Article

Reliability Evaluation of Photovoltaic System Considering Inverter Thermal Characteristics

1
Department of Light Sources and Illuminating Engineering, Fudan University, Shanghai 200433, China
2
Shanghai Engineering Research Center for Artificial Intelligence and Integrated Energy System, Fudan University, Shanghai 200433, China
3
Institute for Six-Sector Economy, Fudan University, Shanghai 200433, China
*
Author to whom correspondence should be addressed.
Submission received: 22 June 2021 / Revised: 8 July 2021 / Accepted: 21 July 2021 / Published: 23 July 2021
(This article belongs to the Section Power Electronics)

Abstract

:
The reliable operation of photovoltaic (PV) power generation systems is related to the security and stability of the power grid and is the focus of current research. At present, the reliability evaluation of PV power generation systems is mostly calculated by applying the standard failure rate of each component, ignoring the impact of thermal environment changes on the failure rate. This paper will use the fault tree theory to establish the reliability assessment method of PV power plants, model the PV power plants working in the variable environment through the hardware-in-the-loop simulation system, and analyze the influence of the thermal characteristics of the inverter’s key components on the reliability of the PV power plant. Studies have shown that the overall reliability of bus capacitors, inverters, and PV power plants is reduced by 18.4%, 30%, and 18.7%, respectively, compared to when the thermal characteristics of bus capacitors are not considered. It can be seen that thermal attenuation has a great influence on the reliability of the PV power generation system.

1. Introduction

PV power generation is considered the most promising method to replace traditional energy in the future. In 2020, more than half of the newly installed renewable energy sources were PV generation, and the additional globally installed capacity of PV power reached 107 GW in one year [1]. According to the forecast of the International Energy Agency (IEA), it will further increase to 4670 GW by 2050, when PV power generation will account for 11% of the total power generation [2]. PV power generation has become the fastest-growing renewable energy source after wind power generation, and it is of ever-increasing significance in the overall energy structure.
The PV power station works in an outdoor environment. The constantly changing environmental conditions such as ambient temperature, wind speed, and irradiance, along with the fact that the types of devices used in the system are different, lead to great challenges in the design, operation, and maintenance of PV power generation systems. For this reason, the reliability of each component of the PV system needs to be fully considered to reduce the probability of failure and improve the reliability of the system [3,4,5,6,7,8,9,10,11,12].
Due to the heat dissipation of the power switch tube when the grid-connected PV system works, it is generally at a higher temperature, which reduces the reliability of the inverter and increases the failure caused by the aging of components. According to Sandia National Laboratories, the number of inverter failures in PV systems is at least four times that of any other component [13]. Among them, power devices such as metal-oxide-semiconductor field-effect transistor (MOSFET), insulated-gate bipolar transistor (IGBT), bus capacitors, transformers, and control boards are the key components of inverter reliability evaluation [14]. In order to save costs, the electrolytic capacitor is generally selected as the bus capacitor. The life of the electrolytic capacitor is closely related to its operating temperature. An increase in operating temperature will increase its equivalent series resistance [15], thereby reducing the capacitance value and increasing the evaporation rate, resulting in a capacitor failure. At the same time, thermal stress will also cause the heat accumulation of the power tube package, leading to power tube failure [16,17]. Literature [13] shows that inverter faults often occur in bus capacitors and power tubes, and temperature is the main factor affecting the failure rate. In addition, the in-house defects of power semiconductor devices and the heat generation from discharging resistance are also worthy of consideration for thermal failure in PV systems [18]. With aspect to the difficulty in characterizing thermal behavior from the component level, the casing temperature is previously proven to serve as an effective indicator with both accuracy and simplicity [19]. Therefore, analyzing and predicting the thermal environment along with the operating temperature of the inverter in the field working environment shed some light on the reliable design of PV stations and make a more accurate evaluation of the reliability of the system.
At present, the reliability evaluation methods for PV systems have simplified the model, and it fails to consider the impact of component attenuation on system reliability caused by changes in the thermal environment of the system. Due to the constraints of the on-site environmental conditions, the empirical test of the reliability of PV inverters is mainly based on long-term operating data for comprehensive analysis and evaluation during the operation of PV inverters [20]. The empirical test has problems such as a long test cycle, high cost, and weak controllability [21,22,23]. In order to better complete the empirical testing, a hardware-in-the-loop simulation platform is previously introduced, where the template system can be effectively tested arbitrarily [24].
This research first determines the key components of inverter failure based on the reliability evaluation method of the fault tree model, and then models the PV power plant through the hardware-in-the-loop simulation system, imports the light and temperature parameters of the PV system, and obtains the changed working environment parameter. Finally, considering the thermal attenuation, it calculates the equivalent failure rate of the key components of the inverter, and uses the grid-connected PV system reliability evaluation model to analyze the impact of the modeled inverter thermal environment on the reliability of the PV system. In addition, this paper also makes up for the shortcomings of the existing fault tree, which analyze PV systems without considering the thermal environment changes.

2. Reliability Evaluation Based on Fault Tree Diagram

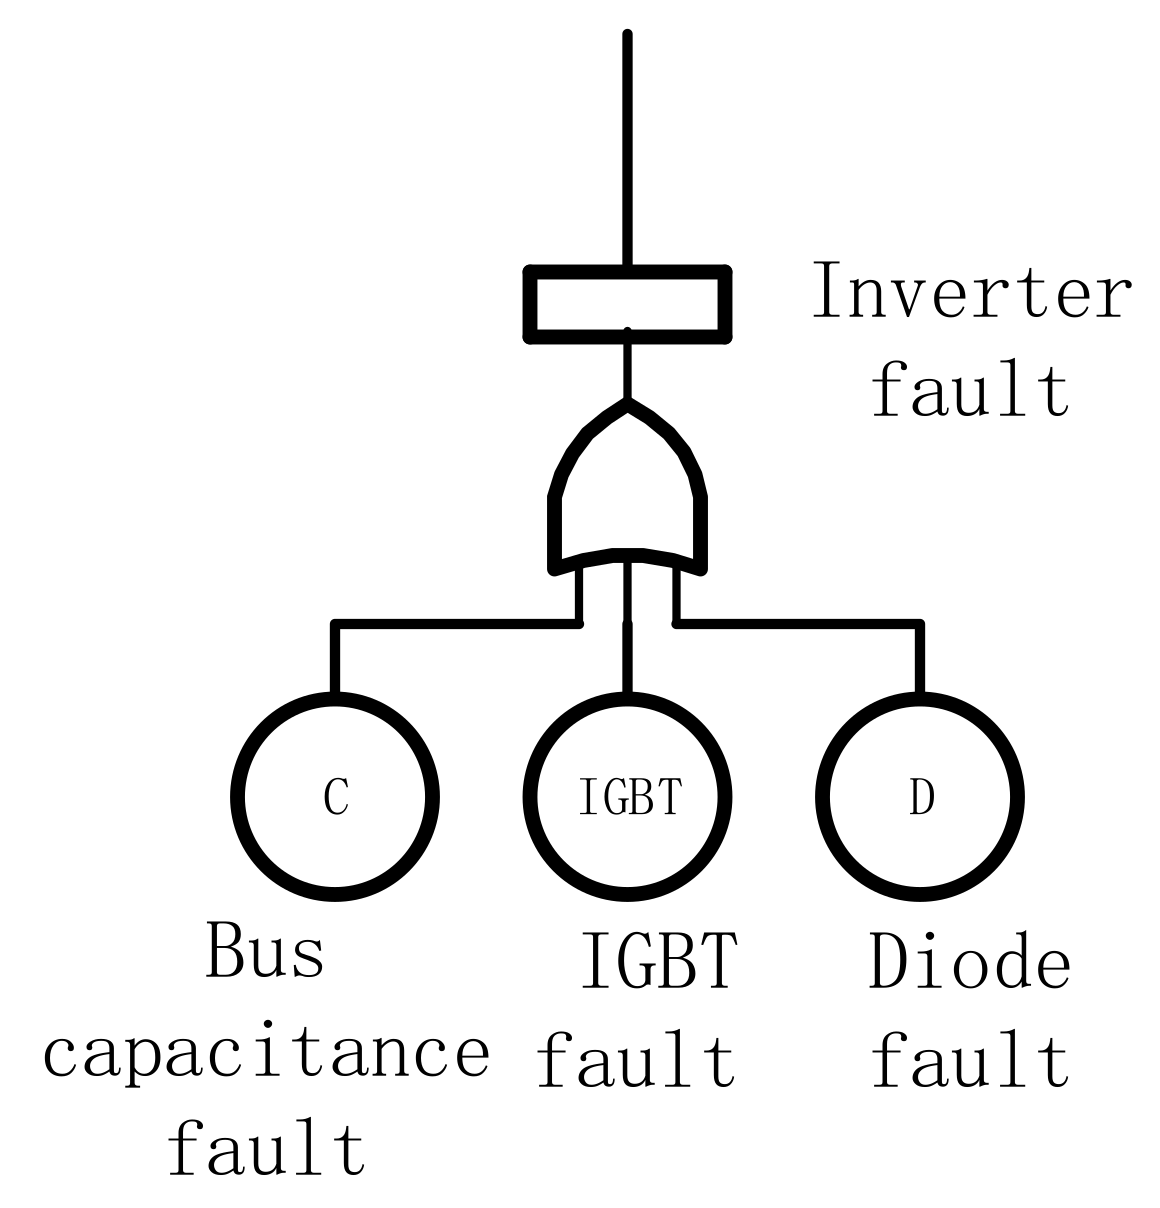
2.1. Fault Tree Evaluation

The reliability evaluation method based on the fault tree model is to transform the physical system into a structured, logical diagram and establish the basic events of the fault tree through experiments to describe the reliability of the top-level events [4]. A typical electrical structure diagram of a grid-connected PV power plant is shown in Figure 1.
The fault tree analysis diagram used in this paper is similar to that in the literature [25], except that the inverter faults are divided into bus capacitor faults, IGBT faults, and rectifier diode faults, as shown in Figure 2.
When performing a quantitative evaluation, the fault tree model should be transformed into a Boolean equation, and then use the mutual independence of fault events to express the system reliability as [26]:
R tot = i = 1 n R E i = R P V × R C O N × R B D × R D C S × R I C × R I I G B T × R I D × R C B × R G P × R A C S × R D C B
Among them, PV means PV module, CON means connector, BD means protection diode, DCS means DC switch, IC means inverter bus capacitance, IIGBT means inverter IGBT, ID means inverter diode, CB means AC circuit breaker, GP stands for grid protector, ACS stands for AC switch, and DCB stands for differential circuit breaker. R E i is the reliability of each event. When it follows the exponential distribution, it is expressed as [26]:
R E i   = exp m i λ i t i
where m i is the number of identical components, λ i represents the failure rate of component i, and t i represents the time of the reliability study. In addition, based on the above relationship, the system reliability of the grid-connected PV power plant can be evaluated.

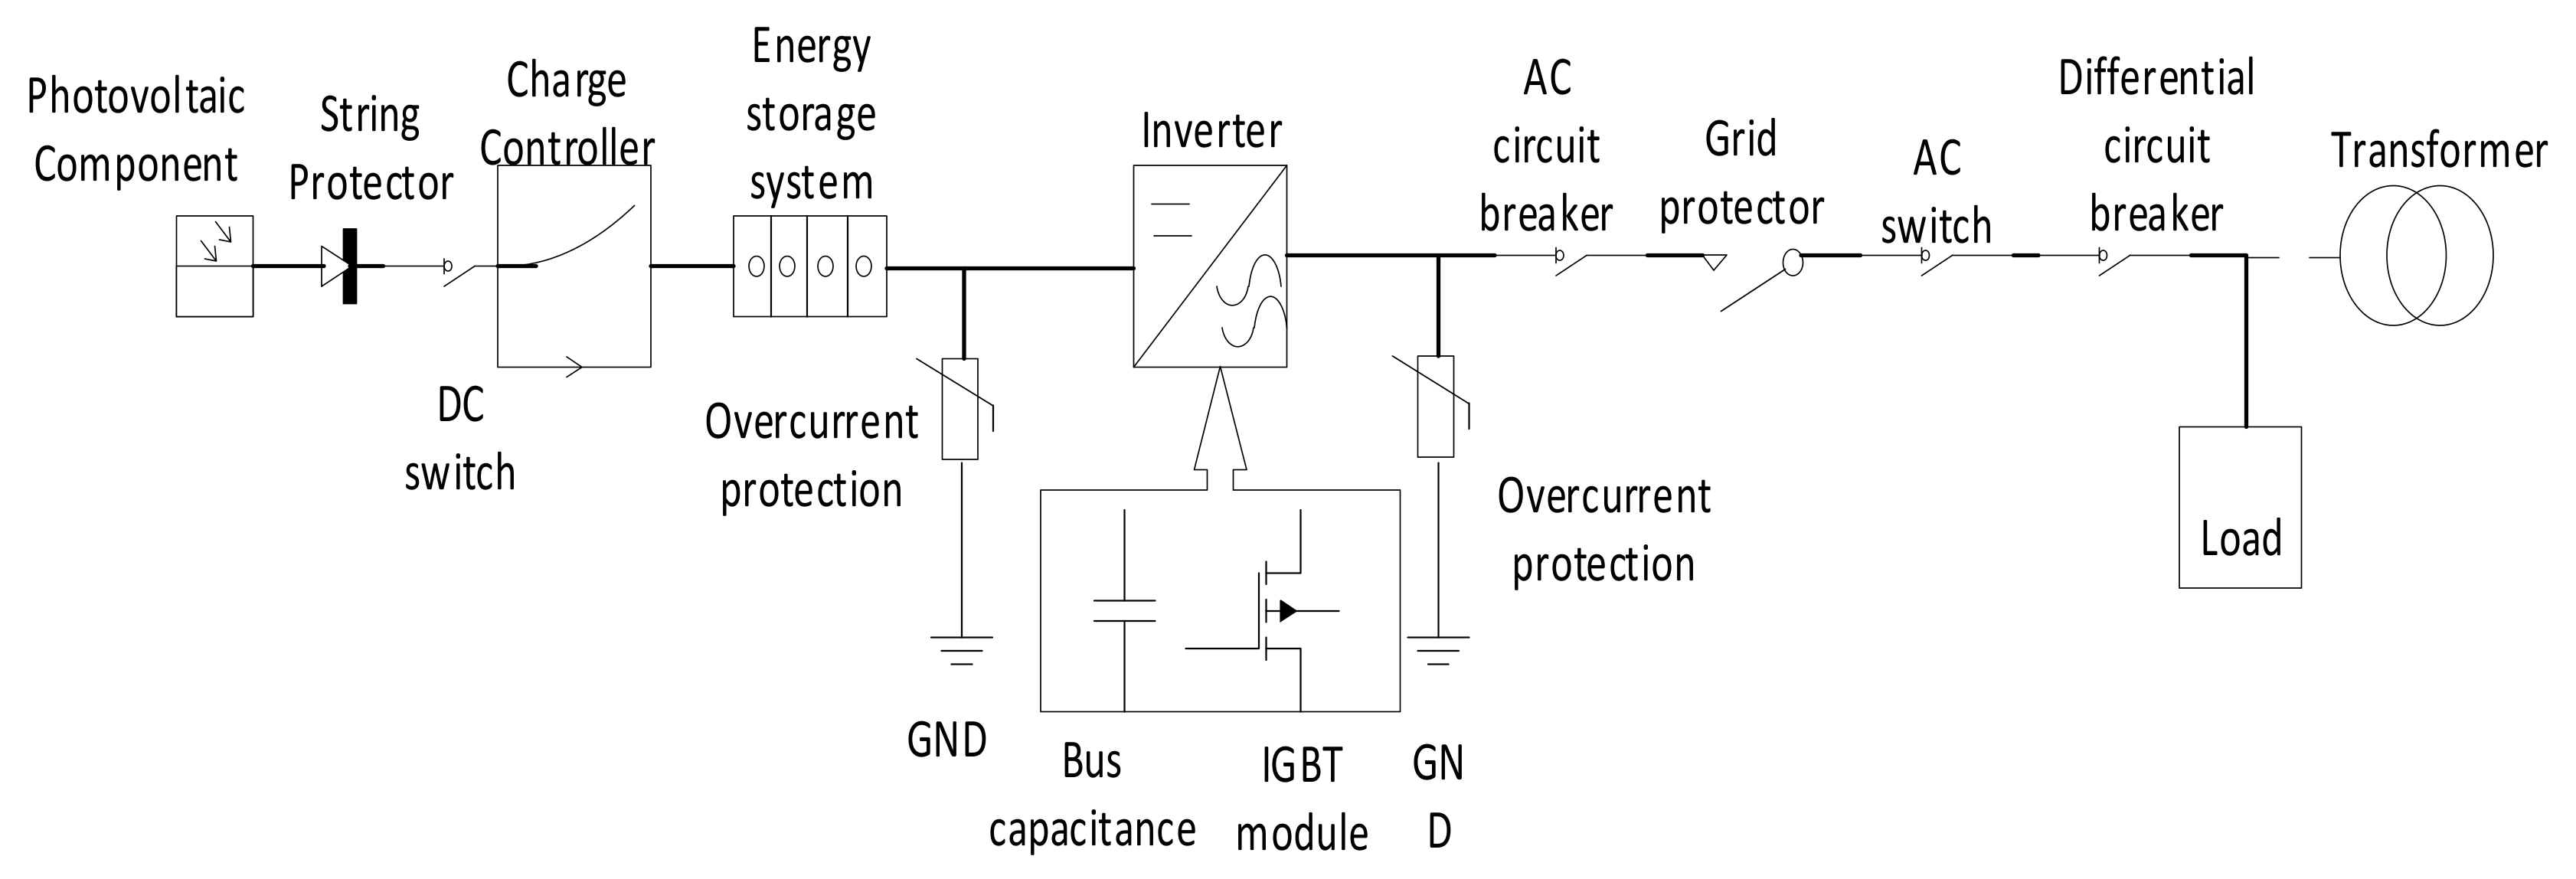
2.2. Reliability Evaluation of PV Power Stations

Assuming that the reliability of a 100 kW PV power station is evaluated under the typical configuration, the data of involved devices (components) in the configuration are listed in Table 1.
According to the literature [25,27,28,29], the failure rate and the according probability density function of each component are shown in Table 2.
Given the parameters, the reliability of each device can be calculated. Take the reliability of IGBT, which has been in operation for one year, as an example:
R I I G B T   = exp m i λ i t i
where m i = 12 , λ i = 0.4 × 10 6 ,   t i = 365 × 8.5 = 3102.5   h , brought into the Formula (3), it obtains:
R I I G B T   = 0.985
which means the reliability of the inverter IGBT after the power station is used for one year is 98.5%.
Studies have shown that inverters have an important impact on the reliability of PV systems. For the key components that affect the reliability of the inverter, comparing six different inverters in [30], it was found that the electrolytic capacitor is the decisive component of the inverter failure instead of the power tube. Previous literature [16] verified and calculated the inverter failure model and obtained the inverter subsystem failure rate and total failure rate table as follows. The research also shows that the inverter bus capacitance is a key component that affects the reliability of the inverter. The subsystem failure rate and total failure rate of the inverter are shown in Table 3.
When grid-connected PV systems work under high power and temperature conditions, the temperature is the main factor affecting the failure rate [14]. The life of the inverter bus electrolytic capacitor is closely related to its operating temperature. The main cause of capacitor failure is the increase in operating temperature. At present, the reliability evaluation of inverter bus capacitors mostly adopts a fixed failure rate. The system reliability is calculated by applying the standard failure rate of each component, all neglecting the impact of the thermal environment on the failure rate.

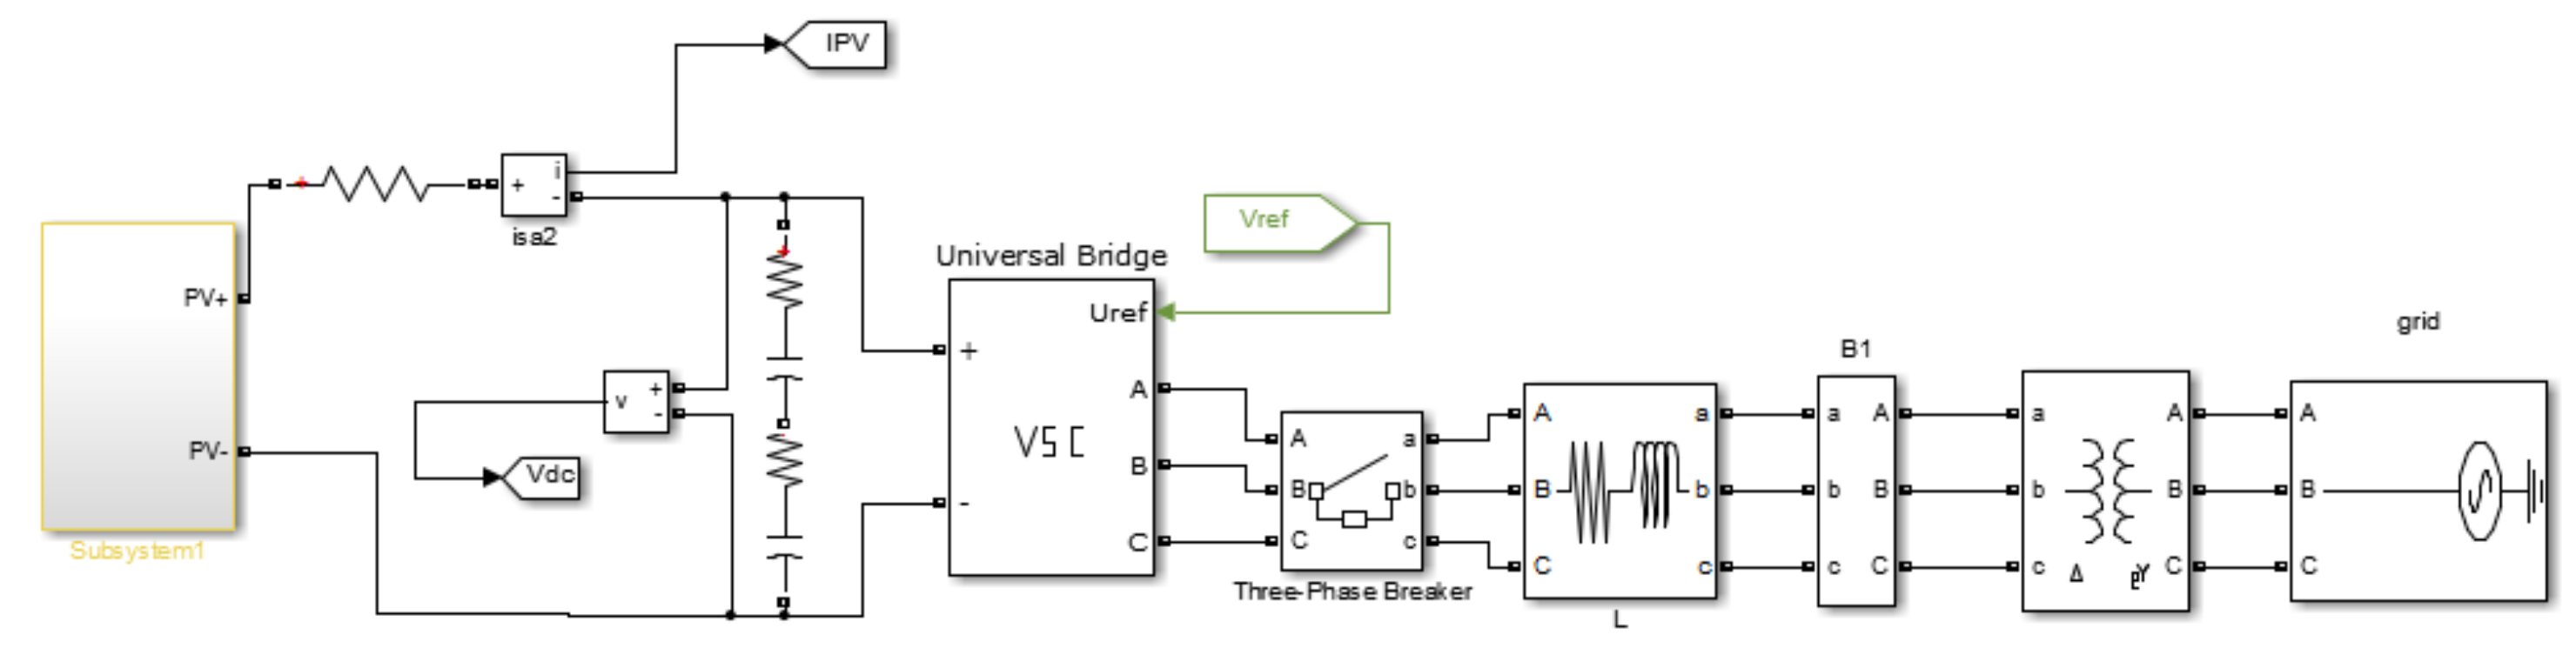
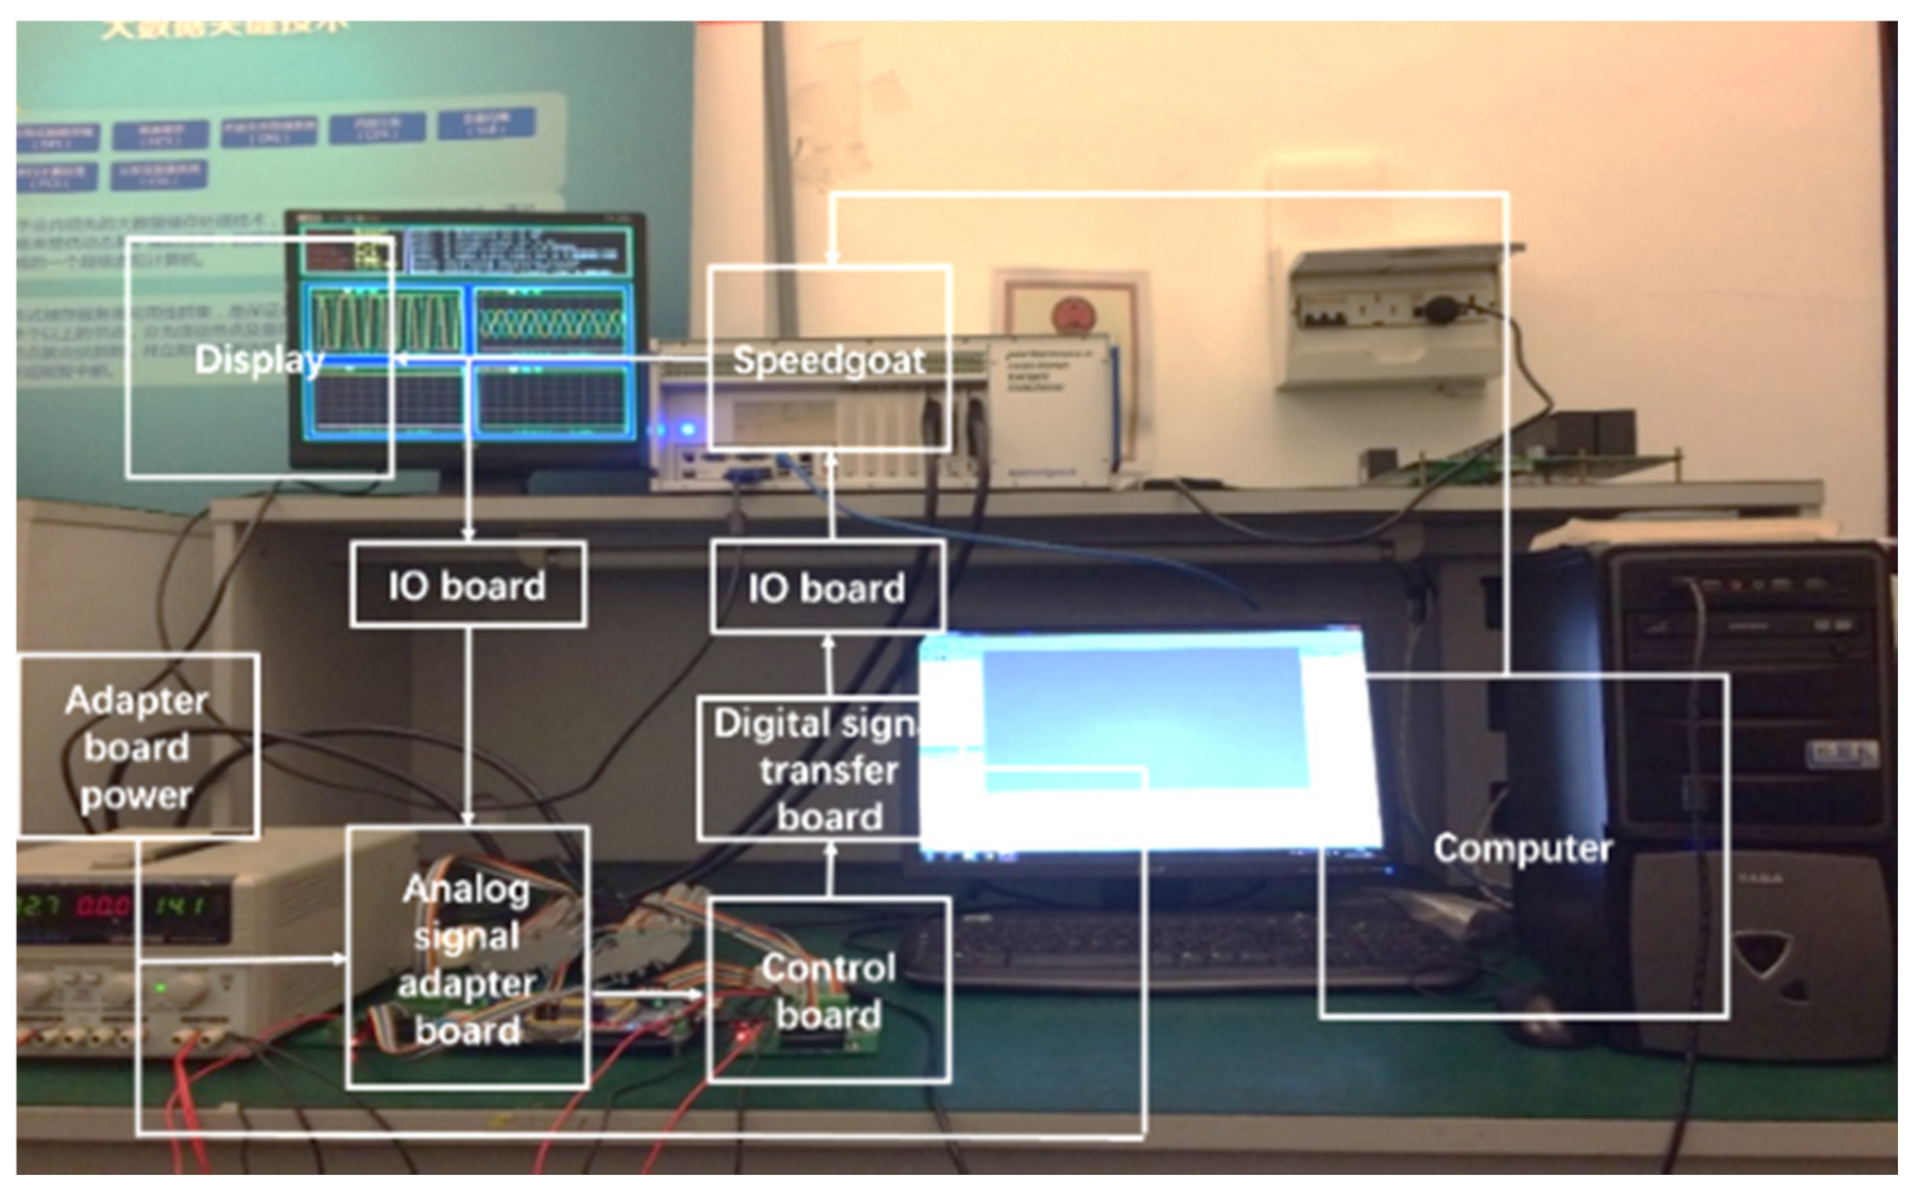
2.3. PV System Based on Hardware-in-the-Loop Simulation Platform

To analyze the impact of thermal environment changes on the reliability of PV systems, this paper will use a hardware-in-the-loop simulation platform (Speedgoat) to model and analyze PV grid-connected systems, which can greatly reduce the cost of the experimental platform construction and save the time and labor during data collection [22,25]. The circuit diagram of the grid-connected simulation model build by Simulink is shown below (Figure 3).
The hardware-in-the-loop simulation system is mainly composed of a simulation host (simulator), a control board (C.U.T), and an interface board. Among them, the simulation host is composed of a PV power generation system (PV-Generator), inverter model, and grid model (Grid); the interface board is composed of PWM signals and analog and digital signals. (TMS320F28335 digital signal processor of TI Company (Dallas, TX, USA) is used, which is connected to the hardware-in-the-loop simulator through an adapter board). The physical platform is shown in Figure 4.
The simulation platform is tested after being established. The test results show that the phase voltage and phase current cycle are both 20 ms, and the frequency is 50 Hz. The PWM wave waveform is a typical SVPWM algorithm modulation wave shape, which is saddle-shaped. Consistent with MATLAB (MathWorks, Natick, MA, USA) simulation results, the hardware-in-the-loop simulation platform currently built can meet the basic requirements.
The environmental parameters were subsequently used as the input of the PV power plant model to simulate the operating status of the PV power plant and analyze the thermal characteristics of the key components of the inverter in a given working state so as to use the PV system reliability model to analyze the impact of thermal characteristics on reliability.

3. Thermal Characteristics and Failure Probability of Key Components of the Inverter

3.1. Thermal Characteristics of Key Components of the Inverter

To analyze the failure rate of the exponential distribution of each device in the PV power plant electrical structure model, a fault tree theory was used to establish a reliability assessment method for the PV power plant. First, the temperature of the key components of the inverter needs to be calculated. The temperature difference between room and radiator can be expressed as [31]:
Δ T = k 1 + c V w × ( P d c P a c ) P r
where P d c is the input DC power, P a c is the output AC power, P r is the inverter rated power, V w is the wind speed, c is the wind speed factor, and k is the inverter heat dissipation factor.
The temperature difference between the inverter components and the heat sink can be approximated as:
Δ   T = k P c
where Δ   T is the temperature difference between the inverter components and the radiator is, k   is the heat transfer coefficient, and P c is the power consumed by the inverter components. Therefore, the temperature of each component of the inverter can be expressed as:
T c = T a + Δ T + Δ   T
where T a is the ambient temperature.
It should be noted that each component may have different levels of heat dissipation devices, and the above Formula (7) may need to be recalculated for different components [31]. A previous study has identified by a no model-specific method that the possible range of k and c is 350 to 650 (°C) and 0.20 to 0.30 (s/m) in Colorado, respectively [31]. Nevertheless, the typical irradiance is sensitive to the latitude of the test site. The latitude of Colorado and Dalian displays a difference (i.e., Colorado at 37–41 °N and Dalian at some 39 °N). Herein, the mean manipulation is adopted for mitigating the statistical difference in the confidence of the data. In this paper, k is taken as 500 °C, and c is taken as 0.25 s/m to keep the parameter in the reasonable range and verify our subsequent experimental design.
Next, the reliability of the inverter bus capacitor is analyzed through the data of a certain power station. First, the typical meteorological year data of NREL are used, where the year-round data of irradiance in 2001 were received by the oblique uniaxial located in Dalian (38°54′ N, 121°38′ E). Then the obtained incident irradiance data and the PV module operating temperature estimation were used. The working temperature and irradiance of the PV cell under the field working state are obtained. The irradiance and temperature data are shown in Figure 5 and Figure 6, respectively.
The abscissas of Figure 6 and Figure 7 represent the hours of sunshine duration throughout the year, and the ordinates respectively represent the amount of incident radiation received during the hour and the working temperature of the photovoltaic cell. It can be seen that the annual average radiation intensity is 386.7 W/m2, and the radiation dose is relatively high in April, May, August, and September; The working temperature of photovoltaic cells is relatively high in June, July, and August, with an average of 28.8 °C.
The irradiance and operating temperature are used as inputs to the hardware-in-the-loop simulation platform. The irradiance data and operating temperature are both hourly averages. The irradiance and operating temperature are simulated to change linearly between two adjacent values.
The calculated temperature difference Δ T + Δ   T between the bus capacitance and the ambient temperature is shown in Figure 7.

3.2. Failure Probability Based on Component Thermal Characteristics

In order to analyze the failure probability of components, this section uses the component temperature parameters obtained by the simulation to calculate. It is assumed that thermal attenuation is a process that gradually accumulates with time and changing temperature.
First, assuming that the component is at a fixed temperature T, the failure probability distribution follows an exponential distribution, as follows:
F t ; T   = 1 exp ( λ T   ×   t )
Among them, λ is the attenuation rate, and F t ,   T is the probability that the component fails at time t at temperature T. The equation for the decay rate as temperature T can be written as:
λ T   = A × exp E a / R T
where E a is the activation energy, R is the general gas constant, and A is a constant that depends on the type of fault.
When the temperature is considered as a variable, it is assumed that Δ T i and λ T i   represent the time at temperature T i and the corresponding decay rate, respectively. i = 1 , 2 , , n . The attenuation rate in each time interval is given by the Arrhenius Equation [32]. The failure probability function at this time is:
F = 1 exp ( ε )
where
ε = Δ T 1 × λ T 1 + Δ T 2 × λ T 2 + + Δ T n × λ T n
Equivalent attenuation rate:
λ e f f = ε i = 1 n Δ T i
Assume that the MTTF (Mean time to Failure) of the inverter at 55 °C is 5000 h. As already stated, for the exponential distribution, MTTF = 1 / λ , . The value of E a / R may be in the range of 3000–12,000 K, taken as 6000 K:
1 5000 = A × exp ( 6000 / 328 )
It can be derived that A = 1.76 × 10 4 .
The cumulative distribution function of the ambient temperature and the bus capacitor temperature obtained by calculation is shown in Figure 8.
Ta is the ambient temperature, and Tc is the bus capacitor temperature. The bus capacitor temperature is slightly higher than the ambient temperature. As can be seen from the figure, the average value of the ambient temperature is about 16 degrees Celsius, and the bus capacitor temperature is about 2 degrees Celsius higher than the ambient temperature. In addition, the ambient temperature and bus capacitor temperature is consistently lower than 40 degrees Celsius.
By calculating the equivalent attenuation rate λ e f f , through Equation (12), the failure probability distribution function can be obtained:
F t   = 1 exp ( λ e f f × t )
To better make a comparison, the failure probability distribution function is simulated under the condition that the irradiance is constant 1000 w/m2, the battery temperature is 50 °C, and other simulation conditions are unchanged. The distribution function is shown in Figure 9. The abscissa is time, and the unit is 0.1 h.
Among them, C1 is the distribution with irradiance and temperature considered as variables, and C2 is the distribution with constant irradiance and temperature. Since the working temperature of C2 is higher than C1, the probability of C2 failure is higher, and the simulation results live up to expectations. Under given conditions, the probability of failure of capacitor C2 at any time point is higher than the probability of failure of C1. In addition, the growth rate of the failure probability of both increases first and then decreases with the increase of time, which is consistent with the bathtub curve theory. By bringing any time t into Formula (14), the probability of capacitor failure until that moment can be obtained. The results are obtained on the premise that the MTTF is 5000 h and the value of E a / R is 6000 K.

4. Analysis of System Reliability Cases of Thermal Characteristics of Inverter Bus Capacitors

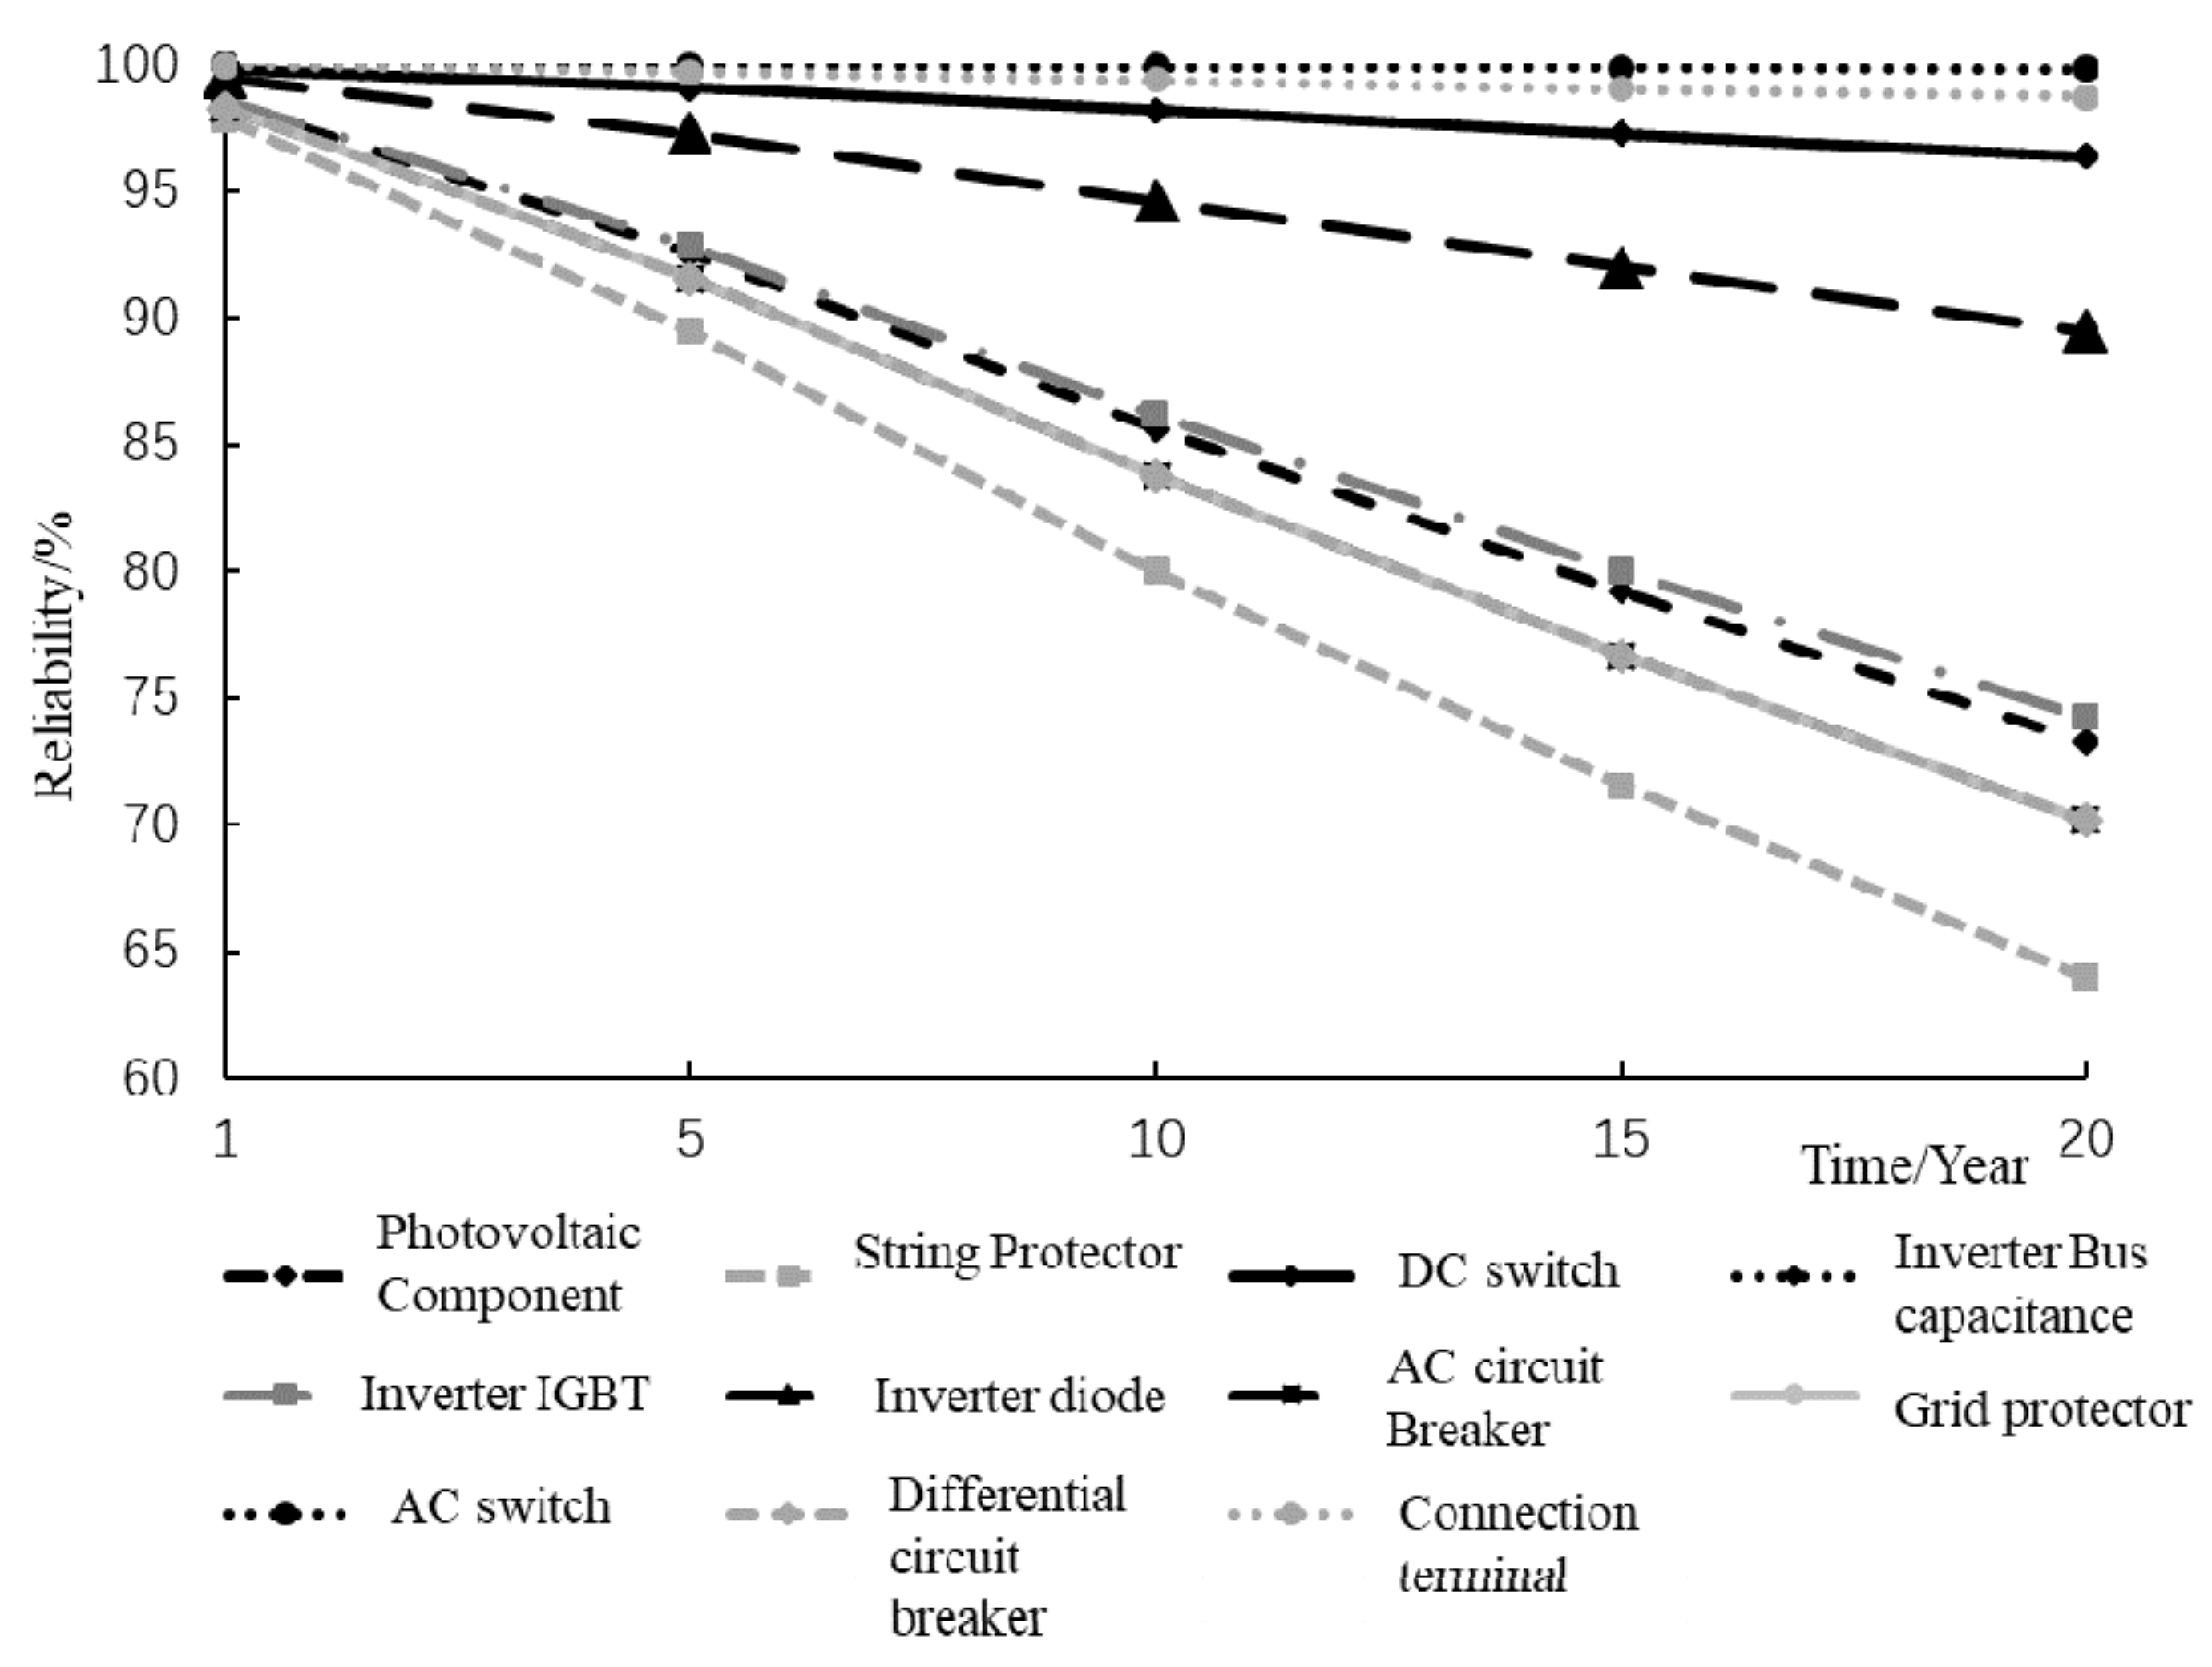
4.1. Reliability Calculation of PV Power Plant without Considering Thermal Characteristics

Without considering the component attenuation, the reliability evaluation table and trend chart of each component of the 100KW power station in 20 years are shown in Table 4 and Figure 10.
After 20 years of operation, the overall reliability of the inverter is:
R I G B T   = R I C   ×   R I I G B T   ×   R I D   = 0.68
Overall reliability of PV power plants is:
R tot = i = 1 n R E i   = 0.098
It can be seen that the reliability of circuit breakers, protectors and inverter IGBTs is relatively poor and decays rapidly with time. The string protector has a reliability of 97.79% when used for one year and only 63.97% after 20 years.

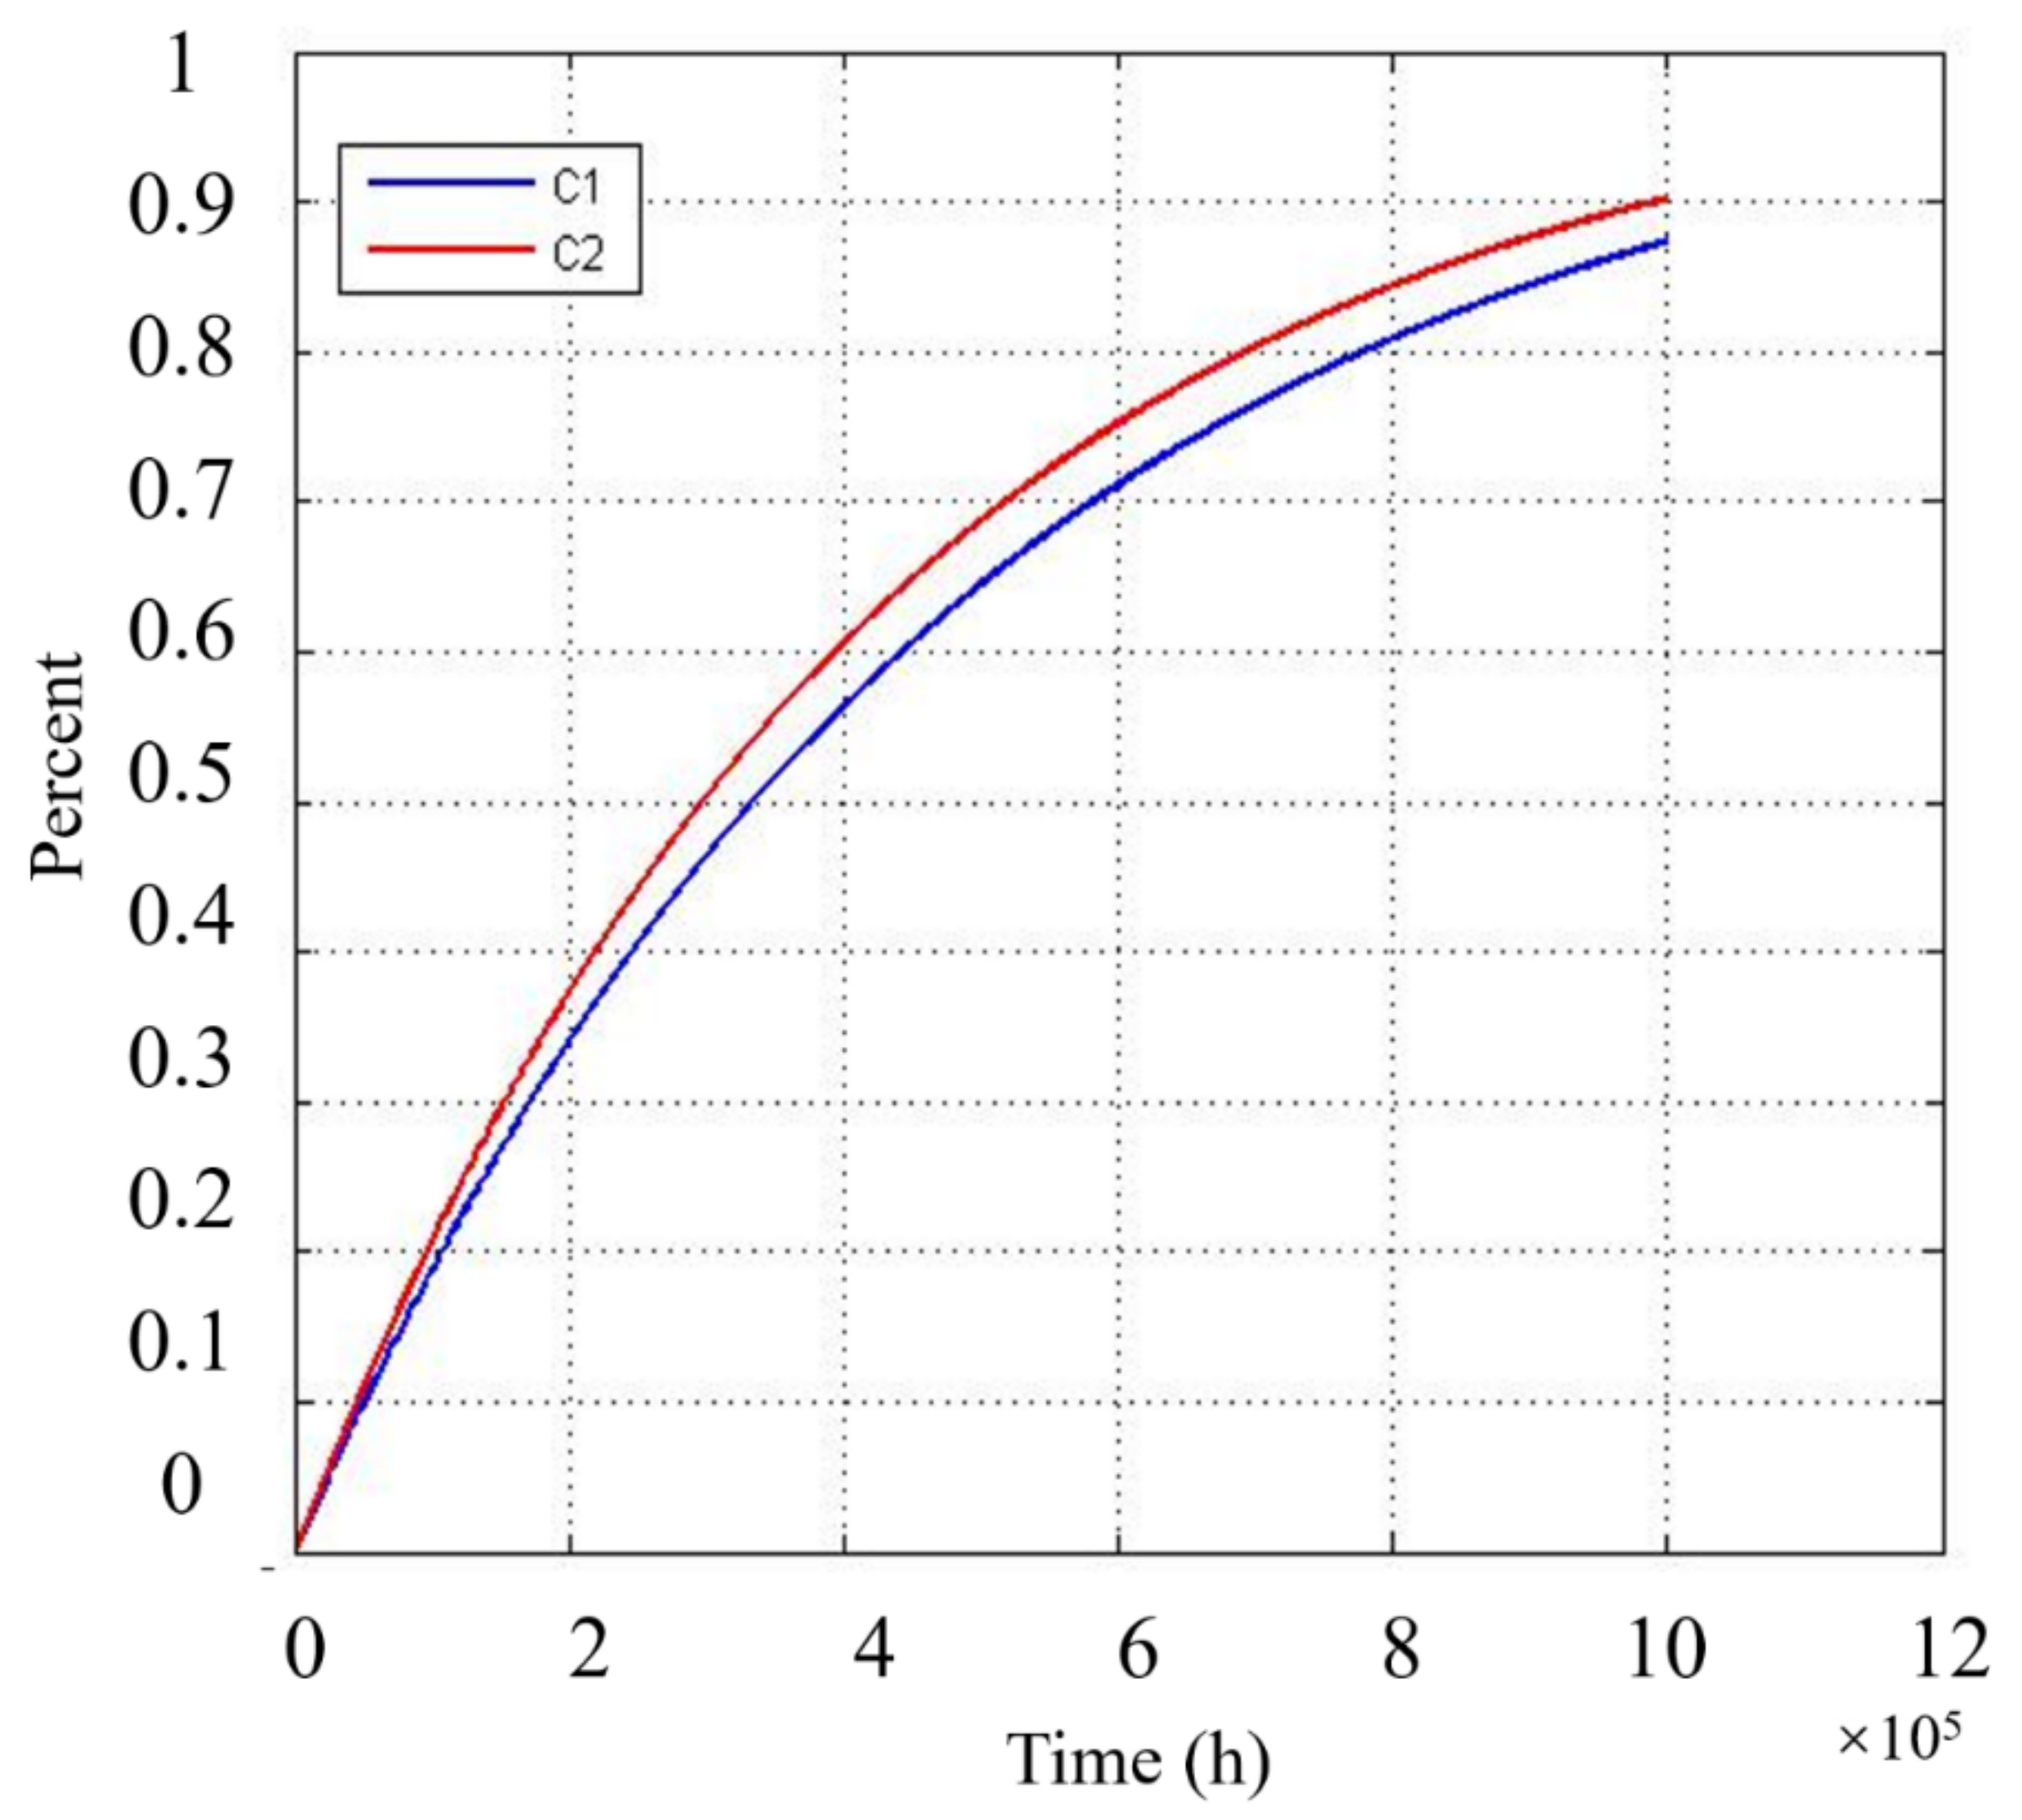
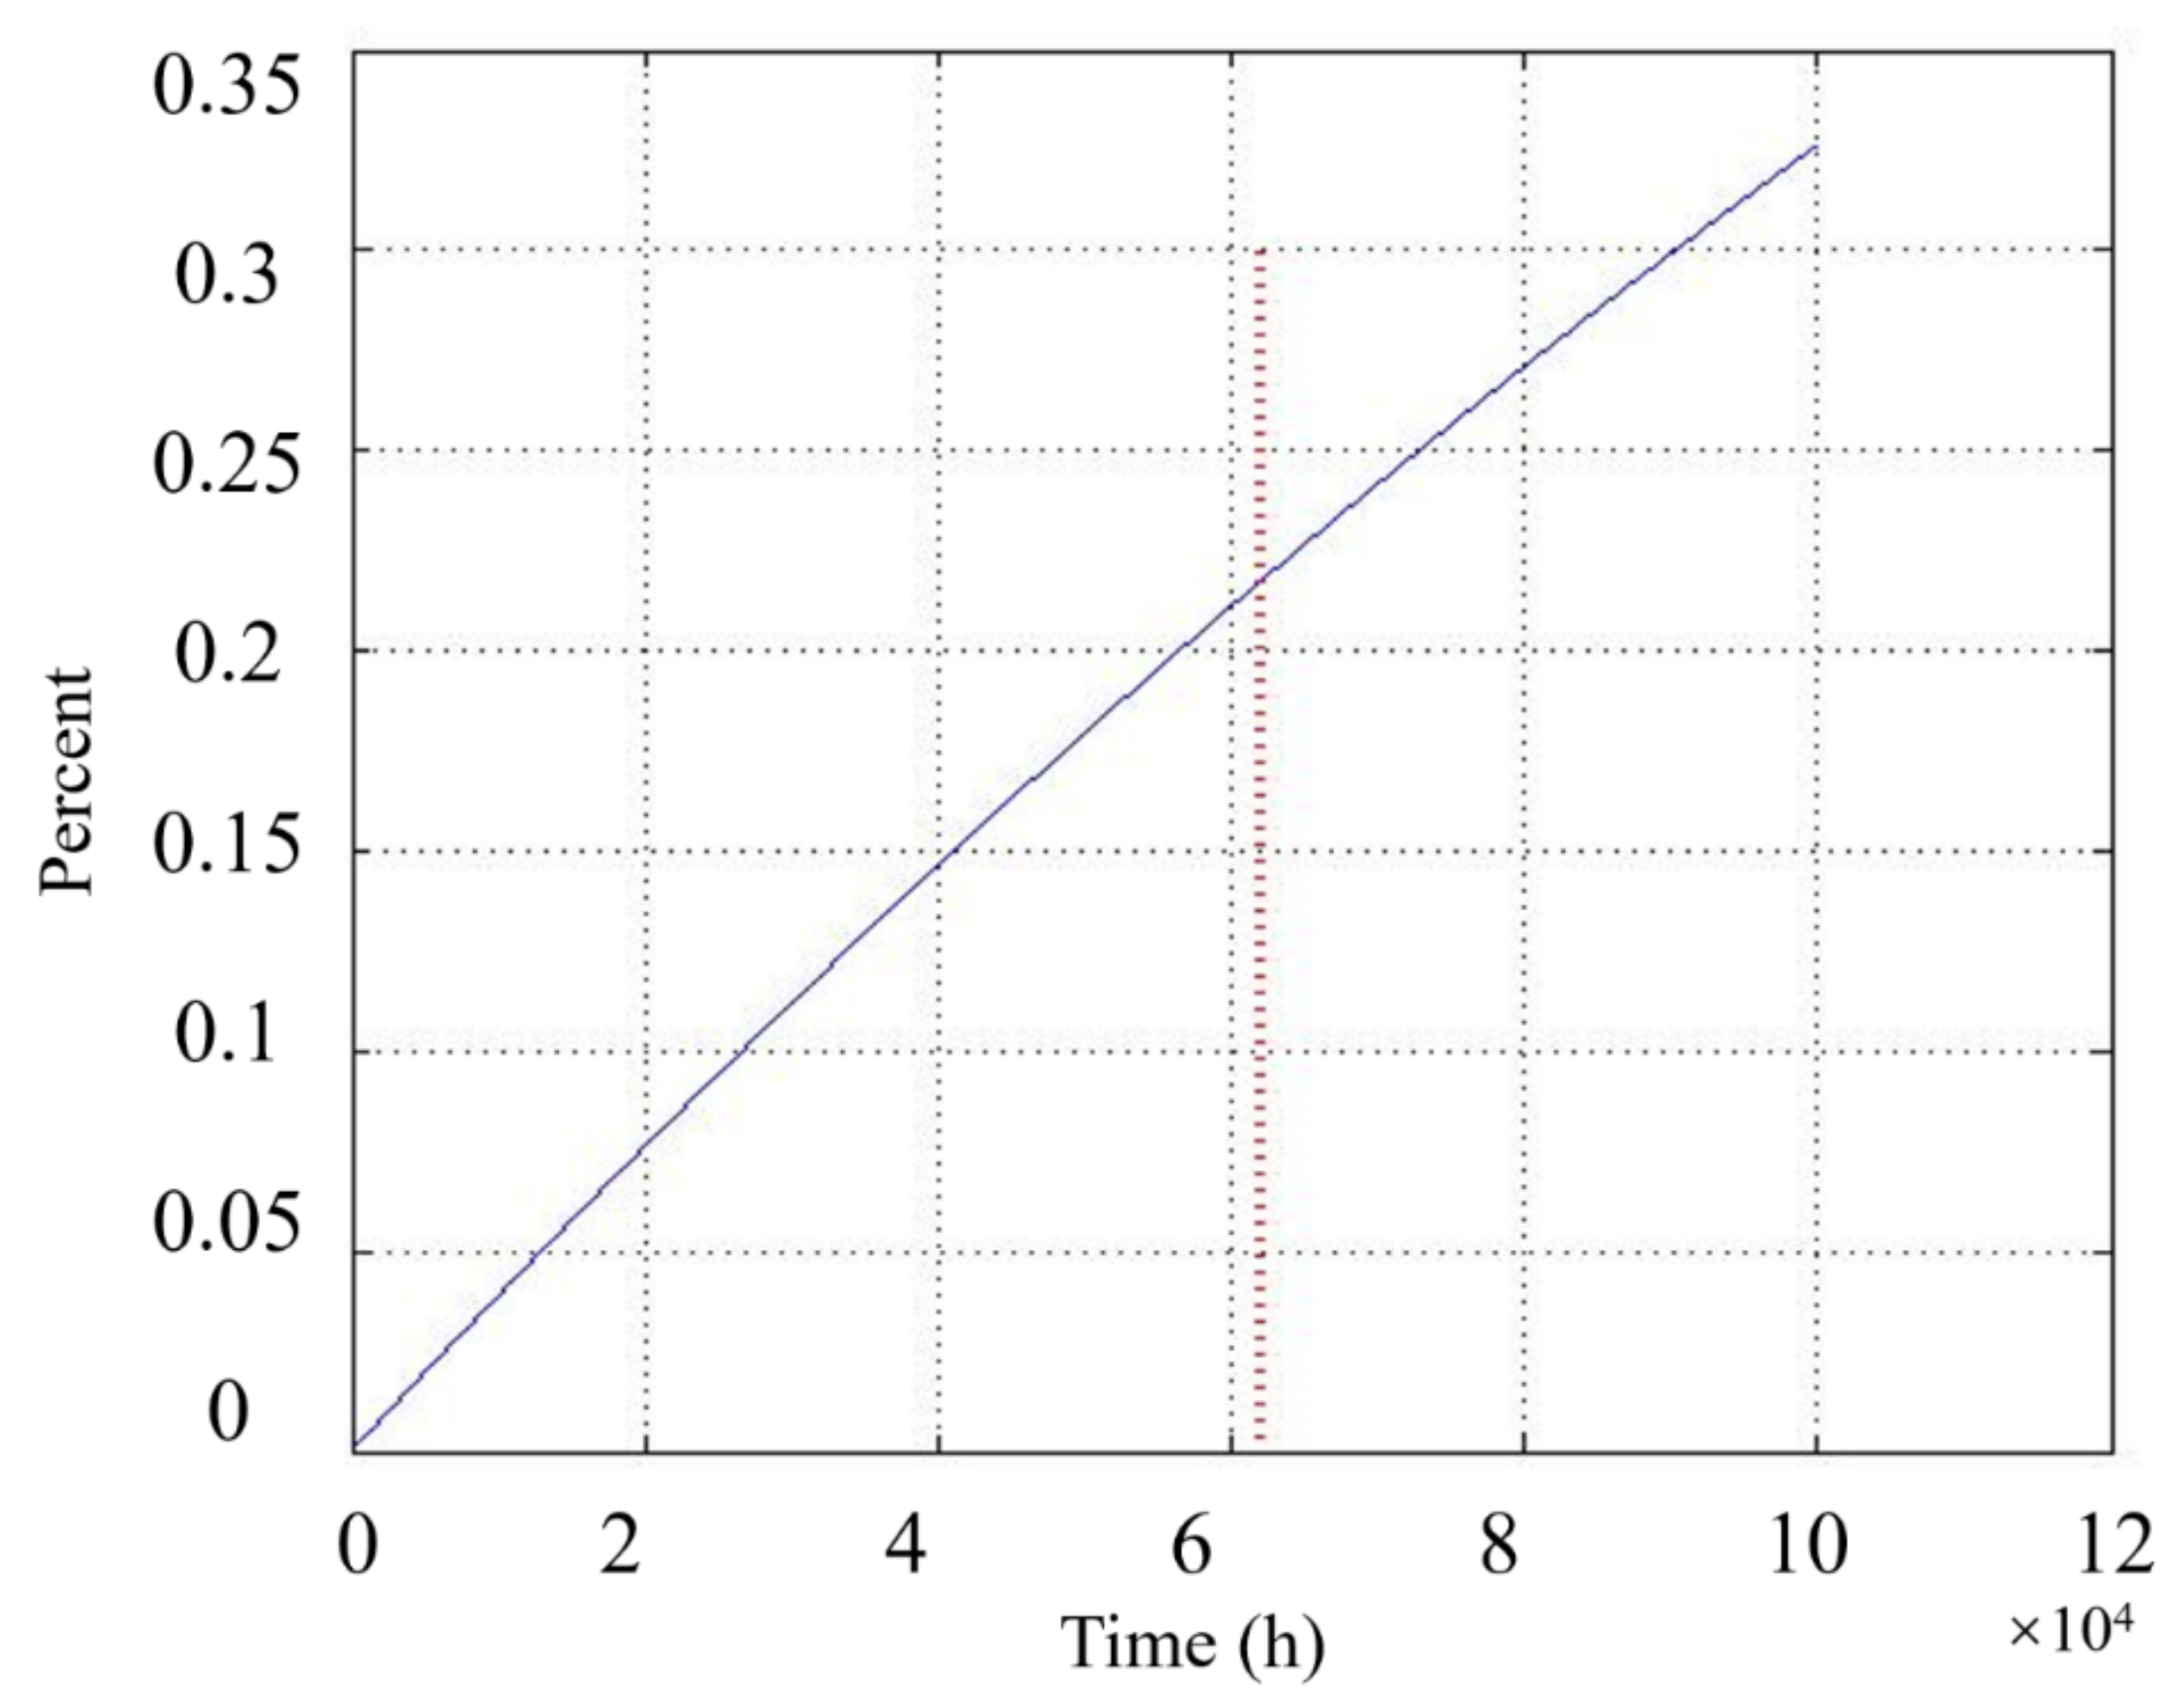
4.2. Reliability Calculation of Grid-Connected PV Power Plant Considering Thermal Characteristics of Bus Capacitor

According to the previous calculation, the failure probability of the inverter is four times that of other components, and the power inverter has a huge effect on PV system stability. Since the bus capacitor is the decisive component on inverter failure while other components have much less impact compared, the bus capacitance is considered as the dominating factor for further thermal effect analysis.
If we consider the thermal characteristics of the bus capacitance, its M T T F = 1 / λ = 1 / 0.3 × 10 6 , A = 293.28 , bring the temperature difference data shown in Figure 7 and the probability of capacitor failure [28] in Table 2 into Equations (12)–(14) and assume that the irradiance, ambient temperature, and wind speed will not change significantly within 20 years, the failure probability distribution function can be obtained, as shown in Figure 11. The dotted line in the figure is the time of 20 years of operation. The intersection of the solid line and the dotted line is the failure probability of the capacitor after 20 years of operation. The reliability of the bus capacitor can be obtained by subtracting this value from 1.
The reliability of the bus capacitor is obtained as:
R I C   = 0.783
Compared with the case without considering the thermal characteristics of the bus capacitor, its reliability is reduced by 18.4%. At this time, the overall reliability of the inverter is:
R I G B T   = R I C   ×   R I I G B T   ×   R I D   = 0.52
The overall reliability of the inverter decreased by 30%. The PV system reliability at this time is:
R R tot = i = 1 n R E i   = 0.080
The overall reliability of PV power stations has decreased by 18.7%, which indicates the thermal characteristics of bus capacitors have a great impact on the reliability of PV power generation systems. If the thermal characteristics of the inverter IGBT and inverter diode are considered, the reliability of the system will be further affected. In the actual working environment, PV power generation systems may also encounter extreme weather, and system reliability will be further challenged. Therefore, certain measures need to be taken to improve system reliability. Common methods include derating design and redundant design. For example, due to the low reliability of the inverter, the 100 KW inverter in this study can be replaced with three 50 KW inverters to improve the overall reliability of the system.

4.3. Analysis and Discussion

Up to date, the life and reliability estimations of the inverter bus capacitors are completed by querying the fixed failure rate in the technical manual for simplicity purposes. They do not take into account the complex variations in the field operating environments, such as estimation at room temperature (25 °C) or estimation based on the conventional heat generation of the squeeze. However, the above research paradigm is all due to the poor accessibility of thermal characteristics data, resulting in large deviations in the results, which often need to be compensated by long-term on-site laboratory tests.
This paper fully considers the field data from the operating environment and applies hardware-in-the-loop simulation to tackle the ambient weather changes, the operating temperature of the inverter’s internal capacitors, and the time-varying operating conditions. Moreover, the test process is expedited via hardware-in-the-loop simulation by reducing the test frequency and workload of on-site testing. In the case of considering the thermal characteristics of the bus capacitor, the data of temperature difference are shown in Figure 5, and the probability of failure of the capacitor [13] is substituted into the formula Equations (11)–(13). It is assumed that the irradiation, ambient temperature, and wind speed within 20 years exhibit a statistically stationary process; thereby, the reliability of the bus capacitor can be obtained. Compared with the circumstance where the thermal characteristics of the bus capacitor are not considered, the bus capacitor reliability is reduced by 18.4%
The failure rate of the exponential distribution of each device in the electrical structure model of a photovoltaic power plant, and a reliability assessment method for the PV system is proposed through the fault tree theory. Then based on the thermal theory of the inverter, by using the built simulation platform, the temperature difference between the bus capacitance and the ambient temperature was calculated. Subsequently, the reliability evaluation method of the PV system is put forward considering the thermal characteristics of bus capacitance. The reliability evaluation method is used to analyze the reliability of 100 MW grid-connected PV power stations. The reliability when considering the thermal characteristics of the inverter is compared with the reliability without considering the thermal characteristics, and the impact of thermal characteristics on system reliability is evaluated. This helps to establish a more flexible and efficient monitoring plan for the reliability of PV systems.

5. Conclusions

Establishing the reliability evaluation model of the PV power generation system and analyzing the reliability of the system working in a variable environment are of great significance to the optimization design of the PV power generation system. Since the existing PV system reliability evaluation model fails to take thermal attenuation into consideration, the accuracy of reliability evaluation is reduced. This paper establishes a fault tree for a typical grid-connected PV system to analyze the reliability of PV systems under the impact of thermal characteristics of key components of the inverter. This research is mainly based on a hardware-in-the-loop simulation platform (Speedgoat) to model a grid-connected PV power plant that works in a variable environment. The results show that the overall reliability of bus capacitors, inverters, and PV power plants is reduced by 18.4%, 30%, and 18.7%, respectively, compared to when the thermal characteristics of bus capacitors are not considered; the thermal attenuation has a huge impact on the reliability of the inverter bus capacitors, which in turn affects the overall reliability of the inverter and the PV power generation system.

Author Contributions

Conceptualization, T.L. and Z.L.; methodology, T.L. and S.T.; software: R.Z. and L.M.; validation, J.S. and R.Z.; writing—original draft preparation: S.T. and T.L.; writing—review and editing, R.Z., T.L., J.S. and Z.L.; supervision: Y.S.; project administration: T.L. and Y.S. All authors have read and agreed to the published version of the manuscript.

Funding

This research was funded by the Key Scientific Research Program of Shanghai (Grant No.18DZ1203305), the National Key Research and Development Program of China (Grant No. 2019YFB2103200 and No. 2018YFB1500904), Shanghai Municipal Economic and Information Commission (Grant No.202001015), and Shanghai Engineering Research Center for Artificial Intelligence and Integrated Energy System (Grand No. 19DZ2252000).

Acknowledgments

This work is supported by Institute for Six-sector Economy, Fudan University.

Conflicts of Interest

The authors declare no conflict of interest.

References

  1. IEA. Renewables. 2020. Available online: https://www.iea.org/reports/renewables-2020 (accessed on 22 May 2021).
  2. IEA. Trends in PV Applications. 2020. Available online: https://iea-pvps.org/trends_reports/trends-in-pv-applications-2020/ (accessed on 22 May 2021).
  3. Ventura, C.; Tina, G.M. Utility scale photovoltaic plant indices and models for on-line monitoring and fault detection purposes. Electr. Power Syst. Res. 2016, 136, 43–56. [Google Scholar] [CrossRef]
  4. Ahadi, A.; Ghadimi, N.; Mirabbasi, D. Reliability assessment for components of large scale photovoltaic systems. J. Power Source 2014, 264, 211–219. [Google Scholar] [CrossRef]
  5. Spertino, F.; Amato, A.; Casali, G.; Ciocia, A.; Malgaroli, G. Reliability Analysis and Repair Activity for the Components of 350 kW Inverters in a Large Scale Grid-Connected Photovoltaic System. Electronics 2021, 10, 564. [Google Scholar] [CrossRef]
  6. Yan, W.; Liu, W.; Kong, W. Reliability evaluation of PV modules based on exponential dispersion process. Energy Rep. 2021, 7, 3023–3032. [Google Scholar] [CrossRef]
  7. Altamimi, A.; Jayaweera, D. Reliability of power systems with climate change impacts on hierarchical levels of PV systems. Electr. Power Syst. Res. 2021, 190, 106830. [Google Scholar] [CrossRef]
  8. Sun, Y.; Gao, J.; Wang, J.; Huang, Z.; Li, G.; Zhou, M. Evaluating the reliability of distributed photovoltaic energy system and storage against household blackout. Glob. Energy 2021, 4, 18–27. [Google Scholar]
  9. Sandelic, M.; Sangwongwanich, A.; Blaabjerg, F. Reliability Evaluation of PV Systems with Integrated Battery Energy Storage Systems: DC-Coupled and AC-Coupled Configurations. Electronics 2019, 8, 1059. [Google Scholar] [CrossRef] [Green Version]
  10. Gusman, L.S.; Pereira, H.A.; Callegari, J.M.S.; Cupertino, A.F. Design for reliability of multifunctional PV inverters used in industrial power factor regulation. Int. J. Electr. Power 2020, 119, 105932. [Google Scholar] [CrossRef]
  11. Peyghami, S.; Davari, P.; Wang, H.; Blaabjerg, F. System-level reliability enhancement of DC/DC stage in a single-phase PV inverter. Microelectron. Reliab. 2018, 88, 1030–1035. [Google Scholar] [CrossRef]
  12. Atsu, D.; Seres, I.; Aghaei, M.; Farkas, I. Analysis of long-term performance and reliability of PV modules under tropical climatic conditions in sub-Saharan. Renew. Energy 2020, 162, 285–295. [Google Scholar] [CrossRef]
  13. Stember, L.H.; Huss, W.R.; Bridgman, M.S. A Methodology for Photovoltaic System Reliability & Economic Analysis. IEEE. Trans. Reliab. 1982, R31, 296–303. [Google Scholar]
  14. Petrone, G.; Spagnuolo, G.; Teodorescu, R.; Veerachary, M.; Vitelli, M. Reliability Issues in Photovoltaic Power Processing Systems. IEEE Trans. Ind. Electron. 2008, 55, 2569–2580. [Google Scholar] [CrossRef]
  15. Harada, K.; Katsuki, A.; Fujiwara, M. Use of ESR for deterioration diagnosis of electrolytic capacitor. IEEE Trans Power Electr. 1993, 8, 355–361. [Google Scholar] [CrossRef]
  16. Bo, Y.; Bingyu, S.; Hongfen, C.; Xiaodong, Y.; Lei, M.; Yaojie, S. Reliability Assessment of the Distributed PV Station. J. Fudan Univ. 2017, 56, 91–97. [Google Scholar]
  17. Patil, N.; Das, D.; Pecht, M. A prognostic approach for non-punch through and field stop IGBTs. Microelectron. Reliab. 2012, 52, 482–488. [Google Scholar] [CrossRef]
  18. Hyun, K.D.; Chul, K.S.; Bok, K.Y. Thermal Characteristic and Failure Modes and Effects Analysis for Components of Photovoltaic PCS. J. Korean Soc. Saf. 2018, 33, 1–7. [Google Scholar]
  19. Xiang, D.; Ran, L.; Tavner, P.; Bryant, A.; Yang, S.; Mawby, P. Monitoring Solder Fatigue in a Power Module Using Case-Above-Ambient Temperature Rise. IEEE Trans. Ind. Appl. 2011, 47, 2578–2591. [Google Scholar] [CrossRef]
  20. Li, X.; Pan, C.; Luo, D.; Sun, Y.; Series, D.C. Arc Simulation of Photovoltaic System Based on Habedank Model. Energies 2020, 13, 1416. [Google Scholar] [CrossRef] [Green Version]
  21. Besanger, Y.; Tran, Q.T.; Boudinnet, C.; Nguyen, T.L.; Brandl, R.; Strasser, T.I. Using power-hardware-in-the-loop experiments together with co-simulation for the holistic validation of cyber-physical energy systems. In Proceedings of the 2017 IEEE PES Innovative Smart Grid Technologies Conference Europe (ISGT-Europe), Turin, Italy, 26–29 September 2017; pp. 1–6. [Google Scholar]
  22. Fei, Z.; Lin, Z.X.; Junjun, Z.; Jingsheng, H. Hardware-in-the-loop simulation, modeling and close-loop testing for three-level photovoltaic grid-connected inverter based on RT-LAB. In Proceedings of the 2014 International Conference on Power System Technology, Chengdu, China, 20–22 October 2014; pp. 2794–2799. [Google Scholar]
  23. Ruz, F.; Rey, A.; Torrelo, J.M.; Nieto, A.; Cánovas, F.J. Real time test benchmark design for photovoltaic grid-connected control systems. Electr. Power Syst. Res. 2011, 81, 907–914. [Google Scholar] [CrossRef] [Green Version]
  24. Liu, Z.; Li, T.; Shu, M.; Sun, Y.; Ma, L. Using Hardware-in-the-Loop Simulation Platform for Empirical Testing of Photovoltaic System. In Proceedings of the 2020 IEEE 3rd International Conference on Electronics Technology (ICET), Chengdu, China, 8–12 May 2020; pp. 452–456. [Google Scholar]
  25. Collins, E.; Dvorack, M.; Mahn, J.; Mundt, M.; Quintana, M. Reliability and availability analysis of a fielded photovoltaic system. In Proceedings of the 34th IEEE Photovoltaic Specialists Conference (PVSC), Philadelphia, PA, USA, 7–12 June 2009; pp. 2316–2321. [Google Scholar]
  26. O’Connor, P.; Kleyner, A. Reliability Engineering; John Wiley & Sons: Hoboken, NJ, USA, 2012. [Google Scholar]
  27. Kumar, A.; Chatterjee, D. A survey on space vector pulse width modulation technique for a two-level inverter. In Proceedings of the 2017 National Power Electronics Conference (NPEC), Pune, India, 2017 18–20 December 2017; pp. 78–83. [Google Scholar]
  28. Alavi, O.; Hooshmand Viki, A.; Shamlou, S. A Comparative Reliability Study of Three Fundamental Multilevel Inverters Using Two Different Approaches. Electronics 2016, 5, 18. [Google Scholar] [CrossRef] [Green Version]
  29. Nkhonjera, L.K. Simulation and Performance Evaluation of Battery Based Stand-Alone Photovoltaic Systems of Malawi. Master’s Thesis, Taiwan National Central University, Taiwan, 2009. [Google Scholar]
  30. Harb, S.; Balog, R.S. Reliability of Candidate Photovoltaic Module-Integrated-Inverter (PV-MII) Topologies—A Usage Model Approach. IEEE Trans. Power Electr. 2013, 28, 3019–3027. [Google Scholar] [CrossRef]
  31. Sorensen, N.R.; Thomas, E.V.; Quintana, M.A.; Barkaszi, S.; Rosenthal, A.; Zhang, Z.; Kurtz, S. Thermal study of inverter components. In Proceedings of the 2012 IEEE 38th Photovoltaic Specialists Conference (PVSC) PART 2, Austin, TX, USA; 3–8 June 2012; pp. 1–8. [Google Scholar]
  32. Lee, W.S.; Grosh, D.L.; Tillman, F.A.; Lie, C.H. Fault Tree Analysis, Methods, and Applications ߝ A Review. IEEE Trans. Reliab. 1985, R34, 194–203. [Google Scholar] [CrossRef]
Figure 1. Typical electrical structure diagram of a grid-connected PV power plant.
Electronics 10 01763 g001
Figure 2. Inverter fault tree diagram.
Electronics 10 01763 g002
Figure 3. Circuit diagram of grid-connected PV system simulation.
Electronics 10 01763 g003
Figure 4. Hardware-in-the-loop simulation platform [24].
Electronics 10 01763 g004
Figure 5. Time-segmented chart of the radiation amount received by the oblique uniaxial throughout the year (unit: W/m2).
Electronics 10 01763 g005
Figure 6. Time-sharing chart of the working temperature of inclined uniaxial PV cells throughout the year.
Electronics 10 01763 g006
Figure 7. Temperature difference between bus capacitance and ambient temperature.
Electronics 10 01763 g007
Figure 8. The cumulative distribution function of the ambient temperature and the bus capacitor temperature.
Electronics 10 01763 g008
Figure 9. Failure probability distribution function.
Electronics 10 01763 g009
Figure 10. Reliability of components in a 10 KW grid-connected PV power station after 20 years of operation.
Electronics 10 01763 g010
Figure 11. Capacitor failure probability distribution function considering thermal attenuation.
Electronics 10 01763 g011
Table 1. Number of components used in 100 kW grid-connected PV power station.
Device NameNumber
PV module330
PV module string protector23
DC switch3
Inverter bus capacitance2
Inverter IGBT12
Inverter diode18
AC circuit breaker1
Grid protector1
AC switch1
Differential circuit breaker1
Connection terminal874
Power storage system16
Charge controller1
Table 2. Failure rate and obeying probability density function of each component of the grid-connected PV power station.
Device ClassificationPDFFailure Rate
(10−6 Times/Hour)
References
PV moduleIndex0.0152[25]
PV module string protectorindex0.313[25]
DC switchindex0.2[4]
Inverter bus capacitanceindex0.3[25]
Inverter IGBTindex0.4[28]
Inverter diodeindex0.1[28]
AC circuit breakerindex5.712[25]
Grid protectorindex5.712[25]
AC switchindex0.034[25]
Differential circuit breakerindex5.712[25]
Connectorindex0.00024[25]
Power storage systemindex12.89[28]
transformerindex6.44[28]
208 V/480 VWeibull3n/a[4]
transformer 480 V/34.5 kVWeibull2n/a[13]
Table 3. Failure rates of sub-system and total failure rates.
SubsystemNumber/PieceFailure Rate/10−6 h−1Subsystem Failure Rate/10−6 h−1
Bus electrolytic capacitor63.4420.64
OR film capacitor200.153
IGBT8 (With voltage—risen section)0.0080.064
AC relay6 (2 per phase)0.10.6
Liquid crystal1<20<20
In-flight communication1<20<20
Note: The total failure rate when electrolytic capacitors are used without maintenance is 61.304; the total failure rate when film capacitors are used under maintenance is 3.664.
Table 4. Reliability of each component within 20 years of 100 KW grid-connected PV power station.
Device NameWorking Time (Year)
15101520
PV module98.46 92.51 85.59 79.18 73.25
PV module string protector97.79 89.43 79.98 71.53 63.97
DC switch99.81 99.07 98.16 97.25 96.35
Inverter bus capacitance99.81 99.07 98.16 97.25 96.35
Inverter IGBT98.52 92.82 86.16 79.98 74.24
Inverter diode99.44 97.25 94.57 91.96 89.43
AC circuit breaker98.24 91.52 83.76 76.66 70.16
Grid protector98.24 91.52 83.76 76.66 70.16
AC switch99.99 99.95 99.89 99.84 99.79
Differential circuit breaker98.24 91.52 83.76 76.66 70.16
Connection terminal99.9399.6899.3599.0398.71
Publisher’s Note: MDPI stays neutral with regard to jurisdictional claims in published maps and institutional affiliations.

