Article

Deep Learning-Enhanced Framework for Performance Evaluation of a Recommending Interface with Varied Recommendation Position and Intensity Based on Eye-Tracking Equipment Data Processing

by
Piotr Sulikowski
1,* and
Tomasz Zdziebko
2
1
Faculty of Information Technology and Computer Science, West Pomeranian University of Technology, ul. Zolnierska 49, 71-210 Szczecin, Poland
2
Faculty of Economics, Finance and Management, University of Szczecin, ul. Mickiewicza 64, 71-101 Szczecin, Poland
*
Author to whom correspondence should be addressed.
Submission received: 7 January 2020 / Revised: 27 January 2020 / Accepted: 30 January 2020 / Published: 5 February 2020

Abstract

:
The increasing amount of marketing content in e-commerce websites results in the limited attention of users. For recommender systems, the way recommended items are presented becomes as important as the underlying algorithms for product selection. In order to improve the effectiveness of content presentation, marketing experts experiment with the layout and other visual aspects of website elements to find the most suitable solution. This study investigates those aspects for a recommending interface. We propose a framework for performance evaluation of a recommending interface, which takes into consideration individual user characteristics and goals. At the heart of the proposed solution is a deep neutral network trained to predict the efficiency a particular recommendation presented in a selected position and with a chosen degree of intensity. The proposed Performance Evaluation of a Recommending Interface (PERI) framework can be used to automate an optimal recommending interface adjustment according to the characteristics of the user and their goals. The experimental results from the study are based on research-grade measurement electronics equipment Gazepoint GP3 eye-tracker data, together with synthetic data that were used to perform pre-assessment training of the neural network.

1. Introduction

Fast e-commerce development inspires increasing attention to sales-boosting solutions, especially recommending systems, which aim to replace salespeople from traditional shops. Shopping online offers the benefit of convenience, but on the other hand it is lacking the personal touch of salespeople, especially when a customer has to select from a very large number of alternatives. Thus, the optimization of user experience, including personalization and implementing recommending interfaces, has a crucial role in e-commerce website design. While, in a physical store, a salesperson may directly recommend products, in an online shopping environment it is the recommending interface that helps promote products which may be interesting to the customer. Recommender systems play a vital role in motivating purchase decisions and usually prove successful in enhancing sales [1].
In a recommender system, a user model is usually created, constituting a description of a user, in order to facilitate interactions between the user and the system [2]. A digital representation of a user model is a user profile, which reflects their preferences, transactions, online behavior, etc. [3]. Online systems process a wide stream of user data [4,5,6,7] essential to build user profiles and recommend items which are optimal in terms of fit and, as a consequence, resulting sales. A lot of effort has been made to analyze that data spectrum and discover user preferences and needs [8,9]. Early solutions were founded on content-based and collaborative filtering algorithms [10], which were then extended towards explanation interfaces [11] with the use of context [12] and other approaches such as social media data inclusion [13,14].
The final performance of a recommending system, however, depends on factors that go beyond the recommendation algorithms themselves [15]. While there is substantial research in the area of those algorithms, there are substantially fewer studies in the area of the stages which follow in the online recommending process, such as item recommendation presentation. Human-computer interaction with recommending interfaces can be analyzed using DOM-events-based solutions [4] or gaze tracking [16,17,18]. Results from eye-tracking studies show that gaze data are a valuable source for inferring user interest, and the examination of the visual aspects of organizing a recommending interface may allow to better integrate those interfaces in e-commerce platforms [1,19,20]. In order to optimize the interface, a number of factors can be analyzed, such as the number of recommendations, recommendation item images, descriptions and layouts [21,22]. Since customers are inundated with information, especially marketing content, the habituation effect usually appears, which ends in the banner blindness phenomenon. As a result, even recommendations that are optimal from the algorithm perspective may provide insignificant results unless they are shown to the user in a wise way [23,24,25]: in the right part of a website, at the right moment of the selection and purchase process, with the right level of content intrusiveness [26,27,28], and considering personal preferences [29].
This paper is a substantial extension of a conference paper [30] and proposes a validated framework for the performance evaluation of a recommending interface, to optimize its efficiency considering individual user characteristics. The evaluation is based on a deep learning neural network trained on experimental data from an eye-tracking study on the varying visual intensity and position of a recommendation and enhanced with data from implicit user tracking and synthetic data for missing measures. The framework can be implemented as part of e-commerce personalization engine responsible for recommending interface adjustment.
The remainder of the article is structured as follows: the conceptual framework is presented in Section 2. The structure of the experiment and empirical results are provided in Section 3 and conclusions are presented in Section 4.

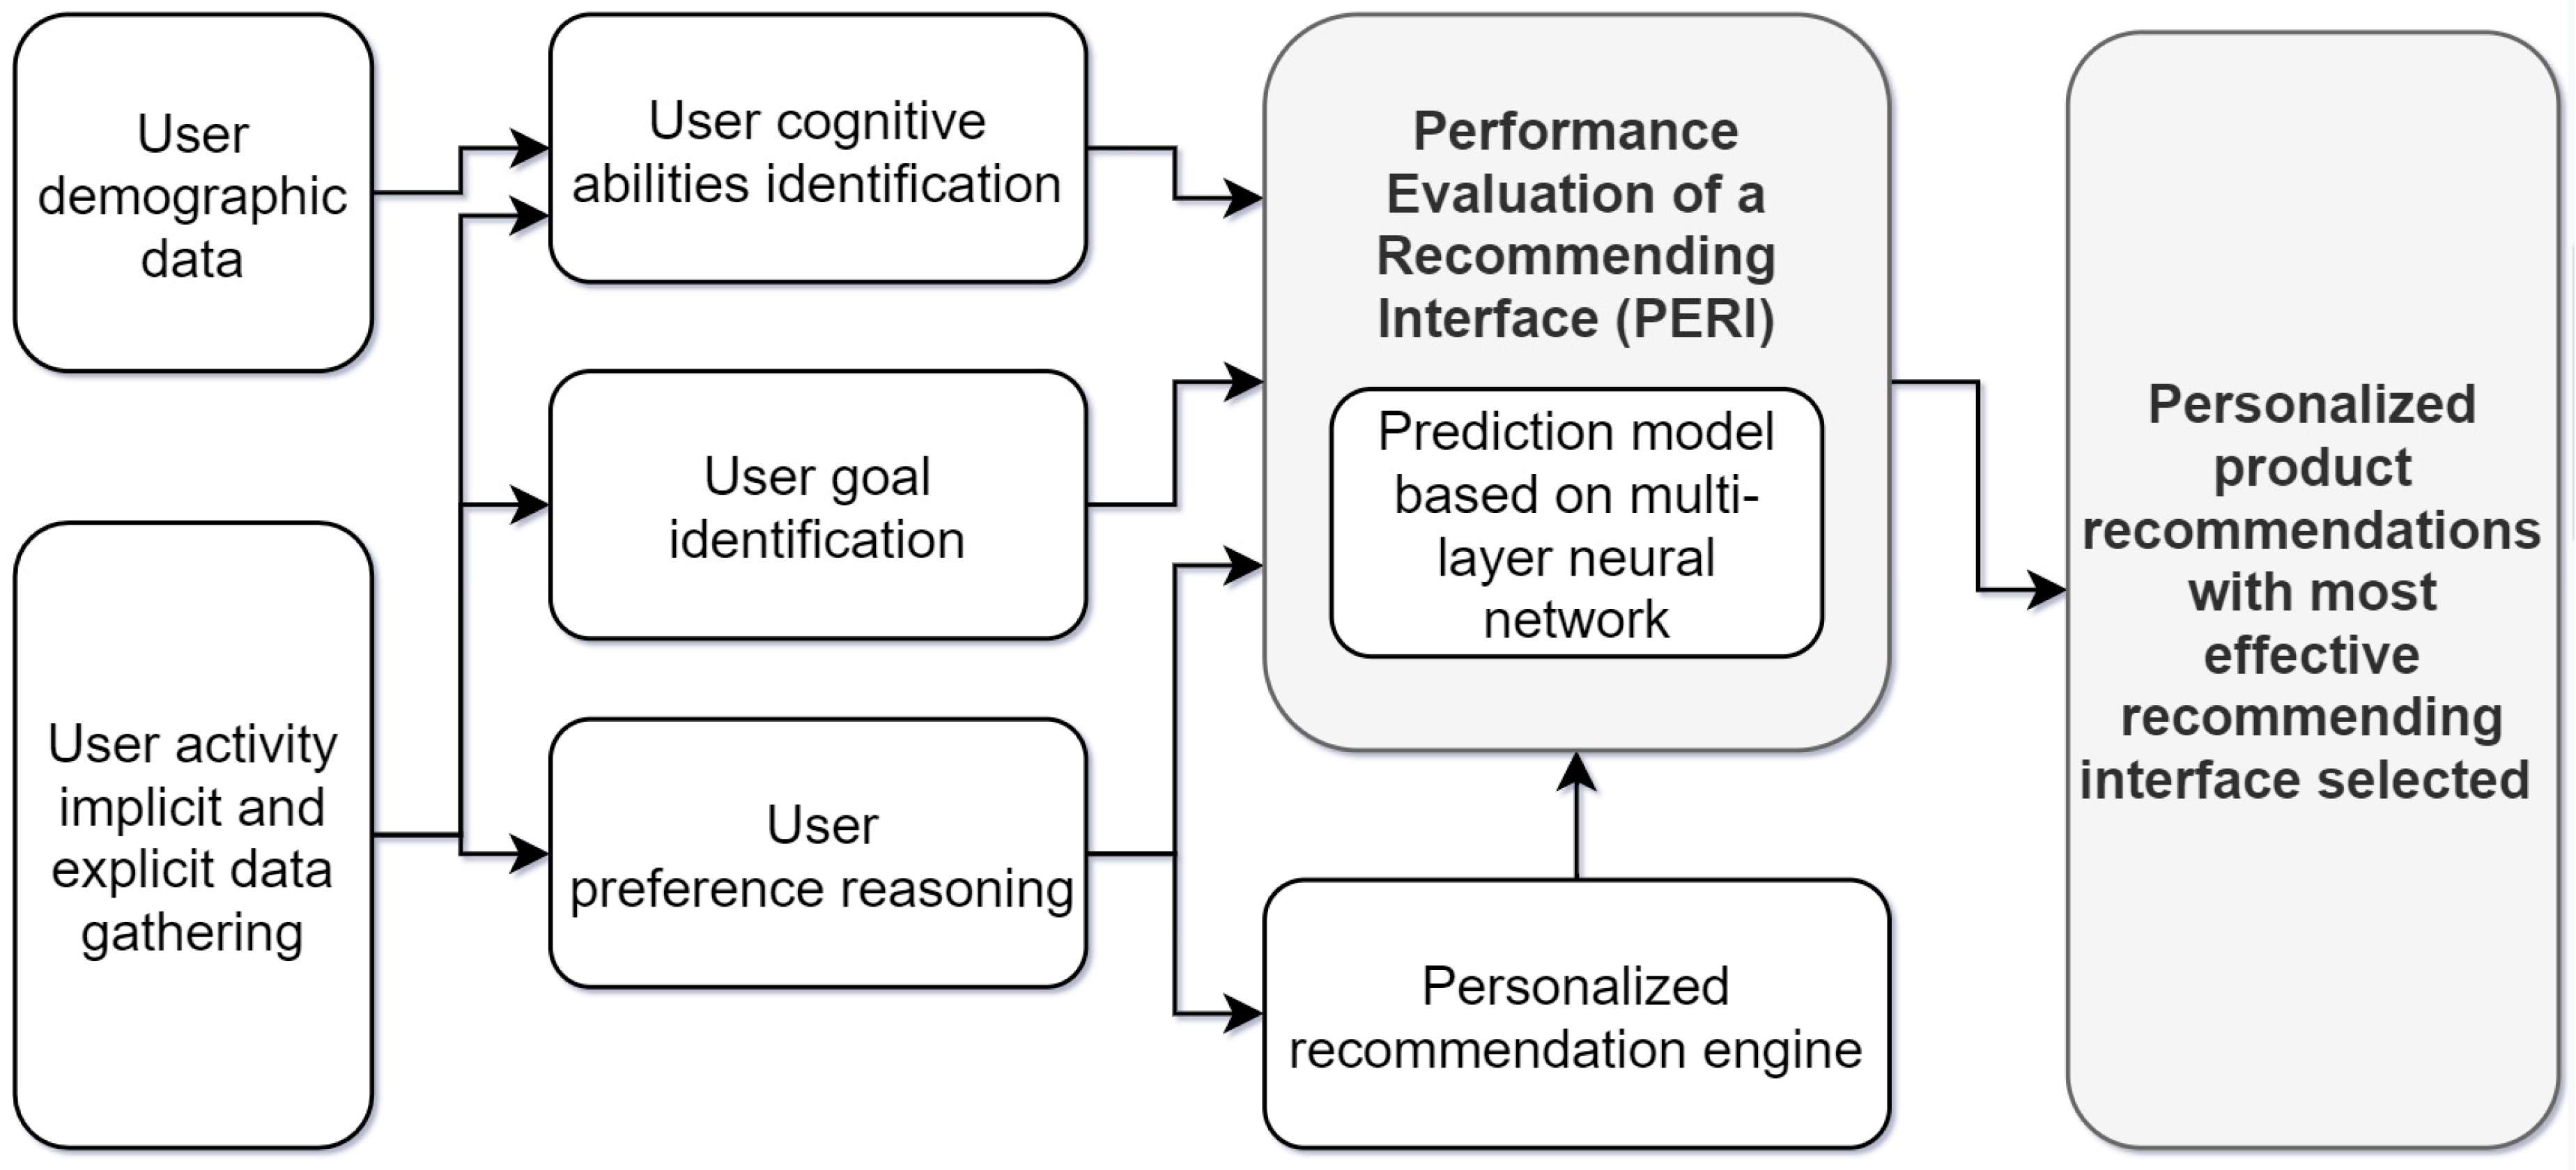
2. Conceptual Framework

The main objective of this paper is to present a framework for performance evaluation of the positioning of a recommendation within a recommending interface of a website and the varying visual intensity of a recommendation with regard to attracting customer interest. In order to evaluate the viability and usefulness of the framework in terms of user experience and marketing goals, a pre-assessment study is performed. This evaluation is based on a deep neural network model built on data from a study performed with research-grade measurement electronics equipment Gazepoint GP3 eye-tracker and synthetic data to perform pre-assessment training of the neural network.
The main assumption behind our proposed framework for Performance Evaluation of a Recommending Interface (PERI) is that different variants of a recommendation interface can have different impact on different users depending on their cognitive abilities [31,32], their way of interacting with a website and their goals of the visit to an e-commerce website. These assumptions have been confirmed by several studies [22,33,34,35].
In order to determine user interest, one can ask the user explicitly or observe them implicitly. While explicit questioning often disrupts natural behavior and constitutes an extra burden on the user [3,36,37], implicit measures are unobtrusive and therefore better suited to the purpose of the study. The subjects may focus on normally performed tasks, no extraneous cognitive load is generated and no additional motivation is required to provide explicit ratings [38,39,40,41].
The methodology of the research assumes the use of gaze tracking for user behavior observation. Eye tracking is a powerful method used to generate implicit feedback and one of the most popular techniques of observing human–computer interaction. Within the scope of the study, gaze-based data are analyzed and interpreted in a basic e-commerce scenario. Eye movements are used to discover which areas of an e-commerce website are most looked at, and which of them are the most relevant to the user, attracting user attention the most. Raw data collected by the eye-tracker device are processed with eye-tracking software and analytics algorithms.
Eye movements may be unordered in nature and unconscious, yet they are generally tightly connected with cognitive processes [42]. Therefore, inference about user attention and interest is possible based on gaze data. A literature review by Buscher et al. confirms that data from gaze-tracking equipment is an excellent source of information on how much attention is paid to particular content on the screen [43].
For the pre-assessment study, total fixation duration is the main gaze-based measure, used together with the buying action. Total fixation is used as an indicator of attractiveness by a number of research studies [35,44,45,46,47]. It is calculated as the sum of fixation durations aggregated on a section of a website, in particular the recommendation content (RC) section and the main section, with editorial content (EC). In the study, in addition to experimenting with the position of a recommending interface on a website and the location of a particular recommendation item (RI) within that interface, changes in visual intensity are also taken into account. Three basic levels of intensity are used. Changing the visual intensity of an item is a popular marketing technique used to counteract habituation and attract more attention [48]. Data from the eye-tracking study have been supplemented with features generated on the basis of those data.
Figure 1 depicts the architecture of the framework for the performance evaluation of a recommending interface utilizing certain recommendation positions and intensities. Its key components include the following:
  • User demographic data. Demographic data about users (i.e., age, education, interests) which can be used to identify user cognitive abilities. These data can be gathered through registration questionnaires;
  • User activity implicit and explicit data gathering. This module is responsible for collecting data about user behavior and preferences in an untrobusive way by implicitly tracking their activity, and explicitly by gathering opinions expressed mainly in the form of rating stars;
  • User goal identification. This module is responsible for the identification of the user’s goal. In the case of e-commerce websites, visitors can represent different stages of the purchase funnel. A user may be exploring the offer without having buying in mind. User goals can be identified based on a phrase typed in a search engine, the redirections source, and the relation between the items visited by user, usage of product filter utility and history of previous visits;
  • User cognitive abilities identification. The role of this module is to assess user’s cognitive abilities and classify them at one of a number of selected levels. As current cognitive abilities can influence the way a user interacts with a website and processes the provided information, presentation methods should be tailored to user abilities;
  • User preference reasoning. The role of this module is to infer user personal preferences about particular products, product features and product categories in general. Those preferences are used to construct a user model which is the input for the recommender system;
  • Personalized recommendation engine. This module is responsible for generating the most accurate personalized product recommendations for individuals, which fit their preferences and also can reach website goals;
  • Performance Evaluation of a Recommending Interface (PERI). This module is the core of the proposed framework. It is responsible for the evaluation of the performance of a possible set of different ways in which recommendations can be presented. The process of evaluation is carried from the perspective of individual user’s goals, cognitive abilities and website goals. The heart of this module is a prediction model based on a multi-layer deep neural network, which is trained preliminarily on the basis of eye-tracking data.
The proposed framework can be used for any e-commerce site to automatically adjust the recommending interface to the needs, preferences, goals, etc., of individuals and optimize the interface performance, optimally setting up the positions and visual intensities. The prediction model is based on a deep neural network, due to the multi-dimensionality of the preference evaluation task, as this modeling technique handles such sophisticated regression problems in the most accurate way. In real-world solutions, PERI may produce complex evaluation measures by incorporating different user goals. For example, in a scenario where a user is only browsing, without having buying in mind, the success of RC can be defined as clicking on an RC and then exploring a product page, or just by looking at the product description. Moreover, simply attracting user interest to RC, represented by fixation time, can also be of huge importance, as users rely on recommender systems to enhance their confidence in purchase decisions [1].

3. Experimental Results

3.1. Eye-Tracking Experiment Structure and Procedure

This section describes the experiment performed to collect the eye tracking and behavior data used to train the neural network responsible for the evaluation of recommending interfaces.
Task. Each participant was given the task to shop online in order to furnish a studio apartment with six types of furniture. Each subject was asked to move between product categories and select one item from each category, according to their individual preference.
Website. The experiment was composed of a recommending interface within a dedicated e-commerce website, developed using Drupal CMS. The website was available in Polish and consisted of a title, menu, product images and short descriptive text. It covered functions such as product list, buying cart and recommendations.
The editorial content (EC) was placed in the central area of the screen, under the main menu. It contained product lists about three screens long with 10 products in each product category. Each product had three unique features: name, product image and price. There were six product categories (PCj): wardrobes, chests of drawers, beds, bedside cabinets, tables and chairs. Products in a category were quite similar visually and similarly priced. In addition, under the furniture description there was an ‘Add to Cart’ button that stored customer choices in a database. Upon selection of a product, its short description was available in the cart preview and on the main cart page. Of course, it was possible to remove the product from the cart in order to allow the user to make changes to the final selection of purchases.
Recommending interface. There were two alternative recommendation interface layouts, i.e., horizontal and vertical recommending mode. This means that the recommendation content (RC) section was anchored in one of two dedicated parts of the screen below the main menu: either on the left side of the page, next to the general product list (in vertical mode), or at the top of the page, above the general product list (in horizontal mode). Only one recommendation layout was available at a time, so, when horizontal mode was on, the vertical one was deactivated and vice versa. Figure 2 shows variants of the recommendation content (RC) location.
The RC section consisted of four recommendation items—RC1 to RC4,—randomly selected from all products in a category. The section in each variant did not change its location on the screen when browsing products in the product category, regardless of the user scrolling the EC section. In fact, only general product lists were made scrollable to ensure reliable subject exposure to the recommendation interface.
It was ensured that product features, i.e., name, image and price, would not stand out from other products in the category. It was assumed that the possible distinction of a particular RCi location would be achieved only by means of visual intensity VI. Three levels of intensity were used: standard (without any highlight)—VI1, flickering (slowly disappears and reappears every 1–2 s)—VI2 and background in red—VI3. There was a maximum of one RCi at VI2 or VI3 for each product category. An example of visual intensity of the last kind (VI3) is shown in Figure 3.
Measurement equipment. Research-grade Gazepoint GP3 eye tracker, a 60 Hz update rate system, was utilized. The device’s nominal accuracy is 0.5–1 degree of visual angle. It allows for ±15 cm range of depth movement and offers 5- and 9-point calibration. It is powered by USB.
Procedure. The experiment proceeded as follows. First, the test person was sitting at the test stand in such a way that their eyes were in the optimal range of the eye-tracking device’s camera. It was explained what the device for tracking eyeball movements is, and then the eye tracker was calibrated with Gazepoint Control software and a 9-point calibration method. For greater accuracy, calibration was always performed twice, the first time just to familiarize the subject with the process. There was a dual monitor setup with the operator screen invisible to the participant. Thanks to the correct calibration, the device was able to determine the coordinates of the place where the user was looking.
The participant was then informed of their task but was not told about the purpose of the study. After this introduction, the subject had to furnish the apartment. After choosing one item from a category, the subject clicked ‘Next’ and was automatically moved to the next category. Category by category, the visual intensity of recommendation items changed every time. In addition, for the first three categories, the layout of RC was vertical and, after moving to the fourth category, it changed to horizontal and remained thus for the following categories. In general, each participant was presented with at least six subsequent webpages with different recommendation options.
Each session was monitored live and recorded using Gazepoint Analysis software. We constantly double-checked the operator’s monitor to ensure the eyes of the subject were in the optimal position relative to the camera, etc. After the participant had completed the task, basic data such as age were collected, and a question was asked about whether the subject felt they were influenced by the recommendations. Finally, all data were saved and stored by the eye-tracking system for further analysis. One experimental run typically lasted about 12 min.
Participants. The initial experimental group of users consisted of 52 people who produced valid eye-tracking data. Most of them were undergraduate or graduate students invited in person or attracted to advertisements for the study, and they were native Polish speakers. They ranged in age from 14 to 54 years (mean = 25.2, σ = 8.0).

3.2. Performance Evaluation of a Recommending Interface Experiment Structure and Procedure

This section relates to the next stage of the experiment necessary to preliminarily implement the proposed framework for Performance Evaluation of a Recommending Interface (PERI). In line with the character of the study, the presented implementation does not cover the full spectrum of data described in the proposal, related to goal identification and preference reasoning modules which were not used since participants were given only one particular task. For the ultimate measure of interface performance, the add-to-cart action was chosen in this implementation. As mentioned in the framework proposal, other performance measures could alternatively be employed, e.g., fixation time on the recommending interface, time spent on a product page accessed via the recommending interface, etc.
Data. Data collected using the eye-tracking device were used to build a deep learning solution and perform our pre-assessment study. Fixation data collected with Gazepoint Analysis software constitute lines containing information about all fixations performed by participants. In total, 15,922 fixation records were generated.
Preprocessing. Data were preprocessed in order to extract fixations concerning individual RCi locations for every product category PCj and every user who was efficiently involved in the study. As a result, 593 rows were generated, each containing the following features: RC layout (horizontal/vertical)—rc_layout, RCi location (1-4)—rc_location, recommendation position intensity level (1-3)—rc_location_intensity, total fixation time for RC layout—fixation_time_layout, total fixation time for RCi location—fixation_time_location, total time spent on product category page—fixation_time_category, percentage of time while fixation was registered inside the RC layout in relation to total time spent on category page—share_time_layout_category, percentage of time while fixation was registered inside RCi location in relation to total time spent on category page—share_time_location_category, percentage of time while fixation was registered inside RCi location in relation to total time spent on RC layout—share_time_location_layout, user age—user_age, level of user’s cognitive abilities—user_cognitive_ability_level, adding the product to cart action (and its purchase) from RCadd_to_cart. The features concerning the time spent looking at RC were introduced to measure interest in the recommending interface.
All the features beside the last one were used to predict the add-to-cart action, which, in the case of our study, was selected as the ultimate efficiency measure. This measure was selected due to the purchase task given to participants. In another scenario, a different efficiency measure could be applied, for example, interest level generated by recommending interface, measured as time spent on recommended product pages.
Neural network. The preprocessed data were used to train a neural network responsible for the evaluation of recommending interfaces. Multi-layer perceptron deep neural network architecture was chosen as most suitable for the classification problem with a low number of features and training records. It allowed for the deep learning of the relationship between interactions with different recommending interfaces and their efficiency, where success was measured as the add-to-cart action. IBM SPSS Statistics was utilized for building the deep learning network.

4. Results

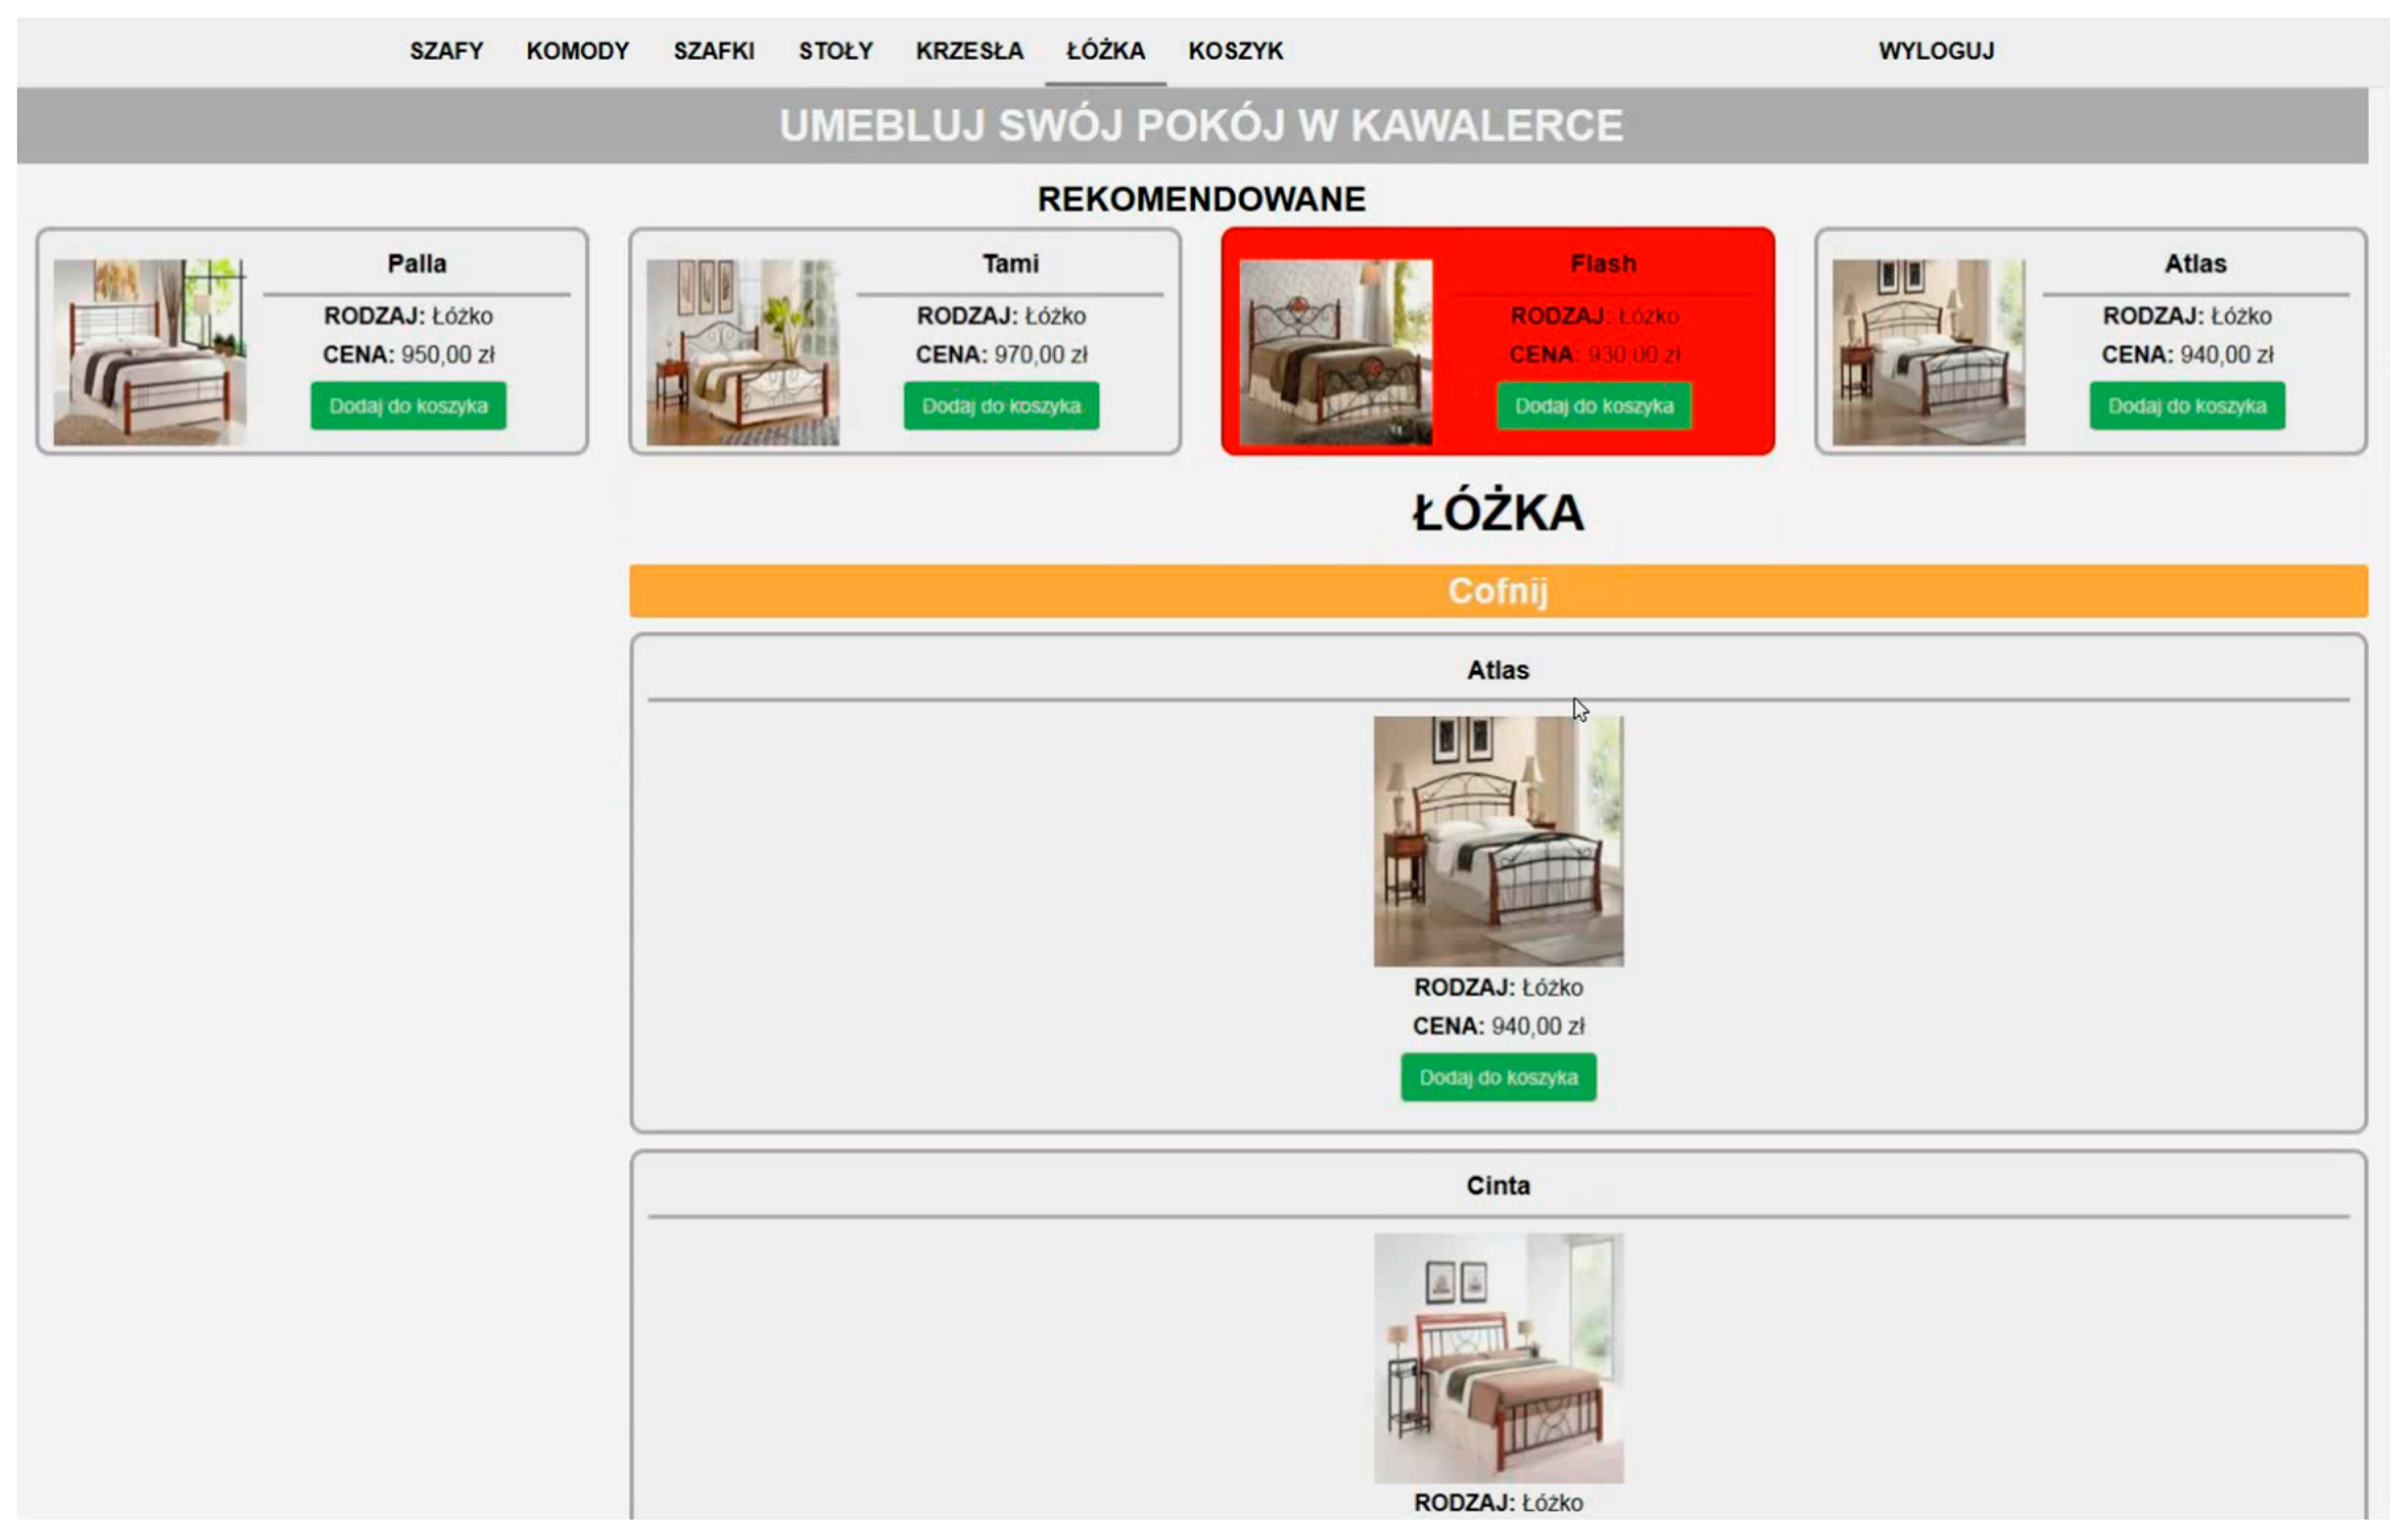
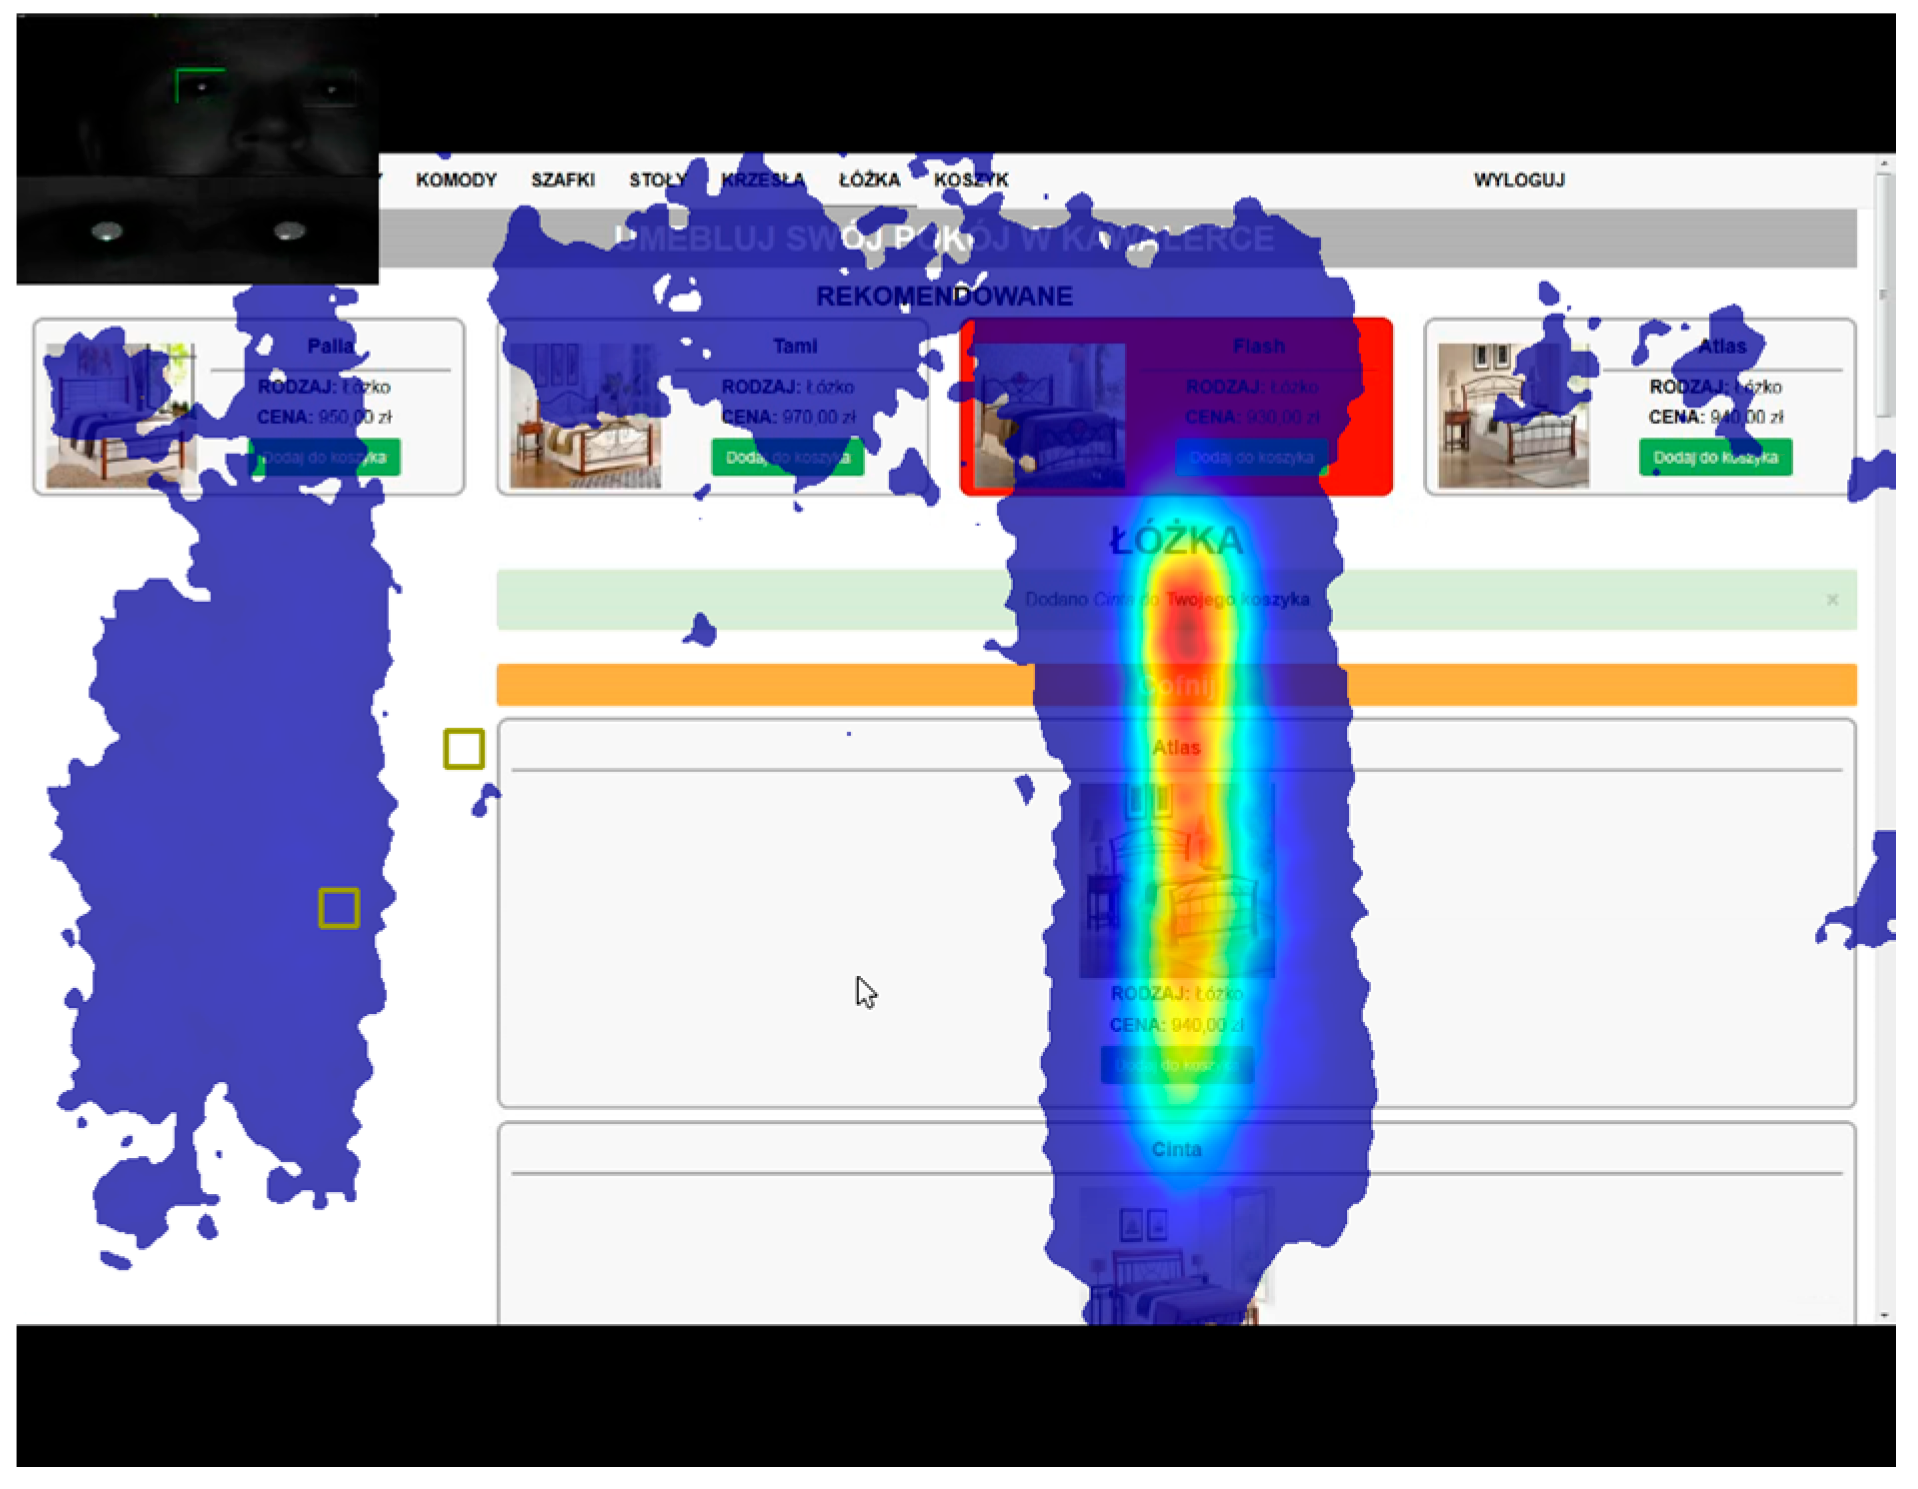
4.1. Eye-Tracking Results of Recommending Interface Efficiency

After completing the task, 33% of participants responded that they felt their selection was influenced by the RC areas of the site (6% felt strongly about it), while others claimed the opposite, including 52% who strongly felt they did not care about recommendations on the website. The last group did indeed seem to show strong resistance to the recommendations—some of those participants, when shown the RC sections after the test, were surprised that they might have neglected most of them at all, treating them comparably to adverts, which confirms the prevalence of the habituation effect.
The analysis of eye-tracking data shows that the task took, on average, 2.3 min to complete. In the study, 312 products were selected for purchase in total. Fixation time on the recommending interface was, on average, 16.3 s per person, which is 12% of the average task completion time. The mean amount of time devoted by subjects to observing RC was 8.2 s and 8.1 s for the vertical and horizontal layouts, respectively. Thus, in terms of fixation time, the two presented variants of the recommending interface layout offered equal performance.
Table 1 shows in more detail the distribution of these times for all locations of recommendation items. It was found that the first three locations, RCi, were the most favorable, irrespective of the layout. The least eye-catching locations took fourth place on the list, next to the bottom bar of the website (vertical layout) or next to the right edge of the screen (horizontal layout). The most popular of all was the RC3 location in the horizontal arrangement (3.9 s). This was probably influenced by the fact that this recommendation item was placed directly above the general product list. The second most popular location was RC2 and the third was RC1, both in the vertical layout. The apparent popularity of RC2 in this arrangement was impacted by the fact that, in one product category, this item was shown as flickering (VI2), and the popularity of RC1, although always shown with standard visual intensity (VI1), may be influenced by the fact that a lot of people perceive the first location on a list as the best one. It should be noted that, in the case of the vertical layout, this first position still worked better than RC3, which, for one product category, was presented with dazzling intensity VI3. Item RC3 in vertical mode performed on a par with item RC2 in the horizontal layout, the latter being supported by flickering effect (VI2) for one product category.
An aggregated heatmap for all participants is presented in Figure 4. It illustrates the views of users in website areas. The areas that received the most attention have a warmer color, while those that were less attractive have a colder one. This map shows that the recommending interface received some attention in relation to the total time spent on completing the task, but less than the main product list. We can also notice some differences in the attractiveness of recommendation items in different locations to the disadvantage of RC4 for both layout options.
From a sales perspective, 12% of products in all carts were selected directly from the recommendation items. Oddly, this is exactly the same proportion as the one of the recommending interface fixation time to task completion time, which shows the importance of focusing attention on recommended items. Vertical RC layout was responsible for 62% of product selections, while the others were due to the horizontal RC layout—the vertical layout turned out to be almost twice as effective as the other. This may be related to banner blindness, where banners have historically often been placed in the very same area of a website as horizontal recommendations in the experiment. In the case of the vertical layout, for RC with all RCi at the standard intensity level (VI1), the recommendation-driven purchases (RDPs) were evenly distributed among the recommended products. In the case of RC with RC2 at the flickering intensity level (VI2), the item attracted four out of nine RDPs in the product category; in the case of RC with RC3 on a red background (VI3), the item surprisingly attracted only one out of eight RDPs in the product category. On the whole, RC2 was the most effective, which means that the second recommendation on the vertical list brought the most sales (48% of RDP’s for vertical RC, and 30% of all RDP’s). The recommendation-driven purchase volume is presented in more detail in Table 2.
It has to be noted that only direct recommendation driven purchases were considered, that is, purchases initiated directly from RC. It was not feasible to reliably assess non-direct RDPs, that is, the amount of purchases committed from the general product list, yet inspired by recommendation items. Therefore, non-direct RDPs were not analyzed in this study. However, it was noticed in the visual analysis that a few subjects glanced at a recommendation item and, sometime later, decided to select the same product from the general product list, with causation not confirmed.
Another side remark after visual analysis is connected with the fact that the flickering effect (VI2) of a recommendation item seemed to have a prolonged effect on fixation after moving to the next product category. This means that, despite the visual intensity changing to standard, this recommendation location continued to attract attention.

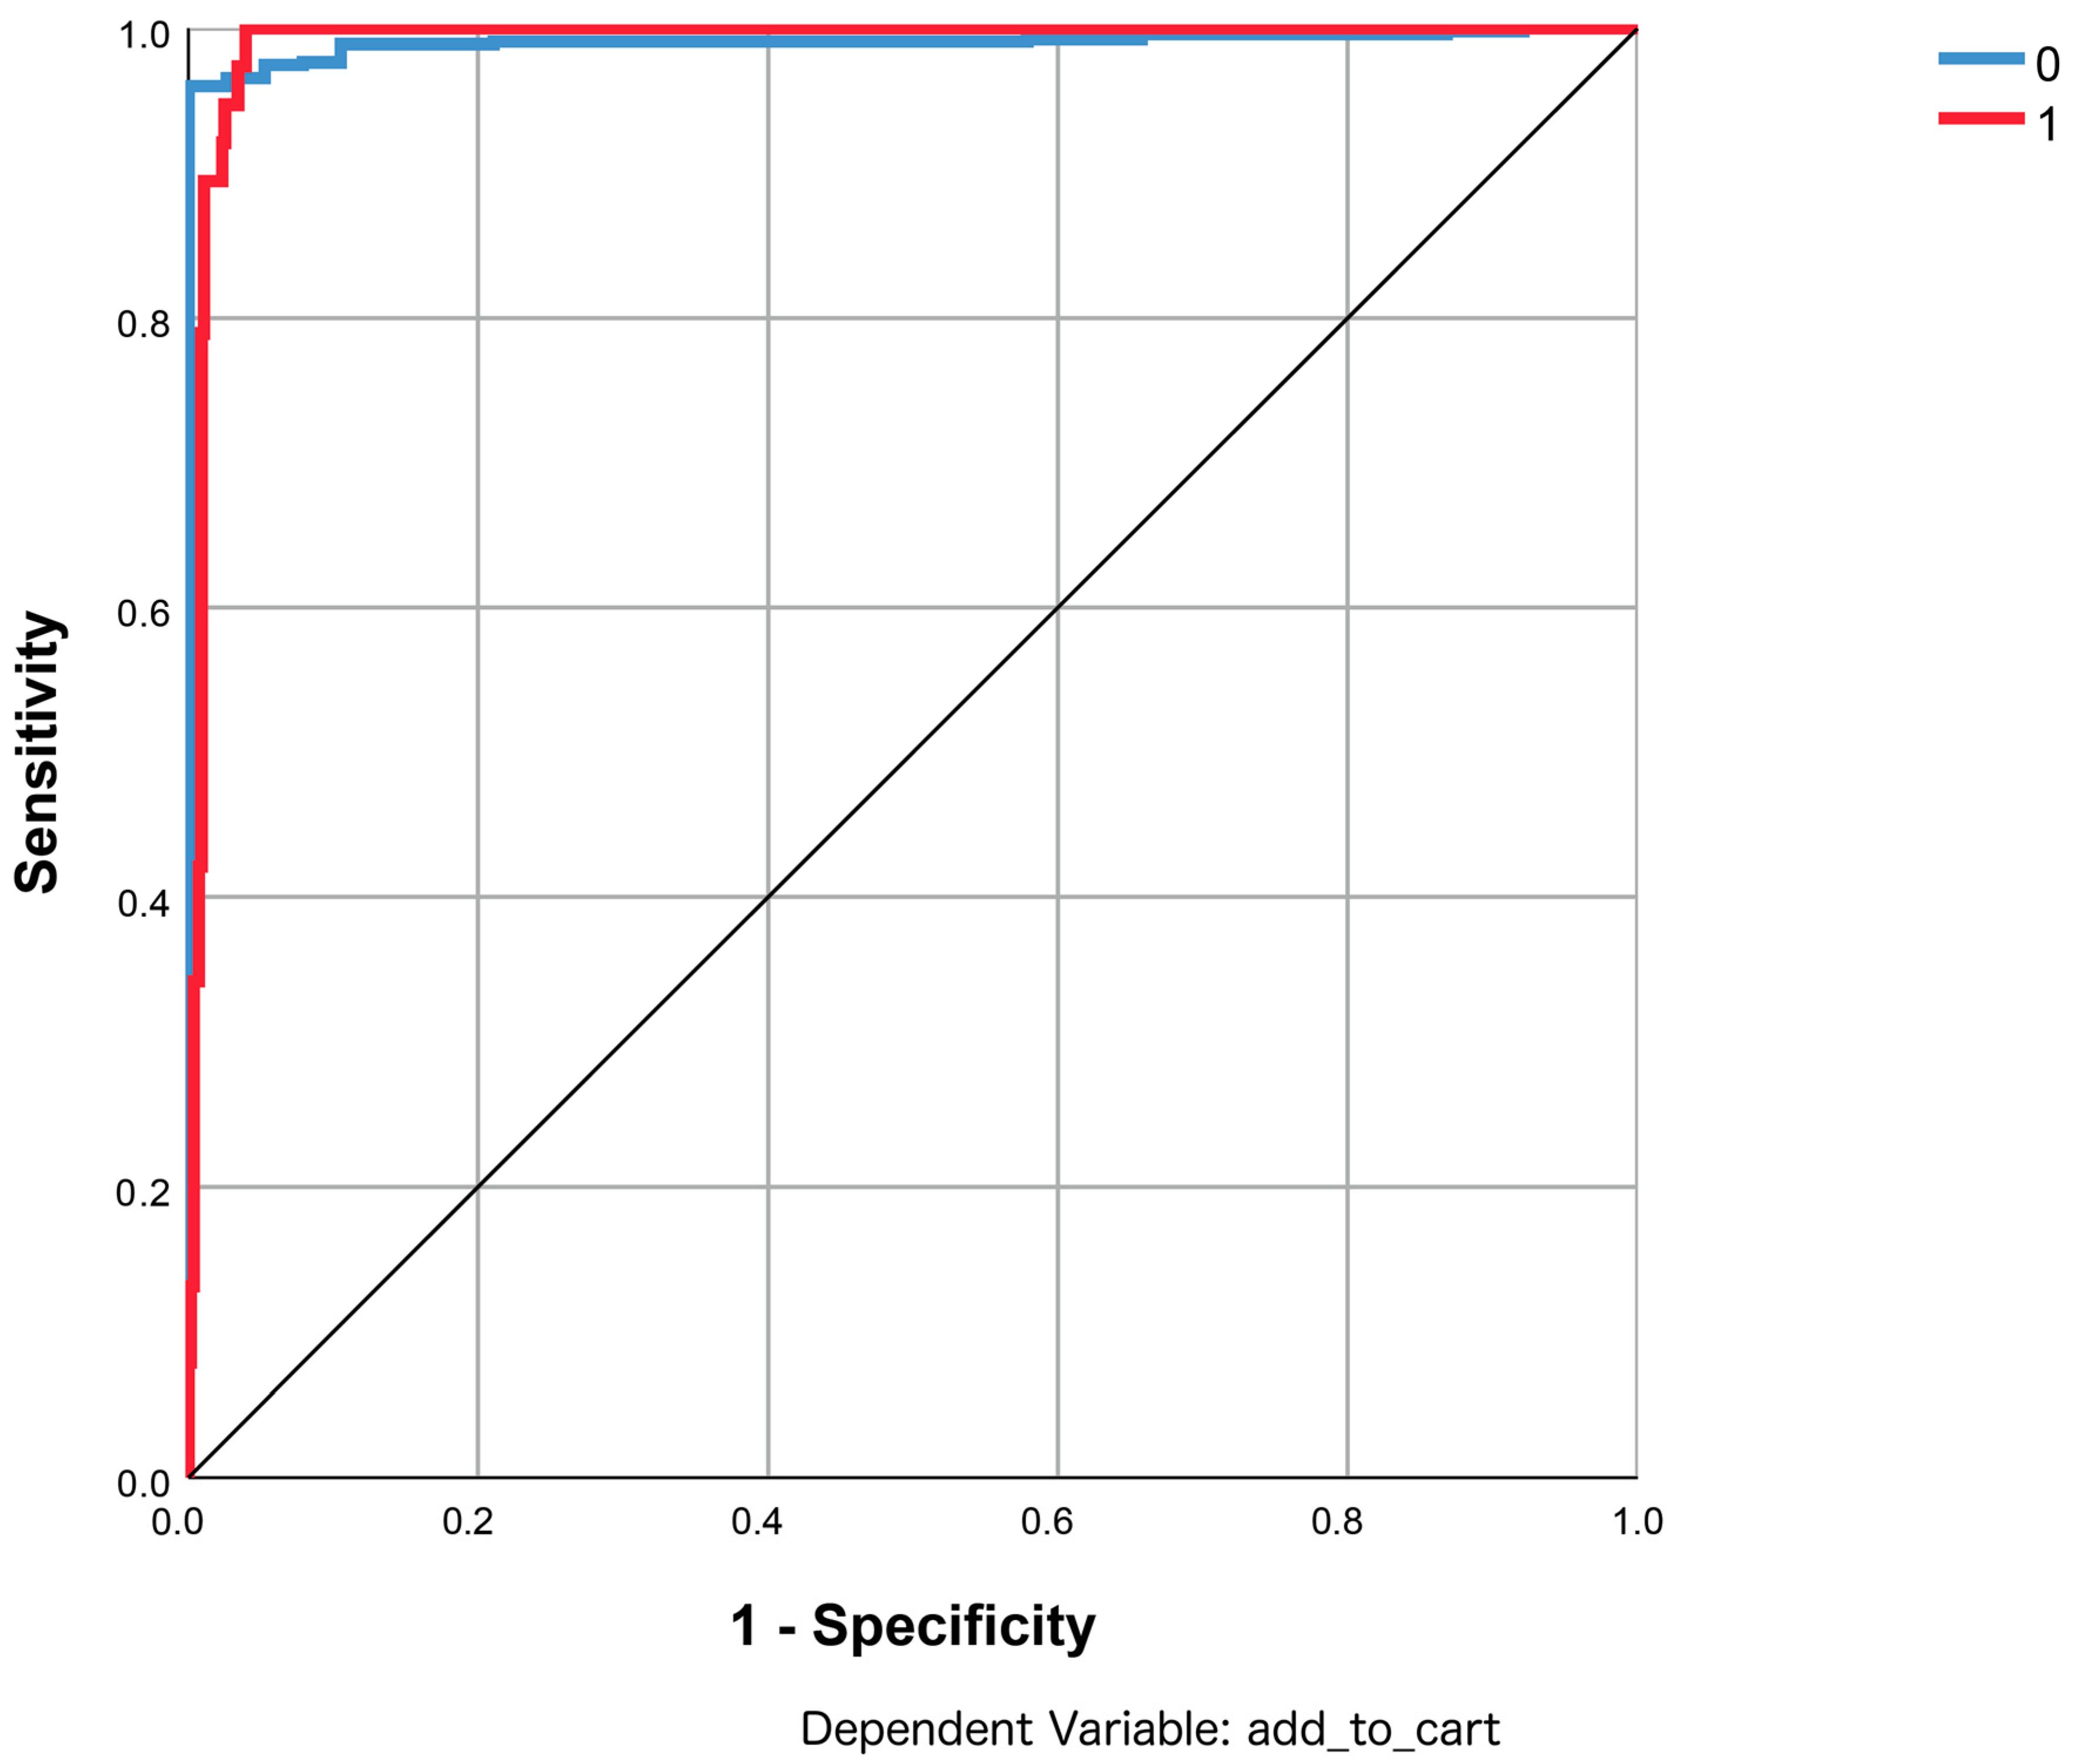
4.2. Results of the Pre-assesment Study of the Proposed Framework for Performance Evaluation of a Recommending Interface (PERI)

Using data described in Section 3.2, the deep neural network was trained for the goal of predicting the performance of recommending interfaces. As a performance measure, the action of adding a product to cart from the RCi location was used. In total, 40 products were selected directly from RCi locations. A custom multilayer perceptron with two hidden layers for the binary classification of adding a product to cart was built, the number of neurons being computed automatically. The resulting neural network consisted of four layers (one input, two hidden and one output). The parameters of the neural network are presented in Table 3. Variables rc_location and user_cognitive_ability_level were treated as categorical variables and, thus, one-hot encoding was performed, resulting in one input neuron for each variable value. In both hidden layers and the output layer, sigmoid function was used as activation function. For training the neural network, the gradient descent algorithm was used, with an initial learning rate of 0.4 and momentum of 0.9. The number of neurons in each hidden layer was determined automatically by using iterative estimation algorithms (IBM SPSS Statistics). All input variables were normalized before training of the network.
A test sample of 168 records (around 28.3%) was put aside for the accuracy validation of the neural network. Due to unbalanced data there, were ten positive samples randomly selected. The confusion matrix on the training and testing sample is shown in Table 4. Overall classification accuracy is high for both training and testing datasets, at 98.4% and 98.2%, respectively. The best results are achieved for the not-buying action, with 98.7% and 99.4% of accuracy for both training and testing sets. Regarding predicting the buying action, the accuracy is also quite high—92.9% and 80.0% for the same sets, respectively. Precision and recall accuracy equal 80% and 89%, respectively, and they are the most appropriate metrics for the accuracy evaluation of the model.
Other metrics show overall good accuracy of the resulting network, with AUC 0.991 for both actions (buying and not-buying) with high sensitivity and specificity (Figure 5).
The most important variables for the deep neural network are fixation_time_location, fixation_time_layout, share_time_location_layout, share_time_location_category and rc_location (Table 5). The importance of each predictor was calculated with the SLRM algorithm by removing each predictor variable in turn from the model and verifying how that affects the model’s accuracy.

5. Conclusions

E-commerce platform designers, together with marketers, seek ways of attracting the attention of web users and encouraging them to commit to purchases, in particular with the use of recommending interfaces. The presented study showed the influence of the layout of a recommending interface, the position of a recommendation item and various levels of visual intensity applied to it, on user behavior in a simply structured shopping website. Thanks to the research-grade measurement electronics equipment Gazepoint GP3 eye tracker, as well as tracking participants’ purchase decisions, the attractiveness of selected website areas was analyzed. A framework for the Performance Evaluation of a Recommending Interface (PERI) was proposed.
There are several major conclusions. In the experiment, an average of 12% of task completion time was used to look at the recommending interfaces and, coincidentally, exactly the same percentage of goods were purchased directly from recommendations. While comparing the vertical and horizonal recommending interface modes, in terms of fixation time, they performed equally, but from the point of view of purchase commitments, the vertical layout proved to be almost twice as effective as the horizontal one. It is speculated that the worse sales performance of the horizontal layout is related to banner blindness, because banners usually occupy a similar rectangular space at the top of the screen. In the better performing vertical arrangement, the most attractive in terms of fixation time was the position on the list, where the effect of slow flickering was used to increase visual intensity. On the other hand, the high visual attractiveness of the first item on the list, despite the lack of any visual distinction, may be due to the preconception that the first is always the best (similar to search engines). The level of attractiveness of the dazzling red back background was relatively low, probably due to the excessively high content intrusiveness that turned out to be counterproductive. It was also found that the first three locations in a recommending interface were the most eye-catching, regardless of the layout, with the least popular locations being the last ones, bordering the bottom or right edge of the website, respectively, for vertical and horizontal layouts. The study justifies considering a vertical rather than horizontal layout when designing a recommending interface and suggests that it is necessary to search for balanced rather than radical visual intensity solutions to counteract the habituation effect without adversely affecting buyers.
The results, based on deep learning solutions used to implement the framework for Performance Evaluation of a Recommending Interface (PERI), showed that the obtained multilayer perceptron has a very good overall prediction accuracy (precision: 80%, recall: 89%) and can be used to assess the performance of different recommending interfaces for users with different characteristics. The prediction accuracy of the adding a product to basket action is a little lower but still high, which is understandable, considering the preliminary character of PERI implementation and the fact that the results were obtained based on a relatively small dataset with a selected number of features. Nevertheless, we showed that the PERI framework can be used to automate an optimal recommending interface adjustment, including adjusting the recommendation position and visual intensity, according to the characteristics of the user. We are planning to perform an extended research with more complex e-commerce stores’ websites and subsamples of users of those stores in order to get a wider representation of user characteristics; users will also be given different tasks, from searching to buying, in order to include the goal identification and preference reasoning modules, and further validate the framework. We are also planning to test more types of deep learning networks with more hidden layers and neurons, as well as other machine learning techniques, in order to seek the best-performing architectures for this sophisticated and multidimensional problem.

Author Contributions

Conceptualization, P.S.; methodology, P.S., T.Z.; software, P.S., T.Z.; supervision, P.S.; validation, P.S., T.Z.; formal analysis, P.S., T.Z.; investigation, P.S., T.Z.; resources, P.S.; data curation, P.S., T.Z.; writing—original draft preparation, P.S.; writing—review and editing, P.S., T.Z.; visualization, P.S., T.Z.; project administration, P.S.; funding acquisition, P.S., T.Z. All authors have read and agreed to the published version of the manuscript.

Funding

This research project was supported by the National Science Centre of Poland, Grant No. 2017/27/B/HS4/01216 coordinated by Prof. Jaroslaw Jankowski.

Acknowledgments

We would like to thank Chair of Information Systems Engineering Jaroslaw Jankowski (West Pomeranian University of Technology) for project funding acquisition, administration and co-ordination. We would also like to thank PhD student Kamil Bortko (West Pomeranian University of Technology) for help with experimental lab setup and graduate student Lukasz Dobrowolski (West Pomeranian University of Technology) for support, initial gaze data being presented in his master’s thesis with the permission granted by the first author and under his guidance.

Conflicts of Interest

The authors declare no conflict of interest.

References

  1. Smith, B.; Linden, G. Two decades of recommender systems at Amazon. com. IEEE Internet Comput. 2017, 21, 12–18. [Google Scholar] [CrossRef]
  2. Bagher, R.C.; Hassanpour, H.; Mashayekhi, H. User trends modeling for a content-based recommender system. Expert Syst. Appl. 2017, 87, 209–219. [Google Scholar] [CrossRef]
  3. Jannach, D.; Lerche, L.; Zanker, M. Recommending based on implicit feedback. In Social Information Access; Springer: Cham, Switzerland, 2018; pp. 510–569. [Google Scholar]
  4. Sulikowski, P.; Zdziebko, T.; Turzyński, D.; Kańtoch, E. Human-website interaction monitoring in recommender systems. Procedia Comput. Sci. 2018, 126, 1587–1596. [Google Scholar] [CrossRef]
  5. Sulikowski, P.; Zdziebko, T.; Turzyński, D. Modeling online user product interest for recommender systems and ergonomics studies. Concurr. Comput. Pract. Exp. 2019, 31, e4301. [Google Scholar] [CrossRef]
  6. Wątróbski, J.; Jankowski, J.; Karczmarczyk, A.; Ziemba, P. Integration of Eye-Tracking Based Studies into e-Commerce Websites Evaluation Process with eQual and TOPSIS Methods. In Information Systems: Research, Development, Applications, Education, Proceedings of the 10th SIGSAND/PLAIS EuroSymposium 2017, Gdańsk, Poland, 22 September 2017; Lecture Notes in Business Information Processing; Wrycza, S., Maślankowski, J., Eds.; Springer: Cham, Switzerland, 2017; Volume 300, pp. 56–80. [Google Scholar]
  7. Jankowski, J.; Ziemba, P.; Wątróbski, J.; Kazienko, P. Towards the tradeoff between online marketing resources exploitation and the user experience with the use of eye tracking. In Intelligent Information and Database Systems, Proceedings of the 8th Asian Conference, ACIIDS 2016, Da Nang, Vietnam, 14–16 March 2016; Part I. Lecture Notes in Artificial Intelligence; Nguyen, N.T., Trawiński, B., Fujita, H., Hong, T.P., Eds.; Springer: Berlin, Germany, 2016; Volume 9621, pp. 330–343. [Google Scholar]
  8. Melville, P.; Sindhwani, V. Recommender Systems. In Encyclopedia of Machine Learning and Data Mining; Springer Publishing Company: New York, NY, USA, 2017; pp. 1056–1066. [Google Scholar]
  9. Yi, B.; Shen, X.; Liu, H.; Zhang, Z.; Zhang, W.; Liu, S.; Xiong, N. Deep matrix factorization with implicit feedback embedding for recommendation system. IEEE Trans. Ind. Inf. 2019, 15, 4591–4601. [Google Scholar] [CrossRef]
  10. Yang, X.; Guo, Y.; Liu, Y.; Steck, H. A survey of collaborative filtering based social recommender systems. Comput. Commun. 2014, 41, 1–10. [Google Scholar] [CrossRef]
  11. Zhang, Y.; Chen, X. Explainable recommendation: A survey and new perspectives. arXiv 2018, arXiv:1804.11192. [Google Scholar]
  12. Verbert, K.; Manouselis, N.; Ochoa, X.; Wolpers, M.; Drachsler, H.; Bosnic, I.; Duval, E. Context-aware recommender systems for learning: A survey and future challenges. IEEE Trans. Learn. Technol. 2012, 5, 318–335. [Google Scholar] [CrossRef]
  13. Lu, J.; Wu, D.; Mao, M.; Wang, W.; Zhang, G. Recommender system application developments: A survey. Decis. Support Syst. 2015, 74, 12–32. [Google Scholar] [CrossRef]
  14. Seo, Y.D.; Kim, Y.G.; Lee, E.; Baik, D.K. Personalized recommender system based on friendship strength in social network services. Expert Syst. Appl. 2017, 69, 135–148. [Google Scholar] [CrossRef]
  15. Cremonesi, P.; Elahi, M.; Garzotto, F. User interface patterns in recommendation-empowered content intensive multimedia applications. Multimed. Tools Appl. 2017, 76, 5275–5309. [Google Scholar] [CrossRef] [Green Version]
  16. Li, Y.; Xu, P.; Lagun, D.; Navalpakkam, V. Towards measuring and inferring user interest from gaze. In Proceedings of the 26th International Conference on World Wide Web Companion, Perth, Australia, 3–7 April 2017; International World Wide Web Conferences Steering Committee: Geneva, Switzerland, 2017; pp. 525–533. [Google Scholar]
  17. Zhao, Q.; Chang, S.; Harper, F.M.; Konstan, J.A. Gaze prediction for recommender systems. In Proceedings of the 10th ACM Conference on Recommender Systems, Boston, MA, USA, 15–19 September 2016; pp. 131–138. [Google Scholar]
  18. Chen, L.; Wang, F. An eye-tracking study: Implication to implicit critiquing feedback elicitation in recommender systems. In Proceedings of the 2016 Conference on User Modeling Adaptation and Personalization, Halifax, NS, Canada, 13–16 July 2016; pp. 163–167. [Google Scholar]
  19. Chen, L.; Wang, F.; Pu, P. Investigating users’ eye movement behavior in critiquing-based recommender systems. AI Commun. 2017, 30, 207–222. [Google Scholar] [CrossRef]
  20. Jin, Y.; Tintarev, N.; Verbert, K. Effects of personal characteristics on music recommender systems with different levels of controllability. In Proceedings of the 12th ACM Conference on Recommender Systems (RecSys’18), Vancouver, BC, Canada, 2–7 October 2018; pp. 13–21. [Google Scholar]
  21. Bortko, K.; Bartków, P.; Jankowski, J.; Kuras, D.; Sulikowski, P. Multi-criteria Evaluation of Recommending Interfaces towards Habituation Reduction and Limited Negative Impact on User Experience. Procedia Comput. Sci. 2019, 159, 2240–2248. [Google Scholar] [CrossRef]
  22. Hu, R.; Pu, P. Enhancing recommendation diversity with organization interfaces. In Proceedings of the 16th International Conference on Intelligent User Interfaces, Palo Alto, CA, USA, 13–16 February 2011; pp. 347–350. [Google Scholar]
  23. Portnoy, F.; Marchionini, G. Modeling the effect of habituation on banner blindness as a function of repetition and search type: Gap analysis for future work. In Proceedings of the CHI’10 Extended Abstracts on Human Factors in Computing Systems, Atlanta, GA, USA, 10–15 April 2010; pp. 4297–4302. [Google Scholar]
  24. Ha, L. Digital advertising clutter in an age of mobile media. In Digital Advertising; Routledge: Abington, UK, 2017; pp. 69–85. [Google Scholar]
  25. Hussein, D.; Han, S.N.; Lee, G.M.; Crespi, N. Social cloud-based cognitive reasoning for task-oriented recommendation in the social internet of things. IEEE Cloud Comput. 2015, 2, 10–19. [Google Scholar] [CrossRef] [Green Version]
  26. Jankowski, J.; Hamari, J.; Watróbski, J. A gradual approach for maximising user conversion without compromising experience with high visual intensity website elements. Internet Res. 2019, 29, 194–217. [Google Scholar] [CrossRef]
  27. Resnick, M.; Albert, W. The Impact of Advertising Location and User Task on the Emergence of Banner Ad Blindness: An Eye-Tracking Study. Int. J. Hum. Comput. Interact. 2014, 30, 206–219. [Google Scholar] [CrossRef]
  28. Jankowski, J. Modeling the Structure of Recommending Interfaces with Adjustable Influence on Users. In Intelligent Information and Database Systems, Proceedings of the 5th Asian Conference, ACIIDS 2013, Kuala Lumpur, Malaysia, 18–20 March 2013; Lecture Notes in Computer Science 7803; Springer: Berlin/Heidelberg, Germany, 2013; pp. 429–438. [Google Scholar]
  29. Cheng, S.; Liu, Y. Eye-tracking based adaptive user interface: Implicit human-computer interaction for preference indication. J. Multimodal User Interfaces 2012, 5, 77–84. [Google Scholar] [CrossRef]
  30. Sulikowski, P. Evaluation of Varying Visual Intensity and Position of a Recommendation in a Recommending Interface Towards Reducing Habituation and Improving Sales. In Advances in E-Business Engineering for Ubiquitous Computing, Proceedings of the 16th International Conference on E-Business Engineering, ICEBE 2019, Shanghai, China, 11–13 October 2019; Lecture Notes on Data Engineering and Communications Technologies; Chao, K.M., Jiang, L., Hussain, O., Ma, S.P., Fei, X., Eds.; Springer: Cham, Switzerland, 2020; Volume 41, pp. 208–218. [Google Scholar]
  31. Bigras, É.; Léger, P.M.; Sénécal, S. Recommendation Agent Adoption: How Recommendation Presentation Influences Employees’ Perceptions, Behaviors, and Decision Quality. Appl. Sci. 2019, 9, 4244. [Google Scholar] [CrossRef] [Green Version]
  32. Khusro, S.; Ali, Z.; Ullah, I. Recommender systems: Issues, challenges, and research opportunities. In Information Science and Applications, Proceedings of the 7th International Conference on Information Science and Applications (ICISA), Ho Chi Minh, Vietnam, 15–18 February 2016; Springer: Singapore, 2016; pp. 1179–1189. [Google Scholar]
  33. Xu, S.; Jiang, H.; Lau, F. Personalized online document, image and video recommendation via commodity eye-tracking. In Proceedings of the 2008 ACM Conference on Recommender Systems, Lausanne Switzerland, 23–25 October 2008; pp. 83–90. [Google Scholar]
  34. Conati, C.; Carenini, G.; Toker, D.; Lallé, S. Towards user-adaptive information visualization. In Proceedings of the Twenty-Ninth AAAI Conference on Artificial Intelligence, Austin, TX, USA, 25–30 January 2015; pp. 4100–4106. [Google Scholar]
  35. Steichen, B.; Carenini, G.; Conati, C. Adaptive Information Visualization-Predicting user characteristics and task context from eye gaze. In Proceedings of the International Conference on User Modeling, UMAP Workshops, Montreal, QC, Canada, 16–20 July 2012; Volume 872. [Google Scholar]
  36. Lerche, L. Using Implicit Feedback for Recommender Systems: Characteristics, Applications, and Challenges. Ph.D. Thesis, Technische Universität Dortmund, Dortmund, Germany, December 2016. [Google Scholar]
  37. Zhao, Q.; Harper, F.M.; Adomavicius, G.; Konstan, J.A. Explicit or implicit feedback? engagement or satisfaction?: A field experiment on machine-learning-based recommender systems. In Proceedings of the 33rd Annual ACM Symposium on Applied Computing, Pau, France, 9–13 April 2018; ACM: New York, NY, USA, 2018; pp. 1331–1340. [Google Scholar]
  38. Varga, E. Recommender systems. In Practical Data Science with Python 3; Apress: Berkeley, CA, USA, 2019; pp. 317–339. [Google Scholar]
  39. Zhou, M.; Ding, Z.; Tang, J.; Yin, D. Micro behaviors: A new perspective in e-commerce recommender systems. In Proceedings of the Eleventh ACM International Conference on Web Search and Data Mining, Los Angeles, CA, USA, 5–9 February 2018; pp. 727–735. [Google Scholar]
  40. Zdziebko, T.; Sulikowski, P. Monitoring Human Website Interactions for Online Stores. In New Contributions in Information Systems and Technologies; Advances in Intelligent Systems and Computing; Springer: Cham, Switzerland, 2015; Volume 354, pp. 375–384. [Google Scholar]
  41. Tian, G.; Wang, J.; He, K.; Sun, C.; Tian, Y. Integrating implicit feedbacks for time-aware web service recommendations. Inf. Syst. Front. 2017, 19, 75–89. [Google Scholar] [CrossRef]
  42. Liversedge, S.P.; Drieghe, D.; Li, X.; Yan, G.; Bai, X.; Hyönä, J. Universality in eye movements and reading: A trilingual investigation. Cognition 2016, 147, 1–20. [Google Scholar] [CrossRef] [Green Version]
  43. Buscher, G.; Dengel, A.; Biedert, R.; Van Elst, L. Attentive documents: Eye tracking as implicit feedback for information retrieval and beyond. ACM Trans. Interact. Intell. Syst. 2012, 1, 1–30. [Google Scholar] [CrossRef]
  44. Xu, S.; Jiang, H.; Lau, F.C. User-oriented document summarization through vision-based eye-tracking. In Proceedings of the 13th International Conference on Intelligent User Interfaces (IUI’09), Sanibel Island, FL, USA, 8–11 February 2009; ACM: New York, NY, USA, 2009; pp. 7–16. [Google Scholar]
  45. Loyola, P.; Brunetti, E.; Martinez, G.; Velásquez, J.D.; Maldonado, P. Leveraging Neurodata to Support Web User Behavior Analysis. In Wisdom Web of Things; Zhong, N., Ma, J., Liu, J., Huang, R., Tao, X., Eds.; Web Information Systems Engineering and Internet Technologies Book Series; Springer: Cham, Switzerland, 2016; pp. 181–207. [Google Scholar]
  46. Sheng, H.; Lockwood, N.S.; Dahal, S. Eyes Don’t Lie: Understanding Users’ First Impressions on Websites Using Eye Tracking. In Human Interface and the Management of Information. Information and Interaction Design, Proceedings of the 15th International Conference, HCI International 2013, Las Vegas, NV, USA, 21–26 July 2013; Lecture Notes in Computer Science; Yamamoto, S., Ed.; Springer: Berlin/Heidelberg, Germany, 2013; Volume 8016, p. 8016. [Google Scholar]
  47. Sharafi, Z.; Shaffer, T.; Sharif, B.; Guéhéneuc, Y.-G. Eye-Tracking Metrics in Software Engineering. In Proceedings of the 2015 Asia-Pacific Software Engineering Conference, New Delhi, India, 1–4 December 2015; IEEE Press: Piscataway, NJ, USA, 2015; pp. 96–103. [Google Scholar]
  48. Lee, J.; Ahn, J.-H.; Park, B. The effect of repetition in internet banner ads and the moderating role of animation. Comput. Hum. Behav. 2015, 46, 202–209. [Google Scholar] [CrossRef]
Figure 1. The framework for performance evaluation of a recommending interface.
Electronics 09 00266 g001
Figure 2. Recommendation layouts of the recommending interface: (a) vertical; (b) horizontal.
Electronics 09 00266 g002
Figure 3. Example of visual intensity VI3 (red background) in the vertical recommending interface.
Electronics 09 00266 g003
Figure 4. Aggregated heatmap for all participants in the study.
Electronics 09 00266 g004
Figure 5. Sensitivity and specificity for the multilayer perceptron.
Electronics 09 00266 g005
Table 1. Average fixation time(s) for each recommendation location.
Recommendation LocationTime (s)
Vertical RCHorizontal RC
RC12.41.3
RC23.12.1
RC32.13.9
RC40.60.8
Total8.28.1
Table 2. Recommendation driven purchase and visual intensity for each recommendation location (RCi) and product category (PCj).
Recommendation LocationVertical RCHorizontal RC
PC1PC2PC3PC4PC5PC6
RC11 (VI1)1 (VI1)0 (VI1)2 (VI1)0 (VI1)4 (VI1)
RC22 (VI1)4 (VI2)5 (VI1)0 (VI1)3 (VI2)0 (VI1)
RC31 (VI1)4 (VI1)1 (VI3)0 (VI1)1 (VI1)2 (VI3)
RC42 (VI1)0 (VI1)2 (VI1)0 (VI1)2 (VI1)0 (VI1)
Total698266
Table 3. Parameters of multilayer perceptron neural network.
Network Information
Input LayerFactors1rc_location
2rc_layout
3rc_location_intensity
Covariates1fixation_time_category
2fixation_time_layout
3fixation_time_location
4share_time_layout_category
5share_time_location_category
6share_time_location_layout
7user_age
8user_cognitive_ability_level
Number of Units17
Rescaling Method for CovariatesNormalized
Hidden Layer(s)Number of Hidden Layers2
Number of Units in Hidden Layer 18
Number of Units in Hidden Layer 26
Activation FunctionSigmoid
Output LayerDependent Variables1add_to_cart
Number of Units2
Activation FunctionSigmoid
Error FunctionSum of Squares
Table 4. Confusion matrix for multilayer perceptron for predicting efficiency of recommending interface.
Classification
SampleObservedPredicted
01Percent Correct
Training0392598.7%
122692.9%
Overall Percent92.7%7.3%98.4%
Testing0157199.4%
12880.0%
Overall Percent94.6%5.4%98.2%
Table 5. Confusion matrix for multilayer perceptron for predicting the efficiency of the recommending interface.
Independent VariableNormalized Importance
fixation_time_location100%
fixation_time_layout42%
share_time_location_layout12%
share_time_location_category8%
rc_location7%
rc_layout4%
rc_location_intensity4%
user_cognitive_ability_level2%
fixation_time_category1%
user_age1%
share_time_layout_category1%

