
Does the GRB Duration Depend on Redshift?


1
Department of Natural Science, University of Public Service, H-1441 Budapest, Hungary
2
Department of Physics of Complex Systems, Eötvös Loránd University, H-1053 Budapest, Hungary
3
Department of Astronomy, Eötvös Loránd University, H-1053 Budapest, Hungary
4
Konkoly Observatory, Research Centre for Astronomy and Earth Sciences, H-1121 Budapest, Hungary
*
Author to whom correspondence should be addressed.
Universe 2022, 8(4), 221; https://0-doi-org.brum.beds.ac.uk/10.3390/universe8040221
Submission received: 20 February 2022
/
Revised: 25 March 2022
/
Accepted: 26 March 2022
/
Published: 30 March 2022
(This article belongs to the Special Issue Gamma-Ray Bursts: Observational and Theoretical Prospects in the Era of Multi-Messenger Astronomy)
Abstract
:Several hundred gamma-ray burst (GRB) redshifts have been determined to date. One of the other important properties—besides the distance—of the GRBs is the duration of the burst. In this paper, we analyse these two important quantities of the phenomena. In this paper, we map the two-dimensional distribution and explore some suspicious areas. As it is well known that the short GRBs are closer than the others, we search for parts in the Universe where the GRB duration is different from the others. We also analyse whether there are any ranges in the duration where the redshifts differ. We find some suspicious areas, however, no other significant region was found than the short GRB region.
1. Introduction
Gamma-ray bursts (GRBs) are the most energetic phenomena in the universe, which can be detected up to very high redshifts ( spectroscopically [1,2] and by photometry [3]). The GRBs have attracted a lot of attention as promising distance indicators complementary to other cosmological probes and, among others, these calibrated GRBs are consistent with that of SNe Ia [4,5]. The GRB data could be combined with other objects to examine the evidence for different cosmological models. Amati et al. [6] showed that the CDM model is statistically favoured over the wCDM scenario. Moreover, Khadka and Ratra [7] found that the cosmological parameters obtained from GRBs were consistent with baryon acoustic oscillation and Hubble parameter measurements and the GRBs could be used as complementary and outstanding probes to trace dark energy’s evolution in support of other indicators [8,9].
Although there are indications that there are more GRB groups [10,11,12,13,14,15,16,17,18,19,20,21] other than the classical short and long dichotomy [22,23], in this paper we deal only with short (SGRB) and long (LGRB) gamma-ray bursts. The cosmological origin of gamma-ray bursts (GRBs) is well established (e.g., [24]). Assuming that the Universe exhibits large-scale homogeneity and isotropy, the same is also expected for GRBs. GRBs are, to date, the only objects which have been sampled in the observable Universe as a whole, thus the large-scale angular isotropy of the sky distribution of GRBs has been well studied over recent decades. Most of these studies have demonstrated that the sky distribution of GRBs is isotropic [25,26,27,28,29,30,31].
However, there are indications for some large-scale anisotropy in space distribution of quasars [32] and GRBs [33,34,35,36]. Some GRB subsamples appear to deviate significantly from isotropy. Vavrek et al. [30] reported that the angular distributions of short and long GRBs are different, while Řípa [37], Řípa and Shafieloo [38,39] analysed the isotropy of Fermi GRBs according to their properties (duration, fluences, peak fluxes). Cline et al. [40] found that the angular distributions of very short GRBs are anisotropic, and Magliocchetti et al. [29] reported that the short GRB class in general deviates from angular isotropy. Mészáros et al. [28] and Litvin et al. [41] wrote that the angular distribution of intermediate duration () GRBs is not isotropic. LGRBs are believed to be produced from core-collapsed supernovae (SNe) [42,43,44] which is supported by observations that some GRBs are associated with SNe (e.g., [45,46]). This model implies that the LGRB event rate should trace the cosmic star formation rate [47,48,49,50,51,52]. They generally occur in faint, blue, low-mass star-forming galaxies [53,54] and also in the bright regions of their hosts [55,56,57].
Before the launch of the Neil Gehrels Swift Observatory, there were a few suggestions for cosmological time dilation in GRB light curves (e.g., [58,59]). However, after the launch of the Neil Gehrels Swift Observatory and the Fermi Gamma-ray Space Telescope, there were no clear signatures of cosmological time dilation in the GRB light curves (e.g., [60,61]).
GRBs are the only astrophysical objects sampled in the whole observable Universe [62]. If we can define distance indicators from high-energy GRB observed parameters (e.g., Amati relation [63], Ghirlanda relation [64], Yonetoku relation [65], Liang–Zhang relation [66], Dainotti relation [67]), we can test the cosmological models even at very high redshifts including the validity of the cosmological principle. The light curves’ spectral dependency and the detectors’ response will further complicate the connection between the intrinsic and observed s. Therefore, it is interesting to investigate whether the time dilatation factor is detectable in the shape of observed light curves [68]. It is also an interesting problem whether the physics of the GRB central engine at low and high redshifts are the same or not [69,70].
2. Duration versus Redshift Distribution Analyses
Currently, nearly five hundred redshifts have been observed for GRBs. The Caltech GRBOX web-page contains most of them1, therefore, in this analysis we use their data set. In this database, 34 GRBs had photometric redshifts. We have to note that where both photometric and spectroscopic redshifts were available, we used the latter ones. Based on the Swift GRB observations, less then 20% of the photometric redshifts differ significantly from the spectroscopic ones. This means that approximately five to six observations from 34 contain excessive noise, which is approx. 1% of the total data. We believe that this is not a major source of error besides the Poisson noise. Among these 487 GRBs, 474 had duration information ( is the time over which a burst emits from 5% of its total measured counts to 95% [71,72]) as well. SWIFT BAT was used to estimate of a burst from 15–150 keV [61], in contrast the FERMI GBM team which computes in the 50–300 keV range [73]. Earlier, Rácz et al. [74] and Racz et al. [75] did not find any trace of selection effects in the spectral behaviour of GRBs, using the common GRB observation by both satellites. Pinter et al. [76] have shown a small, but measurable, difference between the two satellites’ distribution which appears for the shortest and the very long GRBs. The origin of the difference is that in some cases the Swift detects a soft, long emission tail of the GRB which is not detected by the Fermi GBM. This suggests a question about grouping. We do not deal with the grouping here, as we study only the duration range where this effect is not significant; we will omit the short GRBs for reasons we will discuss later, and will concentrate on the long GRBs while the number of the deviating longest GRBs is small.
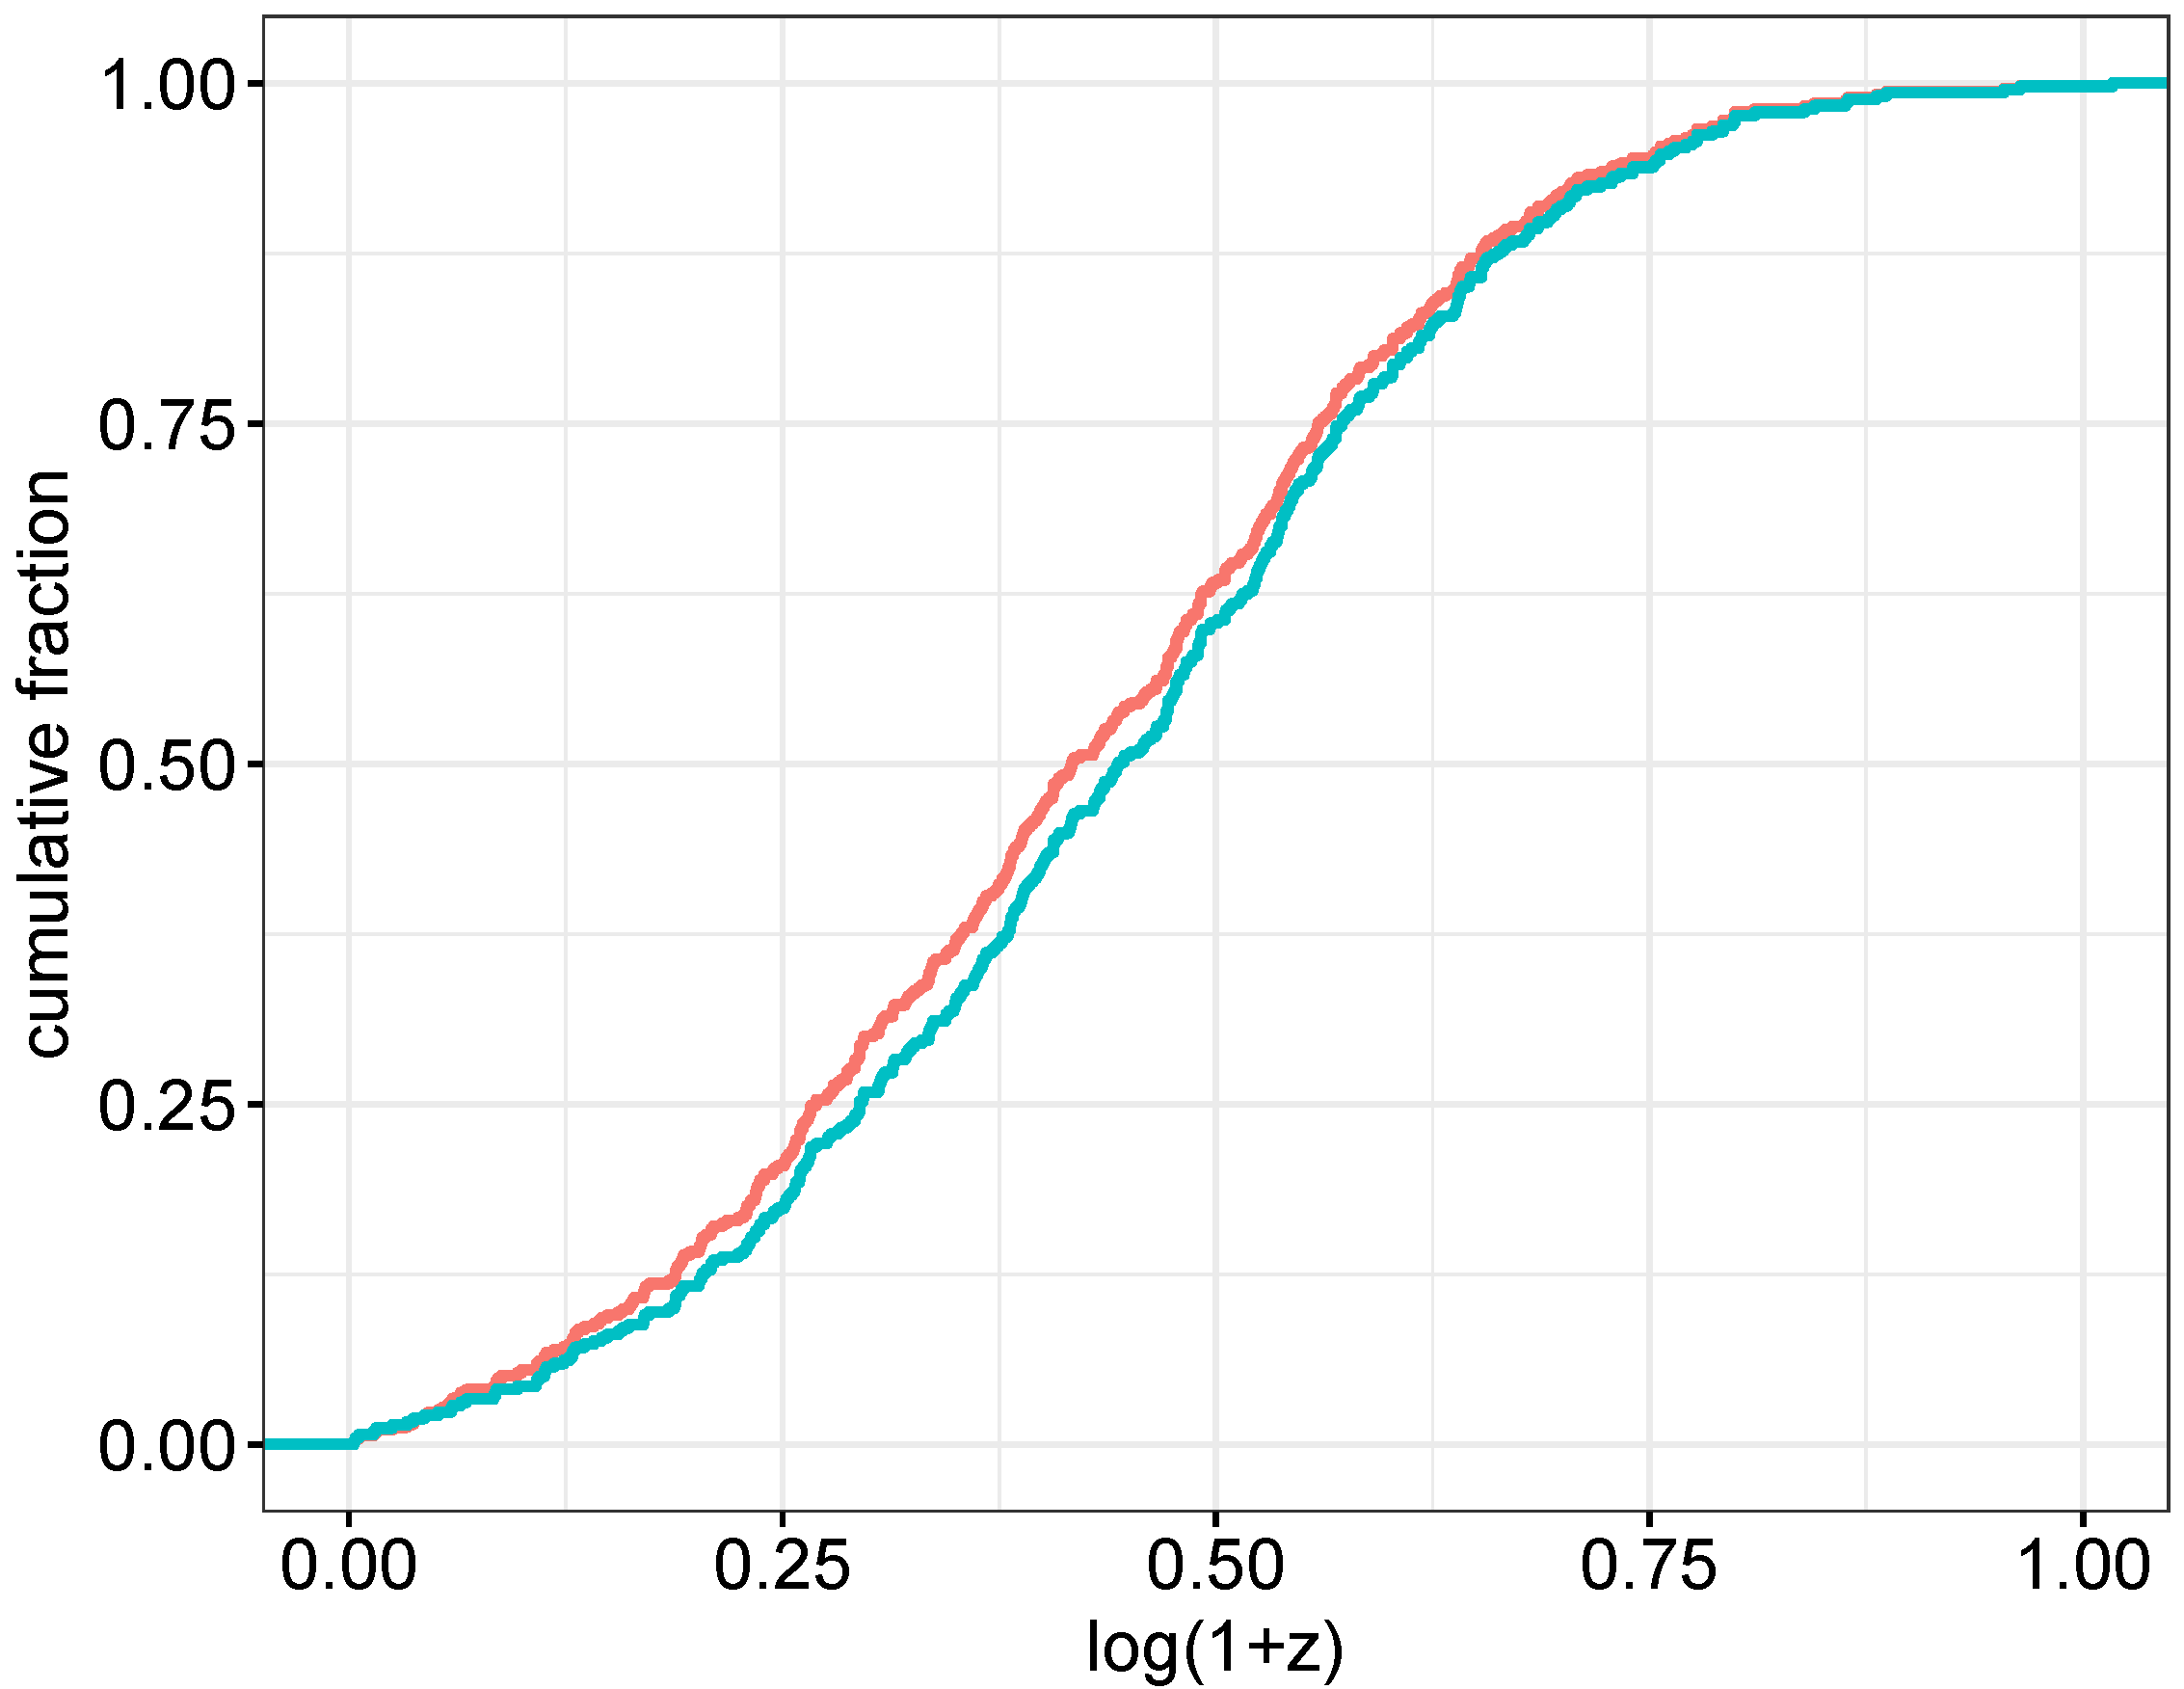
In Figure 1 the cumulative distribution of the redshifts of the 474 GRBs can be seen; one can observe that the ∼60% of the GRBs are in the = (0.25–0.6) range.
2.1. Comparison with the Whole Sample Redshifts
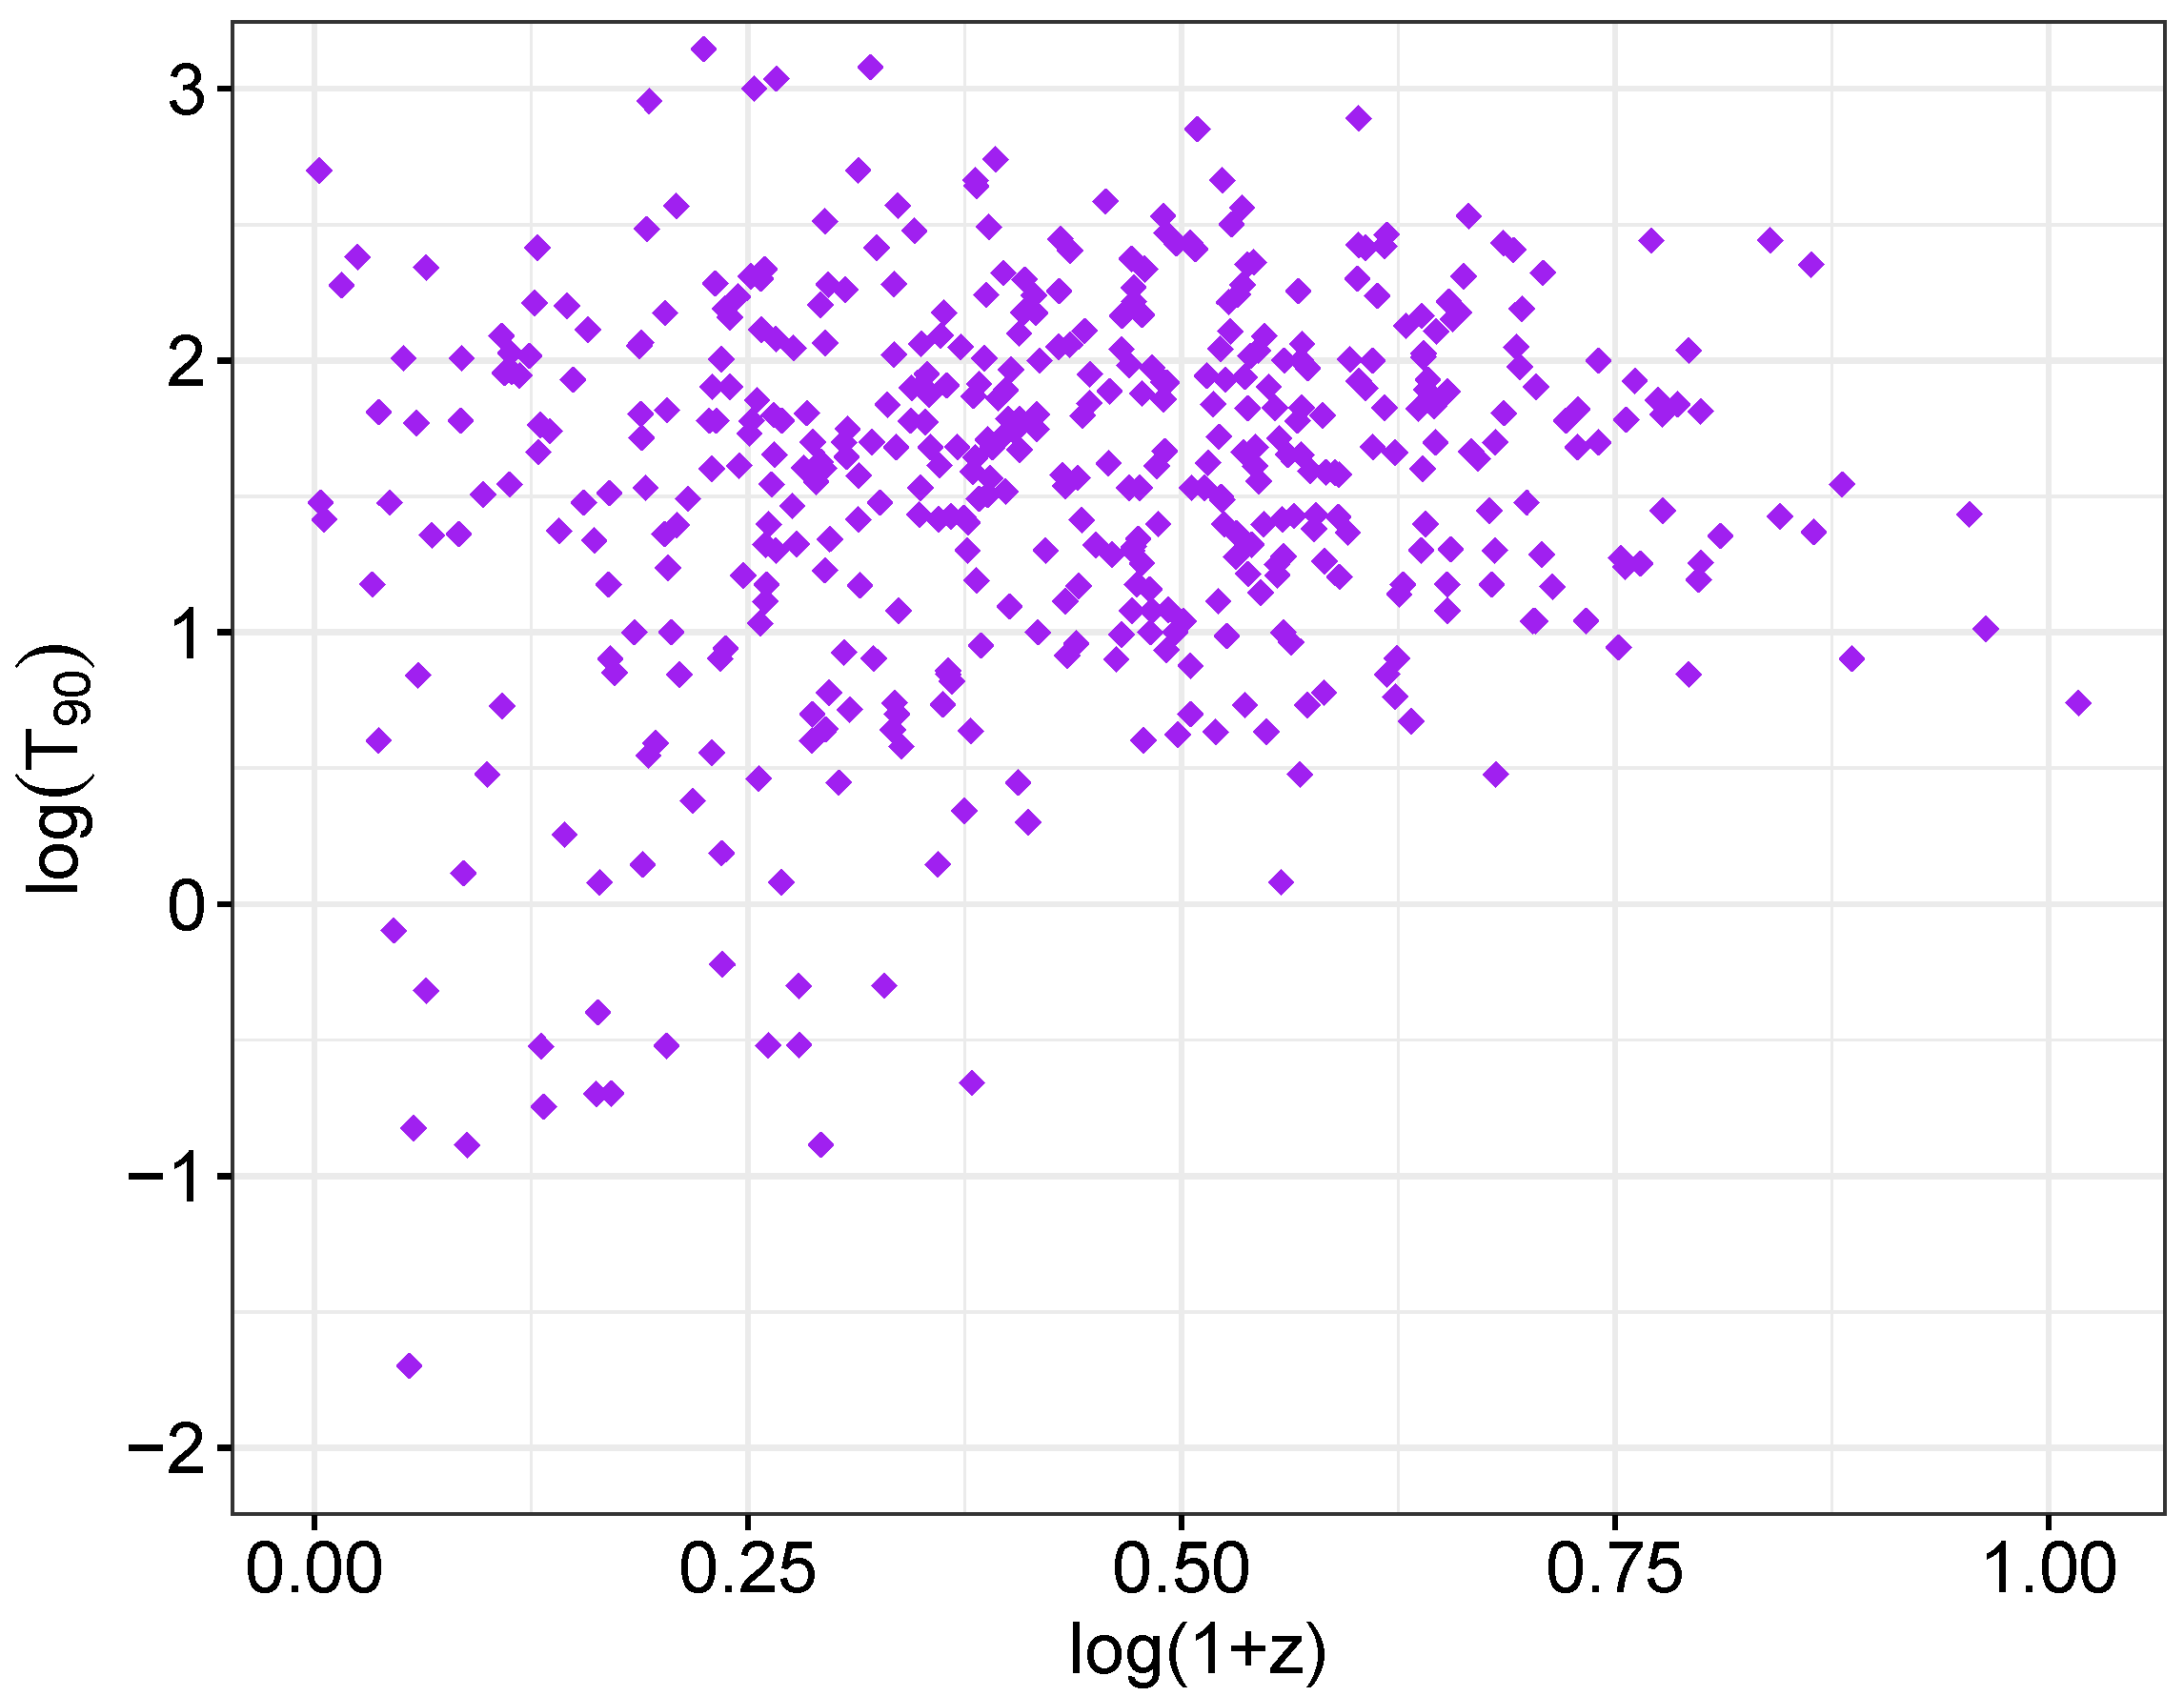
Figure 2 shows the redshift vs. duration () distribution of the 474 GRBs. To study whether the redshift distribution depends on the duration () parameter, one can use several statistical tests. Here, we ordered the GRBs by duration and chose n consecutive ones. This group’s redshift distribution was compared with the complementary GRBs’ redshift distribution using a Kolmogorov–Smirnov test (KS). (Note: in this paper we use 10 base logarithm, therefore always means ).
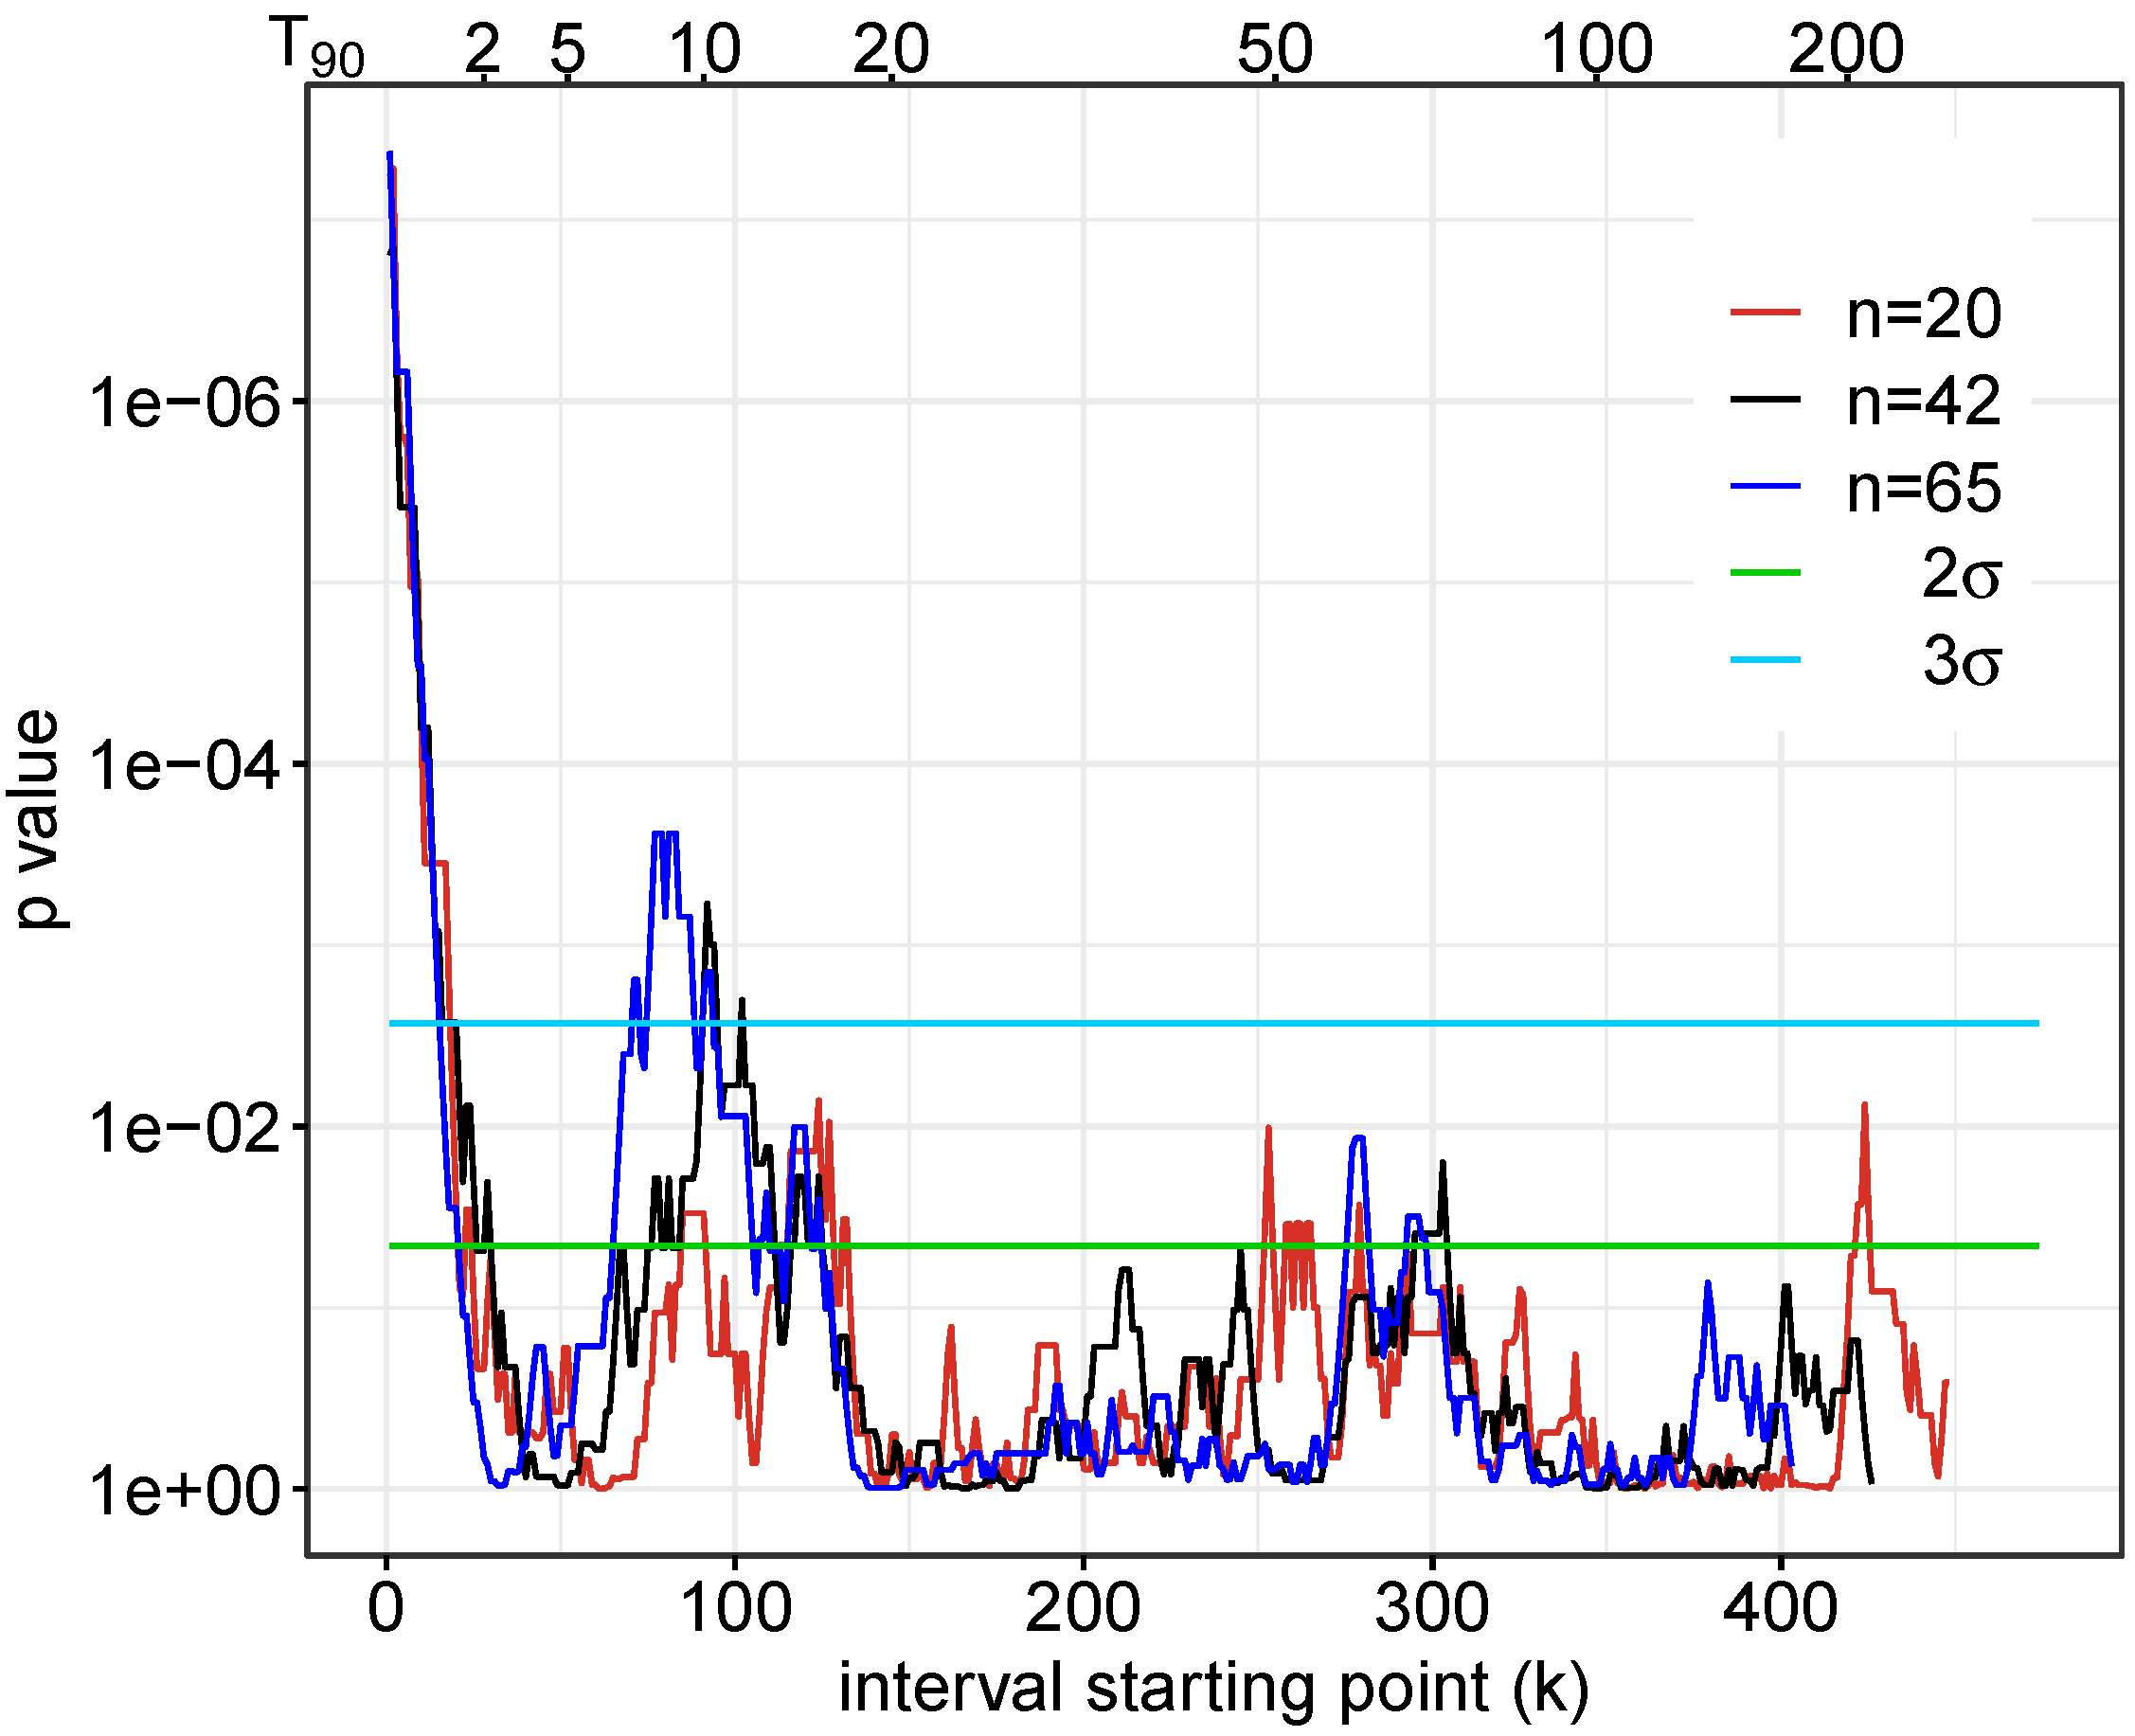
We compared the redshift distributions starting the group at the kth position. We carried out this process for different group sizes from to . As an example, Figure 3 shows the KS p value’s dependence of k for , 42 and 65, respectively. The green (0.0455) and blue (0.0027) lines show 2 and 3 sigma significance, respectively.
2.2. Comparison with the 421 Non-Short GRBs’ Redshifts
From the KS tests results in Figure 3, one can see that the biggest deviations are for the shortest bursts. It is well known that these short GRBs are typically closer in distance than long GRBs [77,78,79]. Some believe that 2 s is the border between short and long bursts [25], however, many studies show the border is not that obvious [27,28,80,81].
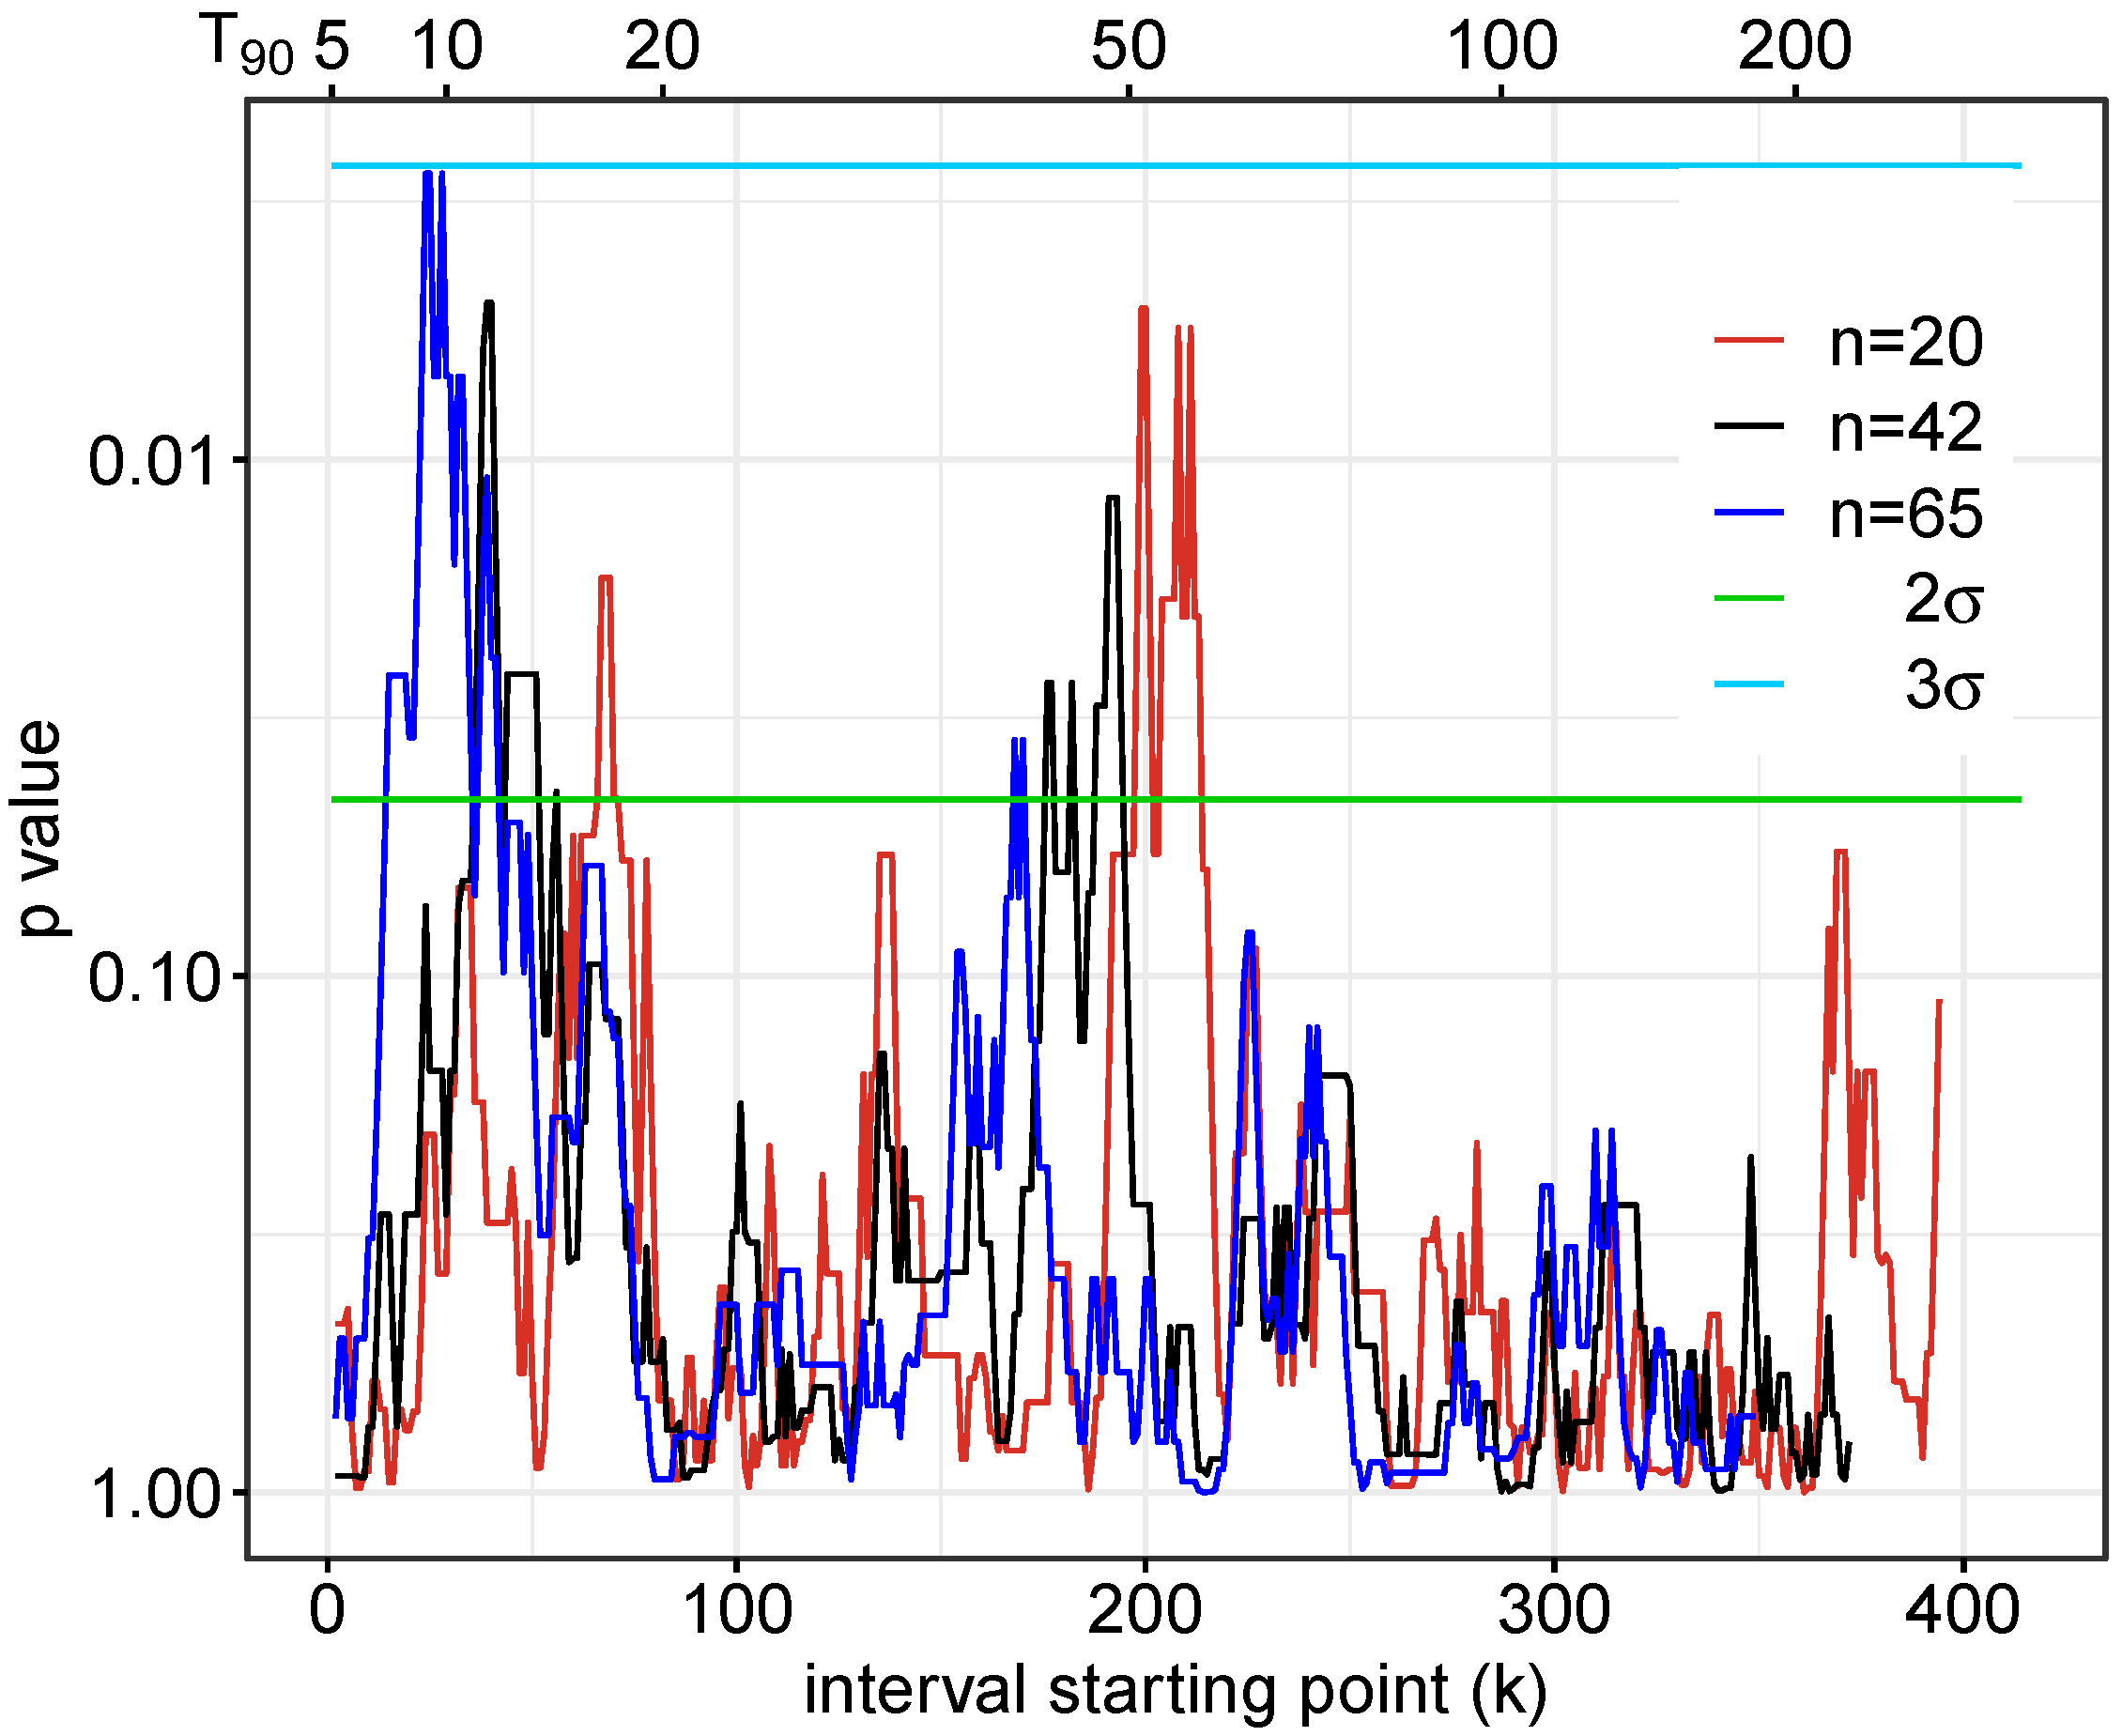
As the different groups’ distributions are quite wide, we chose the s for this division to make sure there are no short GRBs in the sample. This means the first 53 GRBs ( s) were not used for calculating the distribution of the long GRBs’ redshift distribution. (For the difference in the 421 long GRBs’ distribution and the whole 474 GRB sample distribution, see Figure 1). Then, we repeated the method which was described in Section 2.1. We also carried out this process from to . Figure 4 shows the KS p value’s dependence of k for , 42 and 65, respectively. The green (0.0455) and blue (0.0027) lines show 2 and 3 sigma significance, respectively.
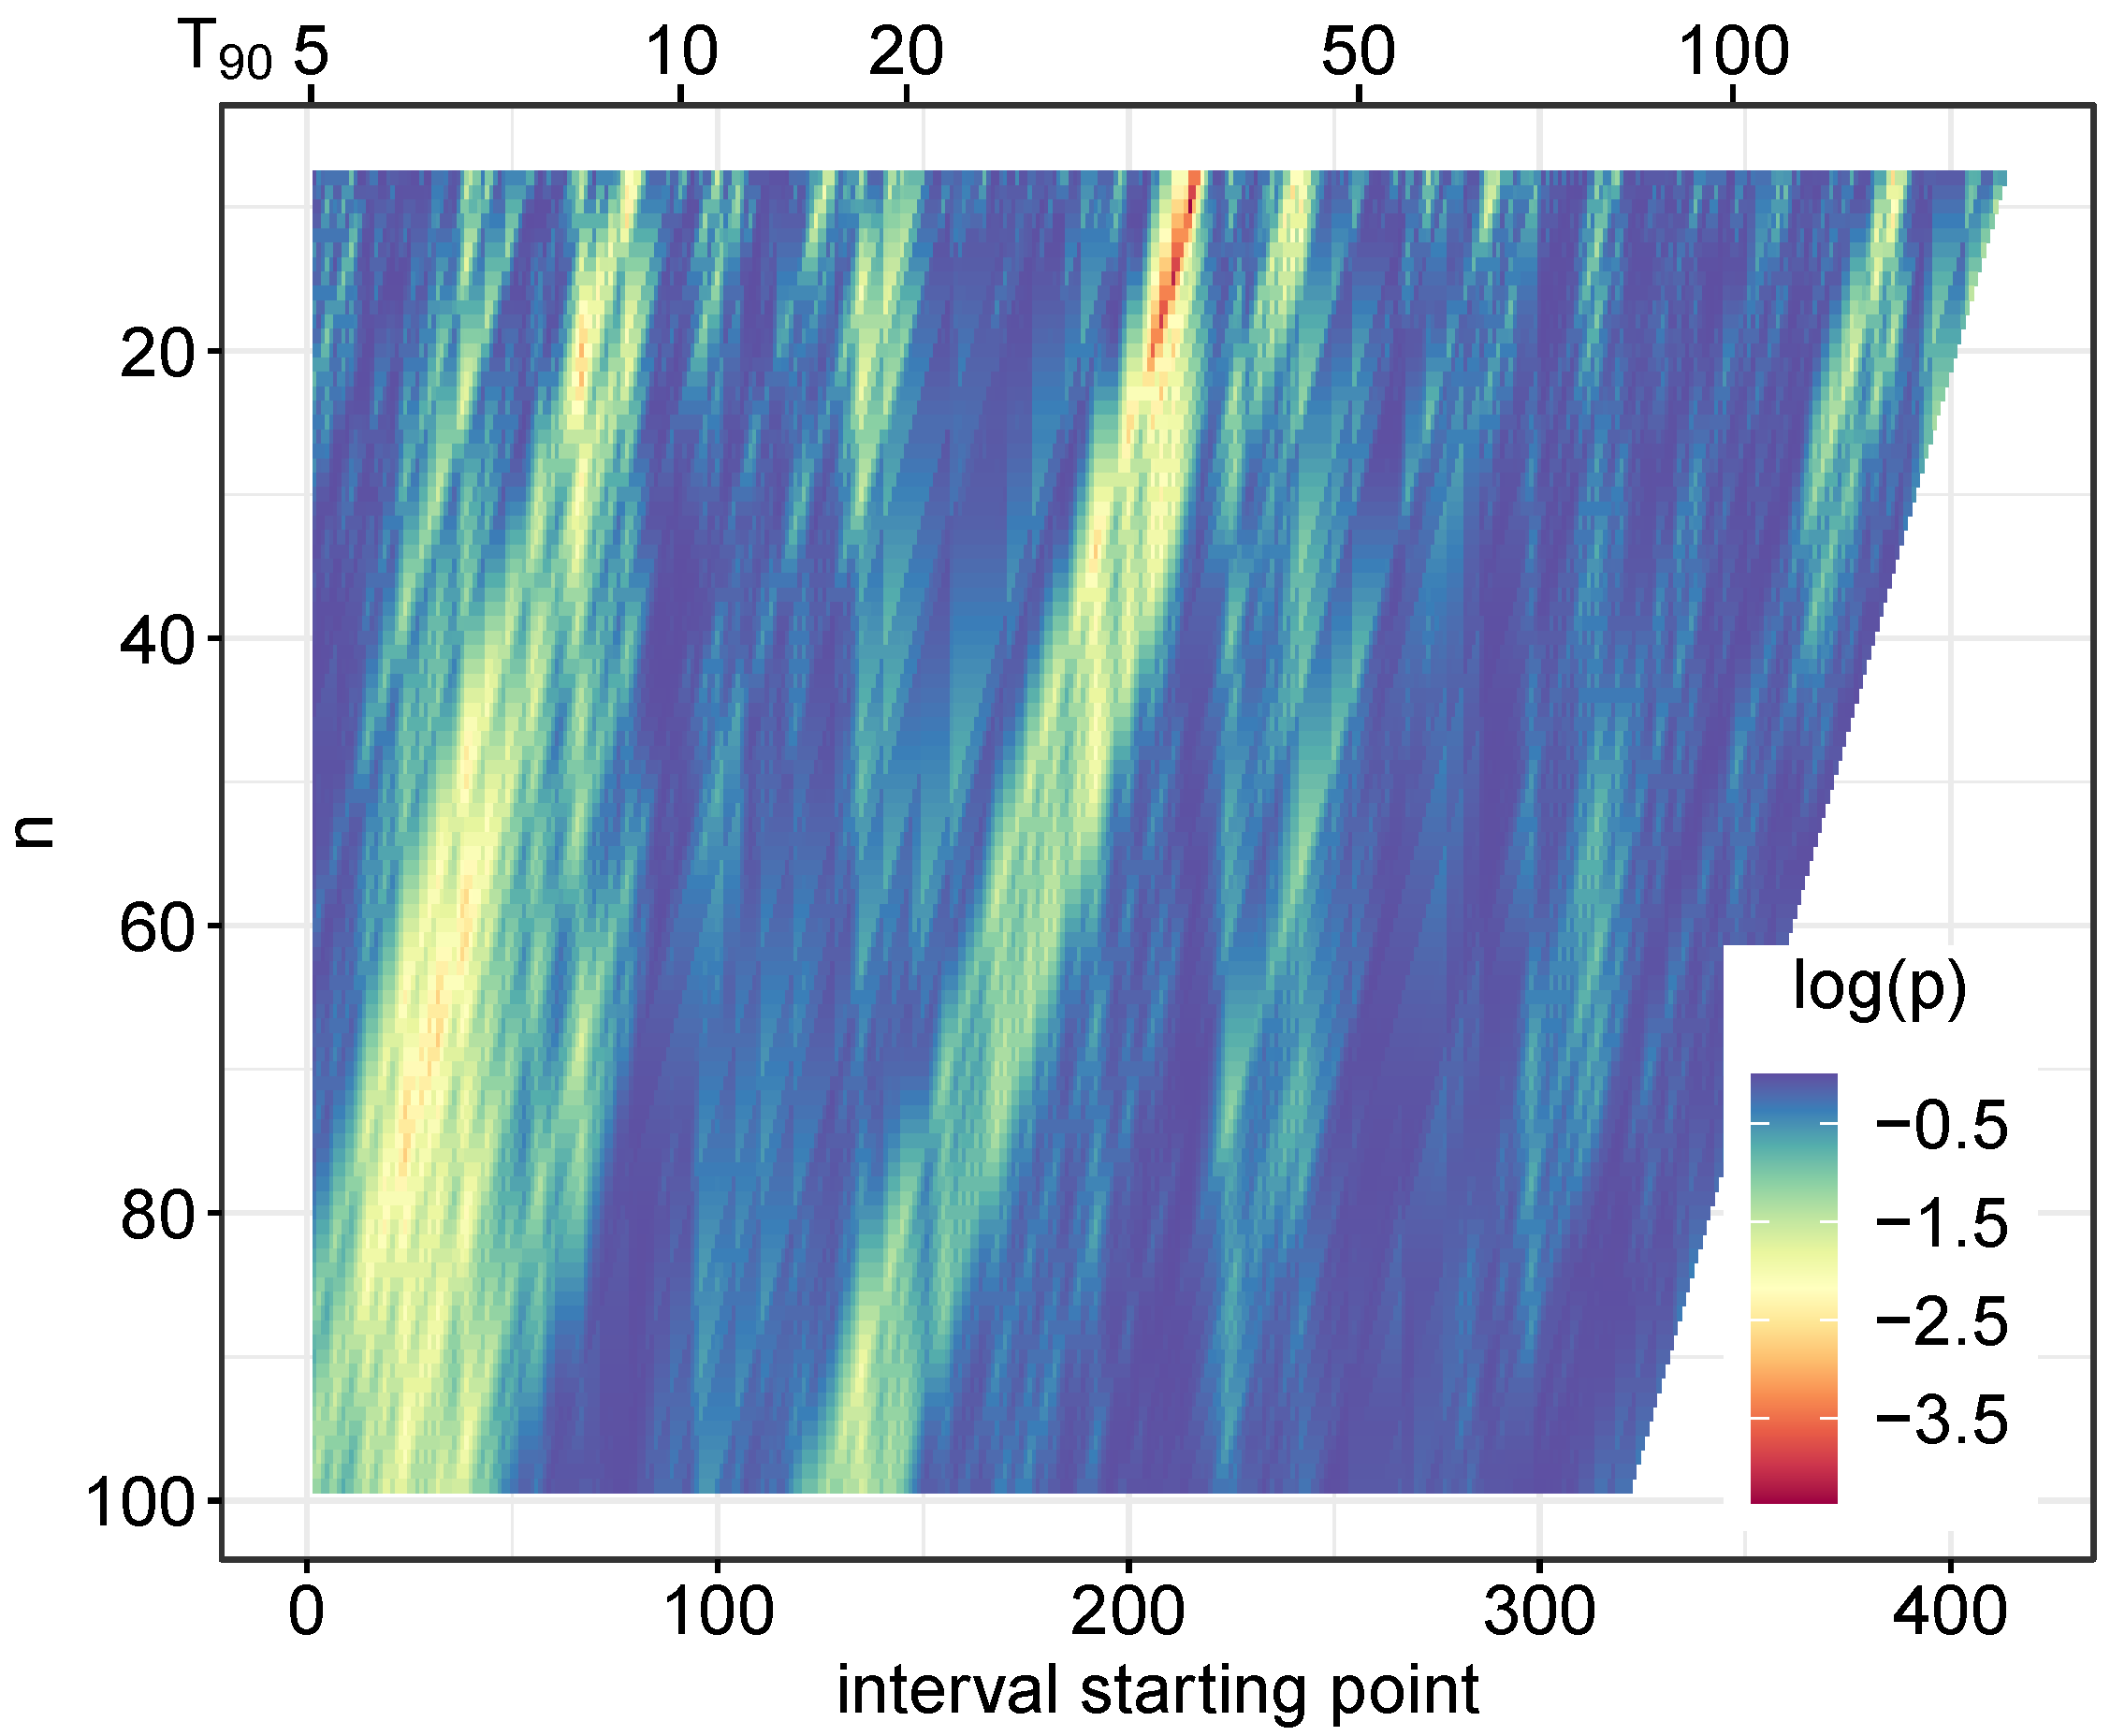
Figure 5 shows the two-parameter (n, duration) KS p value. Note that the short part was cut from the figures, since p is extremely low in the short duration area (see Figure 3), which also means high significance. This means the short GRB redshift distribution differs with a very high significance level from the long duration GRBs redshift distribution. We call this part of the GRBs’ distribution AREA1.
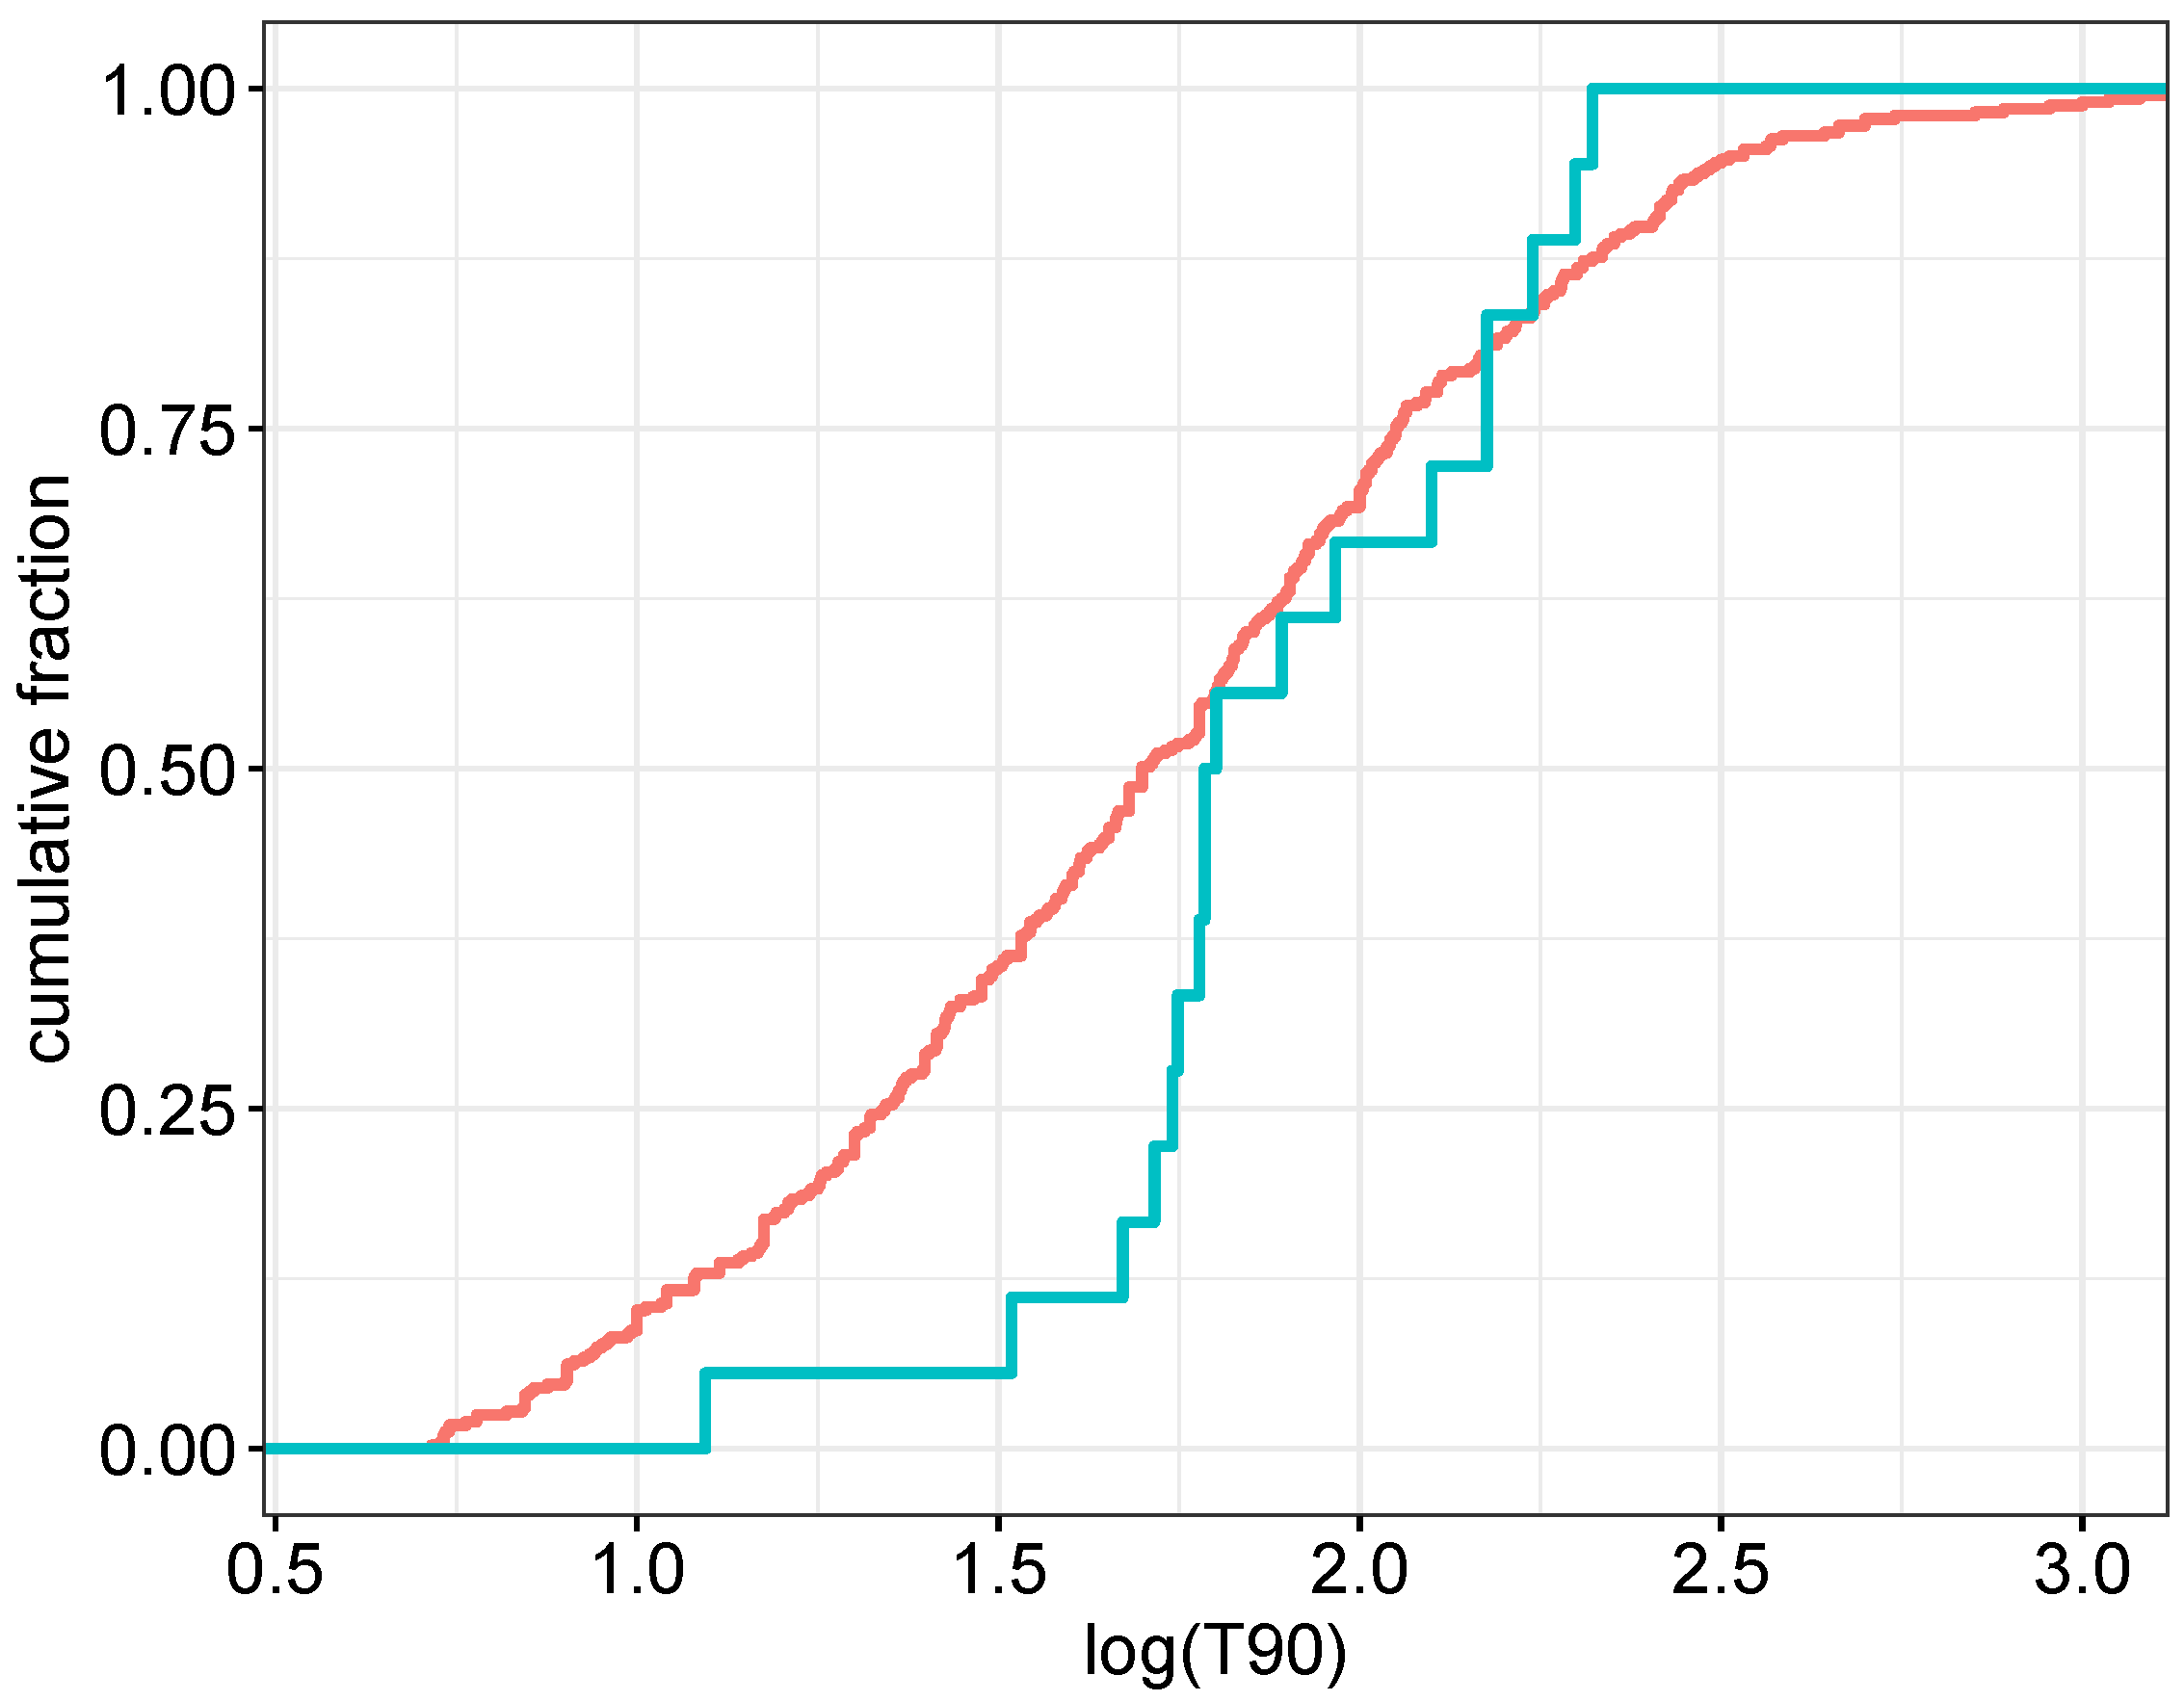
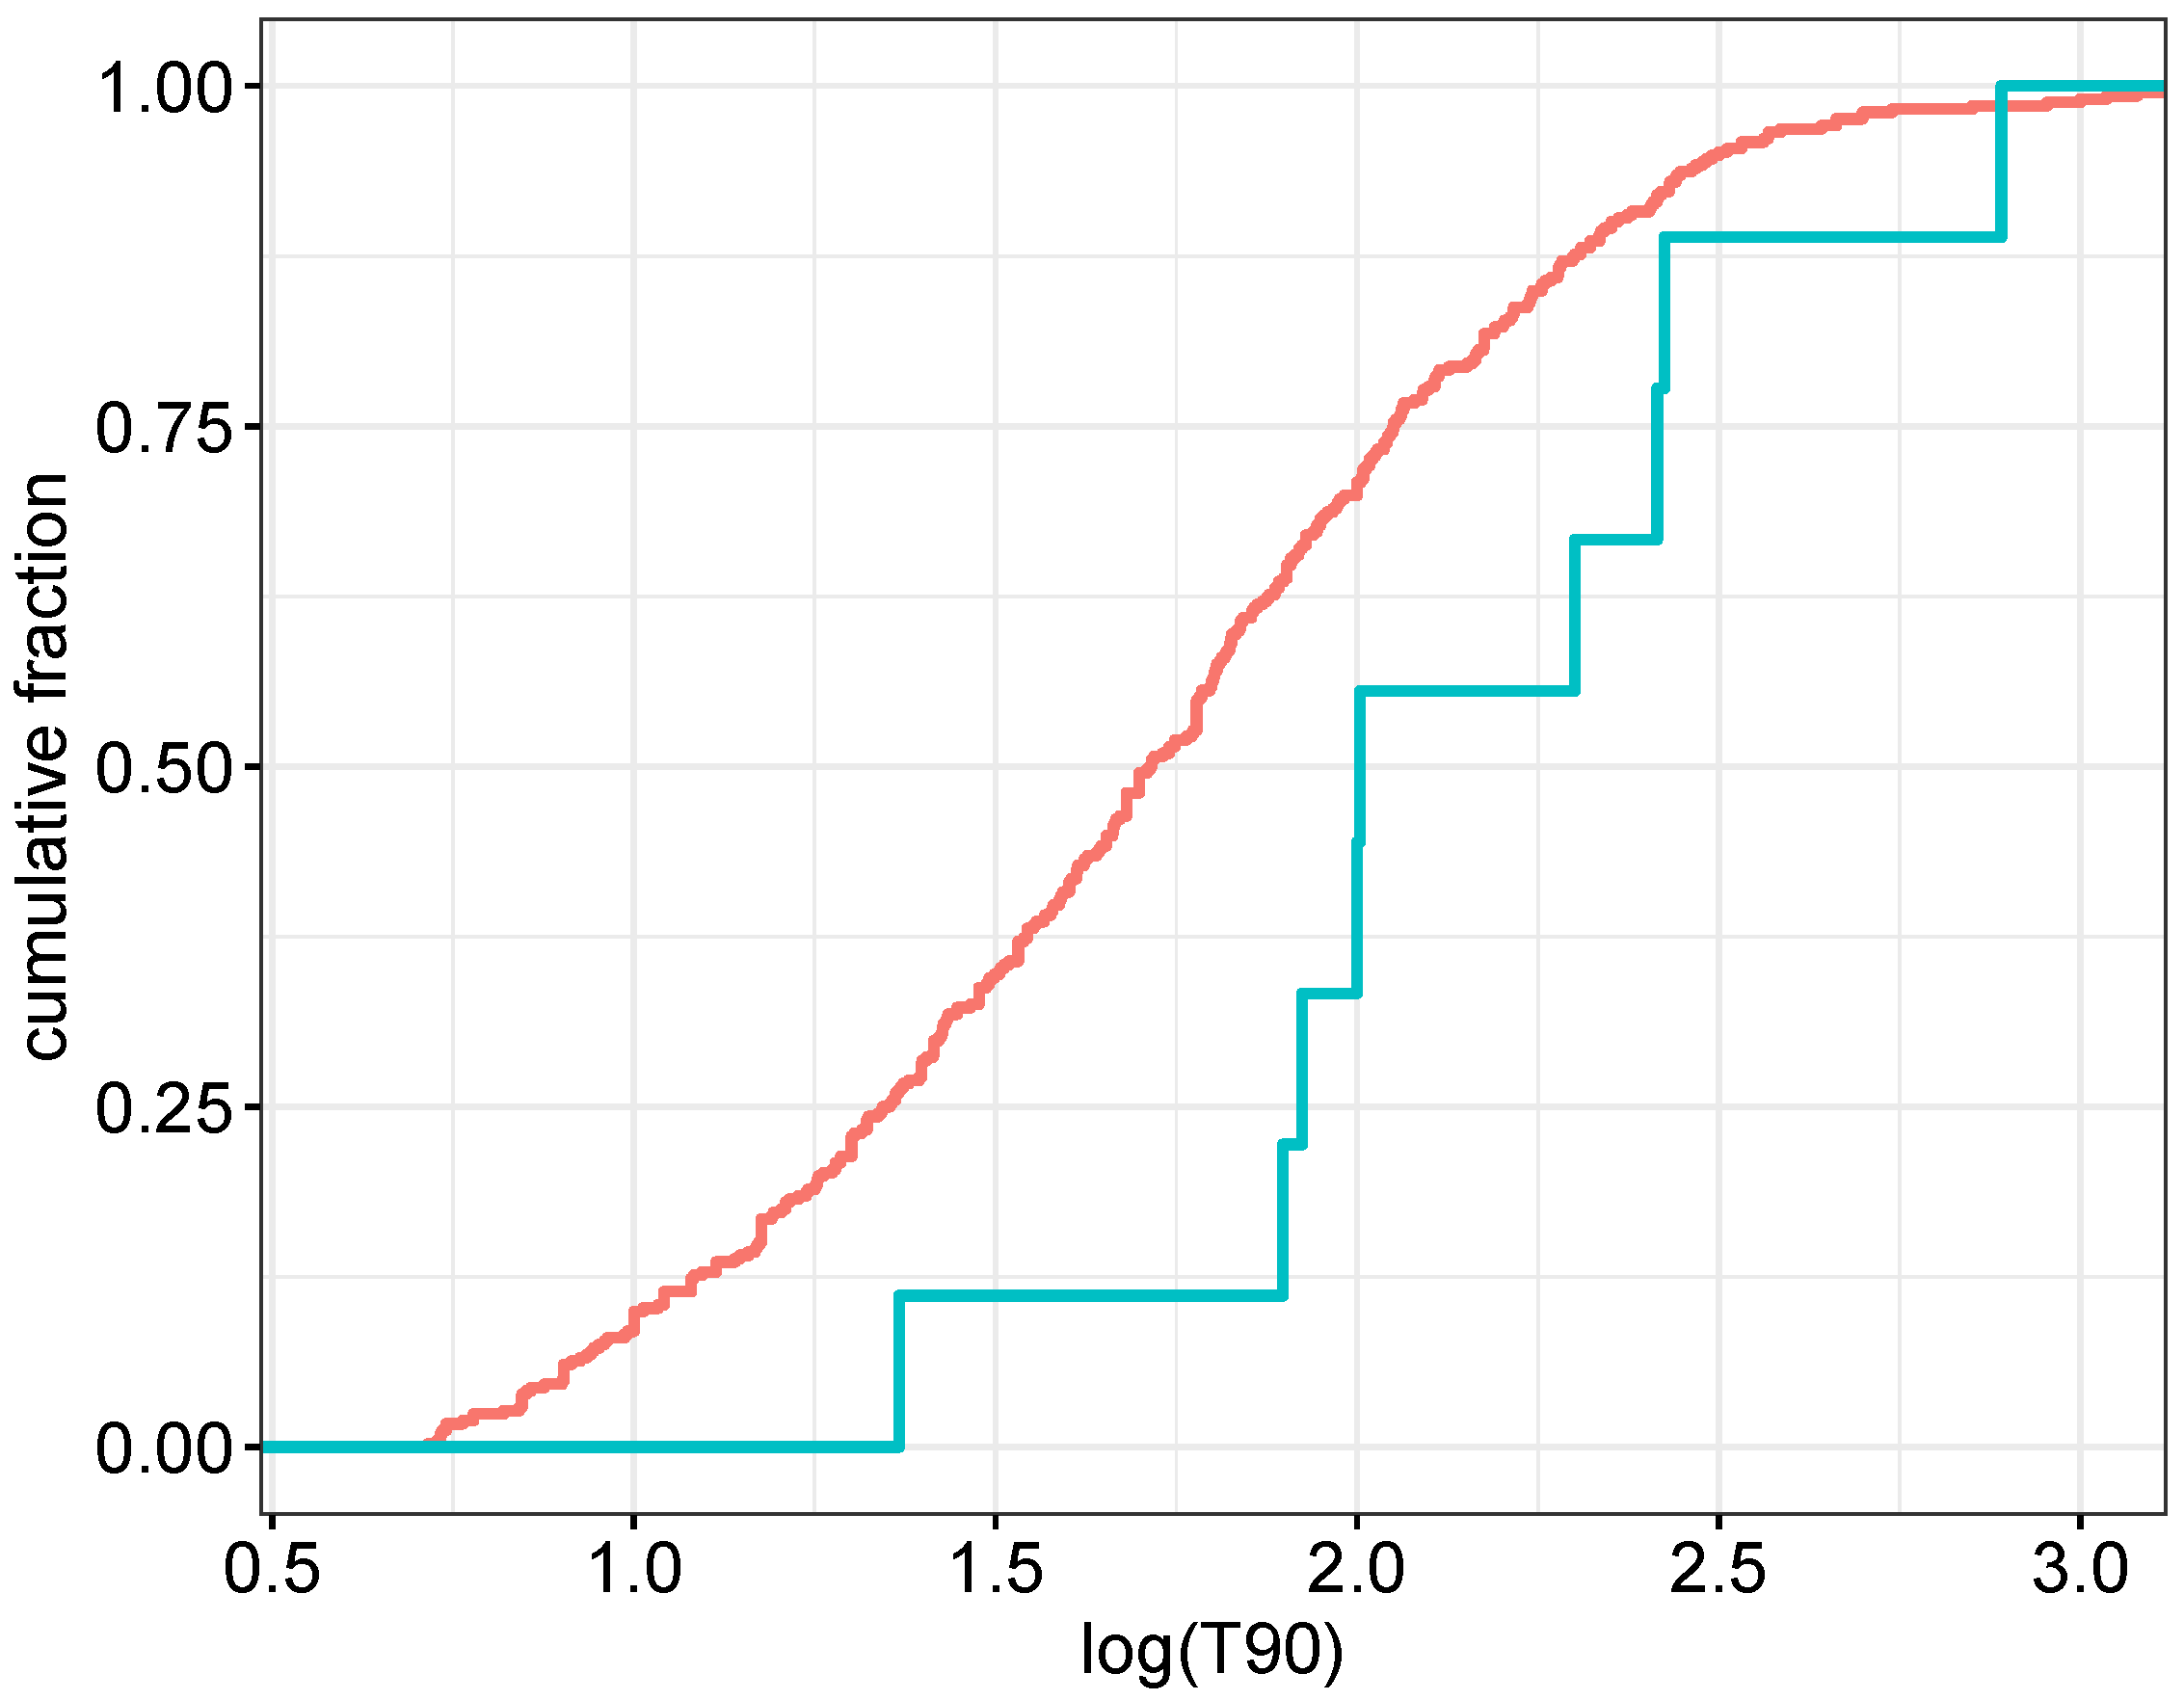
The p value reaches 0.0027 in three areas, the aforementioned short duration part (AREA1), the (16 s, 20 s) interval (AREA2) with n between 12 and 21 and the (49 s, 61 s) interval (AREA3) with n between 23 and 36. The p value reaches 0.0455 in only four areas. The three aforementioned areas and the (9 s, 21 s) interval (AREA4) with n between 59 and 68. Figure 6 and Figure 7 show the cumulative redshift distribution of AREA3–4.
2.3. The Redshift vs. T90 Method
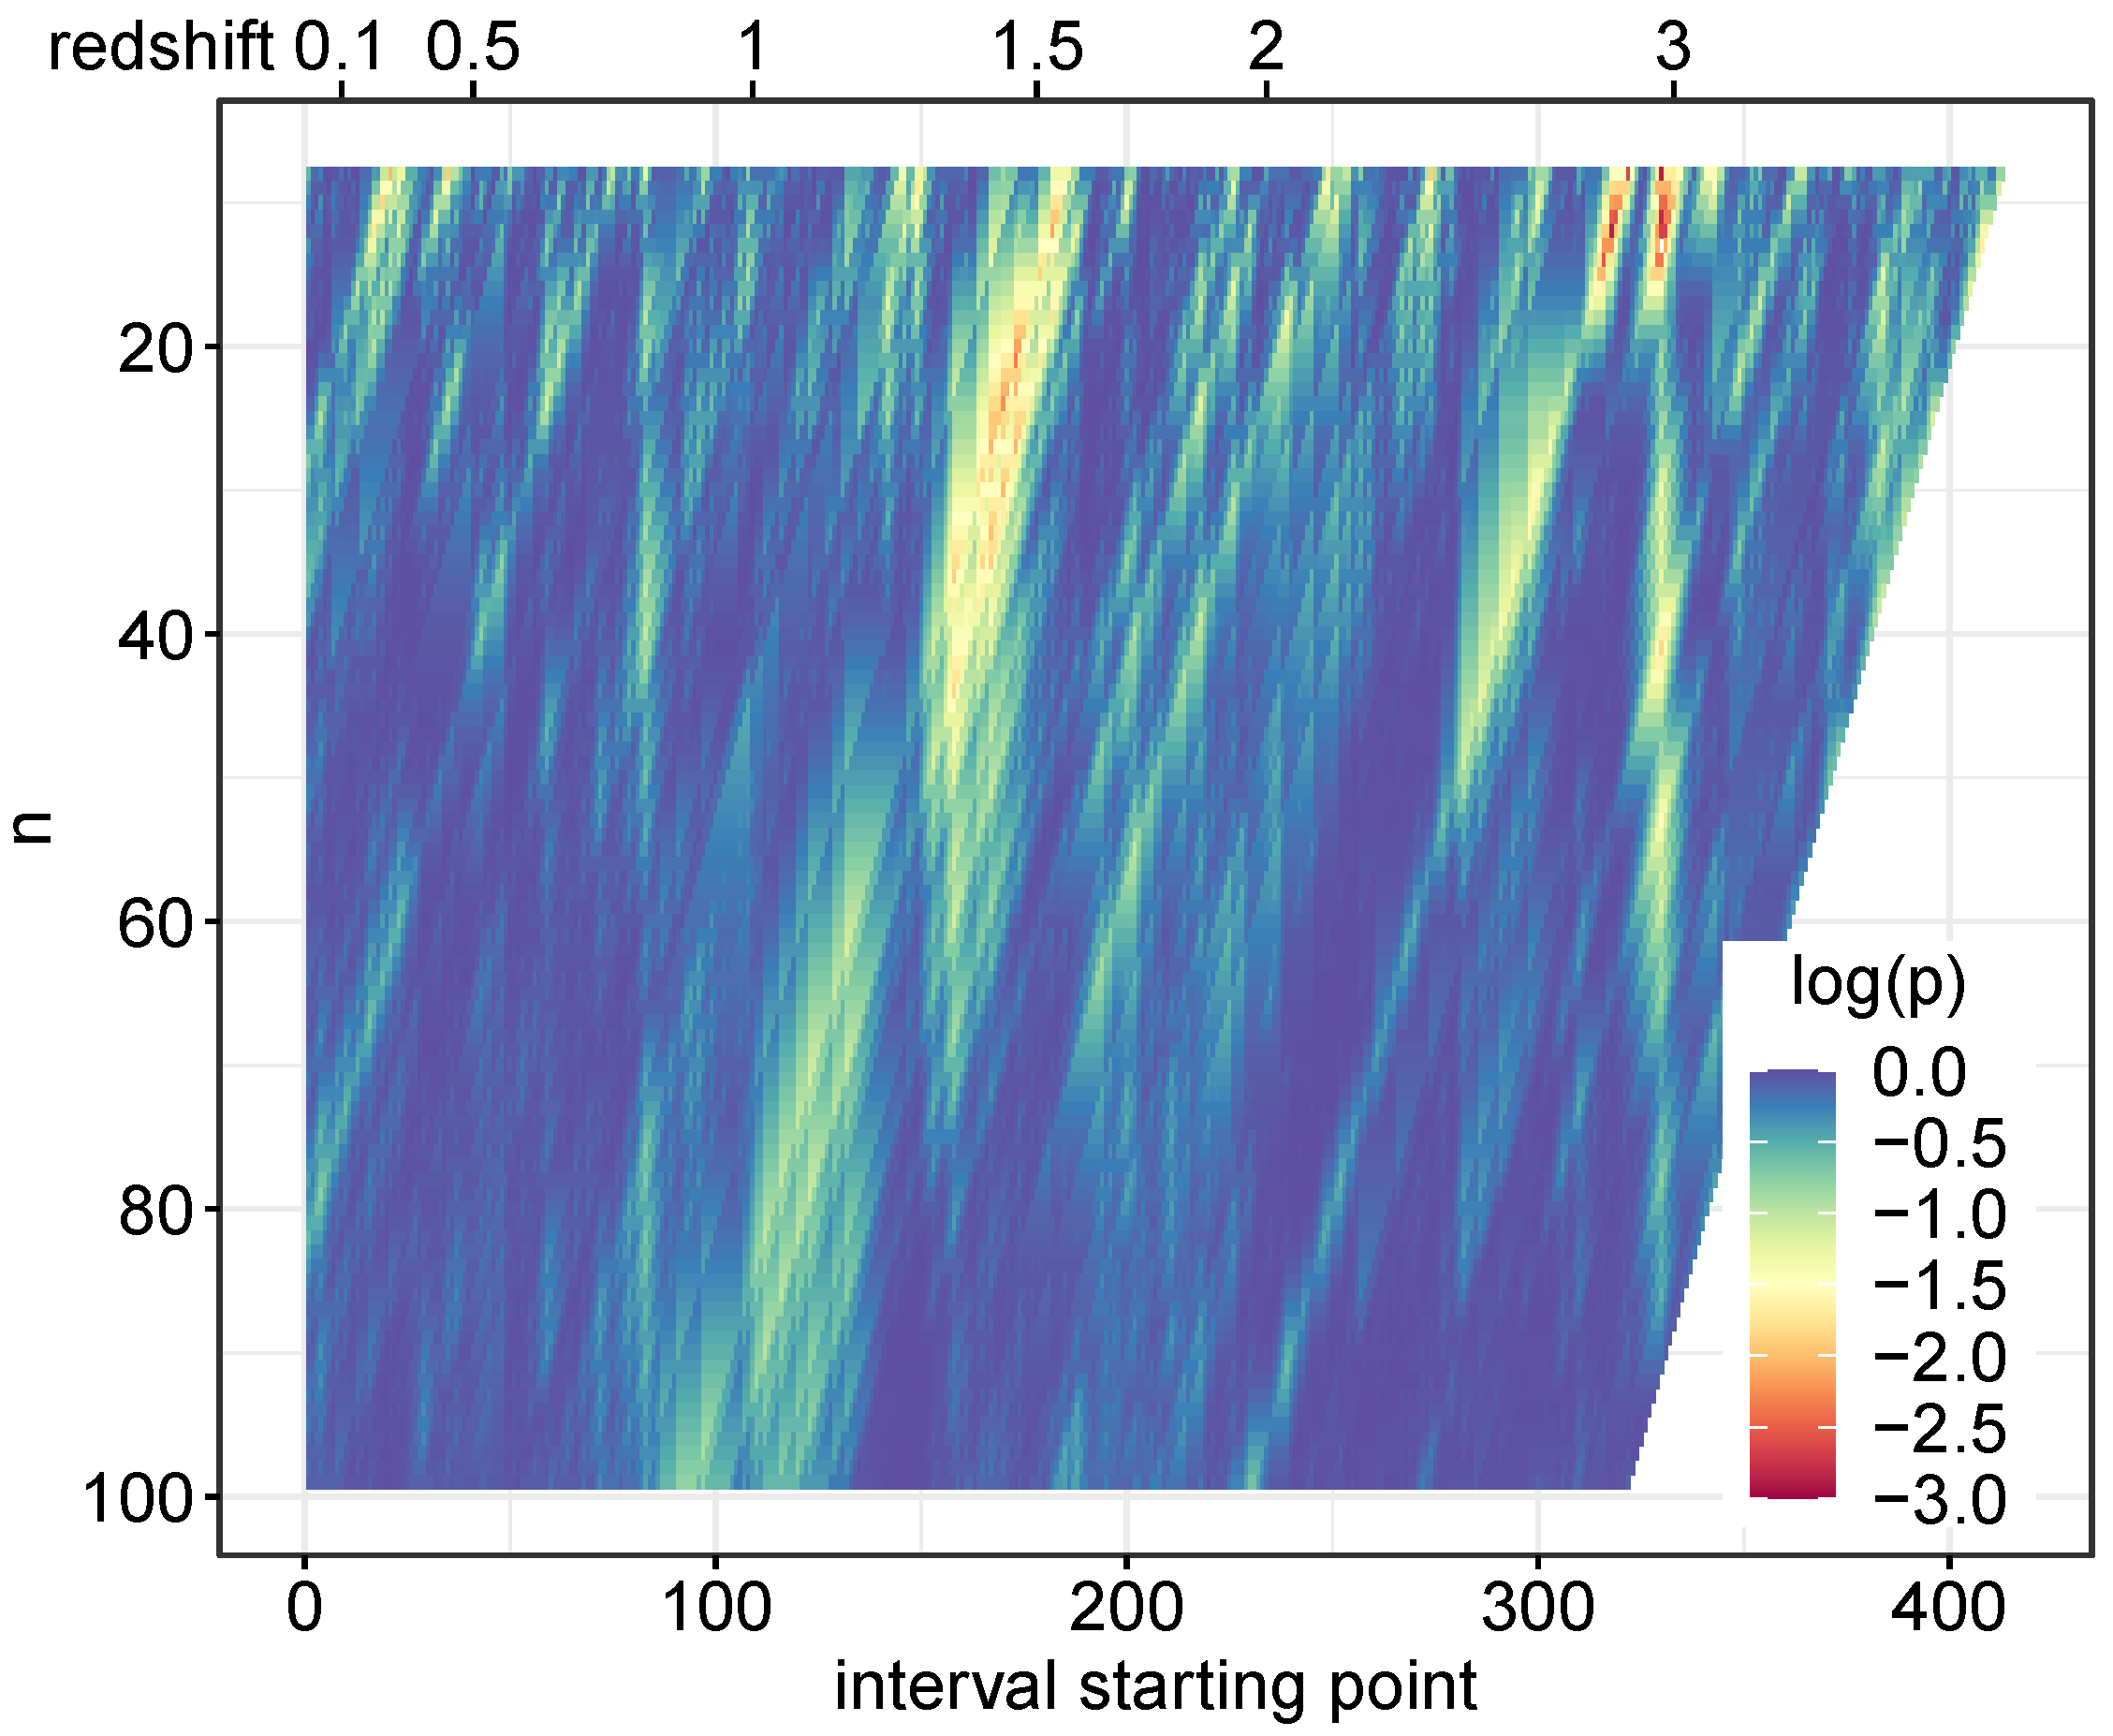
One can make a similar analysis by swapping the variables: order the GRBs by redshift, select a redshift interval, then compare the duration distribution of this subsample with the duration distribution of the complementary sample. Since there are few short bursts with redshift bigger than one, we omitted the 53 GRBs which had s. Therefore, we analysed the remaining 421 GRBs. Here, we ordered the GRBs by redshift and chose the closest, consecutive n GRBs and compared the n closest GRBs’ duration distribution with the GRBs’ duration distribution, performing the Kolmogorov–Smirnov test (KS). We repeated this process starting from the kth GRB and repeated the process with a block size of n running from 8 to 99.
3. Summary and Conclusions
Several hundred GRB redshifts have been determined to date. Some of the most important properties of the GRBs are the duration and the redshift of the bursts. In this paper, we analysed 474 GRBs which had duration and redshift information as well. The most significant interrelation between these two quantities was that the short GRB redshifts are significantly smaller (we call this AREA1). Therefore, in this research we excluded the short GRBs (to be sure, we chose the s) and we analysed the remaining 421 GRBs.
We chose a certain number (n = 8–99) of GRBs which had a certain duration in an interval and compared their redshifts with the remaining GRBs’ redshift distribution. We found three intervals where the redshift distribution was different than in the rest of the GRBs (see Figure 6 and Figure 7). AREA2 ( is between 16 s, 20 s and n between 12 and 21) and AREA4 ( = (9 s, 21 s), n = (59, 68)) bursts tend to be farther and AREA3 ( = (49 s, 61 s), n = (23, 36)) GRBs tend to be closer than the average.
It should be noted that the one-block KS significances will be lower than the whole sample because we conducted many non-independent statistical tests. The trial factor can be estimated by (i.e., for it is ≈6.5).
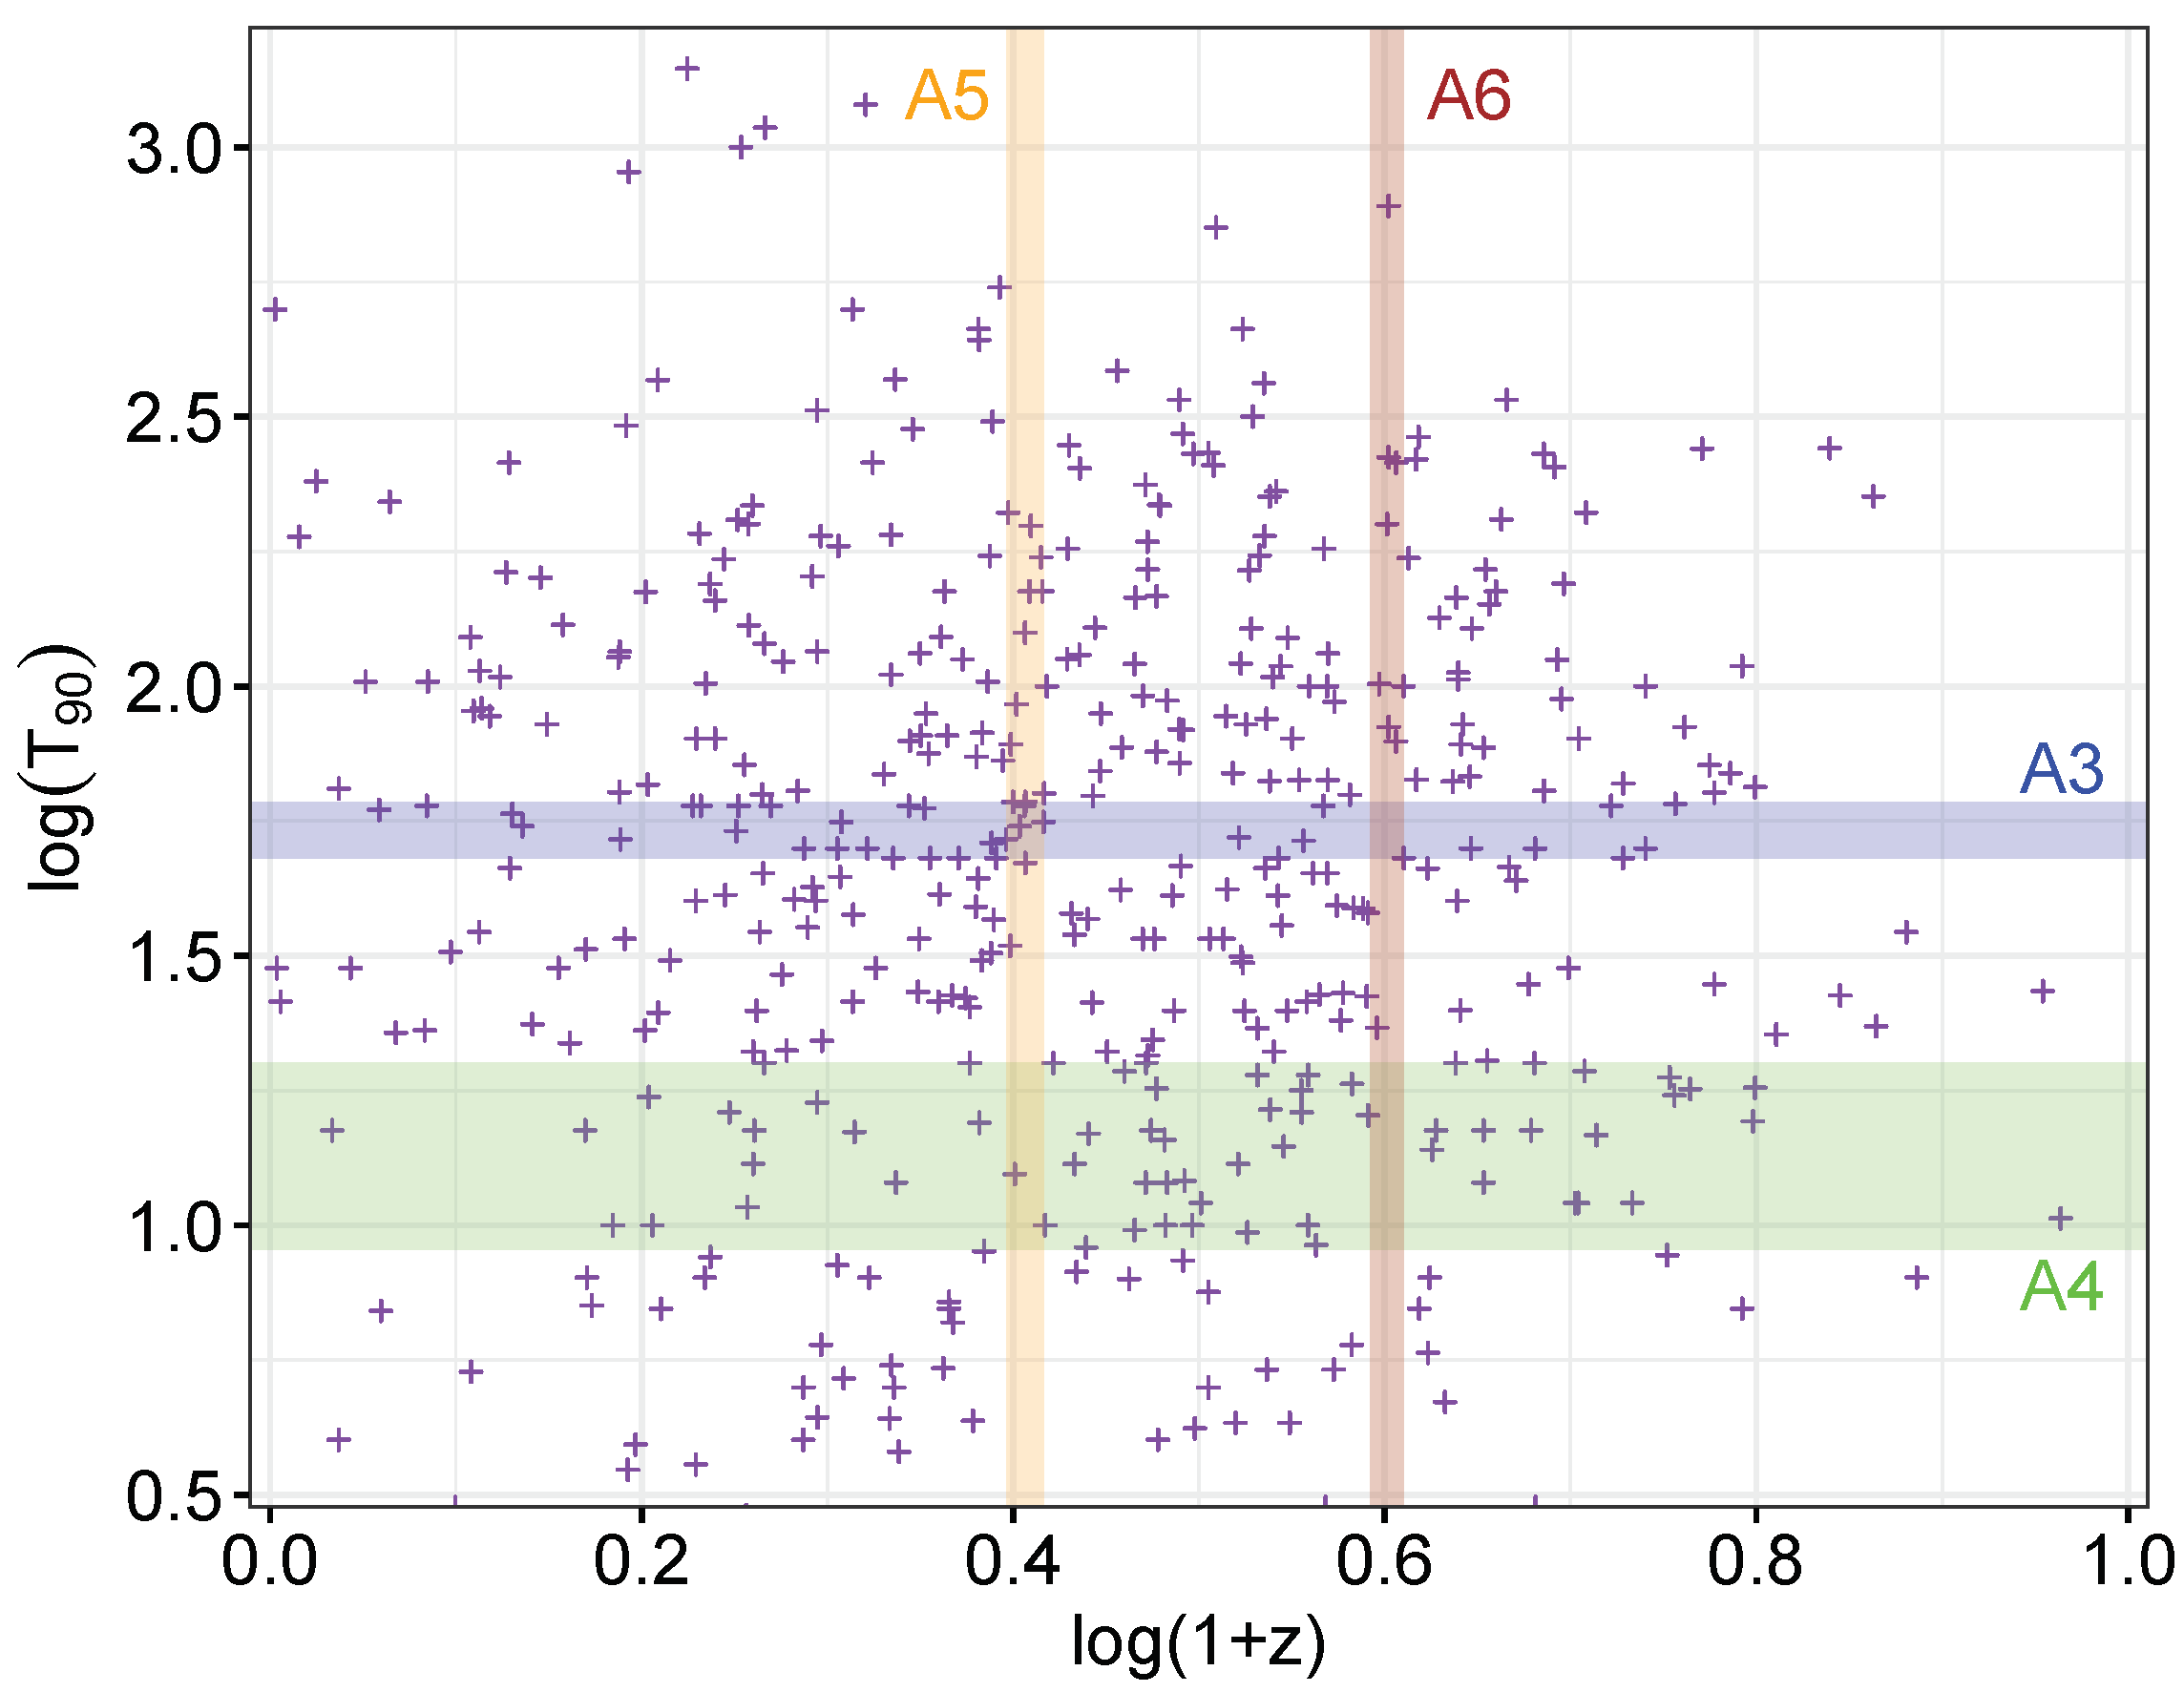
We also analysed the other way, by choosing a redshift interval and checking whether the distribution in this interval is different than the remaining GRBs’ duration distribution (see Figure 9 and Figure 10). We found two intervals where the duration distribution tended to be longer than in the overall sample (see AREA5 and AREA6 in Figure 11).
Balázs et al. [82] and Rácz et al. [74] have shown that variance of the observed is dominated by the intrinsic variance of the duration. Our results are consistent with these findings as no significant time dilatation effects were found [60,61]. As a consequence, the redshift plays a marginal role in the observed distribution of GRB durations [83].
More precisely, the AREA4 GRBs are relatively far, because there are fewer GRBs closer than in the range of = (9 s, 21 s) than is typical. The origin of this effect could be either simply a statistical fluctuation or this could be a signature of some selection effect around the overlap of the intermediate [10,11,12,13,14,15,16,17,18,21] and long GRB groups. Another fact is that, in this duration range, there are relatively more Fermi GBM observations [76] which further complicates the selection effects. For the redshift observations, the Swift BAT usually produces arcminute precision positional data, which is not the case for the Fermi GBM. Further detailed studies are needed to answer this question.
Author Contributions
Conceptualisation, Z.B., L.G.B., I.H., S.P. and I.I.R.; Data curation, I.H. and I.I.R.; Formal analysis, S.P. and I.H.; Investigation, I.H. and Z.B.; Methodology, L.G.B., I.H. and S.P.; Project administration, I.H. and S.P.; Resources, Z.B., I.H. and I.I.R.; Software, S.P. and I.H.; Supervision, L.G.B., Z.B., I.H., S.P. and I.I.R.; Validation, Z.B., L.G.B., I.H., S.P. and I.I.R.; Visualisation, I.H. and S.P.; Writing—original draft, L.G.B., Z.B., S.P., I.H. and I.I.R.; Writing—review and editing, Z.B., L.G.B., S.P., I.H. and I.I.R. All authors have read and agreed to the published version of the manuscript.
Funding
Hungarian TKP2021-NVA-16 and OTKA K134257.
Institutional Review Board Statement
Not applicable.
Informed Consent Statement
Not applicable.
Data Availability Statement
Not applicable.
Acknowledgments
The authors thank the Hungarian TKP2021-NVA-16 and OTKA K134257 program for their support. The authors would like to thank the referees for their valuable comments which helped to improve the manuscript.
Conflicts of Interest
The authors declare no conflict of interest.
| 1 | http://www.astro.caltech.edu/grbox/grbox.php (accessed on 19 February 2022). |
References
- Salvaterra, R.; Della Valle, M.; Campana, S.; Chincarini, G.; Covino, S.; D’Avanzo, P.; Fernández-Soto, A.; Guidorzi, C.; Mannucci, F.; Margutti, R.; et al. GRB090423 at a redshift of z ~ 8.1. Nature 2009, 461, 1258–1260. [Google Scholar] [CrossRef] [PubMed] [Green Version]
- Tanvir, N.R.; Fox, D.B.; Levan, A.J.; Berger, E.; Wiersema, K.; Fynbo, J.P.U.; Cucchiara, A.; Krühler, T.; Gehrels, N.; Bloom, J.S.; et al. A γ-ray burst at a redshift of z ~ 8.2. Nature 2009, 461, 1254–1257. [Google Scholar] [CrossRef] [PubMed] [Green Version]
- Cucchiara, A.; Levan, A.J.; Fox, D.B.; Tanvir, N.R.; Ukwatta, T.N.; Berger, E.; Krühler, T.; Küpcü Yoldaş, A.; Wu, X.F.; Toma, K.; et al. A Photometric Redshift of z ~ 9.4 for GRB 090429B. Astrophys. J. 2011, 736, 7. [Google Scholar] [CrossRef] [Green Version]
- Wang, F.Y.; Dai, Z.G.; Liang, E.W. Gamma-ray burst cosmology. New Astron. Rev. 2015, 67, 1–17. [Google Scholar] [CrossRef] [Green Version]
- Wang, J.S.; Wang, F.Y.; Cheng, K.S.; Dai, Z.G. Measuring dark energy with the Eiso-Ep correlation of gamma-ray bursts using model-independent methods. Astron. Astrophys. 2016, 585, A68. [Google Scholar] [CrossRef] [Green Version]
- Amati, L.; D’Agostino, R.; Luongo, O.; Muccino, M.; Tantalo, M. Addressing the circularity problem in the Ep-Eiso correlation of gamma-ray bursts. Mon. Not. R. Astron. Soc. 2019, 486, L46–L51. [Google Scholar] [CrossRef] [Green Version]
- Khadka, N.; Ratra, B. Constraints on cosmological parameters from gamma-ray burst peak photon energy and bolometric fluence measurements and other data. Mon. Not. R. Astron. Soc. 2020, 499, 391–403. [Google Scholar] [CrossRef]
- Demianski, M.; Piedipalumbo, E.; Sawant, D.; Amati, L. Prospects of high redshift constraints on dark energy models with the Ep,i-Eiso correlation in long gamma ray bursts. Mon. Not. R. Astron. Soc. 2021, 506, 903–918. [Google Scholar] [CrossRef]
- Luongo, O.; Muccino, M. A Roadmap to Gamma-Ray Bursts: New Developments and Applications to Cosmology. Galaxies 2021, 9, 77. [Google Scholar] [CrossRef]
- Horváth, I. A Third Class of Gamma-Ray Bursts? Astrophys. J. 1998, 508, 757–759. [Google Scholar] [CrossRef] [Green Version]
- Hakkila, J.; Haglin, D.J.; Pendleton, G.N.; Mallozzi, R.S.; Meegan, C.A.; Roiger, R.J. Gamma-Ray Burst Class Properties. Astrophys. J. 2000, 538, 165–180. [Google Scholar] [CrossRef]
- Horváth, I.; Mészáros, A.; Balázs, L.G.; Bagoly, Z. Where is the Third Subgroup of Gamma-Ray Bursts? Balt. Astron. 2004, 13, 217–220. [Google Scholar]
- Řípa, J.; Mészáros, A.; Wigger, C.; Huja, D.; Hudec, R.; Hajdas, W. Search for gamma-ray burst classes with the RHESSI satellite. Astron. Astrophys. 2009, 498, 399–406. [Google Scholar] [CrossRef] [Green Version]
- Koen, C.; Bere, A. On multiple classes of gamma-ray bursts, as deduced from autocorrelation functions or bivariate duration/hardness ratio distributions. Mon. Not. R. Astron. Soc. 2012, 420, 405–415. [Google Scholar] [CrossRef] [Green Version]
- Tsutsui, R.; Nakamura, T.; Yonetoku, D.; Takahashi, K.; Morihara, Y. Identifying Subclasses of Long Gamma-Ray Bursts with Cumulative Light-Curve Morphology of Prompt Emissions. Publ. Astron. Soc. Jpn. 2013, 65, 3. [Google Scholar] [CrossRef] [Green Version]
- Zitouni, H.; Guessoum, N.; Azzam, W.J.; Mochkovitch, R. Statistical study of observed and intrinsic durations among BATSE and Swift/BAT GRBs. Astrophys. Space Sci. 2015, 357, 7. [Google Scholar] [CrossRef] [Green Version]
- Tarnopolski, M. Analysis of Fermi gamma-ray burst duration distribution. Astron. Astrophys. 2015, 581, A29. [Google Scholar] [CrossRef] [Green Version]
- Tarnopolski, M. Analysis of the observed and intrinsic durations of Swift/BAT gamma-ray bursts. New Astron. 2016, 46, 54–59. [Google Scholar] [CrossRef] [Green Version]
- Horváth, I.; Tóth, B.G.; Hakkila, J.; Tóth, L.V.; Balázs, L.G.; Rácz, I.I.; Pintér, S.; Bagoly, Z. Classifying GRB 170817A/GW170817 in a Fermi duration-hardness plane. Astrophys. Space Sci. 2018, 363, 53. [Google Scholar] [CrossRef] [Green Version]
- Tarnopolski, M. Analysis of the Duration-Hardness Ratio Plane of Gamma-Ray Bursts Using Skewed Distributions. Astrophys. J. 2019, 870, 105. [Google Scholar] [CrossRef]
- Tarnopolski, M. Graph-based clustering of gamma-ray bursts. Astron. Astrophys. 2022, 657, A13. [Google Scholar] [CrossRef]
- Mazets, E.P.; Golenetskii, S.V.; Ilinskii, V.N.; Panov, V.N.; Aptekar, R.L.; Gurian, I.A.; Proskura, M.P.; Sokolov, I.A.; Sokolova, Z.I.; Kharitonova, T.V. Catalog of cosmic gamma-ray bursts from the KONUS experiment data. I. Astrophys. Space Sci. 1981, 80, 3–83. [Google Scholar] [CrossRef]
- Norris, J.P.; Cline, T.L.; Desai, U.D.; Teegarden, B.J. Frequency of fast, narrow gamma-ray bursts. Nature 1984, 308, 434. [Google Scholar] [CrossRef]
- Mészáros, P.; Gehrels, N. Gamma-ray bursts and their links with supernovae and cosmology. Res. Astron. Astrophys. 2012, 12, 1139–1161. [Google Scholar] [CrossRef] [Green Version]
- Briggs, M.S.; Paciesas, W.S.; Pendleton, G.N.; Meegan, C.A.; Fishman, G.J.; Horack, J.M.; Brock, M.N.; Kouveliotou, C.; Hartmann, D.H.; Hakkila, J. BATSE Observations of the Large-Scale Isotropy of Gamma-Ray Bursts. Astrophys. J. 1996, 459, 40. [Google Scholar] [CrossRef] [Green Version]
- Tegmark, M.; Hartmann, D.H.; Briggs, M.S.; Meegan, C.A. The Angular Power Spectrum of BATSE 3B Gamma-Ray Bursts. Astrophys. J. 1996, 468, 214. [Google Scholar] [CrossRef] [Green Version]
- Balázs, L.G.; Mészáros, A.; Horváth, I.; Vavrek, R. An intrinsic anisotropy in the angular distribution of gamma-ray bursts. Astron. Astrophys. Suppl. Ser. 1999, 138, 417–418. [Google Scholar] [CrossRef] [Green Version]
- Mészáros, A.; Bagoly, Z.; Horváth, I.; Balázs, L.G.; Vavrek, R. A Remarkable Angular Distribution of the Intermediate Subclass of Gamma-Ray Bursts. Astrophys. J. 2000, 539, 98–101. [Google Scholar] [CrossRef] [Green Version]
- Magliocchetti, M.; Ghirlanda, G.; Celotti, A. Evidence for anisotropy in the distribution of short-lived gamma-ray bursts. Mon. Not. R. Astron. Soc. 2003, 343, 255–258. [Google Scholar] [CrossRef] [Green Version]
- Vavrek, R.; Balázs, L.G.; Mészáros, A.; Horváth, I.; Bagoly, Z. Testing the randomness in the sky-distribution of gamma-ray bursts. Mon. Not. R. Astron. Soc. 2008, 391, 1741–1748. [Google Scholar] [CrossRef] [Green Version]
- Tarnopolski, M. Testing the anisotropy in the angular distribution of Fermi/GBM gamma-ray bursts. Mon. Not. R. Astron. Soc. 2017, 472, 4819–4831. [Google Scholar] [CrossRef]
- Clowes, R.G.; Harris, K.A.; Raghunathan, S.; Campusano, L.E.; Söchting, I.K.; Graham, M.J. A structure in the early Universe at z~1.3 that exceeds the homogeneity scale of the R-W concordance cosmology. Mon. Not. R. Astron. Soc. 2013, 429, 2910–2916. [Google Scholar] [CrossRef] [Green Version]
- Horváth, I.; Hakkila, J.; Bagoly, Z. Possible structure in the GRB sky distribution at redshift two. Astron. Astrophys. 2014, 561, L12. [Google Scholar] [CrossRef] [Green Version]
- Horváth, I.; Bagoly, Z.; Hakkila, J.; Tóth, L.V. New data support the existence of the Hercules-Corona Borealis Great Wall. Astron. Astrophys. 2015, 584, A48. [Google Scholar] [CrossRef] [Green Version]
- Balázs, L.G.; Bagoly, Z.; Hakkila, J.E.; Horváth, I.; Kóbori, J.; Rácz, I.I.; Tóth, L.V. A giant ring-like structure at 0.78 < z < 0.86 displayed by GRBs. Mon. Not. R. Astron. Soc. 2015, 452, 2236–2246. [Google Scholar] [CrossRef] [Green Version]
- Horvath, I.; Szécsi, D.; Hakkila, J.; Szabó, Á.; Racz, I.I.; Tóth, L.V.; Pinter, S.; Bagoly, Z. The clustering of gamma-ray bursts in the Hercules-Corona Borealis Great Wall: The largest structure in the Universe? Mon. Not. R. Astron. Soc. 2020, 498, 2544–2553. [Google Scholar] [CrossRef]
- Řípa, J. Testing Isotropic Universe via Properties of Gamma-Ray Bursts Detected by Fermi/GBM. In Proceedings of the 7th International Fermi Symposium, Garmisch-Partenkirchen, Germany, 15–20 October 2017; p. 80. [Google Scholar]
- Řípa, J.; Shafieloo, A. Testing the Isotropic Universe Using the Gamma-ray Burst Data ofFermi/GBM. Astrophys. J. 2017, 851, 15. [Google Scholar] [CrossRef] [Green Version]
- Řípa, J.; Shafieloo, A. Update on testing the isotropy of the properties of gamma-ray bursts. Mon. Not. R. Astron. Soc. 2019, 486, 3027–3040. [Google Scholar] [CrossRef]
- Cline, D.B.; Matthey, C.; Otwinowski, S. Study of Very Short Gamma-Ray Bursts. Astrophys. J. 1999, 527, 827–834. [Google Scholar] [CrossRef] [Green Version]
- Litvin, V.F.; Matveev, S.A.; Mamedov, S.V.; Orlov, V.V. Anisotropy in the Sky Distribution of Short Gamma-Ray Bursts. Astron. Lett. 2001, 27, 416–420. [Google Scholar] [CrossRef]
- Woosley, S.E. Gamma-ray bursts from stellar mass accretion disks around black holes. Astrophys. J. 1993, 405, 273–277. [Google Scholar] [CrossRef]
- Paczyński, B. Are Gamma-Ray Bursts in Star-Forming Regions? Astrophys. J. 1998, 494, L45–L48. [Google Scholar] [CrossRef] [Green Version]
- Woosley, S.E.; Bloom, J.S. The Supernova Gamma-Ray Burst Connection. Annu. Rev. Astron. Astrophys. 2006, 44, 507–556. [Google Scholar] [CrossRef] [Green Version]
- Hjorth, J.; Sollerman, J.; Møller, P.; Fynbo, J.P.U.; Woosley, S.E.; Kouveliotou, C.; Tanvir, N.R.; Greiner, J.; Andersen, M.I.; Castro-Tirado, A.J.; et al. A very energetic supernova associated with the γ-ray burst of 29 March 2003. Nature 2003, 423, 847–850. [Google Scholar] [CrossRef] [Green Version]
- Stanek, K.Z.; Matheson, T.; Garnavich, P.M.; Martini, P.; Berlind, P.; Caldwell, N.; Challis, P.; Brown, W.R.; Schild, R.; Krisciunas, K.; et al. Spectroscopic Discovery of the Supernova 2003dh Associated with GRB 030329. Astrophys. J. 2003, 591, L17–L20. [Google Scholar] [CrossRef] [Green Version]
- Totani, T. Cosmological Gamma-Ray Bursts and Evolution of Galaxies. Astrophys. J. 1997, 486, L71–L74. [Google Scholar] [CrossRef]
- Zhang, B.; Mészáros, P. Gamma-Ray Bursts: Progress, problems–prospects. Int. J. Mod. Phys. A 2004, 19, 2385–2472. [Google Scholar] [CrossRef]
- Jakobsson, P.; Björnsson, G.; Fynbo, J.P.U.; Jóhannesson, G.; Hjorth, J.; Thomsen, B.; Møller, P.; Watson, D.; Jensen, B.L.; Östlin, G.; et al. Ly-α and ultraviolet emission from high-redshift gamma-ray burst hosts: To what extent do gamma-ray bursts trace star formation? Mon. Not. R. Astron. Soc. 2005, 362, 245–251. [Google Scholar] [CrossRef]
- Mészáros, A.; Bagoly, Z.; Balázs, L.G.; Horváth, I. Redshift distribution of gamma-ray bursts and star formation rate. Astron. Astrophys. 2006, 455, 785–790. [Google Scholar] [CrossRef] [Green Version]
- Zhang, B. Gamma-Ray Bursts in the Swift Era. Chin. J. Astron. Astrophys. 2007, 7, 1. [Google Scholar] [CrossRef] [Green Version]
- Schulze, S.; Chapman, R.; Hjorth, J.; Levan, A.J.; Jakobsson, P.; Björnsson, G.; Perley, D.A.; Krühler, T.; Gorosabel, J.; Tanvir, N.R.; et al. The Optically Unbiased GRB Host (TOUGH) Survey. VII. The Host Galaxy Luminosity Function: Probing the Relationship between GRBs and Star Formation to Redshift ∼ 6. Astrophys. J. 2015, 808, 73. [Google Scholar] [CrossRef]
- Le Floc’h, E.; Duc, P.A.; Mirabel, I.F.; Sanders, D.B.; Bosch, G.; Diaz, R.J.; Donzelli, C.J.; Rodrigues, I.; Courvoisier, T.J.L.; Greiner, J.; et al. Are the hosts of gamma-ray bursts sub-luminous and blue galaxies? Astron. Astrophys. 2003, 400, 499–510. [Google Scholar] [CrossRef]
- Palmerio, J.T.; Vergani, S.D.; Salvaterra, R.; Sand ers, R.L.; Japelj, J.; Vidal-García, A.; D’Avanzo, P.; Corre, D.; Perley, D.A.; Shapley, A.E.; et al. Are long gamma-ray bursts biased tracers of star formation? Clues from the host galaxies of the Swift/BAT6 complete sample of bright LGRBs. III. Stellar masses, star formation rates, and metallicities at z > 1. Astron. Astrophys. 2019, 623, A26. [Google Scholar] [CrossRef]
- Fruchter, A.S.; Levan, A.J.; Strolger, L.; Vreeswijk, P.M.; Thorsett, S.E.; Bersier, D.; Burud, I.; Castro Cerón, J.M.; Castro-Tirado, A.J.; Conselice, C.; et al. Long γ-ray bursts and core-collapse supernovae have different environments. Nature 2006, 441, 463–468. [Google Scholar] [CrossRef] [PubMed] [Green Version]
- Blanchard, P.K.; Berger, E.; Fong, W.f. The Offset and Host Light Distributions of Long Gamma-Ray Bursts: A New View From HST Observations of Swift Bursts. Astrophys. J. 2016, 817, 144. [Google Scholar] [CrossRef] [Green Version]
- Lyman, J.D.; Levan, A.J.; Tanvir, N.R.; Fynbo, J.P.U.; McGuire, J.T.W.; Perley, D.A.; Angus, C.R.; Bloom, J.S.; Conselice, C.J.; Fruchter, A.S.; et al. The host galaxies and explosion sites of long-duration gamma ray bursts: Hubble Space Telescope near-infrared imaging. Mon. Not. R. Astron. Soc. 2017, 467, 1795–1817. [Google Scholar] [CrossRef] [Green Version]
- Norris, J.P.; Nemiroff, R.J.; Scargle, J.D.; Kouveliotou, C.; Fishman, G.J.; Meegan, C.A.; Paciesas, W.S.; Bonnell, J.T. Detection of Signature Consistent with Cosmological Time Dilation in Gamma-Ray Bursts. Astrophys. J. 1994, 424, 540. [Google Scholar] [CrossRef] [Green Version]
- Lee, T.T.; Petrosian, V. Distributions of Peak Flux and Duration for Gamma-Ray Bursts. Astrophys. J. 1996, 470, 479. [Google Scholar] [CrossRef]
- Sakamoto, T.; Barthelmy, S.D.; Baumgartner, W.H.; Cummings, J.R.; Fenimore, E.E.; Gehrels, N.; Krimm, H.A.; Markwardt, C.B.; Palmer, D.M.; Parsons, A.M.; et al. The Second Swift Burst Alert Telescope Gamma-Ray Burst Catalog. Astrophys. J. Suppl. 2011, 195, 2. [Google Scholar] [CrossRef] [Green Version]
- Lien, A.; Sakamoto, T.; Barthelmy, S.D.; Baumgartner, W.H.; Cannizzo, J.K.; Chen, K.; Collins, N.R.; Cummings, J.R.; Gehrels, N.; Krimm, H.A.; et al. The Third Swift Burst Alert Telescope Gamma-Ray Burst Catalog. Astrophys. J. 2016, 829, 7. [Google Scholar] [CrossRef] [Green Version]
- Cao, S.; Dainotti, M.; Ratra, B. Standardizing Platinum Dainotti-correlated gamma-ray bursts, and using them with standardized Amati-correlated gamma-ray bursts to constrain cosmological model parameters. Mon. Not. R. Astron. Soc. 2022. [Google Scholar] [CrossRef] [PubMed]
- Amati, L.; Frontera, F.; Tavani, M.; in’t Zand, J.J.M.; Antonelli, A.; Costa, E.; Feroci, M.; Guidorzi, C.; Heise, J.; Masetti, N.; et al. Intrinsic spectra and energetics of BeppoSAX Gamma-Ray Bursts with known redshifts. Astron. Astrophys. 2002, 390, 81–89. [Google Scholar] [CrossRef]
- Ghirlanda, G.; Ghisellini, G.; Lazzati, D. The Collimation-corrected Gamma-Ray Burst Energies Correlate with the Peak Energy of Their νFνSpectrum. Astrophys. J. 2004, 616, 331–338. [Google Scholar] [CrossRef]
- Yonetoku, D.; Murakami, T.; Nakamura, T.; Yamazaki, R.; Inoue, A.K.; Ioka, K. Gamma-Ray Burst Formation Rate Inferred from the Spectral Peak Energy–Peak Luminosity Relation. Astrophys. J. 2004, 609, 935–951. [Google Scholar] [CrossRef] [Green Version]
- Liang, E.; Zhang, B. Model-independent Multivariable Gamma-Ray Burst Luminosity Indicator and Its Possible Cosmological Implications. Astrophys. J. 2005, 633, 611–623. [Google Scholar] [CrossRef] [Green Version]
- Dainotti, M.G.; Simone, B.D.; Schiavone, T.; Montani, G.; Rinaldi, E.; Lambiase, G. On the Hubble Constant Tension in the SNe Ia Pantheon Sample. Astrophys. J. 2021, 912, 150. [Google Scholar] [CrossRef]
- Littlejohns, O.M.; Butler, N.R. Investigating signatures of cosmological time dilation in duration measures of prompt gamma-ray burst light curves. Mon. Not. R. Astron. Soc. 2014, 444, 3948–3960. [Google Scholar] [CrossRef] [Green Version]
- Belczynski, K.; Holz, D.E.; Fryer, C.L.; Berger, E.; Hartmann, D.H.; O’Shea, B. On the Origin of the Highest Redshift Gamma-Ray Bursts. Astrophys. J. 2010, 708, 117–126. [Google Scholar] [CrossRef] [Green Version]
- Tanvir, N.R.; Le Floc’h, E.; Christensen, L.; Caruana, J.; Salvaterra, R.; Ghirlanda, G.; Ciardi, B.; Maio, U.; D’Odorico, V.; Piedipalumbo, E.; et al. Exploration of the high-redshift universe enabled by THESEUS. Exp. Astron. 2021, 52, 219–244. [Google Scholar] [CrossRef]
- Kouveliotou, C.; Meegan, C.A.; Fishman, G.J.; Bhat, N.P.; Briggs, M.S.; Koshut, T.M.; Paciesas, W.S.; Pendleton, G.N. Identification of two classes of gamma-ray bursts. Astrophys. J. 1993, 413, L101–L104. [Google Scholar] [CrossRef]
- Koshut, T.M.; Paciesas, W.S.; Kouveliotou, C.; van Paradijs, J.; Pendleton, G.N.; Fishman, G.J.; Meegan, C.A. Systematic Effects on Duration Measurements of Gamma-Ray Bursts. Astrophys. J. 1996, 463, 570. [Google Scholar] [CrossRef] [Green Version]
- Poolakkil, S.; Preece, R.; Fletcher, C.; Goldstein, A.; Bhat, P.N.; Bissaldi, E.; Briggs, M.S.; Burns, E.; Cleveland, W.H.; Giles, M.M.; et al. The Fermi-GBM Gamma-Ray Burst Spectral Catalog: 10 yr of Data. Astrophys. J. 2021, 913, 60. [Google Scholar] [CrossRef]
- Rácz, I.I.; Balázs, L.G.; Horvath, I.; Tóth, L.V.; Bagoly, Z. Statistical properties of Fermi GBM GRBs’ spectra. Mon. Not. R. Astron. Soc. 2018, 475, 306–320. [Google Scholar] [CrossRef]
- Racz, I.I.; Balázs, L.G.; Bagoly, Z.; Horvath, I.; Tóth, L.V. Fermi GBM GRBs’ multivariate statistics. Astron. Nachrichten 2018, 339, 352–357. [Google Scholar] [CrossRef] [Green Version]
- Pinter, S.; Balázs, L.G.; Bagoly, Z.; Tóth, L.V.; Racz, I.I. Comparison of Fermi and Swift GRB Data. Universe 2022. submitted. [Google Scholar]
- Bagoly, Z.; Mészáros, A.; Balázs, L.G.; Horváth, I.; Klose, S.; Larsson, S.; Mészáros, P.; Ryde, F.; Tusnády, G. The Swift satellite and redshifts of long gamma-ray bursts. Astron. Astrophys. 2006, 453, 797–800. [Google Scholar] [CrossRef] [Green Version]
- Jakobsson, P.; Malesani, D.; Fynbo, J.P.U.; Hjorth, J.; Milvang-Jensen, B. GRB Redshifts & Host Galaxies: An Unbiased Sample. In Gamma-Ray Burst: Sixth Huntsville Symposium; American Institute of Physics Conference Series; Meegan, C., Kouveliotou, C., Gehrels, N., Eds.; American Institute of Physics: College Park, MD, USA, 2009; Volume 1133, pp. 455–463. [Google Scholar] [CrossRef]
- Pérez-Ramírez, D.; de Ugarte Postigo, A.; Gorosabel, J.; Aloy, M.A.; Jóhannesson, G.; Guerrero, M.A.; Osborne, J.P.; Page, K.L.; Warwick, R.S.; Horváth, I.; et al. Detection of the high z GRB 080913 and its implications on progenitors and energy extraction mechanisms. Astron. Astrophys. 2010, 510, A105. [Google Scholar] [CrossRef] [Green Version]
- Balázs, L.G.; Mészáros, A.; Horváth, I. Anisotropy of the sky distribution of gamma-ray bursts. Astron. Astrophys. 1998, 339, 1–6. [Google Scholar]
- Zhang, B.; Zhang, B.B.; Virgili, F.J.; Liang, E.W.; Kann, D.A.; Wu, X.F.; Proga, D.; Lv, H.J.; Toma, K.; Mészáros, P.; et al. Discerning the Physical Origins of Cosmological Gamma-ray Bursts Based on Multiple Observational Criteria: The Cases of z = 6.7 GRB 080913, z = 8.2 GRB 090423, and Some Short/Hard GRBs. Astrophys. J. 2009, 703, 1696–1724. [Google Scholar] [CrossRef] [Green Version]
- Balázs, L.G.; Bagoly, Z.; Horváth, I.; Mészáros, A.; Mészáros, P. On the difference between the short and long gamma-ray bursts. Astron. Astrophys. 2003, 401, 129–140. [Google Scholar] [CrossRef] [Green Version]
- Tarnopolski, M. Can the Cosmological Dilation Explain the Skewness in the Gamma-Ray Burst Duration Distribution? Astrophys. J. 2020, 897, 77. [Google Scholar] [CrossRef]
Figure 1.
The redshift cumulative distributions of the 474 bursts (red) and the 421 non-short ( 5 s) GRBs (blue) which had known redshift and duration.
Figure 1.
The redshift cumulative distributions of the 474 bursts (red) and the 421 non-short ( 5 s) GRBs (blue) which had known redshift and duration.

Figure 2.
Duration () vs. log distribution of the 474 GRBs with known redshift and duration.

Figure 3.
One can order the 474 GRBs according to their . n = 20 (red), (black) and (blue) consecutive GRBs were chosen and their z distribution was compared with the complementary GRBs’ redshift distributions. This figure shows the KS test p value as a function of the starting number (k, see details in the text) of the n consecutive GRBs. The green (light blue) line marks the 2 (3) significance level.

Figure 4.
We ordered the 421 non-short GRBs ( s) according to their . n = 20 (red), (black) and (blue) consecutive GRBs were chosen and their z distribution was compared with the complementary GRBs’ redshift distributions. This figure shows the KS test p value as a function of the starting number of the n GRBs. Green (light blue) line marks the 2 (3) significance level.

Figure 5.
The two-parameter (n, duration) KS test p value contour plot using the 421 non-short GRBs.
Figure 5.
The two-parameter (n, duration) KS test p value contour plot using the 421 non-short GRBs.

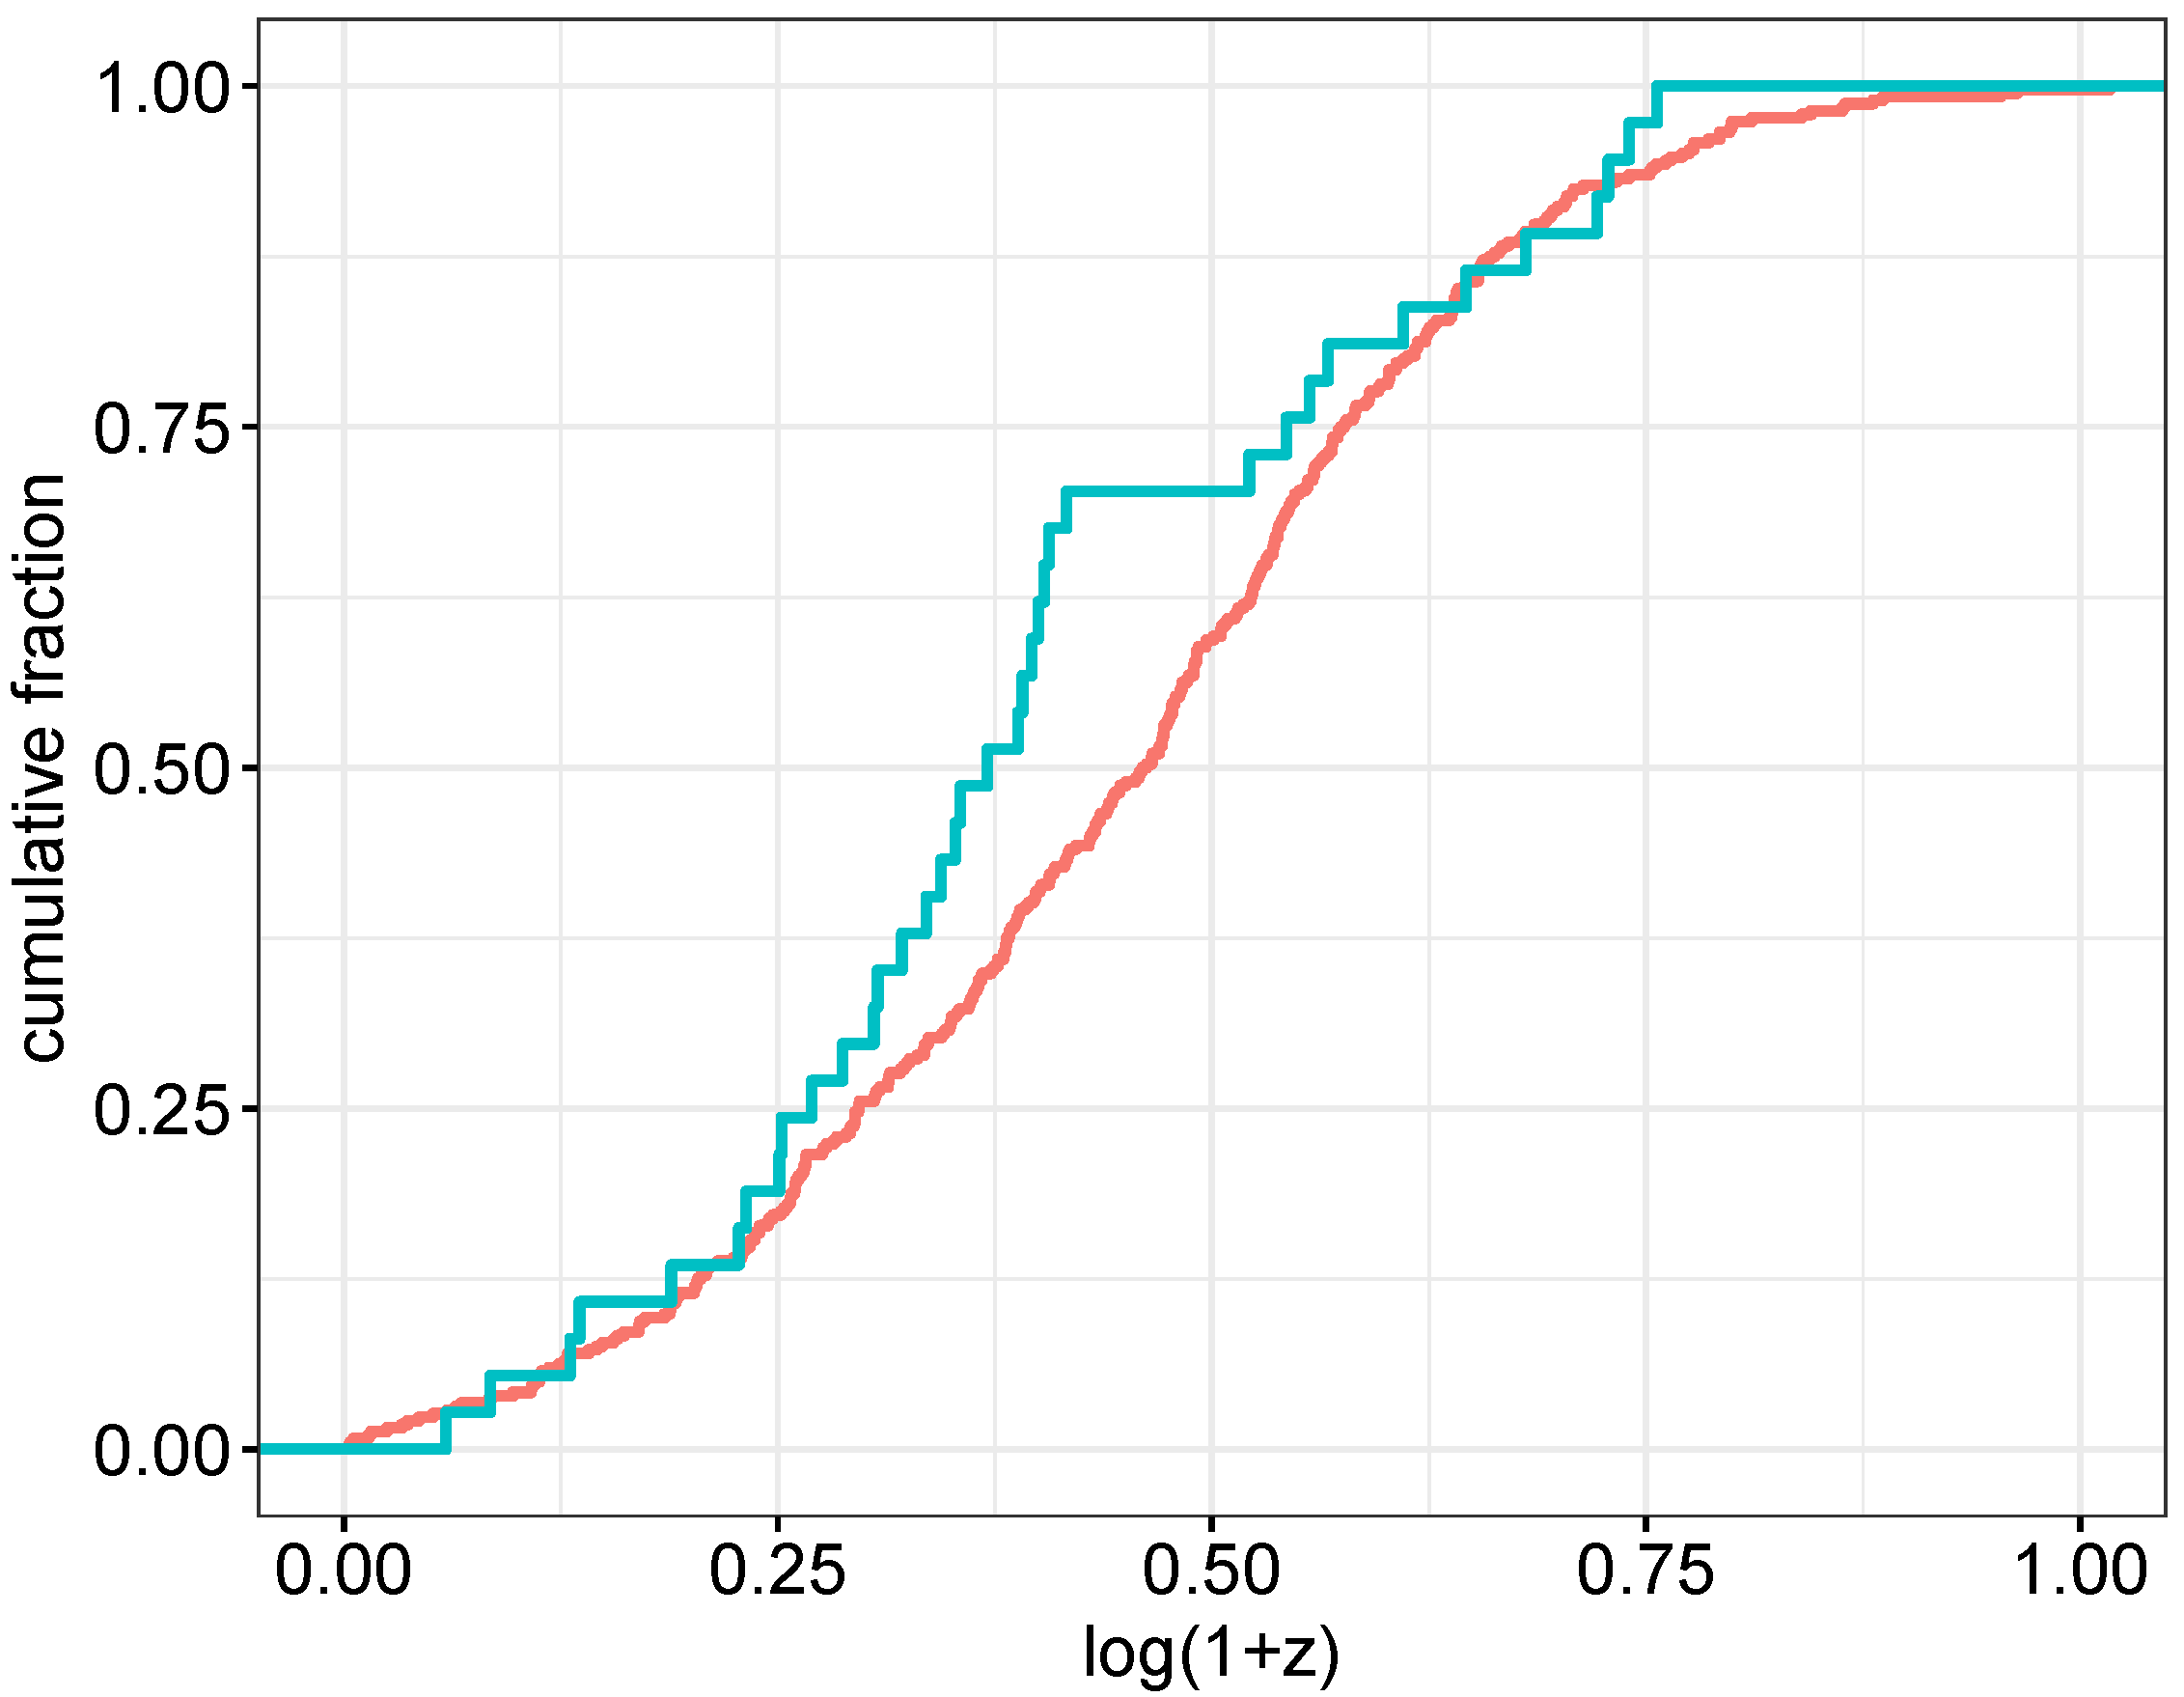
Figure 6.
Cumulative redshift distribution of AREA3 GRBs (49 s 61 s) is marked with blue. Red line is the 421 − n GRBs’ redshift distribution. These bursts tend to be closer than the others.
Figure 6.
Cumulative redshift distribution of AREA3 GRBs (49 s 61 s) is marked with blue. Red line is the 421 − n GRBs’ redshift distribution. These bursts tend to be closer than the others.

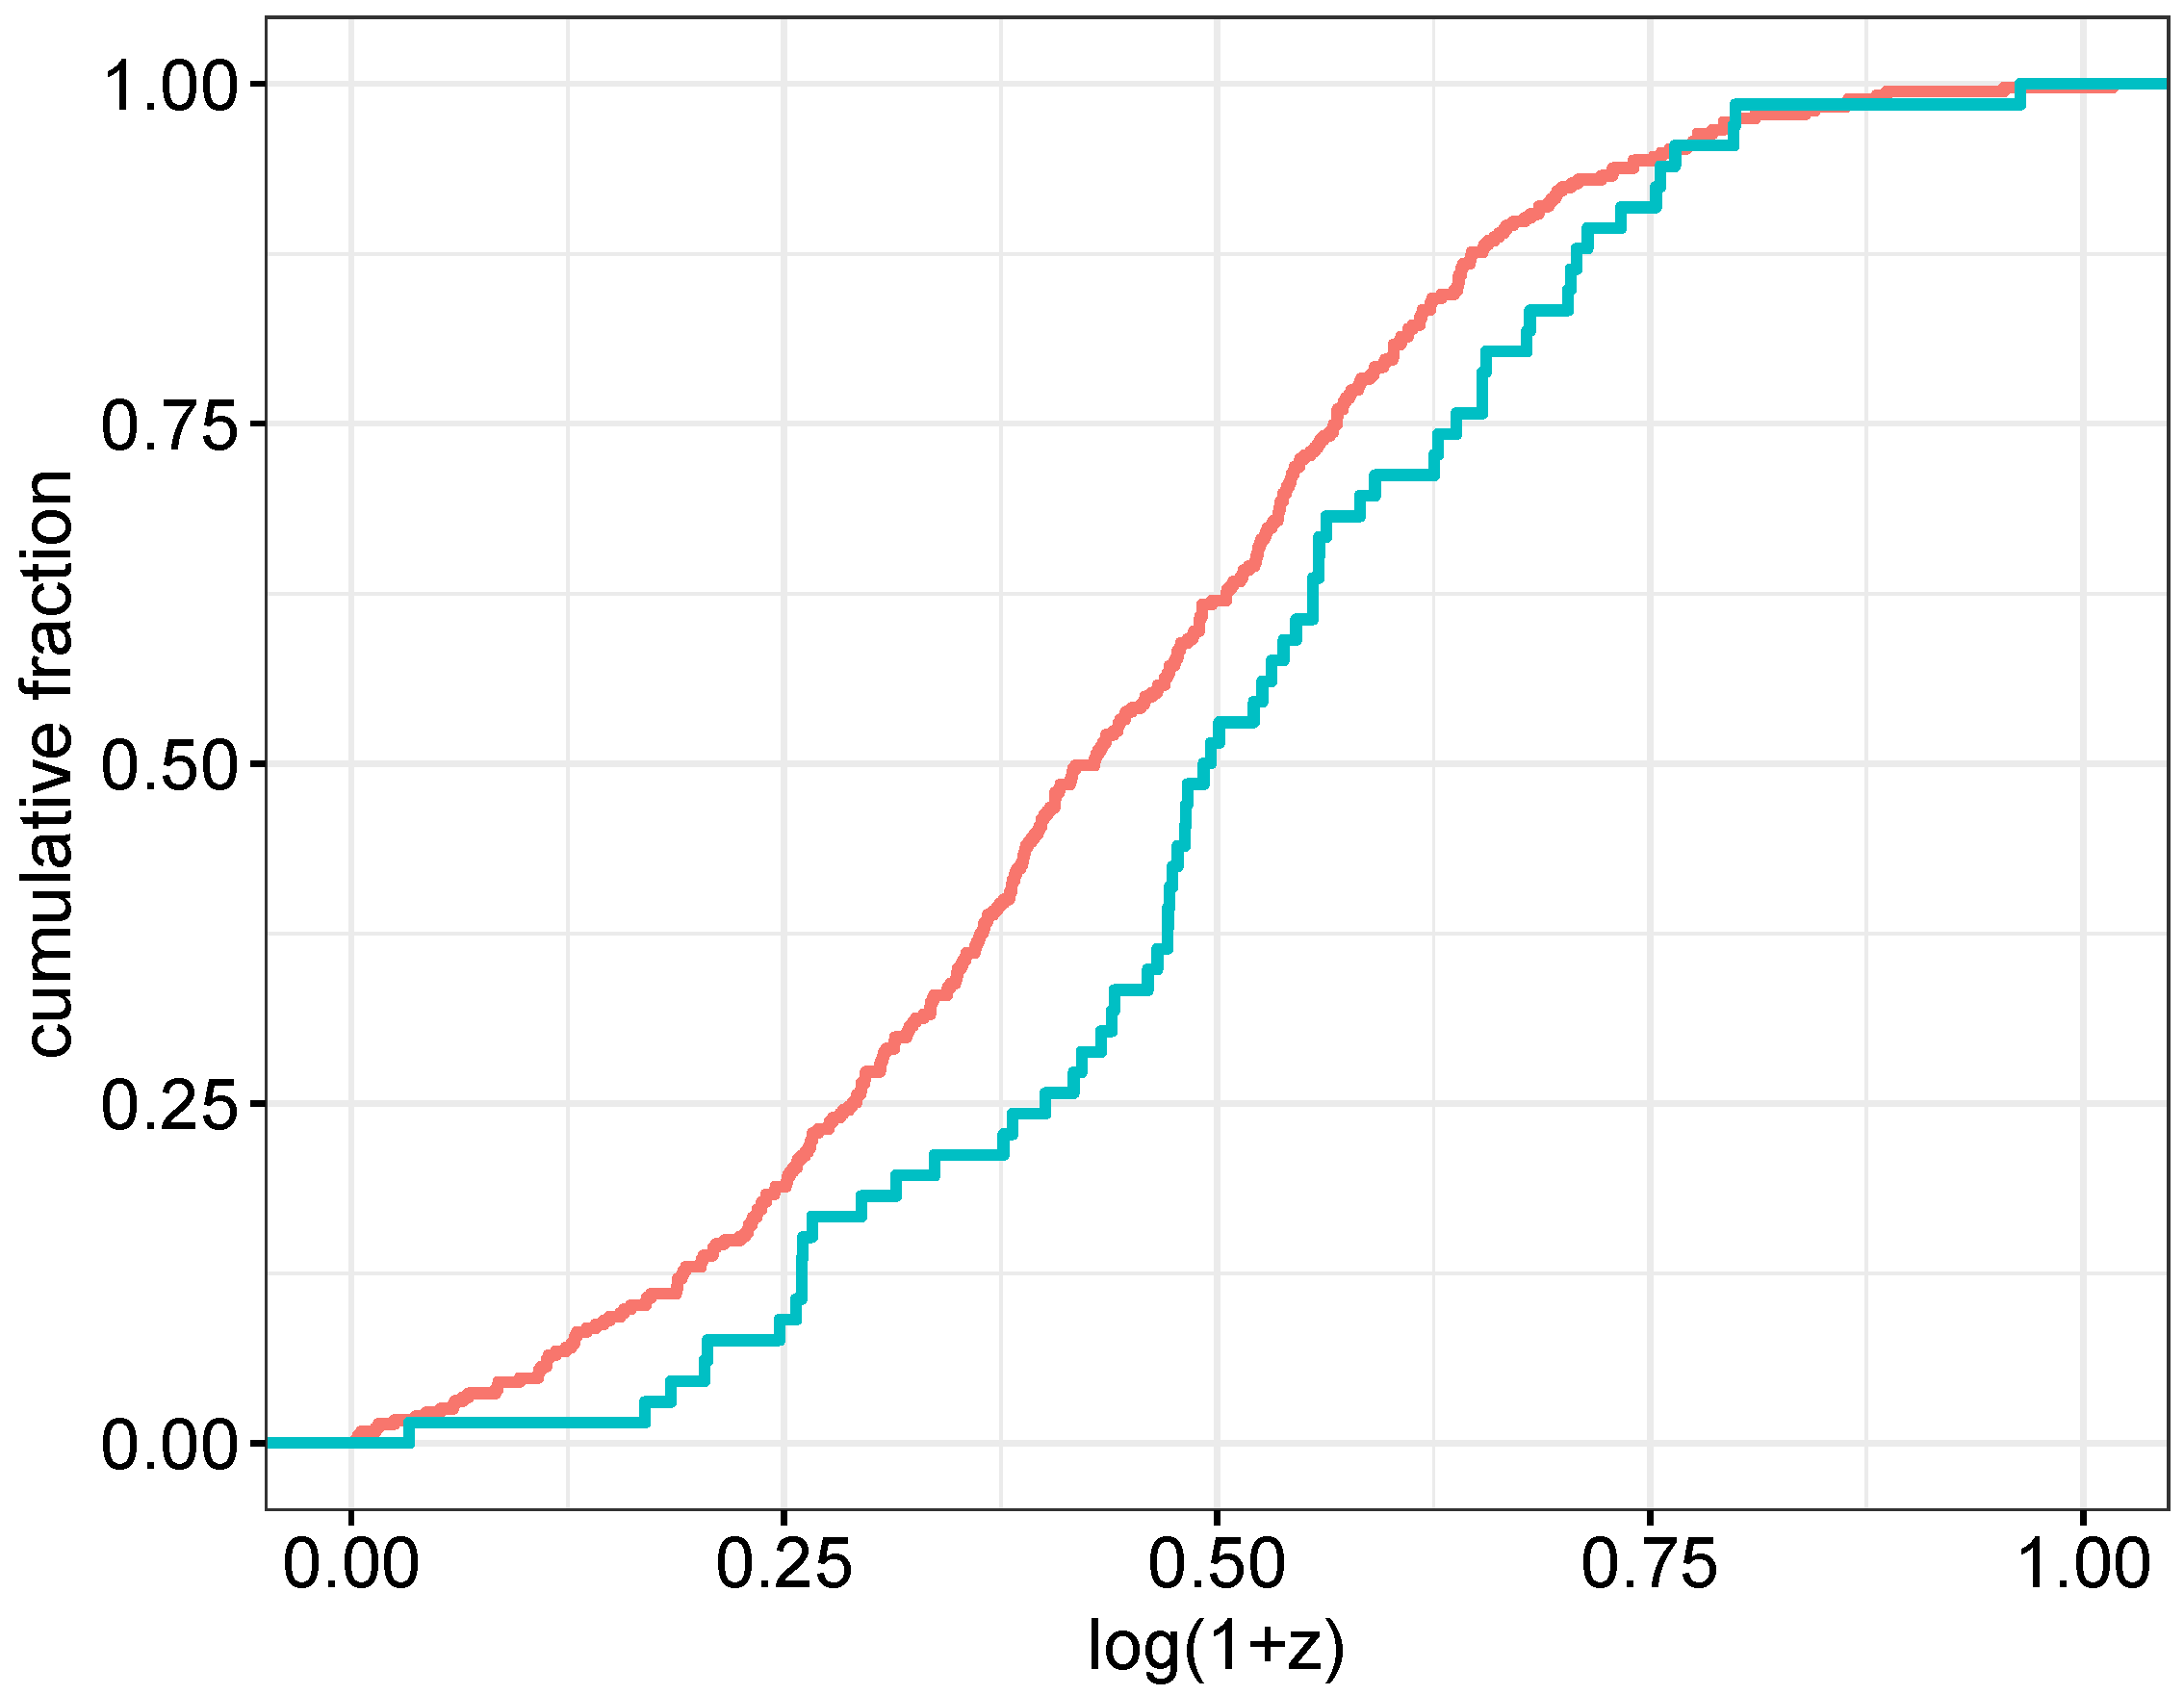
Figure 7.
Cumulative redshift distribution of AREA4 GRBs (9 s 21 s) is marked with blue. Red line is the 421 − n GRBs’ redshift distribution. These bursts tend to be farther than the others.
Figure 7.
Cumulative redshift distribution of AREA4 GRBs (9 s 21 s) is marked with blue. Red line is the 421 − n GRBs’ redshift distribution. These bursts tend to be farther than the others.

Figure 8.
The two-parameter (n, redshift) KS p value surface plot using the 421 non-short GRBs.

Figure 9.
The GRBs between (AREA5, marked with blue line) tend to be longer than the others (red line).
Figure 9.
The GRBs between (AREA5, marked with blue line) tend to be longer than the others (red line).

Figure 10.
The GRBs between (AREA6, blue line) also tend to be longer than the others (red line).

Figure 11.
The four suspicious intervals: AREA3 is blue, AREA4 is green, AREA5 is yellow and AREA6 is brown.
Figure 11.
The four suspicious intervals: AREA3 is blue, AREA4 is green, AREA5 is yellow and AREA6 is brown.

Publisher’s Note: MDPI stays neutral with regard to jurisdictional claims in published maps and institutional affiliations. |
© 2022 by the authors. Licensee MDPI, Basel, Switzerland. This article is an open access article distributed under the terms and conditions of the Creative Commons Attribution (CC BY) license (https://creativecommons.org/licenses/by/4.0/).
Share and Cite
MDPI and ACS Style
Horvath, I.; Racz, I.I.; Bagoly, Z.; Balázs, L.G.; Pinter, S. Does the GRB Duration Depend on Redshift? Universe 2022, 8, 221. https://0-doi-org.brum.beds.ac.uk/10.3390/universe8040221
AMA Style
Horvath I, Racz II, Bagoly Z, Balázs LG, Pinter S. Does the GRB Duration Depend on Redshift? Universe. 2022; 8(4):221. https://0-doi-org.brum.beds.ac.uk/10.3390/universe8040221
Chicago/Turabian StyleHorvath, Istvan, Istvan I. Racz, Zsolt Bagoly, Lajos G. Balázs, and Sandor Pinter. 2022. "Does the GRB Duration Depend on Redshift?" Universe 8, no. 4: 221. https://0-doi-org.brum.beds.ac.uk/10.3390/universe8040221
Note that from the first issue of 2016, this journal uses article numbers instead of page numbers. See further details here.