1. Introduction
Space weather effects mean, first of all, the dynamics of energetic charged particle fluxes in the different areas of near-Earth space caused by solar and geomagnetic activity. These effects include variations of energetic electron and proton fluxes of the Earth’s radiation belts, i.e., captured, quasi-captured, and precipitating, as well as short-term intense fluxes of energetic particles from powerful solar flares—solar cosmic rays (SCR).
Experiments aimed at studying energetic charged particle fluxes in near-Earth space began with the launch of the first satellites. Such measurements are made on serial satellites Electron, Proton, Molnija, Kosmos, Explorer, Injun, Telstar, IMP, OGO, Pegasus, ATS, and others. These measurements made it possible to determine the general structure of the radiation belts and to reveal the mechanisms of particle generation and loss. Based on these measurements’ empirical models of the Earth’s radiation belts were elaborated in the 1970–1980s. These models describe the spatial and energy distribution of omnidirectional proton fluxes with energies from hundreds of keV to hundreds of MeV and electrons with energies from tens of keV to ≈10 MeV in a large volume of near-Earth space, from altitudes of ≈150 km and up to geostationary and highly elliptical orbits. The most famous are the models AP8 and AE8 [
1,
2]; moreover, the models of the Earth’s radiation belt have been developed at SINP MSU [
3]. Advanced models are currently being developed, such as the AP9/AE9 model [
4], based on newer experimental data.
However, it is necessary to note that the models mentioned above are static. Particle flux variations are presented in them only by specifying the fluxes for the minimum and maximum solar activity epochs, while the corresponding flux values differ only for some energies by several times. At the same time, real charged particle fluxes in the near-Earth space, even near solar minima, can be characterized by very significant (more than 2 orders of magnitude) medium- and long-term variations associated with solar and geomagnetic activity, changes in the Earth’s magnetic field, and the density of the upper atmosphere (see, e.g., [
5,
6]). Even more significant flux changes can occur during short-term magnetospheric disturbances [
7,
8,
9,
10,
11]. In addition, energetic particles—ions, protons, and electrons—accelerated during powerful solar flares can enter the areas near Earth’s orbit [
12,
13,
14,
15,
16,
17,
18]. During such events, proton fluxes with energies of tens and hundreds of MeV can exceed the background values of galactic cosmic ray proton fluxes by 3–4 orders of magnitude or more for up to several days [
19]. Such events are even less predictable than events caused by geomagnetic disturbances. One should also take into account the possibility of the appearance in low orbits of relativistic and sub-relativistic electrons accelerated during high-altitude electromagnetic discharges. Considering such effects, the electron fluxes near the geomagnetic equator at low altitudes under the radiation belts are of special interest [
20,
21].
Thus, real energetic charged particle fluxes at satellite orbits can differ significantly from model values. For this reason, new experimental measurements are needed that can provide real-time information about the radiation environment at the various orbits of satellite operation.
At present, measurements of the energetic charged particle fluxes are carried out by a number of spacecraft. It should be noted that the NOAA geophysical observation system has been operating since the 1970s. It uses satellites of the POES series at low polar orbits [
20] and GOES at geostationary orbit (simultaneously no less than two satellites in each orbit). In 2012, two NASA spacecraft, the Van Allen probes, were launched into a highly elliptical near-equatorial orbit to study the structure and characteristics of the radiation belts. Instruments were developed by the Skobel’tsyn Institute of Nuclear Physics of Moscow State University (SINP MSU) to measure the energetic charged particle fluxes operating on Russian weather satellites of the Meteor-M (low orbit) and Electro-L (geostationary) series. There are also a number of other satellites employed, including small spacecraft of the CubeSat type that carry out such measurements.
However, practically all these spacecraft allow measurements of the energetic charged particle fluxes at very limited regions of space and a limited range of pitch angles. The most advanced, in view of detailed measurements of energetic particle fluxes at different drift shells, the Van Allen Probes project [
22,
23] does not have the goal of real-time radiation monitoring in near-Earth space. At present, the European Space Agency is developing the DSS (Distributed Space Weather Sensor System) project [
24] to create a constellation of small satellites for monitoring the energetic charged particle fluxes in the regions from low to geostationary orbits and auroras. However, this project is currently in the “zero” phase; the scientific and technical concept of measurements and segment data handling is not clear.
The above considerations and facts determine the relevance of the development of the Moscow State University project for a small satellite constellation, one of the main goals of which is real-time radiation monitoring in near-Earth space.
2. Multi Satellite Experiment for Real Time Radiation Monitoring in the Near-Earth Space
The most effective system of real-time radiation monitoring can be realized on the basis of a multi-satellite constellation, including ultra-small satellites of the CubeSat type. The proposed project of Moscow State University suggests monitoring radiation in near-Earth space. For this, it is proposed to use real-time data from measurements of charged particle and gamma-ray fluxes, as well as the results of observations of electromagnetic transients from the Earth’s atmosphere by means of spacecraft constellations simultaneously operating in orbits, covering both low-latitude and high-latitude regions of near-Earth space. It is also planned to develop an interactive model for calculating radiation fields in the near-Earth space based on measurements of radiation fluxes in near-Earth space obtained from measurements of satellite constellations, taking into account solar and geomagnetic activity. As a result, an operational monitoring system will be realized for the first time to monitor the adverse dynamics of the radiation situation in near-Earth space and at altitudes of aircraft.
The multi-satellite project of Moscow University is described in detail in [
25,
26,
27]. Within the framework of this project, it is planned to launch several small spacecraft of various types into near-Earth orbits, crossing drift shells in a large range of McIllwine parameter
L. By this, one, the base satellite with a payload mass of 100–150 kg can be used in addition to radiation monitoring to monitor other potentially dangerous space phenomena, such as electromagnetic transients of atmospheric and astrophysical origin and dangerous bodies in the vicinity of the Earth of natural (asteroids, large meteoroids) and artificial (space debris) origin. Nanosatellites, including the CubeSat type, can also be used to implement real-time radiation monitoring. This program began with the launch of such a spacecraft.
2.1. Instrument Concept
Instruments for radiation monitoring should include a spectrometer of protons with energies from 2 up to >160 MeV and electrons with energies of 0.15–10 MeV. Its main element is the assembly as a telescope, including a few semiconductor (silicon) detectors with different thicknesses and scintillator detectors, which are placed coaxially. To measure the pitch-angle distribution and omnidirectional fluxes, several telescopes with differently oriented axes will be used. We also discuss the instrument arrangement, in which the axes of four telescopes lie in the magnetic meridian plane, and the axis of another telescope is normal to this plane. In the case of polar orbit, it means that the axis of four telescopes should lie in the orbital plane.
The payload should also include a three-component magnetometer.
The parameters of the spacecraft orbits on which instruments for radiation monitoring will be installed should provide coverage of the entire spatial volume of the observed radiation captured in a magnetic field, i.e., radiation belts. In this case, measurements of omnidirectional fluxes of captured particles should be provided, followed by model interpolation and extrapolation of the measured fluxes to the entire area of radiation belts. Such measurements will allow us to calculate the current distribution of particle fluxes in a large volume of radiation belts, and, as a result, the real-time levels of radiation doses for a wide range of operating orbits will be derived.
Therefore, in the frame of the mission, several spectrometers of protons and electrons installed on the satellites launched into the special orbits should measure fluxes that allow the prediction of the current energetic charged particle distribution in the large volume of radiation belts up to geostationary orbit. As a sequence, current values of radiation loads can be operatively estimated for a wide range of satellite orbits.
An important addition to the space monitoring system will be a fully automated ground-based satellite data operational analysis system developed at Moscow State University, designed to evaluate and predict radiation conditions in near-Earth space in real-time.
For the first stage of multi-satellite project realization, a special instrument for space radiation monitoring was elaborated. It is the so-called DéCoR (Detector of Cosmic Radiation) instrument. It allows the detection of charged particles and gamma quanta in the energy release range of 0.1–2.0 MeV. A detailed description of the DeCoR instrument is given in [
28,
29]. It consists of a detector unit and electronic plates mounted inside the CubeSat satellite body. The detector unit is a CsI(Tl)/plastic scintillator phoswich viewed by two PMT. The detector’s sensitive area is about 18 cm
2, and the geometric factor is about 50 cm
2sr.
The instrument provides separate detection of events in the plastic scintillator and crystal CsI(Tl). In this case, it is possible to realize instrument operation in the so-called event-by-event mode, when information is recorded about the energy released in both scintillators and the time of detection of each particle or quantum that enters the instrument. From this event-by-event recording, a monitor mode is also implemented, in which, for a given time interval, usually 1 s, the number of detected events in each scintillator, as well as the total count, is determined. Thus, time sets of counting rates in a plastic scintillator, i.e., mainly electrons with energies of over 300 keV, and in a CsI(Tl) crystal, i.e., predominantly gamma quanta with energies of over 100 keV, are obtained. Such monitoring data are regularly transmitted to Earth during the experiment. After viewing monitor data, the researcher identifies the time points at which the flow variations of interest actually occurred. For these moments, detailed data are requested for transmission to Earth.
2.2. The First Stage of Moscow University Multi-Satellite Project Realization
The first stage of the Moscow University multi-satellite project realization began to be implemented on 5 July 2019 after a successful launch from the Vostochny cosmodrome of three Russian nanosatellites of the CubeSat 3U type (SOCRAT, AmurSat, and VDNH-80). In particular, scintillation phoswich detectors DeCoR were installed on two satellites (AmurSat, VDNH-80). Moreover, CubeSats of 6U format (DEKART, Norbi) and CubeSats of 1.5 U format (Yarilo-2) were launched as an associated payload from the cosmodrome Plesetsk on 28 September 2020. The Norbi satellite was elaborated by Novosibirsk State University, and the CubeSat Yarilo-2 was elaborated by Bauman Moscow State Technical University. These three CubeSats are equipped with the same type of DeCoR instruments for monitoring cosmic radiation. The delay between the reception of information from satellites by the ground telemetry receiving station (located in Novosibirsk for Norby and in Kaluga for the rest of the satellites) and the appearance of experimental data at the SINP data center is about 0.5–1 day.
All launched satellites operate in polar solar-synchronous orbits with an altitude of about 550 km and an inclination of about 98°. This provides favorable conditions for monitoring space radiation in various areas of near-Earth space, including zones of captured radiation, areas of precipitation, polar caps, and near-equatorial regions. Thus, for the first time, a unique multi-satellite constellation has been implemented, which makes it possible to carry out simultaneous measurements of particle and gamma quantum fluxes using identical instruments at different points in near-Earth space. Such measurements provide unique information about the dynamics of sub-relativistic electron fluxes in near-Earth space. In particular, information about the nature of short-term (with characteristic times of the order of 1 ms) electron flux variations, including those caused by precipitating and quasi-trapped electrons, can be obtained. In addition to the applied aspects related to the problem of space weather monitoring, such measurements will provide important data necessary for understanding the mechanisms of acceleration and loss of trapped and quasi-trapped electrons.
The results of the flight operation of the CubeSat nanosatellite constellation showed that it is a tool that allows getting a current picture and a predictive estimation of radiation conditions in a large area of near-Earth space. The study of fast variations of electron fluxes in the areas of precipitation and the slot between radiation belts, as well as the study of the dynamics of particle fluxes and gamma rays at low orbits with dependence on geomagnetic conditions, are made. An important factor that allows more efficient scientific research is the installation of instruments on two satellites, sequentially flying through the same region of near-Earth space.
Of course, observations with a small number of nanosatellites cannot substitute the results from the other major missions; however, they can add and perhaps provide more data, which may be not necessarily accurate, but qualitative and certainly at drastically less cost. In this article, we present an example of space weather research performed with minimal resources and show how the small CubeSat constellation can detect space weather events of a certain type, such as flux variations of sub-relativistic electrons in the outer radiation belt during geomagnetic disturbances, the appearance of intense solar proton and electron fluxes in the polar caps after solar flares, as well as fluxes of energetic electrons in the geomagnetic equator regions at small altitudes below the radiation belts.
3. Variations of Electron Fluxes in the Outer Radiation Belt during Geomagnetic Disturbances
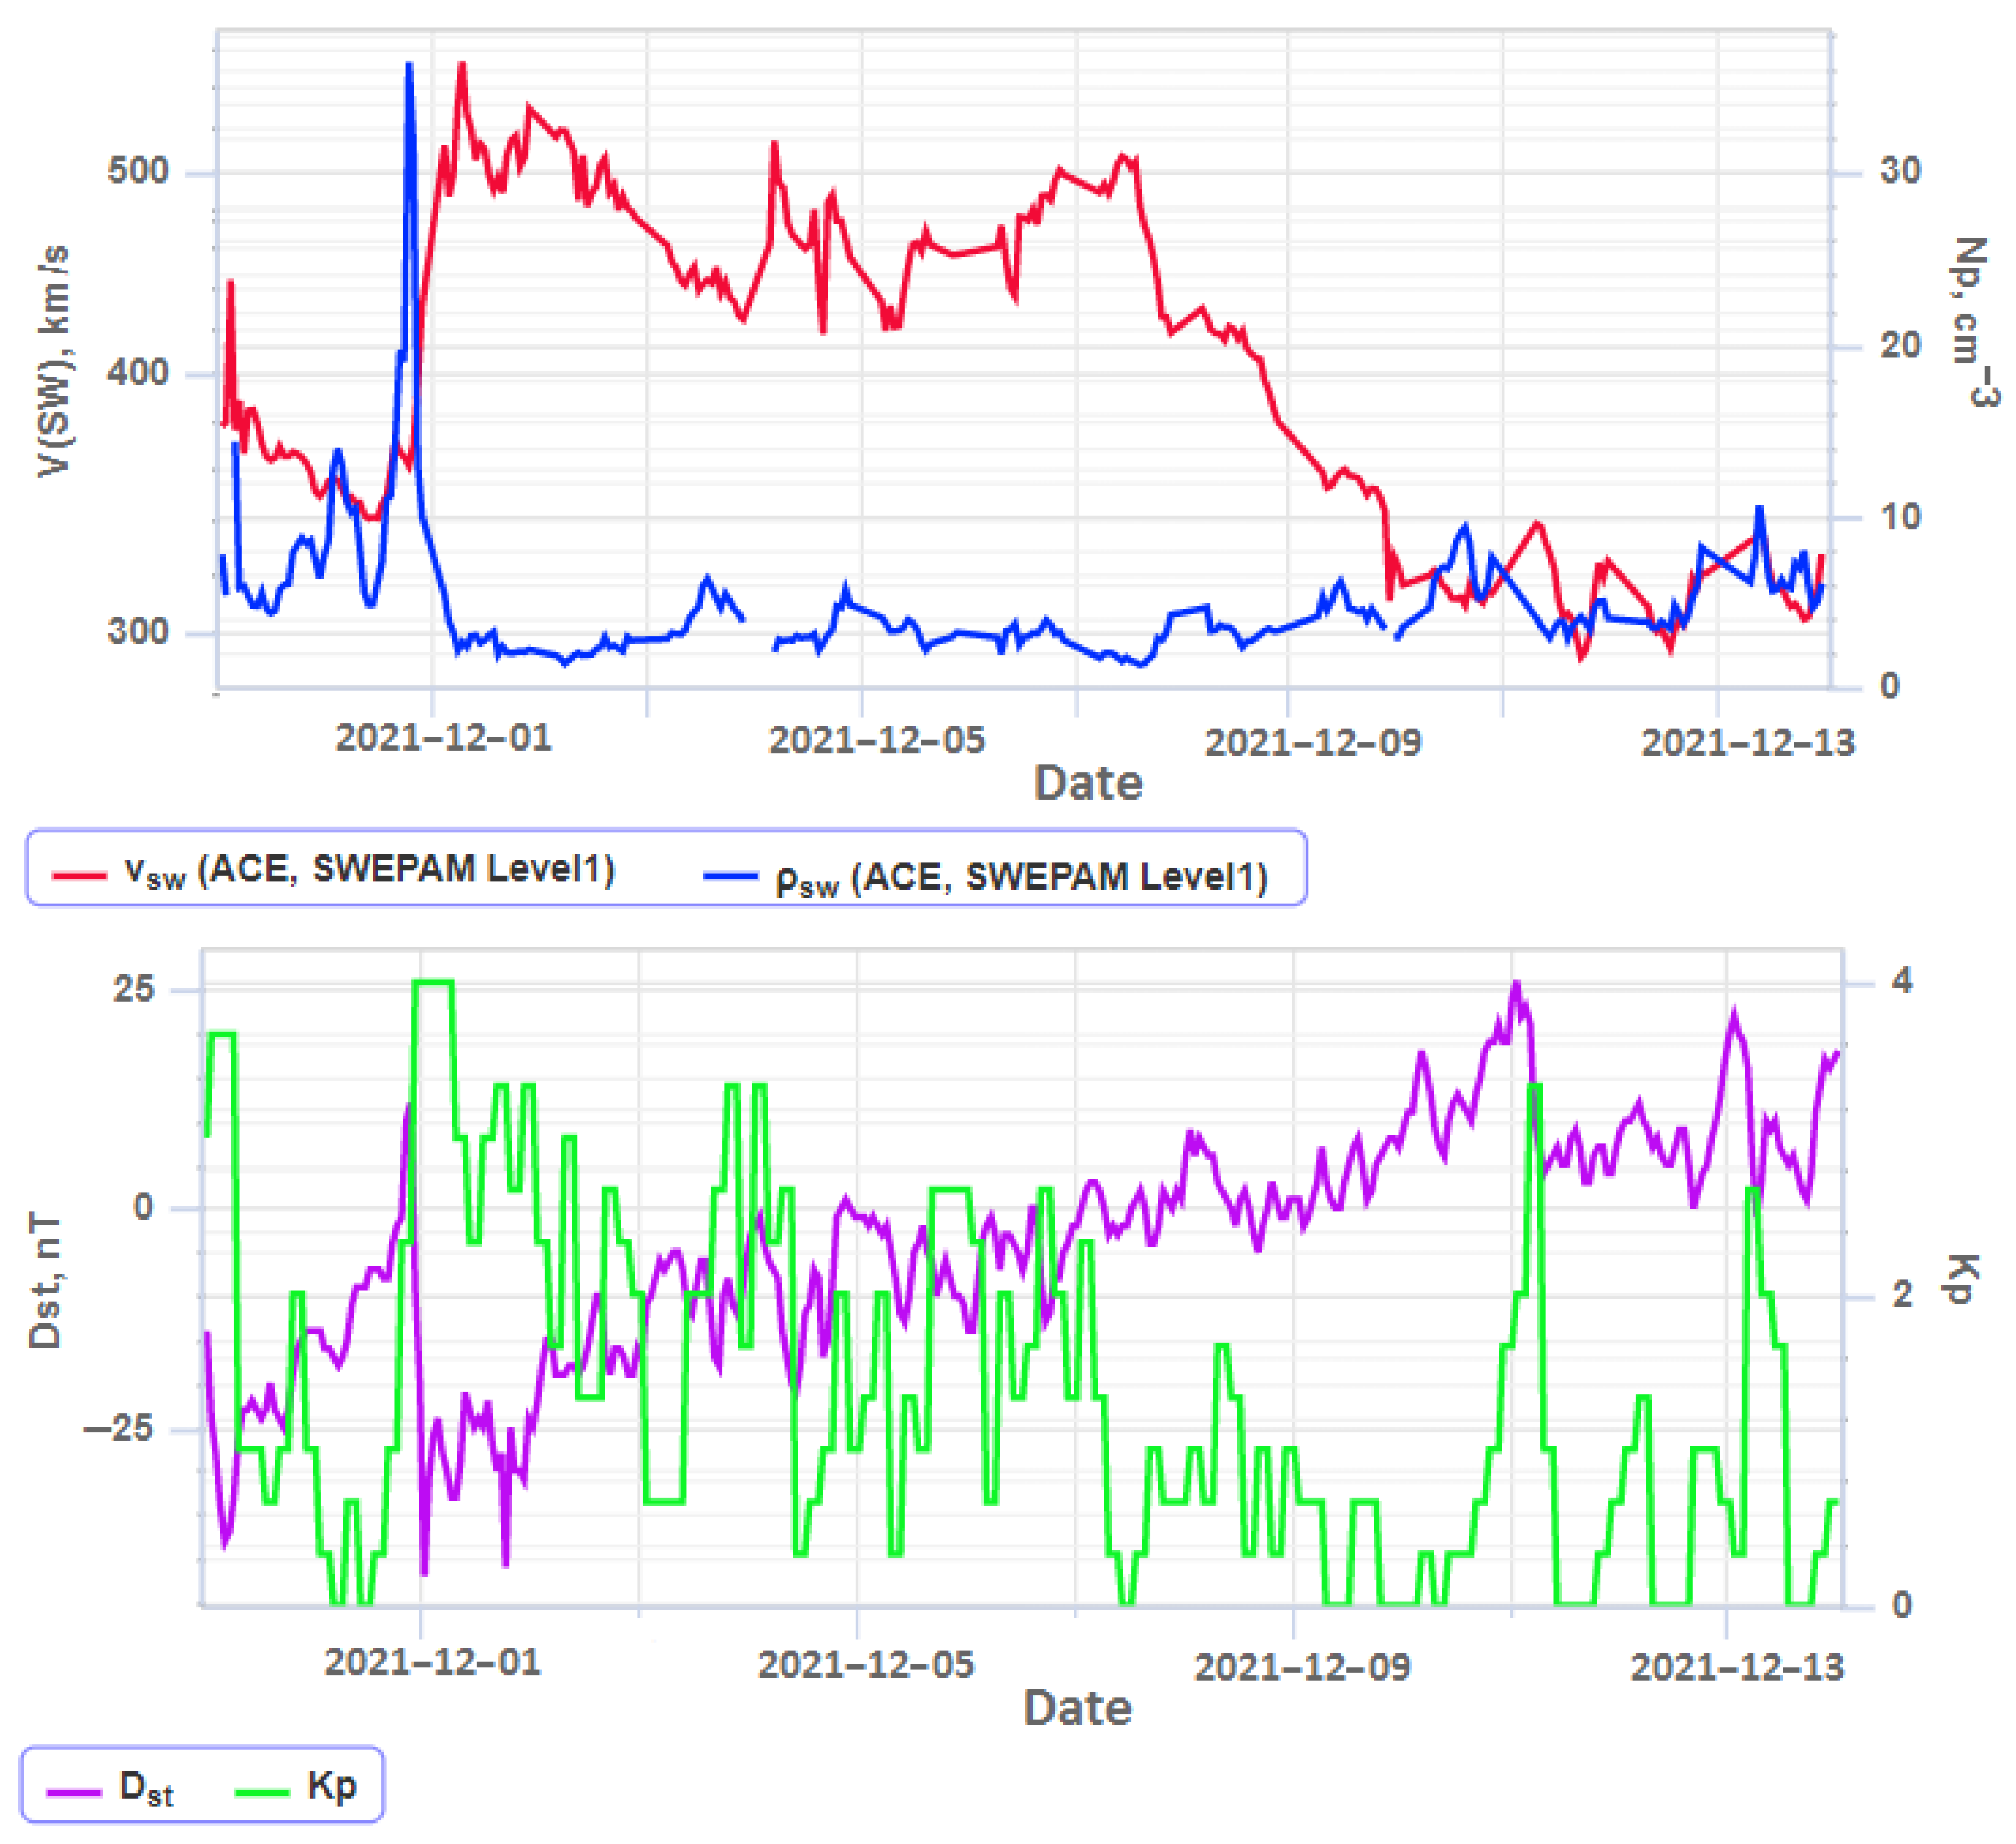
The moderate geomagnetic activity was observed at the beginning of December 2021. As it can be seen from
Figure 1, in which time courses of
Kp,
Dst, as well as solar wind velocity
vSW and density
ρSW are presented, the moderate magnetic storm occurred on 1 December 2021. During this time,
Kp index reached values of about 4 while the
Dst variation was about −50 nT. Approximately at the same time, the solar wind velocity increased to ~600 km/s, and somewhat earlier, an increase in the solar wind density was observed, which indicates the arrival of a shock wave, which actually inspired the magnetic storm.
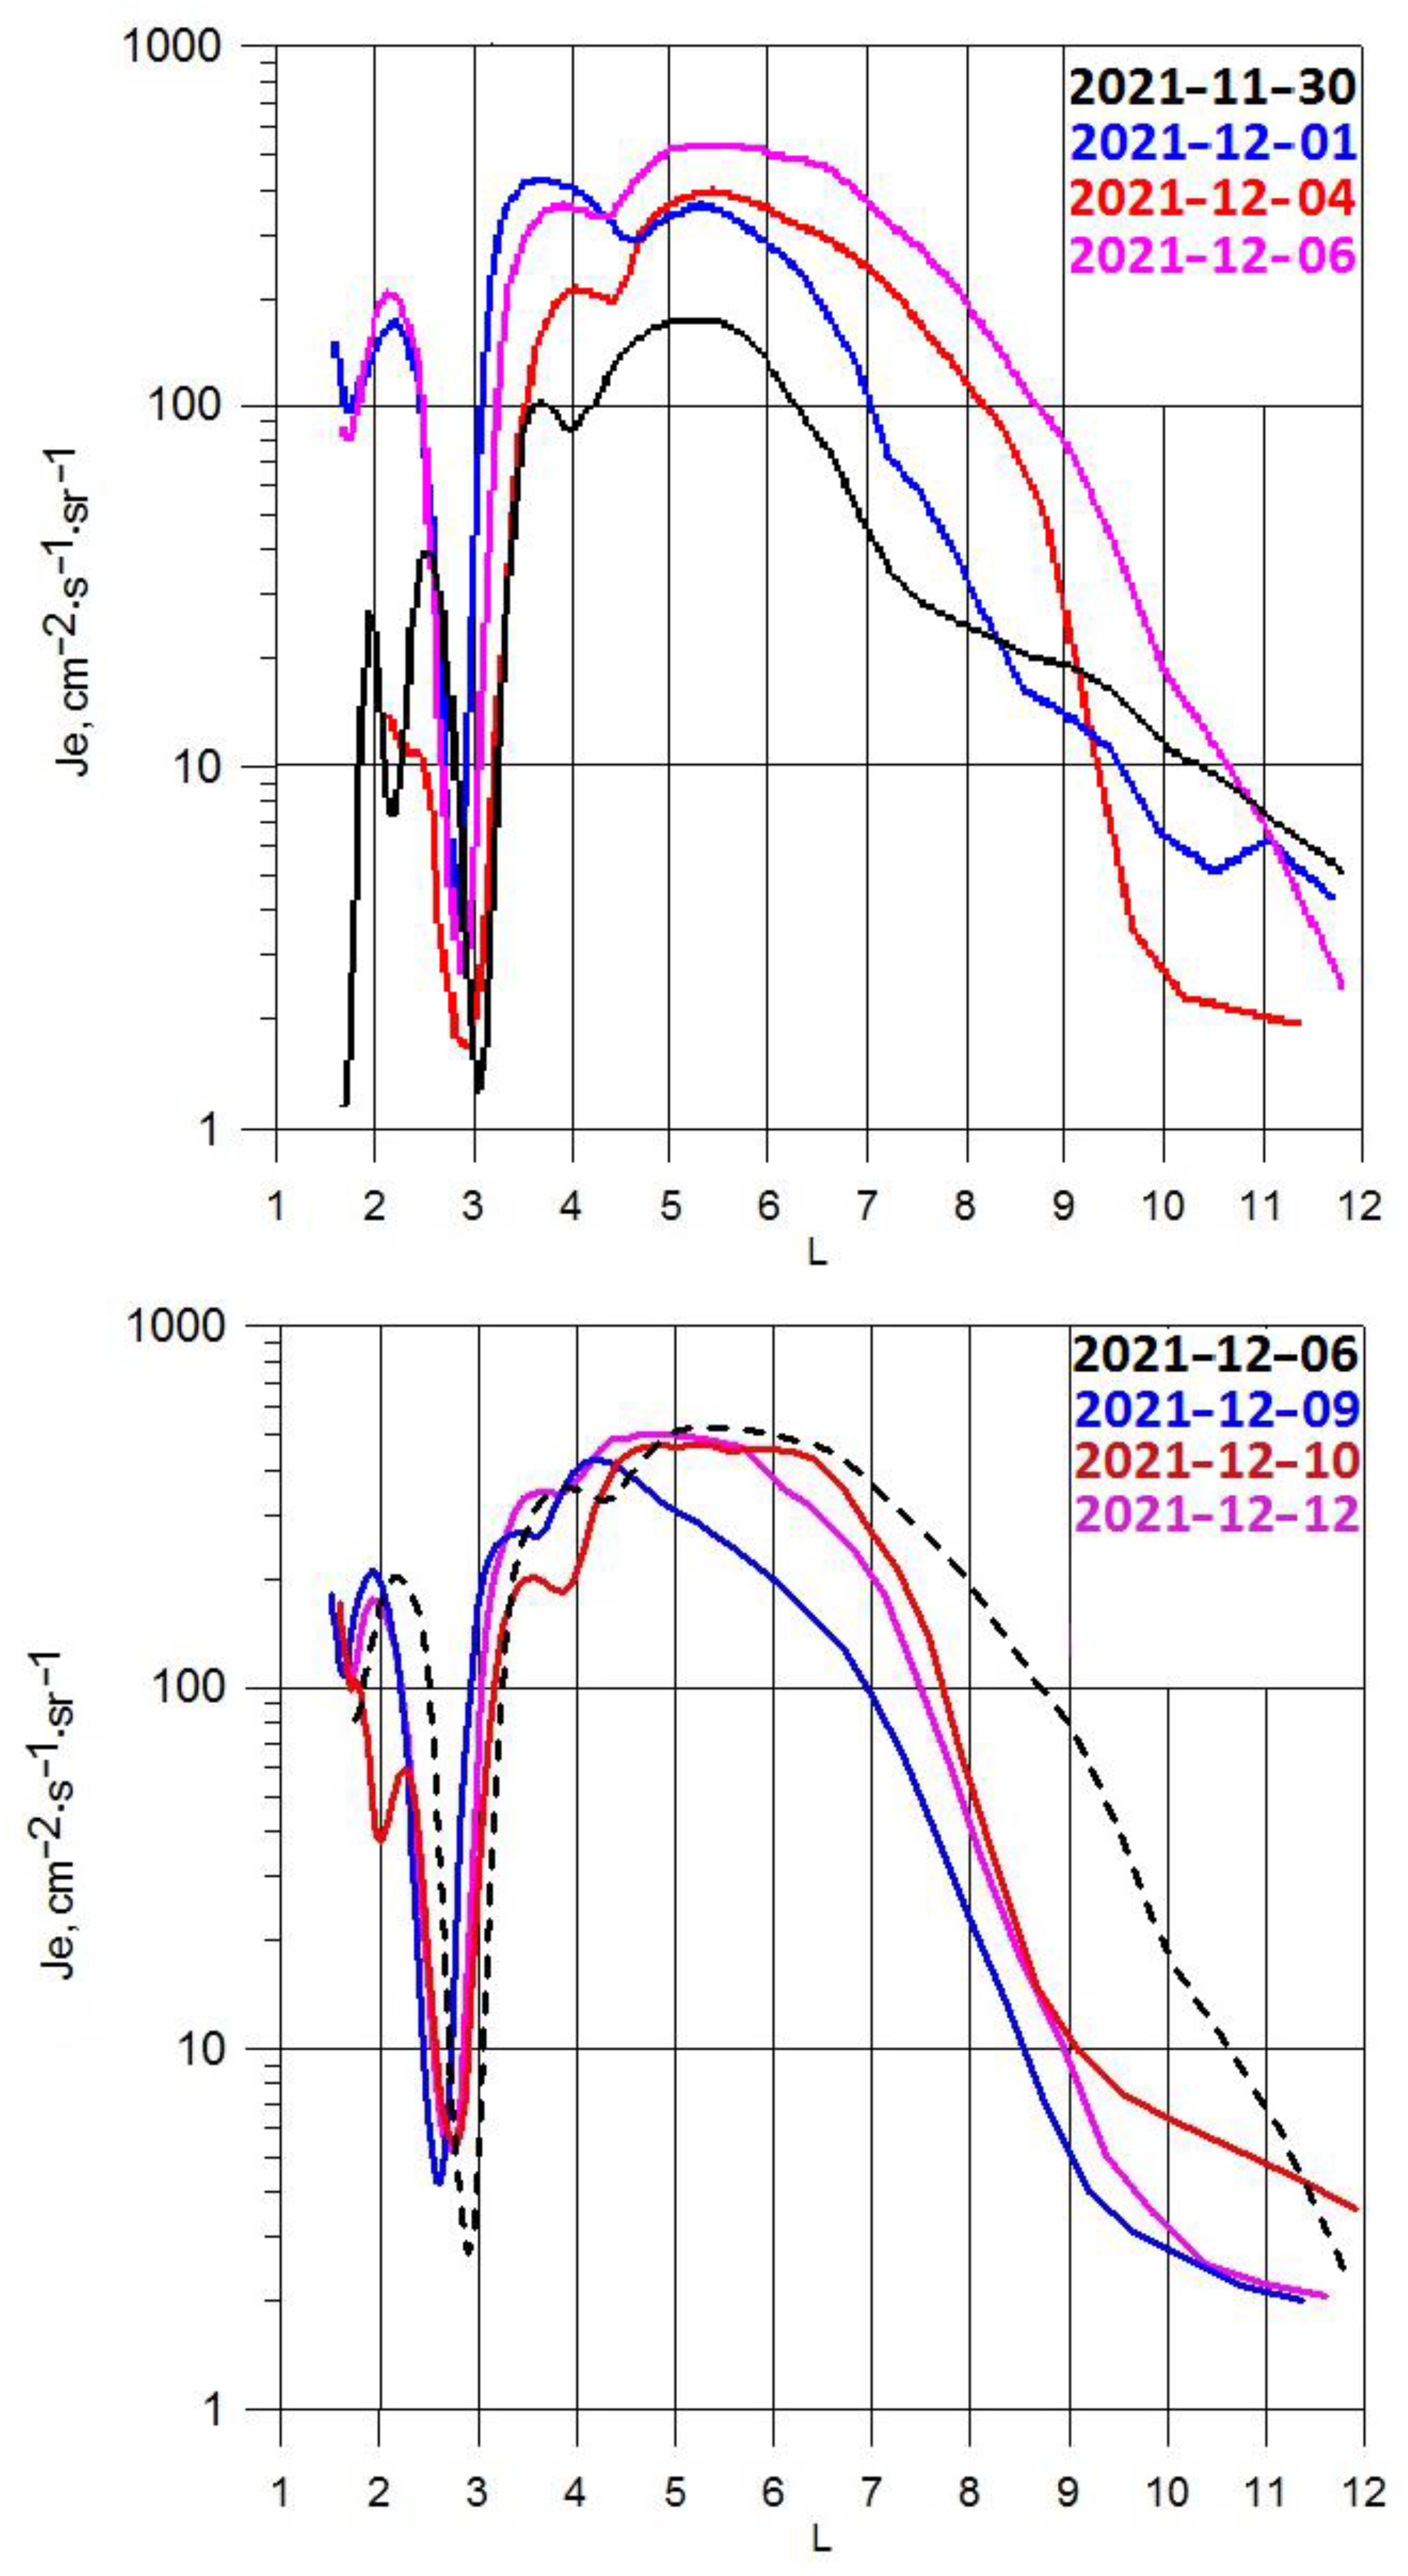
The outer belt electron flux variations on different L-shells before, during, and after the magnetic storm are illustrated by curves in
Figure 2. There we can see the dependence of electron fluxes
Je on drift shell number (McIllwine parameter)
L. The
Je values were obtained from count rates of electrons with energies more than 300 keV. There are counting rates of events detected in the plastic scintillator of the DeCoR instrument divided by its geometry factor. We use here the data from the DeCoR instrument installed on the DECART nanosatellite.
As can be seen from the figure, the sub-relativistic electron flux in the outer radiation belt increases more than three times after the magnetic storm begins. This increase is approximately equal for all L values typical for the outer belt, i.e., from about 3.5 to 7. At the recovery phase, a slow flux increases near the maximum in L (L ~ 5–6) is observed, and some expansion of the belt edges also takes place, i.e., the inner edge shifts to L ~ 3, and the outer edge—up to ~9–10. By this, the fluxes near the inner edge of the belt possess irregular variations, i.e., first there is a decrease in the flux magnitude (see 4 December 2021), and then a gradual increase. After the recovery phase and the transition to a geo-magnetically quiet state, the electron flux inside the belt did not change much on average, but some compression of the outer edge was observed almost to the initial value of L ~ 7.
4. Solar Energetic Particle Injection into Polar Cap
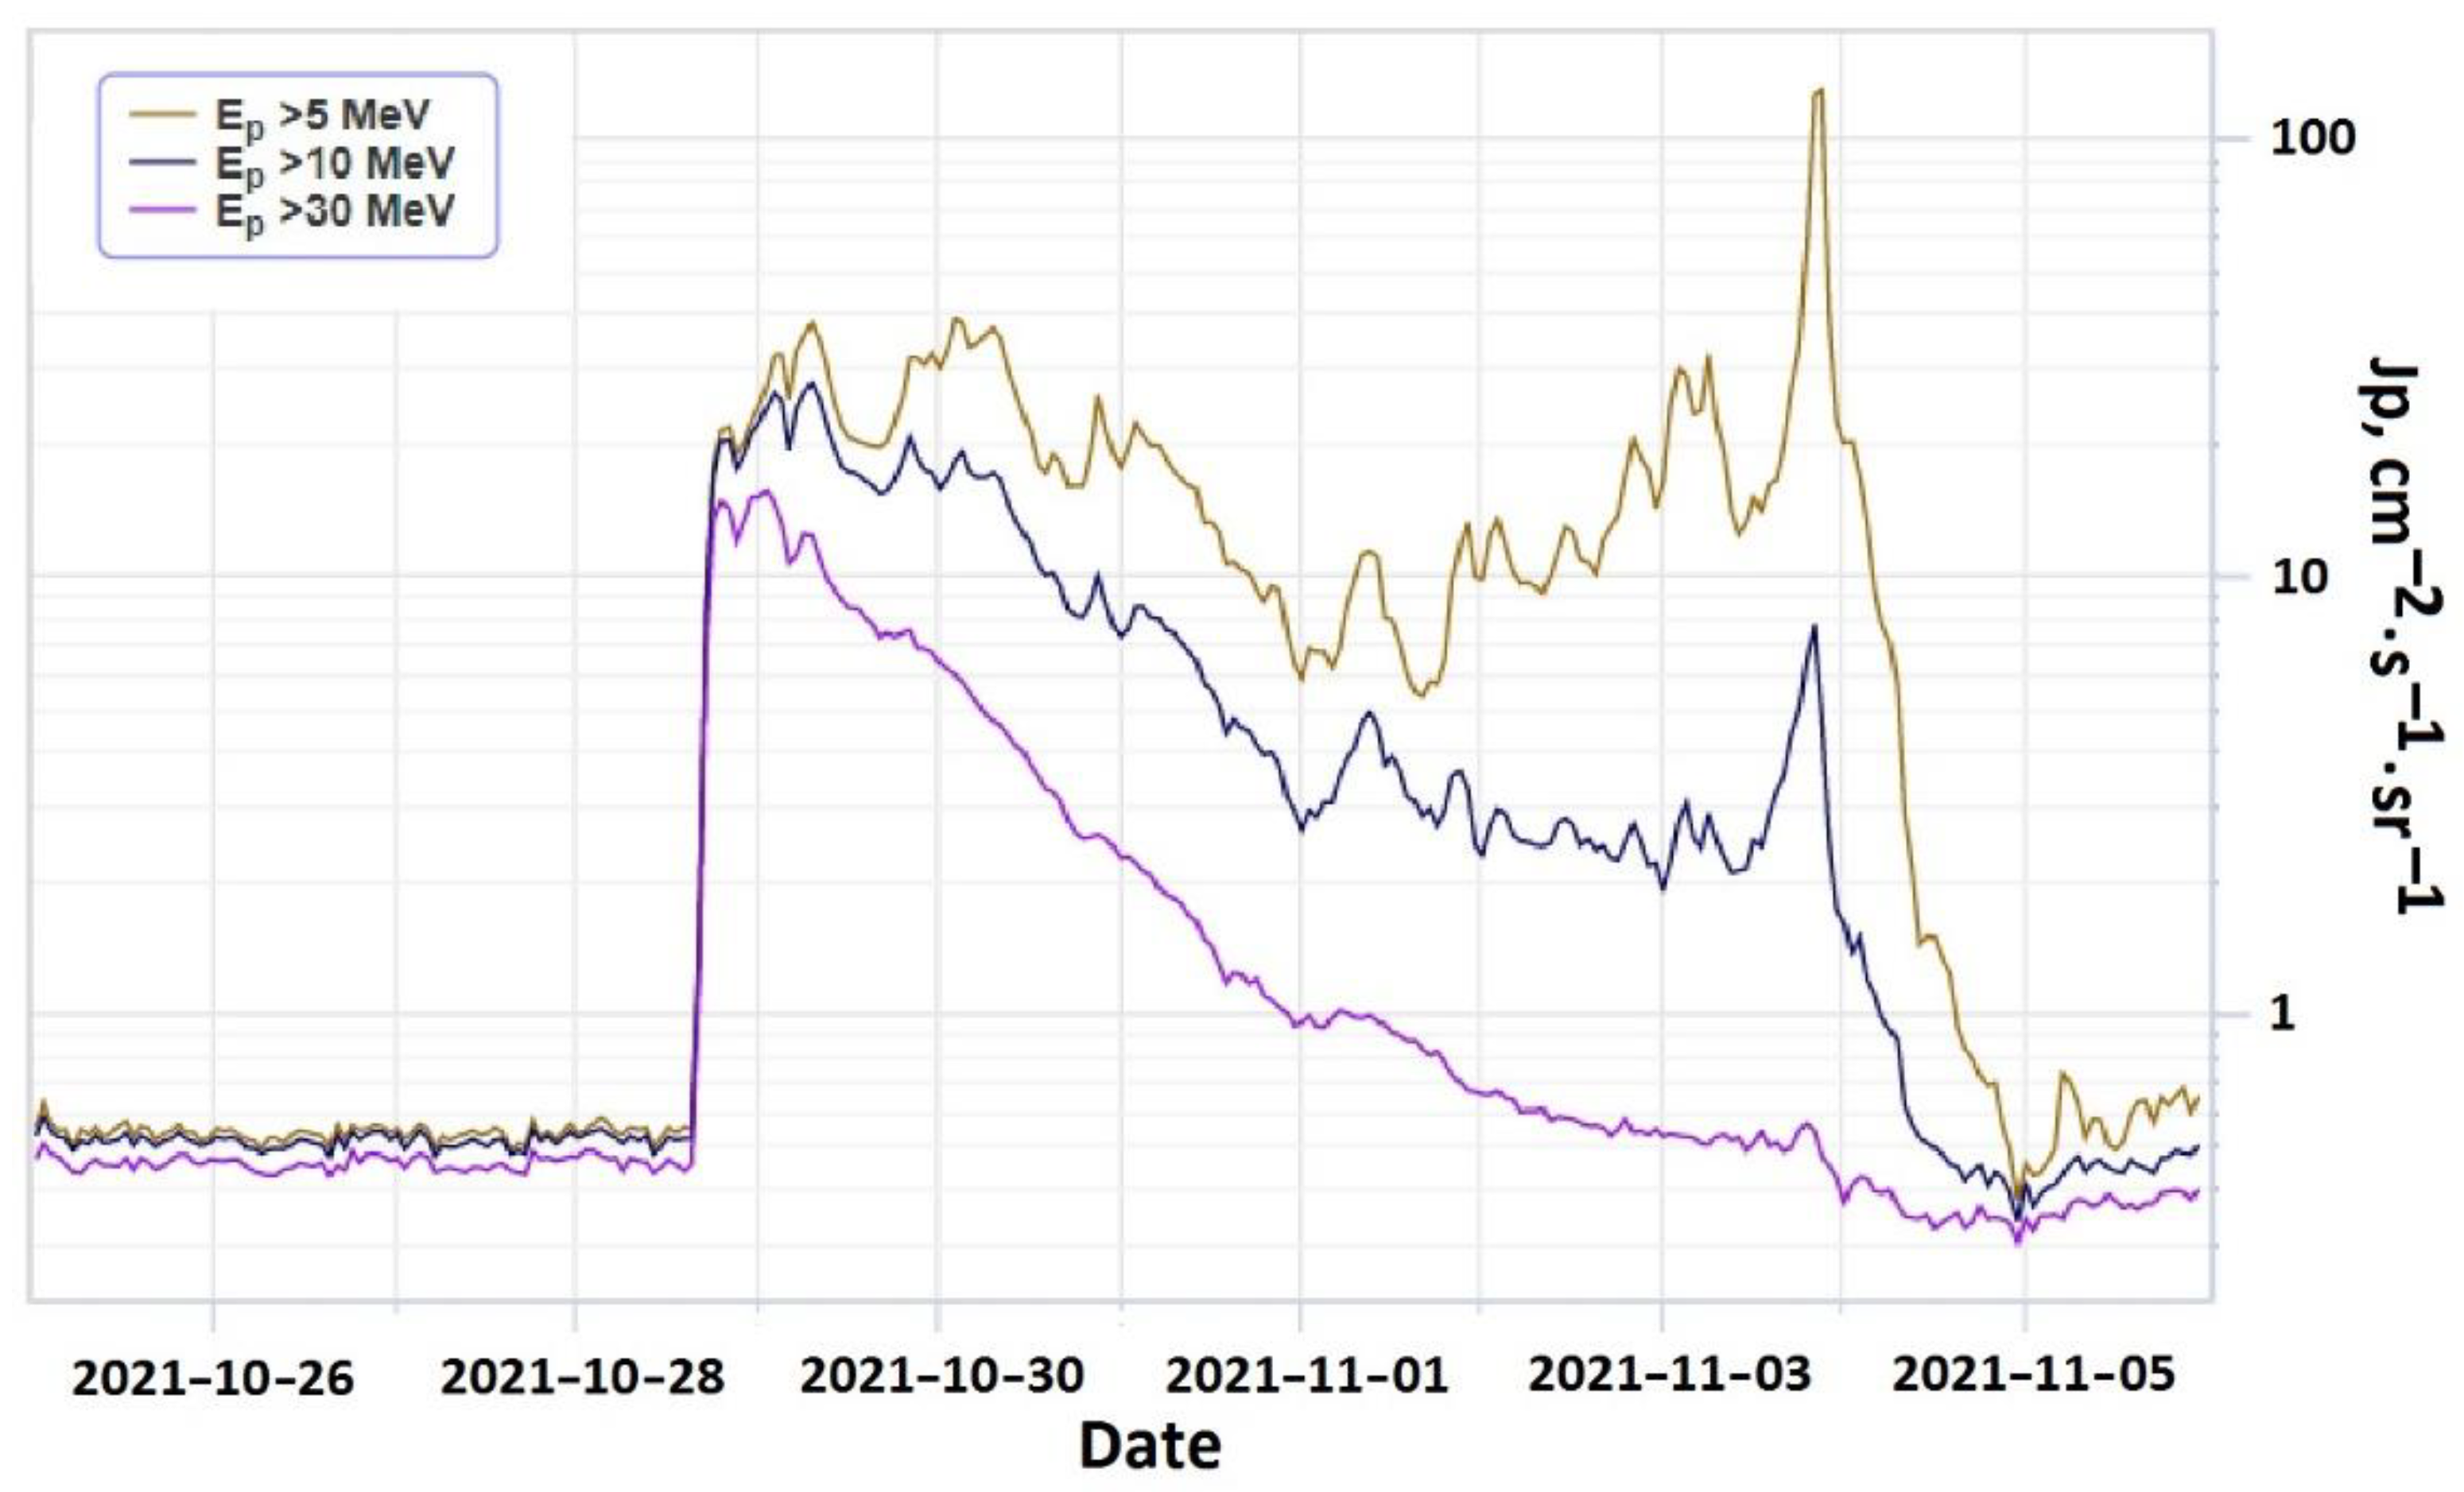
A rather intensive solar flare of an X1.0 class occurred on 28 October 2021 at 15:17 UTC in the active region AR12887, located near the center of the solar disk, AR coordinates S28W01. It led to an acceleration of charged particles, i.e., protons and electrons. Charged particle counters onboard GOES satellites were detected on 28 October 2021, increasing fluxes of protons in a wide energy range (see
Figure 3), while the electron detector onboard ACE satellite—increasing sub-relativistic electron flux. As could be seen from
Figure 3, the second increase in the solar cosmic ray (SCR) flux was observed on 1 November 2021. It was associated with an M1.5 class flare that occurred on 1 November at 01:45 UTC, also in AR12887. A day later, on 2 November, a long-term flare again (M1.7 class) occurred in AR12887, with which a coronal mass ejection (CME) was associated. This CME turned out to be the so-called “cannibal”, absorbing slower CMEs from previous flares. This CME may additionally accelerate SCR protons and electrons. As a result, a short increase in SCR fluxes was observed around midnight from 3 to 4 November, both according to the ACE and GOES data.
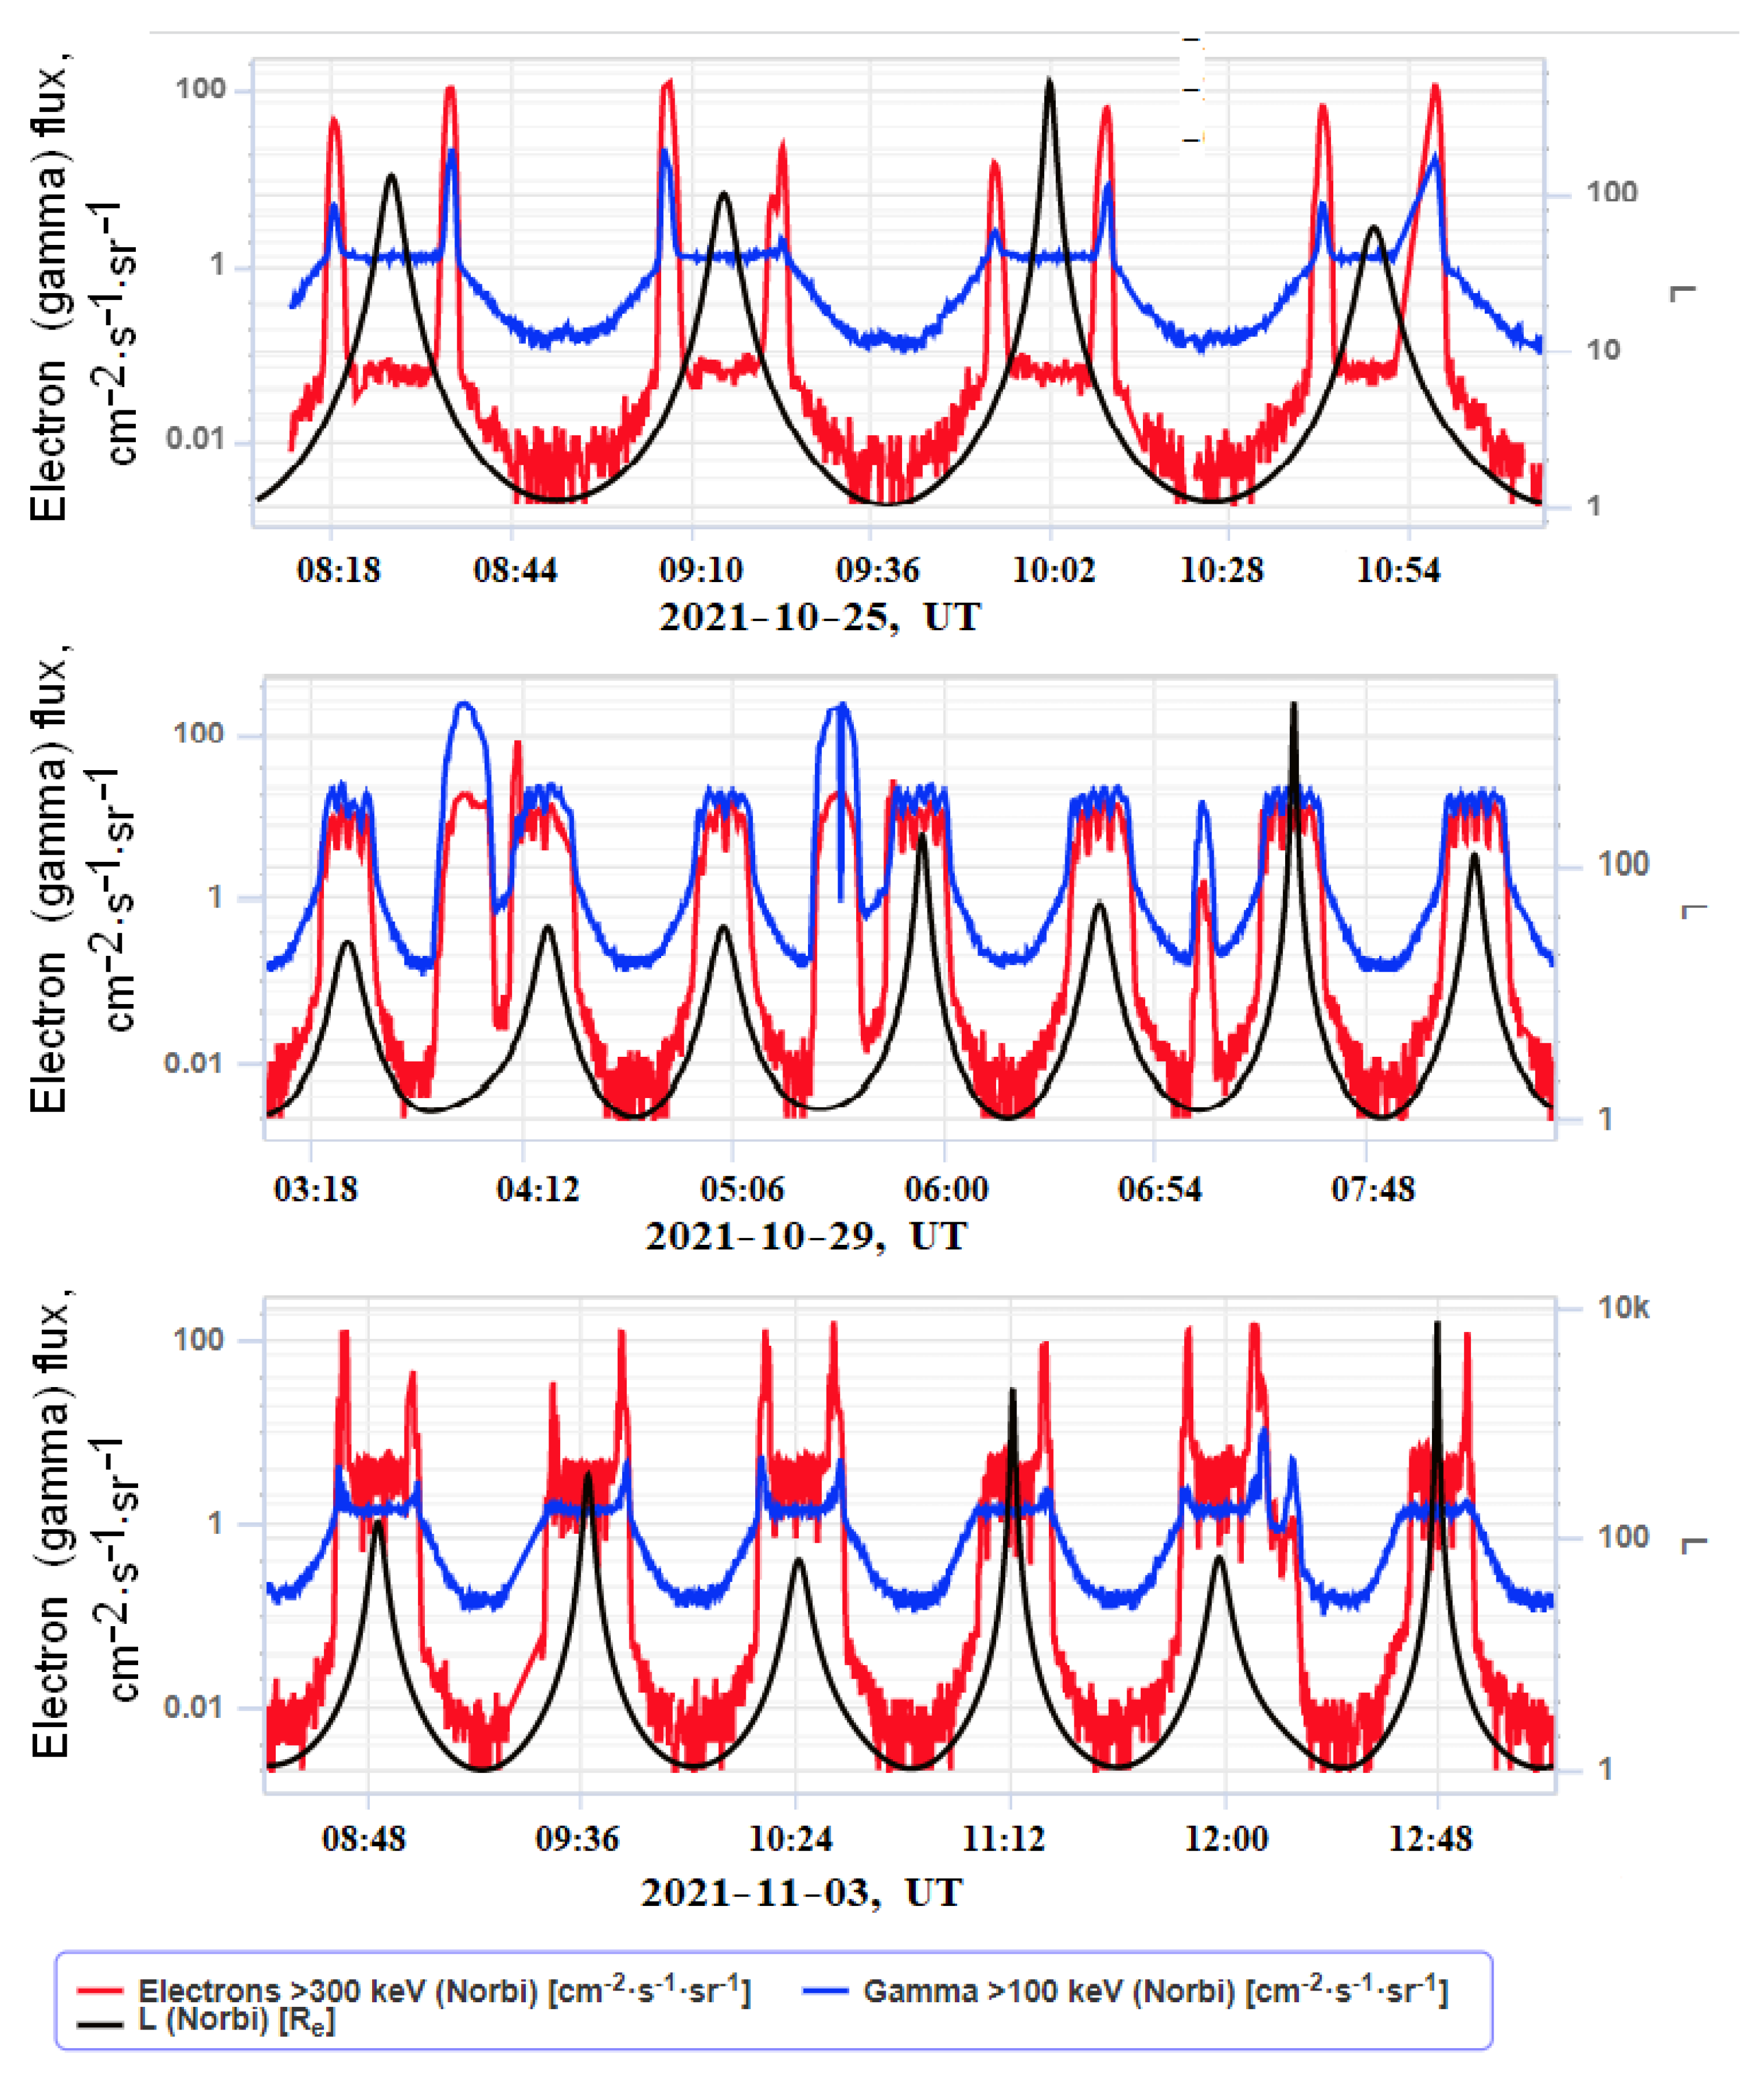
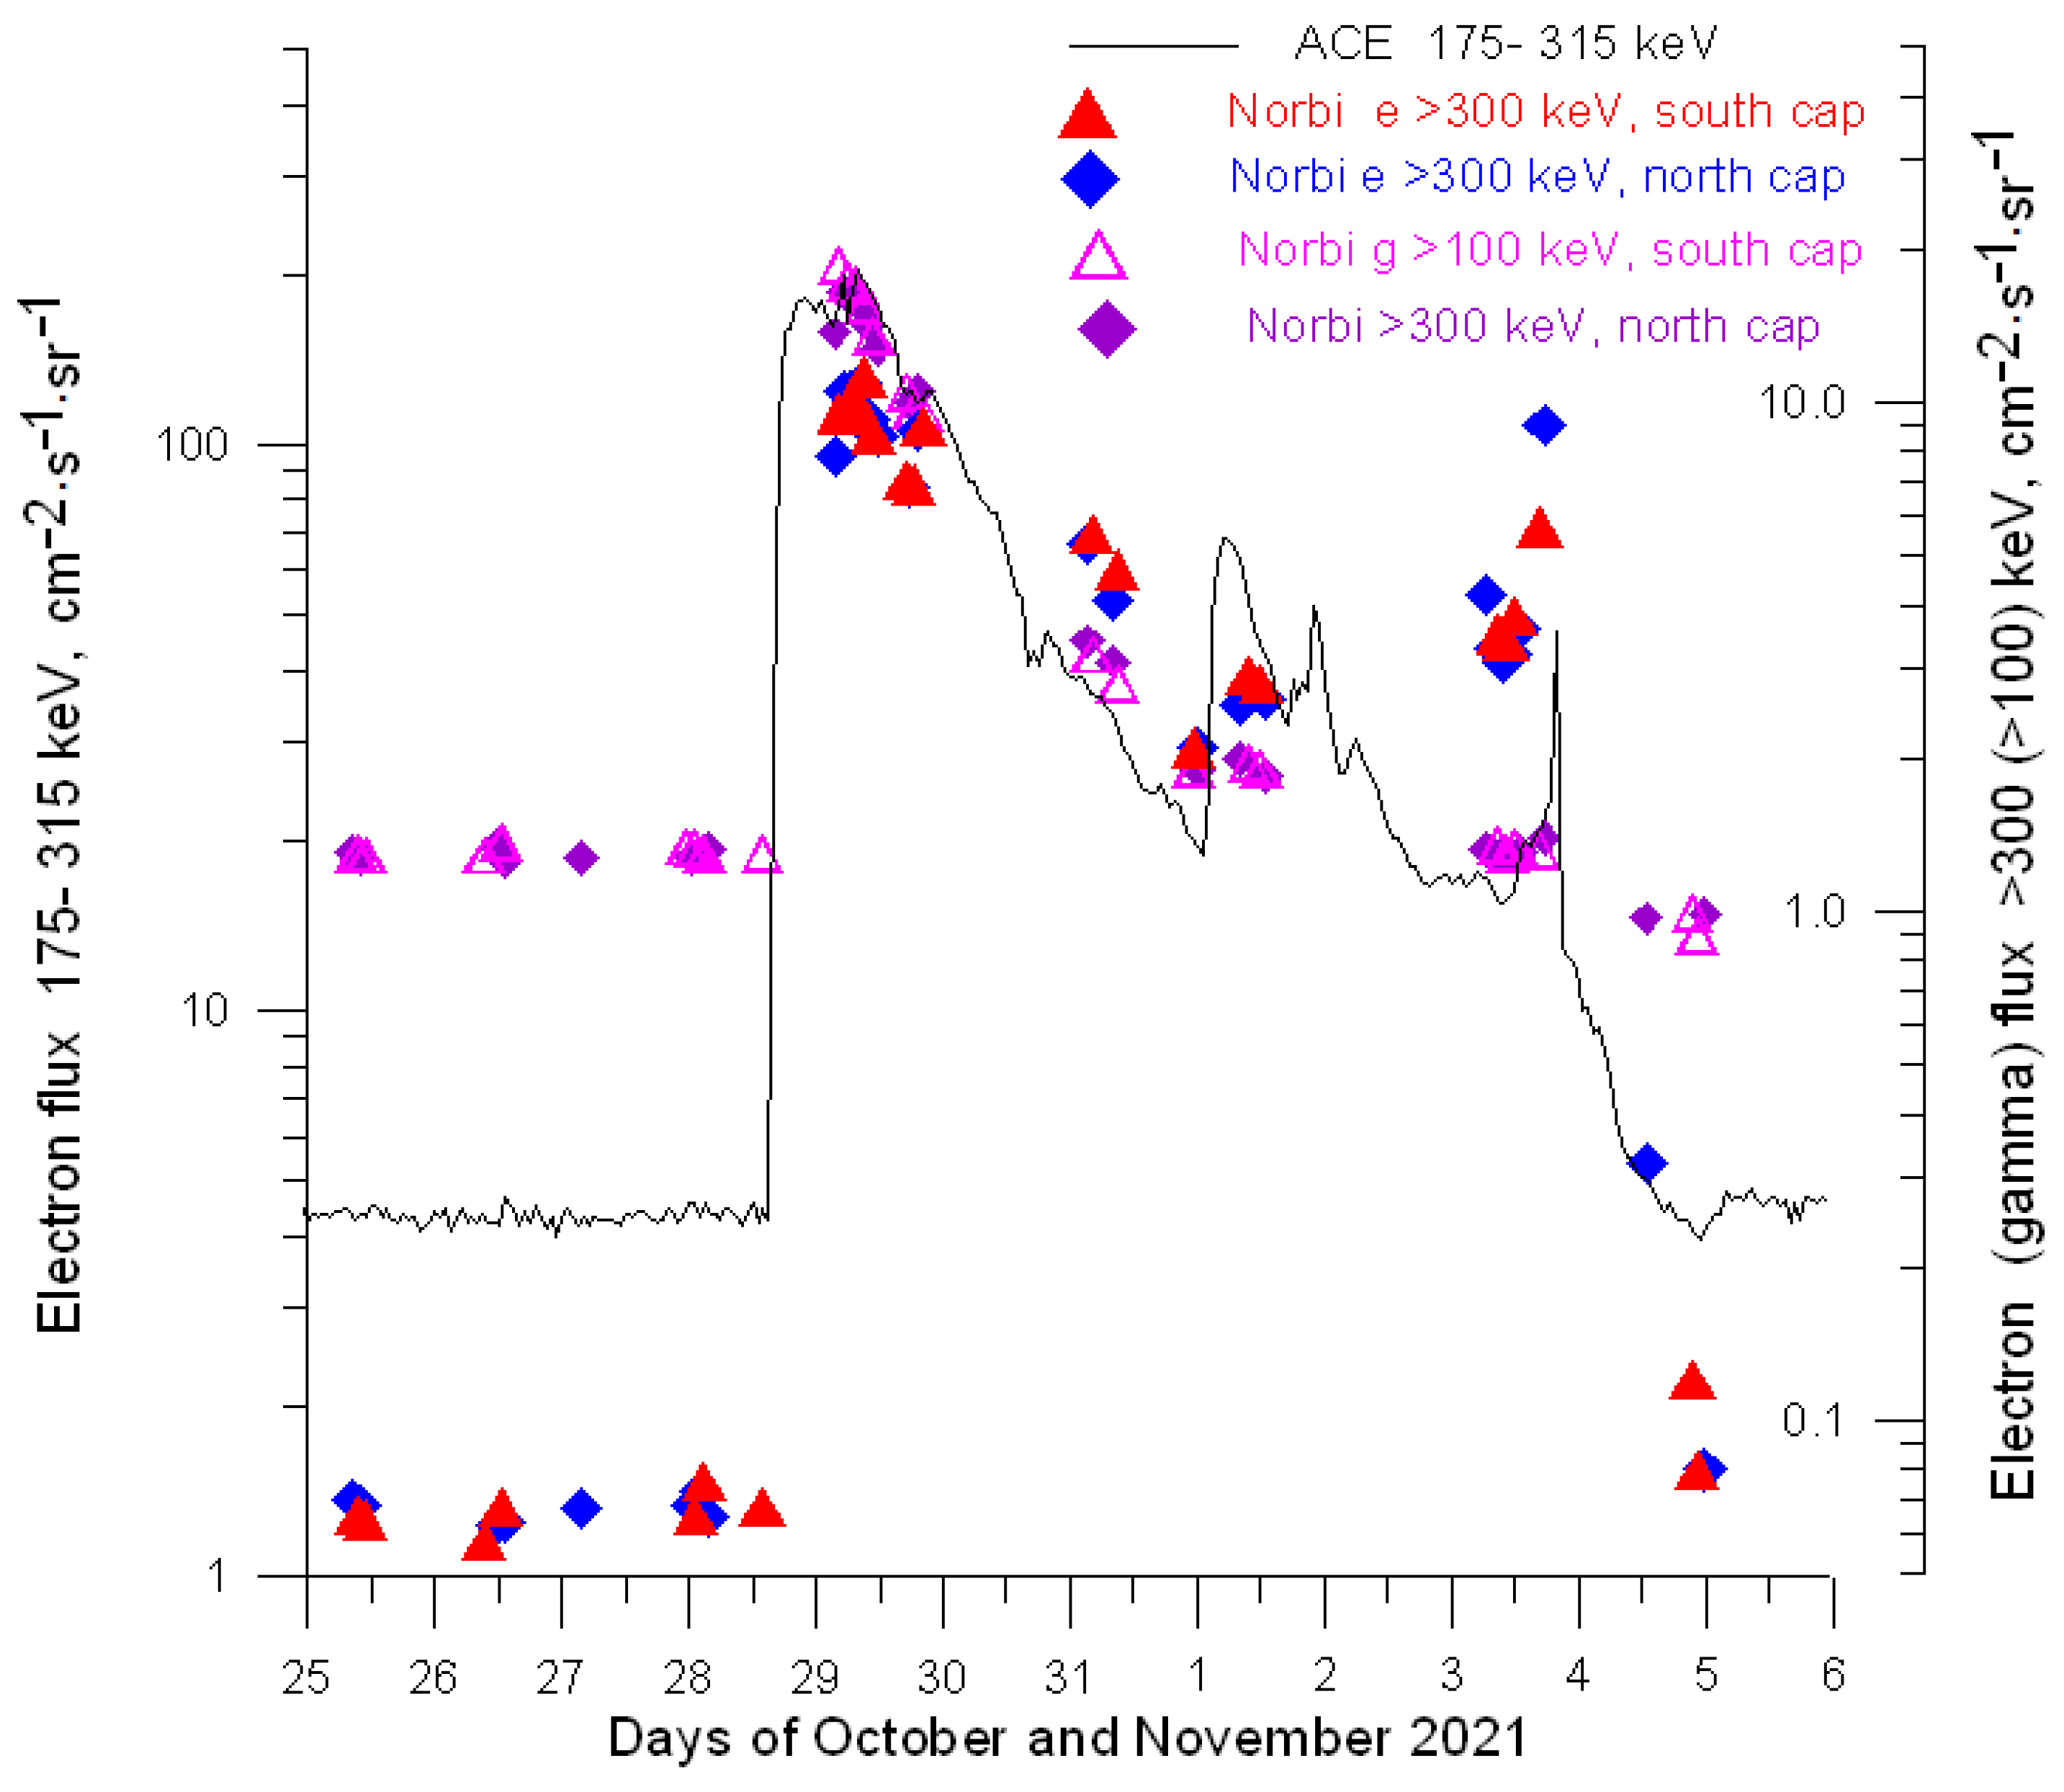
During the considered time, the DeCoR instrument on the Norbi satellite also recorded increases in energetic charged particle fluxes in the polar caps. Time dependences of DeCoR counting rates in two monitoring channels, which correspond to the detection of events predominantly in CsI(Tl) crystal and plastic scintillator, respectively, are presented in
Figure 4. As it was mentioned above, events in CsI(Tl) are caused by the detection of gamma quanta with energies greater than 100 keV, while events in plastic scintillator—by the detection of electrons with energies greater than 300 keV. However, it is necessary to note that the plastic scintillator is also sensitive to protons with energies more than several MeV, which can penetrate through the aluminum layer of 150-micron thickness, which covers the detector input window. The CsI(Tl) scintillator can also detect electrons with energies of more than hundreds of keV due to bremsstrahlung, although its efficiency is much less than the efficiency of detection of gamma quanta with the same energies. It means that protons can input counts in the electron channel (plastic), while sub-relativistic and relativistic electrons—are in the gamma channel CsI(Tl).
The curves presented in
Figure 4 were recorded with a time resolution of 1 s for three-time intervals corresponding to the period before charged particle flux variations connected with solar flares, i.e., 25 October 2021, after the first SCR flux increase, i.e., on 29 October and before the SCR flux increase caused by CME, i.e., 3 November. As it could be seen from the figure before the SCR events, it was a typical picture of count variations along with the low altitude and high inclination orbit (see top panel of
Figure 4). There are so-called latitude dependences quite visible in both channels, which are caused by the detection of local gamma quanta and electrons produced by energetic particles of galactic cosmic rays. Moreover, rather intensive maxima are clearly visible at the moments when the satellite crosses the outer radiation belt of the Earth. What is important is that in the quiet period, the time dependences of counts in both channels are rather flat in the polar caps, and the corresponding counting rates are much less than in the outer belt. The situation changed drastically after the first SCR event, i.e., 29 October. As we can see from the middle panel of
Figure 4, counting rates increased significantly in the polar caps and became of the same value as in the outer belt, which practically ceased to appear on time dependencies. These changes are caused by the filling of polar caps by energetic solar particles such as electrons and protons that were accelerated in flares. The wide and intensive peaks near the geomagnetic equator, which correspond to the minimal
L values, are connected with satellite crossings of the South Atlantic Anomaly (SAA). The curves on the bottom panel of
Figure 4 demonstrate the decreasing count rates in polar caps in both DeCoR instrument channels. It is caused by a decrease in the general SCR fluxes on 3 November, as it can be seen in
Figure 3. Periodic variations of the counting rate in polar caps, which could be seen in the middle and bottom panels of
Figure 4, are caused by satellite rotation and indicate the strong anisotropic pitch-angle distribution of detected particles, because in this case, counting rate values will depend on the instrument axis orientation relative to the magnetic field vector.
The general time dependence of charged particle fluxes in polar caps during the period from 25 October 2021 to 6 November 2021, obtained from DeCoR Norbi data, are presented in
Figure 5. For comparison, the time dependence of flux of electrons with energies in the range of 175–315 keV is also presented according to the data of the EPAM instrument (ACE satellite,
http://sd-www.jhuapl.edu/ACE/EPAM/ (accessed on 30 March 2022)) obtained via
https://cdaweb.gsfc.nasa.gov (accessed on 30 March 2022). We can see, in general, a good fit between both DeCoR Norbi and ACE dependences. It means that sub-relativistic and relativistic electrons give significant input in both DeCoR channels and fill the polar caps effectively. There are two discrepancies in the ACE and DeCoR Norbi data. The last demonstrates very intensive increases on 31 October and 3 November (before the peak caused by the CME), which are not seen in the ACE curve. These peculiarities may be connected with the local increase of solar proton flux on 31 October and the beginning of proton flux growth near 18.00 UT on 3 November. In this case, it reflects the fact that solar protons also fill the polar caps.
5. Sub-Relativistic Electrons near the Geomagnetic Equator
Another example of phenomena associated with the features of the distribution of charged particle fluxes in near-Earth space is the existence of stable sub-relativistic electron fluxes under the radiation belts at low latitudes. The presence of such electrons near the geomagnetic equator (at drift shells with
L < 1.2) is very interesting because, theoretically, the stable electron fluxes should not exist at such
L-shells due to mortality in the SAA during less than one drift period. Nevertheless, they are observed by various space experiments (see, e.g., [
20,
21,
29] at different phases of the solar cycle regardless of geomagnetic activity level. As an example, we can mention the RELEC experiment onboard the Vernov satellite, in which electron fluxes at low
L-shells were studied in detail. In particular, it was shown that these fluxes are most clearly manifested in the equatorial region near 120° east longitude [
21].
A study of electron fluxes near the geomagnetic equator can also be provided with the use of CubeSat satellites. Here we present examples of such observations with the DeCoR instrument onboard Moscow University CubeSat satellites, i.e., the AmurSat and DECART missions.
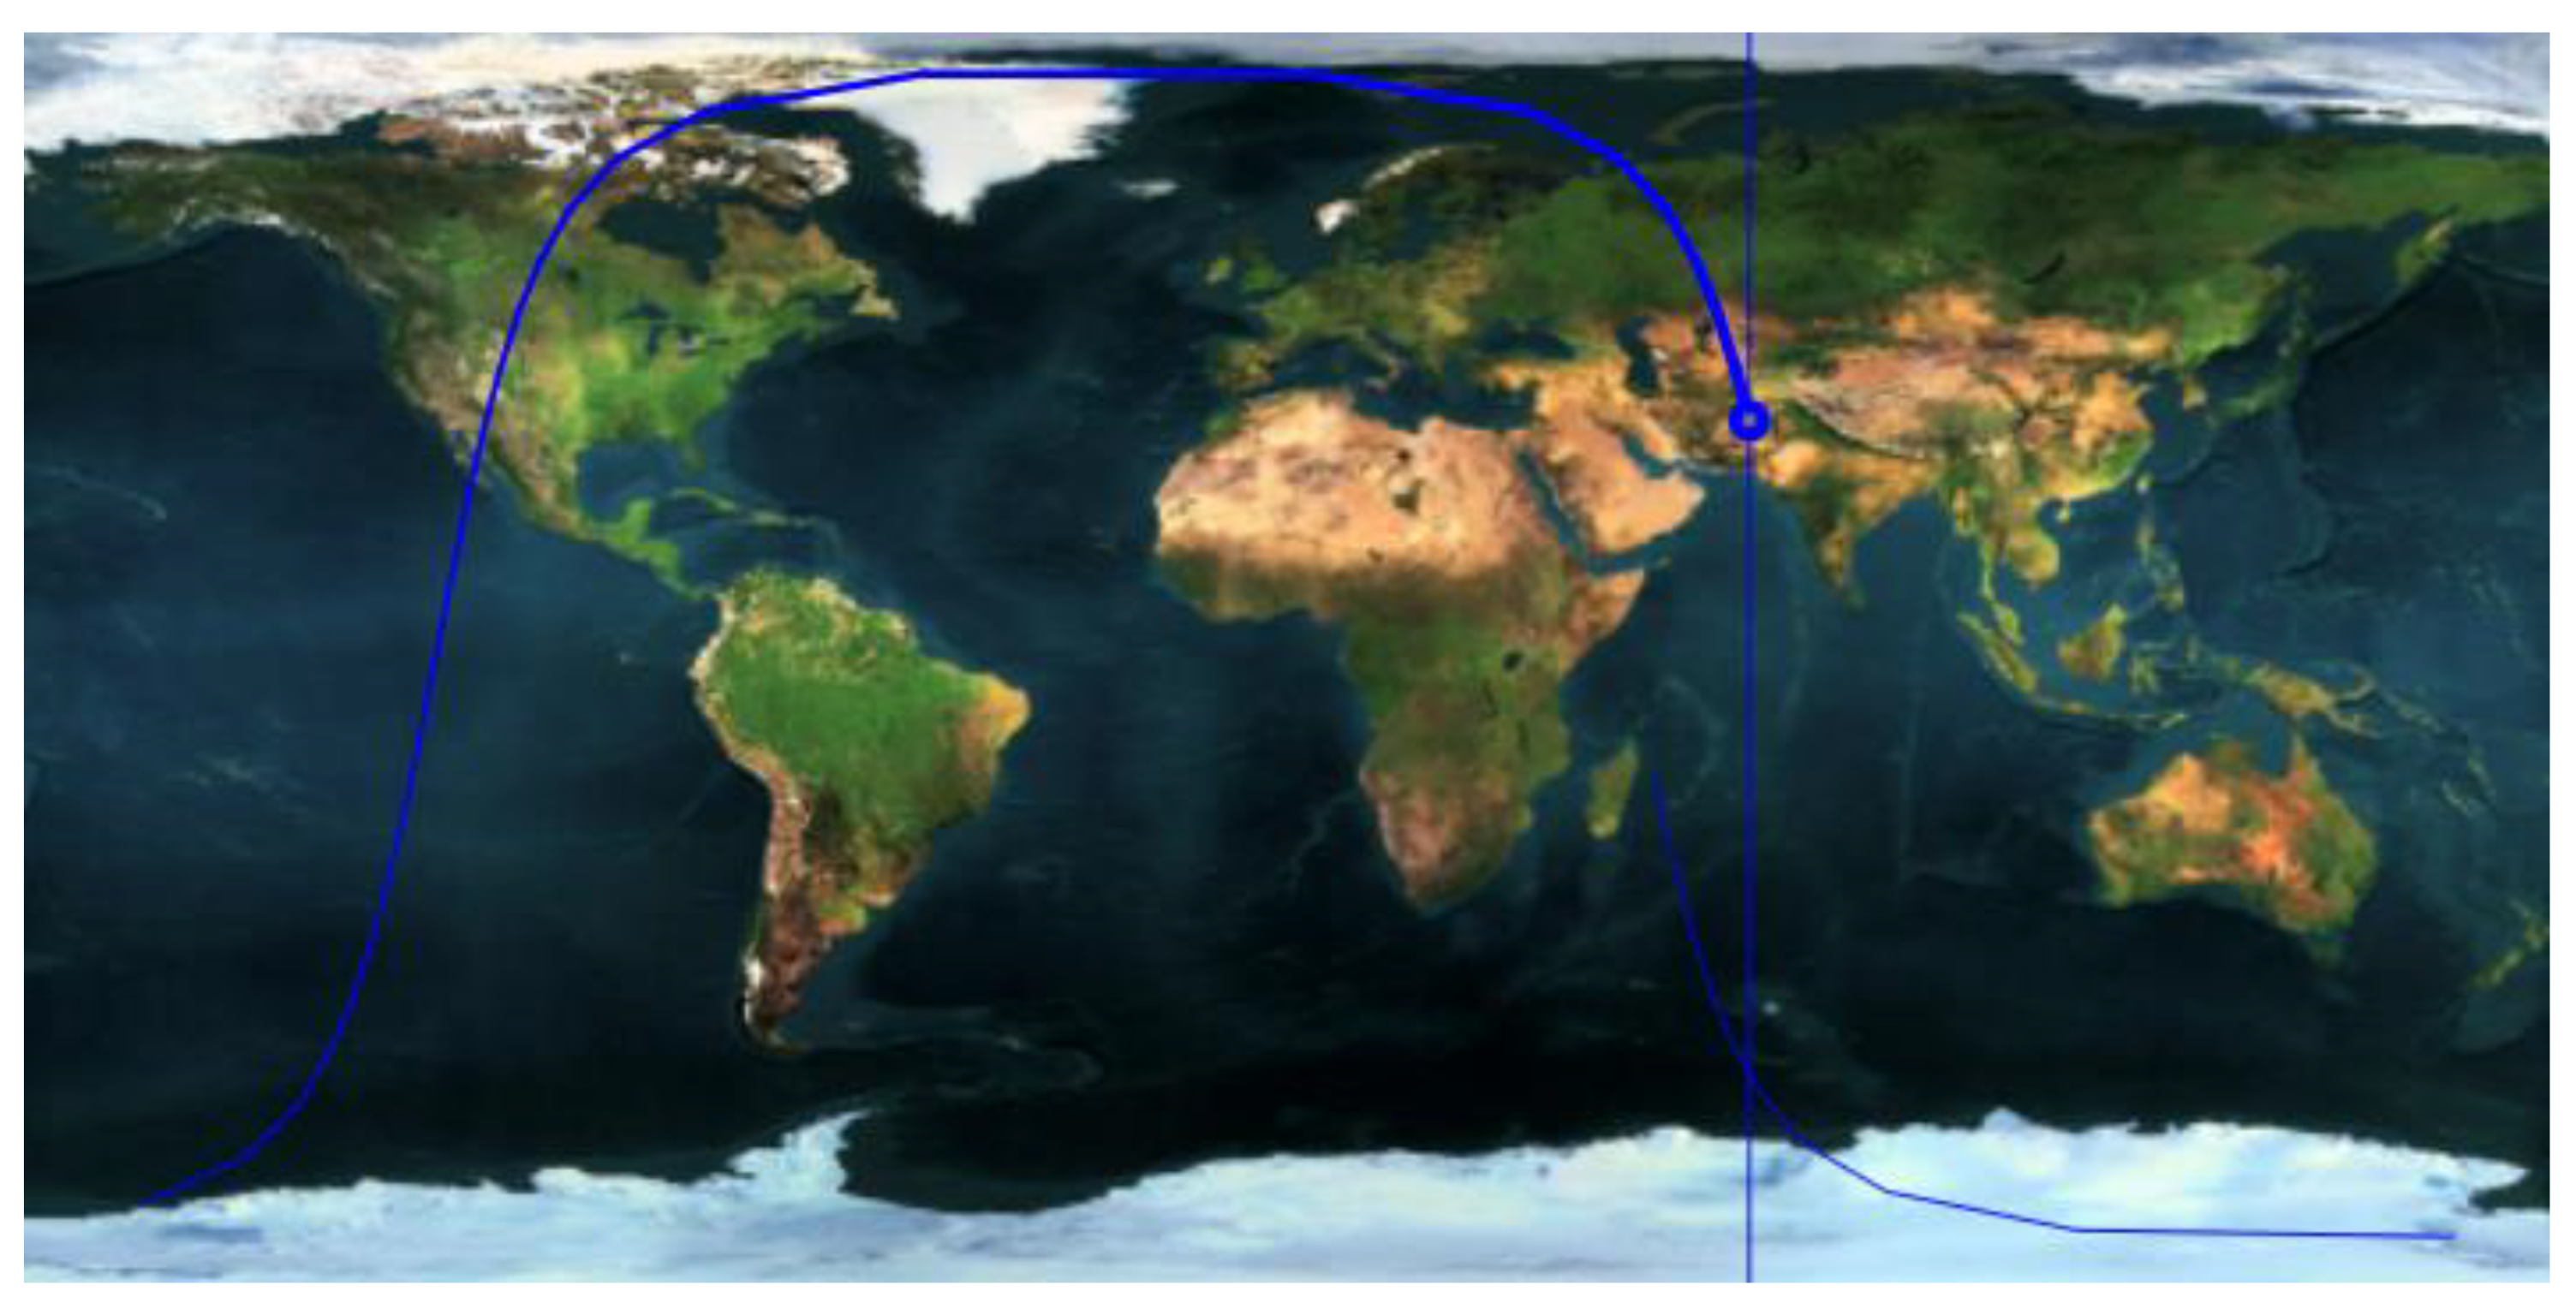
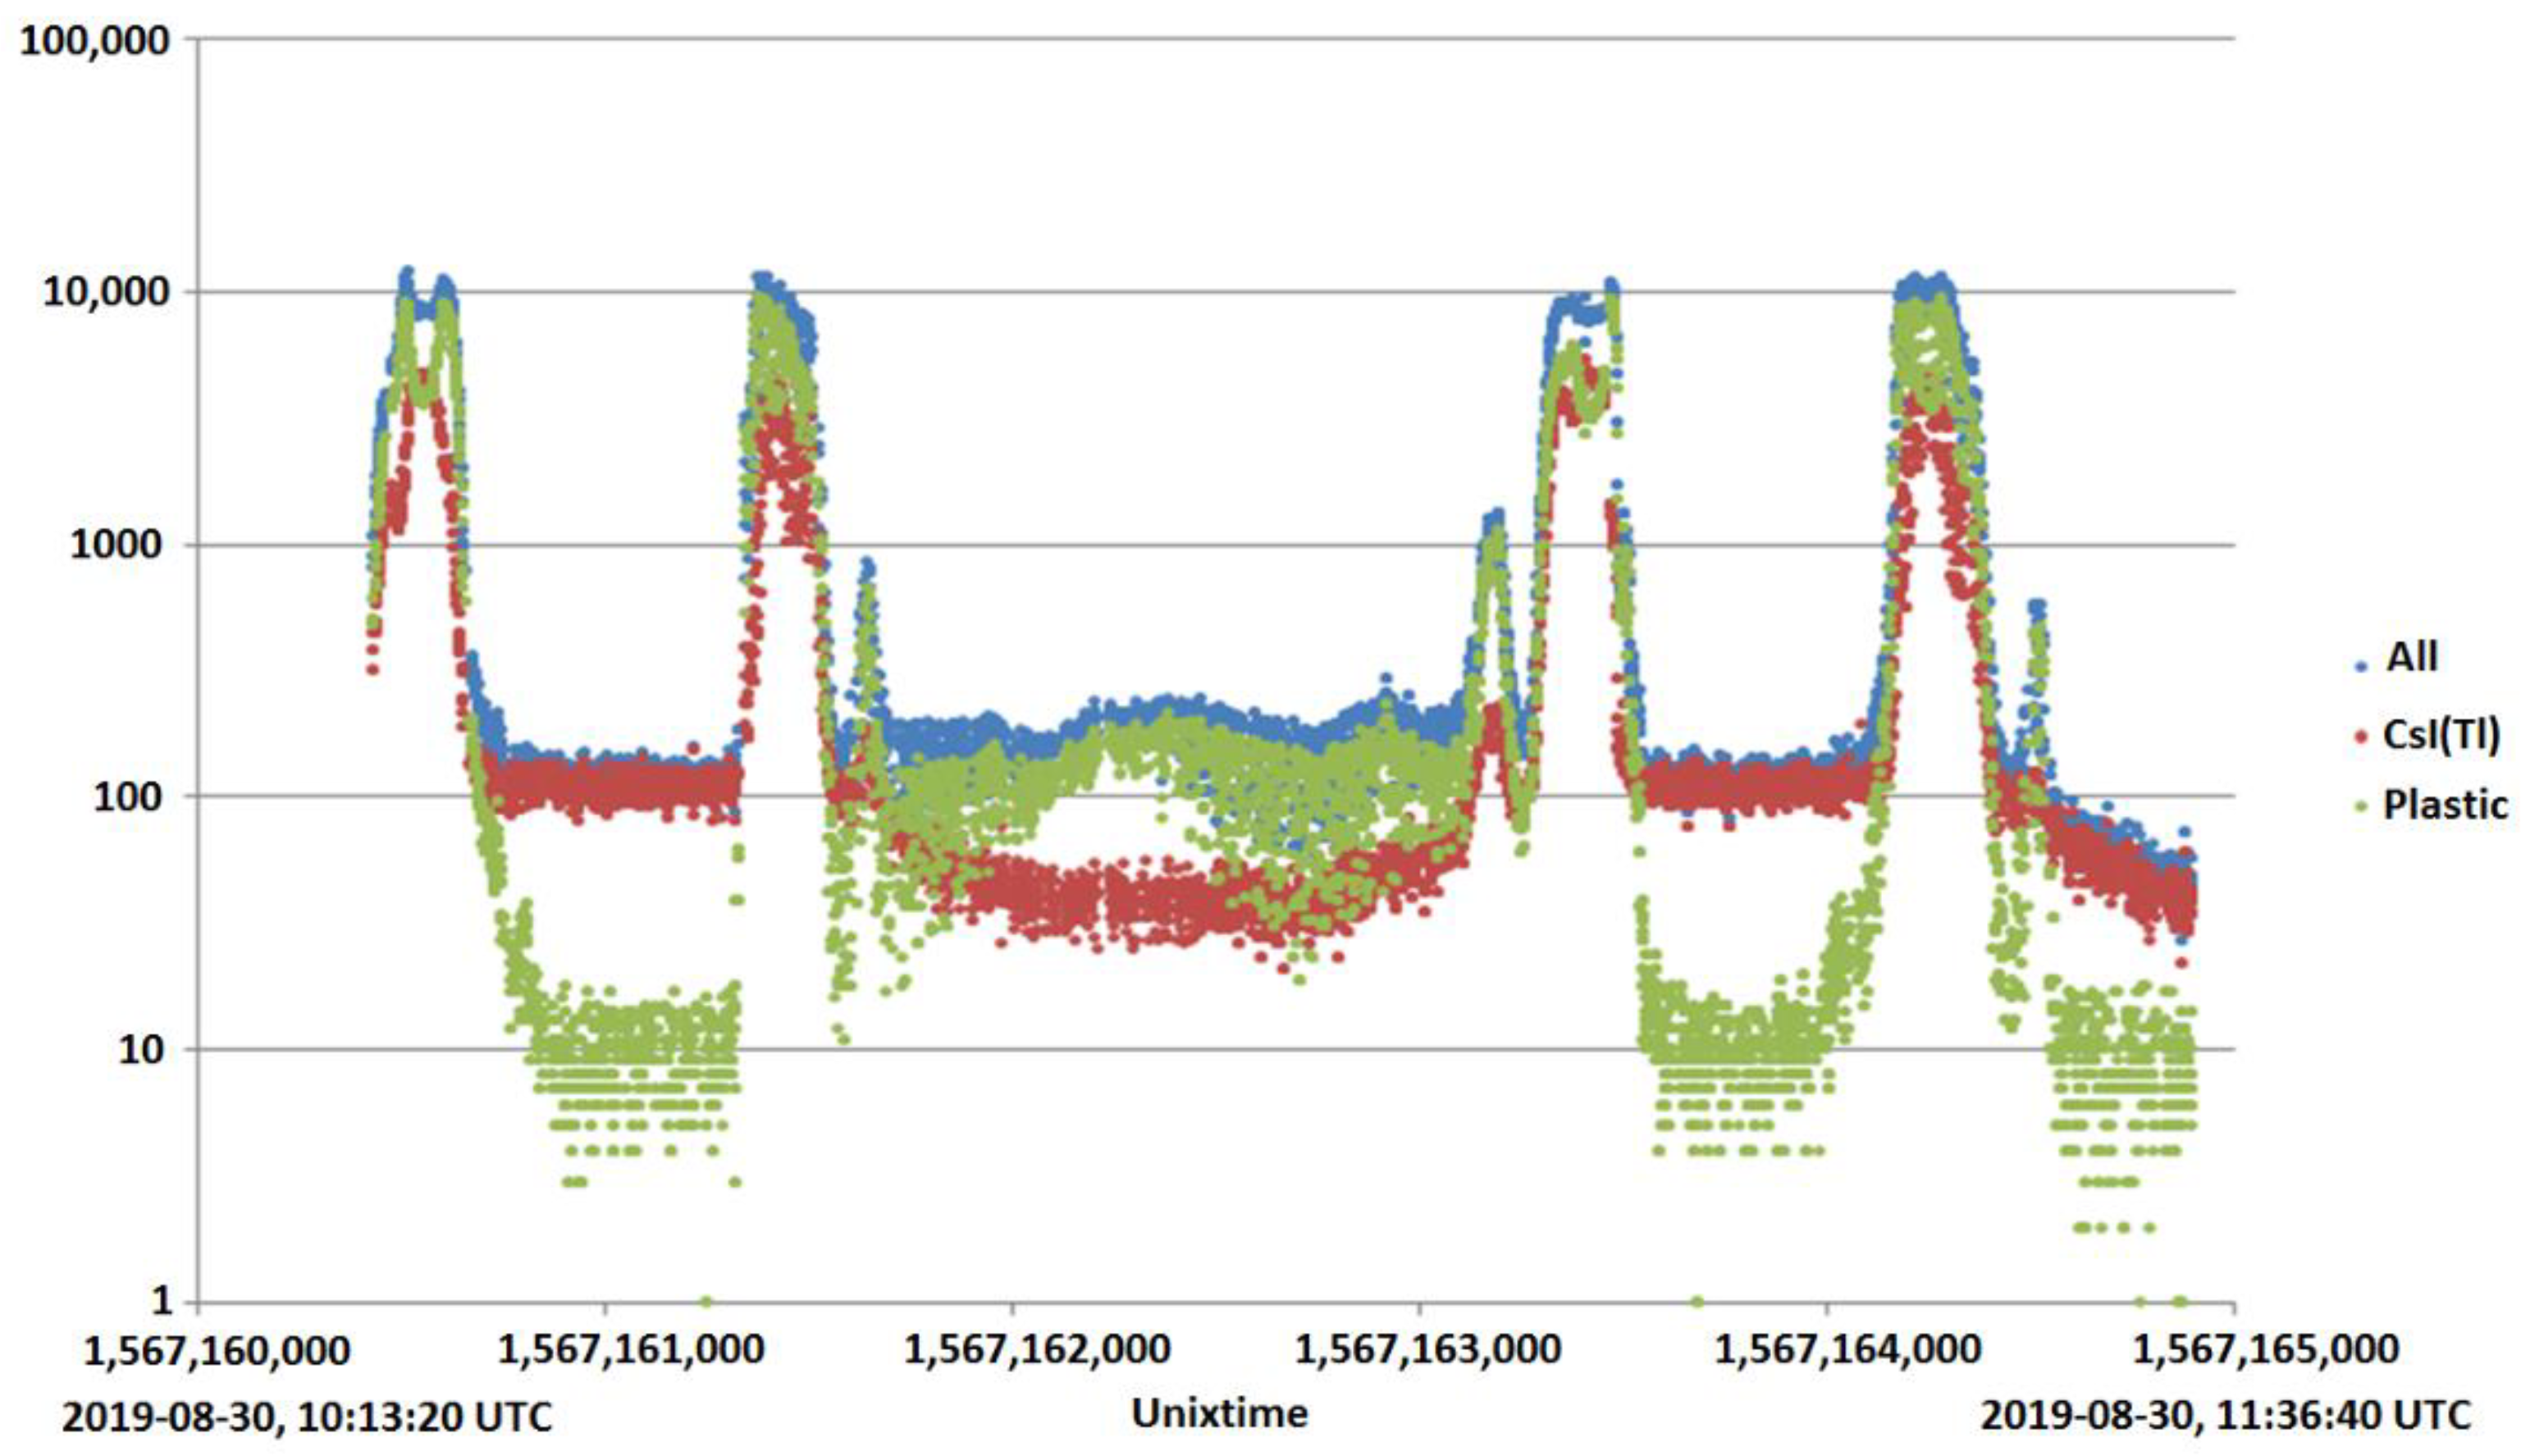
Figure 6 shows a map with the projection of one AmurSat satellite orbit on 30 August 2019, which crosses the geomagnetic equator region in the eastern part of the Pacific Ocean. The corresponding monitor time dependences (with 1 s time resolution) of counting rate in plastic scintillator (main electrons with energies > 300 keV), CsI(Tl) (mainly gamma quanta with energies > 100 keV), and total from DeCoR instrument during one orbit of AmurSat CubeSat in 2019, August 30 are presented in
Figure 7. The figure clearly shows the maxima at the moments when the satellite is in the outer radiation belt of the Earth. During the flight near the equator (10:55–11:10 UTC), a smooth increase in electron fluxes is seen, while the counting rate of background gamma quanta remains unchanged.
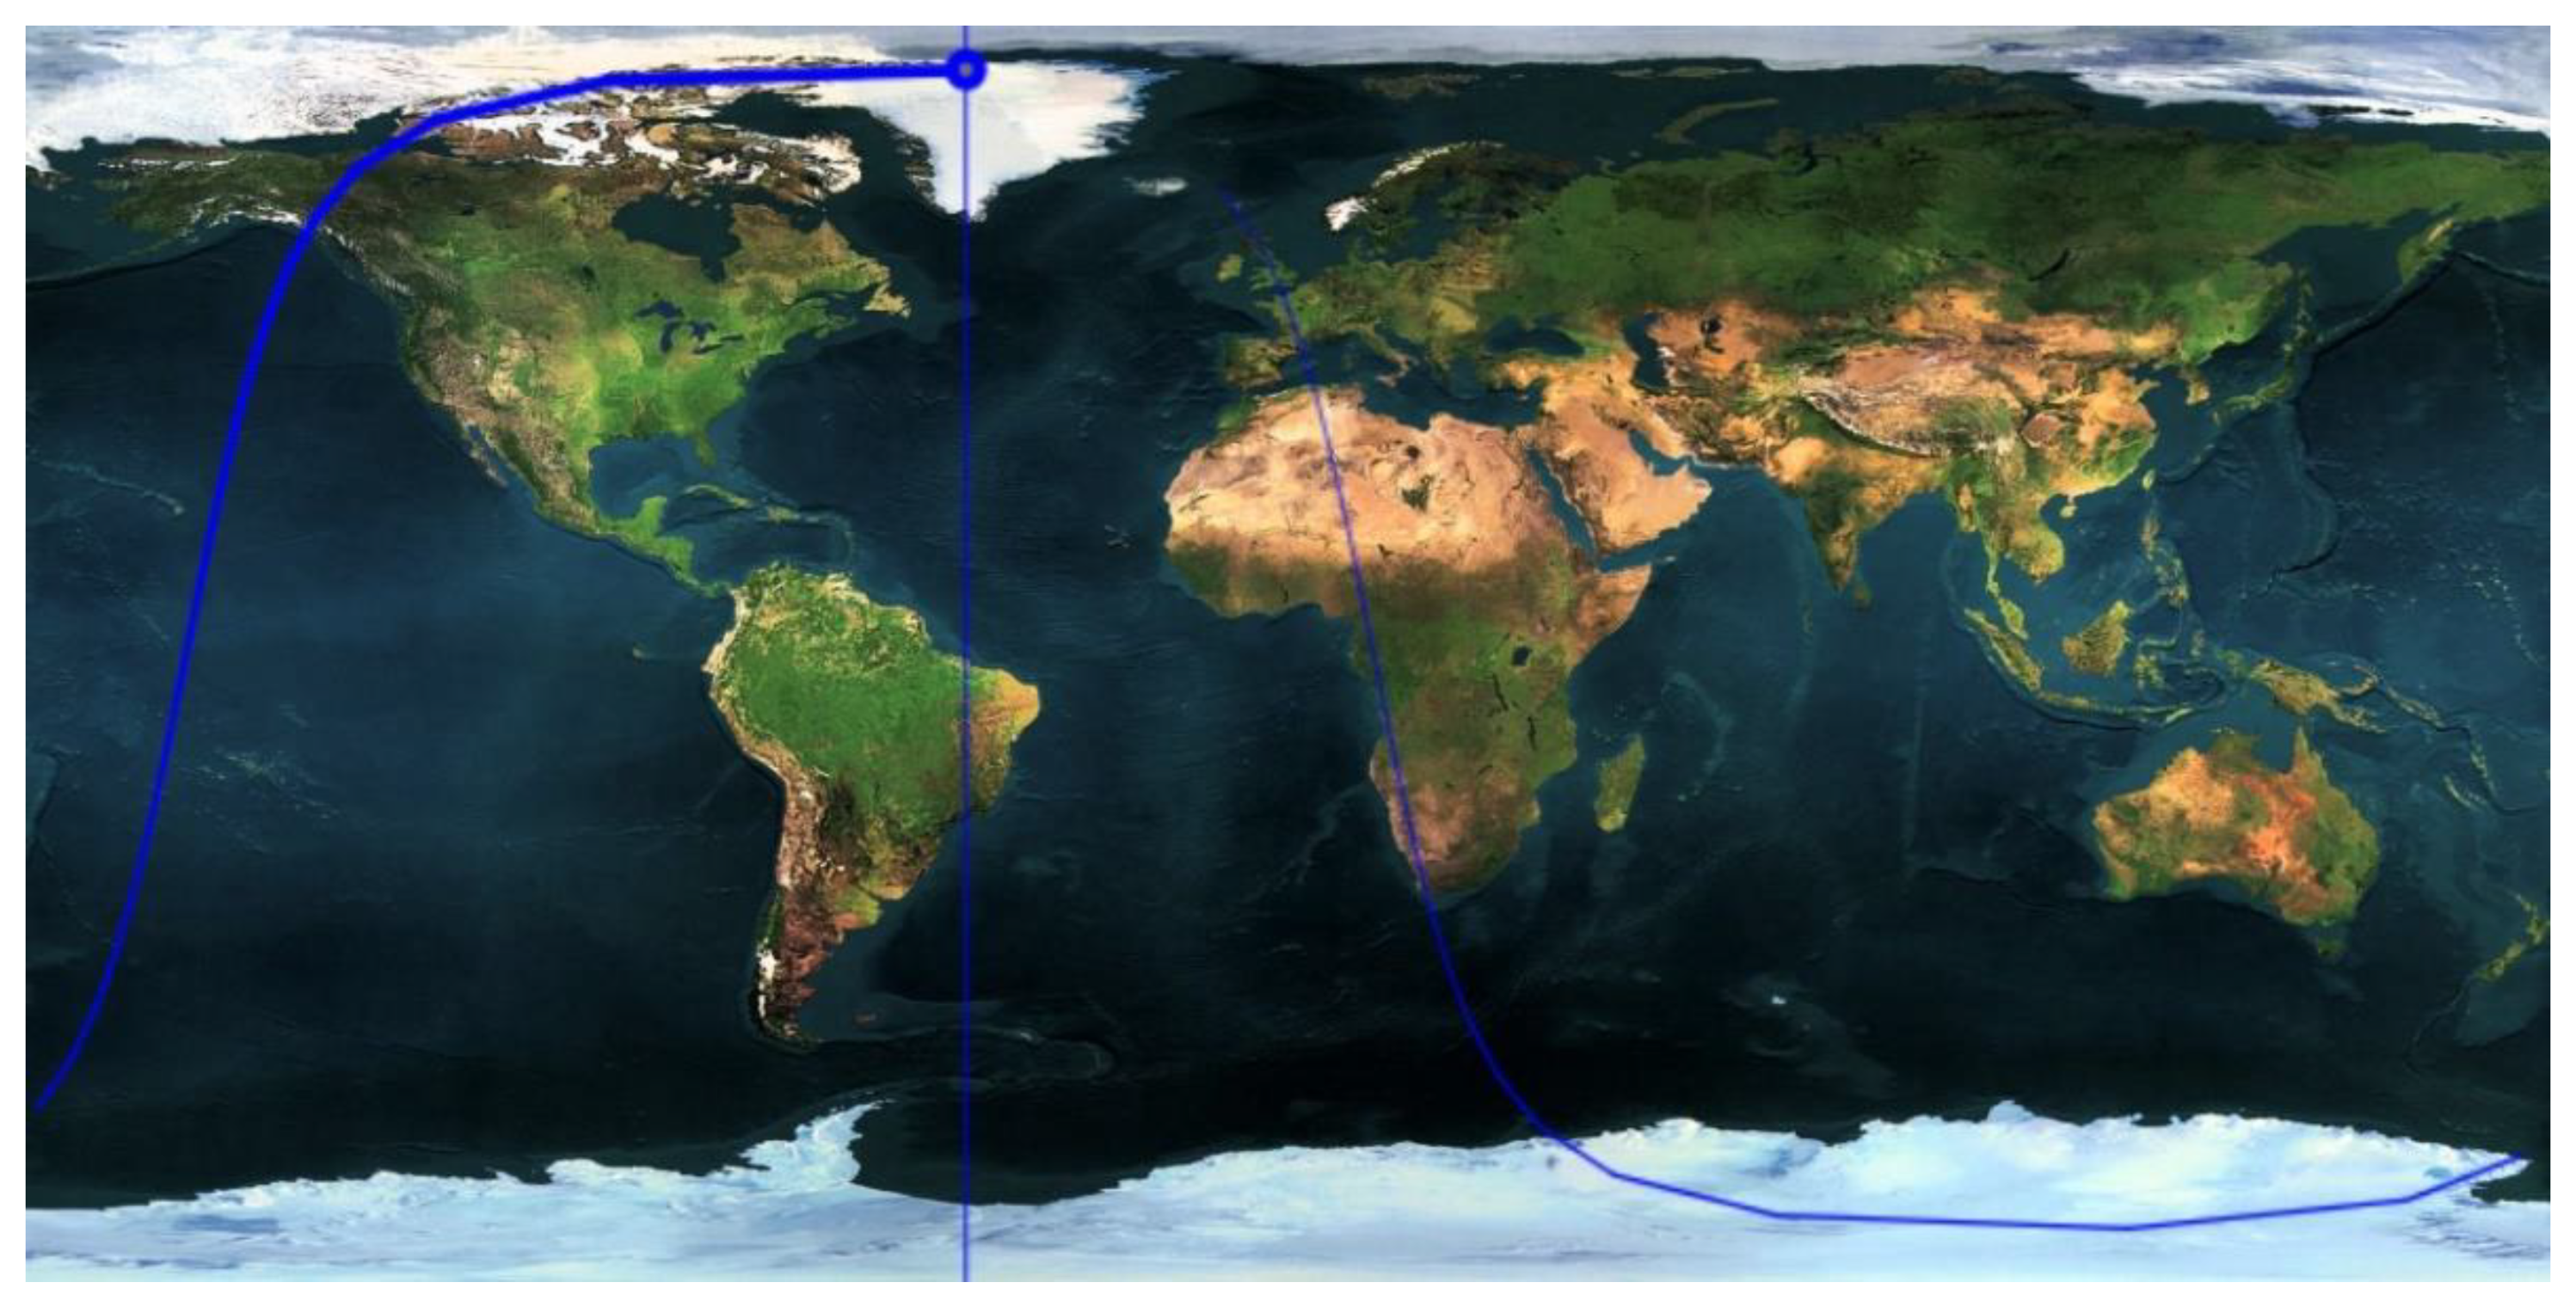
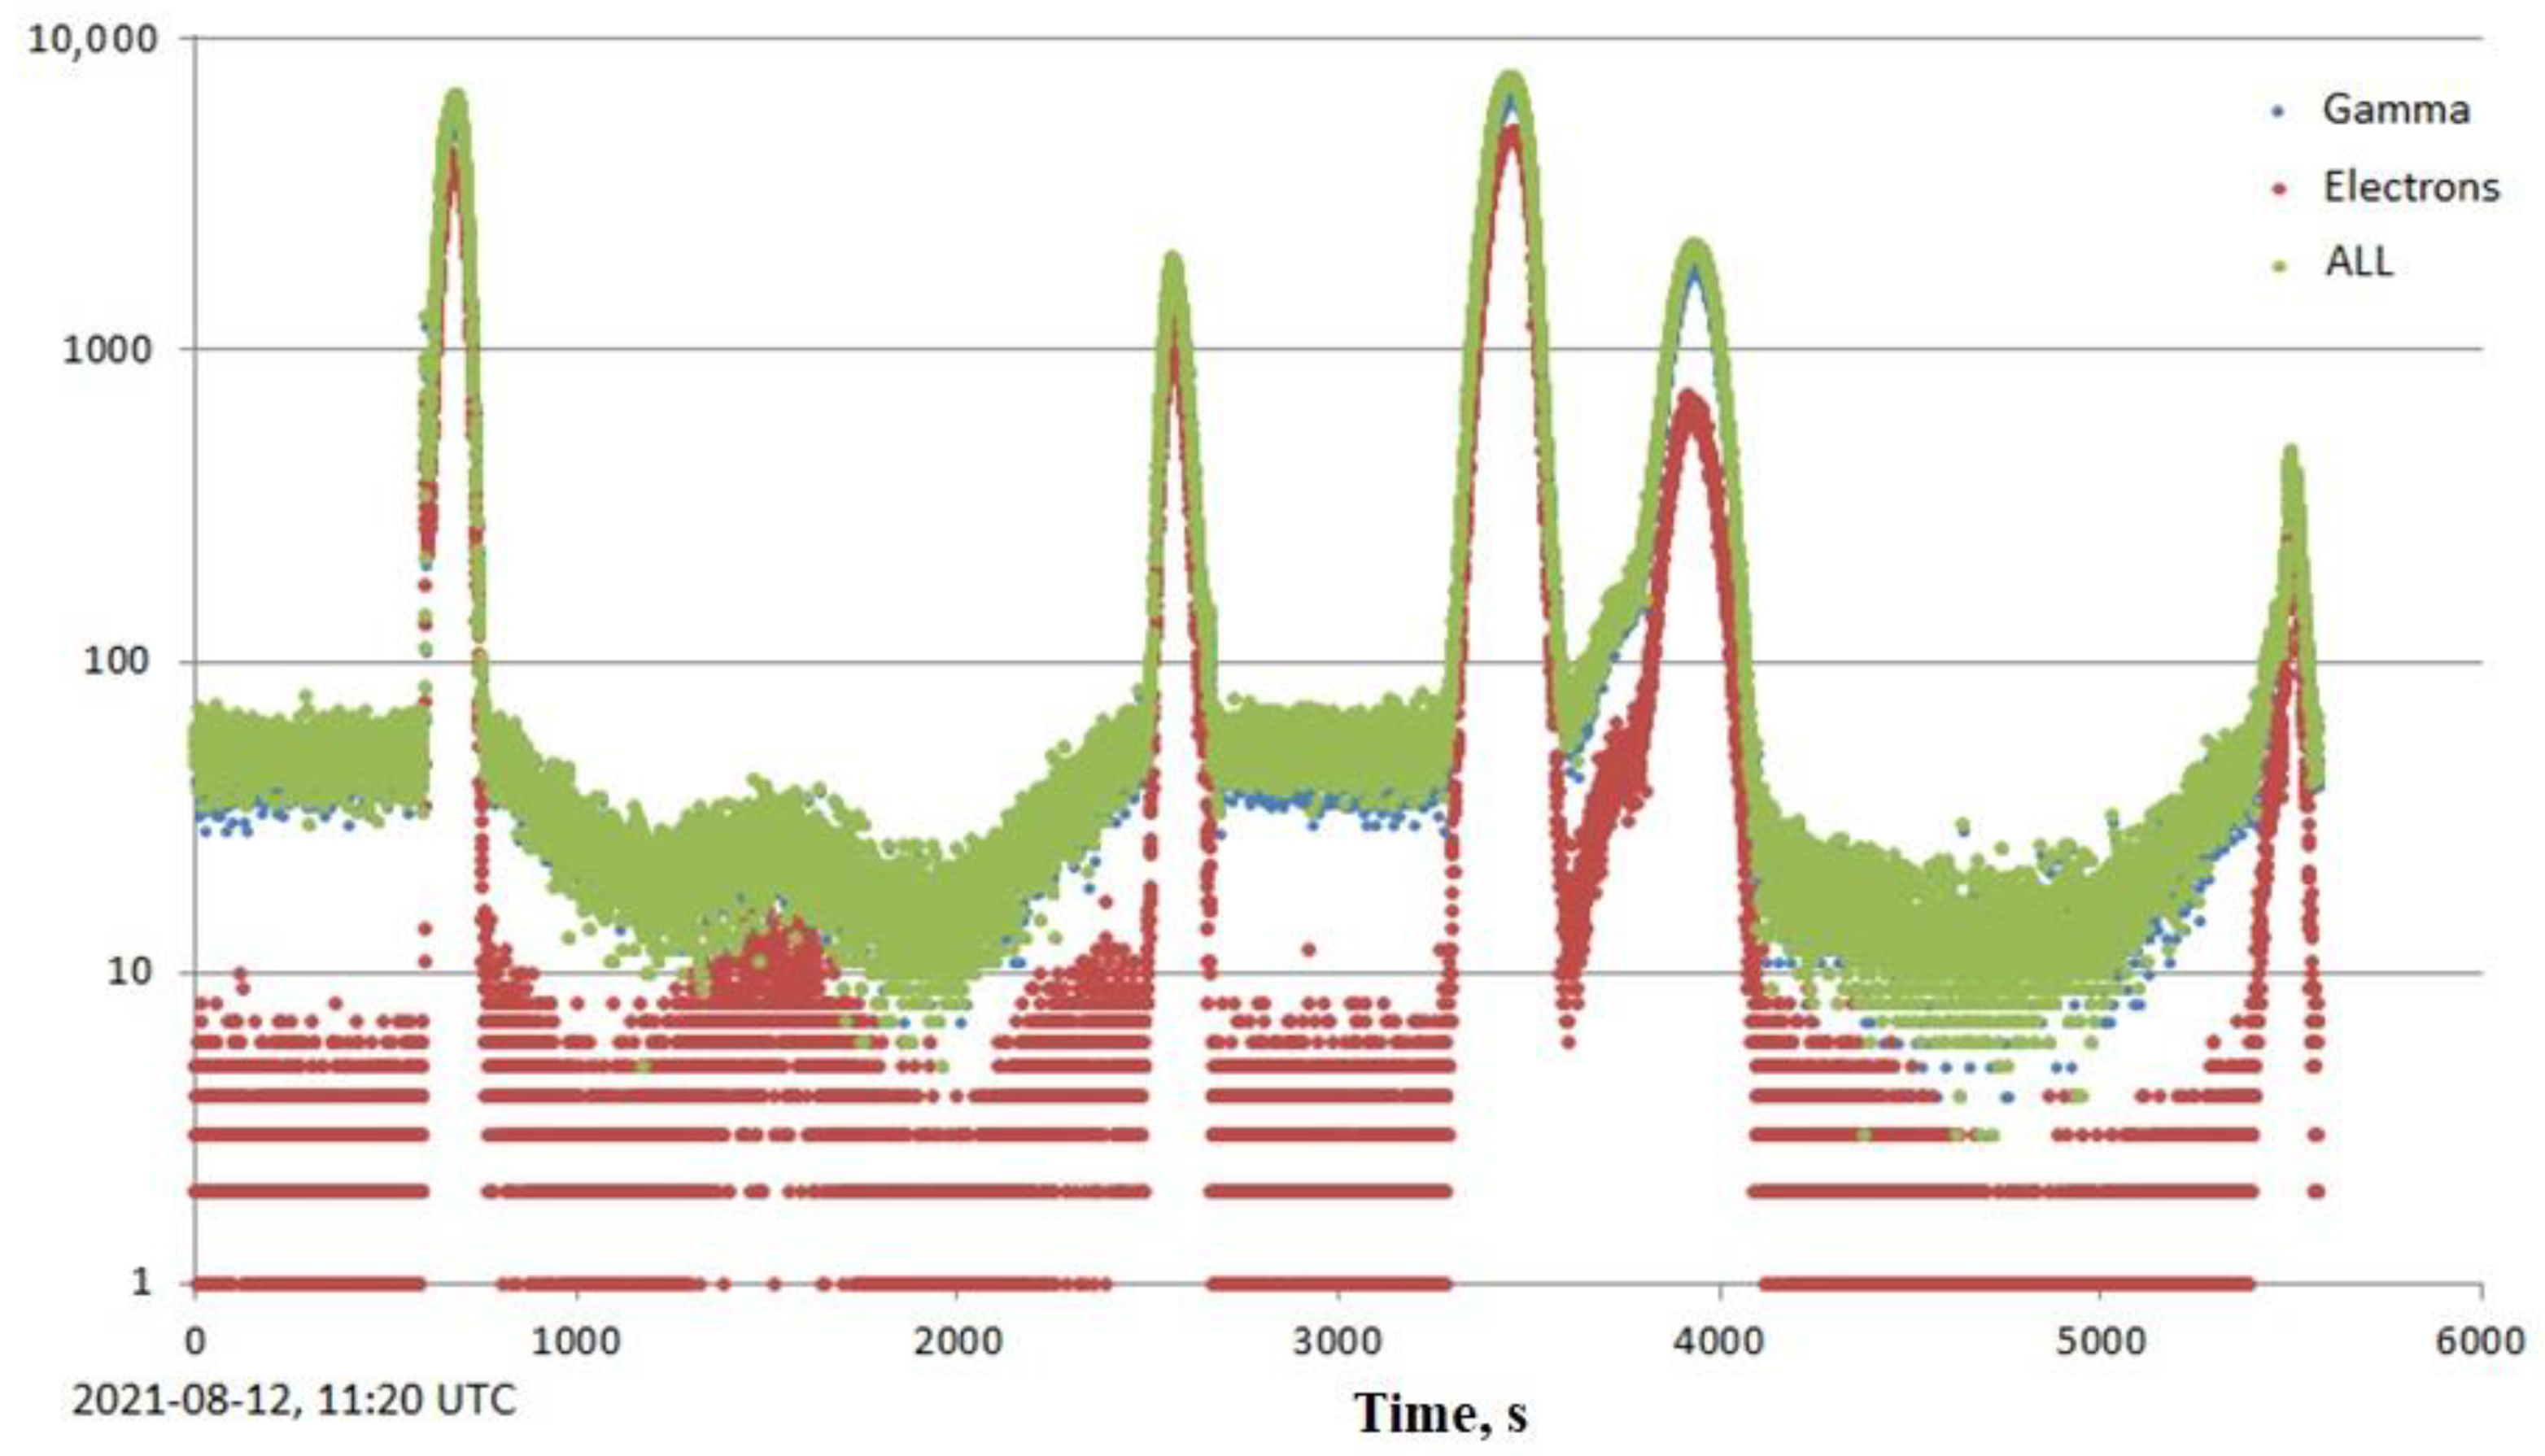
A similar picture was obtained from observations with the DeCoR instrument onboard the DECART CubeSat. Map with the projection of one DECART satellite orbit on 12 August 2021 is presented in
Figure 8. The corresponding count rate time dependences (electrons with energies > 300 keV, gammas with energies > 100 keV, and total) are presented in
Figure 9. A significant maximum in electron counting rates is observed near the geomagnetic equator (~11:50 UTC).
As it could be seen from the presented above figures, the near-equatorial electrons observed at the same region in epochs separated in time by about 2 years. It indicates that this is quite a stable phenomenon. Since electron fluxes on drift shells L < 1.2 must be destroyed by SAA as a result of drift, there should be a constantly existing mechanism for replenishment of stable electron fluxes near the geomagnetic equator. The classical mechanism of precipitation from the radiation belts through pitch-angle diffusion can hardly explain this phenomenon since it does not provide transfer across the magnetic field lines and, accordingly, the movement of particles between drift shells. The shells L < 1.2 correspond to the heights of the magnetic field line tops below the internal radiation belt. Very strong magnetic field disturbances are necessary to ensure the transport of particles across field lines in the inner magnetosphere. However, electron fluxes with L < 1.2 are observed at various levels of geomagnetic activity. Therefore, the mechanism of these fluxes filling from below, i.e., from the atmosphere, seems more probable. In particular, high-altitude electromagnetic discharges, in which electrons can be accelerated to relativistic energies and exit into the near-Earth space along the magnetic field lines, can be a source of near-equatorial electrons. In this regard, it should be noted that equatorial electron fluxes are observed just above the regions in which high-altitude discharges occur quite often.
6. Conclusions
During the implementation of the Moscow State University project of elaboration of a multi-satellite constellation for real-time space radiation monitoring, a number of spacecraft of the CubeSat format were launched. To date, there are four such satellites operating in near-Earth orbits that regularly transmit scientific and telemetric data. These are the AmurSat and VDNKh-80 satellites of the 3U dimension, as well as the 6U DECART and Norbi CubeSats (together with Novosibirsk State University). Thus, for the first time, a unique multi-satellite constellation has been implemented, which makes it possible to simultaneously measure the particle and quantum fluxes at different areas in near-Earth space using the same type of instruments.
A special compact detector of gamma quanta and energetic charged particles (electrons and protons) called DeCoR has been developed to carry out radiation monitoring on CubeSat satellites. With its help, observations of various effects of space weather have been made.
During geomagnetic disturbances from late November to early December 2021, a significant increase in the sub-relativistic electron fluxes in the outer radiation belt was observed. At the same time, a significant expansion of its boundaries took place; in particular, the polar edge shifted to L ~ 10, and such a change persisted for quite a long time, i.e., for several days.
In late October–early November 2021, several fairly powerful solar flares occurred, as a result of which protons and electrons were accelerated and solar cosmic ray fluxes were produced. Observations of charged particle fluxes in the polar caps have been made, which have shown that they are effectively filled by solar energetic particles.
The existence of stable streams of sub-relativistic energies in the region of the geomagnetic equator–on drift shells L < 1.2 has been confirmed. Presumably, such fluxes can be caused by electrons accelerated in high-altitude electromagnetic discharges.
Author Contributions
S.I.S.—The main author of the article, developed the concept of multi-satellite measurements of cosmic radiation, carried out scientific supervision of experiments on satellites of Moscow State University (principal investigator). A.V.B.—Participation in data analysis and writing a section on electrons near the geomagnetic equator, editing the text as a whole. V.V.B.—The chief designer of the electronics of the DeCoR instrument, carried out its adjustment and calibration, developed a data processing technique, prepared initial graphical information—time dependences of count rates. A.F.I.—Developed the concept of the DeCoR device, took part in editing the final version of the article. V.E.E.—Carried out primary data processing and provided database replenishment. V.V.K.—Developed the software for the data center of operational space monitoring. I.N.M.—Analysis of the geomagnetic situation during the experiment, selection of time intervals for studying the effects associated with space weather, participation in writing a section on space weather, drawing figures in the relevant sections. V.I.O.—Provided organizational and technical support conducting a multisatellite experiment. V.L.P.—Participated in writing the section on near-equatorial electrons, developed the concept of a multi-satellite constellation, developed technical requirements for spacecraft and recording instruments. O.Y.P.—Carried out organizational and technical support for the creation of DEKART, AmurSat, VDNKh-80 satellites in CubeSat format. M.I.P.—Developed a methodology for analyzing data from the DeCoR-2 device in parts of searching and studying time variations. Y.K.Z.—Chief designer of DEKART, “AmurSat”, VDNKh-80 satellites. I.V.Y.—Organized and carried out the manufacture of the DeCoR-2 device, pre-flight tests of satellites DEKART, “AmurSat”, VDNKh-80. V.Y.P.—Chief designer of the Norby satellite. A.S.S.—Developed the methodology and received data from the satellite “Norby”. S.V.K.—Developed the methodology and received data from satellites DEKART, “AmurSat”, VDNH-80. A.P.P.—Carried out organizational and technical support for the maintenance, management, and reception of data from satellites DEKART, “AmurSat”, VDNKh-80. All authors have read and agreed to the published version of the manuscript.
Funding
This research has been supported by the Interdisciplinary Scientific and Educational School of Moscow University “Fundamental and Applied Space Research”.
Institutional Review Board Statement
Not applicable.
Informed Consent Statement
Not applicable.
Data Availability Statement
Not applicable.
Conflicts of Interest
The authors declare no conflict of interest.
References
- Sawyer, D.M.; Vette, J.I. AP-8 Trapped Proton Environment for Solar Maximum and Solar Minimum; NSSDC/WDC-A-R&S 76-06; NASA/Goddard Space Flight Center: Greenbelt, MD, USA, 1976.
- Vette, J.I. The AE-8 Trapped Electron Environment; NSSDC/WDC-A-R&S 1-24; NASA/Goddard Space Flight Center: Greenbelt, MD, USA, 1991.
- Getcelev, I.V.; Sosnovetc, E.N.; Kovtukh, A.S.; Dmitriev, A.V.; Podzolko, M.V.; Vlasova, N.A.; Reizman, S.Y. Empirical model of radoation belt of Helium nuclei. Cosm. Res. 2005, 43, 229–232. [Google Scholar] [CrossRef]
- Ginet, G.P.; O’Brien, T.P.; Huston, S.L.; Johnston, W.R.; Guild, T.B.; Friedel, R.; Lindstrom, C.D.; Roth, C.J.; Whelan, P.; Quinn, R.A.; et al. AE9, AP9 and SPM: New models for specifying the trapped energetic particle and space plasma environment. Space Sci. Rev. 2013, 179, 579–615. [Google Scholar] [CrossRef] [Green Version]
- Myagkova, I.N.; Bogomolov, A.V.; Eremeev, V.E.; Shiryaev, A.O.; Ginzburg, E.A. Dynamics of the radiation environment in the near-earth space in September–November 2020 according to the Meteor-M and Electro-l satellite data. Cosm. Res. 2021, 59, 433–445. [Google Scholar] [CrossRef]
- Tverskaya, L.V.; Balashov, S.V.; Vevden’kin, N.N.; Ivanov, V.V.; Karpenko, D.S.; Kochura, S.G.; Maksimov, I.A.; Open’ko, S.I.; Pavlov, N.N.; Reizman, S.Y.; et al. Outer radiation belt of relativistic electrons at minimum of 23 cycle of Solar activity. Geomagn. Aeron. 2012, 52, 740–745. [Google Scholar] [CrossRef]
- Friedel, R.H.; Reeves, W.G.P.; Obara, T. Relativistic electron dynamics in the inner magnetosphere—A review. J. Atmos. Sol. Terr. Phys. 2002, 64, 265–283. [Google Scholar] [CrossRef]
- Turner, D.L.; Shprits, Y.; Hartinger, M.; Angelopoulos, V. Explaining sudden losses of outer radiation belt electrons during geomagnetic storms. Nat. Phys. 2012, 8, 208–212. [Google Scholar] [CrossRef]
- Li, X.; Selesnick, R.S.; Zhao, H.; Baker, D.N.; Blake, J.B.; Temerin, M.A. Source, Loss, and Transport of Energetic Particles Deep Inside Earth’s Magnetosphere. In Magnetospheres in the Solar System, 1st ed.; Romain, M., Nicolas, A., Hiroshi, H., Daniel, T.W., Yongliang, Z., Larry, J.P., Eds.; Geophysical Monograph Series; American Geophysical Union: Washington, DC, USA, 2021; pp. 323–334. [Google Scholar] [CrossRef]
- Kataoka, R.; Miyoshi, Y. Average profiles of the solar wind and outer radiation belt during the extreme flux enhancement of relativistic electrons at geosynchronous orbit. Ann. Geophys. 2008, 26, 1335–1339. [Google Scholar] [CrossRef]
- Reeves, G.D.; Morley, S.K.; Friedel, R.H.W.; Henderson, M.G.; Cayton, T.E.; Cunningham, G.; Blake, J.B.; Christensen, R.A.; Thomsen, D. On the relationship between relativistic electron flux and solar wind velocity: Paulikas and Blake revisited. J. Geophys. Res. 2011, 116, A02213. [Google Scholar] [CrossRef]
- Lin, R.P. Energetic solar electrons in the interplanetary medium. Sol. Phys. 1985, 100, 537–561. [Google Scholar] [CrossRef]
- Kahler, S.W. Solar Sources of Heliospheric Energetic Electron Events-Shocks or Flares? Space Sci. Rev. 2007, 129, 359–390. [Google Scholar] [CrossRef]
- Kallenrode, M.B.; Cliver, E.W.; Wibberenz, G. Composition and Azimuthal Spread of Solar Energetic Particles from Impulsive and Gradual Flares. ApJ 1992, 391, 370. [Google Scholar] [CrossRef]
- Posner, A. Up to 1-hour forecasting of radiation hazards from solar energetic ion events with relativistic electrons. Space Weather 2007, 5, S05001. [Google Scholar] [CrossRef] [Green Version]
- Wang, L.; Krucker, S.; Mason, G.M.; Lin, R.P.; Li, G. The injection of ten electron/3He-rich SEP events. Astron. Astrophys. 2016, 585, A119. [Google Scholar] [CrossRef] [Green Version]
- Kontar, E.P.; Reid, H.A.S. Onsets and Spectra of Impulsive Solar Energetic Electron Events Observed Near the Earth. Astrophys. J. Lett. 2009, 695, L140–L144. [Google Scholar] [CrossRef]
- Gómez-Herrero, R.; Pacheco, D.; Kollhoff, A.; Lara, F.E.; von Forstner, J.L.F.; Dresing, N.; Lario, D.; Balmaceda, L.; Krupar, V.; Malandraki, O.E.; et al. First near-relativistic solar electron events observed by EPD onboard Solar Orbiter. Astron. Astrophys. 2021, 656, L3. [Google Scholar] [CrossRef]
- Wibberenz, G.; Cane, H.V. Multi-Spacecraft Observations of Solar Flare Particles in the Inner Heliosphere. Astrophys. J. 2006, 650, 1199–1207. [Google Scholar] [CrossRef]
- Rodger, C.J.; Clilverd, M.A.; Green, J.C.; Lam, M.M. Use of POES SEM-2 observations to examine radiation belt dynamics and energetic electron precipitation into the atmosphere. J. Geophys. Res. 2010, 115, A04202. [Google Scholar] [CrossRef] [Green Version]
- Petrov, V.L.; Bogomolov, A.V.; Bogomolov, V.V.; Kalegaev, V.V.; Panasyuk, M.I.; Svertilov, S.I.; Kosenko, A.A. Spatial and Temporal Characteristics of Subrelativistic Electron Fluxes in the Near-Earth Space from the Vernov Satellite Data. Geomagn. Aeron. 2020, 60, 151–161. [Google Scholar] [CrossRef]
- Fox, N.; Burch, J.L. The Van Allen Probes Mission; Springer: Berlin/Heidelberg, Germany, 2014. [Google Scholar]
- Li, X.; Baker, D.N.; Zhao, H.; Zhang, K.; Jaynes, A.N.; Schiller, Q.; Kanekal, S.G.; Blake, J.B.; Temerin, M. Radiation belt electron dynamics at low L (<4): Van Allen Probes era versus previous two solar cycles. J. Geophys. Res. Space Phys. 2017, 122, 5224–5234. [Google Scholar] [CrossRef] [Green Version]
- Kraft, S.; Lupi, A.; Luntama, J.-P. ESA’s Distributed Space Weather Sensor System (D3S) utilizing hosted payloads for operational space weather monitoring. In Proceedings of the 67th International Astronautical Congress, Guadalajara, Mexico, 26–30 September 2016. [Google Scholar]
- Panasyuk, M.I.; Podzolko, M.V.; Kalegaev, V.V.; Kovtyh, A.S.; Kuznetsov, N.V.; Osedlo, V.I.; Petrov, V.L.; Popova, E.P.; Poroykov, A.Y.; Rubinstein, I.A.; et al. Multi-Satellite Operative Monitoring of Near-Earth Radiation within the Universat-SOCRAT Project. Moscow Univ. Phys. Bull. 2018, 73, 687–695. [Google Scholar] [CrossRef]
- Sadovnichii, V.A.; Panasyuk, M.I.; Lipunov, V.M.; Bogomolov, A.V.; Bogomolov, V.V.; Garipov, G.K.; Gorbovskoy, E.S.; Zimnukhov, D.S.; Iyudin, A.F.; Kaznacheeva, M.A.; et al. Monitoring of Natural and Technogenic Space Hazards: Results of the Lomonosov Mission and Universat-SOCRAT Project. Cosm. Res. 2018, 56, 488–497. [Google Scholar] [CrossRef]
- Svertilov, S.I.; Panasyuk, M.I.; Petrov, V.L.; Bogomolov, V.V.; Iyudin, A.F.; Kalegaev, V.V.; Klimov, P.A.; Osedlo, V.I.; Peretyat’ko, O.Y.; Podzolko, M.V.; et al. Multi-Satellite Project UNIVERSAT-SOCRAT of Cubesat Grouping for Spacecraft and Aviation Radiation Hazard Warning System and First Experience of Moscow University Cubesat Missions. Adv. Astronaut. Sci. 2020, 173, 537–543. [Google Scholar]
- Bogomolov, V.V.; Dementiev, Y.N.; Iyudin, A.F.; Novikov, A.A.; Panasyuk, M.I.; Svertilov, S.I.; Yashin, I.V.; Korzhik, M.V.; Fedorov, A.A.; Kozlov, D.Y.; et al. Advanced Gamma Detector for Cubesats. Adv. Astronaut. Sci. 2020, 173, 537–543. [Google Scholar]
- Bogomolov, A.V.; Denisov, Y.I.; Kolesov, G.Y.; Kudryavtsev, M.I.; Logachev, Y.I.; Morozov, O.V.; Svertilov, S.I. Fluxes of quasi-trapped electrons with energies >0.08 MeV in the near-Earth space on drift shells L < 2. Cosm. Res. 2005, 43, 307–313. [Google Scholar]
Figure 1.
Parameters of solar wind and geomagnetic activity in late November–early December 2021. (Top panel) solar wind velocity vSW (red line), density ρSW (blue line). (Bottom panel) Kp (green line), Dst (violet line) indices.
Figure 1.
Parameters of solar wind and geomagnetic activity in late November–early December 2021. (Top panel) solar wind velocity vSW (red line), density ρSW (blue line). (Bottom panel) Kp (green line), Dst (violet line) indices.
Figure 2.
Electron flux Je distribution on McIllwine parameter L before, during (top panel) and after (bottom panel) geo-magnetic disturbances late November–early December 2021. Color of curves corresponds to the color of dates presented on the panels.
Figure 2.
Electron flux Je distribution on McIllwine parameter L before, during (top panel) and after (bottom panel) geo-magnetic disturbances late November–early December 2021. Color of curves corresponds to the color of dates presented on the panels.
Figure 3.
Time dependences of solar proton fluxes in different energy ranges from GOES data: >1 MeV (brown), >10 MeV (blue), >30 MeV (violet).
Figure 3.
Time dependences of solar proton fluxes in different energy ranges from GOES data: >1 MeV (brown), >10 MeV (blue), >30 MeV (violet).
Figure 4.
Time dependences of gamma-quantum (blue line), electron (red line) intensity from DeCoR Norbi data before (top panel), soon after (middle panel) and after (bottom panel) SCR arrival in end of October. Time dependence of McIllwine parameter L presented by black line on all the panels.
Figure 4.
Time dependences of gamma-quantum (blue line), electron (red line) intensity from DeCoR Norbi data before (top panel), soon after (middle panel) and after (bottom panel) SCR arrival in end of October. Time dependence of McIllwine parameter L presented by black line on all the panels.
Figure 5.
Profile of the event in solar cosmic rays according to data from the Norbi satellite (colored triangles, measurements were made in the polar caps—electrons with energies > 300 keV, as well as bremsstrahlung gamma quanta with energies > 100 keV) and the ACE spacecraft (black line, electrons with energy 175–315 keV).
Figure 6.
The AmurSat satellite orbit projection on the map for time interval 30 August 2019, 10:13:20–11:36:40. The big dot corresponds to the beginning of interval.
Figure 6.
The AmurSat satellite orbit projection on the map for time interval 30 August 2019, 10:13:20–11:36:40. The big dot corresponds to the beginning of interval.
Figure 7.
Monitoring counting measured 30 August 2019 during AmurSat satellite one orbit in plastic scintillator (green points), CsI(Tl) (red points), and total (blue points).
Figure 7.
Monitoring counting measured 30 August 2019 during AmurSat satellite one orbit in plastic scintillator (green points), CsI(Tl) (red points), and total (blue points).
Figure 8.
The DECART satellite orbit projection on the map for time interval 8 December 2021, 11:20–12:50. The big dot corresponds to the beginning of interval.
Figure 8.
The DECART satellite orbit projection on the map for time interval 8 December 2021, 11:20–12:50. The big dot corresponds to the beginning of interval.
Figure 9.
Monitoring counting measured 12 August 2021 during DECART satellite one orbit in plastic scintillator (red points), CsI(Tl) (blue points), and total (green points).
Figure 9.
Monitoring counting measured 12 August 2021 during DECART satellite one orbit in plastic scintillator (red points), CsI(Tl) (blue points), and total (green points).
| Publisher’s Note: MDPI stays neutral with regard to jurisdictional claims in published maps and institutional affiliations. |
© 2022 by the authors. Licensee MDPI, Basel, Switzerland. This article is an open access article distributed under the terms and conditions of the Creative Commons Attribution (CC BY) license (https://creativecommons.org/licenses/by/4.0/).


