Article

Interpersonal and Intrapersonal Variabilities in Daily Activity-Travel Patterns: A Networked Spatiotemporal Analysis

1
School of Urban Planning & Design, Peking University Shenzhen Graduate School, Shenzhen 518055, China
2
Faculty of Science, Division of Geography & Tourism, Katholieke Universiteit Leuven, 3000 Leuven, Belgium
3
College of Urban & Environmental Science, Peking University, Beijing 100083, China
*
Author to whom correspondence should be addressed.
ISPRS Int. J. Geo-Inf. 2021, 10(3), 148; https://0-doi-org.brum.beds.ac.uk/10.3390/ijgi10030148
Submission received: 31 December 2020 / Revised: 25 February 2021 / Accepted: 1 March 2021 / Published: 8 March 2021
(This article belongs to the Special Issue Geospatial Methods in Social and Behavioral Sciences)

Abstract

:
Interpersonal and intrapersonal variabilities are two important perspectives to understand daily travel behaviors, while only a small number of studies incorporate them for understanding human dynamics. This paper employed a network analysis approach to detecting daily activity-travel patterns of 680 Beijing’s residents within a week and then used a multilevel multinomial logit model to analyze the intrapersonal variability in patterns and the socioeconomic linkages behind them. Results suggest that most activity-travel patterns have significant day-to-day intrapersonal and interpersonal variabilities. This suggests that the application of a typical day of activity-travel behaviors to measure and represent a week’s or even longer-term behaviors may be biased, due to the existence of day-to-day intrapersonal variability. This study also provides a hint for the selection of days of a week to conduct a diary survey for activity pattern mining or travel demand modeling.

1. Introduction

With a shift from road capacity expansion to travel demand management in transportation planning, it is necessary to better understand the variability of travel behavior [1]. Behavioral variability includes interpersonal variability and intrapersonal variability. Most travel studies focus on explaining the variability of travel behavior of different individuals (or groups) in terms of socioeconomic attributes, built environment, and perceived accessibility [2,3,4,5,6]. In other words, the complexity of daily activity-travel patterns is subject to several spatiotemporal patterns determined by a set of individual characteristics of the traveler. The other one is intrapersonal variability, which describes the travel behavioral variability of individuals (or groups) from trip to trip, day to day, and week to week [7,8,9,10].
Most existing research on behavioral variability focused on interpersonal variability, while intrapersonal variability are under-researched. Individual daily activity-travel patterns were often assumed to be stable in the short term, and prediction of multi-day behaviors was usually achieved by choosing the travel behavioral characteristics of “typical day” to represent multi-day features [10]. In the reality, people’s daily travel patterns may significantly vary across days and weeks. Ignorance of day-to-day variability can easily lead to errors of travel demand model estimation and model interpretation [11]. Researchers found that sociodemographic characteristics which have been used to capture interpersonal variability hold large difference in explaining the level of intrapersonal variability [2,10], which shows the importance of intrapersonal variability analysis.
There are two major types of research on intrapersonal variability. One is based on the characteristics of travel behavior based on trip frequency, trip chain, travel time, time allocation, route choice, mode choice, and activity space [12,13,14,15]. However, these simplified measures do not regard the behavioral trajectory as a whole, and the integrity of travel behavior was neglected. The other is to measure the intrapersonal variability based on behavioral integrity, for example, based on activity chain patterns [16,17] and the measure of spatiotemporal prism [1,18]. Some attempts emphasize on the regularity of individual travel behavior, representing the repeated activity-travel episodes over time [19,20,21,22]. However, most holistic measurement of intrapersonal variability cannot well consider the characteristics of its sequence, dynamics, spatial-temporal interaction, and multi-dimensional attributes in pattern mining.
This is mainly due to the lack of multi-day mobility datasets and appropriate trajectory clustering methods. Traditionally, the collection of mobility data relies on the Origin-Destination (OD) data collection technology through travel surveys, including the in-person/in-home interviews since the 1970s, the computer-aided telephone interviewing (CATI) technique in the 1990s, and current Web, mail, GPS, and automatic fare collection (AFC) technologies [23,24]. Particularly, development of internet communication technology (ICT) and wearable devices (e.g., cell phone and GPS devices) make it possible for large-scale, long time-series, and fine-grained spatial-temporal trajectories, researchers have been able to observe behavioral variability at larger temporal scale, cover multi-dimensional attributes. To deal with these datasets, Zhang and Thill [25] proposed a spatiotemporal behavioral trajectory pattern mining method from the field of network science. This method not only measures the sequence of activities effectively, but also ensures its temporal concurrence. However, they fail to consider the day-to-day variability of activity-travel patterns and do not check the factors resulting in such interpersonal and intrapersonal variabilities.
To fill these gaps, this study thus focuses on two research questions: (1) How to extract variant activity-travel patterns from daily trajectory data and examine their intrapersonal variabilities? (2) Do the occurrence likelihoods of different activity-travel patterns significantly vary across the day of a week (i.e., intrapersonal variability) and between individual (i.e., interpersonal variability)? To examine these questions, we used the GPS-based activity-travel dairy data of suburban residents in 2012 Beijing. We firstly applied Zhang and Thill’s network analysis approach [25] to capturing day-to-day (intrapersonal) variability of activity-travel patterns in a week, thus detecting the typology of representative activity-travel patterns. We then developed a multilevel multinomial logit model to estimate the intrapersonal variability of different activity-travel patterns in a week and the relationship between socioeconomic attributes between the clusters of patterns.

2. Literature Review

2.1. Activity-Travel Pattern Mining

Activity-travel pattern mining can inform transportation policies with the information of target segments for tailor-made policy measures. To gain insights into the interpersonal and intrapersonal variability in activity-travel patterns, most of the research followed a two-step approach [26,27]. First is to find the interdependent activity-travel pattern with various pattern recognition methods. Second is to elucidate the relationship between these interdependent patterns and the corresponding factors with correlation analysis. These help transportation planners design better policies and envision more accurate forecasts of individual’s travel demands.
Current patterns mining methods for spatiotemporal behavior trajectories mainly include hot-spot detection, clustering based on trajectory similarity, and sequential alignment method [28,29,30,31]. First, hotspot detection refers to the analysis of spatial and temporal density distribution of point or line elements in trajectory data [32,33,34], which decomposes the space-time paths into several discrete events and aggregates them according to their spatial and temporal distribution and density characteristics. However, it often needs to split a whole behavior trajectory into several fragments, so only fragmented behavior pattern features can be obtained.
In addition to the hot-spot detection, there are some other qualitative and quantitative technologies to extract space-time behavioral patterns from trajectories data. As summarized by Thériault et al. [35], there are two complementary GIS methods used to analyze the dynamics of entities in space, including deductive methods that search for qualitative reasoning behind the spatial dynamics and inductive methods that examine the properties and trends of the distribution of the entities in space using spatial statistical toolkits, such as the point clustering analysis, minimum convex polygon detection, centrographic analysis, and spatial autocorrelation analysis. Thériault et al. [35] further developed an approach combining both deductive and inductive methods to understand the qualitative reasoning behind the point changes in spatiotemporal evolution of entities, as well as to measure the overall spatial patterns and their evolution of a set of entities. Similar qualitative or quantitative measures have been used to categorize varying behavioral patterns in space and time as well as to track the changing pattern of activity space [12,36,37].
Second, there are many types of trajectory-based similarity measurement and dissimilarity measurement (e.g., distance). One of the most commonly used methods is to extract key variables from spatiotemporal behavior trajectories and measure vector distances, followed by cluster analysis [16,20]. Common distance measures include Euclidean distance, Mahalanobis distance, Hamming distance, minimum outer rectangular distance, etc. [33,38,39]. However, these distance-based approaches are often difficult to consider the similarity of trajectory’s temporal dimension. They are not suitable for trajectory data with different lengths, acquisition frequencies and time scales, and often neglect the sequence, or the order of activities [22].
The third genre of pattern mining relies on the sequential alignment method (SAM), which measures the distance between behavior trajectories directly, including dynamic time planning (DTW), longest common subsequence (LCS), and edit distance-based alignment method. A key advantage of SAM is its capability to consider the multiple attributes and the compositional and sequential characteristics of human activity patterns [39]. Early sequential alignment measurements focused mainly on activity type alignment of trajectory sequence, without considering other multi-dimensional attributes of activity, such as location, timing, duration, travel mode, arrival time at the destination, accompany person, and existence of secondary activities, while recent analysis began to consider these attributes, forming a multi-dimensional sequential alignment method [2,29,39,40,41]. Although the SAM can effectively measure the sequence similarity of activity events, it ignores the temporal concurrence of activity occurrence, and is difficult to measure the spatial interaction between activities. Moreover, the computational cost is high, especially for large dataset, and the computational efficiency is low [25].

2.2. Interpersonal and Intrapersonal Variabilities

Many interpersonal variability studies focused on the associations between sociodemographic attributes or built environment and specific individual’s mobility features, such as route choice, travel mode, destination choice, health-engagement activity. For example, Abdel-Aty and Kitamura [42] explored interpersonal variability in relation to route choice, the results showed that travel time, traffic safety, and roadway characteristics are of significance on route choice. Larsen et al. [43] found that gender, trip distance, land use mix level, and presence of street trees are positively associated to children’s travel mode. Yang et al. [44] concluded individual occupation as an important factor which influences the work destination choice. Moudon et al. [45] found strong correlation between sociodemographic attributes, built environment and individual’s health-enhancement walking activity. Jahre et al. [46] studied the type of bike use and its relation to sociodemographic attributes, finding that ethnicity correlated to the bike use. In addition to urban activity-travel behavior, studies also focused on the rural travel activity. Fan et al. [47] studied the influence of built environment and sociodemographic characteristics on active commuting in America rural area, finding that sociodemographic factors explained more variance in active commuting than physical environmental factors. Some researchers also investigated interpersonal variability from the perspective of household characteristics, and perceived accessibility variables [5,48,49]. These studies provide interesting insights into the interpersonal variability, but the intrapersonal variability, or day-to-day variability, was ignored and left uncovered.
There are two main causes of the intrapersonal variability in travel behavior: (1) From the perspective of time geography, individual behavior is driven by needs and desires, which are determined by a set of constraints. The needs, desires and the constraints on individuals are different every day [1,50]. (2) The variation of daytime behavior is the feedback to the built environment. Changes in urban environment, transportation system, population or socio-economic structure at both macro and micro levels induce the temporal variation of activity-travel patterns. The dynamics of behavior may come from the randomness associated with travelers’ values, perceptions, attitudes, needs, preferences, and decision-making processes [1].
At present, the research on intrapersonal variability mainly focuses on individual urban travel behavior in trip frequency, trip chain, departure time, route choice, time allocation, activity space, and other behavioral indicators by using longitudinal travel survey data. Pas [8] used the dataset of an activity diary survey to measure intrapersonal variability by examining the daily trip frequency (the difference between individual daily trip frequency and average trip frequency over a period). Hatcher and Mahmassani [51] used data from a sample of commuters in Austin, Texas, to examine whether the departure time or route for a given day was different from the previous day, as well as the deviation from the median departure time and the most commonly used route. Taking these as indices to measure intrapersonal variability of individuals, they studied the day-to-day variability of trip frequency, departure time and morning commuting route choice. Chikaraishi et al. [52] decomposed the total variation of departure time choice into five components: spatial variation, temporal variation, inter-household variation, inter-individual variation, and intra-individual variation. Moreover, they used multi-level analysis approach to analyze the proportion of each type of variation. Susilo and Axhausen [53] explored the stability and variability of individual daily activity-travel-location patterns based on Herfindahl–Hirschman index.
As the emergence of multiple-day daily data, a limited number of recent studies has attempted to investigate both behavioral variability in a comprehensive and integrated framework. For example, Dharmowijoyo et al. [5] studied day-to-day interpersonal and intrapersonal variability of individuals’ activity spaces with four-consecutive-day Household Activity-Travel Survey Database of Jakarta Metropolitan Area. Their results showed that intrapersonal variability is more important than interpersonal in terms of total squared distance of individual out-of-home activity locations to the centroid of activity locations. Zhang et al. [10] investigated multi-day activity-travel patterns sampling based on single-day data with the Mobidrive six-week travel diary dataset and reported that interpersonal variability observed in cross-sectional single-day data of a group of people can be used to generate the day-to-day intrapersonal variability. Egu and Bonnel [6] explored day-to-day variability of transit usage on a multi-month scale with smart card data. Findings suggested that it is possible to correlate this intrapersonal variability to interpersonal variability using cluster analysis. All the above studies show substantial relationships between interpersonal and intrapersonal variability, and more importantly, highlight the importance of combining interpersonal and intrapersonal variations to gain in-depth understandings on behavioral variability studies.

3. Method

The research methods of this article include two parts. We first applied the network analysis approach proposed by Zhang and Thill [25] to convert individual-based trajectory data into individual-by-individual networked data and used the community detection algorithm (i.e., the Louvain method) to cluster individuals into groups by their cohesive activity-travel patterns. Different from Zhang and Thill’s analysis, this study continued to compare the intrapersonal (day-to-day) variability of daily activity-travel patterns in a week. In order to statistically test the intrapersonal and interpersonal variations in daily activity-travel patterns, we used a multilevel multinomial logit model to examine whether the activity-travel patterns significantly vary across days of a week and their associations with individual’s socioeconomic attributes.

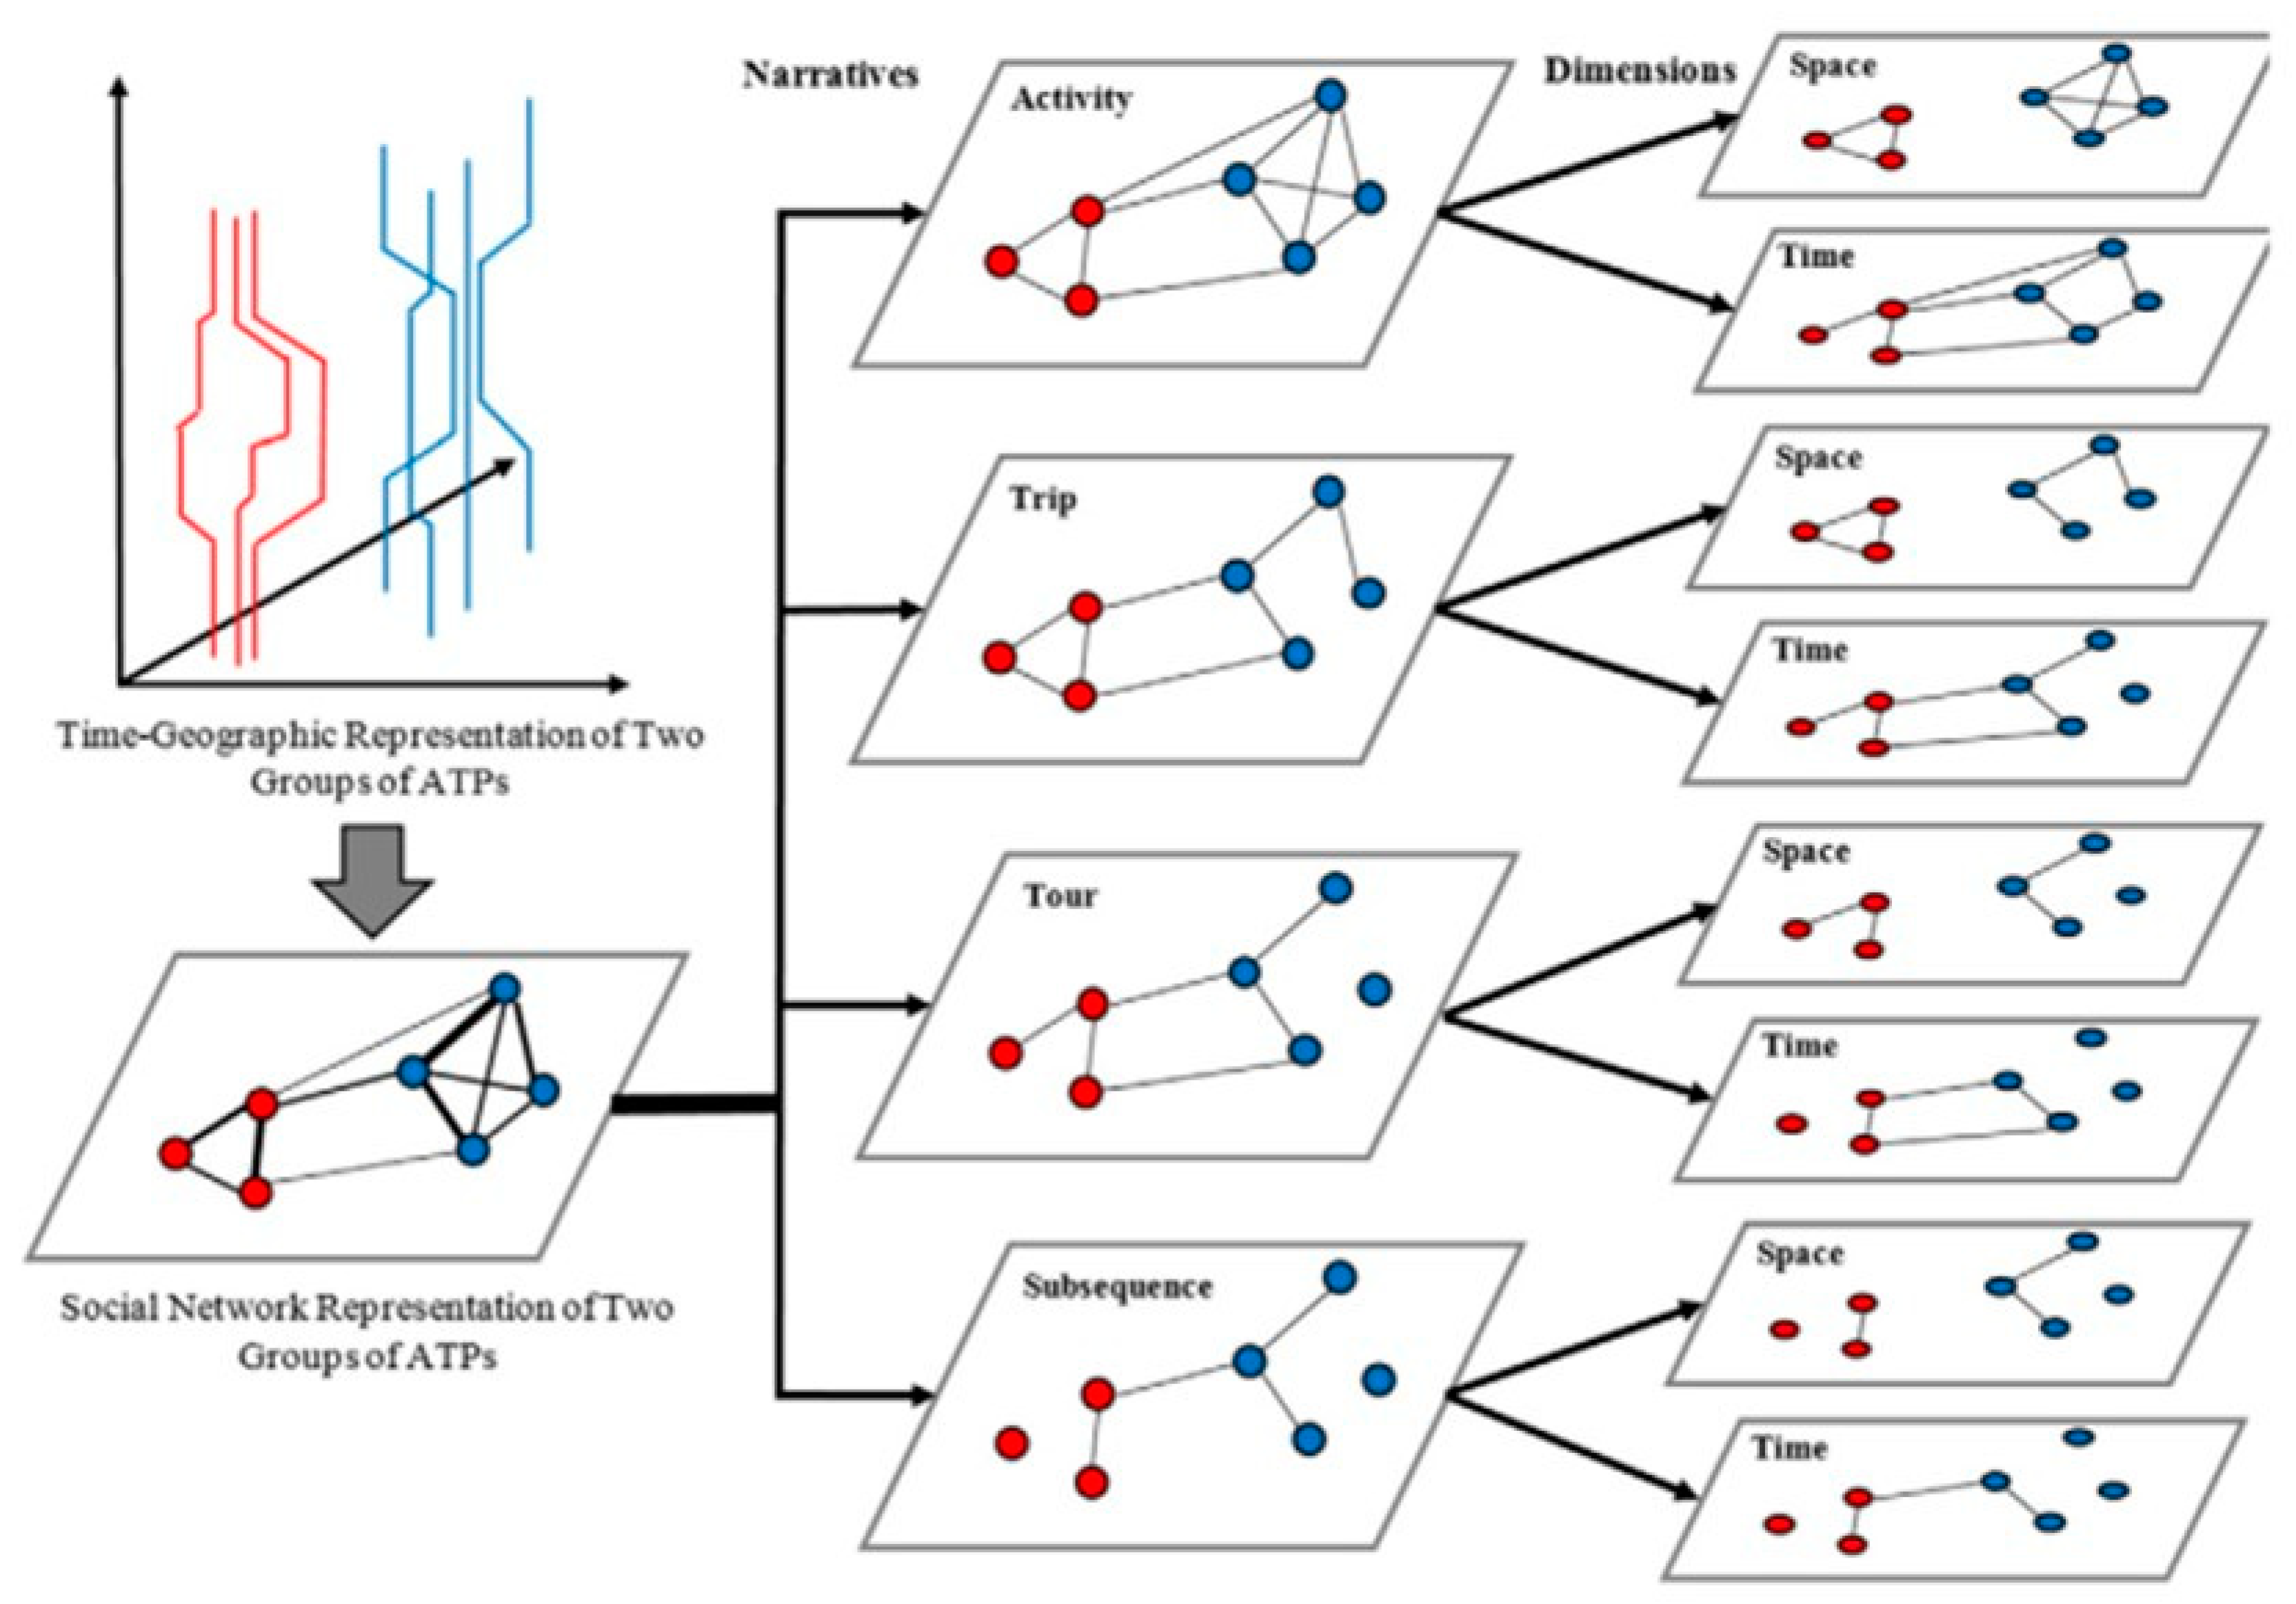
3.1. A Network Analysis Approach

Based on the social affiliation theory of Georg Simmel, Zhang and Thill [25] proposed a new method of activity-travel patterns mining. They constructed the interpersonal relationship network by calculating the strength (or degree of similarity) between individuals and used the community detection algorithm in the field of complex network analysis to conduct pattern mining and visualization of individual’s spatiotemporal activity-travel trajectories.
This method consists of two steps. Firstly, we need to transform the spatiotemporal activity-travel trajectory (or time-geography paths) into a two-mode network based on individual and activity-travel event. Secondly, based on the spatiotemporal relationships among the behavioral events formed under different narrative modes (e.g., activity, trip, tour, sequence, and a composite of previous four narrative modes), a two-mode network is transformed into an individual-based one-mode network by constructing the adjacency matrix between individuals. Figure 1 shows the process of transforming spatiotemporal activity-travel trajectory into individual-by-individual network based on four different narrative modes and their spatiotemporal connections.
Specifically, Equation (1) represents the calculation of individual-by-individual adjacency matrix based on the shared duration of the conjoint events between individuals i and j, as defined in Equation (2), and the spatial distance between the two events as defined in Equation (3). By Equations (1)– (3), the space-time trajectory is transformed into the adjacency matrix of the network between individuals, the element value of the adjacency matrix ranges from 0 to 1. The higher the value, the higher the similarity between two individuals.
R n a k i , j = T u i k , v i k , u j k , v j k 1 S s = 1 S D l s , i k , l s , j k       n activity , trip , tour
T u i k , v i k , u j k , v j k = m i n v i k , v j k m a x u i k , u j k
D l s , i k , l s , j k = e x p γ d l s , i k , l s , j k
where a k i , j is the k-th (k = 1, …, K) common conjoint event of individual i and j, R n a k i , j denotes the strength of connection defined by the k-th conjoint event of individual i and j from the perspective of n-class narrative, while n-type events include activity, trip and tour defined previously, with a value range of 0 to 1. The larger the value, the greater the similarity. If i and j do not have a common conjoint event, the R n a k i , j would be 0. T · is the overlap time of common conjoint events, u i k represents the start time of individual i for common conjoint event, v i k denotes the end time, similar for u j k and v j k . S denotes the number of locations of common conjoint events, D · is the spatial function based on Euclidean distance, l s , i k denotes the s-th location of individual i based on common conjoint event k, 1 S s = 1 S D l s , i k , l s , j k represents the average spatial distance of the common conjoint event.
Given the narrative mode n and K common conjoint event shared by each pair individuals i and j, we can compute the adjacency matrix A i j = k = 1 K R n a k i , j . The above equations are subjective to the calculation processes when n is a narrative mode of activity, trip or tour events. When n is a sequence, the calculation equations have subtle changes: the time relationship is no longer the overlapping time of the k-th common conjoint event, but the minimum duration of the k-th common conjoint event in the similar sequence. When n is a composite event, the aggregate adjacency matrix of four narrative perspectives is calculated according to the specific weighted index of each narrative perspective. In summary, the adjacency matrix by individual A i j is determined by two parameters: the type of narrative mode n and the spatial interaction parameter γ . In this study, we focused on the activity event, and the parameter γ is set at 0, because this study mainly looks at interpersonal and intrapersonal variabilities between different activity-travel patterns. If we consider the spatial interaction, it can divide individuals of the same activity-travel pattern into several groups in different locations, but it is not the focus of this study.
Finally, based on the adjacency matrix A i j derived above, we used the Louvain method [54] to partition the individual-by-individual network into communities, in order to maximize the quality score, or the modularity Q, as defined below:
Q = 1 2 m i , j A i j k i k j 2 m δ c i , c j
where A i j represents the weight of linkage strength between individual nodes i and j in the network, k i = j A i j is the sum of the edge weights attached to vertex i, c i is the community to which the individual i is assigned, the δ function δ(u, v) is 1 if u = v and 0 otherwise and m = 1 2 i j A i j . Intuitively, this modularity-maximization method aims to search for the best partition or community property, in which the interconnections or similarities inside the communities are much larger than those between communities. While there are many modularity-maximization methods, this study selected the Louvain method because (1) its algorithm is fast and highly efficient, particularly for a large data set; and (2) it is non-parametric and unsupervised, with the number of partitions determined by the algorithm [55,56,57,58].
After the analysis of community detection, we can derive an outcome of partition (i.e., a set of communities with similar activity-travel patterns). By using such a clustering outcome, we can simply tabulate the day-to-day variability and check whether the detected communities (i.e., groups of activity-travel patterns) vary across days within a week (e.g., between the weekday and weekend). Furthermore, we developed a multilevel model, as introduced in the next section, to estimate whether the intrapersonal and interpersonal variabilities in activity-travel patterns are significant in statistics.

3.2. Multilevel Multinomial Logit Model

In this section we developed a two-level multinomial logit model to estimate the intrapersonal variability (i.e., whether the detected category of activity-travel patterns varies across days in a week) and interpersonal variability (i.e., whether the detected category varies with individual’s socioeconomic characteristics). We used a multinomial-logit form of model because the dependent variable is the class of detected communities or patterns, which is a multiple categorical variable [59,60]. Furthermore, we developed a two-level regression model, because the independent variables are measured at two levels, with day variables nested within each individual. Table 1 defines and describes both dependent and independent variables used in the model. The specification of a two-level multinomial logit model is written as follows:
Level   1 : η i j m = β o m + β i m Day i j + ε i j m
Level   2 : β 0 m = γ 00 m + γ 0 s m Individual   Attriibutes s j + μ 0 j m
Here, in Level-1′s equation, η i j m is the odd ratio of an individual j has a Type-m activity-travel pattern on Day i (i = Monday, …, Sunday). m = 1, …, M−1, given there are M-type of communities detected by the previous community detection analysis and the Type-M community is set as the reference class. Day i j is a dummy day variable, and Day i j equals one when the day is i, otherwise zero. β o m is the constant; β i m is the coefficient of a Day variable; ε i j m is the error term. At Level-2, we further assume the constant terms vary with different individuals and are associated with individual socioeconomic attributes. The model is finally estimated by using the maximum likelihood estimation method.

4. A Case Study in Beijing, China

4.1. Data and Variables

The research data comes from a one-week activity-travel diary survey in the Shangdi-Qinghe area of Beijing from September to December 2012. This survey recorded individual residents’ activity and travel trajectory data within seven consecutive days by wearable GPS devises, in combination with an interactive website survey which collected residents’ socioeconomic attributes and activity diary for each day of the week. The questionnaire of the activity diary includes the investigation of starting and ending time of each activity, activity details, travel mode, activity and travel companion(s), activity-travel flexibility, etc.
Finally, the survey collected the data of 680 residents from 23 neighborhoods and 19 representative companies, including 456 neighborhood samples and 224 company samples. Although the residents were asked to report their diaries of all the seven days in a week, some of them only recalled several days less than a week. After cleaning the missing data, we finally have 3793 person days for the analysis. Table 1 shows the description and statistics of intrapersonal and interpersonal characteristics.
Figure 2 is a time-geography representation of the trajectory data. The horizontal coordinates represent two-dimensional space (such as longitude and latitude), while the vertical coordinates represent the temporal axis. Each trajectory displays a person’s activity travel within seven days, and colored lines represent different types of activity events. This study focuses on one-week individual spatial-temporal activity-travel pattern.

4.2. Analytical Results

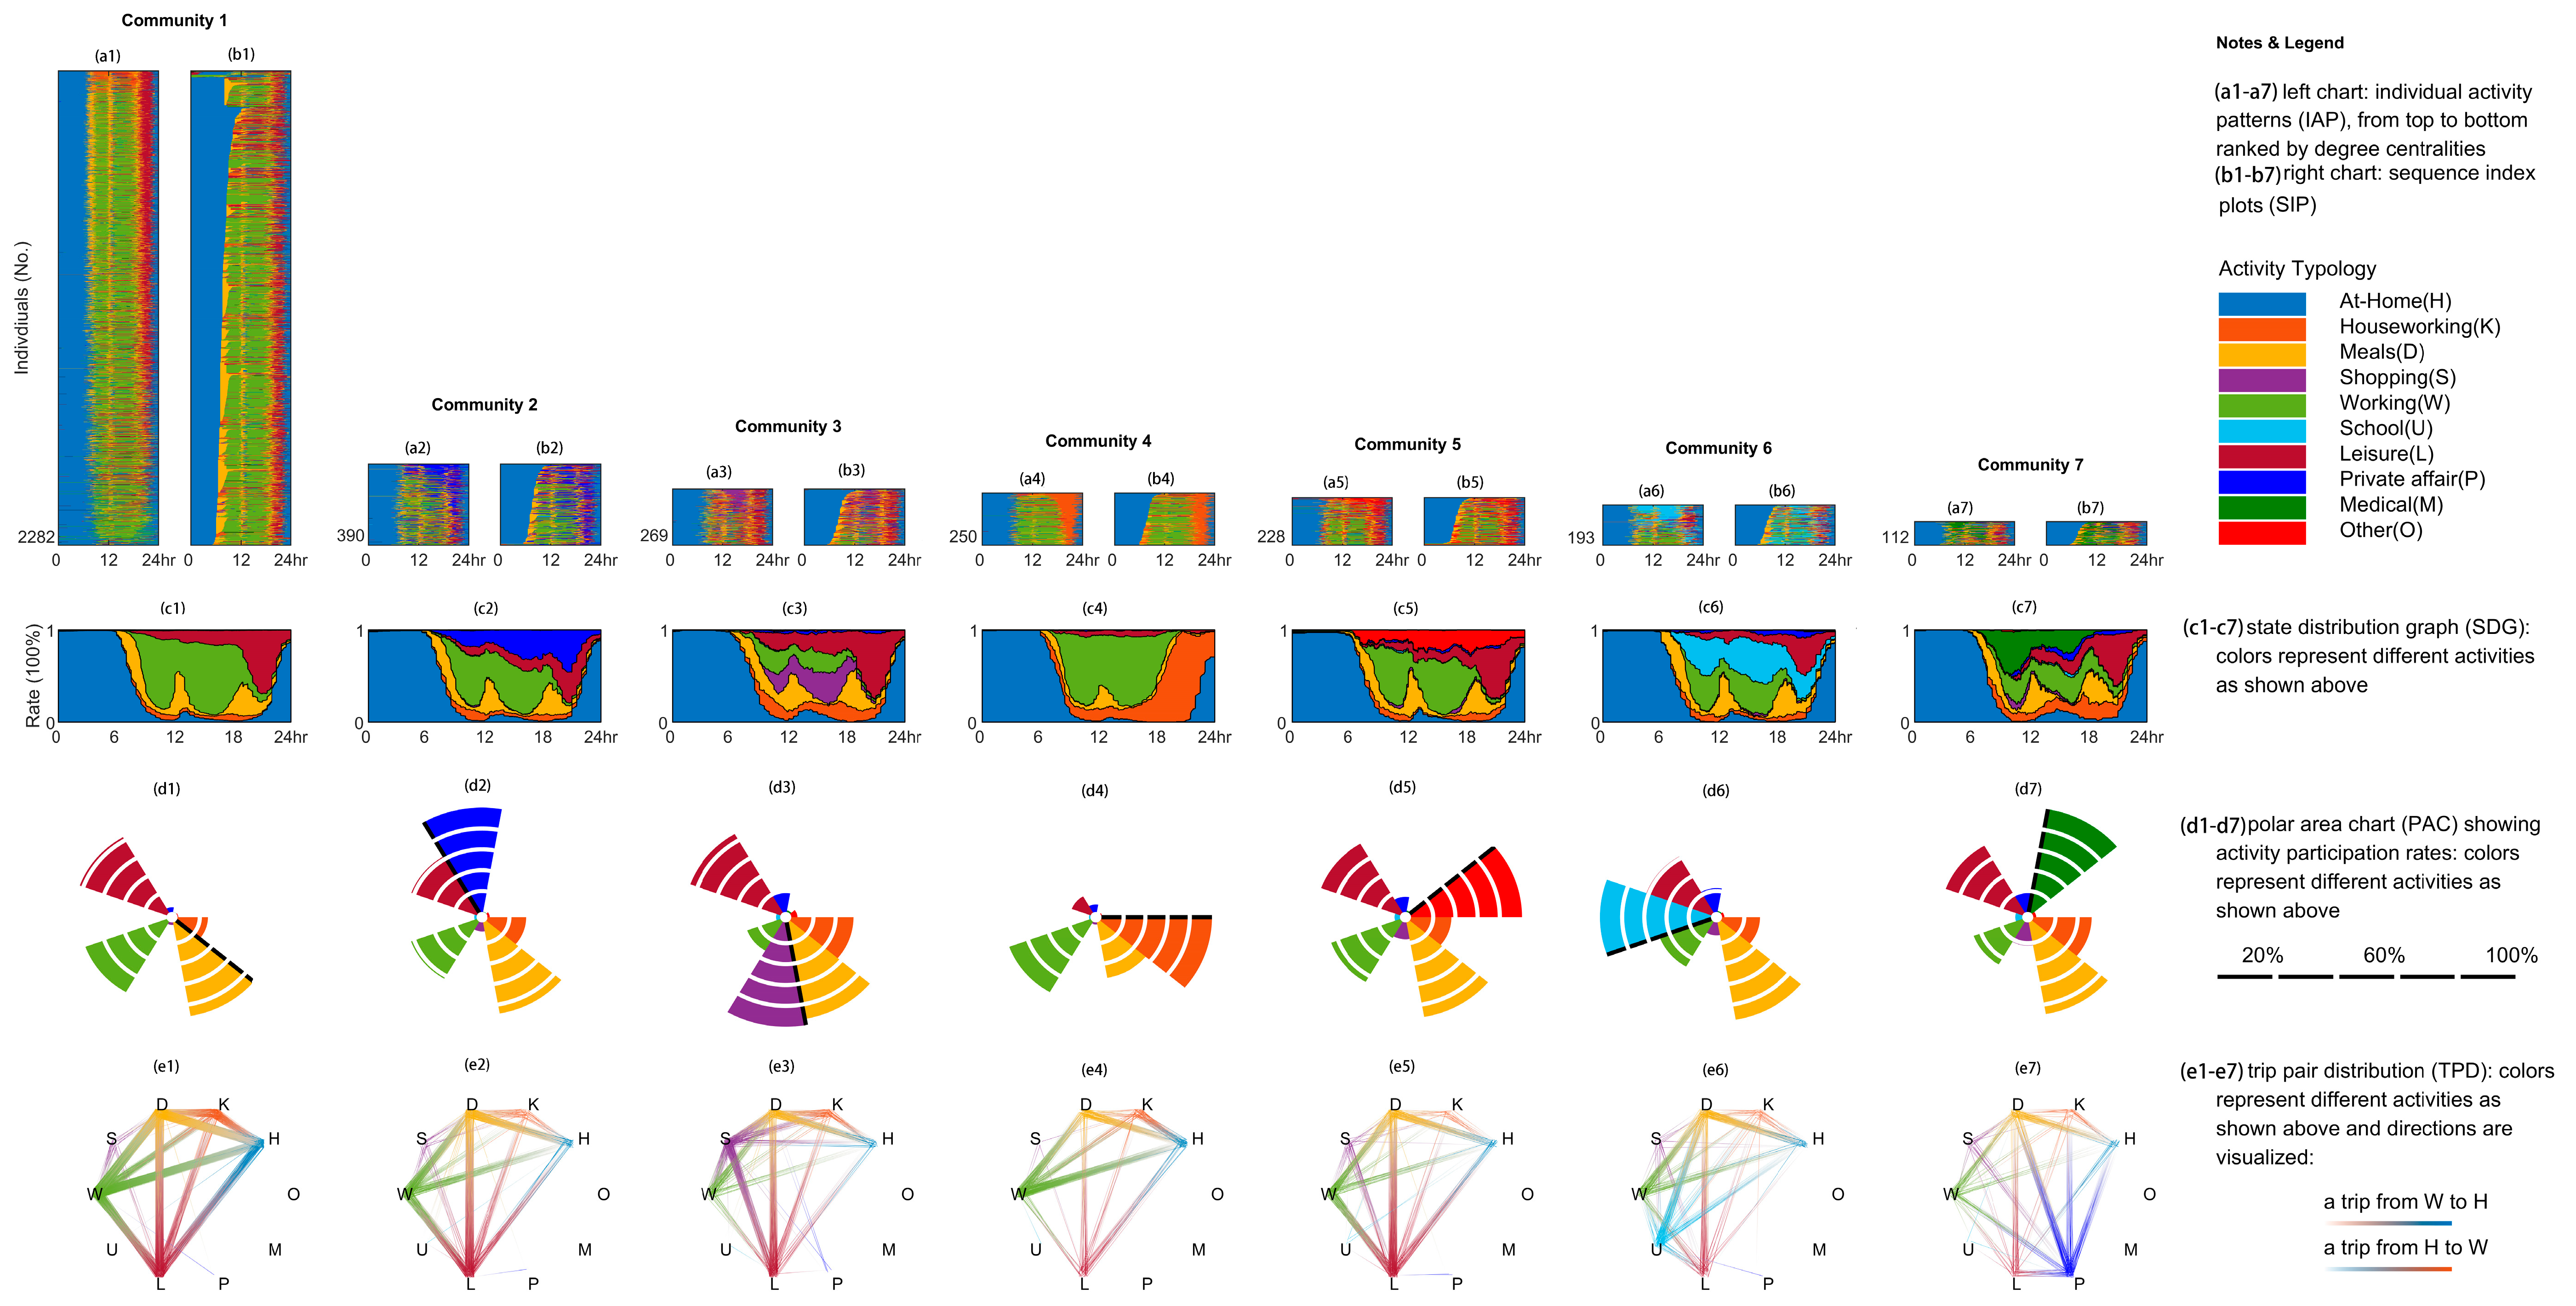
4.2.1. Activity-Travel Patterns and Their Variabilities across Days in a Week

The network analysis approach divided the daily trajectories of 680 residents into nine communities or clusters, with a modularity value of 0.44. As defined in Equation (4), this value represents the quality of the partition detected by the community detection algorithm (i.e., the Louvain method here). When the value is between 0.3 and 0.7, the partition is deemed as well-detected [61]. Because two communities only have a small number of person-day trajectories, we focused on the rest of 7 communities with more than 100 trajectories in the communities. Figure 3 visualizes varying activity patterns by day of the seven communities, including the plots of daily activity sequence (Figure 3a), sequence index plot (b), state distribution graph (c), polar area chart (d), and trip pair distribution (e). Colors in these plots indicate 10 types of daily activities, including at-home activities, housework, meals, shopping, working, school, leisure (including exercise, entertainment, and travelling), private affair (including family or friend visiting, running errands, and taking care of the elderly and children), medical, and other activities.
As shown in Figure 3, different communities have varying activity-travel patterns. Among them, the activity-travel pattern as shown in Community 1 is a dominant type of pattern, consisting of 2282 person-days of trajectories and accounting for 60.16% of the total observations. Residents of the Community 1 have a typical day dominant by working activities (hereinafter referred to the working pattern). This pattern is characterized by working activities in the daytime between the breakfast and lunch and between the lunch and the dinner, along with leisure and recreational activities after 6 p.m.
By contrast, the primary activity-travel pattern in Community 2 is the private affair-oriented pattern (i.e., the private-affair pattern), containing leisure and private affairs activities (both peaked after 6 p.m.) except for working and having meals. The dominant activity of the pattern is private affair. This Community has 390 person days, comprising 10.28% of the total observations. Community 3 is primarily the leisure-oriented pattern (i.e., the leisure pattern), which is characterized by multiple types of activities and dominated by leisure, recreational (peaked at 9 p.m.) and shopping (peaked at 3 p.m.) activities. This community contains 269 person days, accounting for 7.09% of the total observations. In addition, Community 4 is dominated by working and housework activities (i.e., the working-housework pattern). Communities 5–7 have a relatively lower percentage of person-day trajectories, with a significant pattern dominated by other activities, school-related activities, and medical activities, respectively.
We further calculated the proportional distribution of the 7 activity-travel patterns detected across a week, as shown in Table 2. The distribution significantly varies across days of a week. For example, the working pattern as detected in Community 1 is not distributed evenly from Monday to Sunday, but more likely to occur on the weekday while less likely on the weekend. By contrast, the private-affair pattern, the leisure pattern and the school-related pattern are more likely to occur on the weekend. As to the leisure pattern, the proportional gap between the weekday and the weekend is significant. In addition, there is a lower probability to see the private-affair pattern on Thursday, the leisure pattern on Tuesday, and the school pattern on Monday. Similarly, the occurrence likelihood of the other-activities pattern is the lowest on Saturday but the highest on Sunday. The occurrence likelihood of the medical-activity pattern appears periodic, with relatively higher proportions on Monday, Wednesday, Friday, and Sunday. These findings demonstrate that the occurrence likelihood of specific activity-travel patterns may vary between weekday and weekend, as well as between the day of weekday/weekend.
In addition, we calculated the proportion of different types of activity-travel patterns during the weekday (five consecutive days), the weekend (two consecutive days), and a full week (seven consecutive days), to see to what extent individuals present more than one pattern in different time periods. In the weekday, the proportion of individuals with two types of activity-travel patterns is the highest (45.78%), followed by one type (33.73%) and three different patterns (18.37%), respectively. Less than 3% individuals have more than three types of activity-travel patterns in the weekday. In the weekend, more individuals (53.24%) have two types of patterns. For an entire week, two types (40.82%) of activity-travel patterns are the most found among the samples, followed by the three types (29.08%).

4.2.2. Testing Intrapersonal and Interpersonal Variabilities of Activity-Travel Patterns Using a Multilevel Model

Table 3 shows the estimated effects of intrapersonal (i.e., the observed day of a week) and interpersonal (individual socioeconomics) variations on the occurrence likelihood of the seven activity-travel patterns, based on the multilevel multinomial logit model. Based on the significance test, we can find that not all of activity-travel patterns have significant intrapersonal or day-to-day variability, such as the pattern of working-housework, while some significant day-to-day variations exist in the patterns of private-affair, leisure, school, other-activities and medical-activities. Particularly, compared to Monday, the patterns of private-affair, leisure, and school-related are more likely to occur on the weekend, and the patterns of other-activities and medical-activity are more likely to occur on Sunday. On the one hand, these statistical findings generally correspond to the descriptive analysis in last section. The assumption of using a typical day to measure the activity-travel pattern may result in significant biased findings. These findings are consistent with some existing studies (e.g., [2,10]). On the other hand, the activity-travel patterns have no significant variations in the weekday, but significant variations in the weekend, after controlling for socioeconomic features. This finding provides a hint for the selection of days of a week to conduct a diary survey of activity pattern or travel demand. In general, if researchers want to estimate the activity-travel pattern or the travel demand in the research area, the selection of at least three days within a week as the typical days is necessary: one from the weekday and two of the weekend.
To investigate the interpersonal variability of activity-travel patterns, we need to look at the individual socioeconomic correlates of the occurrence likelihood of a specific pattern. Findings suggest that after controlling for the intrapersonal variations, the occurrence likelihoods of most activity-travel patterns vary between individuals; the interpersonal variability prevalently exists. For example, the married individuals are more likely to have private-affair pattern, even compared to the occurrence of working pattern. Furthermore, the groups of the male, aged between 40 and 50, medium education level and employed status have lower probabilities to present a private-affair pattern, compared to the other groups. Similarly, the occurrence of the leisure pattern significantly varies with gender, employment status, income level, and marital status. Interestingly, the working-housework pattern is preferable for people with age between 30 and 50, while the medical-activity pattern is preferable for people with age above 50, hukou in Beijing and high-education level. These findings also demonstrate that the interpersonal variability varies between the activity-travel pattern.

5. Discussion and Conclusions

This paper investigates the intrapersonal and interpersonal variabilities in activity-travel pattern mining. We developed a method incorporating a network analysis approach (e.g., the community detection algorithm) with a multilevel multinomial logit model to measure and estimate intrapersonal and interpersonal variabilities. Particularly, we firstly used the network analysis approach to detect activity-travel patterns within a week of 680 residents in Shangdi-Qinghe area, Beijing. We then adopted a multilevel multinomial logit model to analyze the day-to-day variability of different patterns and their associations with days of the week and individual’s socioeconomic attributes.
In this study we transformed the person-day trajectory data into network data and then used the Louvain algorithm to partition the trajectories into clusters or communities. The algorithm detects seven large communities of activity-travel patterns, which are characterized as the working pattern, private-affair pattern, leisure pattern, working-housework pattern, other-activities pattern, school pattern, and medical-activity pattern. Modeling findings suggest that most activity-travel patterns have significant intrapersonal or day-to-day variability while some have not, such as the working-housework pattern. The occurrence probabilities of most activity-travel patterns vary between weekday and weekend but have no significant difference between Monday to Friday. The patterns of private-affair, leisure and school-related are more likely to occur in the weekend, while the patterns of other-activities and medical-activity are preferable on Saturday. These findings suggest that application of a typical day of activity-travel behaviors to represent a week’s or even longer-term behaviors may be biased, due to the existence of day-to-day intrapersonal variability. Further, finding provides a hint for the selection of days of a week to conduct a diary survey of activity pattern or travel demand.
In addition, the multilevel multinomial logit modeling results reveal significant interpersonal variations in activity-travel patterns. Findings suggest that women have a higher level of interpersonal variabilities than men, whose activity-travel patterns tend to be more diversified, and the female’s time-allocation differences of different patterns are larger, which may be related to their social constraints.
This study also demonstrates the advantage of an incorporation of network analysis approach and multilevel multinomial logit model to spatiotemporal behavior pattern mining. This approach provides a feasible framework for integrating interpersonal and intrapersonal variabilities, which yielding new insights into activity travel pattern and linkage to the individual’s socioeconomic attributes. The analytical framework thus helps researchers and policymakers better understand different activity-travel patterns and the underlying variabilities.
There are some limitations that deserve further investigations. First, although this study relying on a week’s activity-travel data can reveal both intrapersonal and interpersonal variabilities in activity-travel patterns, it fails to capture the robust variabilities which often occur in the longer term. Future work should try to collect a longer-term dataset, for example, by using one-month or longer-period mobile phone signaling data. By comparing behavioral data in the short run and long run, we can further examine whether the individual residents have seasonal variations in activity-travel arrangement. Second, because this study only focused on a typical suburban area in Beijing, modeling findings might be biased. Future studies should investigate and compare other areas in Beijing and even other cities around the world.

Author Contributions

Conceptualization, Wenjia Zhang; Methodology, Chunhan Ji and Wenjia Zhang; Data processing and analysis, Chunhan Ji and Yanwei Chai; Resources, Yanwei Chai; Writing—original draft preparation, Chunhan Ji, Hao Yu, Wenjia Zhang, and Yi Zhao; Writing—review and editing, Wenjia Zhang and Chunhan Ji. All authors have read and agreed to the published version of the manuscript.

Funding

This research was funded by the National Natural Science Foundation of China, grant number 41801158, Shenzhen Municipal Basic Research Project (Free Exploration), grant number JCYJ20180302153551891, and Shenzhen Municipal Natural Science Foundation, grant number: JCYJ20190808173611341.

Institutional Review Board Statement

No applicable.

Informed Consent Statement

No applicable.

Data Availability Statement

The data is available from the authors upon reasonable request.

Acknowledgments

Thanks to all those who helped with this article.

Conflicts of Interest

The authors declare no conflict of interest.

References

  1. Pendyala, R.M.; Yamamoto, T.; Kitamura, R. On the Formulation of Time-Space Prisms to Model Constraints on Personal Activity-Travel Engagement. Transportation 2002, 29, 73–94. [Google Scholar] [CrossRef]
  2. Raux, C.; Ma, T.-Y.; Cornelis, E. Variability in Daily Activity-Travel Patterns: The Case of a One-Week Travel Diary. Eur. Transp. Res. Rev. 2016, 8, 26. [Google Scholar] [CrossRef]
  3. Elias, W.; Shiftan, Y. Ethnic Groups Differences in Regard to Social Networks, Daily Activity Patterns, and Driving Behavior. Transp. Res. Part F Traffic Psychol. Behav. 2017, 46, 316–328. [Google Scholar] [CrossRef]
  4. Lee, J.H.; Davis, A.; Yoon, S.Y.; Goulias, K.G. Exploring Daily Rhythms of Interpersonal Contacts: Time-of-Day Dynamics of Human Interactions with Latent Class Cluster Analysis. Transp. Res. Rec. 2017, 2666, 58–68. [Google Scholar] [CrossRef]
  5. Dharmowijoyo, D.B.E.; Susilo, Y.O.; Karlström, A. Analysing the Complexity of Day-to-Day Individual Activity-Travel Patterns Using a Multidimensional Sequence Alignment Model: A Case Study in the Bandung Metropolitan Area, Indonesia. J. Transp. Geogr. 2017, 64, 1–12. [Google Scholar] [CrossRef]
  6. Egu, O.; Bonnel, P. Investigating Day-to-Day Variability of Transit Usage on a Multimonth Scale with Smart Card Data. A Case Study in Lyon. Travel Behav. Soc. 2020, 19, 112–123. [Google Scholar] [CrossRef]
  7. Hanson, S.; Huff, J.O. Assessing Day-to-Day Variability in Complex Travel Patterns; Transportation Research Board: Washington, DC, USA, 1982. [Google Scholar]
  8. Pas, E.I. Intrapersonal Variability and Model Goodness-of-Fit. Transp. Res. Part A Gen. 1987, 21, 431–438. [Google Scholar] [CrossRef]
  9. Schönfelder, S. Urban Rhythms—Modelling the Rhythms of Individual Travel Behaviour. Ph.D. Thesis, Swiss Federal Institute of Technology Zurich, Zurich, Switzerland, 2006; p. 274. [Google Scholar] [CrossRef]
  10. Zhang, A.; Kang, J.E.; Axhausen, K.; Kwon, C. Multi-Day Activity-Travel Pattern Sampling Based on Single-Day Data. Transp. Res. Part C Emerg. Technol. 2018, 89, 96–112. [Google Scholar] [CrossRef]
  11. Pas, E.I.; Sundar, S. Intrapersonal Variability in Daily Urban Travel Behavior: Some Additional Evidence. Transportation 1995, 22, 135–150. [Google Scholar] [CrossRef]
  12. Kwan, M.-P. Gender and Individual Access to Urban Opportunities: A Study Using Space—Time Measures. Prof. Geogr. 1999, 51, 211–227. [Google Scholar] [CrossRef]
  13. Kwan, M.-P. Space-Time and Integral Measures of Individual Accessibility: A Comparative Analysis Using a Point-Based Framework. Geogr. Anal. 2010, 30, 191–216. [Google Scholar] [CrossRef]
  14. Buliung, R.N.; Roorda, M.J.; Remmel, T.K. Exploring Spatial Variety in Patterns of Activity-Travel Behaviour: Initial Results from the Toronto Travel-Activity Panel Survey (TTAPS). Transportation. 2008, 35, 697–722. [Google Scholar] [CrossRef]
  15. Heinen, E.; Chatterjee, K. The Same Mode Again? An Exploration of Mode Choice Variability in Great Britain Using the National Travel Survey. Transp. Res. Part A Policy Pract. 2015, 78, 266–282. [Google Scholar] [CrossRef] [Green Version]
  16. Huff, J.O.; Hanson, S. Repetition and Variability in Urban Travel. Geogr. Anal. 2010, 18, 97–114. [Google Scholar] [CrossRef]
  17. Huff, J.O.; Hanson, S. Measurement of habitual behaviour: Examining systematic variability in repetitive travel. In Developments in Dynamic and Activity-Based Approaches to Travel Analysis; Oxford Studies in Transport; Jones, P., Ed.; Avebury: Aldershot, UK, 1990; pp. 229–249. ISBN 978-0-566-07023-5. [Google Scholar]
  18. Neutens, T.; Delafontaine, M.; Scott, D.M.; De Maeyer, P. An Analysis of Day-to-Day Variations in Individual Space—Time Accessibility. J. Transp. Geogr. 2012, 23, 81–91. [Google Scholar] [CrossRef] [Green Version]
  19. Kitamura, R.; van der Hoorn, T. Regularity and Irreversibility of Weekly Travel Behavior. Transportation 1987, 14, 227–251. [Google Scholar] [CrossRef]
  20. Jones, P.; Clarke, M. The Significance and Measurement of Variability in Travel Behaviour. Transportation 1988, 15. [Google Scholar] [CrossRef]
  21. Harvey, A.S.; Taylor, M.E.; Ellis, S.; Aas, D. 24 Hour Society and Passenger Travel; Saint Mary’s University: Halifax, NS, Canada, 1997. [Google Scholar]
  22. Goulet-Langlois, G.; Koutsopoulos, H.N.; Zhao, Z.; Zhao, J. Measuring Regularity of Individual Travel Patterns. IEEE Trans. Intell. Transport. Syst. 2018, 19, 1583–1592. [Google Scholar] [CrossRef] [Green Version]
  23. Bricka, S.G.; Richard, T.B.; Christopher, L.S.; Nicholas, W. Origin-Destination data collection technology. In Mobile Technologies for Activity—Travel Data Collection and Analysis; IGI Global: Hershey, PA, USA, 2014; pp. 1–16. ISBN 9781466661714. [Google Scholar]
  24. Egu, O.; Bonnel, P. How Comparable Are Origin-Destination Matrices Estimated from Automatic Fare Collection, Origin-Destination Surveys and Household Travel Survey? An Empirical Investigation in Lyon. Transp. Res. Part A Policy Pract. 2020, 138, 267–282. [Google Scholar] [CrossRef]
  25. Zhang, W.; Thill, J.-C. Detecting and Visualizing Cohesive Activity-Travel Patterns: A Network Analysis Approach. Comput. Environ. Urban Syst. 2017, 66, 117–129. [Google Scholar] [CrossRef]
  26. Cho, S.; Janssens, D.; Joh, C.; Kim, H.; Choi, K.; Park, D. Space—Time Sequential Similarity for Identifying Factors of Activity-Travel Pattern Segmentation: A Measure of Sequence Alignment and Path Similarity. Geogr. Anal. 2019, 51, 203–220. [Google Scholar] [CrossRef]
  27. Flyvbjerg, B.; Holm, M.S.; Buhl, S.L. How (In)Accurate Are Demand Forecasts in Public Works Projects? The Case of Transportation. arXiv 2013, arXiv:1303.6654. [Google Scholar] [CrossRef] [Green Version]
  28. Kwan, M.-P. Interactive Geovisualization of Activity-Travel Patterns Using Three-Dimensional Geographical Information Systems: A Methodological Exploration with a Large Data Set. Transp. Res. Part C Emerg. Technol. 2000, 8, 185–203. [Google Scholar] [CrossRef]
  29. Joh, C.-H.; Arentze, T.; Hofman, F.; Timmermans, H. Activity Pattern Similarity: A Multidimensional Sequence Alignment Method. Transp. Res. Part B Methodol. 2002, 36, 385–403. [Google Scholar] [CrossRef]
  30. Shaw, S.-L.; Yu, H.; Bombom, L.S. A Space-Time GIS Approach to Exploring Large Individual-Based Spatiotemporal Datasets. Trans. GIS. 2008, 12, 425–441. [Google Scholar] [CrossRef]
  31. Guo, D. Flow Mapping and Multivariate Visualization of Large Spatial Interaction Data. IEEE Trans. Visual. Comput. Graph. 2009, 15, 1041–1048. [Google Scholar] [CrossRef]
  32. Giannotti, F.; Nanni, M.; Pinelli, F.; Pedreschi, D. Trajectory Pattern Mining. In Proceedings of the 13th ACM SIGKDD International Conference on Knowledge Discovery and Data Mining—KDD’07, San Jose, CA, USA, 12–15 August 2007; ACM Press: New York, NY, USA, 2007; p. 330. [Google Scholar] [CrossRef] [Green Version]
  33. Lee, J.-G.; Han, J.; Whang, K.-Y. Trajectory Clustering: A Partition-and-Group Framework. In Proceedings of the 2007 ACM SIGMOD International Conference on Management of Data—SIGMOD’07, Beijing, China, 11–14 June 2007; ACM Press: New York, NY, USA, 2007; p. 593. [Google Scholar] [CrossRef]
  34. Guo, D.; Liu, S.; Jin, H. A Graph-Based Approach to Vehicle Trajectory Analysis. J. Locat. Based Serv. 2010, 4, 183–199. [Google Scholar] [CrossRef]
  35. Thériault, M.; Claramunt, C.; Villeneuve, P.Y. A Spatio-Temporal Taxonomy for the Representation of Spatial Set Behaviours. In Spatio-Temporal Database Management; Lecture Notes in Computer Science; Böhlen, M.H., Jensen, C.S., Scholl, M.O., Eds.; Springer: Berlin/Heidelberg, Germany, 1999; Volume 1678, pp. 1–18. ISBN 978-3-540-66401-7. [Google Scholar]
  36. Buliung, R.N.; Kanaroglou, P.S. A GIS Toolkit for Exploring Geographies of Household Activity/Travel Behavior. J. Transp. Geogr. 2006, 14, 35–51. [Google Scholar] [CrossRef]
  37. Patterson, Z.; Farber, S. Potential Path Areas and Activity Spaces in Application: A Review. Transp. Rev. 2015, 35, 679–700. [Google Scholar] [CrossRef]
  38. Jiang, S.; Ferreira, J.; González, M.C. Clustering Daily Patterns of Human Activities in the City. Data Min. Knowl. Disc. 2012, 25, 478–510. [Google Scholar] [CrossRef] [Green Version]
  39. Kwan, M.-P.; Xiao, N.; Ding, G. Assessing Activity Pattern Similarity with Multidimensional Sequence Alignment Based on a Multiobjective Optimization Evolutionary Algorithm: Assessing Activity Pattern Similarity. Geogr. Anal. 2014, 46, 297–320. [Google Scholar] [CrossRef] [PubMed] [Green Version]
  40. Joh, C.-H.; Polak, J.W.; Ruiz, T. Characterizing Global Activity Schedule Adjustment Behavior by Using a Sequence Alignment Method. Transp. Res. Rec. 2005, 1926, 26–32. [Google Scholar] [CrossRef]
  41. Shoval, N.; Isaacson, M. Sequence Alignment as a Method for Human Activity Analysis in Space and Time. Ann. Assoc. Am. Geogr. 2007, 97, 282–297. [Google Scholar] [CrossRef]
  42. Abdel-Aty, M.A.; Kitamura, R. Exploring Route Choice Behavior Using Geographic Information System-Based Alternative Routes and Hypothetical Travel Time Information Input. In Transportation Research Record 7; Transportation Research Board: Washington, DC, USA, 1995. [Google Scholar]
  43. Larsen, K.; Gilliland, J.; Hess, P.; Tucker, P.; Irwin, J.; He, M. The Influence of the Physical Environment and Sociodemographic Characteristics on Children’s Mode of Travel to and From School. Am. J. Public Health 2009, 99, 520–526. [Google Scholar] [CrossRef] [PubMed]
  44. Yang, M.; Wang, W.; Chen, X.; Wang, W.; Xu, R.; Gu, T. Modeling Destination Choice Behavior Incorporating Spatial Factors, Individual Sociodemographics, and Travel Mode. J. Transp. Eng. 2010, 136, 800–810. [Google Scholar] [CrossRef]
  45. Moudon, A.V.; Huang, R.; Stewart, O.T.; Cohen-Cline, H.; Noonan, C.; Hurvitz, P.M.; Duncan, G.E. Probabilistic Walking Models Using Built Environment and Sociodemographic Predictors. Popul. Health Metr. 2019, 17, 7. [Google Scholar] [CrossRef]
  46. Jahre, A.B.; Bere, E.; Nordengen, S.; Solbraa, A.; Andersen, L.B.; Riiser, A.; Bjørnarå, H.B. Public Employees in South-Western Norway Using an e-Bike or a Regular Bike for Commuting—A Cross-Sectional Comparison on Sociodemographic Factors, Commuting Frequency and Commuting Distance. Prev. Med. Rep. 2019, 14, 100881. [Google Scholar] [CrossRef] [PubMed]
  47. Fan, J.X.; Wen, M.; Kowaleski-Jones, L. Sociodemographic and Environmental Correlates of Active Commuting in Rural America: Active Commuting in Rural America. J. Rural Health 2015, 31, 176–185. [Google Scholar] [CrossRef]
  48. Xianyu, J.; Rasouli, S.; Timmermans, H. Analysis of Variability in Multi-Day GPS Imputed Activity-Travel Diaries Using Multi-Dimensional Sequence Alignment and Panel Effects Regression Models. Transportation 2017, 44, 533–553. [Google Scholar] [CrossRef]
  49. Berg, J.K.; Aber, J.L. A Multilevel View of Predictors of Children’s Perceptions of School Interpersonal Climate. J. Educ. Psychol. 2015, 107, 1150–1170. [Google Scholar] [CrossRef] [Green Version]
  50. Kitamura, R.; Yamamoto, T.; Susilo, Y.O.; Axhausen, K.W. How Routine Is a Routine? An Analysis of the Day-to-Day Variability in Prism Vertex Location. Transp. Res. Part A Policy Pract. 2006, 40, 259–279. [Google Scholar] [CrossRef] [Green Version]
  51. Hatcher, S.G.; Mahmassani, H. Daily Variability of Route and Trip Scheduling Decisions for the Evening Commute. In Transportation Research Record 11; Transportation Research Board: Washington, DC, USA, 1992. [Google Scholar]
  52. Chikaraishi, M.; Fujiwara, A.; Zhang, J.; Axhausen, K.W. Exploring Variation Properties of Departure Time Choice Behavior by Using Multilevel Analysis Approach. Transp. Res. Rec. 2009, 2134, 10–20. [Google Scholar] [CrossRef] [Green Version]
  53. Susilo, Y.O.; Axhausen, K.W. Stability in Individual Daily Activity-Travel-Location Patterns: A Study Using the Herfindahl-Hirschman Index; ETH Zurich: Zurich, Switzerland, 2007. [Google Scholar]
  54. Blondel, V.D.; Guillaume, J.-L.; Lambiotte, R.; Lefebvre, E. Fast Unfolding of Communities in Large Networks. J. Stat. Mech. 2008, 2008, P10008. [Google Scholar] [CrossRef] [Green Version]
  55. Fortunato, S. Community Detection in Graphs. Phys. Rep. 2010, 486, 75–174. [Google Scholar] [CrossRef] [Green Version]
  56. Zhou, L.; Zhang, W.; Fang, C.; Sun, H.; Lin, J. Actors and Network in the Marketization of Rural Collectively-Owned Commercial Construction Land (RCOCCL) in China: A Pilot Case of Langfa, Beijing. Land Use Policy. 2020, 99, 104990. [Google Scholar] [CrossRef]
  57. Zhang, W.; Thill, J.-C. Mesoscale Structures in World City Networks. Annals of the American Association of Geographers. 2019, 109, 887–908. [Google Scholar] [CrossRef]
  58. Zhang, W.; Fang, C.; Zhou, L.; Zhu, J. Measuring Megaregional Structure in the Pearl River Delta by Mobile Phone Signaling Data: A Complex Network Approach. Cities 2020, 104, 102809. [Google Scholar] [CrossRef]
  59. Zhang, W.; Zhang, M. Incorporating Land Use and Pricing Policies for Reducing Car Dependence: Analytical Framework and Empirical Evidence. Urban Stud. 2018, 55, 3012–3033. [Google Scholar] [CrossRef]
  60. Zhang, M.; Zhang, W. When Context Meets Self-Selection: The Built Environment–Travel Connection Revisited. J. Plan. Educ. Res. 2020, 40, 304–319. [Google Scholar] [CrossRef]
  61. Newman, M.E.J. Modularity and Community Structure in Networks. Proc. Natl. Acad. Sci. USA 2006, 103, 8577–8582. [Google Scholar] [CrossRef] [PubMed] [Green Version]
Figure 1. Conversion of Time Geography Path into Space-Time Behavior Network (Adapted from Zhang and Thill [25]).
Ijgi 10 00148 g001
Figure 2. Distribution of Multiple-day Spatiotemporal Behavioral Trajectory of 680 Residents in the Shangdi-Qinghe Area, Beijing.
Ijgi 10 00148 g002
Figure 3. Activity-travel patterns of seven largest communities detected based on the complex network approach.
Ijgi 10 00148 g003
Table 1. Description of the variables of intrapersonal and interpersonal variabilities in daily activity-travel patterns.
VariablesDescriptionMeanStd.
Dependent variable
The class of detected communities 1Each type of community has a group of individuals with a similar activity-travel pattern (A multiple categorial variable: Type-1, 2, … 7 Communities or Patterns).42.16
Independent variables
1.Intrapersonal Attributes: Day variables (Level 1)
Monday1: Monday, 0: others0.150.36
Tuesday1: Tuesday, 0: others0.150.36
Wednesday1: Wednesday, 0: others0.150.36
Thursday1: Thursday, 0: others0.150.36
Friday1: Friday, 0: others0.150.36
Saturday1: Saturday, 0: others0.130.33
Sunday1: Sunday, 0: others0.120.32
2.Interpersonal Attributes: Individual’s socioeconomic features (Level 2)
Gender1: Male, 0: female0.460.50
Age under 301: age < 30 years old; 0: others0.340.48
Age between 30 and 401: 30 age < 40 years old; 0: others0.390.49
Age between 40 and 501: 40 age <50 years old; 0: others0.180.38
Age over 501: age 50 years old; 0: others0.080.28
Hukou 21: with Beijing’s hukou 2, 0: others0.700.46
Education low level1: Uneducated, primary and middle school; 0: others0.150.35
Education medium level1: College or undergraduate; 0: others0.710.46
Education high level1: Postgraduate and above; 0: others0.150.36
Employment status1: Employed, 0: Unemployed0.900.30
Income low level1: Less than 2000 yuan per month, 0: others0.150.36
Income medium level1: 2001–6000 yuan per month, 0: others0.630.48
Income high level1: above 6000 yuan per month, 0: others0.220.42
Marriage status1: unmarried, 0: married0.240.43
1 In fact, 9 types of communities are found in the case study in the next section. However, considering that community size affects representativeness, 7 types of communities with community size over 100 are selected as the dependent variable; 2 Hukou is a system of household registration used in mainland China, which officially identifies a person as a resident of a district.
Table 2. Distribution of the 7 activity patterns in 7 days of a week.
DayWorking PatternPrivate-Affair PatternLeisure PatternWorking-Housework PatternOther-Activities PatternSchool-Related PatternMedical-Activity Pattern
Monday65.71%10.77%3.23%7.36%5.75%3.95%3.23%
Tuesday64.95%10.68%2.85%7.83%6.76%4.98%1.96%
Wednesday65.61%10.35%3.51%6.84%6.31%4.04%3.33%
Thursday66.49%8.83%4.68%6.85%5.59%5.23%2.34%
Friday64.40%9.95%4.89%7.33%5.58%4.01%3.84%
Saturday49.79%11.86%17.16%5.93%4.87%7.84%2.54%
Sunday46.90%11.26%18.39%4.14%8.28%7.13%3.91%
Table 3. Results of the multilevel multinomial logit model.
VariablesPrivate-Affair PatternLeisure PatternWorking-Housework PatternOther-Activities PatternSchool-Related PatternMedical-Activity Pattern
Intrapersonal Attributes: Day variable
Tuesday
Wednesday
Thursday
Friday
Saturday0.70 **2.27 *** 1.19 ***
Sunday0.73 **2.41 *** 1.00 ***1.23 ***0.84 **
Interpersonal Attributes: Individual’s socioeconomic features
Male−0.52 **−1.00 ***−0.52 **−0.44 ** −0.61 **
Age between 30 and 40 0.85 **0.70 **
Age between 40 and 50−0.94 ** 0.80 **0.75 **
Age over 50 1.03 ** 0.87 *
Hukou 0.94 **
Education low level −0.67 * −1.47 **
Education medium level−0.60 ** −0.59 *
Employed−0.76 **−1.43 ***−0.92 **
Income low level −0.76 **−0.74 **
Income medium level
Unmarried−1.70 ***−0.80 **−0.90 ** −0.99 **
Constant −1.12 *−1.10 **−3.10**−2.59**−2.35 **
Log likelihood: −4493.67
Chi-square: 561.93 ***
Note: * 10% significant level, ** 5% significant level, *** 1% significant level, and blank representing insignificant. Reference class: the working pattern and the day of Monday.
Publisher’s Note: MDPI stays neutral with regard to jurisdictional claims in published maps and institutional affiliations.

