Article

Decision Making in the 4th Dimension—Exploring Use Cases and Technical Options for the Integration of 4D BIM and GIS during Construction

1
Department of Civil, Environmental and Geomatic Engineering, University College London, London WC1E 6BT, UK
2
Costain Skanska Joint Venture, London W1K 5JN, UK
*
Author to whom correspondence should be addressed.
Current address: Department of Civil, Environmental and Geomatic Engineering, University College London, Gower Street, London WC1E 6BT, UK.
ISPRS Int. J. Geo-Inf. 2021, 10(4), 203; https://0-doi-org.brum.beds.ac.uk/10.3390/ijgi10040203
Submission received: 8 December 2020 / Revised: 4 February 2021 / Accepted: 5 February 2021 / Published: 29 March 2021
(This article belongs to the Special Issue Integration of BIM and GIS for Built Environment Applications)

Abstract

:
In both the Geospatial (Geo) and Building Information Modelling (BIM) domains, it is widely acknowledged that the integration of geo-data and BIM-data is beneficial and a crucial step towards solving the multi-disciplinary challenges of our built environment. The result of this integration—broadly termed GeoBIM—has the potential to be particularly beneficial in the context of the construction of large infrastructure projects, which could make use of data relating to the larger spatial extents typically handled in geographical information systems (GIS) as well as the detailed models generated by BIM. To date, GeoBIM integration has mainly been explored for buildings, in a 3D context and for small projects. This paper demonstrates the results of the next level of integration, exploring the addition of the fourth dimension by linking project schedule information to create 4D GeoBIM, examining interoperability challenges and benefits in the context of a number of use cases relating to the enabling works for a major commercial infrastructure project. The integrating power of location and time—knowing where and when data relate to—allows us to explore data interoperability challenges relating to linking real world construction data, created using commercial software, with other data sources; we are then able to demonstrate the benefits of 4D GeoBIM in the context of three decision making scenarios: examining the potential for prioritisation of noise mitigation interventions by identifying apartments closest to the noisiest construction process; development of a 4D location-enabled risk register allowing, for example, work to continue underground if a risk is specific to the top of a building; ensuring construction safety by using 3D buffering to ensure that the required distances between moving construction equipment and surrounding infrastructure are not breached. Additionally, once integrated, we are able to ‘democratize’ the data—make it accessible beyond the BIM and GIS expert group—by embedding it into a 3D/4D open source Web GIS tool.

1. Introduction

The construction sector in the United Kingdom (UK) contributed around £103 billion, 6.5% of GDP, and comprised 2.1 million jobs, 6.3% of the UK jobs total in 2014 [1] and the UK’s Government Construction Strategy document, issued in 2016, forecast savings of £1.7 billion due to improved construction efficiency, with £3 billion savings having been made in the 2011–2016 period preceding the report [1]. As noted in the document, at least part of this saving has been and will be achieved due to the development of digital capability and design using Building Information Modelling (BIM) [1]. A report by Price Waterhouse Coopers in 2018 estimated that savings due to BIM Level 2 (collaborative working and information exchange, see Table 1) could amount to up to £429 million per year for government infrastructure projects [2]. While much of the initial focus within BIM was on buildings, increasing efforts are now underway to employ this technology within infrastructure projects, with existing standards being extended to accommodate this (see Section 3.2).
Creating and managing digital information about the built environment is not new in itself—indeed, this is one of the common applications of geographical information systems (GIS), which bring together spatial (mappable) data and associated information, and provide a central database (data repository) to store, update and interrogate this data. The United Kingdom Cabinet office recently compiled a report that lists ten high-value themes that have the potential for geospatial data to unlock up to £11 billion per year of economic value along with social benefits [4]. Within this they specifically mention infrastructure and construction, with geospatial data used to support optimal route locations for new pipelines, generators or power lines or signal towers to reduce planning times and maximise return on investment, leading to an added value of between £2.2–£4.6 billion [4].
Both BIM and GIS manage spatial information (i.e. information that relates to somewhere on the earth’s surface) although their focus tends to be slightly different. BIM primarily focuses on providing extensive engineering and construction detail to the spatial extent of a project at architecture and infrastructure scale. While this primarily relates to new build/construction, the approach is also used for existing assets (e.g., via Historic BIM, HBIM, which uses a scan-to-BIM approach to construct the required 3D models [5]). GIS focusses on a larger extent of the built environment (precinct, city, country) and provides full city-wide coverage and extensive contextual information (in contrast to the project-specific focus of BIM). Like BIM, it models existing and projected built assets, but also incorporates information about people, traffic and other activity (further similarities and differences are explored in Section 3.1).
Given that infrastructure projects—the focus of this paper—combine the need for engineering detail (BIM) with that for contextual detail (GIS), there have been ongoing efforts to combine the two information sources, with one of the first of these being the UK’s Crossrail project [6]. However, reviewing the work carried out to date, a number of gaps can be noted. Much of the focus is on 3D, on buildings and on the specific conversion from BIM standard IFC to 3D GIS standard CityGML, which while well established, the latter is not well supported in commercial GIS used in infrastructure [7] (while open software alternatives may be available, these are as yet not widely adopted in the context of major infrastructure projects). Additionally, in many cases, ‘canned’ data—prepared or edited by the research team—is used rather than data from sources external to the team. Further detail is given in Section 3.4.
This research takes a different approach, examining the opportunities and benefits for integrating BIM and GIS in 4D as part of the construction of a real-world major infrastructure project—specifically the UK’s High Speed 2 (HS2) railway (see Section 2). We address the question:
What are the challenges and benefits to integrating real-world 4D information, sourced from commercial BIM and GIS, to support the construction of a large infrastructure project?
As well as exploring theoretical opportunities and challenges, the paper explores the realities of interoperability in practice, using real-world data to allow a realistic understanding of the data processing effort involved to be gained. To permit this effort to be evaluated against benefits gained, we also present three case studies that demonstrate the benefits of the integration of 4D project-related BIM data with GIS: noise mitigation, improving risk registers and construction safety. Finally we highlight the opportunities for democratizing (enabling the wider sharing amongst non-specialist project team members) the integrated data.

2. Project Context—Costain Skanska Joint Venture and HS2

HS2 (High Speed 2) is a planned high-speed railway that will initially connect London and Birmingham by 2026, and then reaching Manchester and Leeds by 2033 [8]. HS2 is one of the most demanding railway projects in the world and certainly, in the UK. It is estimated that 345 miles of tracks will help carry over 300,000 passengers a day when fully operational [8].
Costain Skanska Joint Venture (CSJV) is working on HS2 Enabling Works South Contract, which stretches from Euston Station in Central London to West Ruislip. The main aim of this contract is to prepare the way for the tracks to be built, and thus, the main activities involve: demolition of buildings, surveys, environmental assessment, archaeological excavations and others. Note that for confidentiality reasons some details of the project have been obscured in this paper.

3. Background

3.1. Comparing BIM and GIS

3.1.1. BIM

A search of the literature reveals that a number of different definitions of BIM exist. For example, according to [1], BIM is “a collaborative way of working that facilitates early contractor involvement, underpinned by the digital technologies which unlock more efficient methods of designing, creating and maintaining our assets.” Narrowing this definition slightly to give a more data-centric focus, NBS (“the connected information platform that powers construction”) defines BIM as a process for creating and managing information on a construction project across the project lifecycle, noting that one of the key outputs of this process is the Building Information Model, the digital description of every aspect of the built asset [9]. ISO-19650-1 [10] defines BIM as the “use of a shared digital representation of a built asset to facilitate design, construction and operation processes to form a reliable basis for decisions”. Table 1 further expands the definition by providing details of different levels of BIM maturity [3]. Within Level 2, 3D data is held in managed discipline-specific tools, but a core concept within the proposed Level 3 is that of a fully integrated, collaborative, real-time project model [11]. Across the levels, the concept of a common data environment (CDE) is key, defined as “a system for filing, managing, sharing and distributing electronic data and other information. The CDE is simply ”a digital data room where geometric and other information from the contributing designers and other participants in the project comes together” [11].
It is beyond the scope of this paper to explore the many BIM definitions in depth. However, while this research project is data-centric (aligning with the definition provided by the NBS above [9]) we would additionally suggest that achieving data interoperability is a fundamental underpinning of the collaborative approach outlined by [1].

3.1.2. GIS

A Geographical Information System (GIS) is defined as a “computer-based information system that enables capture, modelling, storage, retrieval, sharing, manipulation, analysis, and presentation of geographically referenced data” [12]. To solve real-world problems, GIS (the software) offer a wide range of specialist analysis options that take advantage of knowing the ‘location’ of something to provide functionality not available through normal data manipulation tools such as spreadsheets. These include: Euclidean (metric) Operations—such as distance, area and volume measurements, topological operations—what is inside, next to, intersecting with an object—network analysis and routing functionality, and operations returning a geometry, e.g., buffering, intersection, or union. Rather than the file system (CDE) used by commercial BIM software such as Autodesk Revit (https://www.autodesk.co.uk/products/revit/architecture (accessed on 12 January 2021)) or Bentley (https://www.bentley.com/en/products/product-line/building-design-software/openbuildings-designer (accessed on 12 January 2021)), GIS data is frequently stored within a spatial database—which not only stores all the data centrally, providing multi-user access to live data, and the ability to set different access rights across the data. A spatial database also provides ad-hoc query functionality via Structured Query Language (SQL) to enable easy linking, integration and querying of data from multiple sources and permit analysis of the stored data.

3.1.3. BIM and GIS

Examining the definitions of both BIM and GIS, and the BIM levels of maturity, immediate similarities can be observed, e.g., digital representation of the built environment, support for decision making. Of particular interest in terms of integrating the two environments is the focus—even at Level 1—on 3D modelling within the BIM context, and the integrated BIM hub proposed at Level 3, which reflects an integrated spatial data infrastructure (perhaps built around one or more spatial databases) common within GIS.
Table 2 and Table 3 outline the similarities and differences between BIM and GIS (adapted from [13]).

3.2. Related Standards

Within BIM, Industry Foundation Classes (IFC) is a data schema developed by buildingSMART to allow sharing of relevant information throughout the lifecycle of any built environment asset among all participants independent from the software/tools used [15], and is a “digital description of the built environment, including buildings and civil infrastructure” [15]. It aims to be vendor-neutral, or agnostic, and usable across a wide range of hardware devices, software platforms. With an initial focus on buildings, the standard is now being extended to infrastructure (https://www.buildingsmart.org/standards/rooms/infrastructure/ (accessed on 12 January 2021)). IFC is embedded in all major BIM software. However, while IFC aims to promote interopability, recent research has highlighted that challenges exist both within and between the various platforms [14].
From the 3D GIS perspective, the dominant standard CityGML is an Open Geospatial Consortium endorsed standard, designed to share 3D City Models [16]. It is used for the representation, storage, and exchange of 3D city and landscape models and provides both a data model and encoding mechanism for describing 3D objects with respect to their geometry, topology, semantics and appearance, and defines five levels of detail (LoD) from 0 to 4, each one providing additional detail in the 3D city model. As with IFC, interoperablity challenges exist and support for this standard within commercial software is poor [7].

3.3. BIM and GIS Integration—Previous Work

Data integration is “the problem of combining data residing at different sources, and providing the user with a unified view of these data” [17] and has also been defined by [18] in the context of GIS and BIM as “the merging of the two systems for the purpose of data interoperability”—in other words, integration is a step towards full interoperability where interoperability is the ability of a system, or components of a system, to provide information portability and inter-application cooperative process control [19]. In an ideal world, this would involve a real-time process where both data sources were maintained in their original format and then ‘unified’ in real-time so that any updates in one system are immediately transformed into the other and are immediately visible to all users of the data. However, the significant semantic and geometric differences between BIM and GIS outlined in Table 3 mean that this level of integration is very challenging. Thus, currently, integration involves a process of extraction, transformation and loading (ETL) where data is first converted from a proprietary format to a standard exchange format (‘extracted’) then passed through a transformation process (designed to resolve the semantic and geometric differences between source and destination and convert to the standard exchange format for the receiving side) and then loaded into the receiving software.

3.3.1. Extract, Transform and Load

Taking a theoretical, rules-based approach [20] present a mathematical framework linked to a graph transformation approach, identifying four prototypical rule types (root, standard, reference and property) to underpin conversion. This work is extended by [21] into the practical domain, developing a system that allows not only a direct IFC/CityGML conversion but also allows additional elements of IFC that don’t have a direct mapping in CityGML to be converted, with the ultimate aim of a lossless conversion.
Working with the same standards, an automated process to extract CityGML LoD 3 buildings from IFC focussing in particular on the geometric operations required to extract the data is demonstrated by [22]. This includes a conceptual mapping between IFC and CityGML. However, full automation is not possible—the external envelope of the building can be extracted but may then require repair to form the closed geometry required by CityGML (and by GIS in general). Similarly, Ref. [23] note that one particularly difficult aspect of BIM to GIS conversion is the automated extraction of the different levels of detail proposed by CityGML, and propose a rules-based method to automate this conversion. The importance of integration is also noted within the HBIM [5] community with an ETL process linking FreeCAD and the PostGIS spatial database developed in python [24], resulting in IFC being stored as queryable spatial objects.
Focusing more on specific applications for the integrated data, Ref. [25] present a process for microclimate analysis at the urban neighbourhood level that first extracts the geometry from the IFC and creates a mesh, and then adds attributes, transforms coordinates and finally structures the data into CityGML format. The Open Geospatial Consortium’s Future Cities Pilot focusses on use cases relating to urban planning, noting, in particular, the need to develop a schema check process to address issues with the externally-sourced IFC [26]. The integration of HBIM and 3DGIS in the context of conservation of an earthquake-damanaged church in Norcia, Italy is described by [27], who note that the requirement for a multi-scale approach to the problem. They test two approaches to interoperability—inserting the BIM data directly into ESRI’s ArcGIS suite of tools, and converting BIM data into GIS format using SafeSoft’s FME sotfware, reporting that while no geometric or semantic information is lost and georeferencing is maintained the FME approach proved slightly more complicated in that the additional attributes specifically related to HBIM were not automatically transferred, and ArcGIS does not yet support GML data. Taking this one step further [28] compare an open-source and two proprietary approaches (ArcGIS and FME) for BIM/GIS conversion, concluding that open source does provide a sound alternative for conversion (although further work is required in terms of efficiency) in the context of their tests using a prototype bridge model created to model three types of components—slab, beam, and column.
While many BIM/GIS conversion studies focus on pre-curated data, created by the research team to enable exploration of issues such as semantics, taking an approach with real-world data. A conversion process for BIM data created by practitioners in the Netherlands has been implemented by [29], who focus on the integration of existing GIS subsoil data in BIM and georeferencing of the BIM models. They note in particular that quality issues such as self-intersecting geometries cause major problems for conversion, and provide a set of recommendations—including the importance of georeferencing, volumetric object creation, the use of IfcSpaces to model spaces and the avoidance of generic entities—to facilitate a conversion. They implement a bespoke solution in C++.

3.3.2. Towards Interoperability—Keeping Data in Source Format

While vendor-specific, the insertion of BIM data (using Autodesk’s Revit format) into ArcGIS in [27] is a first step towards the more theoretical definition of integration—i.e., where data is held in its own format and shared (This process is described by Esri as Extract, Load, Translate, (https://www.esri.com/arcgis-blog/products/arcgis-pro/transportation/common-patterns-for-bim-and-gis-integration/ (accessed on 13 January 2021)). Taking a similar approach to keeping data in its native format, in the HBIM context a direct implementation of SQL over BIM via a python interface is presented by [30].
Moving further towards full interoperability [31] proposes the use of linked data, presenting a case linking IFC and CityGML for tunnel modelling. This approach then makes use of ontology web language (OWL) as a semantic infrastructure linkage, and RDF (resource description framework) to link between features represented both in IFC and CityGML. To illustrate the results, a SPARQL query (a semantic query language) is then used to identify lights in the tunnel.
Similarly [32] outline the challenges faced by urban practitioners when dealing with heterogeneous data at different scales noting that IFC is a relevant standard for asset scale, and CityGML is a useful standard for the neighbourhood scale. They integrate the two using a virtual approach to create a hybrid information infrastructure, with examples relating to neighbourhood asset maintenance and district energy centres. To address semantic interoperability challenges, they propose a mediated schema that eliminates duplicates and contains the unique attributes from each schema. This keeps the data in its source format and translates queries across formats by a process of query rewriting.
A meta-review of approaches can be found in [33], who compare a number of different integration solutions, classifying them according to effectiveness (more effective implies less information lost), extensibility (openness), effort (time and cost) and flexibility (ability to apply the results to another study). They note in particular that application-focussed methods, are not easily able to be translated to other uses given that they are developed for a specific purpose. In contrast, manual translation of existing standards seems to offer a good overall score against these four criteria, with semi-automatic translation also showing good potential. However, full automation is not included in the list of approaches.

3.4. Research Gaps

The majority of the papers reviewed focus on ETL processes, with most commonly encountered being that from IFC to CityGML, although some inroads are being made towards full interoperability. Many authors also note the importance of the multi-scale data that can only be achieved by combining BIM and GIS. Reviewing the work carried out to date, a number of gaps can be noted:
  • While IFC and CityGML are noted as interoperability standards in their respective domains, there are still a number of issues to overcome before full support for multi-software interoperability is achieved within each domain, which in turn adds further complexity to cross-domain interoperability.
  • While CityGML is commonly used in GeoBIM research, it has yet to make its way into GIS software packages [34]—instead, other formats such as a shapefile, geodatabase or a spatial database such as PostGIS are used in practice.
  • The lack of focus on infrastructure projects is evident—even though these are one of the key drivers for BIM
  • Many of the ETL tasks make use of ’canned’ data that has been created or edited by the authors prior to conversion, rather than sourced externally, and where the latter exist these relate primarily to buildings rather than infrastructure.
  • Conversion difficulties and the need for manual intervention are highlighted by the vast majority of the authors, with development of bespoke software sometimes required
  • Much of the research listed above is focussed on implementing GeoBIM for one specific application domain rather than making use of the integrated data in multiple contexts.
There is thus a need to develop a better understanding of challenges encountered when using data that is both externally sourced (i.e., created by a different team or organisation), using commercial software, in the context of a commerical project. This will give some indication of the effort required for integration, which can then be weighed against the benefits of a GeoBIM approach in terms of opening up the data beyond its original purpose. Related to this, there is also a need to better articulate these benefits within the context of a large, real-world, active infrastructure project, as to date much of the existing research has focussed on buildings.
Exploring the gaps between theoretical interoperability and what is achievable, and required, in practice will provide a better understanding of if and how interoperability challenges manifest in the real world and what future mitigation could be applied in order to ensure that they are not a barrier to unlocking existing data and moving towards the widespread commercial deployment of GeoBIM.

4. Data

Synchro is a suite of software for digital construction management which has one of its targets as improving the use of data to optimize decision-making, by helping to optimize complex construction projects across civil, building, and industrial sectors. Teams at the jobsite can access the information they need, tailored to the context in which they need it and can track and raise issues linking back to the central model and map views (https://www.bentley.com/en/products/brands/synchro?mkwid=s_pcrid_463398066647_pkw_synchro_pmt_p_pdv_c_slid__pgrid_108282245026_ptaid_kwd-172798762_&intent=&gclid=Cj0KCQjwuL_8BRCXARIsAGiC51C_Ipe-CUWMsLgAoud-U8HWoa_sCBRqfpH8ket2-CKUlVueAjajkcUaArPREALw_wcB (accessed on 20 October 2020)) The software is currently used by CSJV for 4D BIM construction scheduling and project management and a master data file for this research was provided in Synchro’s native .sp format. This contained the 3D geometry and program schedule of a key bridge project which included the closure of a bridge for five years while utilities were disconnected, surrounding buildings demolished and the bridge extended [35].
Additional data files including MicroStation CAD drawings and a Primavera P6 program schedule exported as XML file were also provided. These were the primary input used to create the Synchro master file and were used for reference purposes. The creation process of the master data file from these sources is illustrated in Figure 1. Synchro also includes a 4D program schedule presented as a Gantt chart.
To create the master data file, 3D models originally in MicroStation. The DGN file format was converted to Synchro .spxas format with a MicroStation plug-in and imported into the Synchro master file. The hierarchies of 3D objects from the DGN drawings were preserved in this conversion and listed in the 3D Objects window in the tree structure. If object levels are labelled correctly in the original DGN, the group of 3D entities that constitute the object can be easily identified.
The 3D models represented physical objects related to the construction project, including machinery equipment, existing site and new installations. These 3D objects were assigned as resources, categorized as either equipment or material, and the resources were then assigned to corresponding tasks with time attributes attached. Using the resulting model, Synchro enables users to view and analyze construction sequences in 4D, with model visualized in 3D as well as in time dimension, to identify clash and conflicts in sequence or resource allocation. Additional context is provided by 3D models of the road, railway, greenspace and other objects (Figure 2 and Figure 3). As the demolition excavator model shown in Figure 3 shows, 3D objects are organized in a tree structure with different levels.

5. Method

A three-part method underpins the research described in this paper—firstly, data was converted from Synchro into a format suitable for use in GIS; in parallel with this, a number of use cases were developed to help CSJV understand the benefits of the potentially complicated data integration task. Finally, approaches to interactive 3D and 4D visualisation were explored, which could unlock the data to be explored by users not having Synchro software expertise.

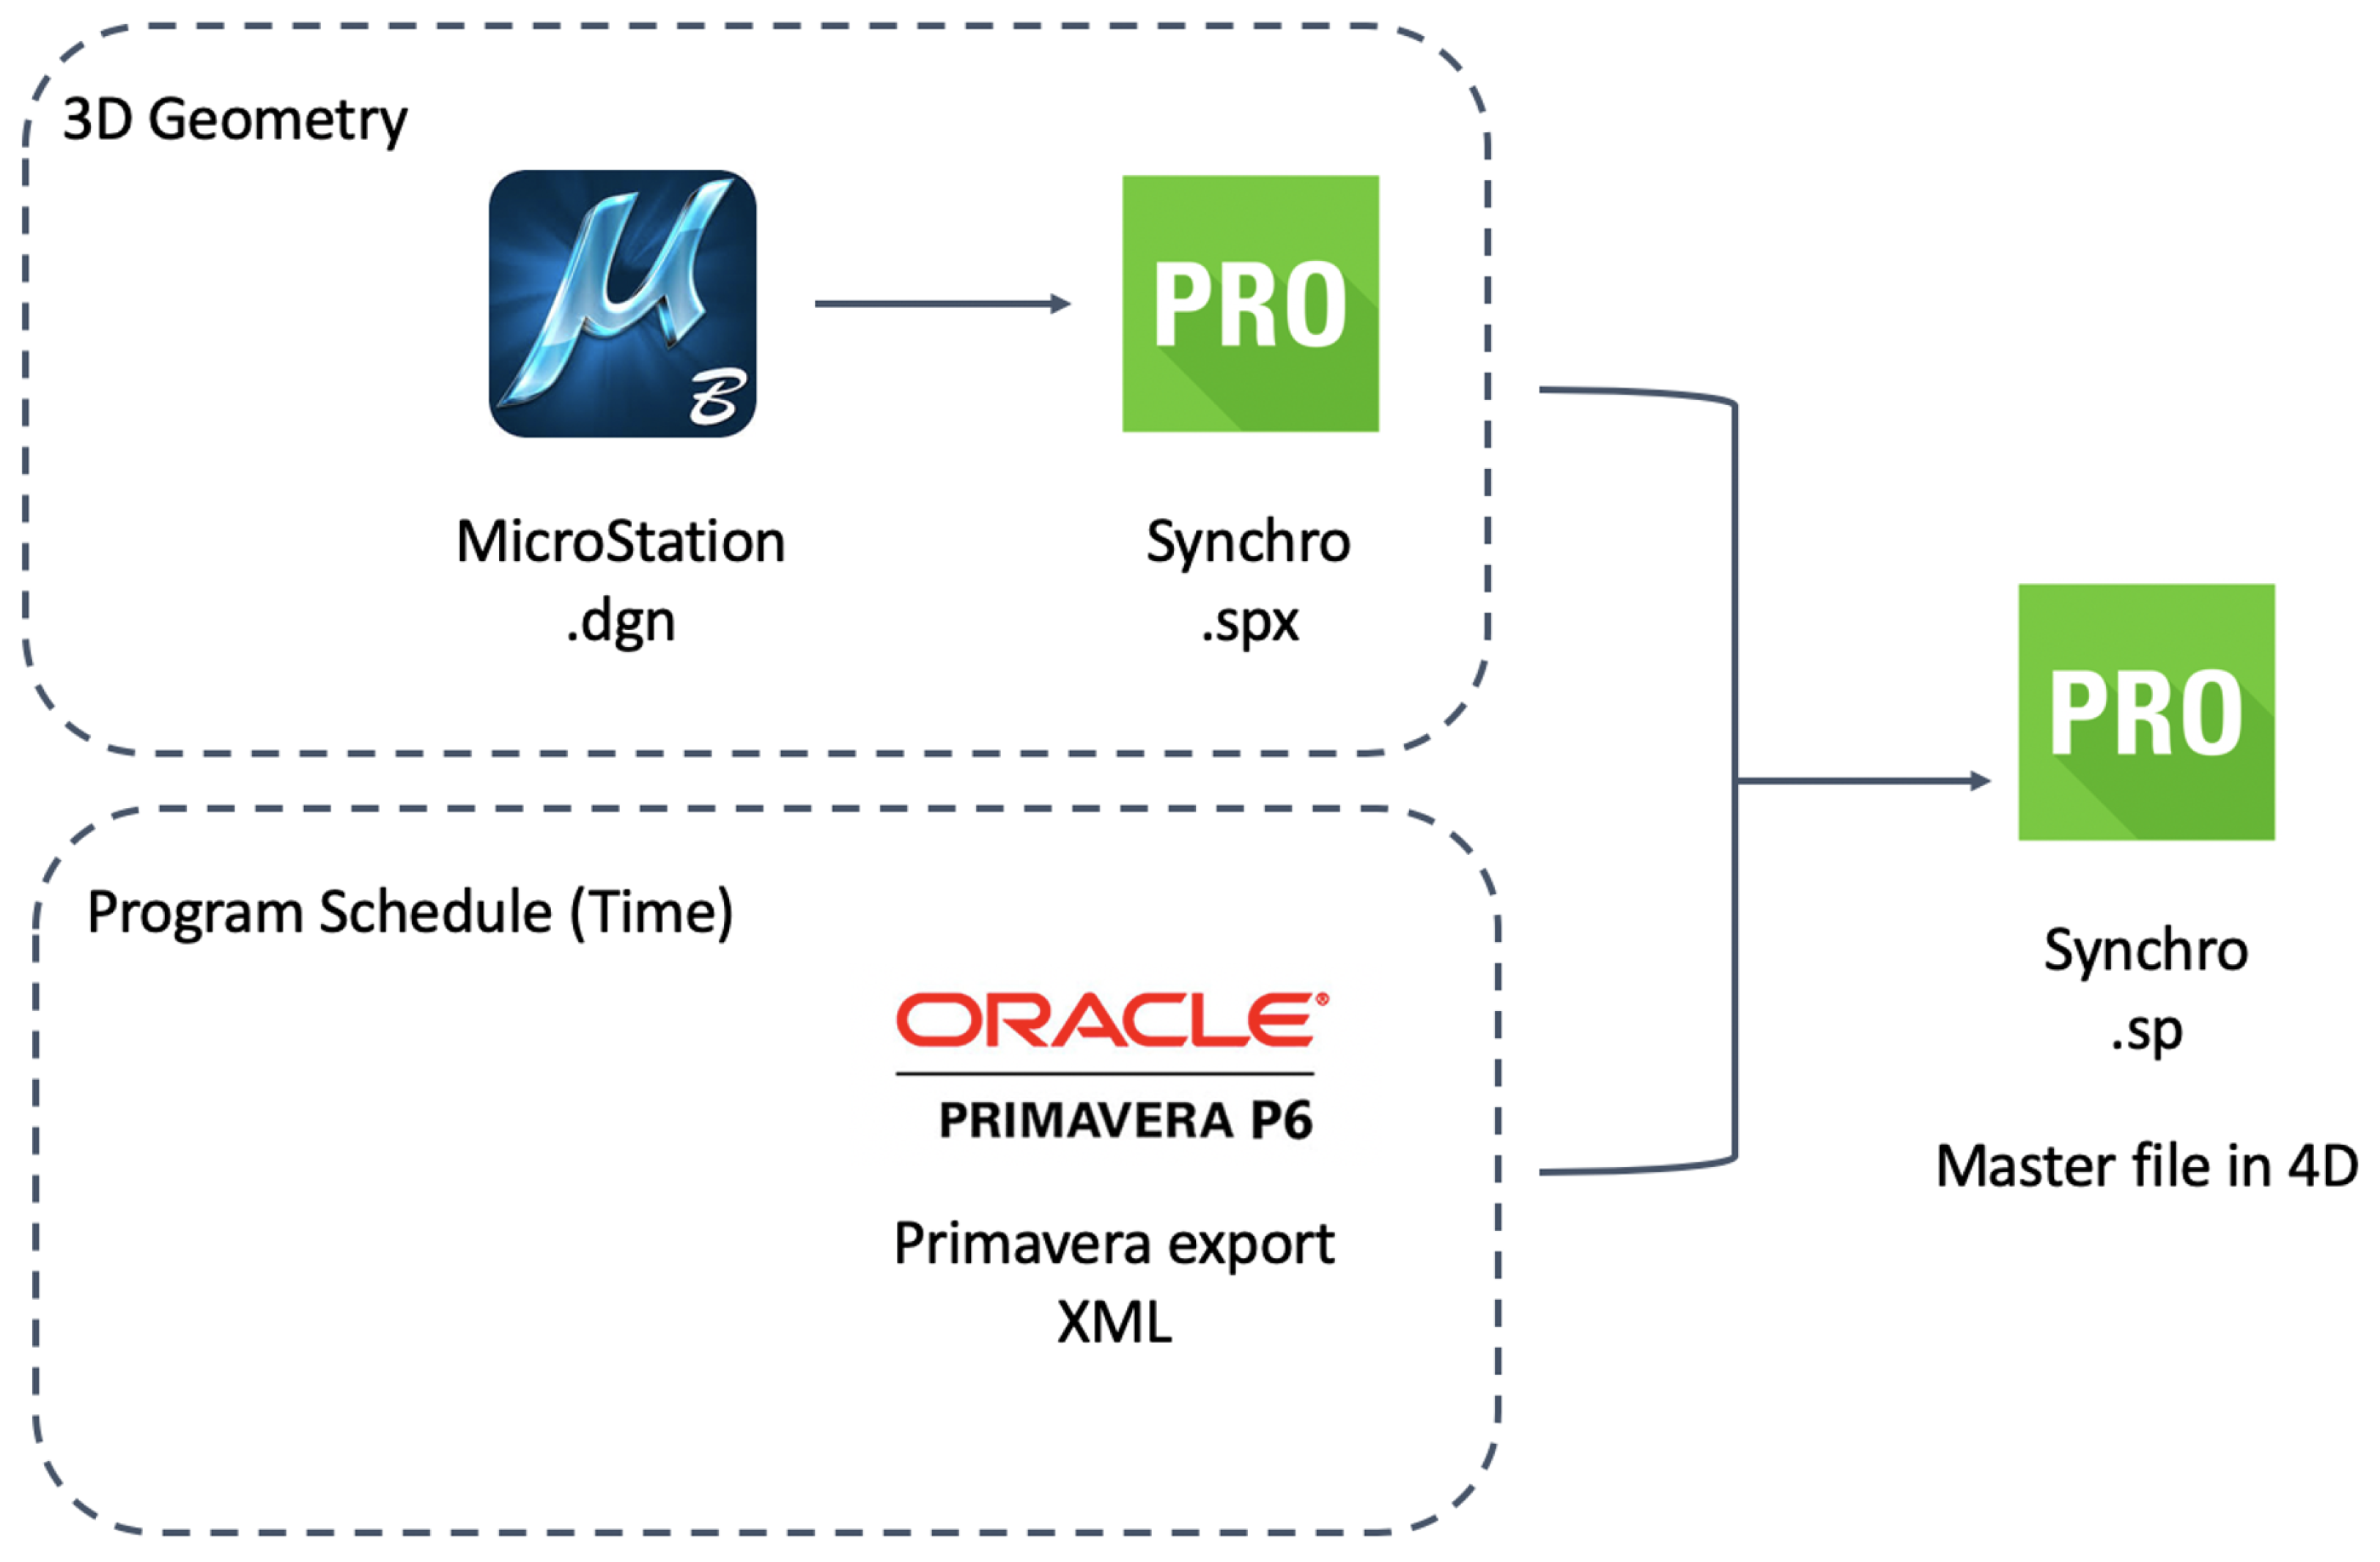
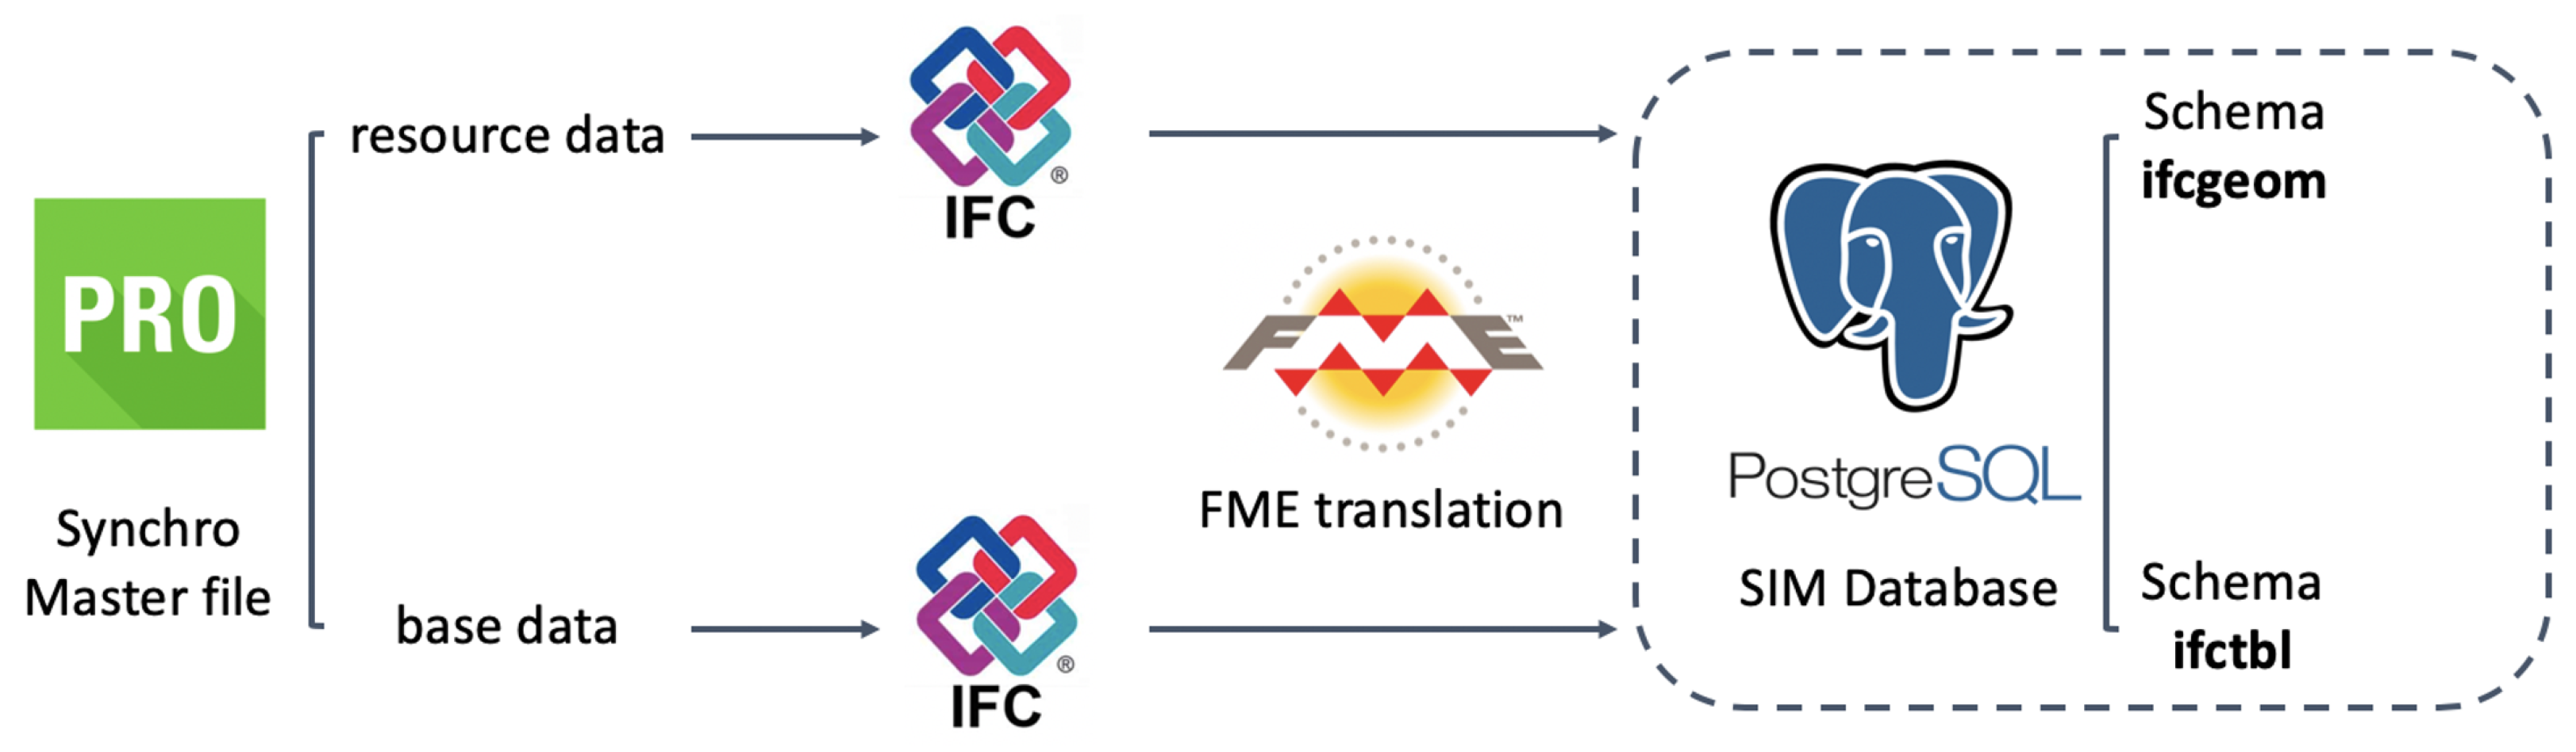
5.1. Data Conversion

Figure 4 shows an overview of the data migration process, which separately migrated the resource data (i.e., the schedule and associated geometry) and the background (base) data, by exporting both as IFC files, and then using FME to directly migrate them—feature class by feature class—into a PostgreSQL/PostGIS database. This results in a central repository for the data enabling multi-user, multi-software access with the option to control editing and visualisation permission. A centrally managed data store also facilitates queries between multiple data sources and facilitates backup and security management, allowing the data to be utilized for a diverse range of applications.

5.2. Identifying the Benefits of BIM/GIS Integration—Use Case Identification

Given the projected level of effort involved in the data conversion process, a key consideration for CSJV was the ‘so what’ of the process—i.e., what benefits would accrue from extracting the data and combining it with GIS. An iterative discussion process was carried out between the CSJV teams and the research team to understand the potential benefits of unlocking the data from Synchro and integrating it into GIS.
Interviews (as a round table discussion) were first conducted with senior members of the CSJV team (the BIM Manager, the Synchro expert) followed by the technical staff (GIS manager and GIS technician), and latterly with one of the technical experts. They covered multiple aspects of the problem:
1.
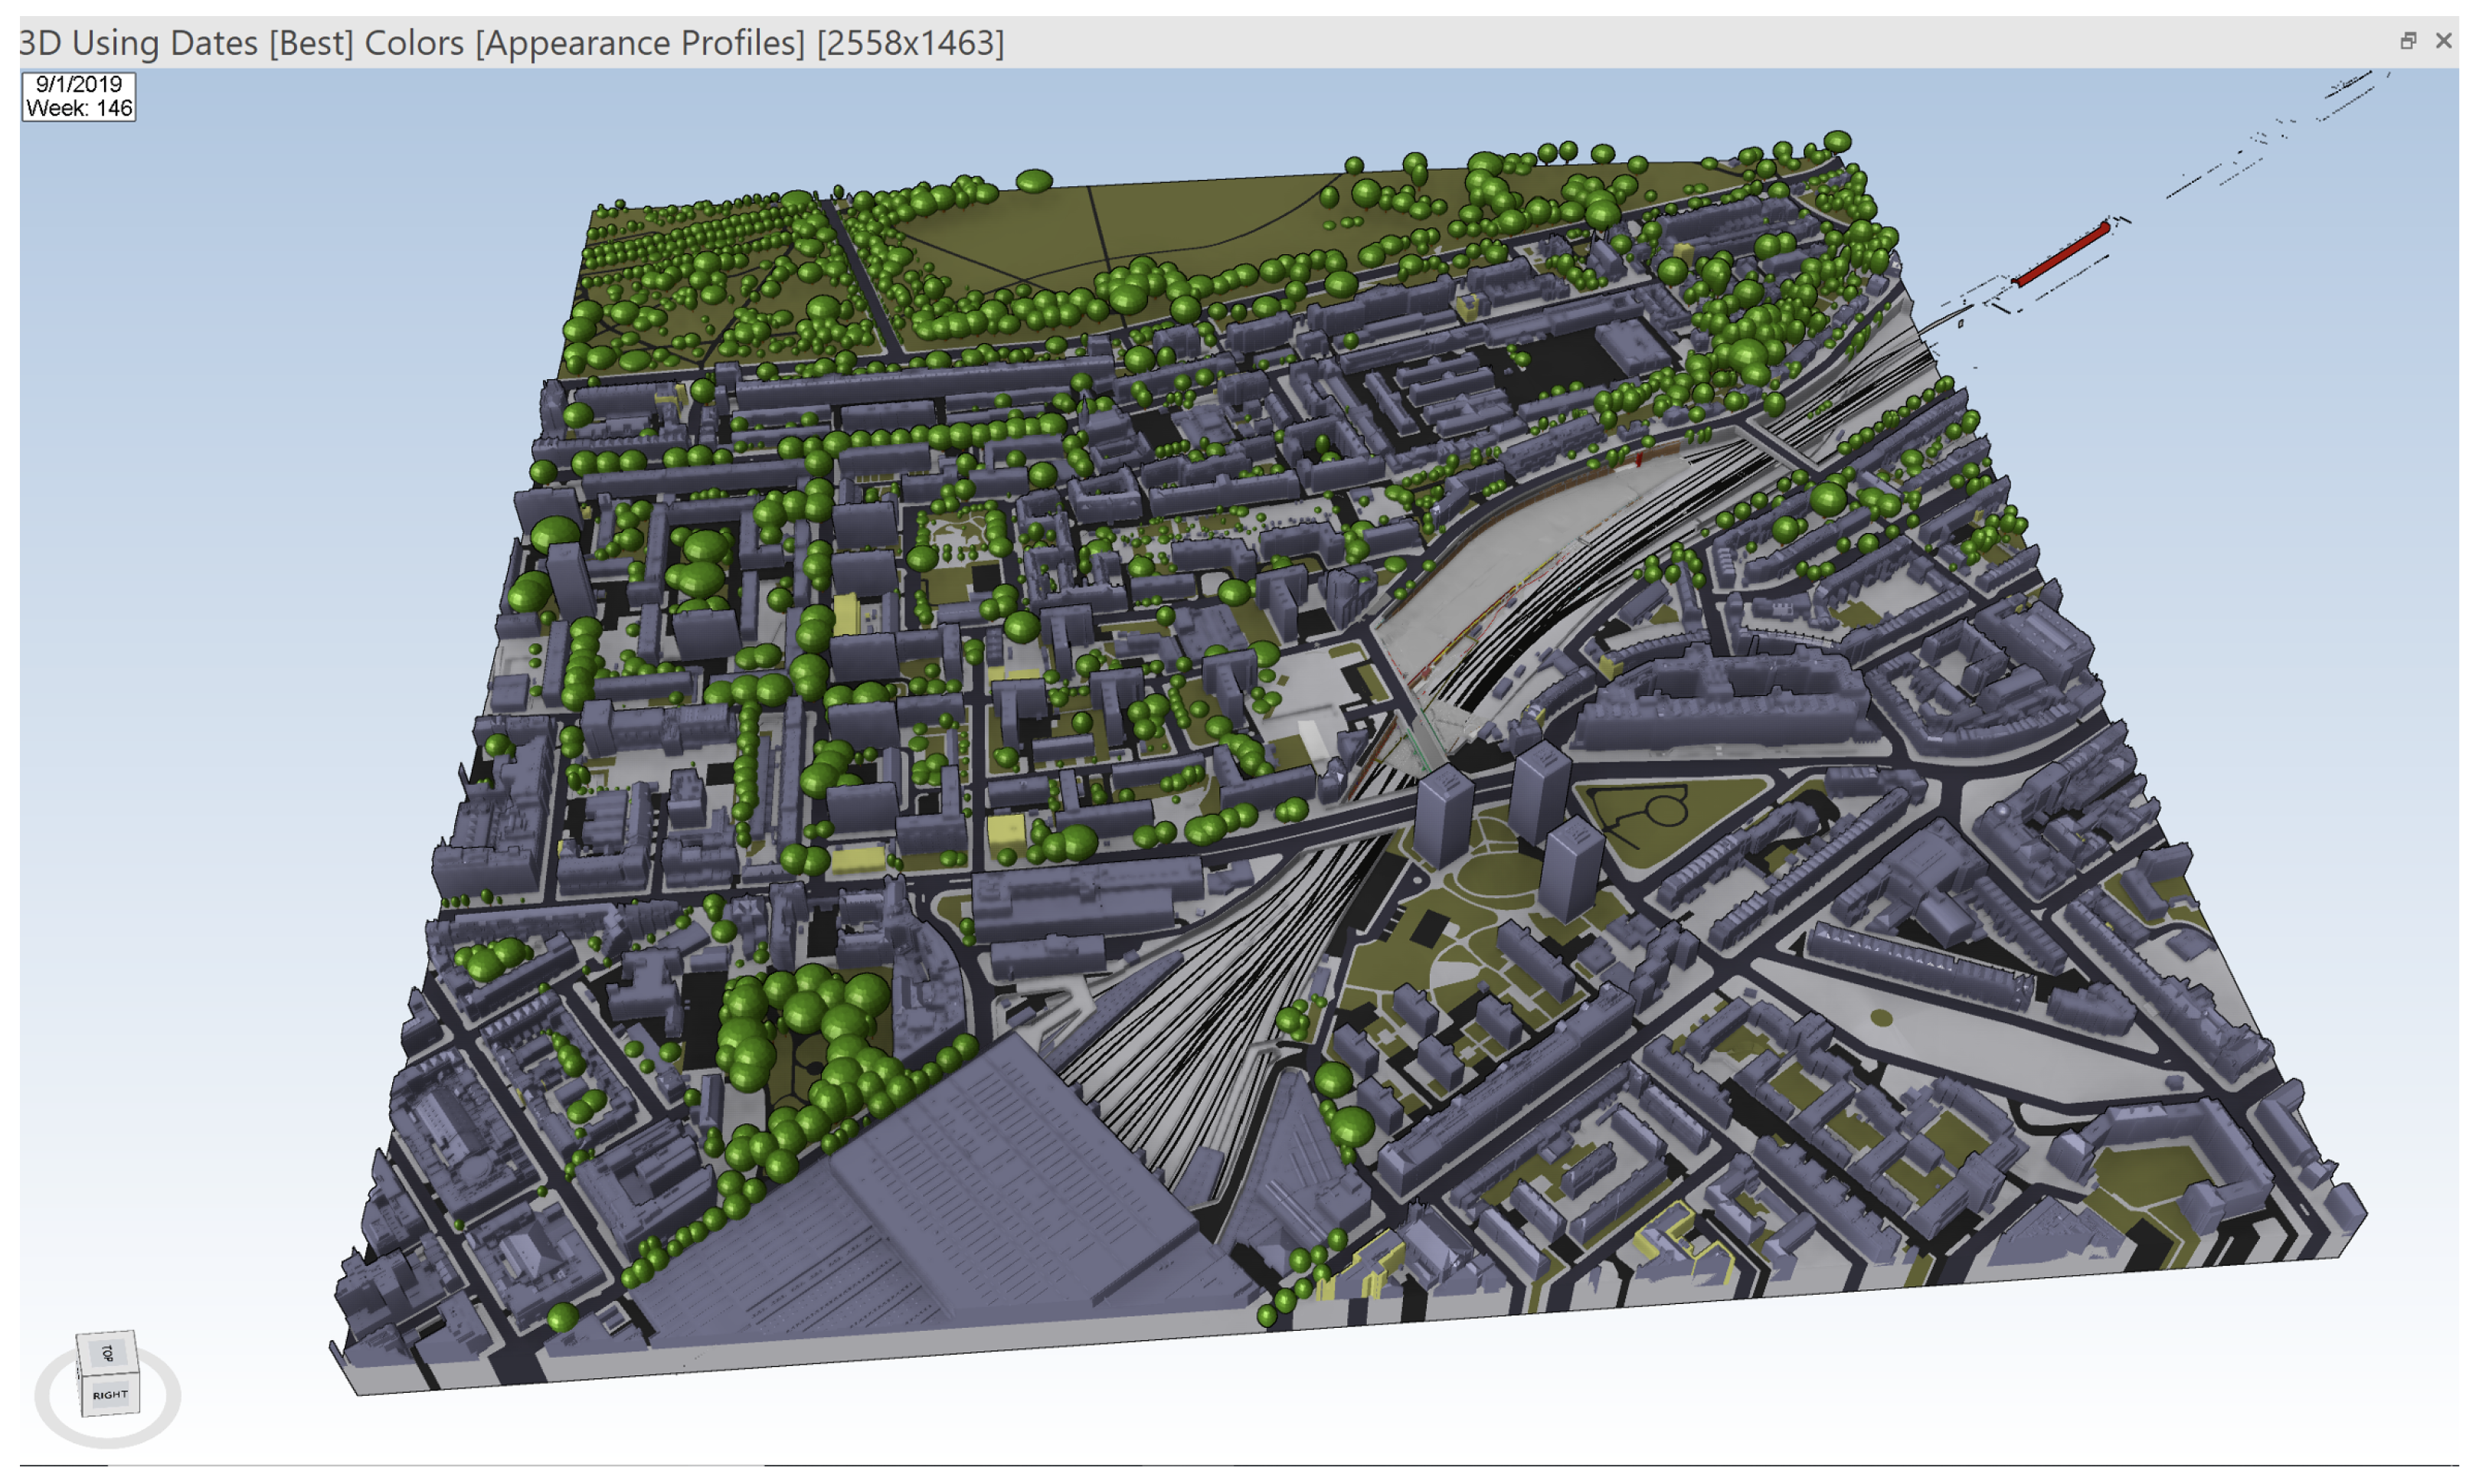
Through discussions and demonstrations, the researchers first developed a better understanding of the data, the software and how it was used currently. In particular, a better understanding of the level of expertise required to use Synchro was a key outcome of the discussion, along with a demonstration of the high level of sophisticated and complex 4D modelling available within this software package—both graphically and through the links from the graphics to tasks on the timeline.
2.
The team as a whole then explored the wider context of tasks undertaken by CSJV as part of the HS2 project, and—during the discussion—identified specific examples of situations where having easier access to the detailed Synchro data (which was not possible due to the expertise required to drive the software as well as limited licenses) may be of assistance. As part of the discussion, the CSJV team also explained if and how the suggested tasks were currently handled.
3.
In parallel with this, the CSJV team provided insight into GIS datasets available that may be relevant for the topics identified.
4.
Each topic was further refined to or specifically identify the required input data and processing to achieve relevant outputs.
5.
The use cases were then implemented taking an iterative approach with regular feedback from the CSJV team.

5.3. Democratising the Data—Visualisation

One of the issues highlighted during the discussions related to the level of expertise required to access and interact with the 4D data in Synchro. It was felt that the opportunity to interact with the data via a user-friendly web or desktop interface would be very valuable to decision makers (who do not have Synchro software expertise). They could then explore the data as needed during meetings (note that, in this context, the process of democratizing the data does not refer to opening it up to the public, as some of the data is commercially sensitive). To ‘democratize’ the data in this way, options for 3D and 4D visualisation of the resulting converted data were explored on two platforms—ArcGIS Pro https://www.esri.com/en-us/arcgis/products/arcgis-pro/resources (accessed on 20 October 2020), selected to allow GIS specialists to work on data management, editing, querying and analytics and CesiumJS https://cesium.com/cesiumjs/ (accessed on 20 October 2020), an open-source JavaScript library for 3D globes and maps which reads data in GeoJSON format and as 3D tiles (amongst others).

5.3.1. ArcGIS Pro

The PostGIS polyhedral mesh format could not (in 2019) be read by ArcGIS Pro and the data was re-converted into multi-patch format for visualisation. Geometries of resource data were also divided into two parts, depending on whether the 3D object was linked to a task or not. That way geometry was linked to the time attribute from its corresponding task. As ArcGIS Pro refreshes the entire layer anytime when one feature in the layer changes, this is needed to improve the performance in displaying data with time. Display start and finish dates were manually added to each 3D object according to their resource type and planned task start and finish dates. It was assumed that equipment would be on display as the same dates assigned as task dates, for demolition or removal tasks, display start date was assigned to be the same as project start date, and for installation tasks, finish date was assigned to be the same as project finish date. This avoided the situations when a new installation was only on display during the period when the installation task was active, disappearing afterwards.

5.3.2. Cesium

Upon installation, a Cesium viewer of the globe and basic navigation functionalities including a timeline were available. Eight views were added to the database divided by object categories, similar to layers created for ArcGIS, including tasks, base data, buildings, roads, greenspaces, trees, rail and other features. As only WGS84 coordinate system was supported by both GeoJSON and Cesium, geometries from the database were transformed from British National Grid (SRID: 27700) to WGS84 (SRID: 4326).
All data was served directly from PostGIS as GeoJSON through a NodeJS web application server. Start and end dates were included with each 3D object to allow users to browse through the data in 4D. As GeoJSON does not support PolyhedralSurfaceZ geometry type, objects were converted and exported through FME to Cesium 3DTiles format, which is an open specification developed by Cesium for streaming massive heterogeneous 3D geospatial datasets [36]. Data were visualised at a height of 70m above ground to account for the difference between ellipsoidal height used by WGS84 and the actual height transformed from the 3D model. Once the basic visualisation was complete, further options were explored to visualise the results of the identified use cases.

6. Results

6.1. Data Conversion

Table 4 shows a summary of the data exported from Synchro.
A number of data quality issues were encountered during this translation process, as follows:
1.
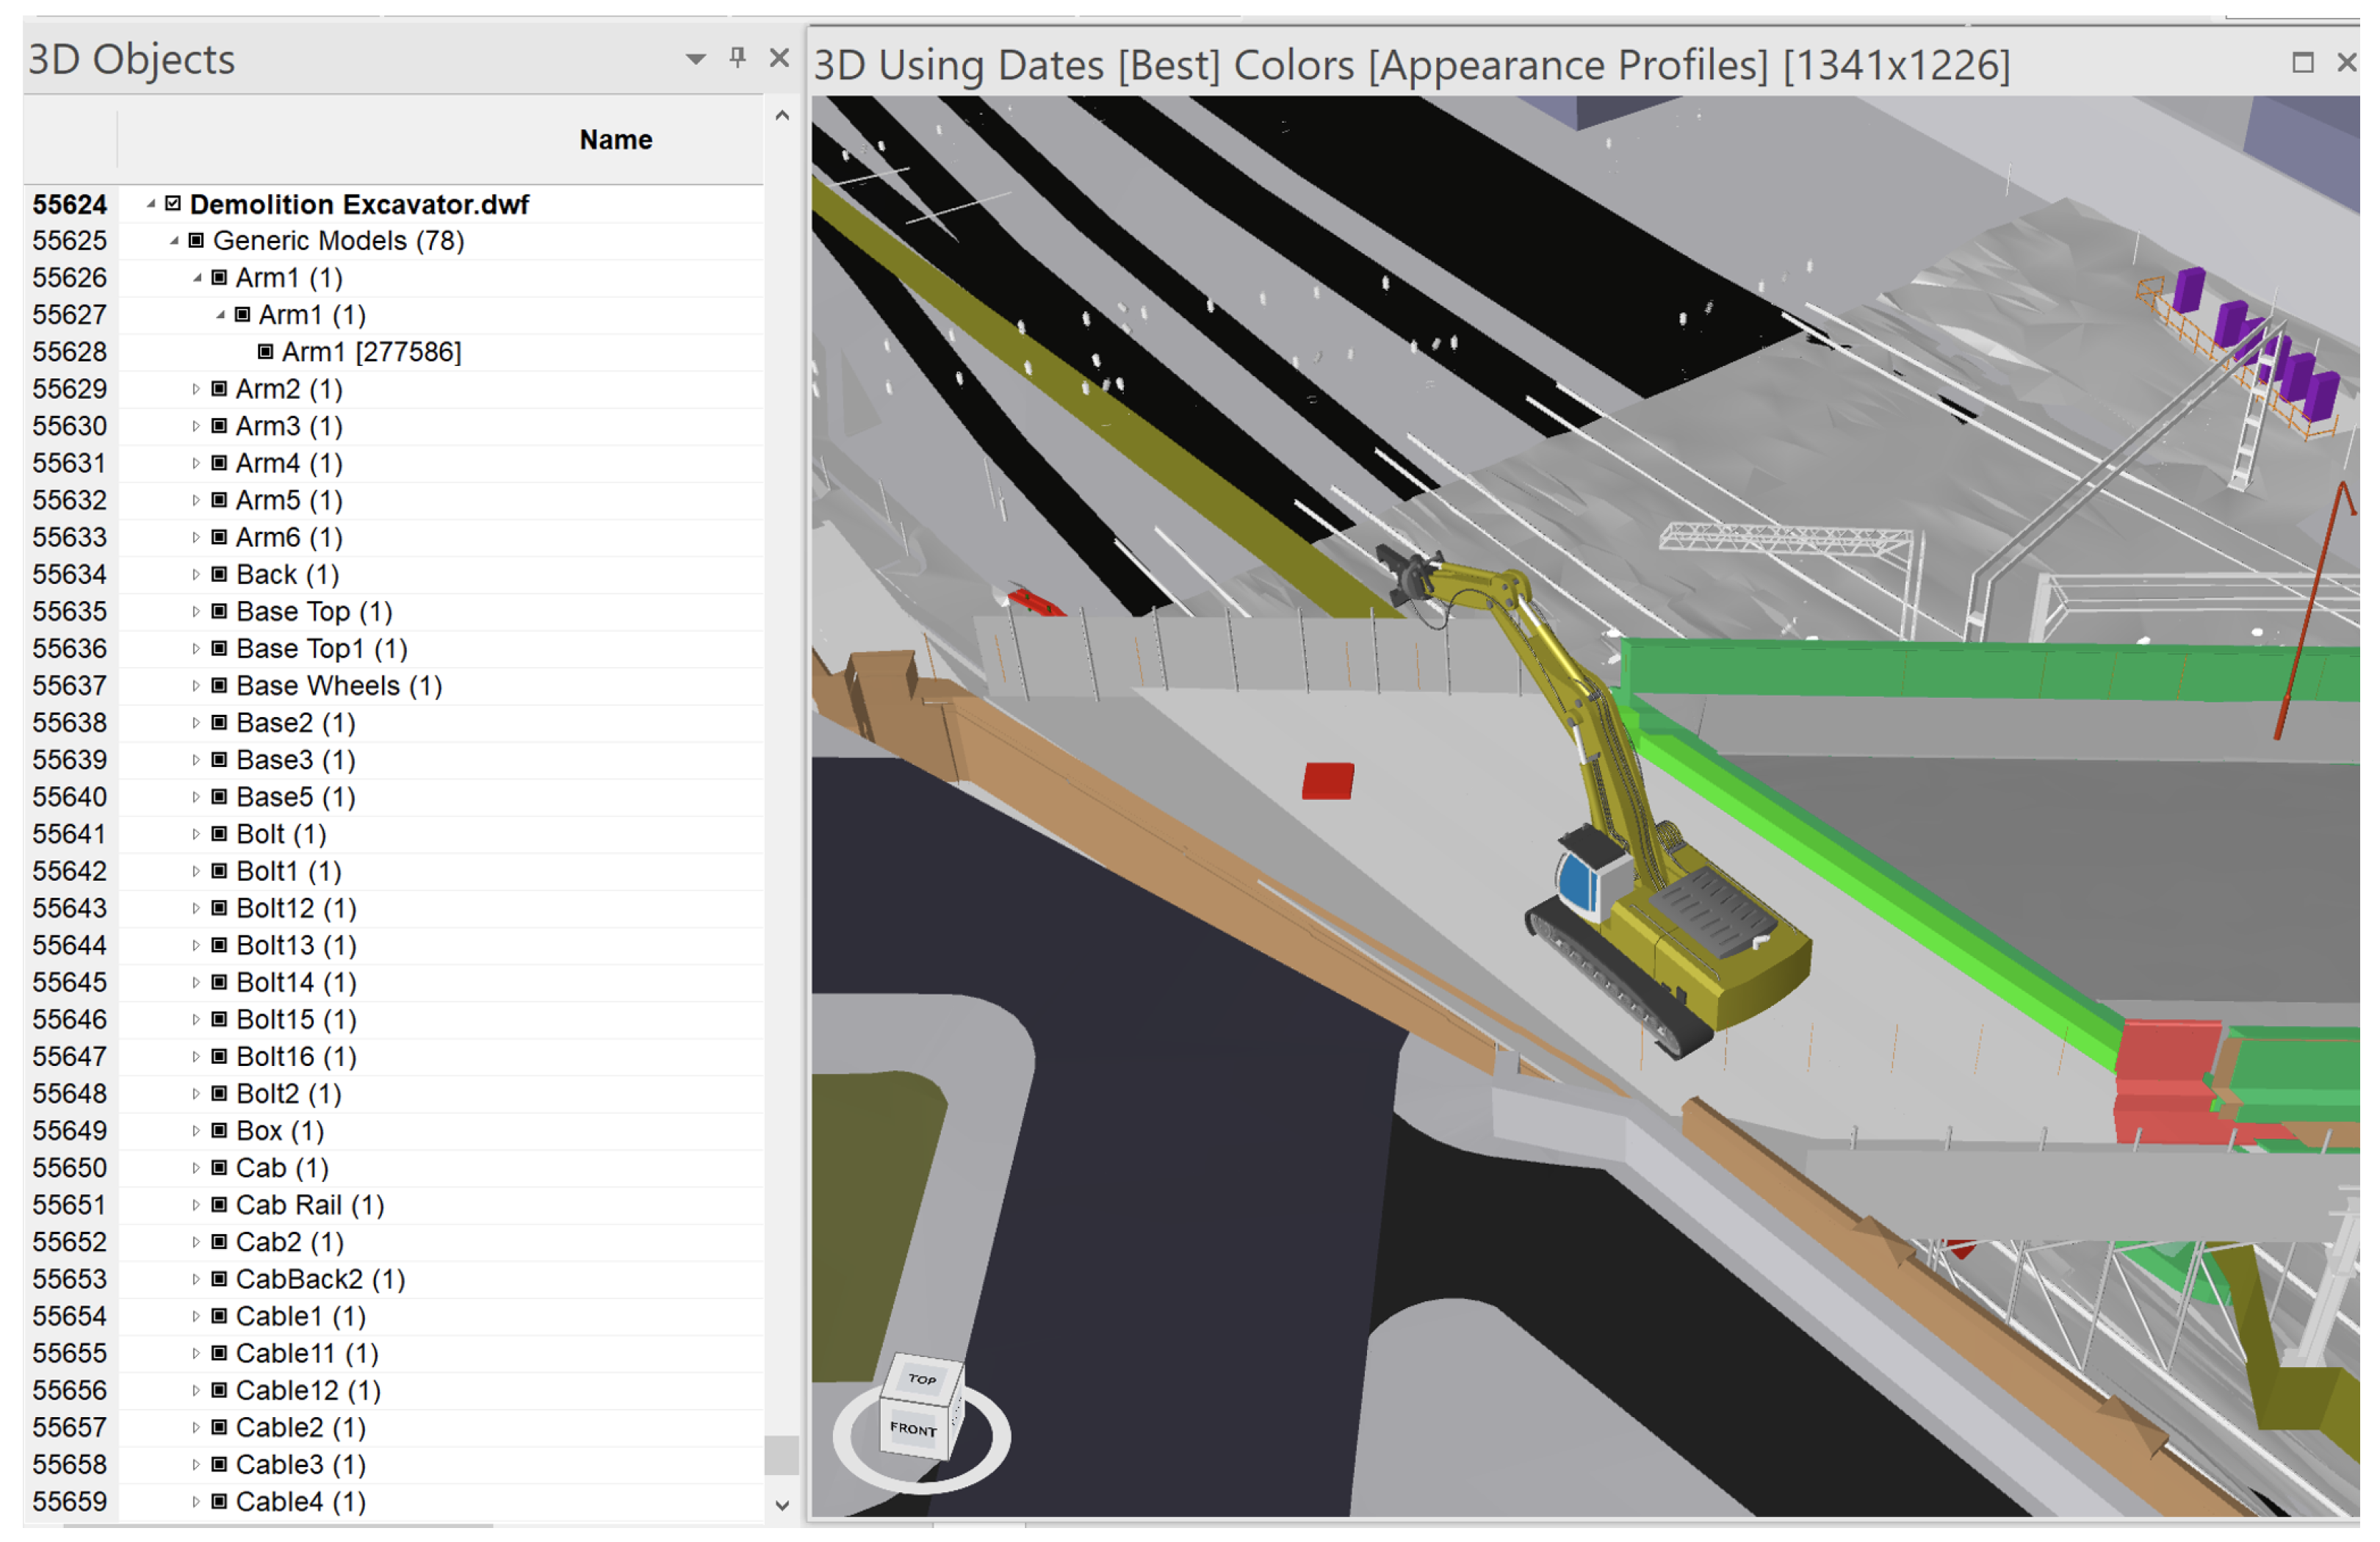
The number of vertices in the 3D model (13,073,125) meant that the geometry and the attribute data had to be handled separately.
2.
Data had to be re-projected from the project engineering grid (Snake Grid, [37]) to British National Grid (the UK’s national mapping reference system) in preparation for downstream integration and visualisation with GIS data.
3.
The IFC export lost many of the parent-child relationships between the different resources—these then had to be re-linked via data from a separate Excel export (the majority of time for conversion—approximately 1 day of effort for this small dataset—related to this task).
4.
Although the objects are presented in a hierarchy, there is a lack of clear definition as to which objects should be created as individual features and which should be aggregated during model creation.
The migrated tables were reviewed for the completeness of geometry and semantic information, and datasets were cleaned up and restructured to manage information relevant to the project. It was noted that IfcBuildingElementProxy was the only element extracted via the conversion process from Synchro, for both base and resource data. This was due to a lack of semantic information for the geometry within Synchro itself, given its focus on visualisation—while the user is able to identify objects visually, these are not labelled in the dataset (although theoretically, Synchro does provide the opportunity to classify objects and keep this classification through IFC export, this was not achieved in practice). The resulting database contained 9379 individual 3D objects, with a total of 13,073,125 vertices and due to the size of the dataset, IfcBuildingElementProxy was divided into two tables—one for geometry and the other for attributes, linked by a global ID assigned to each 3D object. This allows separate editing and querying in geometry and attribute, and both tables are joined only when needed, resulting in optimal performance for the subsequent implementations (as this was a prototype test a high specification database server was not used. It is anticipated that such a server, correctly configured, may overcome the performance issues encountered). All objects were classified post export from the task/resource information.
As original 3D objects modelled in Synchro were in SnakeGrid [37], a transformation to British National Grid was also carried out to match the coordinate system used by CSJV GIS platform. 3D objects relating to both resource data and base data were combined and transformed using FME’s https://www.safe.com/fme/ (accessed on 20 October 2020) SnakeGridObject with Reproject by Centroid, which defined the reprojection offset and rotation parameters between SnakeGrid and British National Grid based on the location of the respective centroid of all objects. Each object was shifted and rotated by the same amount—this is to preserve the shape and size of individual 3D model and their internal relationship and consistency [37].

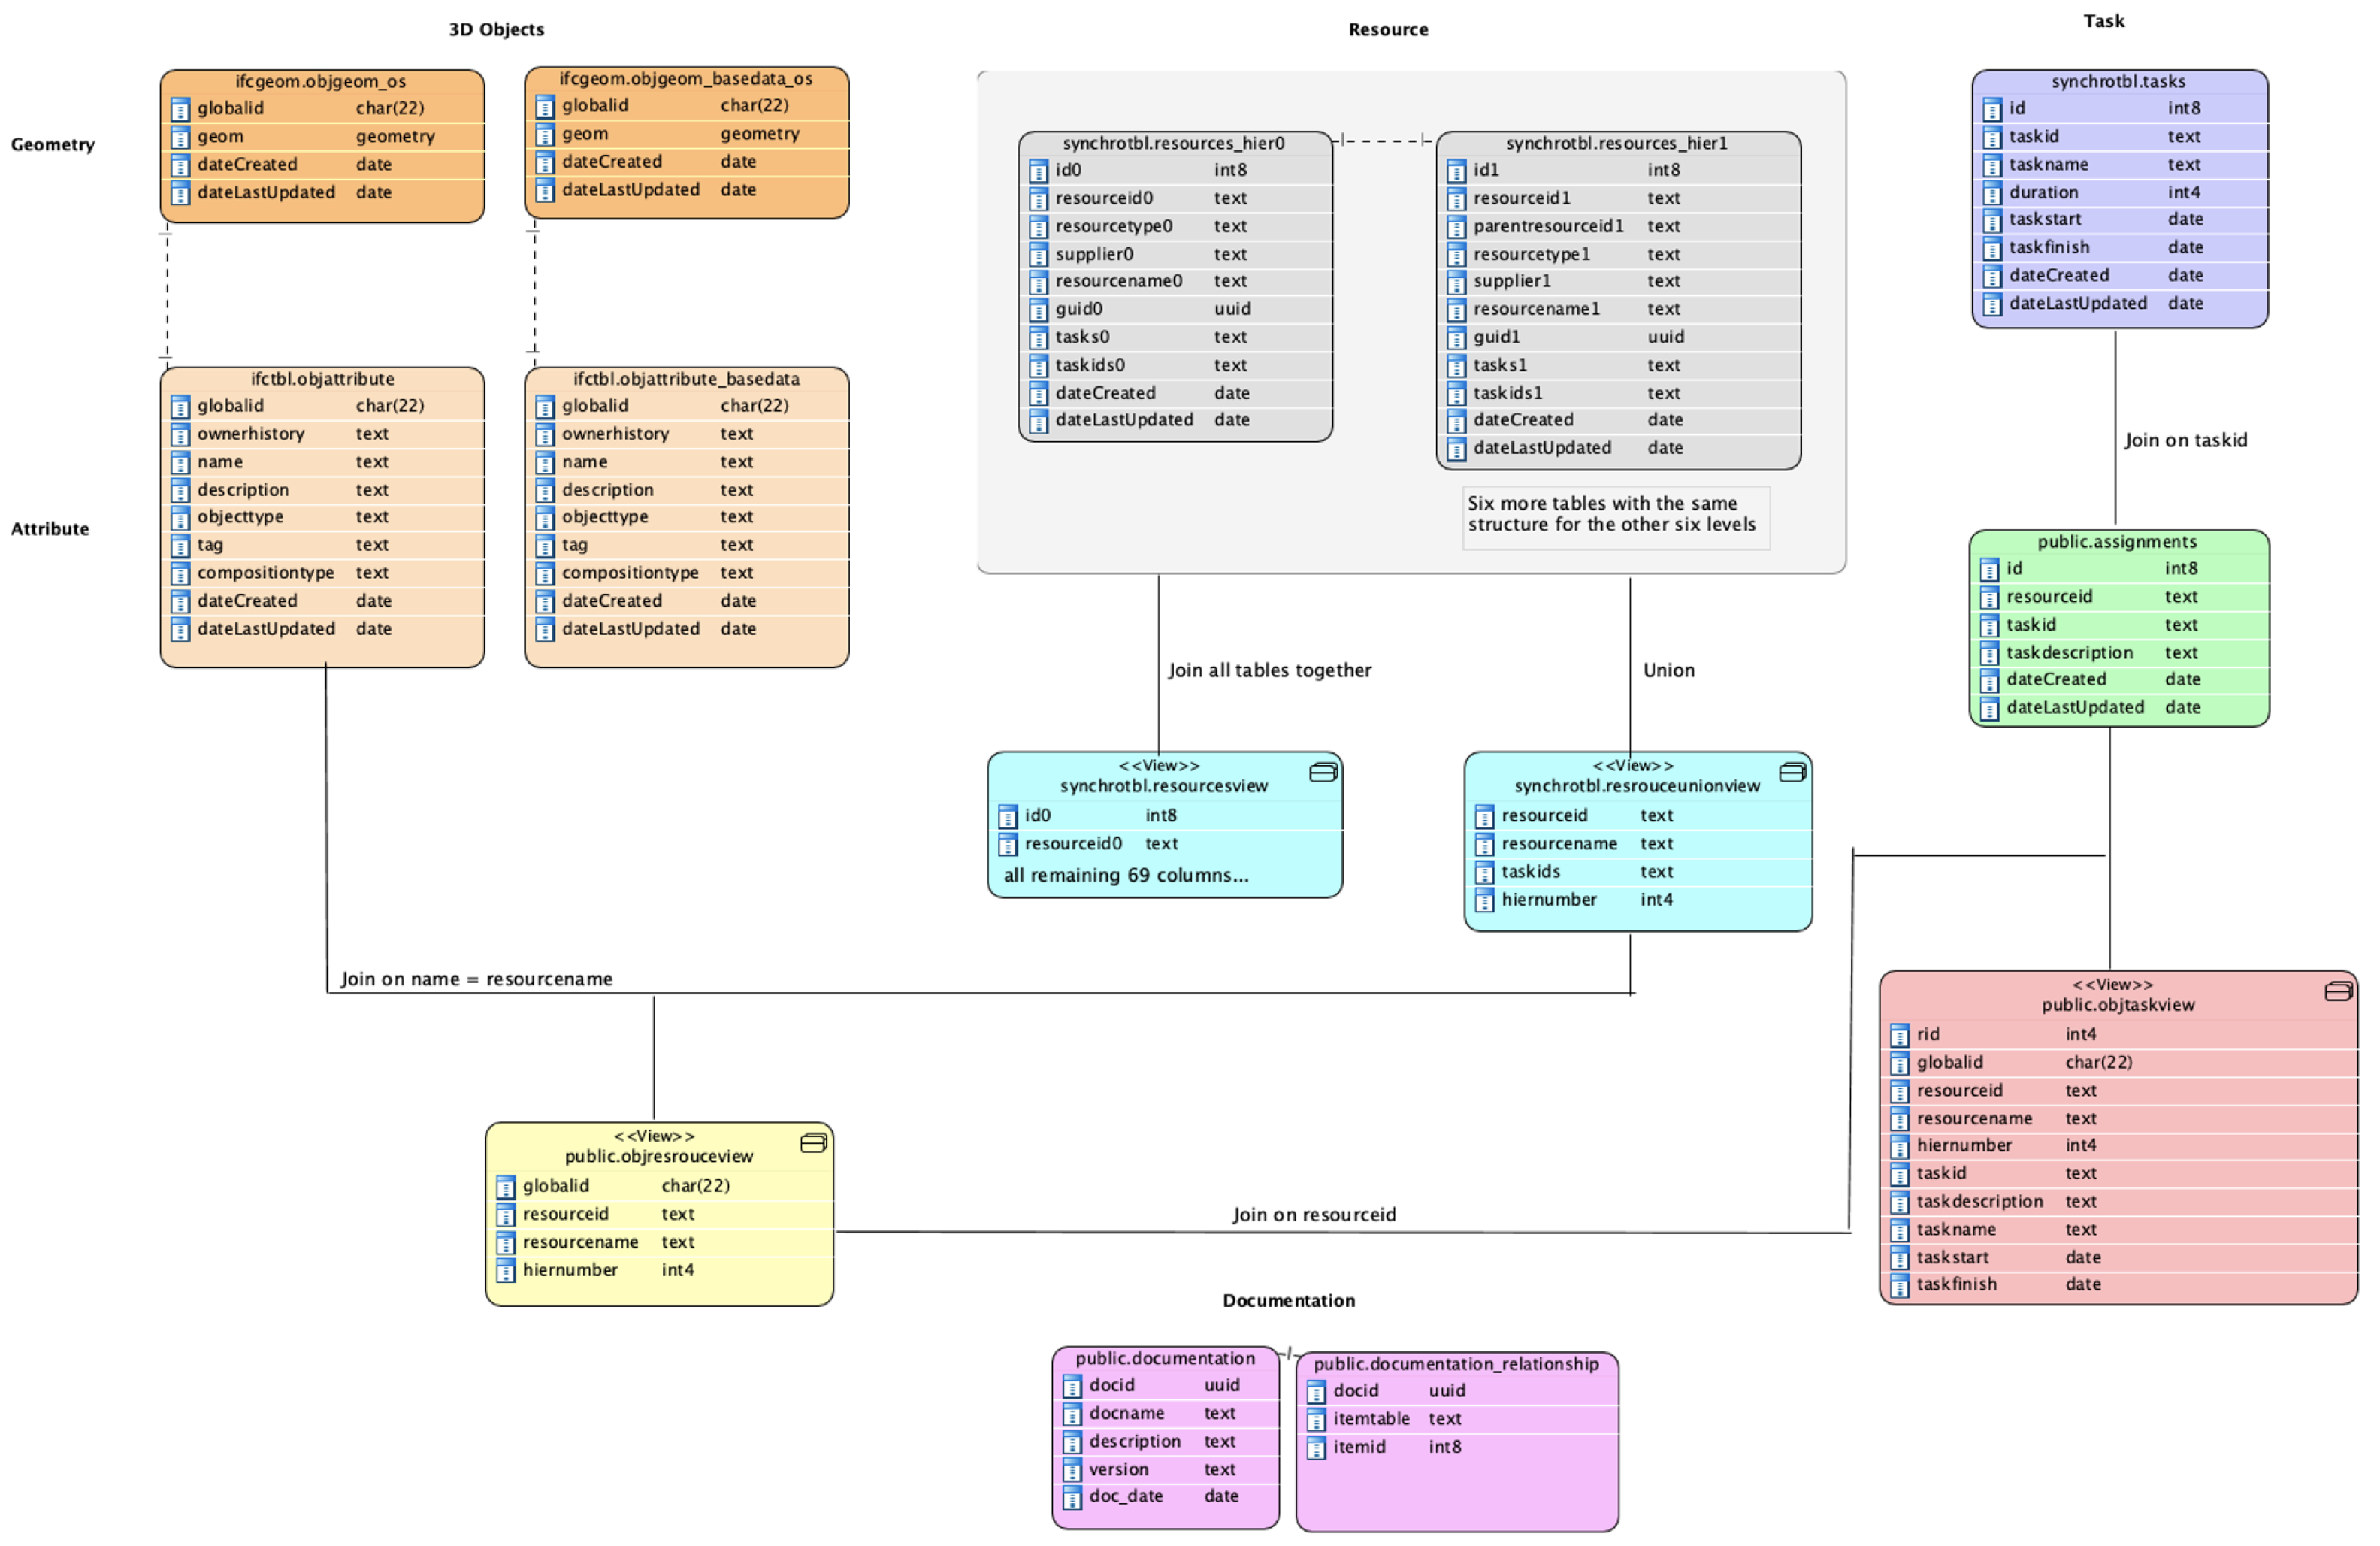
6.1.1. Re-Linking Task, Schedule and 3D Geometry

For task and schedule data, although information was included in ifcTask, ifcScheduleTimeControl, ifcRelAssignTasks and ifcRelNests, and linked by IFC generated IDs to show the hierarchy of tasks and construction sequence, the relationship between resource and their corresponding tasks could not be fully retrieved. A separate Excel export was generated from Synchro to reproduce the relationships.This contained the ResourceIDs and ParentResourceIDs generated by Synchro, and the ResourceNames that were equivalent to Name in the 3D geometry, and TaskIDs that the resources were assigned to.
The Resource sheet was manually divided into eight levels, with each level linked to its parent level by ParentResourceID. Any resource under any level can be assigned to a task along with its child resources, and any resource associated with a task was extracted.
A total of 206 resources were found assigned to a task from the IFC export, while 1888 resources were identified to have a task based on the Excel export. The relationships identified from Excel were used in further development after being matched to the original assignments in the Synchro master file.
As in the demolition excavator model shown in Figure 5, 3D objects were organized in a tree structure with different levels. When assigned as a resource, the tree structure was preserved by assigning a parent resourceID to the child resource. The hierarchy of 3D objects could also be reproduced from the Excel export which contained level information that can be used to identify the category of the objects, for example, trees, buildings, green spaces.

6.1.2. Data Quality Considerations

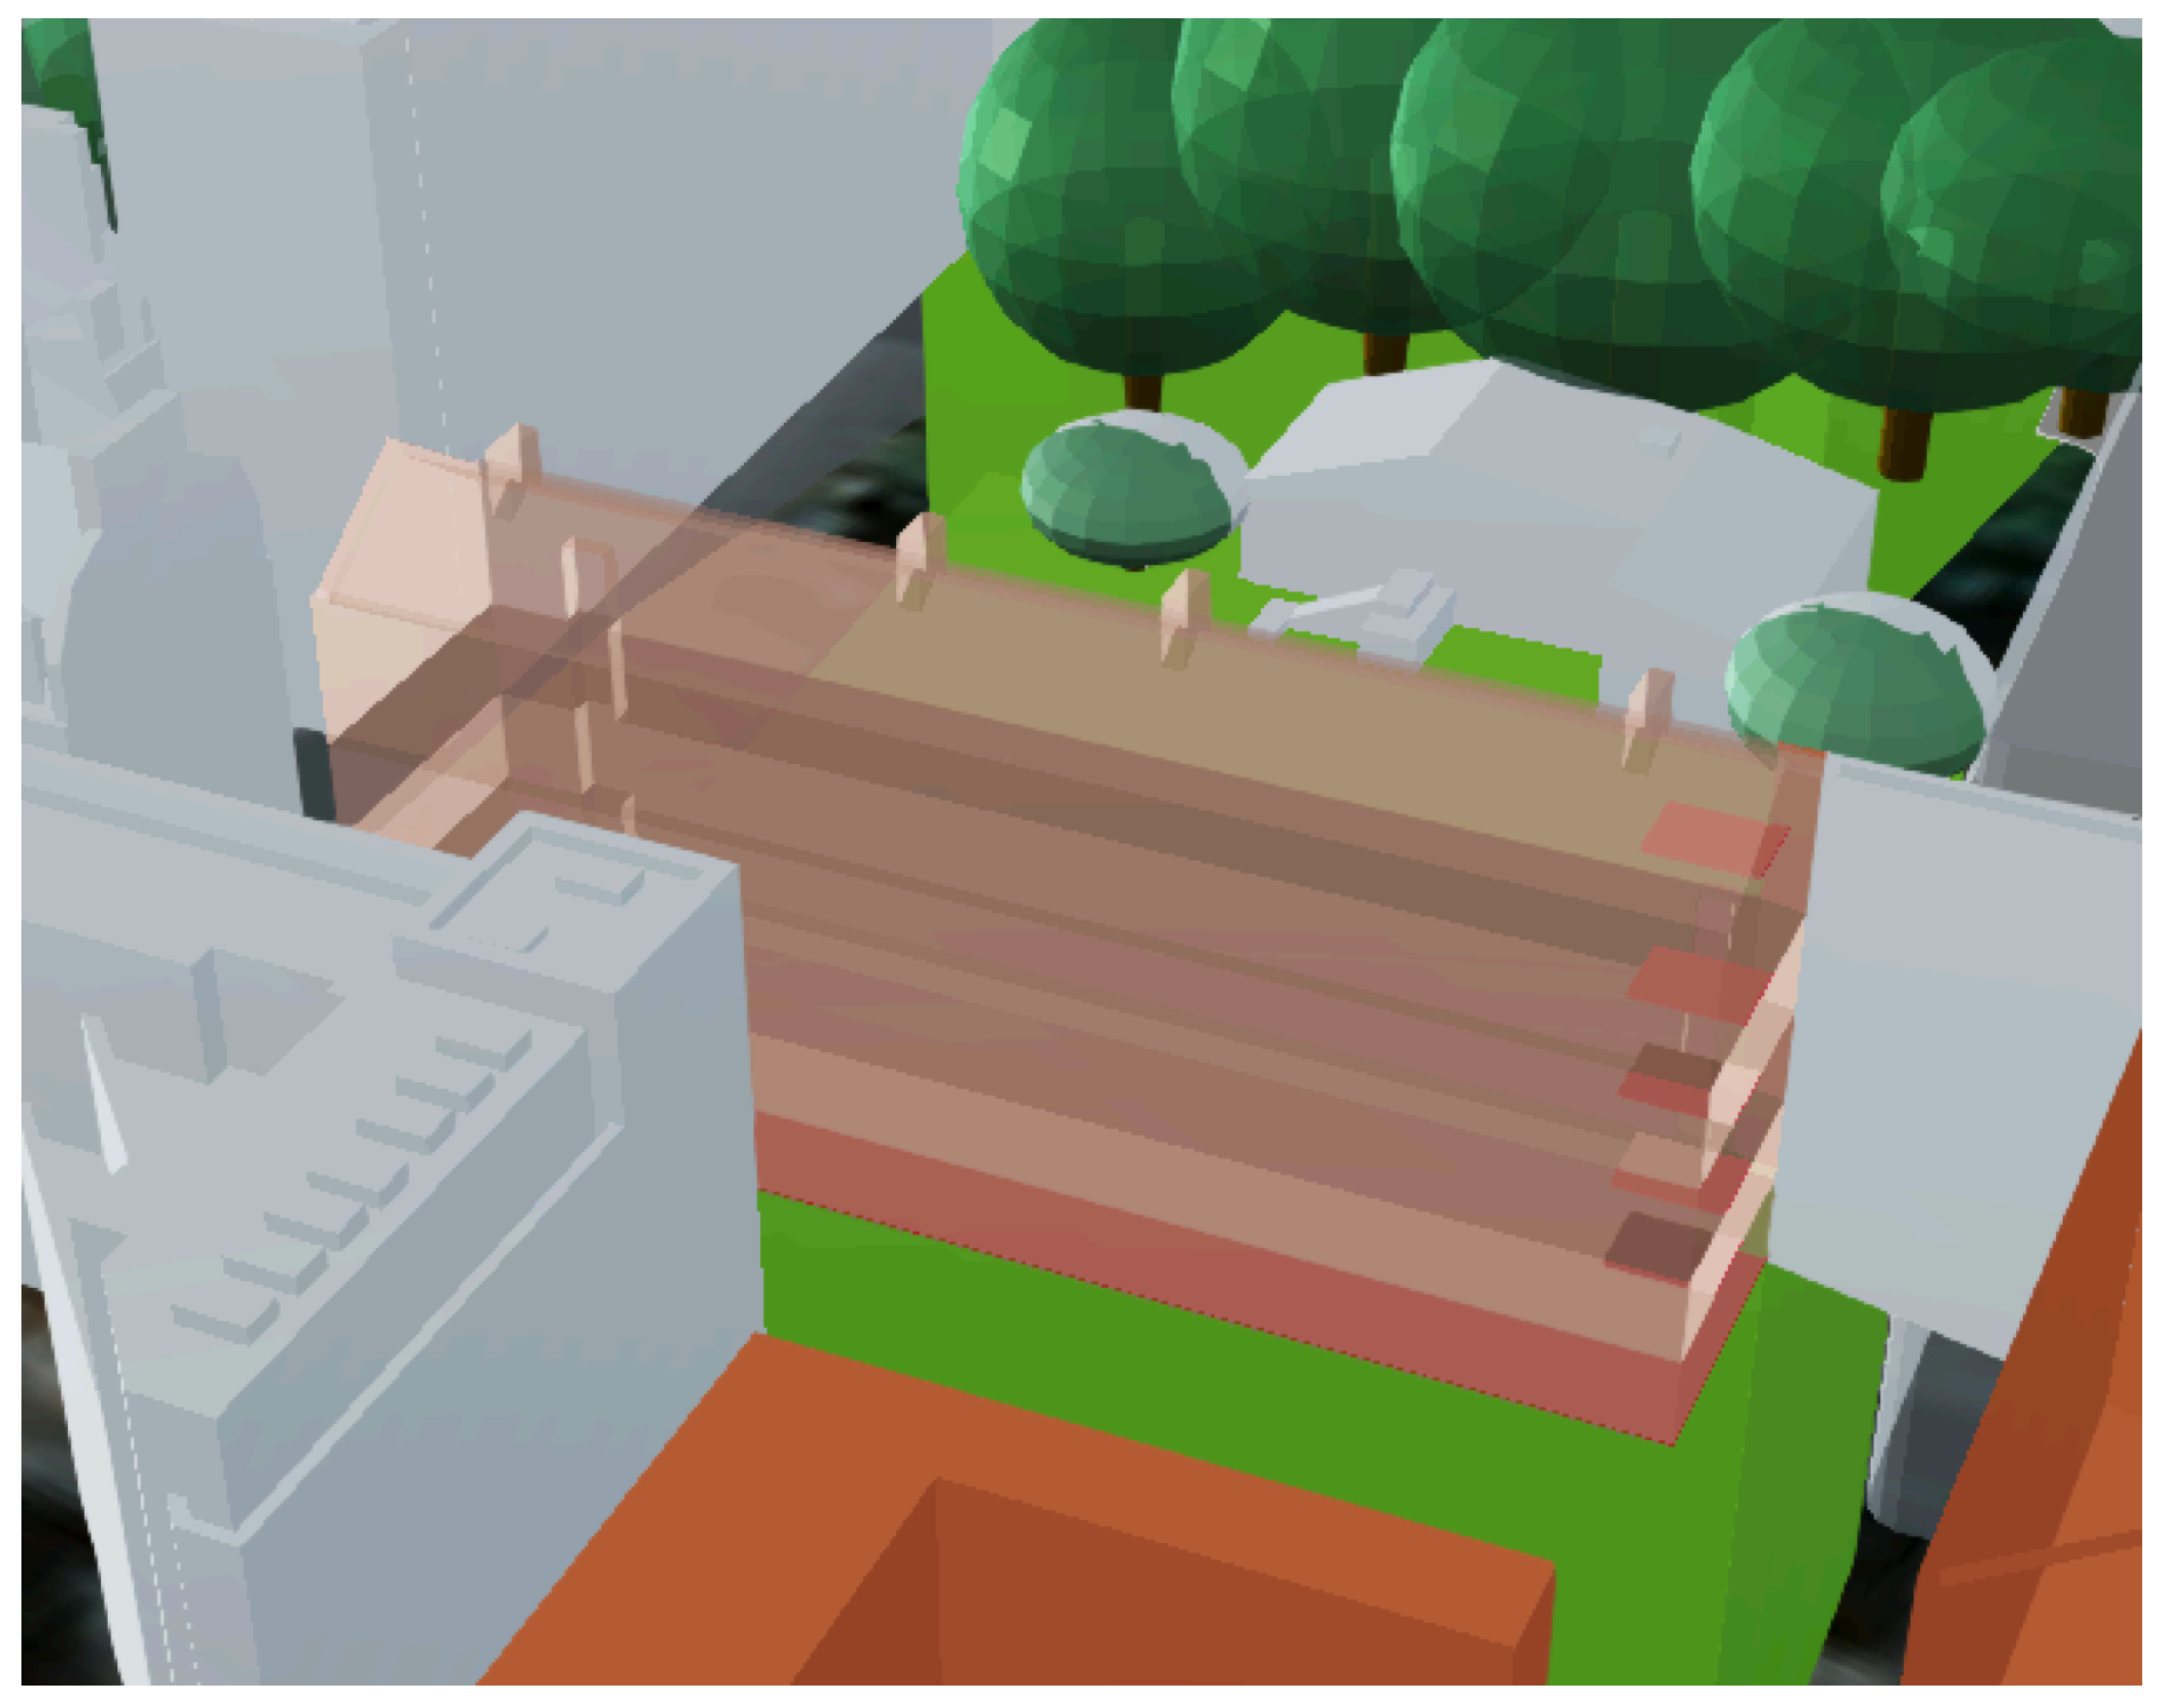
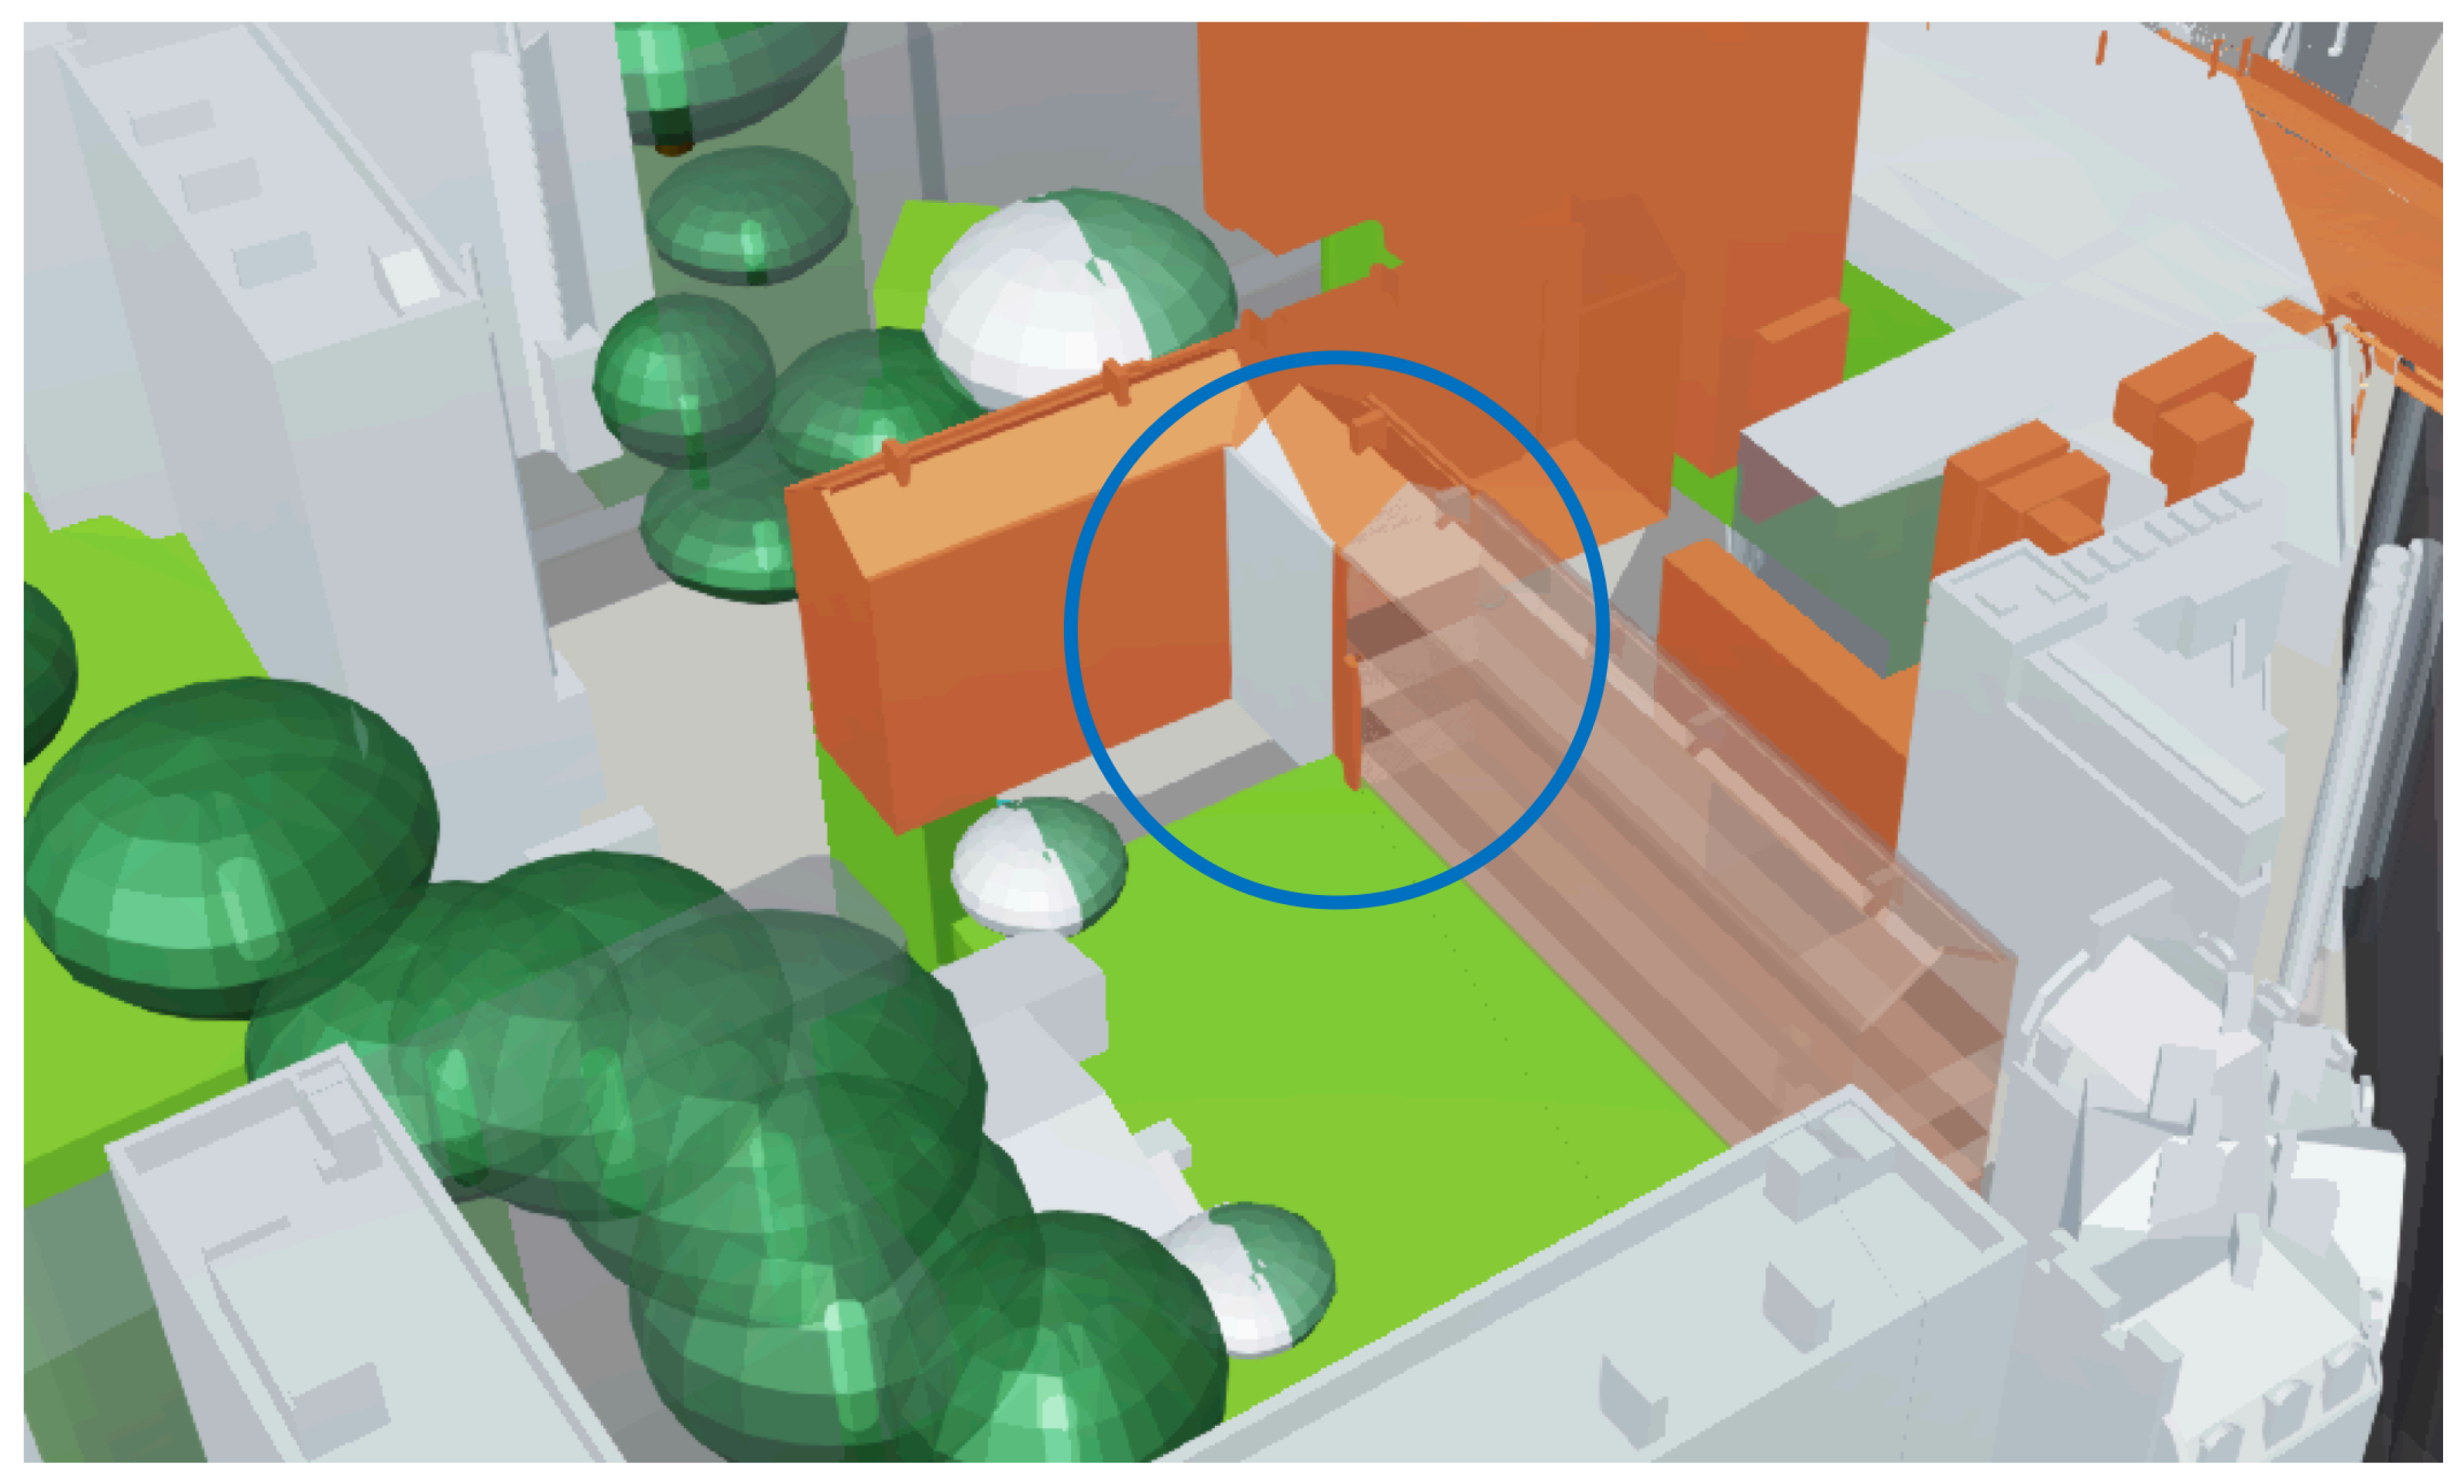
  • Completeness: Missing data from export and import caused additional iterations when setting up the database. Geometries not assigned as resources were not included in the IFC export, and the relationship between a 3D geometry and its associated task could not be modelled within IFC alone. Existing GIS data exported from the enterprise database required manual data cleanup, and attributes were either missing or converted from CAD drawings only which resulted in a lack of actual semantic information. When a group of geometries needed to be assigned to the same task within Synchro, this was usually accomplished by the user manually selecting the objects that were of interest. Thus, cases were found when one piece or a small set of objects were left out when the group was assigned to a task as a whole. Figure 6 shows the task of a building demolition, where one piece of the building (in white) continued to be displayed throughout the project.
  • Duplicate geometries: were found in the Synchro export between resource data and base data. This may be caused by a subset of that data being imported into Synchro twice.
  • Positional Accuracy: The 3D objects in Synchro were originally drafted with CAD software, based on design or surveying data with the measurement at a level of accuracy of 1 mm and provided in the SnakeGrid [37] projection. As British National Grid is the projection used by CSJV GIS system, a transformation was carried out before storing geometries in the database, which introduced distortions. The further away from the centroid of the entire model area, the larger distortion it caused, as the objects were reprojected based on the centroid of all objects. The centroid position errors and bounding position errors reported from SnakeGrid transformer show maximum values of 70.595 mm, 145.1496 mm and 146.3598 mm respectively.

6.2. Identifying the Benefits of BIM/GIS Integration—Use Case Identification

Based on the discussions described in Section 5.2 three use cases that could benefit from the 4D integrated data were identified.

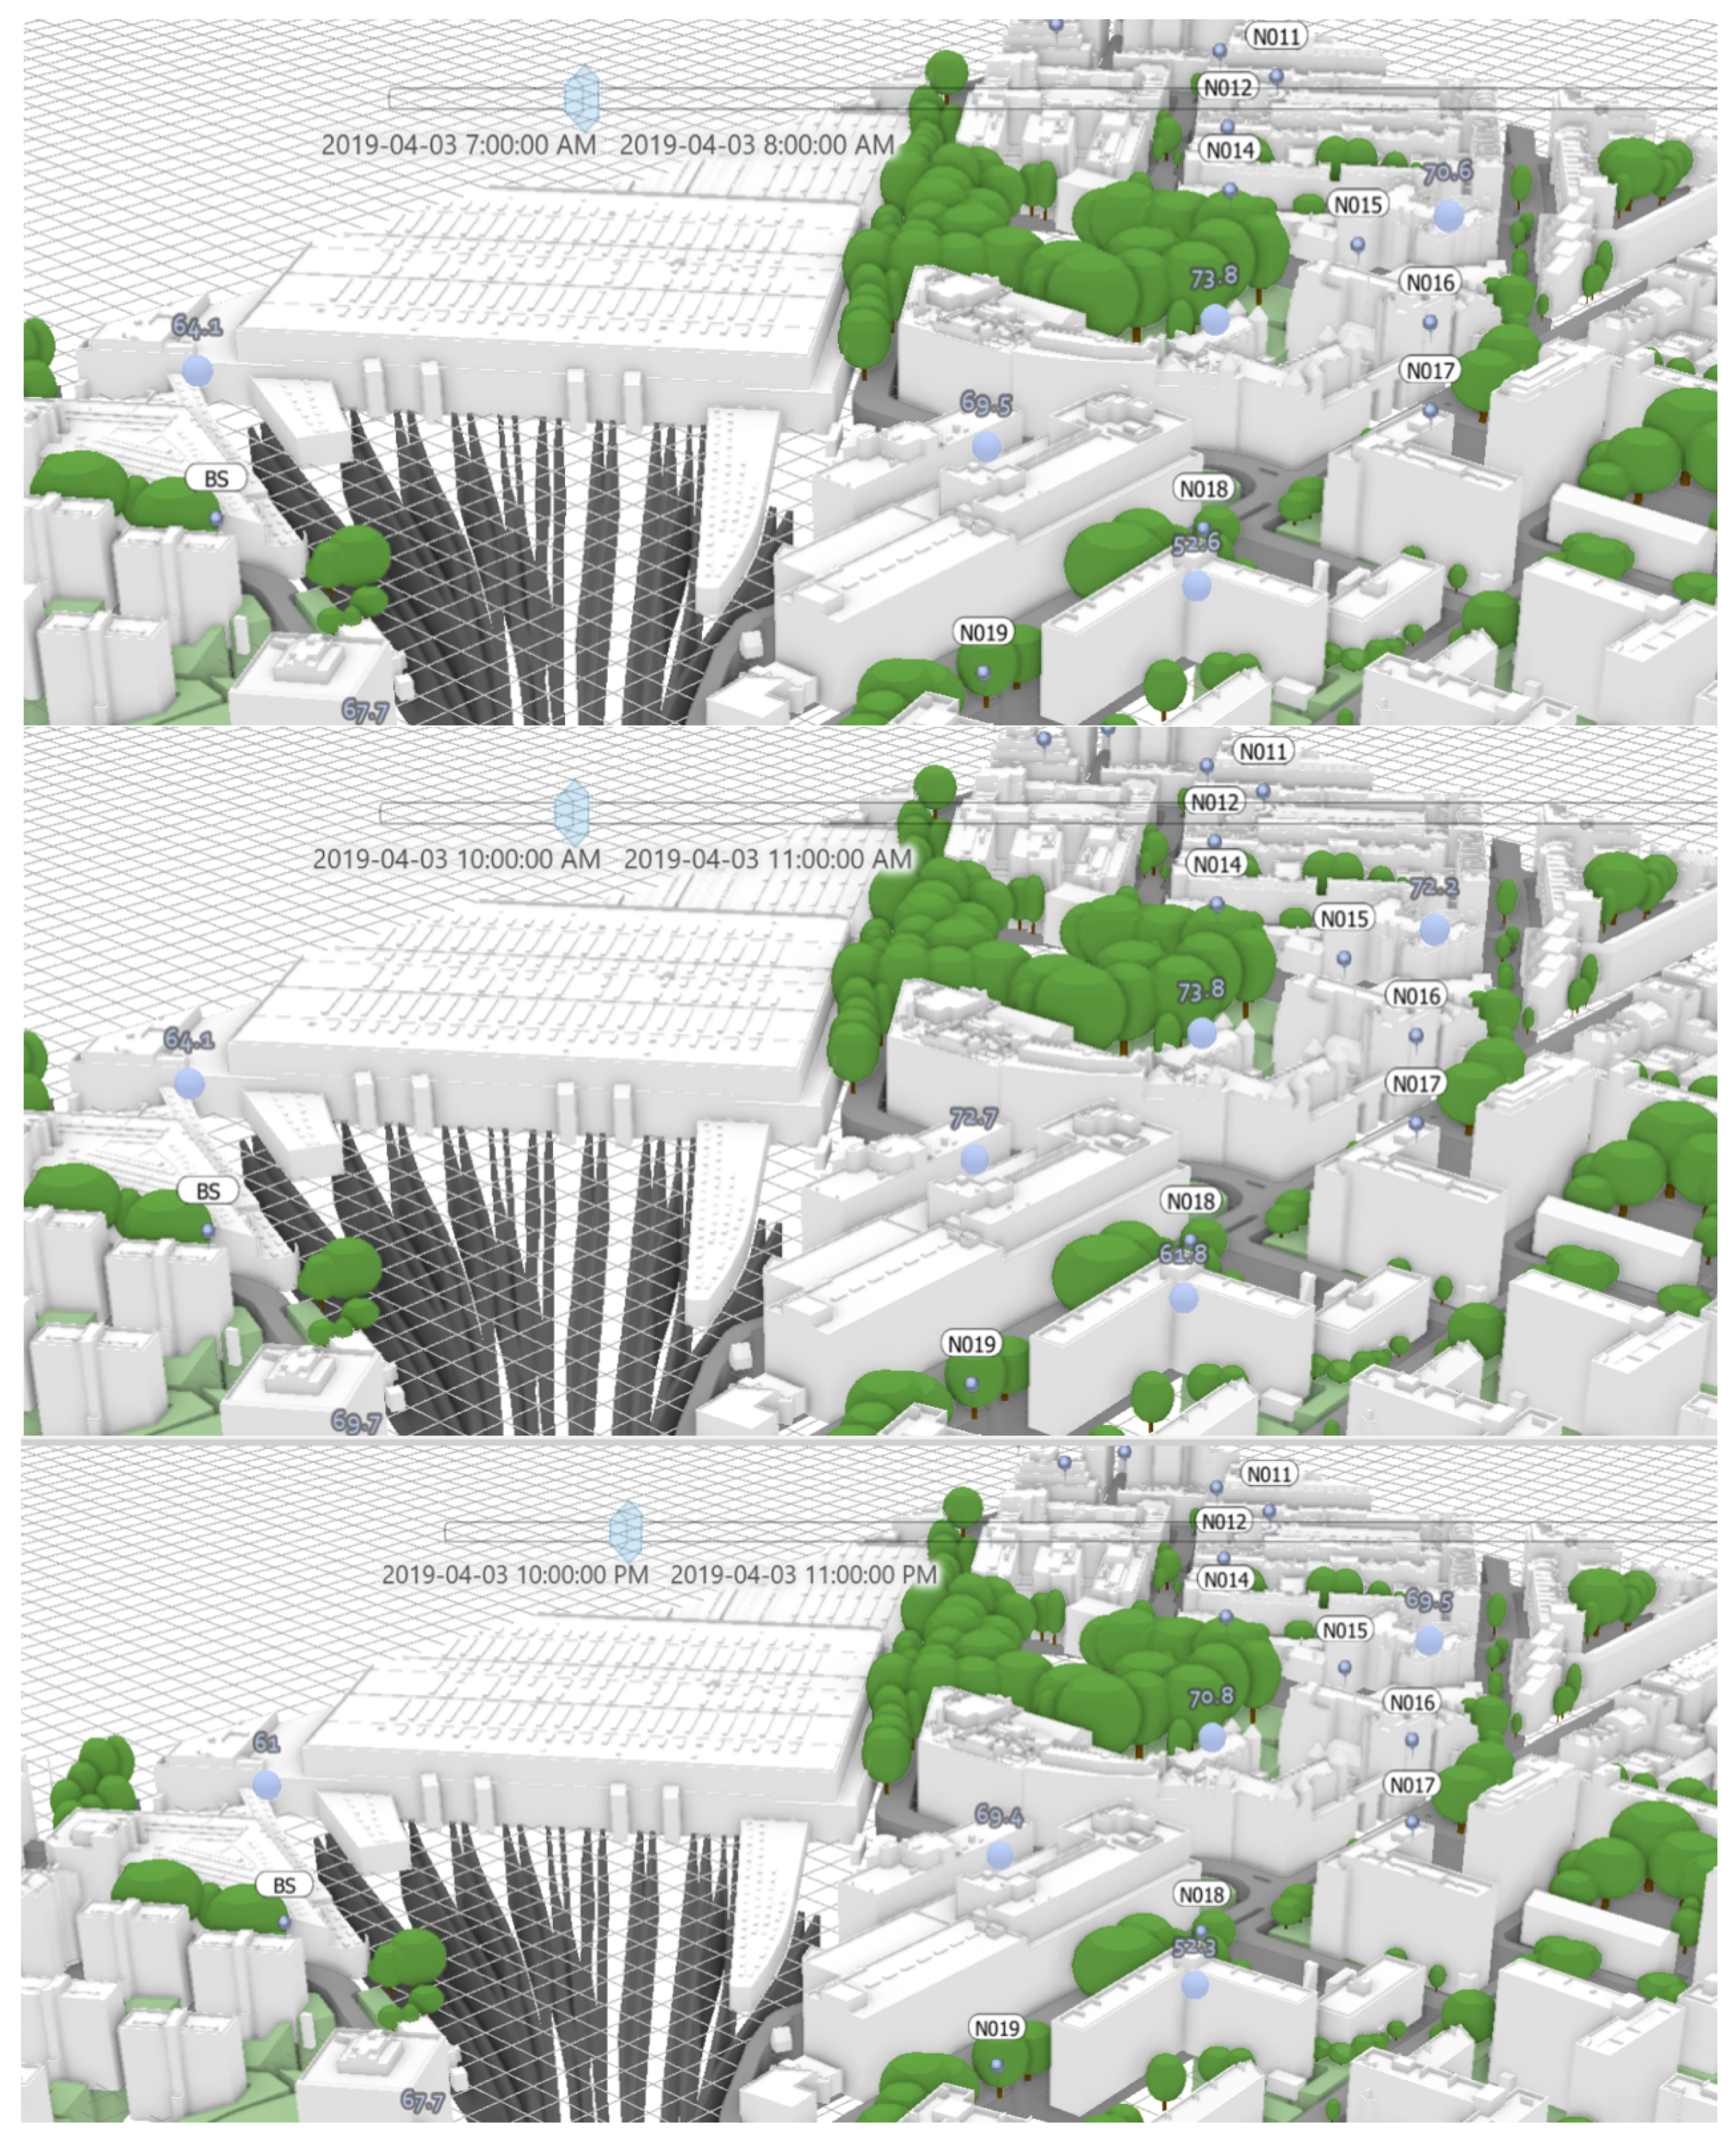
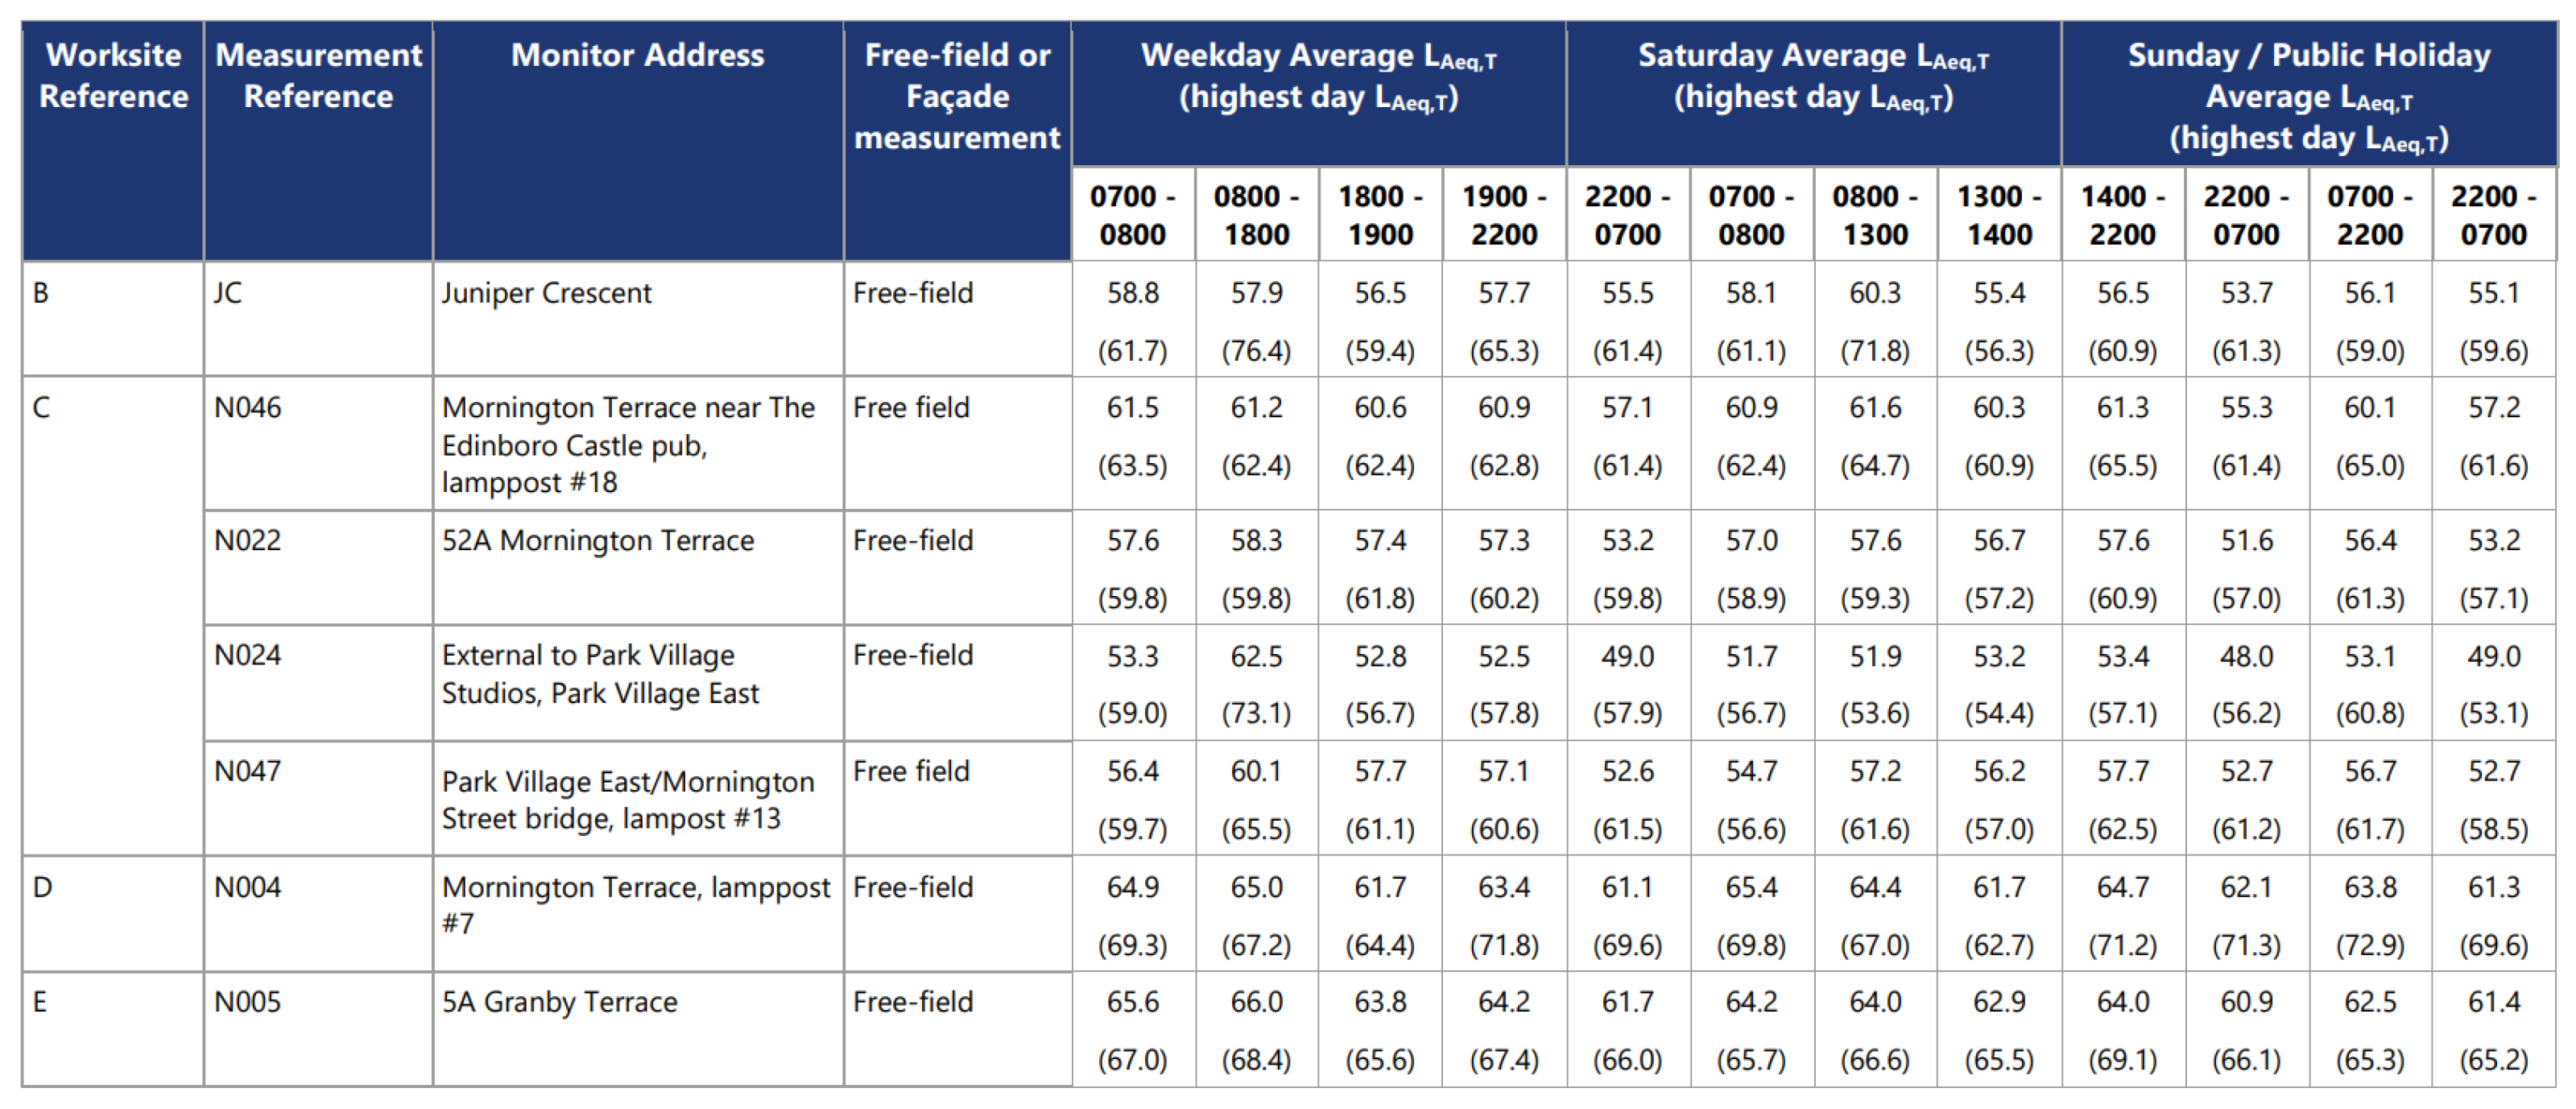
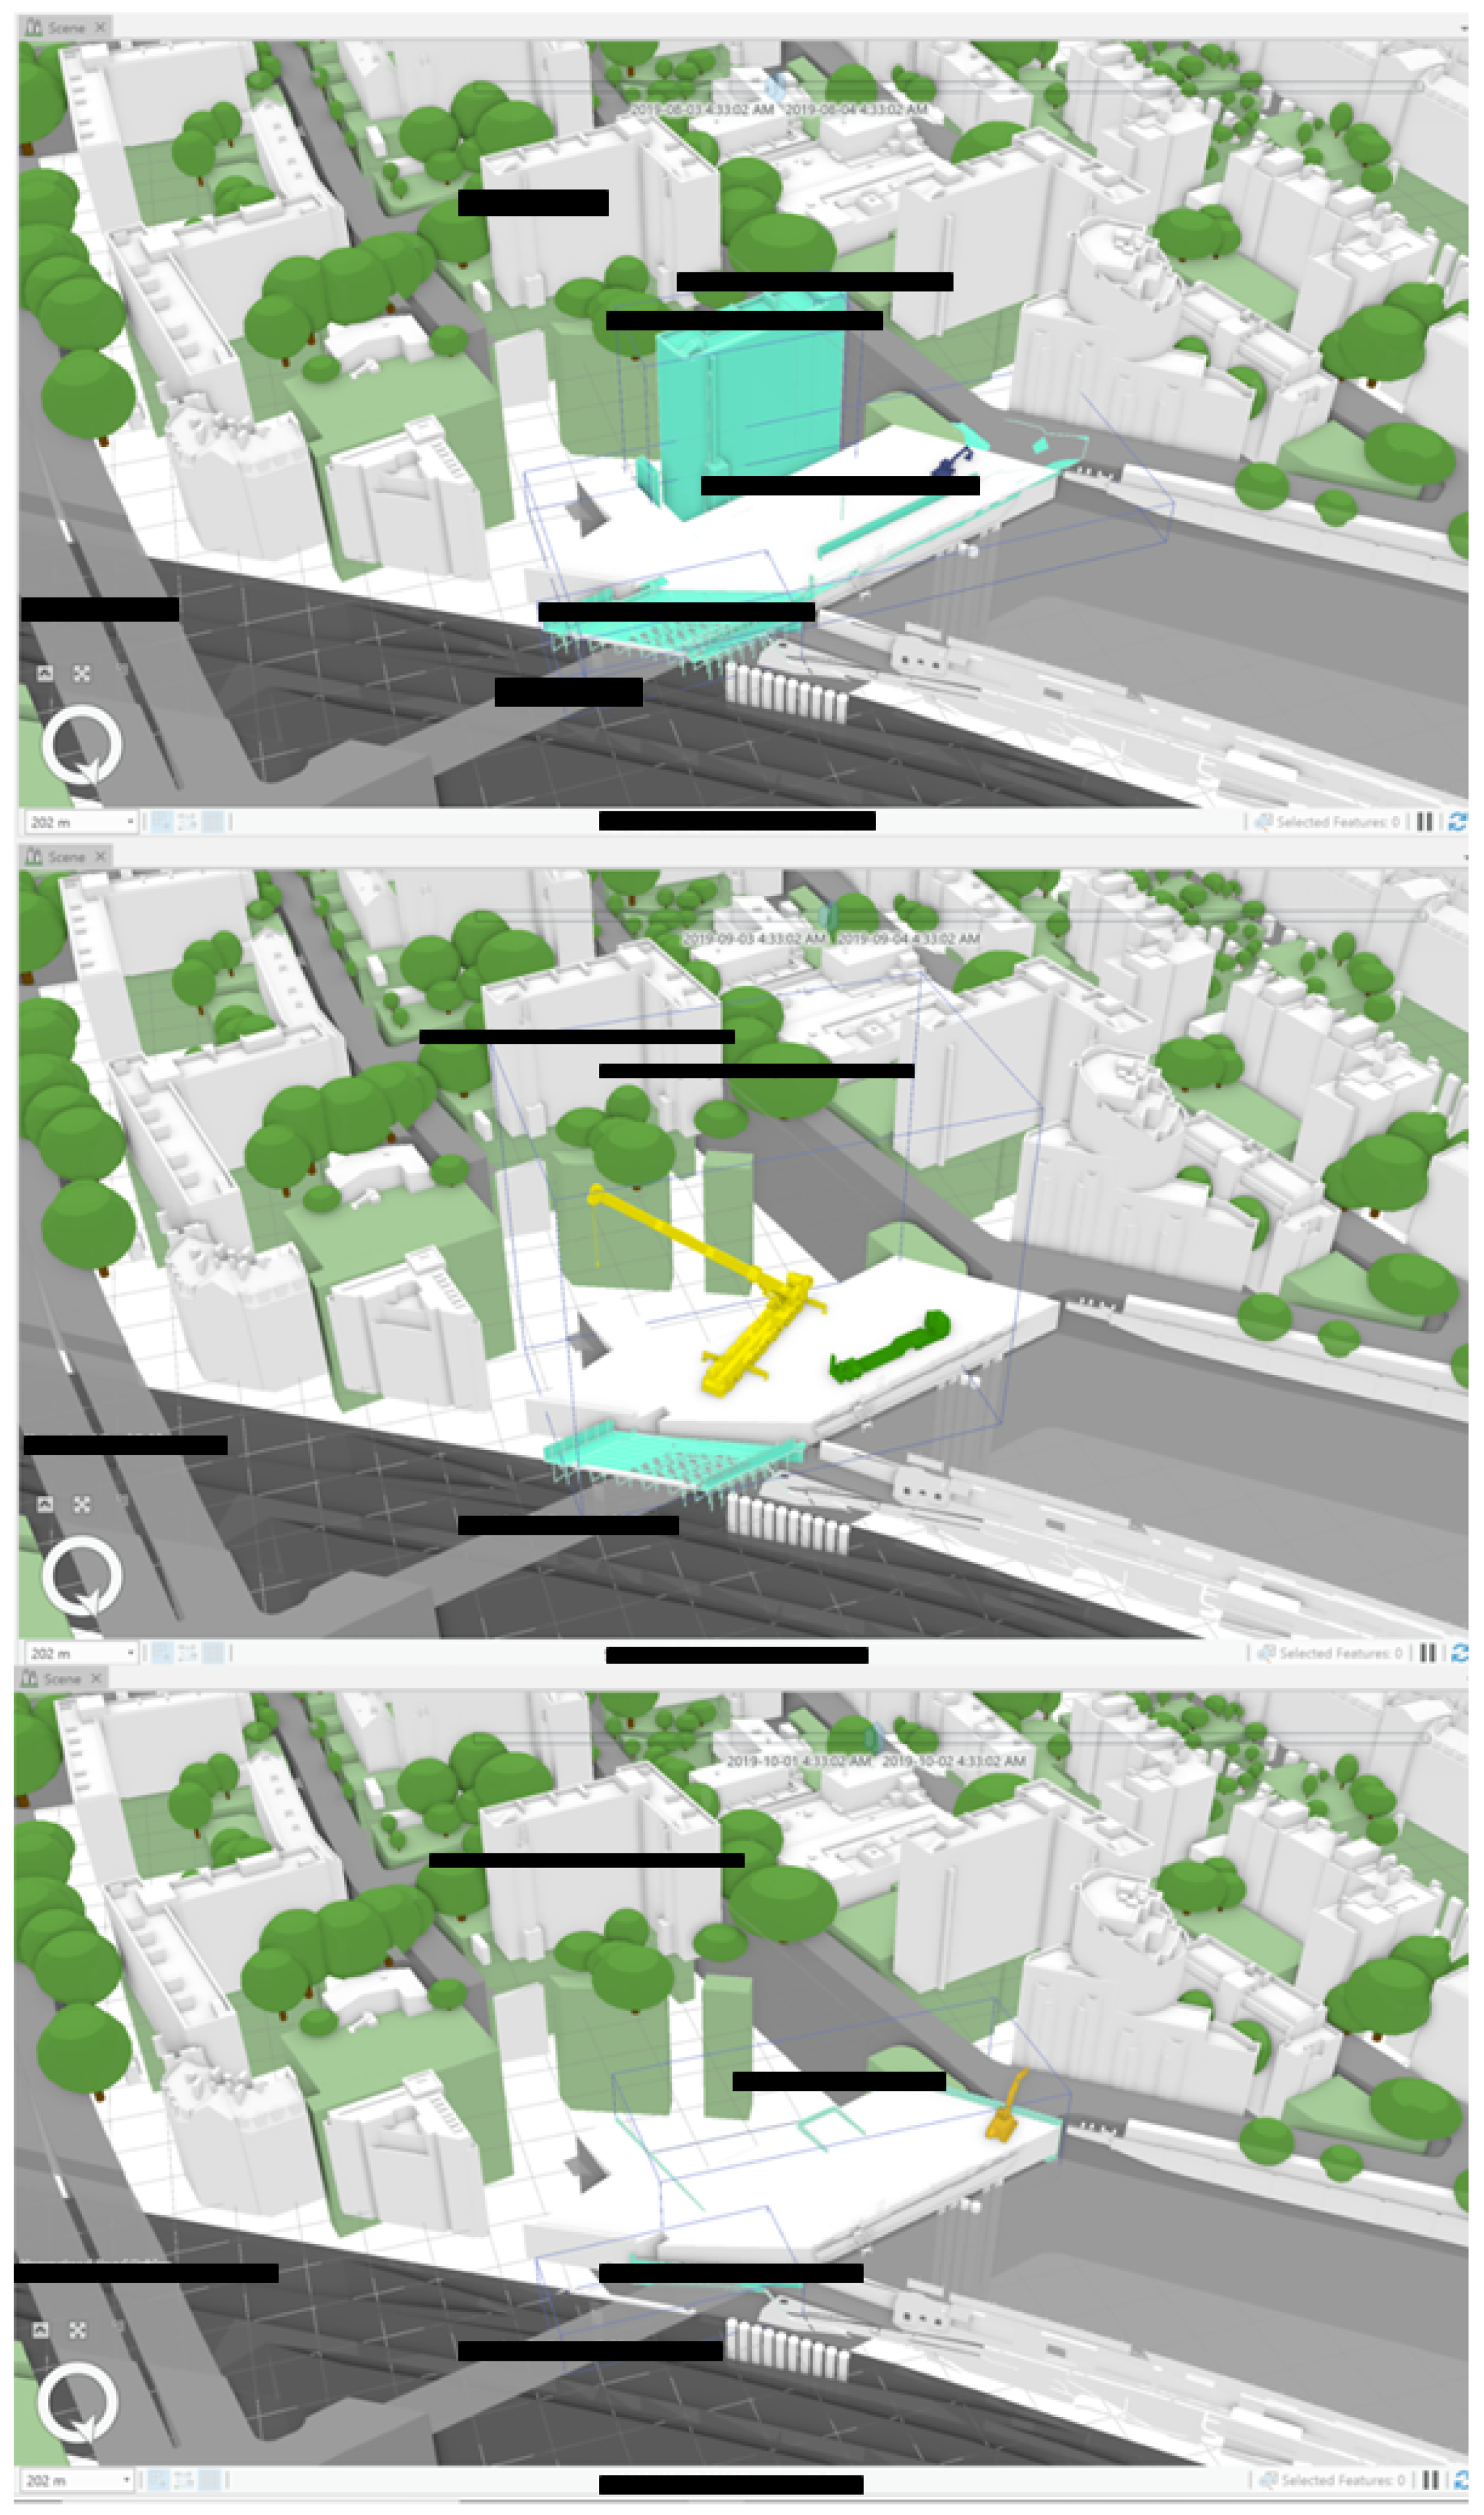
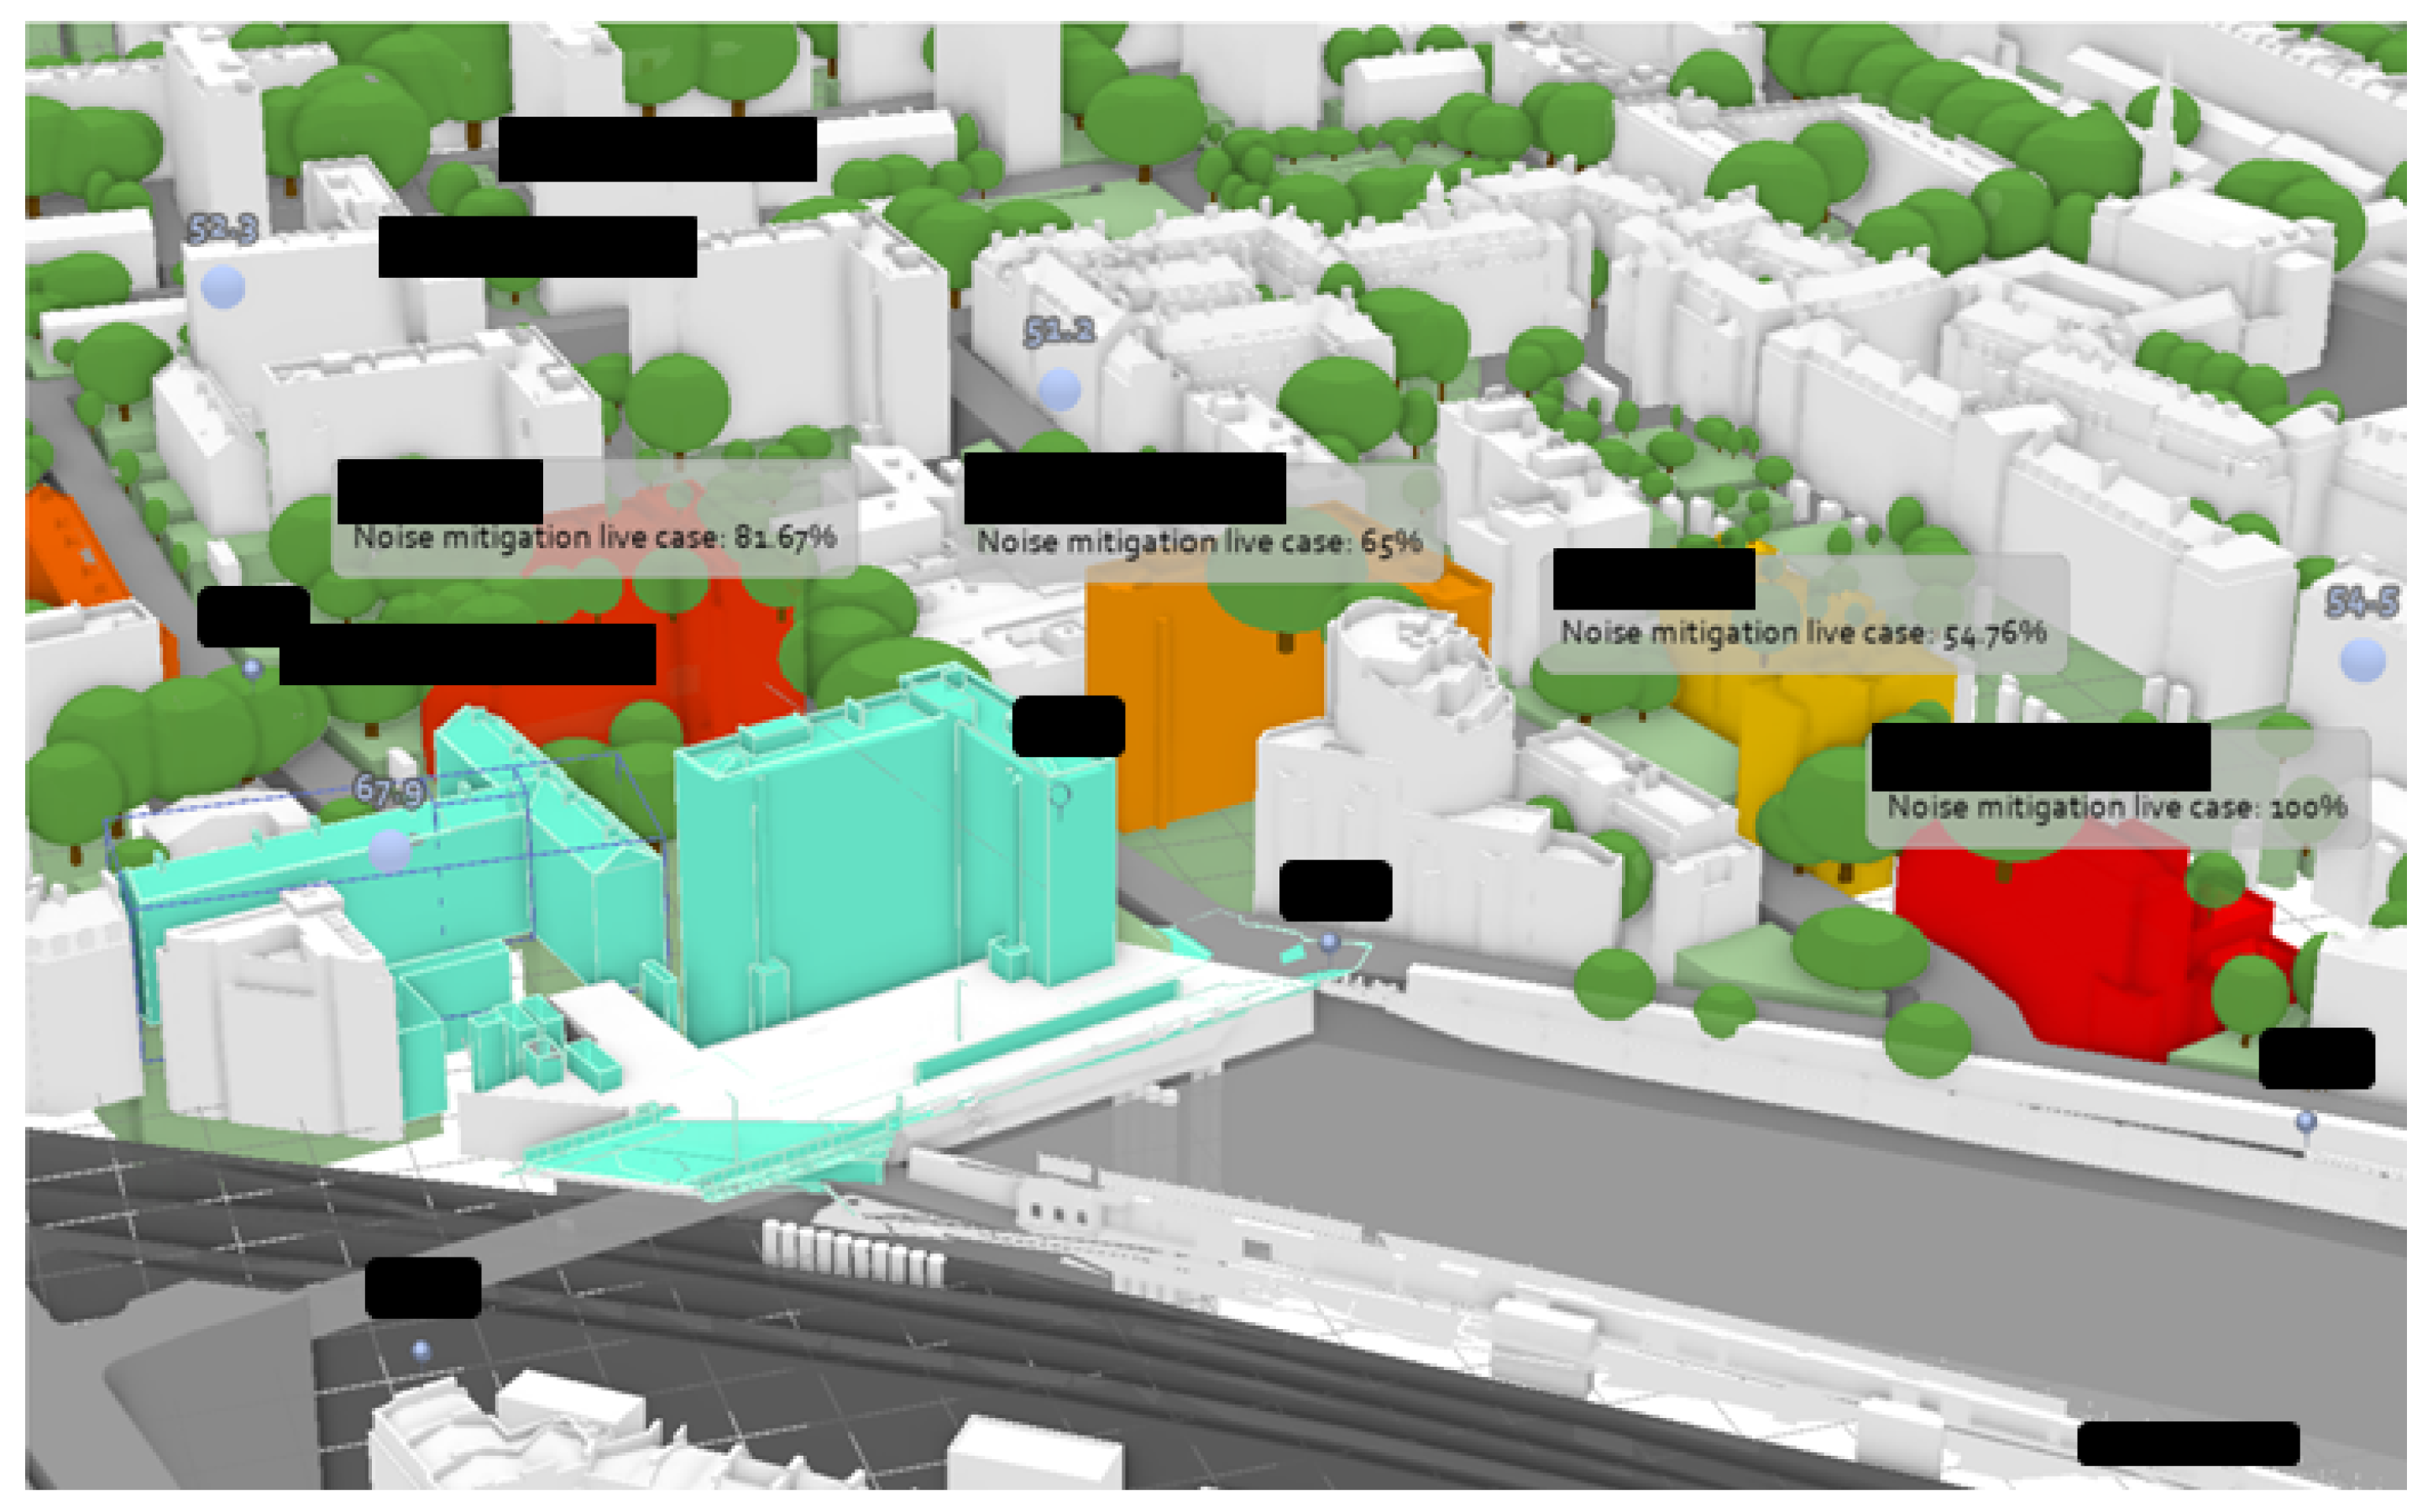
6.2.1. 4D Noise Mitigation and Monitoring

The Noise Insulation team currently uses Microsoft Excel to track the status of noise insulation work at different stages and lists each address identified to be potentially affected by construction noise. Information stored includes the outcome of a review for eligibility for mitigation actions, communications with the occupier and progress up to final installation status. This results in a spreadsheet with 65 columns that is manually maintained, and with location information stored as text without any possibility of spatial visualization. Advantage was taken of the ability of a database to restrict access to data, and open noise data (Figure 7) and project noise data were integrated, with access provided only to the Noise Insulation team and GIS specialists (for technical support) due to information sensitivity. Percentage completion of noise mitigation measures at different stages by the property was calculated and then labelled and symbolized by colouring the corresponding building by status. A graph of noise mitigation statistics was also generated for reporting purposes, which will automatically refresh when data is updated. As the noise monitor location dataset was maintained in the existing GIS system, average noise measurements from the monthly PDF report shown in Figure 7 [38] published on the HS2 website, migrated to the database and visualized across time in ArcGIS Pro and Cesium.

6.2.2. 4D Risk Mapping

The opportunity here is to plot risks linked to the locations to which they apply in 3D or 4D—e.g., to the basement, to a specific wall within the building. For example certain risks may only apply to a specific height above ground, or to a specific floor within the building. Potential exposure to hazardous materials, e.g., asbestos, can be marked up by creating a buffer around the location, leaving areas outside the buffer as space where work can continue. It is also possible to model the area on the ground that is at risk of falling objects due to demolition or working at height, in particular if this relates to an active railway track. Similarly, as working at height might require specific training or health and safety procedures, any work at height could be clearly indicated in the 3D visualisation.
One demolished building in the East Wing was picked as a demonstrator to simulate 4D risk modelling. Examples were selected from a Risk Register for constructability (spreadsheet) provided by CSJV, including:
  • location of asbestos in the basement
  • lift shaft
  • the fragile surface for roof work
This allowed the benefits of modeling risks that were associated with different heights and with different time attributes to be explored. The 3D model of the building was manually sliced into a basement, four floors and a roof using ArcGIS editing tools. Fictitious start and end task dates were then assigned to each part following the floor by floor demolishing sequence. Risk locations were manually captured in ArcGIS, represented as polygons and stored in a risklocation table in the database. Polygons were loaded into Cesium as GeoJSON, adding a date parameter to only show active risks relevant to the current date in the view.

6.2.3. Enabling Construction Safety

An example of a more general case was given by the need to identify potential clashes of a tower crane with surrounding buildings or tree branches. As a first (manual) approach implementing this, an event listener was added to the Cesium viewer, which is triggered when a user right-clicks on any location and will return the latitude, longitude and height of the location. The location is then passed on as a request to the server, together with the current date (in the viewer) and a user-defined buffer distance. This is used to query (via a buffer operation) matching objects from the database—i.e., those that intersect the buffer. Although the location picked by user and the objects visualized in Cesium were in WGS84, the related distances were calculated in British National Grid to obtain a consistent result throughout the GIS system. In the current implementation, the user can scroll through the time-line of the development—e.g., as the crane moves around the site, and when they notice a potential clash can select a point and create the required buffer distance—e.g., the crane must be 100 m from the railway as a minimum. The system will then detail the objects that intersect with that buffer.

6.2.4. Other Use Cases

A number of additional minor use cases were also identified during discussions with the CSJV team, as follows:
  • 3D Distance Measurement functionality in 3D would allow users to measure distances between any two given points and ideally return the result with a level of accuracy between 0.1 m to 0.5 m.
  • Volume calculation to estimate material to be disposed of for a demolished building and number of lorry loads needed.
  • Surface area calculation to estimate the cost of scaffolding or insulation needed of a building.
  • Accessibility—a 3D model of the road network and access road to the work site could be used to ensure that vehicles can make it to site both under normal circumstances and—on an ad hoc basis—if there is a blocked road due to an accident or other work on site. The integrated system could be used to visualize a rerouting option around a blocked access point, with the size of the vehicle providing information on the space needed for turns and number of lanes needed to be blocked as the vehicle arrives on site.

6.3. Democratising the Data—Visualisation

4D visualization in GIS was implemented by adding a time slider to display data according to the date and time that it is valid. Adjustments to the default play speed were available in both ArcGIS and Cesium to allow an automated run through of activity over time. However, manually controlling the speed at which time progresses by clicking on the time slider to select the time and date was deemed more intuitive and effective. The series of screenshots below presented the visualization of the project progress in ArcGIS Pro (Figure 8) and Cesium (Figure 9). 3D model components assigned to tasks were symbolized in cyan in ArcGIS and orange in Cesium. Associated task information was labelled to the minimum bounding volume (blue box) in ArcGIS and displayed in the Active Task panel in Cesium, to avoid duplicate labelling.

6.3.1. Visualisation—Noise Mitigation

Statistics for the noise mitigation cases were reported in two ways: by symbolizing and labelling buildings with the percentage complete values (Figure 10) or by generating bar chart summarizing the number of live or completed cases at each stage for each building.
Figure 11 shows noise monitor locations represented as pins on the ground and labelled with monitor IDs (e.g., N015), and noise measurements at different times of the day represented by blue spheres elevated from the ground level for visualization purposes and labelled with measurement value in decibel level. Two types of time enabled data were displayed in this implementation: the 3D model with task schedule, and the average noise measurement varying by time of the day, days of the week. As changes in noise measurement were provided at hourly intervals while changes in the task were provided on a daily or weekly schedule, playing the time slider animation at the same speed throughout the project was found not to be effective, with the manual time-slider option preferred.

6.3.2. Visualisation—Risk Location Monitoring

Risk locations were represented as red polygons and placed on top of the 3D objects of corresponding building elements, which were set to be semi-transparent for visualization, as shown in Figure 12.
Active risks were time enabled and risk information was printed to the console when an active risk was within a buffer area defined by right-clicking. As the building is being demolished, the remaining locations of any asbestos were updated and the risk information included in the information returned by the buffer, as shown in Figure 13.

7. Discussion

The main question addressed by this paper is “What are the challenges and benefits to integrating 4D information sourced from BIM and GIS to support the construction of a large infrastructure project?” The research focussed specifically on the opportunities and challenges within a real-world infrastructure project.
Working with CSJV, a number of use cases deriving benefit from this novel 4D GeoBIM integration were identified, with the combination of information from BIM and GIS and the addition of time (4D) to the data model proving of specific benefit for risk assessment, noise monitoring and construction safety. While these issues have been studied before, our research addresses these disparate challenges through enabling the interoperability of data created for a different purpose. In addition, we make use of data created in Synchro—a software package not yet widely explored in the literature as a source of BIM data—and have an end goal other than CityGML, which is not widely adopted in UK infrastructure projects.
Both the ArcGIS Pro and Cesium platforms were able to visualise the integrated data, with the latter offering the advantage of being web-based and relatively simple to operate even for a non-expert user. This permits a far wider group within CSJV to interact with and explore the 4D models, perhaps increasing the chance that problems, risks or health and safety issues can be spotted in advance, as experts from different disciplines may have a different perspective on the data. A bespoke website using Cesium proved to be relatively simple to develop, with time-slider functionality in-built.
Additionally, although the current implementation of the Enabling Construction Safety use case (Section 6.2.3) requires manual intervention, the use of Cesium means that this analysis could now be undertaken by a wide range of team members rather than just the Synchro expert. Having multiple sets of eyes on this problem is of benefit, and as the data is all stored in an integrated central database and opened up to much wider use around the project it may be possible to automate the clash detection task in the future (see for example [39]). This integrated approach could also take clash detection beyond that implemented within BIM, which focuses on objects within the BIM project but may not identify clashes with any surrounding existing features (stored in GIS).
More broadly, the research also highlights opportunities for project information—as specified in ISO 19650-1 and ISO-19650-2 [10] to be combined with the reference information mentioned in these specifications for tasks to be undertaken during construction itself rather than just focussing specifically on handover. This makes the case for continual information sharing through a project—as underpinned by BIM guidelines—stronger.

Limitations

As with many previous studies, the process of integrating the data is not yet automatable and currently relies heavily on manual intervention to overcome a number of data quality issues that—while not impacting results when the data is used in its original context—have a clear impact on the integration process and outcomes. This means that the effort required to migrate the data and hence the opportunity to deploy this integration repeatedly as the underlying BIM and GIS data changes could be significant. The issues encountered reflect those described by the authors in Section 3.1, where to date it has not been possible to fully automate the IFC to CityGML conversion process, and the identification of data quality issues described in Section 6.1 further demonstrates that significant additional work is required to achieve full automation. Indeed, automation of interoperability—both for semantics and geometry—is one of the major challenges currently impeding widespread uptake of GeoBIM. Our research highlighted the challenges of extracting data from Synchro using IFC, with loss of parent/child relationships between the different resources and the lack of ability to model the relationship between 3D geometry and a task purely in IFC. This reflects a more comprehensive review on IFC interoperability conducted by [14] which highlights additional IFC interoperability issues, as well as challenges described in [29], who note that “data is often only used for visualisation purposes, which does not require geometric and topological correctness” and [33], who state that “and no method can fully automatize the conversion process”.
A key challenge in addition to automation will be to ensure that the data is kept up to date—i.e., changes in Synchro are immediately reflected in the GIS. Javascript skills are also required for Cesium development and PostgreSQL/PostGIS skills (SQL) to set up and maintain the central database for the project. Currently, therefore, the effort involved in the semi-automated conversion described here will therefore need to be repeated on a regular basis. This effort will need to be weighed up against the benefits of having integrated, interoperable data. It is worth noting, however, that these could be significant for a project covering the spatial and temporal extents of a major infrastructure project such as HS2.
The examples shown here relate to a relatively small case study, and due to time limitations it was not possible to explore the use cases in great depth. Further work is required to develop them to the point that they can be implemented across the wider project context. Usability studies are also required to ensure that the web-based visualisations proposed here are in fact both useful and usable for the target audience. Additionally, an end-to-end data management process is required to address data quality issues as they arise in the source datasets (e.g., completeness, duplicate data). This will require not only technical solutions to automate the ETL processes but management support to ensure that data is updated as necessary along with further research into how best to communicate the ‘age’ or ‘quality’ of the data to decision-makers. The resulting data management/curation processes would have the additional benefit of providing quality assurance on the data which could in turn help facilitate the data handover task between construction and operation phases of the project, facilitating downstream asset and facilities management.
Software considerations are also important. These should include expanding benchmarking exercises such as the one described in [14] to include infrastructure primitives such as those in [28], working firstly on these primitives as an exploration of any issues or information loss during conversion when they are extracted individually from clean models, and building towards exploring issues with the data provided by practitioners. It is important to note that while many authors (e.g., [28] or [29]) develop bespoke software or make use of open software in their research, this may not be applicable the context of a major infrastructure projects, where the uptake of open software has been slow.
Additionally, the processes described in this paper refer to a one-way ETL data migration, moving from Syncrho (4D BIM) to GIS. While the reverse process already exists, with context base mapping being added to Synchro as part of the model creation process, it remains to be seen whether in future the siloed data approach with ETL conversion will be replaced by a more integrated data model that could suit both BIM and GIS operations and analysis or whether the federated information containers approach suggested in ISO-19650 [10] will prevail.
At a more conceptual level, a clearer understanding of the full lifecycle of data is required to enable early-stage identification of features that should be modelled individually and those that can be aggregated. Potential extensions to IFC include better support for relationships between geometry and tasks, and for parent/child relationships between different resources.
Finally, while 4D BIM and 4D GIS are maturing technologies, a wider challenge also exists in terms of achieving interoperability between the two in a commercial context. As highlighted in Table 3, from the BIM side, there is a lack of native integration with database management systems which would provide an easy route to interoperable data access not only during construction but also through to the operational phase of a project. From the GIS side the ability to manage complex, highly accurate, geometric information is currently lacking, and tools for 3D and 4D data analysis (aligned with the metric and topological fundamentals outlined in Section 3.1.2) are still under development. Extensive efforts are underway [40] to achieve data interoperability, with focus, in particular, on the semantic mapping between the two domains, but the outcomes of these standards-setting exercises have yet to make their way into an infrastructure setting, in part because BIM for the infrastructure itself is only now maturing (see Section 3.1).

8. Conclusions

The aim of this paper was to examine both the issues and benefits when integrating 4D BIM data with GIS within the context of a real-world infrastructure project, and the three use cases highlight the potential gains to be made in re-exploiting existing data in this way. While challenges exist in terms of technical integration, developing this understanding as to why data is required forms part of ISO-19650 [10] which suggests that organisations do not collect information that is not needed.
Having a clear case for the collection and ongoing use of, and curation of, information is fundamental and the more the same information can be reused the better the return on the cost of collection and update. Such targeted, clearly specified, reuse and re-purposing of data is fundamental if the cost savings suggested by the UK Government Construction Strategy—in particular the BIM Mandate—are to be achieved and repeated data collection is to be avoided. The concepts and understanding developed here form part of a larger picture examining uses of digital data relating to the built environment through its entire lifecycle—from concept through to construction, handover, asset management and demolition. This in turn raises challenges not only relating to how to update and curate such data over potentially the 50 or 100 years lifespan of an infrastructure asset, but how to increase trust in this data and ensure that the right data is delivered to decision-makers in the right format at the right time. This in turn helps move this field towards the goal of Level 3 BIM—a fully integrated, collaborative, real-time project model [11].

Author Contributions

Conceptualisation: Monika Swiderska, Claire Ellul, Alyssa Huaqiu Liu. Background review (literature): Alyssa Huaqiu Liu, Claire Ellul. Background review (project context): Monika Swiderska. Data Curation: Monika Swiderska. Methodology: Alyssa Huaqiu Liu, Monika Swiderska, Claire Ellul. Formal Analysis: Alyssa Huaqiu Liu. Validation: Monika Swiderska. Writing: Original Draft preparation: Claire Ellul, Alyssa Huaqiu Liu, Monika Swiderska. Writing: Review and Editing: Claire Ellul, Alyssa Huaqiu Liu, Monika Swiderska. Supervision: Claire Ellul, Monika Swiderska. All authors have read and agreed to the published version of the manuscript.

Funding

This research received no external funding.

Institutional Review Board Statement

This study falls under the “service evaluation” exemption as outlined by University College London https://ethics.grad.ucl.ac.uk/exemptions.php (accessed on 25 March 2021). In this context Service Evaluation is undertaken to benefit those who use a particular service and is designed and conducted solely to define or judge current service. [ ] participants will normally be those who use the service or deliver it. It involves an intervention where there is no change to the standard service being delivered (e.g., no randomisation of service users into different groups).

Informed Consent Statement

The study was initiated and driven by CSJV, with participating CSJV staff forming part of the team who initiated and helped scope the project. No personal information or opinions were collected, and questions asked during the various meetings were limited to “service evaluation” type questions-i.e., obtaining explanations of software, data and processes in place within the project, identifying limitations and discussing ideas as to where GeoBIM integration may help improve processes and services.

Data Availability Statement

Due to commercial confidentiality, the data from this project is not openly available.

Acknowledgments

The authors would like to thank the team at CSJV for their availability and input into the discussions underpinning this research, as well as for the provision of the data used.

Conflicts of Interest

The authors declare no conflict of interest.

References

  1. Infrastructure and Projects Authority. Government Construction Strategy 2016 to 2020. Available online: https://assets.publishing.service.gov.uk/government/uploads/system/uploads/attachment_data/file/510354/Government_Construction_Strategy_2016-20.pdf (accessed on 2 August 2020).
  2. Price Waterhouse Coopers. BIM Level 2 Benefits Measurement Application of PwC’s BIM Level 2 Benefits Measurement Methodology to Public Sector Capital Assets. Available online: https://www.cdbb.cam.ac.uk/files/pwc_bmm_application_report_180607_final.pdf (accessed on 2 August 2020).
  3. McPartland, R. BIM Levels Explained. Available online: https://www.thenbs.com/knowledge/bim-levels-explained (accessed on 2 August 2020).
  4. Cabinet Office. An Initial Analysis of the Potential Geospatial Economic Opportunity. Available online: https://assets.publishing.service.gov.uk/government/uploads/system/uploads/attachment_data/file/733864/Initial_Analysis_of_the_Potential_Geospatial_Economic_Opportunity.pdf (accessed on 17 May 2020).
  5. Murphy, M.; McGovern, E.; Pavia, S. Historic building information modelling (HBIM). Struct. Surv. 2009. [Google Scholar] [CrossRef] [Green Version]
  6. Boyes, G.; Ellul, C.; Irwin, D. Exploring BIM for operational integrated asset management—A preliminary study utilising real-world infrastructure data. ISPRS Ann. Photogramm. Remote Sens. Spatial Inform. Sci. 2017, 4, 49–56. [Google Scholar] [CrossRef] [Green Version]
  7. Noardo, F.; Arroyo Ohori, K.; Biljecki, F.; Ellul, C.; Harrie, L.; Krijnen, T.; Eriksson, H.; van Liempt, J.; Pla, M.; Ruiz, A.; et al. Reference study of CityGML software support: The GeoBIM benchmark 2019—Part II. Trans. GIS 2020. [Google Scholar] [CrossRef]
  8. High Speed 2. What Is HS2. 2020. Available online: https://www.hs2.org.uk/what-is-hs2/ (accessed on 20 October 2020).
  9. What Is Building Information Modelling. Available online: https://www.thenbs.com/knowledge/what-is-building-informationmodelling-bim (accessed on 2 August 2020).
  10. International Standards Organisation. ISO TC59 Buildings and Civil Engineering Works, SC 13, Organization and Digitization of Information about Buildings and Civil Engineering Works, Including Building Information Modelling (BIM). Available online: https://www.iso.org/committee/49180.html (accessed on 2 August 2020).
  11. Barnes, P. BIM in Principle and in Practice. Available online: https://0-www-icevirtuallibrary-com.brum.beds.ac.uk/doi/pdf/10.1680/bimpp.63693 (accessed on 2 August 2020).
  12. Worboys, M.F.; Duckham, M. GIS: A Computing Perspective; CRC Press: Boca Raton, FL, USA, 2004. [Google Scholar]
  13. Ellul, C.; Noardo, F.; Harrie, L.; Stoter, J. The EuroSDR GeoBIM Project –Developing Case Studies for the ues of GeoBIM in Practice. Int. Arch. Photogramm. Remote Sens. Spat. Inf. Sci. 2020, 44, 33–40. [Google Scholar] [CrossRef]
  14. Noardo, F.; Krijnen, T.; Arroyo Ohori, K.; Biljecki, F.; Ellul, C.; Harrie, L.; Eriksson, H.; Polia, L.; Salheb, N.; Tauscher, H.; et al. Reference study of IFC software support: The GeoBIM benchmark 2019—Part I. Trans. GIS 2020. [Google Scholar] [CrossRef]
  15. buildingSMART. Industry Foundation Classes—An Introduction. Available online: https://www.iso.org/committee/49180.html (accessed on 2 August 2020).
  16. Gröger, G.; Kolbe, T.H.; Nagel, C.; Häfele, K.H. OGC City Geography Markup Language (CityGML) Encoding Standard; Open Geospatial Consortium: Wayland, MA, USA, 2012. [Google Scholar]
  17. Lenzerini, M. Data integration: A theoretical perspective. In Proceedings of the Twenty-First ACM SIGMOD-SIGACT-SIGART Symposium on Principles of Database Systems, Madison, WI, USA, 3–5 June 2002; pp. 233–246. [Google Scholar]
  18. Sani, M.J.; Musliman, I.A.; Abdul Rahman, A. Extraction and transformation of ifc data to citygml format. Int. Arch. Photogramm. Remote Sens. Spatial Inform. Sci. 2019. [Google Scholar] [CrossRef] [Green Version]
  19. Bishr, Y. Overcoming the semantic and other barriers to GIS interoperability. Int. J. Geogr. Inf. Sci. 1998, 12, 299–314. [Google Scholar] [CrossRef]
  20. Tauscher, H. Creating and maintaining IFC–Citygml conversion rules. ISPRS Ann. Photogramm. Remote Sens. Spat. Inf. Sci. 2019, 4. [Google Scholar] [CrossRef] [Green Version]
  21. Stouffs, R.; Tauscher, H.; Biljecki, F. Achieving complete and near-lossless conversion from IFC to CityGML. ISPRS Int. J. Geo-Inf. 2018, 7, 355. [Google Scholar] [CrossRef] [Green Version]
  22. Donkers, S.; Ledoux, H.; Zhao, J.; Stoter, J. Automatic conversion of IFC datasets to geometrically and semantically correct CityGML LOD3 buildings. Trans. GIS 2016, 20, 547–569. [Google Scholar] [CrossRef] [Green Version]
  23. Kang, T.W.; Hong, C.H. IFC-CityGML LOD mapping automation using multiprocessing-based screen-buffer scanning including mapping rule. KSCE J. Civ. Eng. 2018, 22, 373–383. [Google Scholar] [CrossRef]
  24. Logothetis, S.; Valari, E.; Karachaliou, E.; Stylianidis, E. Spatial Dmbs Architecture for a free and open source BIM. Int. Arch. Photogramm. Remote Sens. Spat. Inf. Sci. 2017, 42. [Google Scholar] [CrossRef] [Green Version]
  25. Jusuf, S.K.; Mousseau, B.; Godfroid, G.; Hui, V.S.J. Integrated modeling of CityGML and IFC for city/neighborhood development for urban microclimates analysis. Energy Procedia 2017, 122, 145–150. [Google Scholar] [CrossRef]
  26. Kalantari, M. Future City Pilot 1: Using IFC/CityGML in Urban Planning Engineering Report; Ogc Engineering Report; Open Geospatial Consortium: Wayland, MA, USA, 2017. [Google Scholar]
  27. Colucci, E.; De Ruvo, V.; Lingua, A.; Matrone, F.; Rizzo, G. HBIM-GIS integration: From IFC to cityGML standard for damaged cultural heritage in a multiscale 3D GIS. Appl. Sci. 2020, 10, 1356. [Google Scholar] [CrossRef] [Green Version]
  28. Zhu, J.; Wang, X.; Wang, P.; Wu, Z.; Kim, M.J. Integration of BIM and GIS: Geometry from IFC to shapefile using open-source technology. Autom. Constr. 2019, 102, 105–119. [Google Scholar] [CrossRef]
  29. Arroyo Ohori, K.; Diakité, A.; Krijnen, T.; Ledoux, H.; Stoter, J. Processing BIM and GIS models in practice: Experiences and recommendations from a GeoBIM project in the Netherlands. ISPRS Int. J. Geo-Inf. 2018, 7, 311. [Google Scholar] [CrossRef] [Green Version]
  30. Diara, F.; Rinaudo, F. Building Archaeology Documentation and Analysis through Open Source Hbim Solutions via Nurbs Modelling. Int. Arch. Photogramm. Remote Sens. Spat. Inf. Sci. 2020, 43, 1381–1388. [Google Scholar] [CrossRef]
  31. Vilgertshofer, S.; Amann, J.; Willenborg, B.; Borrmann, A.; Kolbe, T.H. Linking BIM and GIS models in infrastructure by example of IFC and CityGML. In Computing in Civil Engineering 2017; ASCE Library: Reston, VA, USA, 2017; pp. 133–140. [Google Scholar]
  32. Zadeh, P.A.; Wei, L.; Dee, A.; Pottinger, R.; Staub-French, S. BIM-CITYGML data integration for modern urban challenges. ITcon 2019, 24, 318–340. [Google Scholar]
  33. Liu, X.; Wang, X.; Wright, G.; Cheng, J.C.; Li, X.; Liu, R. A state-of-the-art review on the integration of Building Information Modeling (BIM) and Geographic Information System (GIS). ISPRS Int. J. Geo-Inf. 2017, 6, 53. [Google Scholar] [CrossRef] [Green Version]
  34. Noardo, F.; Ohori, K.A.; Biljecki, F.; Ellul, C.; Harrie, L.; Krijnen, T.; Kokla, M.; Stoter, J. The ISPRS-EuroSDR GeoBIM benchmark 2019. Int. Arch. Photogramm. Remote Sens. Spat. Inf. Sci. 2020, 43, 227–233. [Google Scholar] [CrossRef]
  35. Costain Skanska. Notice of Preparatory Works around Euston. 2018. Available online: https://s3-eu-west-1.amazonaws.com/commonplace-customer-files/hs2ineuston/CSJV%20Notification%20of%20Works%20RPE%20final.pdf (accessed on 2 August 2020).
  36. Cozzi, P.; Ring, K. 3D Engine Design for Virtual Globes; AK Peters Limited: Natick, MA, USA, 2011. [Google Scholar]
  37. Iliffe, J.; Arthur, J.; Preston, C. The snake projection: A customised grid for rail projects. Surv. Rev. 2007, 39, 90–99. [Google Scholar] [CrossRef]
  38. HS2. Construction noise and vibration Monthly Report—May 2020—London Borough of Camden. Available online: https://assets.publishing.service.gov.uk/government/uploads/system/uploads/attachment_data/file/899113/Camden_Noise_Monthly_Report_May2020.pdf (accessed on 2 August 2020).
  39. Irizarry, J.; Karan, E.P. Optimizing location of tower cranes on construction sites through GIS and BIM integration. J. Inf. Technol. Constr. ITcon 2012, 17, 351–366. [Google Scholar]
  40. Jetlund, K.; Onstein, E.; Huang, L. IFC Schemas in ISO/TC 211 Compliant UML for Improved Interoperability between BIM and GIS. ISPRS Int. J. Geo-Inf. 2020, 9, 278. [Google Scholar] [CrossRef]
Figure 1. Synchro master file creation.
Ijgi 10 00203 g001
Figure 2. Synchro project geometry overview.
Ijgi 10 00203 g002
Figure 3. Synchro project detail.
Ijgi 10 00203 g003
Figure 4. Data conversion workflow.
Ijgi 10 00203 g004
Figure 5. Data structure diagram.
Ijgi 10 00203 g005
Figure 6. Incomplete geometry.
Ijgi 10 00203 g006
Figure 7. Noise data for Camden, June 2020, extracted from publicly available data [38].
Ijgi 10 00203 g007
Figure 8. Visualisation—project change over time—ArcGIS Pro (with identifying text obscured).
Ijgi 10 00203 g008
Figure 9. Visualisation—project change over time—Cesium (with identifying text obscured).
Ijgi 10 00203 g009
Figure 10. Noise—buildings labelled by % completion.
Ijgi 10 00203 g010
Figure 11. Noise monitor locations.
Ijgi 10 00203 g011
Figure 12. Risk modelling.
Ijgi 10 00203 g012
Figure 13. Exploring risk information.
Ijgi 10 00203 g013
Table 1. Building Information Modelling (BIM) maturity levels—partially adapted and enhanced from [3].
LevelDescription
0No collaboration. 2D CAD is used for drafting and output and distribution is via paper or electronic prints, or a mixture of both. This leads to information silos, which BIM has been designed to address.
1A mixture of 3D CAD for concept work, and 2D for drafting of statutory approval documentation and Production Information. Electronic sharing of data is carried out from a common data environment (CDE), often managed by the contractor. This level provides the first improvement on traditional work practices by enabling data sharing.
2Focuses on collaborative working, and any CAD system used must be capable of exporting to one of the common file formats such as IFC (Industry Foundation Class) or COBie (Construction Operations Building Information Exchange). As with Level 1, the Common Data Environment is key.
3Sets out to further build on the collaborative working established in Level 2. This level could, for example, address both standards and contractual issues that could be barriers to collaboration.
Table 2. Similarities between geographical information systems (GIS) and BIM, adapted from [13].
PropertyBIMGIS
Information system combining attributes and geometryYesYes
Model the built environment in 3DYesYes
Model indoor and outdoor featuresYesYes
Data can be managed in a database management systemYesYes
Spatial and non-spatial data editing and management tools providedYesYes
2D and 3D visualizationYesYes
Represent the word as is, but also model historic and future representationsYesYes
Model at varying scales and detailYesYes
Table 3. GIS and BIM differences, adapted from [13].
PropertyGISBIM
Geometric complexitySingle building contains a few elements onlySingle building contains 1000 s of elements
Features and attributesAny spatial feature, any attributesFocus on features of interest to construction
Data managementFocus on data flows within Spatial Data Infrastructure (data quality, validation, responsibilities), databases, data sharingData management for project sites/Focus on data functionalities in native software, files-based storage
Key playersGovernment dominatedIndustry dominated
Open dataOpen data/sharing data is seen as public goodSharing data complex; benefits for sharing are not always clear 1
Geometric representationGeometry is measured (B-Rep)Geometry is designed (parametrized)
GeoreferencingNational, internationalLocal
1 Recent research by [14] highlights the challenges of IFC interoperability within BIM software packages. Issues relating to intellectual property and security concerns are also barriers to the open sharing of BIM data. This contrasts with GIS where in many countries open data is mandatory.
Table 4. Summary of the exported data.
DataResource Data ExportBase Data Export
3D Entities76104319
Resources46964313
Tasks4300-
Links5795-
Assignments26-
User Field Views5731-
Publisher’s Note: MDPI stays neutral with regard to jurisdictional claims in published maps and institutional affiliations.

