
Spatial Pattern of Highway Transport Dominance in Qinghai–Tibet Plateau at the County Scale

 ,
,  , , and
Abstract
:1. Introduction
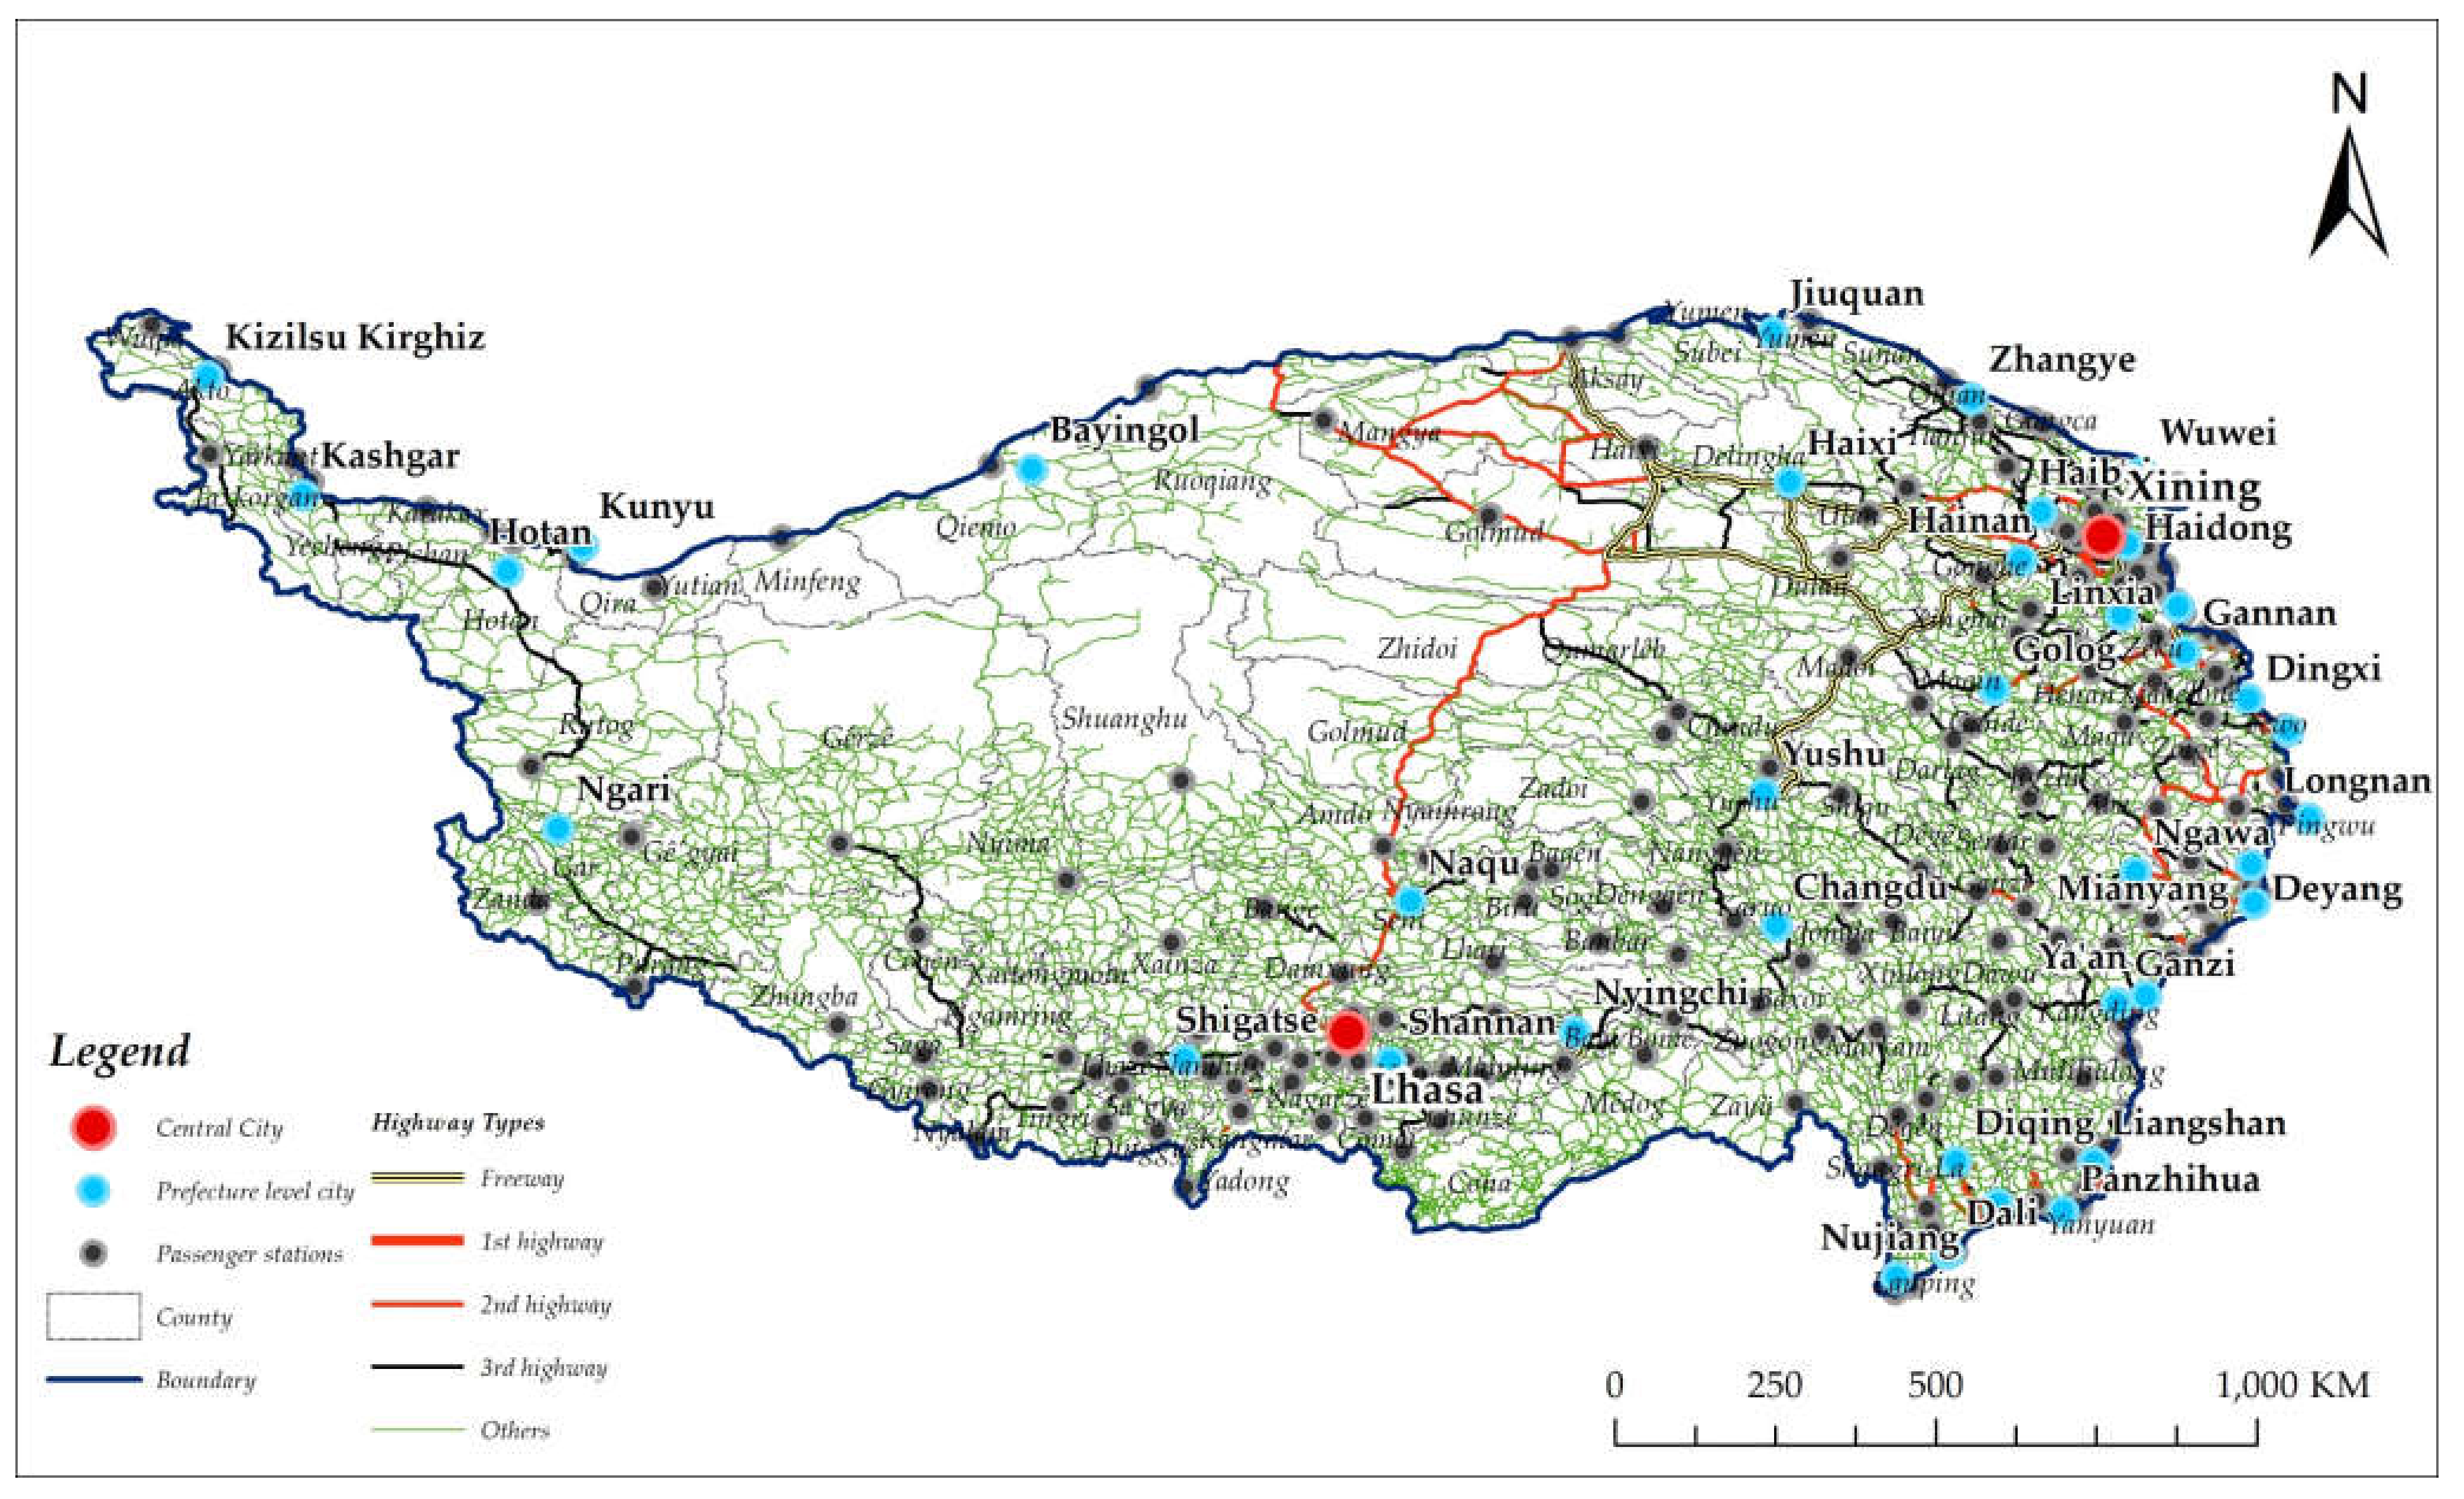
2. Study Area
3. Methods
3.1. Transport Dominance
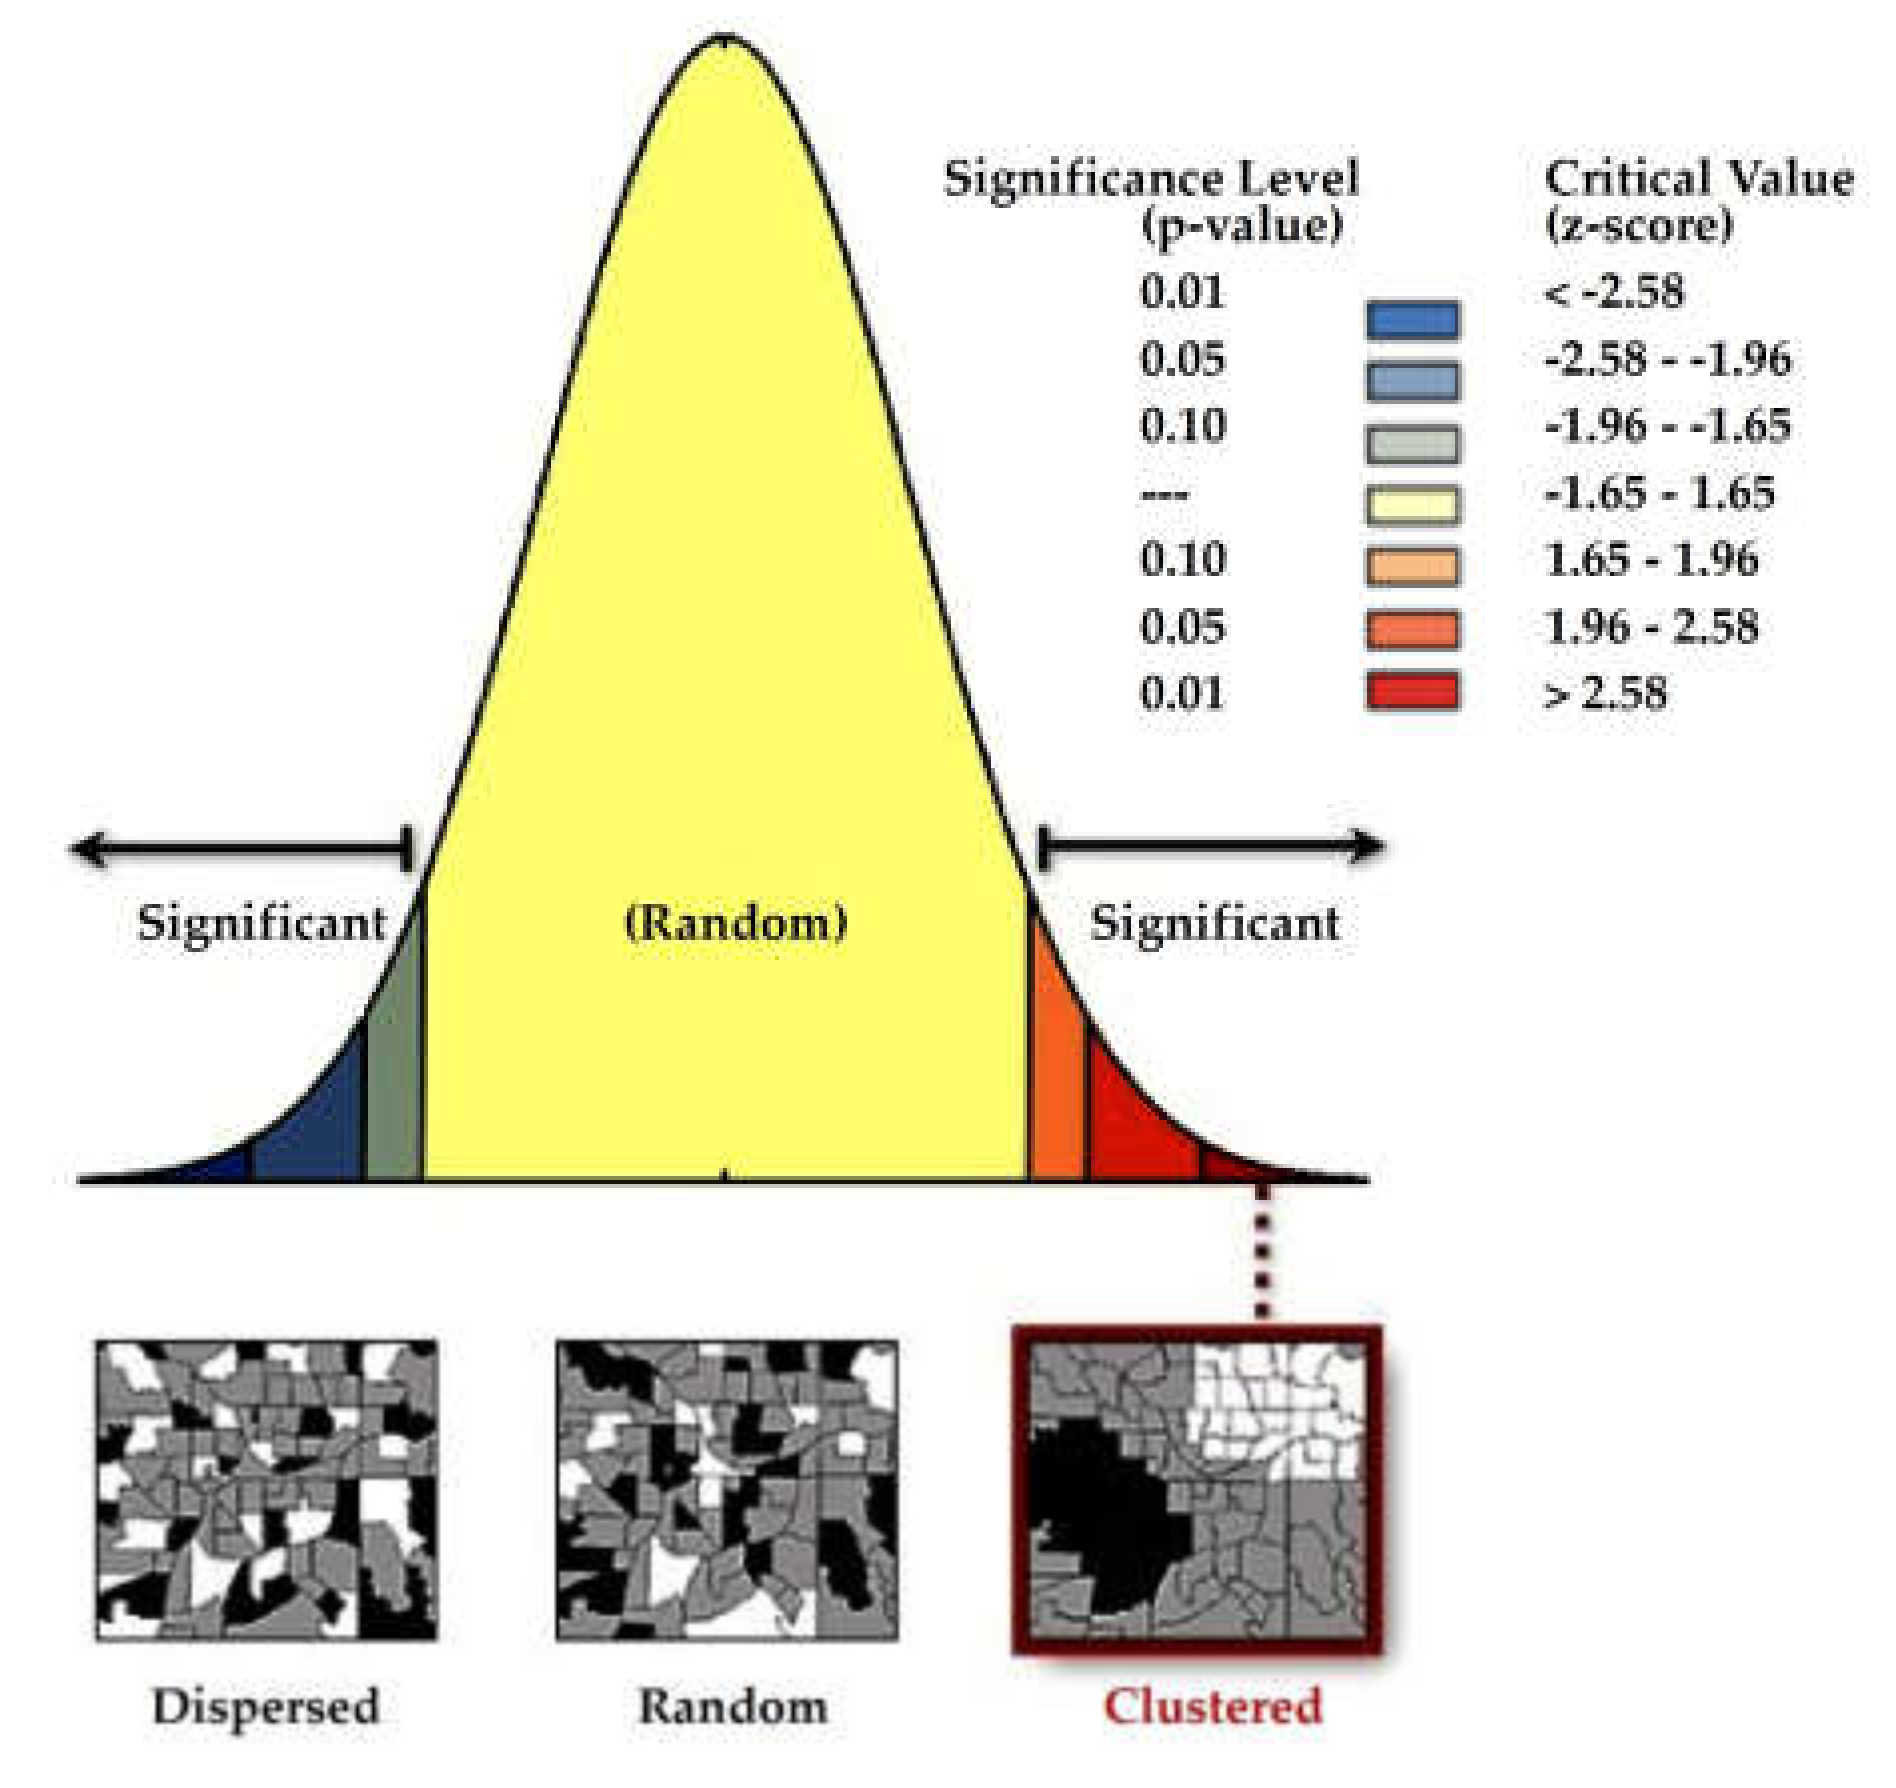
3.2. Spatial Autocorrelation
4. Results
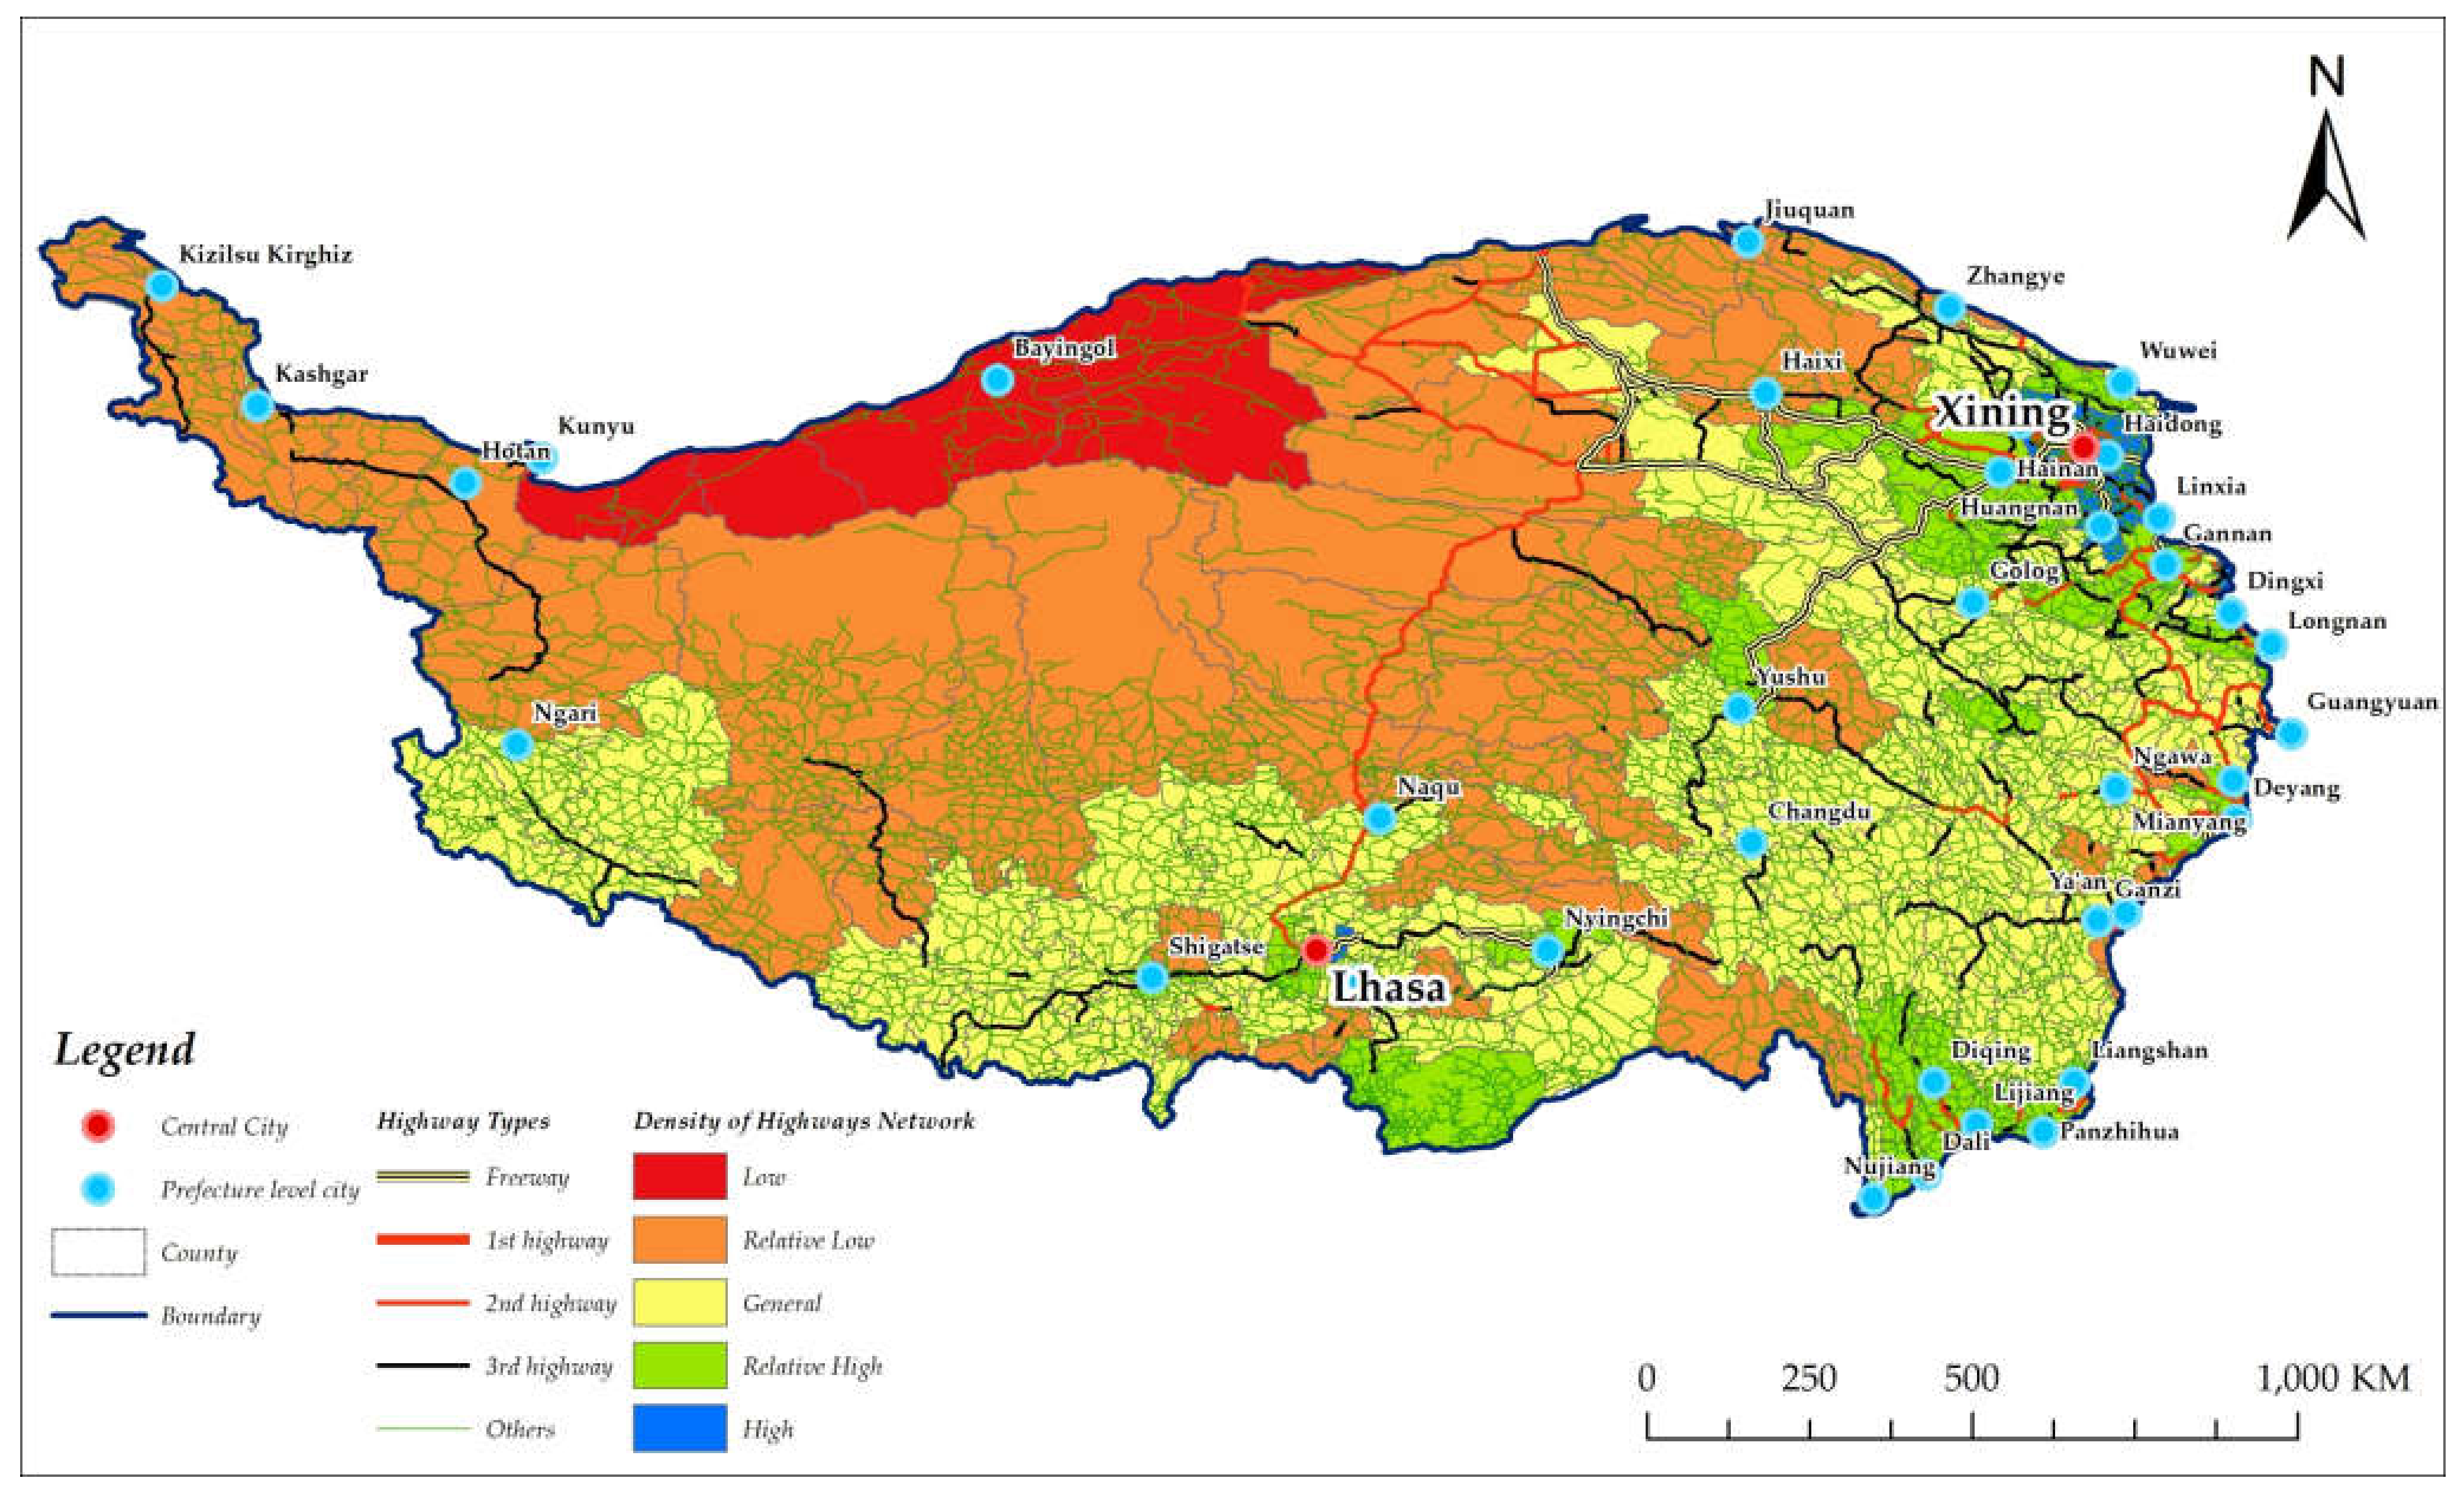
4.1. Density of Highways Network
4.2. Influence of Trunk Lines
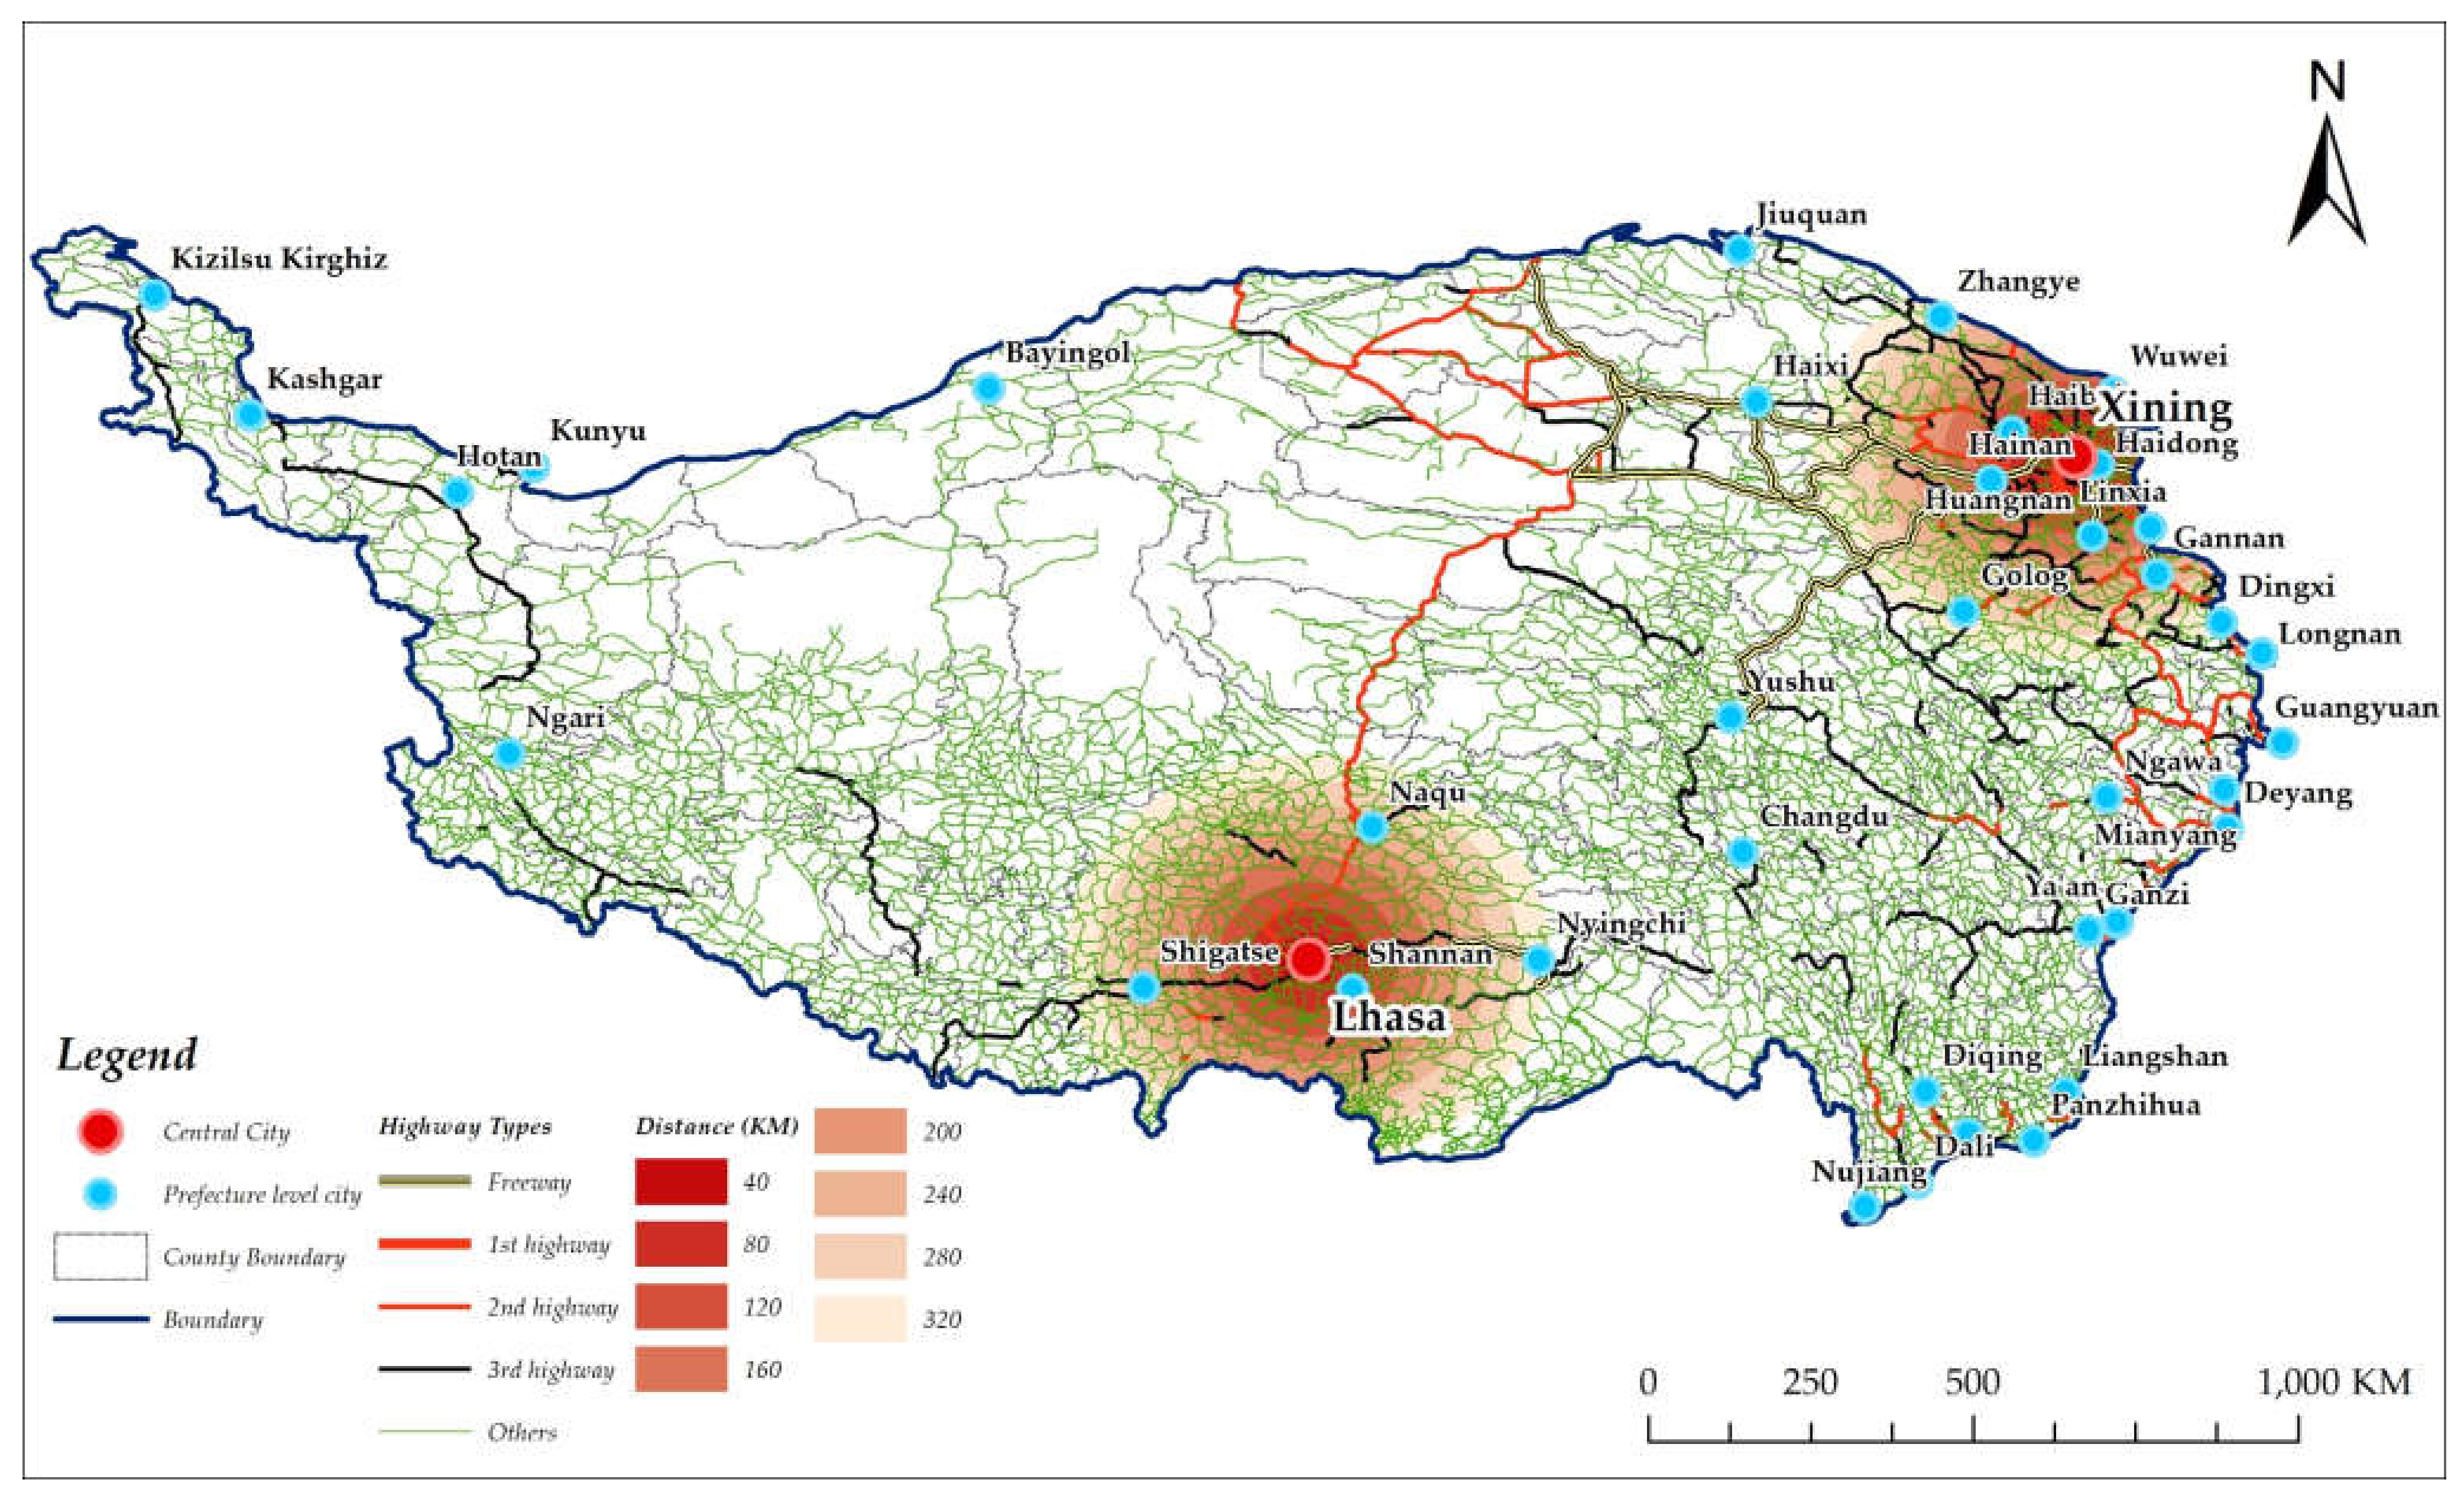
4.3. Spatial Accessibility of Highways
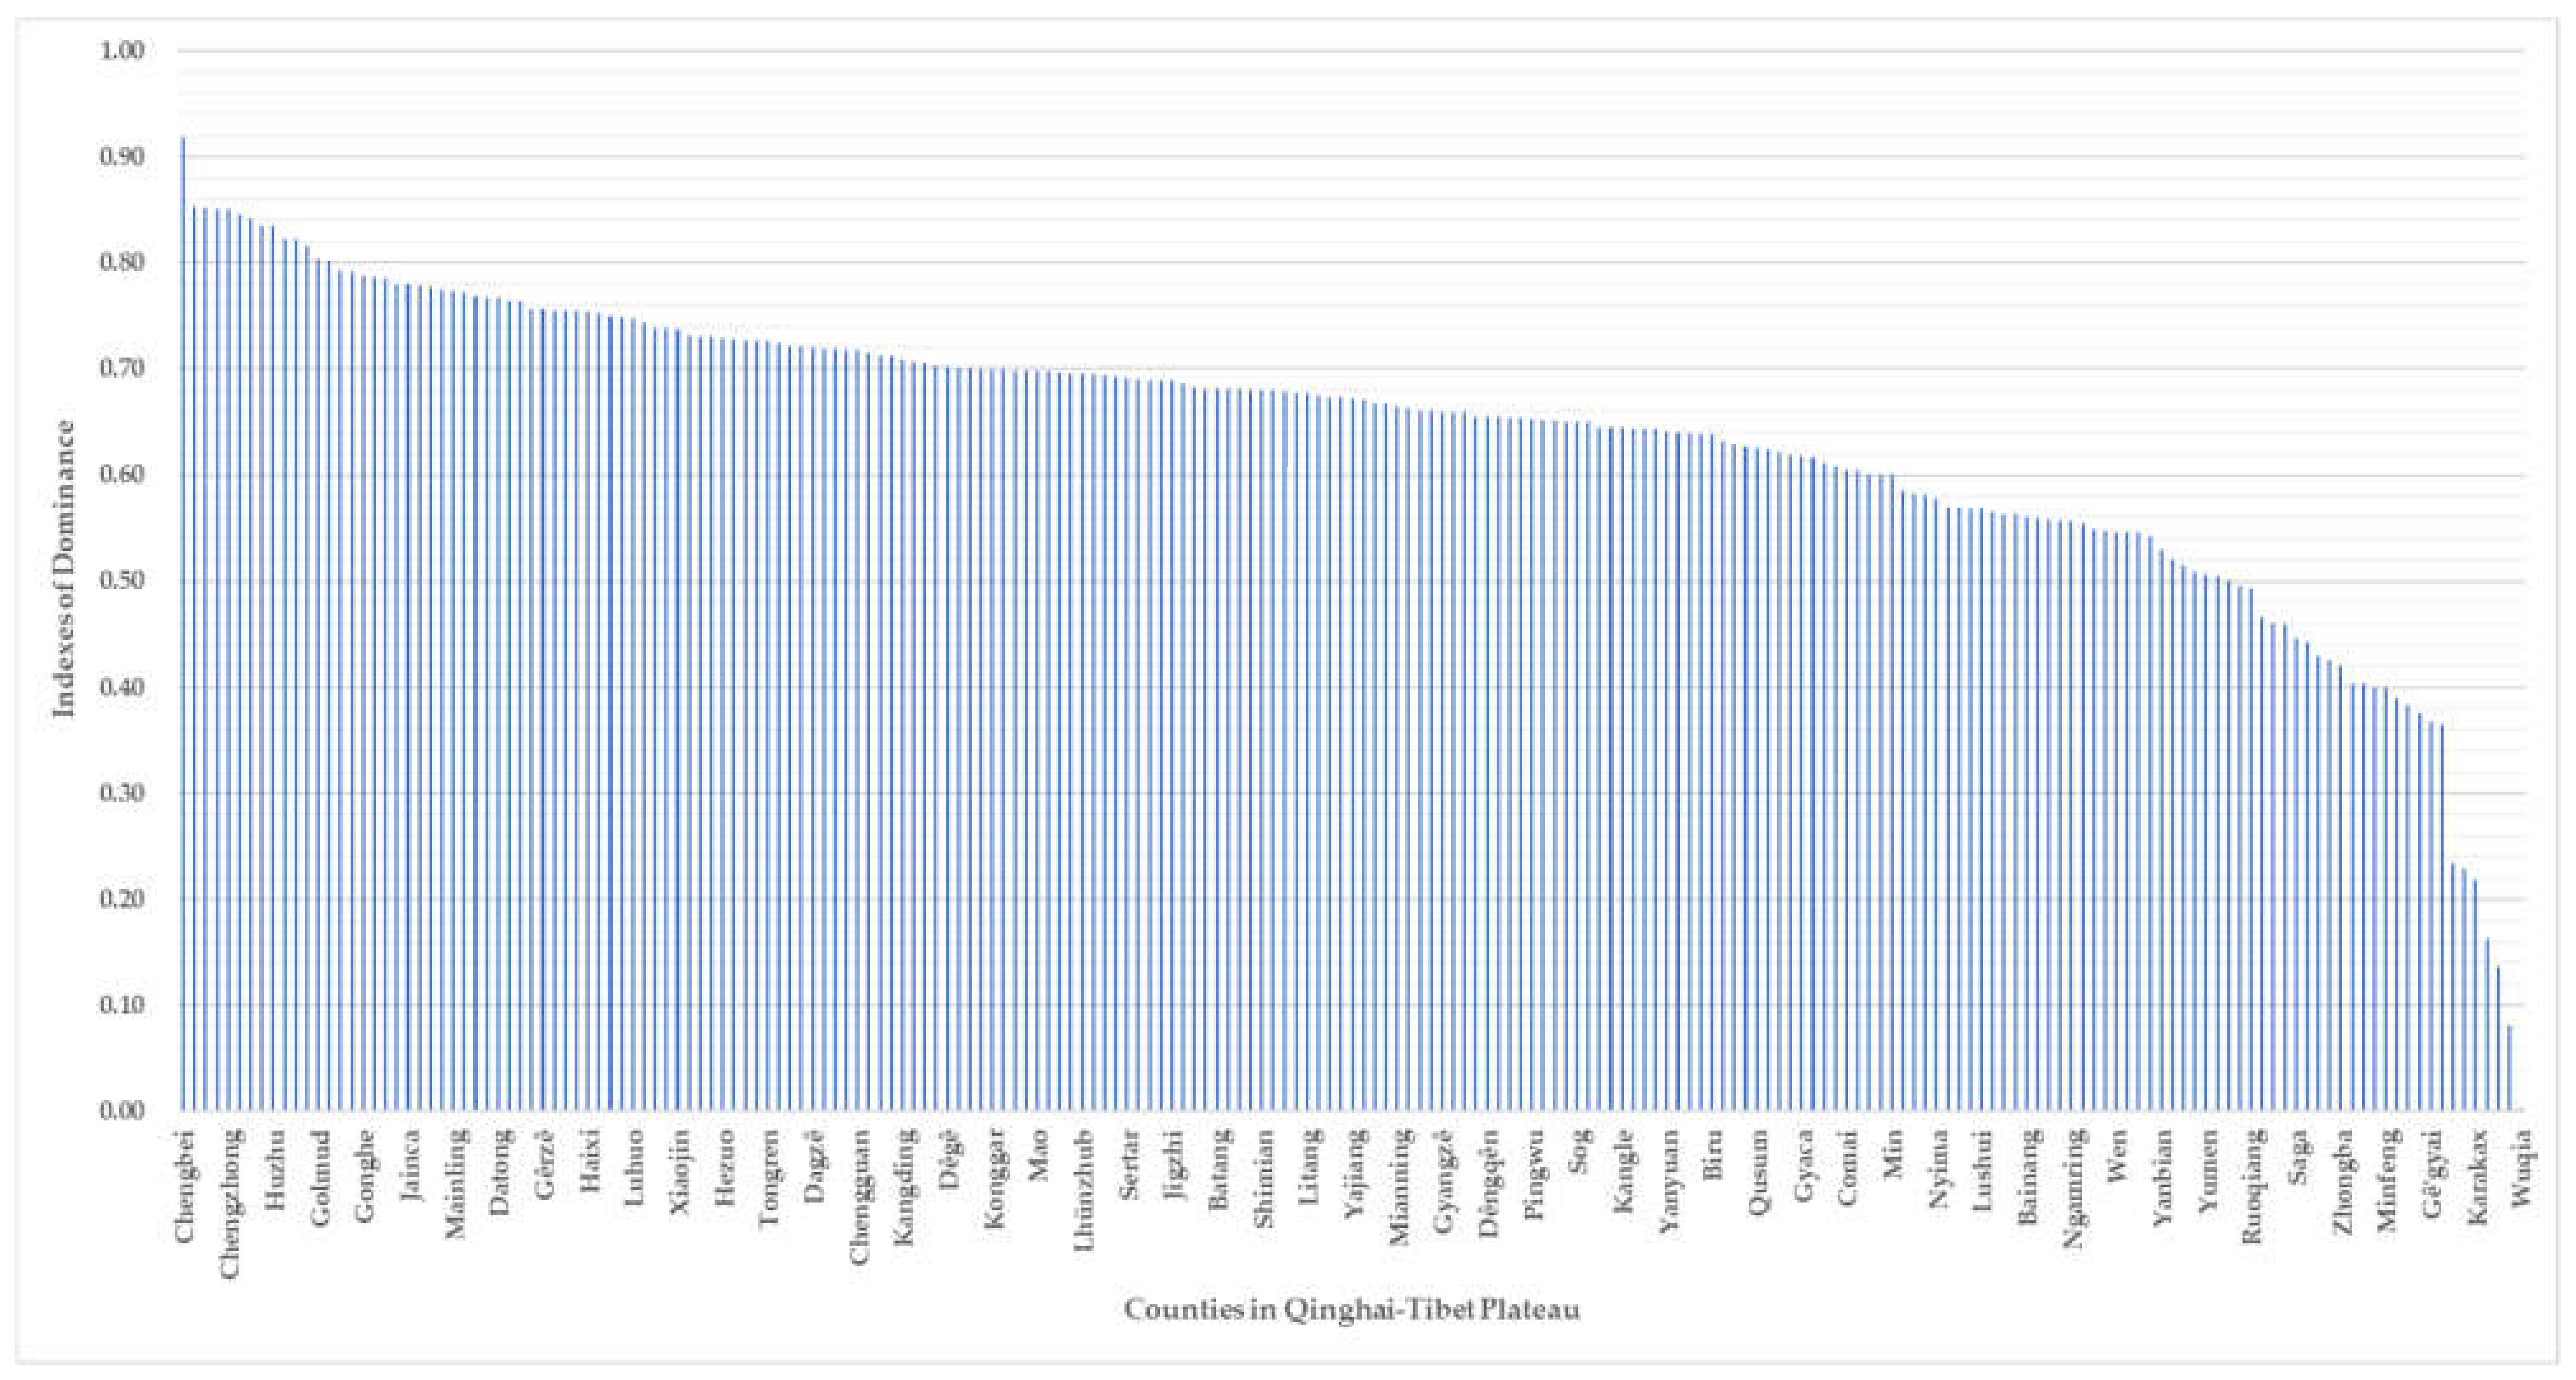
4.4. Highway Transport Dominance
5. Discussion
5.1. The Influence of Urban Location on Transport Dominance
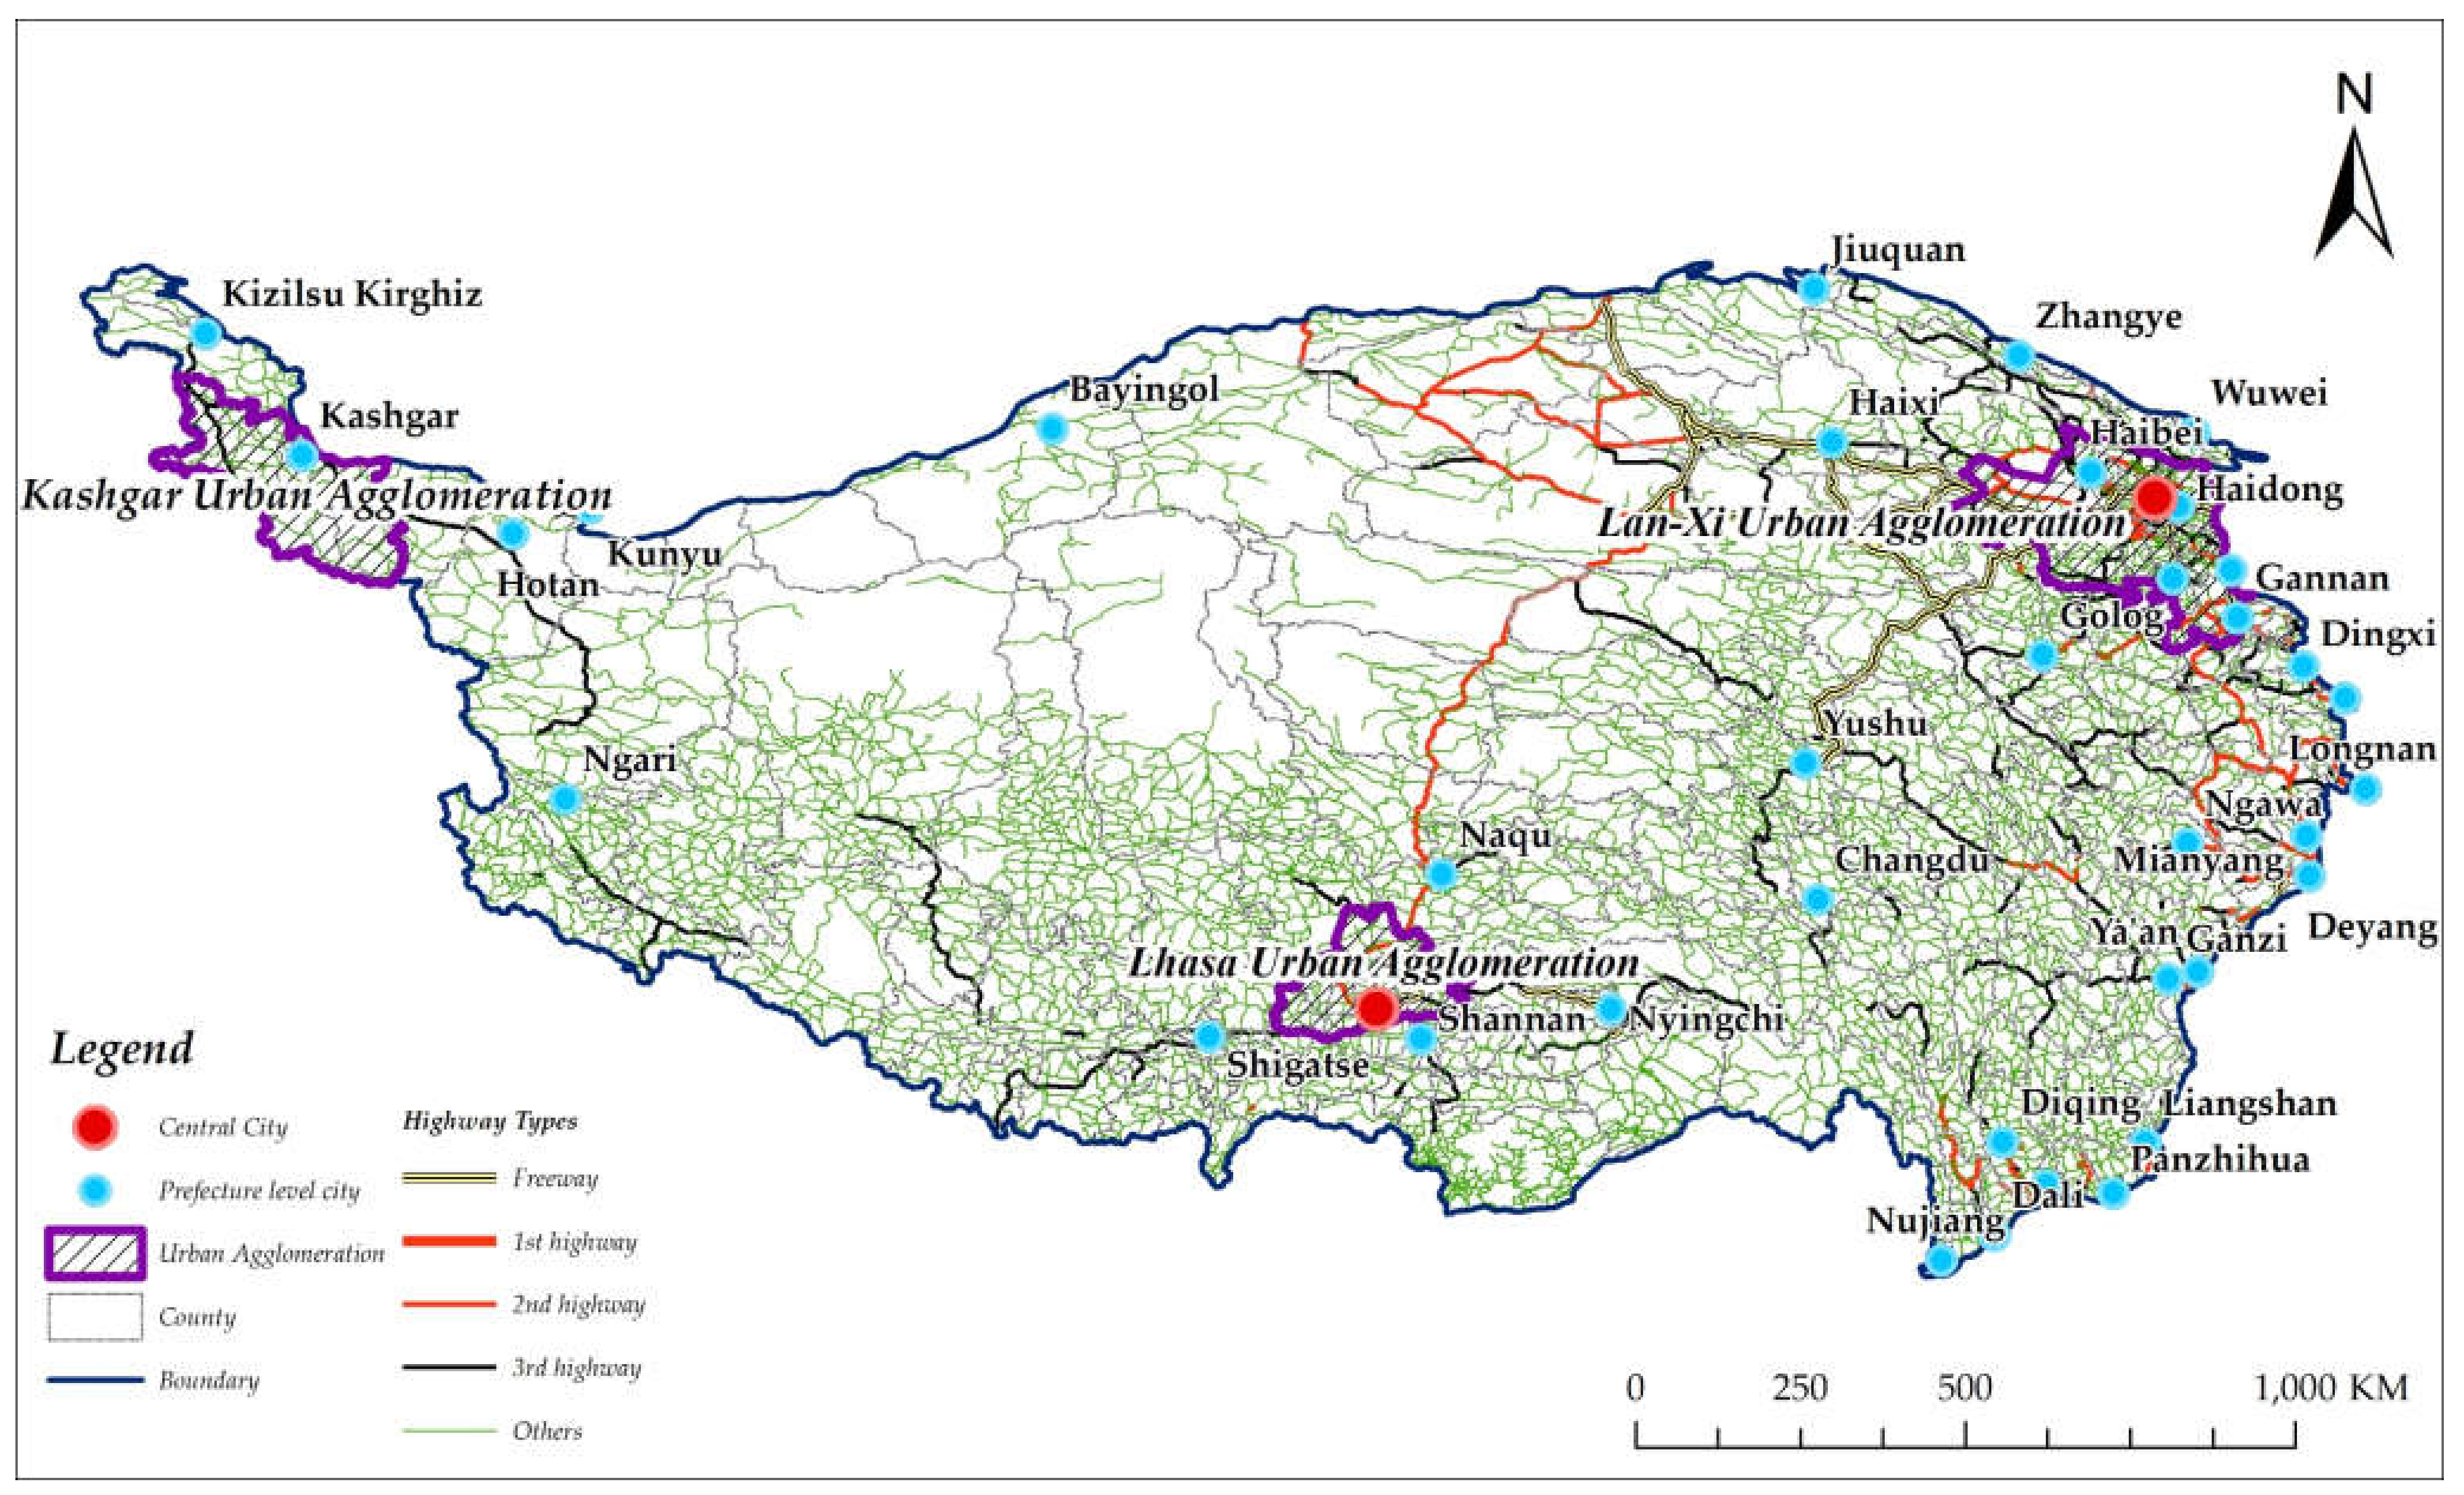
5.2. Highway Network Distribution in Urban Agglomerations
6. Conclusions
Author Contributions
Funding
Data Availability Statement
Acknowledgments
Conflicts of Interest
References
- Gao, Q.; Miao, Y.; Song, J. Research progress on the sustainable development of Qinghai–Tibet Plateau. Geogr. Res. 2021, 40, 1–17. [Google Scholar]
- Wang, W.; Yang, W.; Cao, X. Road transport superiority degree and impact on economic growth in the concentrated contiguous severe poverty areas in China. Prog. Geogr. 2015, 34, 665–675. [Google Scholar]
- Liu, D.; Jin, F. Development level and coordination of highway networks of prefecture-level administrative regions in China. Prog. Geogr. 2014, 33, 241–248. [Google Scholar]
- Mahdinia, I.; Habibian, M.; Habibian, M.; Gudmundsson, H. An indicator-based algorithm to measure transportation sustainability: A case study of the U.S. states. Ecol. Indic. 2018, 89, 738–754. [Google Scholar] [CrossRef]
- Allen, J.; Farber, S. Planning transport for social inclusion: An accessibility-activity participation approach. Transp. Res. Part D 2020, 78, 102212. [Google Scholar] [CrossRef]
- Qi, W.; Liu, S.; Zhou, L. Regional differentiation of population in Tibetan Plateau: Insight from the “Hu Line”. Acta Geogr. Sin. 2020, 75, 255–267. [Google Scholar]
- Jiang, W.; Lü, Y.; Liu, Y.; Gao, W. Ecosystem service value of the Qinghai–Tibet Plateau significantly increased during 25 years. Ecosyst. Serv. 2020, 44, 101146. [Google Scholar] [CrossRef]
- Pritchard, J.P.; Moura, F.; de Abreu e Silva, J.; Martinez, L.M. Spatial analysis of transportation-related social exclusion in the Lisbon metropolitan area. Procedia Soc. Behav. Sci. 2014, 440–449. [Google Scholar] [CrossRef] [Green Version]
- Hansen, W.G. How Accessibility Shapes Land Use. J. Am. Inst. Plan. 1959, 25, 73–76. [Google Scholar] [CrossRef]
- Wachs, M.; Kumagai, T.G. Physical accessibility as a social indicator. Socio Econ. Plan. Sci. 1973, 7, 437–456. [Google Scholar] [CrossRef]
- Maćkiewicz, A.; Ratajczak, W. Towards a new definition of topological accessibility. Transp. Res. Part B Methodol. 1996, 30, 47–79. [Google Scholar] [CrossRef]
- Guzman, L.A.; Oviedo, D. Accessibility, affordability and equity: Assessing ‘pro-poor’ public transport subsidies in Bogotá. Transp. Policy 2018, 68, 37–51. [Google Scholar] [CrossRef]
- Cohen, T. Tools for addressing transport inequality: A novel variant of accessibility measurement. J. Transp. Geogr. 2020, 88, 102863. [Google Scholar] [CrossRef]
- Holl, A. Twenty years of accessibility improvements. The case of the Spanish motorway building programme. J. Transp. Geogr. 2007, 15, 286–297. [Google Scholar] [CrossRef]
- Li, M.; Guo, R.; Li, Y.; He, B.; Fan, Y. The Distribution Pattern of the Railway Network in China at the County Level. Intern. J. Geo Inf. 2019, 8, 336. [Google Scholar] [CrossRef] [Green Version]
- Murayama, Y. The impact of railways on accessibility in the Japanese urban system. J. Transp. Geogr. 1994, 2, 87–100. [Google Scholar] [CrossRef]
- Zhu, X.; Liu, S. Analysis of the impact of the MRT system on accessibility in Singapore using an integrated GIS tool. J. Transp. Geogr. 2004, 12, 89–101. [Google Scholar] [CrossRef]
- Dixit, M.; Sivakumar, A. Capturing the impact of individual characteristics on transport accessibility and equity analysis. Transp. Res. Part D 2020, 87, 102473. [Google Scholar] [CrossRef]
- Cao, X.; Xue, D.; Yan, X. A study on the urban accessibility of national trunk highway system in China. Acta Geogr. Sin. 2005, 60, 903–910. [Google Scholar]
- Adhvaryu, B.; Chopde, A.; Dashora, L. Mapping public transport accessibility levels (PTAL) in India and its applications: A case study of Surat. Case Stud. Transp. Policy 2019, 7, 293–300. [Google Scholar] [CrossRef]
- Kwan, M.-P.; Murray, A.T.; O’Kelly, M.E.; Tiefelsdorf, M. Recent advances in accessibility research: Representation, methodology and applications. J. Geogr. Syst. Vol. 2003, 129–138. [Google Scholar] [CrossRef]
- Páeza, A.; Scott, D.M.; Morency, C. Measuring accessibility: Positive and normative implementations of various accessibility indicators. J. Transp. Geogr. 2012, 25, 141–153. [Google Scholar] [CrossRef]
- Zheng, X.; Guan, X.; Wu, H.; Xiao, H. A Data-Driven Quasi-Dynamic Traffic Assignment Model Integrating Multi-Source Traffic Sensor Data on the Expressway Network. Intern. J. Geo Inf. 2021, 10, 113. [Google Scholar] [CrossRef]
- Croce, A.I.; Musolino, G.; Rindone, C.; Vitetta, A. Transport System Models and Big Data: Zoning and Graph Building with Traditional Surveys, FCD and GIS. Intern. J. Geo Inf. 2019, 8, 187. [Google Scholar] [CrossRef] [Green Version]
- Jin, F.; Wang, C.; Liu, X.; Wang, J.E. China’s regional transport dominance:Density, proximity, and accessibility. J. Geogr. Sci. 2010, 20, 295–309. [Google Scholar] [CrossRef]
- Jin, F.; Chen, Z. Evolution of transportation in China since reform and opening-up: Patterns and principles. Acta Geogr. Sin. 2019, 74, 1941–1961. [Google Scholar] [CrossRef] [Green Version]
- Sun, W.; Zhang, Y. Assessment of Transportation Superiority Degree in Shanxi Province. Prog. Geogr. 2010, 29, 1562–1569. [Google Scholar]
- Wang, C.; Wang, L.; Liu, R.; Yao, M. Empirical Research on Evaluation Model of Transport Superiority Degree—A Case study of Shandong Province. Hum. Geogr. 2010, 25, 73–76. [Google Scholar]
- Zhou, N.; Hao, J.; Xing, T.; Wang, J.; Hong, S. The Spatial Configuration of Transport Superiority in Huang-Huai-Hai Plain. Econ. Geogr. 2012, 32, 91–96. [Google Scholar]
- Miao, Y.; Wang, B. Zoning scheme of climatic influence for asphalt pavement in China. J. Traffic Transp. Eng. 2007, 7, 64–69. [Google Scholar]
- Li, S.; Gong, J.; Deng, Q.; Zhou, T. Impacts of the Qinghai–Tibet Railway on Accessibility and Economic Linkage of the Third Pole. Sustainability 2018, 10, 3982. [Google Scholar] [CrossRef] [Green Version]
- Sun, C. Evaluation of county-level transport superiority degree in Qinghai province. Master’s Thesis, Qinghai Normal University, Xining, China, 2017. [Google Scholar]
- Li, L.; Wu, Q. Analysis on the traffic coverage of Qinghai Province based on the road network accessibility. J. Xi’an Univ. Archit. Technol. 2018, 50, 233–241. [Google Scholar]
- Miao, Y.; Liu, H.; Song, J.; Dai, T. Research Progress of Transportation Facilities Construction and Their Impact Assessment in the Qinghai Tibet Plateau. Adv. Earth Sci. 2020, 35, 308–318. [Google Scholar]
- Zhang, X.; Ge, Q. The structure, characteristic of land use in Tibetan Plateau and its rationed development strategy. Chin. J. Agric. Resour. Reg. Plan. 2002, 23, 14–19. [Google Scholar]
- Qiu, J. China: The third pole. Nature 2008, 454, 393–396. [Google Scholar] [CrossRef] [Green Version]
- Immerzeel, W.W.; Lutz, A.F.; Andrade, M.; Bahl, A.; Biemans, H.; Bolch, T.; Hyde, S.; Brumby, S.; Davies, B.J.; Elmore, A.C.; et al. Importance and vulnerability of the world’s water towers. Nature 2020, 577, 364–369. [Google Scholar] [CrossRef]
- Zhang, Y.; Li, B.; Zheng, D. A discussion on the boundary and area of the Tibetan Plateau in China. Geogr. Res. 2002, 21, 1–8. [Google Scholar]
- Jin, F.; Liu, Y. Threshold study on transportation and industrial development in Qinghai–Tibet Plateau. J. Nat. Resour. 2000, 15, 363–368. [Google Scholar]
- Jin, F.; Wang, C.; Li, X. Discrimination Method and Its Application Analysis of Regional Transport Superiority. Acta Geogr. Sin. 2008, 63, 787–798. [Google Scholar]
- Meng, D.; Shen, J.; Lu, Y. Spatial Coupling between Transportation Superiority and Economy in Central Plain Economic Zone. Econ. Geogr. 2012, 32, 7–14. [Google Scholar]
- Cheng, J.; Wang, C.; Liu, W. Distribution Configuration and Spatial Differentiation of Transport Superiority Degree in Northwest China. Adv. Earth Sci. 2016, 31, 192–205. [Google Scholar]
- Li, P.; Lu, Y. Review and Prospectation of Accessibility Research. Prog. Geogr. 2005, 24, 69–78. [Google Scholar]
- Colak, H.E.; Memisoglu, T.; Gercek, Y. Optimal site selection for solar photovoltaic (PV) power plants using GIS and AHP: A case study of Malatya Province, Turkey. Renew. Energy 2020, 149, 565–576. [Google Scholar] [CrossRef]
- Kittipongvises, S.; Phetrak, A.; Rattanapun, P.; Brundiers, K.; Buizer, J.L.; Melnick, R. AHP-GIS analysis for flood hazard assessment of the communities nearby the world heritage site on Ayutthaya Island, Thailand. Int. J. Disaster Risk Reduct. 2020, 48, 101612. [Google Scholar] [CrossRef]
- Amini, S.; Rohani, A.; Aghkhani, M.H.; Abbaspour-Fard, M.H.; Asgharipour, M.R. Assessment of land suitability and agricultural production sustainability using a combined approach (Fuzzy-AHP-GIS): A case study of Mazandaran province, Iran. Inf. Process. Agric. 2020, 7, 384–402. [Google Scholar] [CrossRef]
- Guler, D.; Yomralioglu, T. Suitable location selection for the electric vehicle fast charging station with AHP and fuzzy AHP methods using GIS. Ann. GIS 2020, 26, 169–189. [Google Scholar] [CrossRef] [Green Version]
- Stankov, U.; Tanja, A.; Michal, K.; Vanja, P.; Marija, C.; Nataša, D.-K. Spatial autocorrelation analysis of tourist arrivals using municipal data: A Serbian example. Geogr. Pannonica 2017, 21, 106–114. [Google Scholar] [CrossRef] [Green Version]
- Fariza, A.; Basofi, A.; Aryani, M.D. Spatial Mapping of Diphtheria Vulnerability Level in East Java, Indonesia, using Analytical Hierarchy Process—Natural Break Classification. J. Phys. Conf. Ser. 2021, 1803, 012009. [Google Scholar] [CrossRef]
- Gao, X. Impact of Transport Accessibility on Land Use Change in the Qinghai–Tibet Plateau. Ph.D. Thesis, Shanxi Normal University, Xi’an, China, 2019. [Google Scholar] [CrossRef]
- Gao, X.; Cao, X.; Li, T.; Lv, M. Evolution of accessibility spatial pattern of the Qinghai–Tibet Plateau in 1976-2016. Acta Geogr. Sin. 2019, 74, 1190–1204. [Google Scholar]
- Liu, Z.; Feng, X.; Wu, S.; Kong, L.; Yao, X. Spatio-temporal Dynamics of the Urban-Rural Construction Land and Ecological Land on Qinghai–Tibet Plateau. J. Geo Inf. Sci. 2019, 21, 1207–1217. [Google Scholar]
- Yang, X.; Qiu, X.; Fang, Y.; Xu, Y.; Zhu, F. Spatial variation of the relationship between transport accessibility and the level of economic development in Qinghai–Tibet Plateau, China. J. Mt. Sci. 2019, 16, 1883–1900. [Google Scholar] [CrossRef]
- Zhu, Y.; Guang, G.; Lan, C.; Gao, J.; Pang, L. GIS-based analysis of traffic routes and regional division of the Qinghai–Tibetan Plateau in prehistoric period. Prog. Geogr. 2018, 37, 438–449. [Google Scholar]
- Foggin, J.M. Environmental Conservation in the Tibetan Plateau Region: Lessons for China’s Belt and Road Initiative in the Mountains of Central Asia. Land 2018, 7, 52–86. [Google Scholar] [CrossRef] [Green Version]


| Type | Criterion | Weight |
|---|---|---|
| Freeway | contains freeway exits | 2.5 |
| Lh ≤ 30 km | 2.0 | |
| 30 km < Lh ≤ 60 km | 1.0 | |
| Lh > 60 km | 0 | |
| Ordinary highway | 1st | 2.5 |
| 2nd | 2.0 | |
| 3rd | 1.5 | |
| others | 1 |
| Decision Objective | Density of Highways Network | Influence of Trunk Lines | Spatial Accessibility of Highways |
|---|---|---|---|
| Density of highways network | 1 | 1/3 | 1/7 |
| Influence of trunk lines | 3 | 1 | 1/3 |
| Spatial accessibility of highways | 7 | 3 | 1 |
| Classification | Threshold | Number of Counties | Proportion * of Total Number (%) | Area (km2) | Proportion * of total area (%) |
|---|---|---|---|---|---|
| low | 0–0.23 | 7 | 3.35 | 118566.06 | 4.57 |
| relative low | 0.23–0.47 | 17 | 8.13 | 341422.76 | 13.15 |
| general | 0.47–0.62 | 43 | 20.57 | 720643.25 | 27.76 |
| relative high | 0.62–0.73 | 97 | 46.41 | 831603.45 | 32.04 |
| high | 0.73–0.92 | 45 | 21.53 | 583639.50 | 22.48 |
Publisher’s Note: MDPI stays neutral with regard to jurisdictional claims in published maps and institutional affiliations. |
© 2021 by the authors. Licensee MDPI, Basel, Switzerland. This article is an open access article distributed under the terms and conditions of the Creative Commons Attribution (CC BY) license (https://creativecommons.org/licenses/by/4.0/).
Share and Cite
Wang, Z.; Fan, H.; Wang, D.; Xing, T.; Wang, D.; Guo, Q.; Xiu, L. Spatial Pattern of Highway Transport Dominance in Qinghai–Tibet Plateau at the County Scale. ISPRS Int. J. Geo-Inf. 2021, 10, 304. https://0-doi-org.brum.beds.ac.uk/10.3390/ijgi10050304
Wang Z, Fan H, Wang D, Xing T, Wang D, Guo Q, Xiu L. Spatial Pattern of Highway Transport Dominance in Qinghai–Tibet Plateau at the County Scale. ISPRS International Journal of Geo-Information. 2021; 10(5):304. https://0-doi-org.brum.beds.ac.uk/10.3390/ijgi10050304
Chicago/Turabian StyleWang, Zhiheng, Hongkui Fan, Daikun Wang, Tao Xing, Dongchuan Wang, Qiaozhen Guo, and Lina Xiu. 2021. "Spatial Pattern of Highway Transport Dominance in Qinghai–Tibet Plateau at the County Scale" ISPRS International Journal of Geo-Information 10, no. 5: 304. https://0-doi-org.brum.beds.ac.uk/10.3390/ijgi10050304