
Integration of Laser Scanner and Photogrammetry for Heritage BIM Enhancement


1
Department of Conservation Science, Queen Rania Faculty of Tourism and Heritage, The Hashemite University, P.O. Box 330127, Zarqa 13133, Jordan
2
Geomatics Department, Architecture and Planning Faculty, King Abdulaziz University, Jeddah 21589, Saudi Arabia
3
Civil Engineering Department, Faculty of Engineering, Aswan University, Aswan 81528, Egypt
*
Author to whom correspondence should be addressed.
ISPRS Int. J. Geo-Inf. 2021, 10(5), 316; https://0-doi-org.brum.beds.ac.uk/10.3390/ijgi10050316
Submission received: 21 March 2021
/
Revised: 30 April 2021
/
Accepted: 2 May 2021
/
Published: 8 May 2021
(This article belongs to the Special Issue Multi-Resolution Data Fusion for Heritage Building Information Modeling (HBIM) and CityGML Organization)
Abstract
:Digital 3D capture and reliable reproduction of architectural features is the first and most difficult step towards defining a heritage BIM. Three-dimensional digital survey technologies, such as TLS and photogrammetry, enable experts to scan buildings with a new level of detail. Challenges in the tracing of parametric objects in a TLS point cloud include the reconstruction of occluded parts, measurement of uncertainties relevant to surface reflectivity, and edge detection and location. In addition to image-based techniques being considered cost effective, highly flexible, and efficient in producing a high-quality 3D textured model, they also provide a better interpretation of surface linear characteristics. This article addresses an architecture survey workflow using photogrammetry and TLS to optimize a point cloud that is sufficient for a reliable HBIM. Fusion-based workflows were proposed during the recording of two heritage sites—the Matbouli House Museum in Historic Jeddah, a UNESCO World Heritage Site; and Asfan Castle. In the Matbouli House Museum building, which is rich with complex architectural features, multi-sensor recording was implemented at different resolutions and levels of detail. The TLS data were used to reconstruct the basic shape of the main structural elements, while the imagery’s superior radiometric data and accessibility were effectively used to enhance the TLS point clouds for improving the geometry, data interpretation, and parametric tracing of irregular objects in the facade. Furthermore, in the workflow that is considered to be the ragged terrain of the Castle of Asfan, here, the TLS point cloud was supplemented with UAV data in the upper building zones where the shadow data originated. Both datasets were registered using an ICP algorithm to scale the photogrammetric data and define their actual position in the construction system. The hybrid scans were imported and processed in the BIM environment. The building components were segmented and classified into regular and irregular surfaces, in order to perform detailed building information modeling of the architectural elements. The proposed workflows demonstrated an appropriate performance in terms of reliable and complete BIM mapping in the complex structures.
1. Introduction
Building information modeling (BIM) describes the geometry of a structure in the form of parametric objects with their attribute information. However, the implementation of BIM in the field of heritage is a challenging task, as the parametric objects of the available software are unable to adapt to the morphological irregularities that are common in historical structures. Generally, modeling architectural elements that are not included in BIM libraries takes a considerable amount of time [1]. Digital 3D capture and reliable reproduction of architectural features is the first and most difficult step towards defining a heritage BIM. Modern 3D survey techniques, such as terrestrial laser scanning (TLS) and photogrammetry, were recently proposed in different lectures as possible methods for reconstructing heritage geometry in BIM, including a remotely sensed point cloud acquisition technique called Scan-to-BIM [2].
The laser scanner directly records surface geometry, providing high-density and reliable 3D point cloud representation in a given field of view, with specified measurement uncertainty. Despite its heavy weight, high cost, and lack of adequate surface coloring, the method is used in various fields of cultural heritage [3]. The scan density representing the average spacing between the points should be selected for the level of information specified in the project requirement [4,5]. However, in TLS point measurements, several factors lead to imprecise acquisition, and the resulting geometry might be affected by noise, mainly due to the position of the device during data acquisition, the object–sensor distance, the angle of incidence of the laser beam with respect to the scanned surfaces, the properties of the object being scanned, and the signal reflection in certain materials like marble and gilded facades [6]. In addition, laser scans also have incorrect data points on spatial discontinuities, such as edges, where the laser beam is partially positioned on two different surfaces, which is known as the mixed pixel effect [7]. Removing all mixed pixels from the point cloud would result in incorrect object size measurements. Unfortunately, the effects of these errors cannot be independently evaluated [8]. As a result, the measurement uncertainty cannot be represented in the current BIM approaches, and any dimensional measurement taken using BIM would be considered accurate, regardless of the reliability of the underlying data.
Furthermore, the lack of high platforms for higher planar data acquisition in TLS can often lead to missing data of upper building zones, such as roofs and upper parts of monuments [9]. In HBIM, color is also fundamental for big data interpretation. TLS has limitations in capturing cloud colors; even when cameras are built into the device, the best results from their use might not be consistent with the position of the scanner. For outdoor applications, long intervals between scans result in different lighting conditions of the captured images, which color the scans. The obtained models have poor color uniformity after assembling the separate scans. These problems impact the subsequent modeling phase and the efficiency of the Scan-to-HBIM methodology [10].
On the other hand, image-based approaches are considered cost effective and efficient and allow a better interpretation of surface linear characteristics for representing real-world structures in a high-quality 3D textured model [11]. The method is typically recommended for monuments or buildings with complex geometric shapes [12]. The major advancements in computer vision and algorithms automated the procedures available to obtain the corresponding point for most pixels in the image. The result is dense, textured 3D points clouds. The camera-equipped UAV platform overcomes the location restrictions of traditional terrestrial sensors [13]. However, the available methods also implement standards for the quality of images and their layout [14,15]. The main challenges are the shadow and textureless elements that can affect the efficiency of the processing algorithms and the absence of scale data [16,17].
Combining TLS and photogrammetric techniques to overcome previous bottlenecks proved to be the most effective way to record large and complex heritage sites in applications for documentation [18], structure assessment [19,20,21,22], texture mapping [23,24], feature extraction [25], etc. In this work, multi-resolution surveying that combines TLS with 3D photogrammetric point clouds was used to create the HBIM model objects that are capable of embodying the richness of the shape acquired. The approach workflow, shown in Figure 1, provides an effective methodology for data fusion using the Iterative Closest Point (ICP) algorithm to produce a complete and accurate geometry. These elements were not only geometrically reconstructed in detail but were also located in their true position in the building framework, with their respective topological details. Sensor integration was approached during the recording of two heritage sites in Jeddah, Saudi Arabia—Matbouli House Museum in Historic Jeddah, a UNESCO World Heritage site; and the Asfan Castle. The historical houses of Jeddah are rich in detailed architectural elements, known as the Hijazi architecture style. In the Matbouli building, multi-sensor recording at different levels of detail was used to improve the interpretation and plotting of complex parametric objects. Furthermore, UAV mobility and accessibility were effectively used in the historic Asfan Castle to allow TLS data completeness.
This paper provides the following main contributions:
- -
- TLS and photogrammetry data fusion to improve built heritage digitization for reliable BIM with different levels of detail.
- -
- Combination of TLS and UAV imagery point clouds to provide complete geometry for the Scan-to-BIM process.
- -
- Enrichment of the Hijazi Architectural Object Library by designing high-detail parametric and non-parametric objects.
The article is structured as follows. The literature review in Section 2 demonstrates the rise of BIM in the increasing amount of research on the reconstruction of BIM geometry. Case studies are stated in Section 3. Data collection and the configuration of the sensor are discussed in Section 4, including the strengths and limitations. Section 5 describes the data fusion methodology to improve the geometry of point clouds. The results of the HBIM are presented in Section 6. The results and conclusions are discussed in Section 7 and Section 8.
2. Related Work
Heritage BIM applications were recently identified in a variety of areas, such as restoration activities [26,27,28], structural analysis and monitoring [29,30], and facility management [31,32]. However, implementing these procedures is challenging because heritage buildings contain unique and irregular elements that are not specified in BIM software libraries [33]. The lack of advanced BIM platforms with such modeling tools prevents the proper digital construction of heritage buildings [5,34,35]. This can only be achieved by developing more adaptable BIM libraries with additional parametric elements that represent various heritage objects [36,37]. These elements require accurate recording and detailed surveys that can be properly interpreted and modeled on a BIM platform [38,39,40]. This often involves the recognition of objects, the extraction of relational information, and the handling of occlusions and noise data [41]. Dore and Murphy [42] suggested guidelines, rules, and methodologies for digitally recording cultural heritage sites. Lopize et al. [43] also described the most relevant techniques and tools for the acquisition and management of HBIM objects. The reliability of the HBIM output mainly depends on the needs of the end user, as well as on the details and shape interpretation of the structural components in the scan points. Digital 3D survey technologies, such as TLS and photogrammetry, enabled researchers to record structures with a different level of detail [44].
Baik and Boehm [45] and Oreni et al. [46] proposed a series of measures to restore a historic library by using TLS point clouds for entire buildings. In the methods provided, only visible sections of the structures could be modeled and reconstructed, while invisible sections were predicted from other similar recorded elements. The differences between the idealized BIM model and the visible defects in the measured survey were crucial with regard to structural modeling, as stated by Nieto-Julián et al. [47]. Barazzetti et al. [19] proposed different ways of scanning to obtain appropriate cloud point data for the final model. The most common problems identified in these analyses were the object type and the scanner construction technology [48]. Godinho et al. [32] discuss the issues of laser signal reflection in gilded materials and the resulting point cloud noise. Amico and Curra [49] also discussed the impact of mixed pixels on element detection, which resulted in a dense cloud of “noise” surrounding the constructive elements. The mixed pixel phenomenon was resolved by a critical assessment carried out by the operator assigned to the survey.
Barrile et al. [50] and Bagnolo et al. [51] used photogrammetry techniques to survey and reconstruct object characteristics for BIM processing, but the geometric processing of complex structures using imagery alone did not guarantee reliable reconstruction and management of the structural elements. The efficiency of the used 3D reconstruction algorithms was affected by shadow and textureless object problems. Moreover, close-spaced photographs had to be successfully aligned, which could be challenging for large and complex systems. Error propagation and noisy point clouds arise in long image sequences with a large-scale structure. Matching failures can also be caused by radiometric variations between photographs [16,17,52]. Furukawa et al. [53] described the difficulties faced during photogrammetric reconstruction of interiors, including texture-poor surfaces, visibility reasoning between rooms, and scalability issues where the objects required capture at different resolutions.
Several researchers proposed merging photos and TLS to improve the quality of BIM. During a survey, Sztwiertnia et al. [6] used non-metric photographs to distinguish and interpret a TLS point cloud’s unique and complex architectural elements. Lopize et al. [54] presented a workflow that combined point clouds, historical sources, and images, to precisely model irregular or complex surfaces of heritage buildings; the photo showed the frames and dimensions of the inserted element and the edges of the shape. Banfi et al. [34] used a similar workflow to link data with a modeling environment to enhance the HBIM model using photo planes and precise orthophotos. Murphy et al. [55] proposed a hybrid approach, whereby a photo scaling program was built using two-dimensional segmented data to plot and quantify distances and angular values. This automated the development of numeric parametric data for the revision and plotting of library items on laser survey data. Generally, the combination of sensors in a survey was particularly effective in digitizing complex structural features, but, on the other hand, it required extensive manual post-processing for data cleaning and alignment. While previous hybrid works improved the geometry of the HBIM approach, separate, individual modeling of multiple artifacts would result in a loss of information from the general perspective of the construction framework; the relevant topology information between architectural elements might allow for a better analysis of buildings for conservation and restoration activities.
3. Case Studies
3.1. Matbouli House Museum in Historic Jeddah
Jeddah is one of the most significant cities in the Kingdom of Saudi Arabia, containing many historic buildings that were constructed over 300 years ago. In 2014, Historical Jeddah was added to the UNESCO World Heritage Sites list. Jeddah’s historic houses are rich in architectural elements, known as the Hijazi style of architecture, derived from various aspects of Islamic culture. The ornaments of Roshan, gates, Manjur, and plaster are examples of such elements, illustrated in Figure 2. Although many traditional buildings were restored and made open to the public, a large number of historic buildings in Jeddah are still at risk or in need of restoration. Many of these structures do not have any engineering data attached to them that could be used for reconstruction and recovery, in the event of a disaster or collapse.
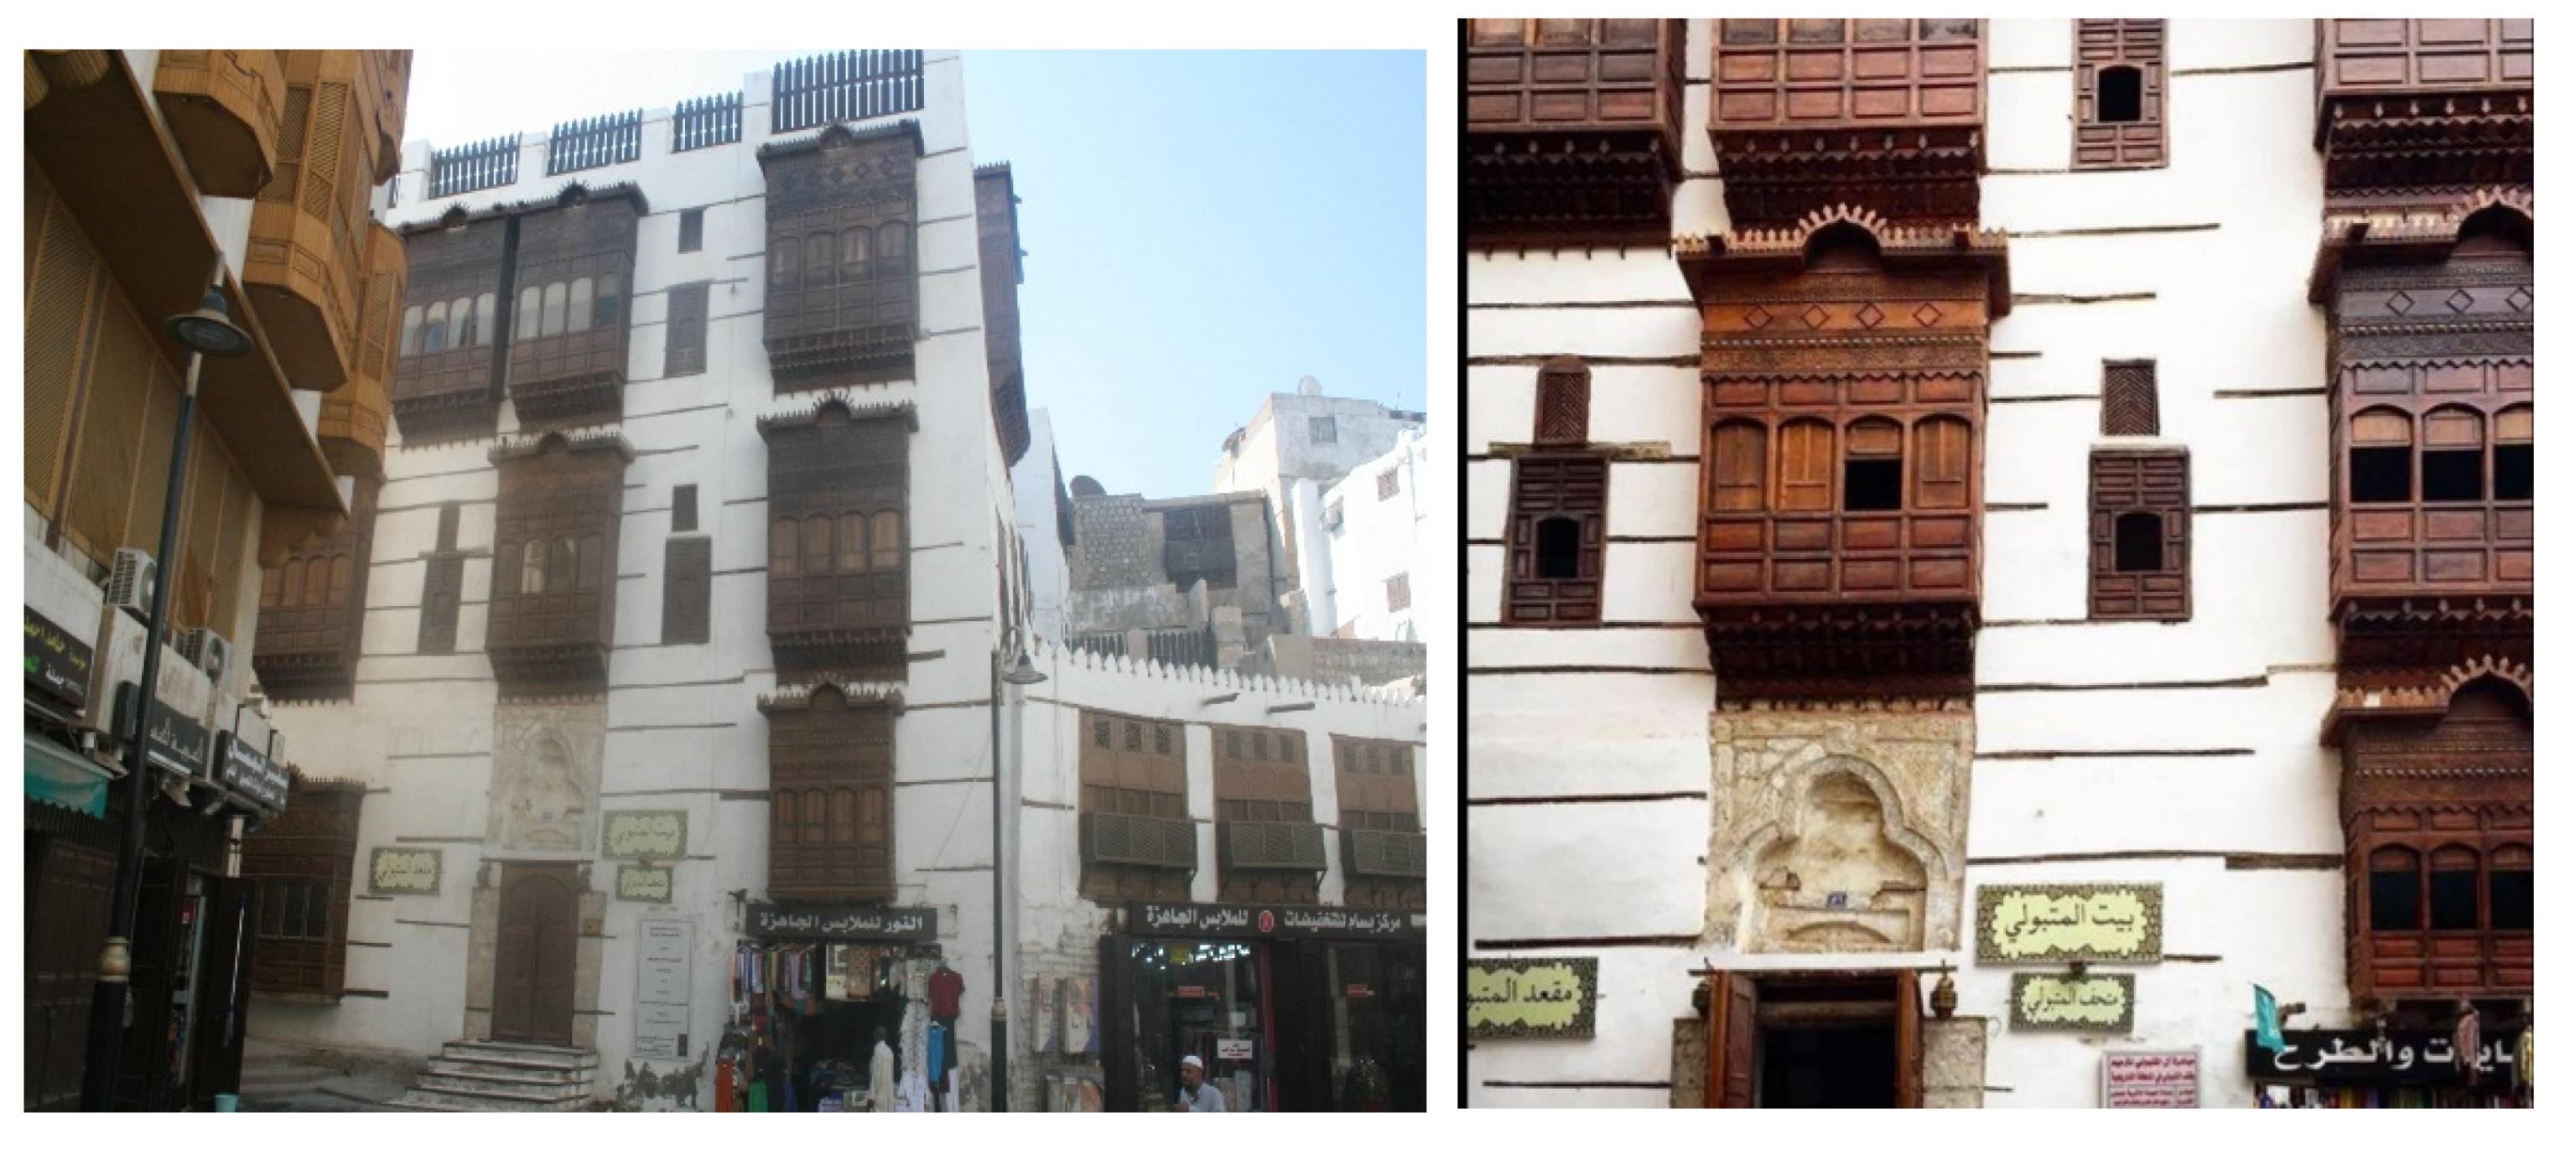
The privately owned Matbouli House, shown in Figure 3, is located on the edge of the historic town. This beautiful example of a traditional Hijazi merchant’s house is now turned into a museum. At the front of the building, the three-story property features stunning wood-latticed Roshan and doors with intricate ornamental wood carving. These architectural styles are common in various historic sites, especially in the Hijazi region and the Red Sea region.
The Hijazi objects have the same type of structure; the difference, however, is in the details of the decorations and how they are assembled, which vary from one building to another. The Roshan in Hijazi buildings is the most significant feature. It is located almost anywhere in the historic facades as a “great projecting wooden frame” that casts light and shadows on the houses. The Roshan is formed by three main parts—the head, the body, and the base, as shown in Figure 4. It is made of wood that has mixed moving and fixed sections. The whole structure of the Roshan is fastened by a series of wall brackets or consoles to the brick. These consoles are designed to incorporate elaborate and polychrome ornamentation in some cases. These wooden structures were carved and decorated. The pieces are mounted on the underpins of the console within the stone. The sideboards are “stacked” over the opening using metal spikes that are connected to the pieces of wood and attached to the wall. The boards have built-in grooves in the lower section, constituting a perfect plinth. Above, from the inside, it can be seen that the eye level is fitted with sliding wooden shutters, while the Mashrabiyah sections are fitted at a higher level to provide space with air circulation. These structures are surmounted by a wide, exquisite cornice [56].
3.2. Asfan Castle
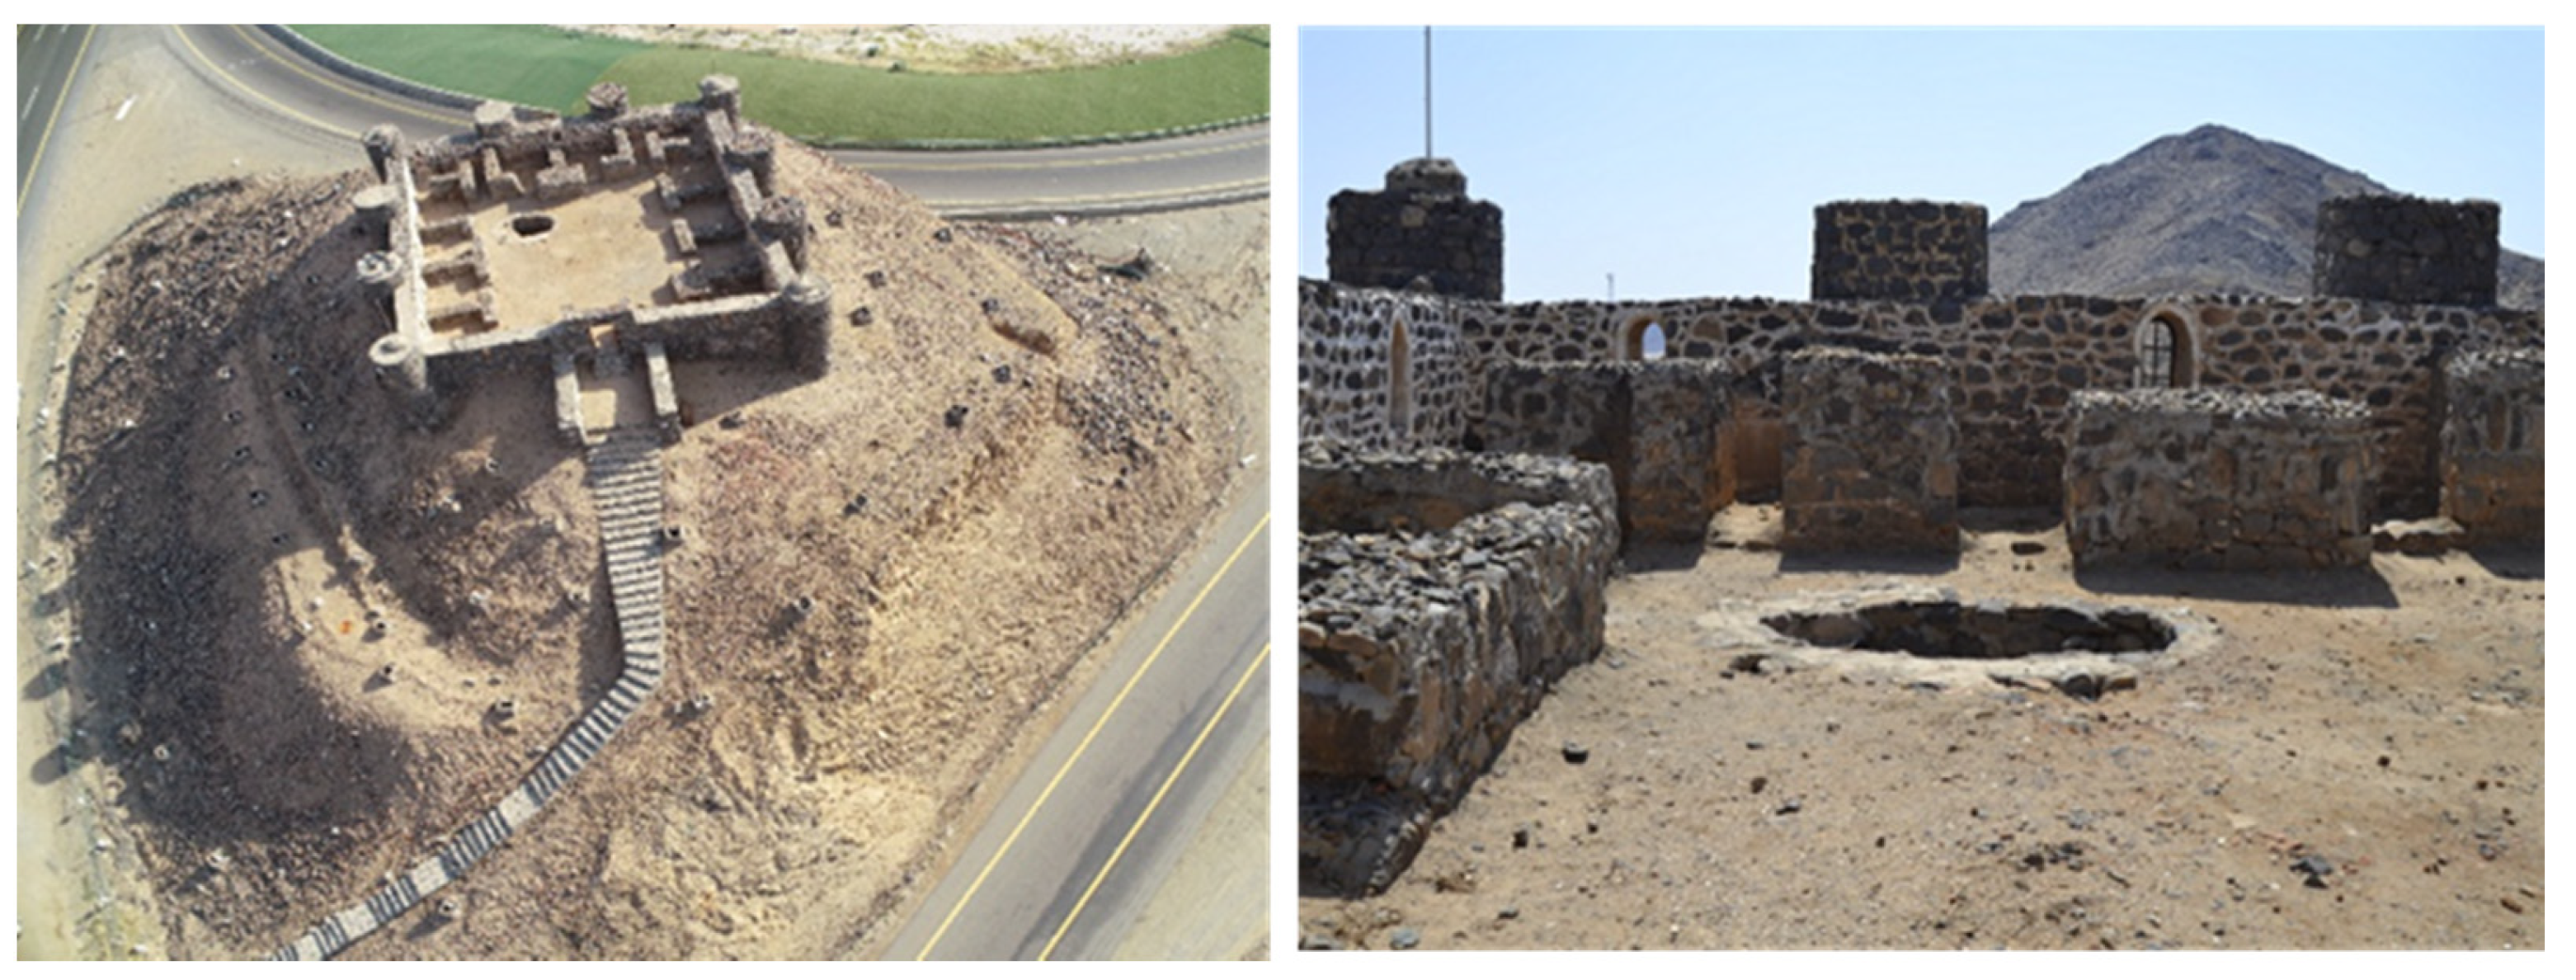
The Asfan Castle is located 30 km north of Jeddah. It was built on a hilltop near the roads that pass through the village of Asfan, shown in Figure 5. The fort was built by the Ottomans in the 14th century and served as a caravanserai for pilgrims coming from the north on their annual pilgrimage. The square-shaped castle consists of a tower at each corner and two additional towers on the walls; the entire structure is 200 square meters in size. The only entrance to the fort was the arched gateway. There was a vault near the center of the castle, which led to the lower part of the fort. The castle was built from basalt stones brought from the nearby mountainous areas. In 2015, the historic castle was restored by Asfan municipality, and the collapsed columns and stairways were reconstructed to allow visitors to enter the site.
4. Acquisition Laser Scanner and Photogrammetric Data
4.1. Matbouli House Museum
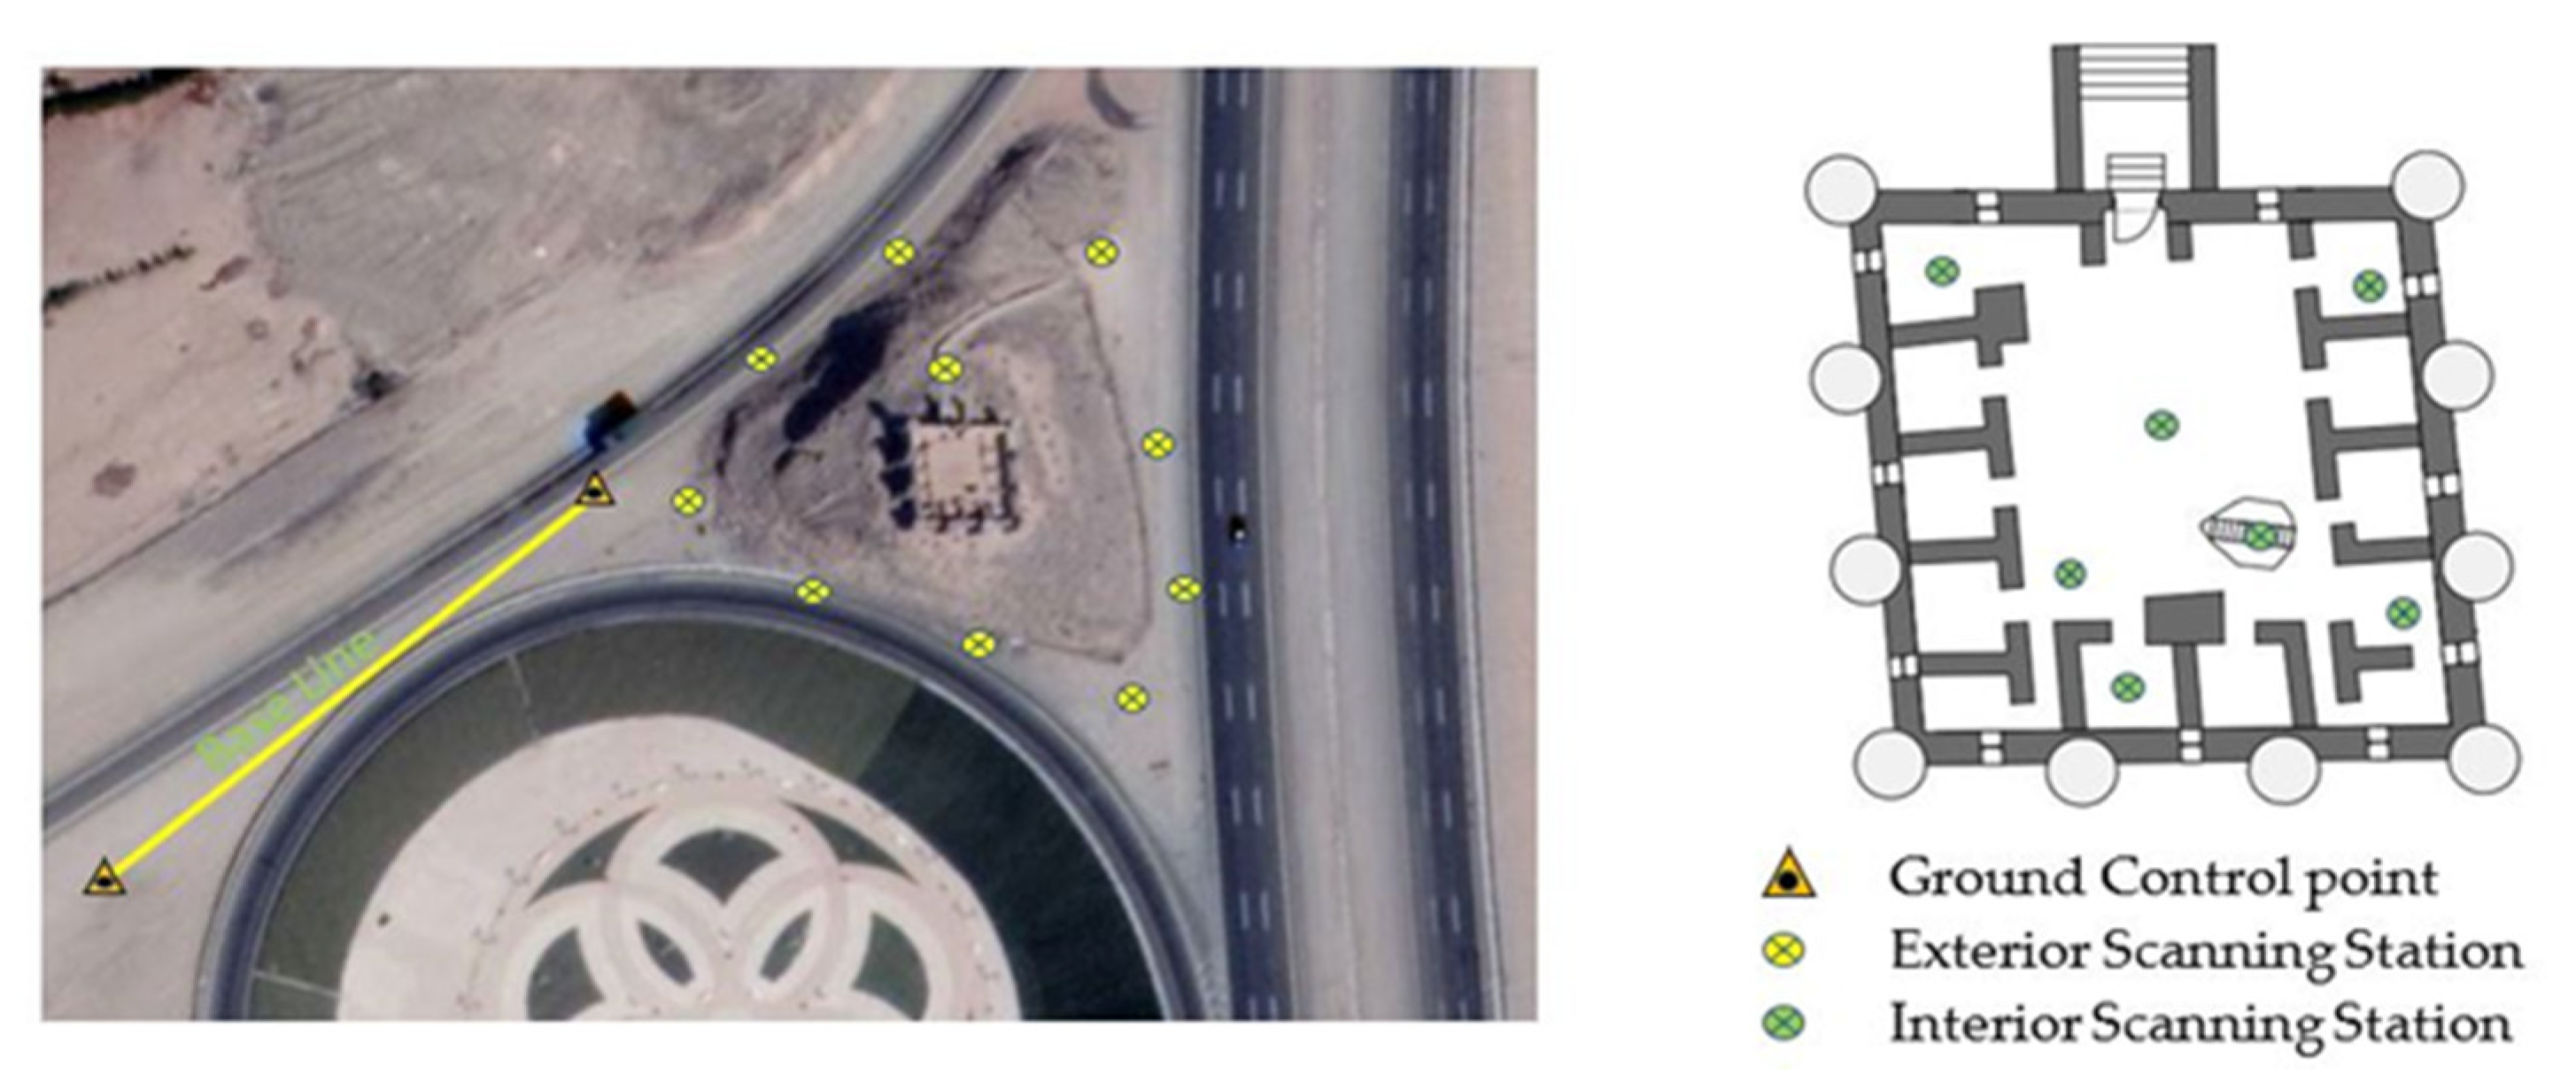
For our surveys, a Leica station C10 laser scanner was used to acquire the surface point clouds. The scanning distance of the system was between 2 and 300 m, with an accuracy between 6 mm and 50 m. The flight time scanner could receive up to 50,000 points per second and had a 360-degree horizontal and 270-degree vertical field of view. The system was equipped with a 4-megapixel resolution camera (1920 × 1920 pixels) to color the produced point cloud. In order to provide 3D coverage of the Matbouli House Museum, 22 different scanner views were selected—17 interior floor scans and 5 exterior facade scans; the scanning work plan is depicted in Figure 6. The precise locations of the scanning stations were defined to reduce the possibility of hidden areas. Ground control points (GCPs) had to be specified according to the local reference system (Ain el abed UTM 36 North) in order to obtain a georeferenced 3D point cloud of the building’s exterior and interior. In addition to a Leica Total Station TCR 1201 (0.3 mgon, 1 mm + 1.5 ppm with reflector), Leica GNSS Viva GS15 receivers (accuracy of 3 mm + 0.5 ppm) were used. The orthometric height values of these GCPs were obtained through geometric leveling with a Leica Runner 24 level (2.0 mm per km double-run leveling).
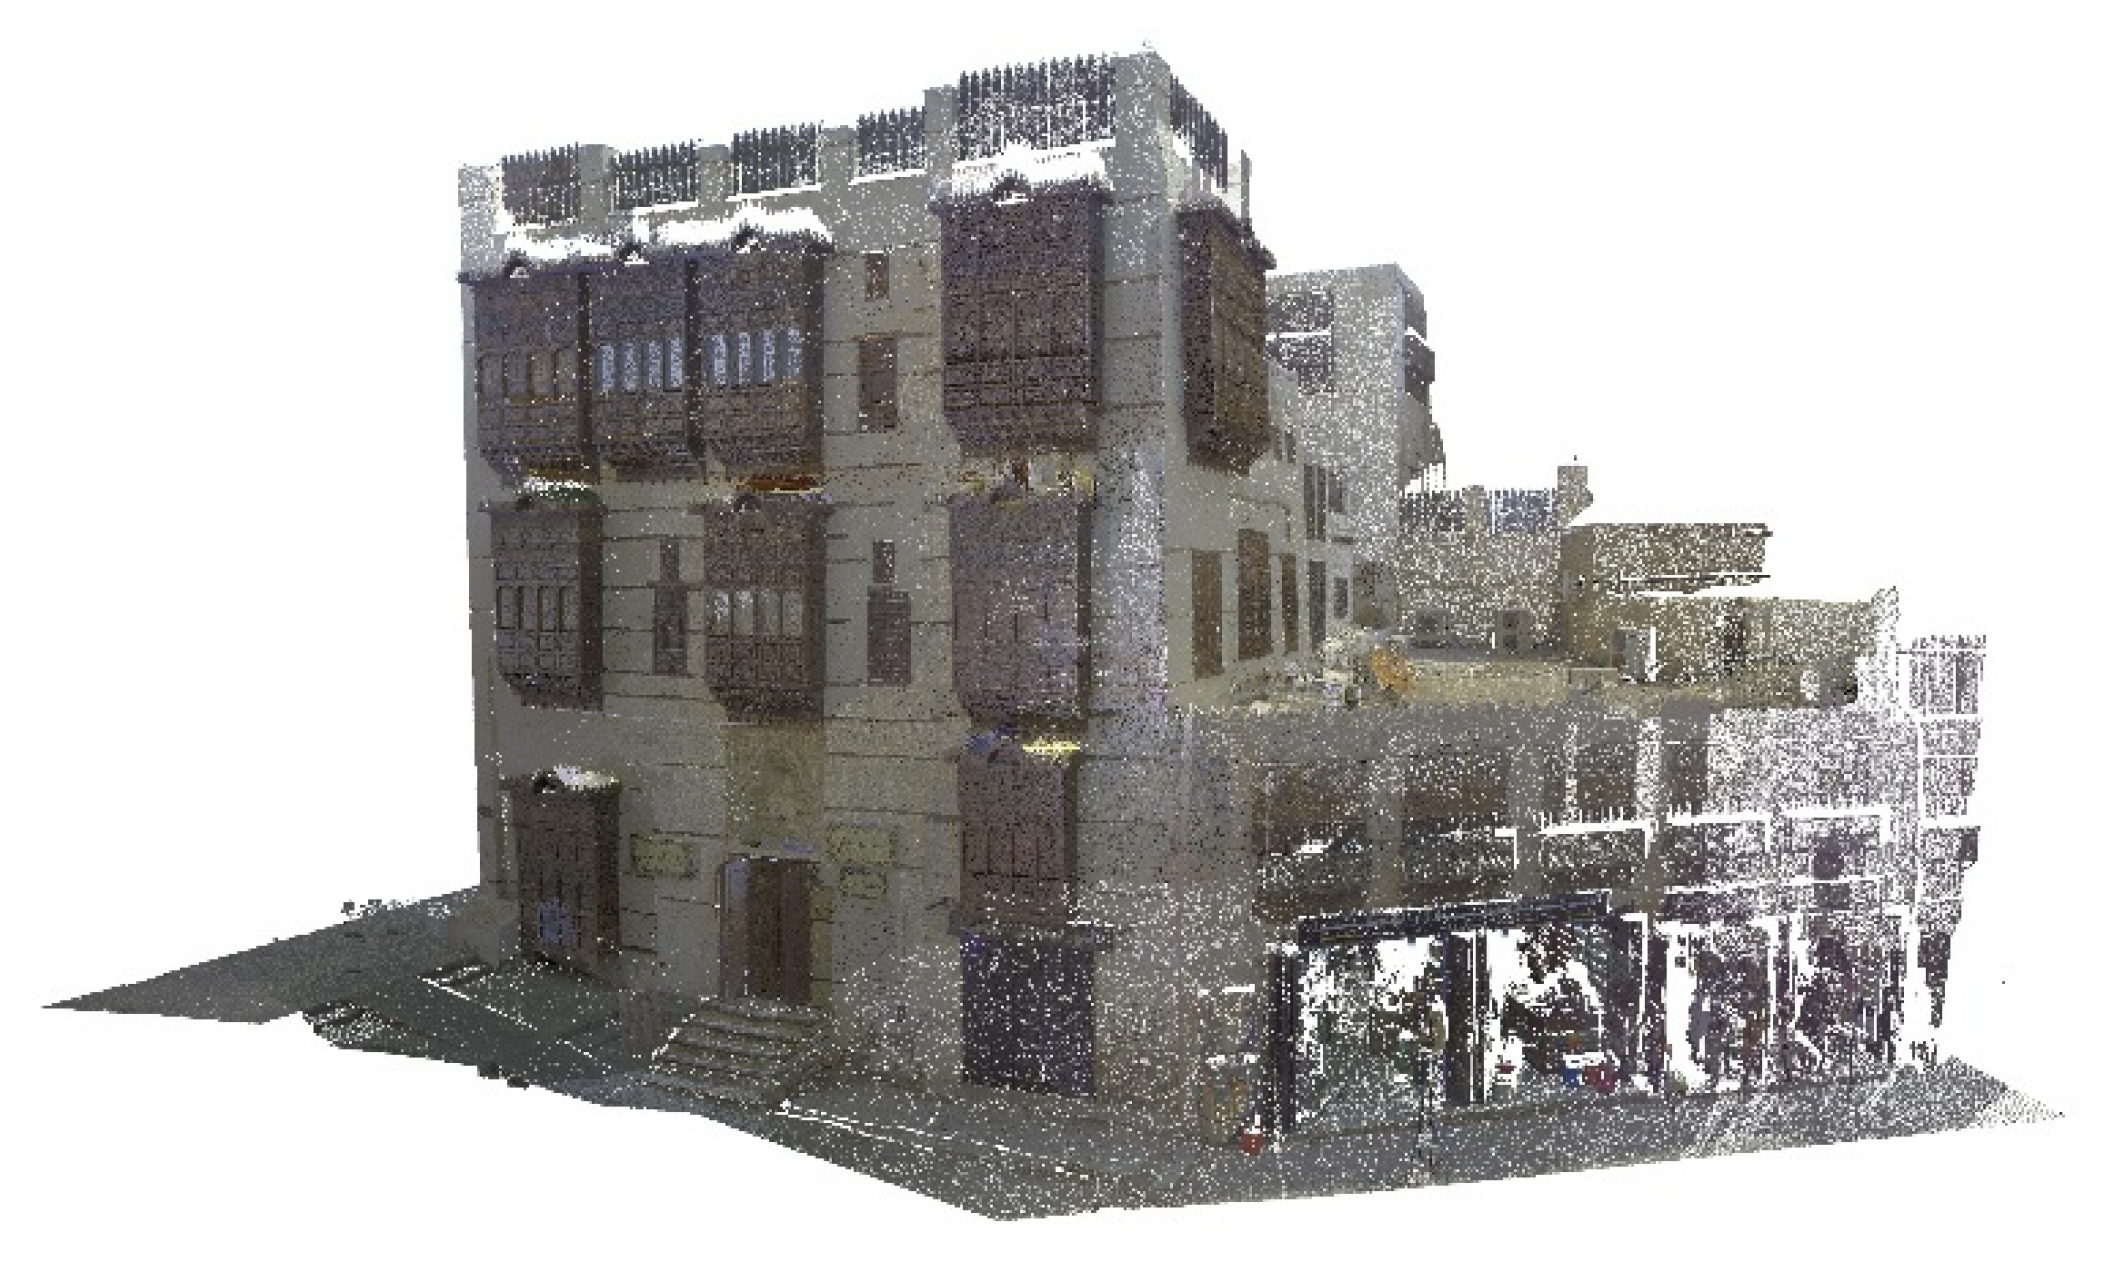
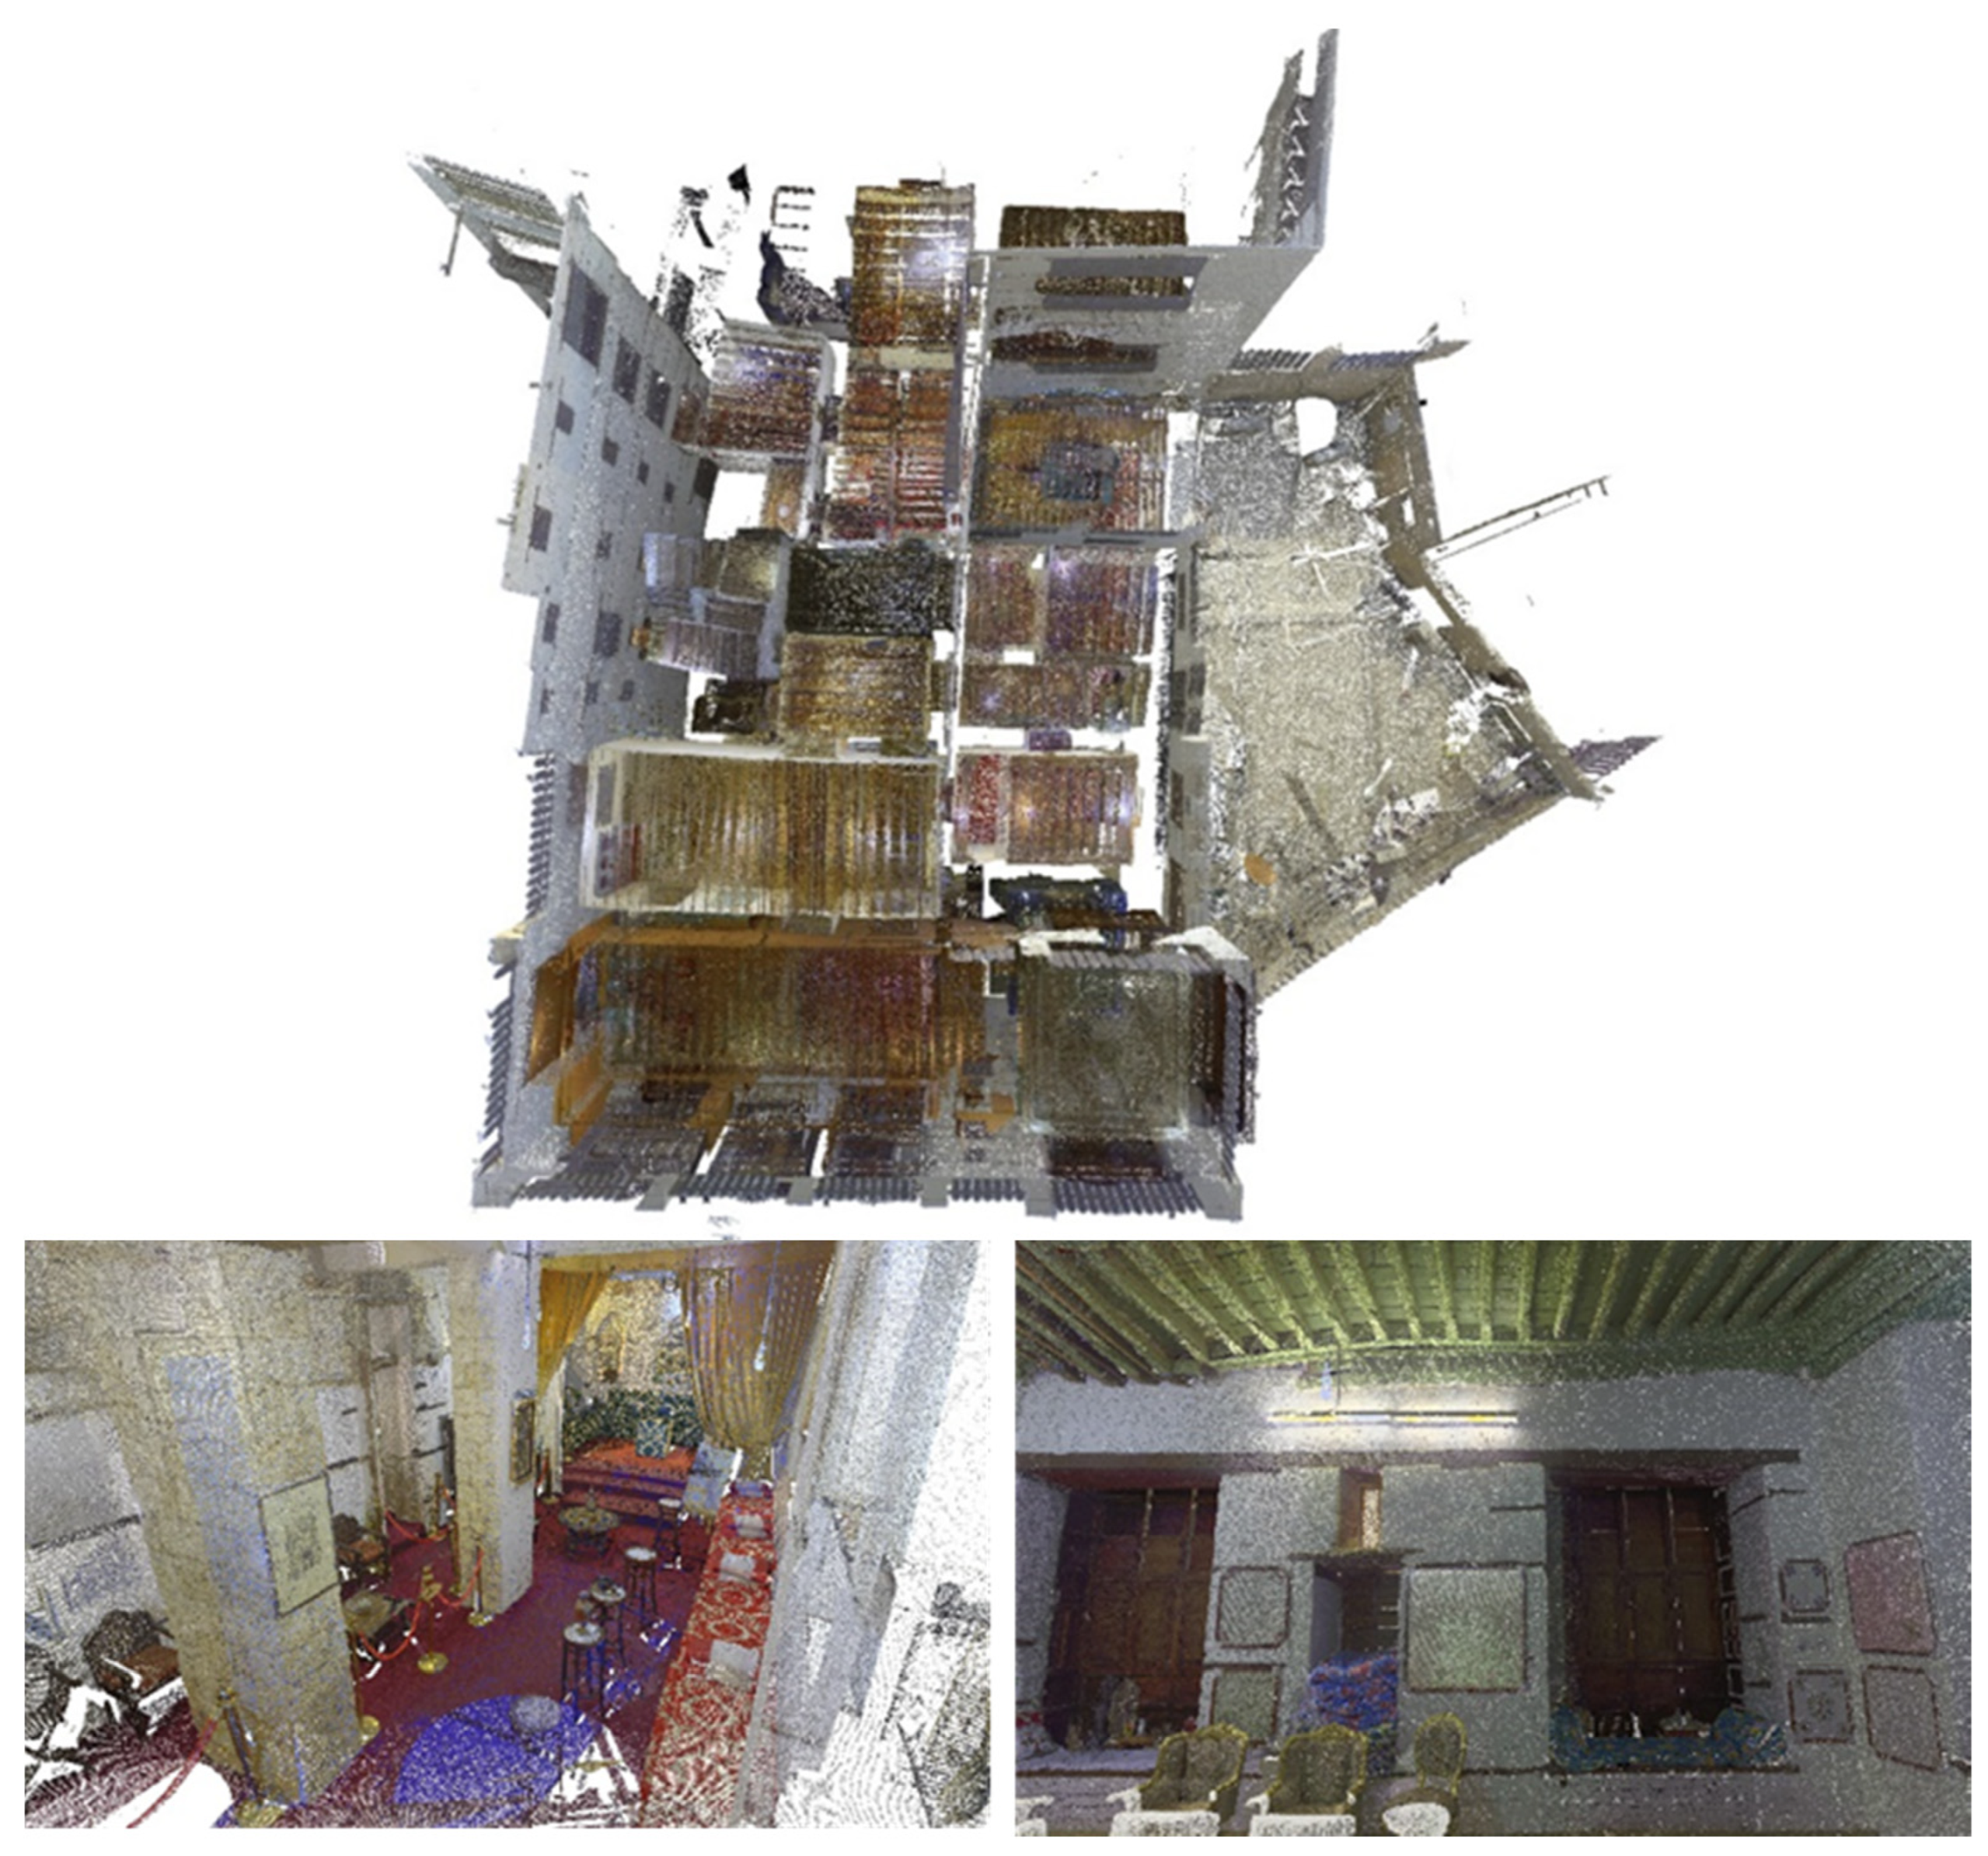
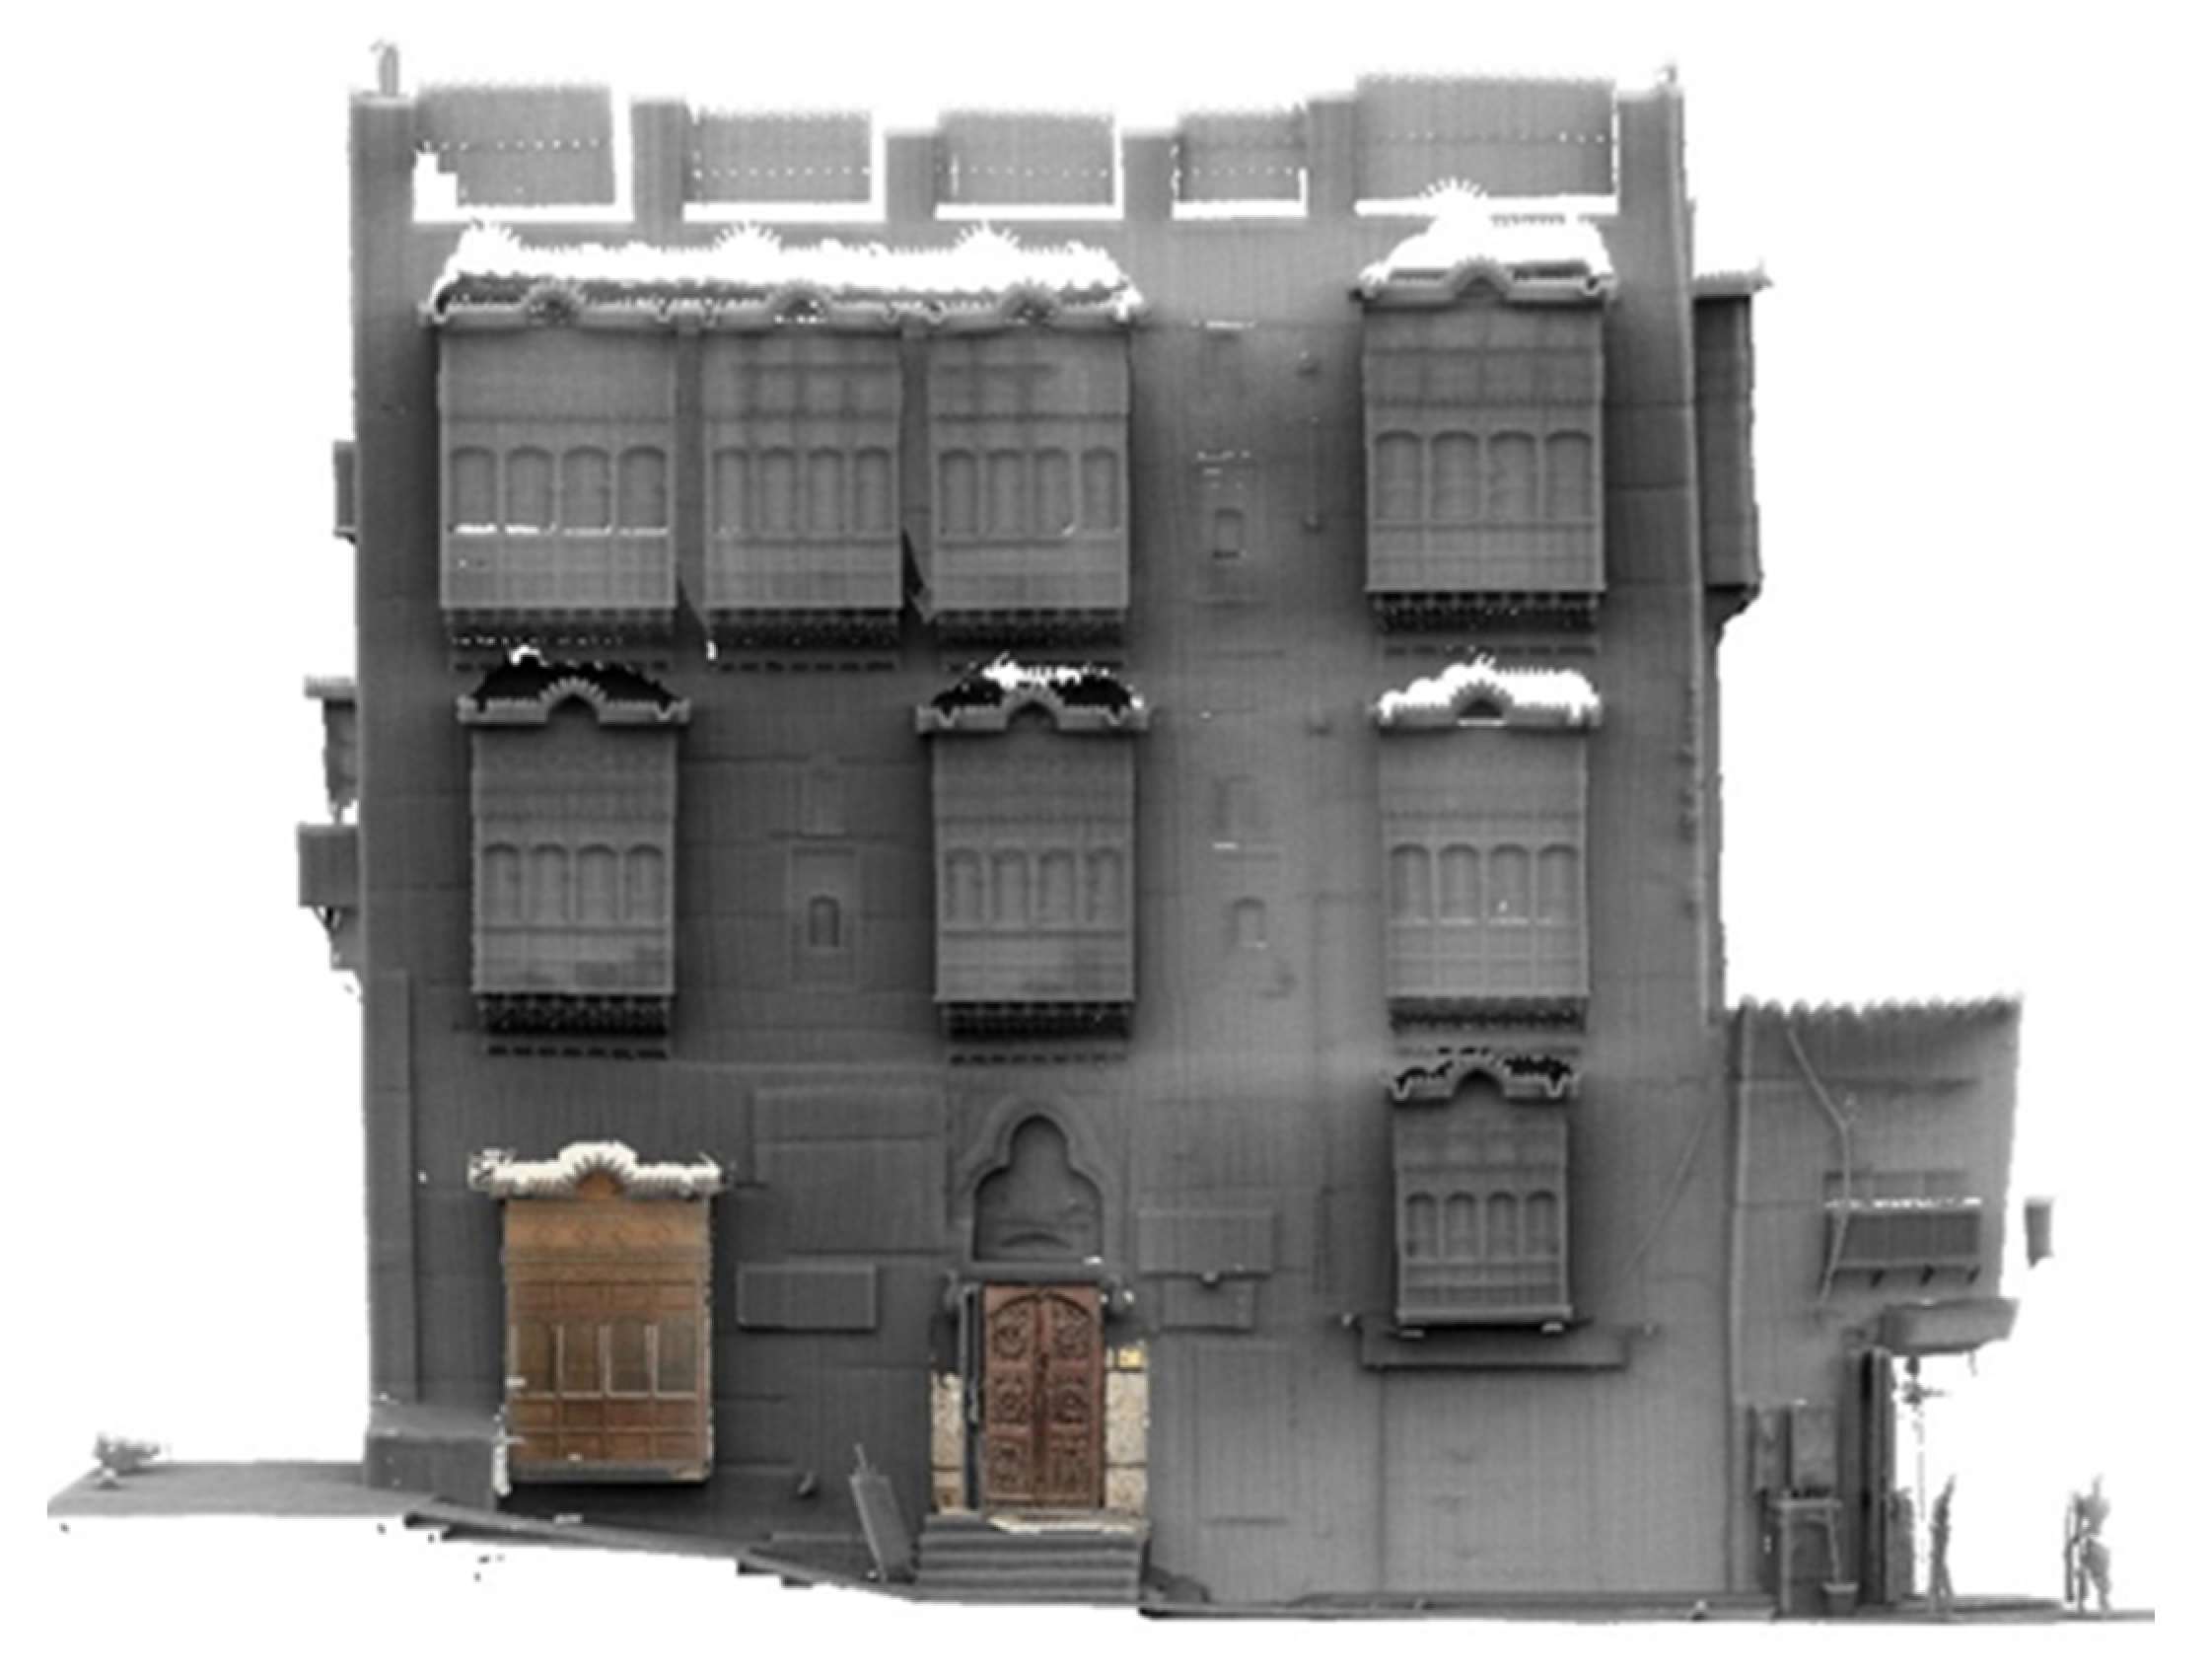
The collected scans were aligned into a single reference to create a unified point cloud that provided a complete overview of the scene. The registration was carried out using artificial targets with a nominal average accuracy of 4 mm, which was primarily due to errors in the point cloud representing the target. For each scan pair, at least three targets should be used, and the 3D location of the targets was measured to determine the transformation parameters of the scans. Figure 7 and Figure 8 depict 3D colored point clouds of the building’s facades and interior spaces, respectively. The model had an overall ground sampling distance (GSD) of 1cm with 280 million points.
Despite TLS’ previously mentioned potential, the data obtained using these tools pose a number of challenges to the goal of accurate and complete 3D recording. TLS has limitations in capturing cloud colors with cameras mounted on the device. The results showed other difficulties related to the reflection of the laser signal in the gilded facades. Such problems can affect data interpretation and model geometry in the HBIM process. The data might also include incorrect data points on spatial discontinuities, such as edges of objects, where the laser beam spot is located partially on two different surfaces. Subsequent manual editing would be required to remove such unnecessary points.
On the other hand, the images can explain the irregular and linear surface characteristics better than the results of the laser can. In the Matbouli building, fine architectural features such as the Roshan, Munjar, and decorated doors were modeled separately using a professional 18-megapixel Nikon D5100 camera. The selected configuration of camera geometry for data acquisition is an important part of the image-based modeling process. In our projects, closely spaced images were steadily collected by the camera in a circle, so that more than 80 per cent of the images overlapped for effective model processing. The photos were taken with a fixed focal length in order to perform photogrammetry analysis. A focal length of 18 mm was used to obtain the camera’s widest shooting range. Some parameters were set during the acquisition of the imagery, depending on the incoming light.
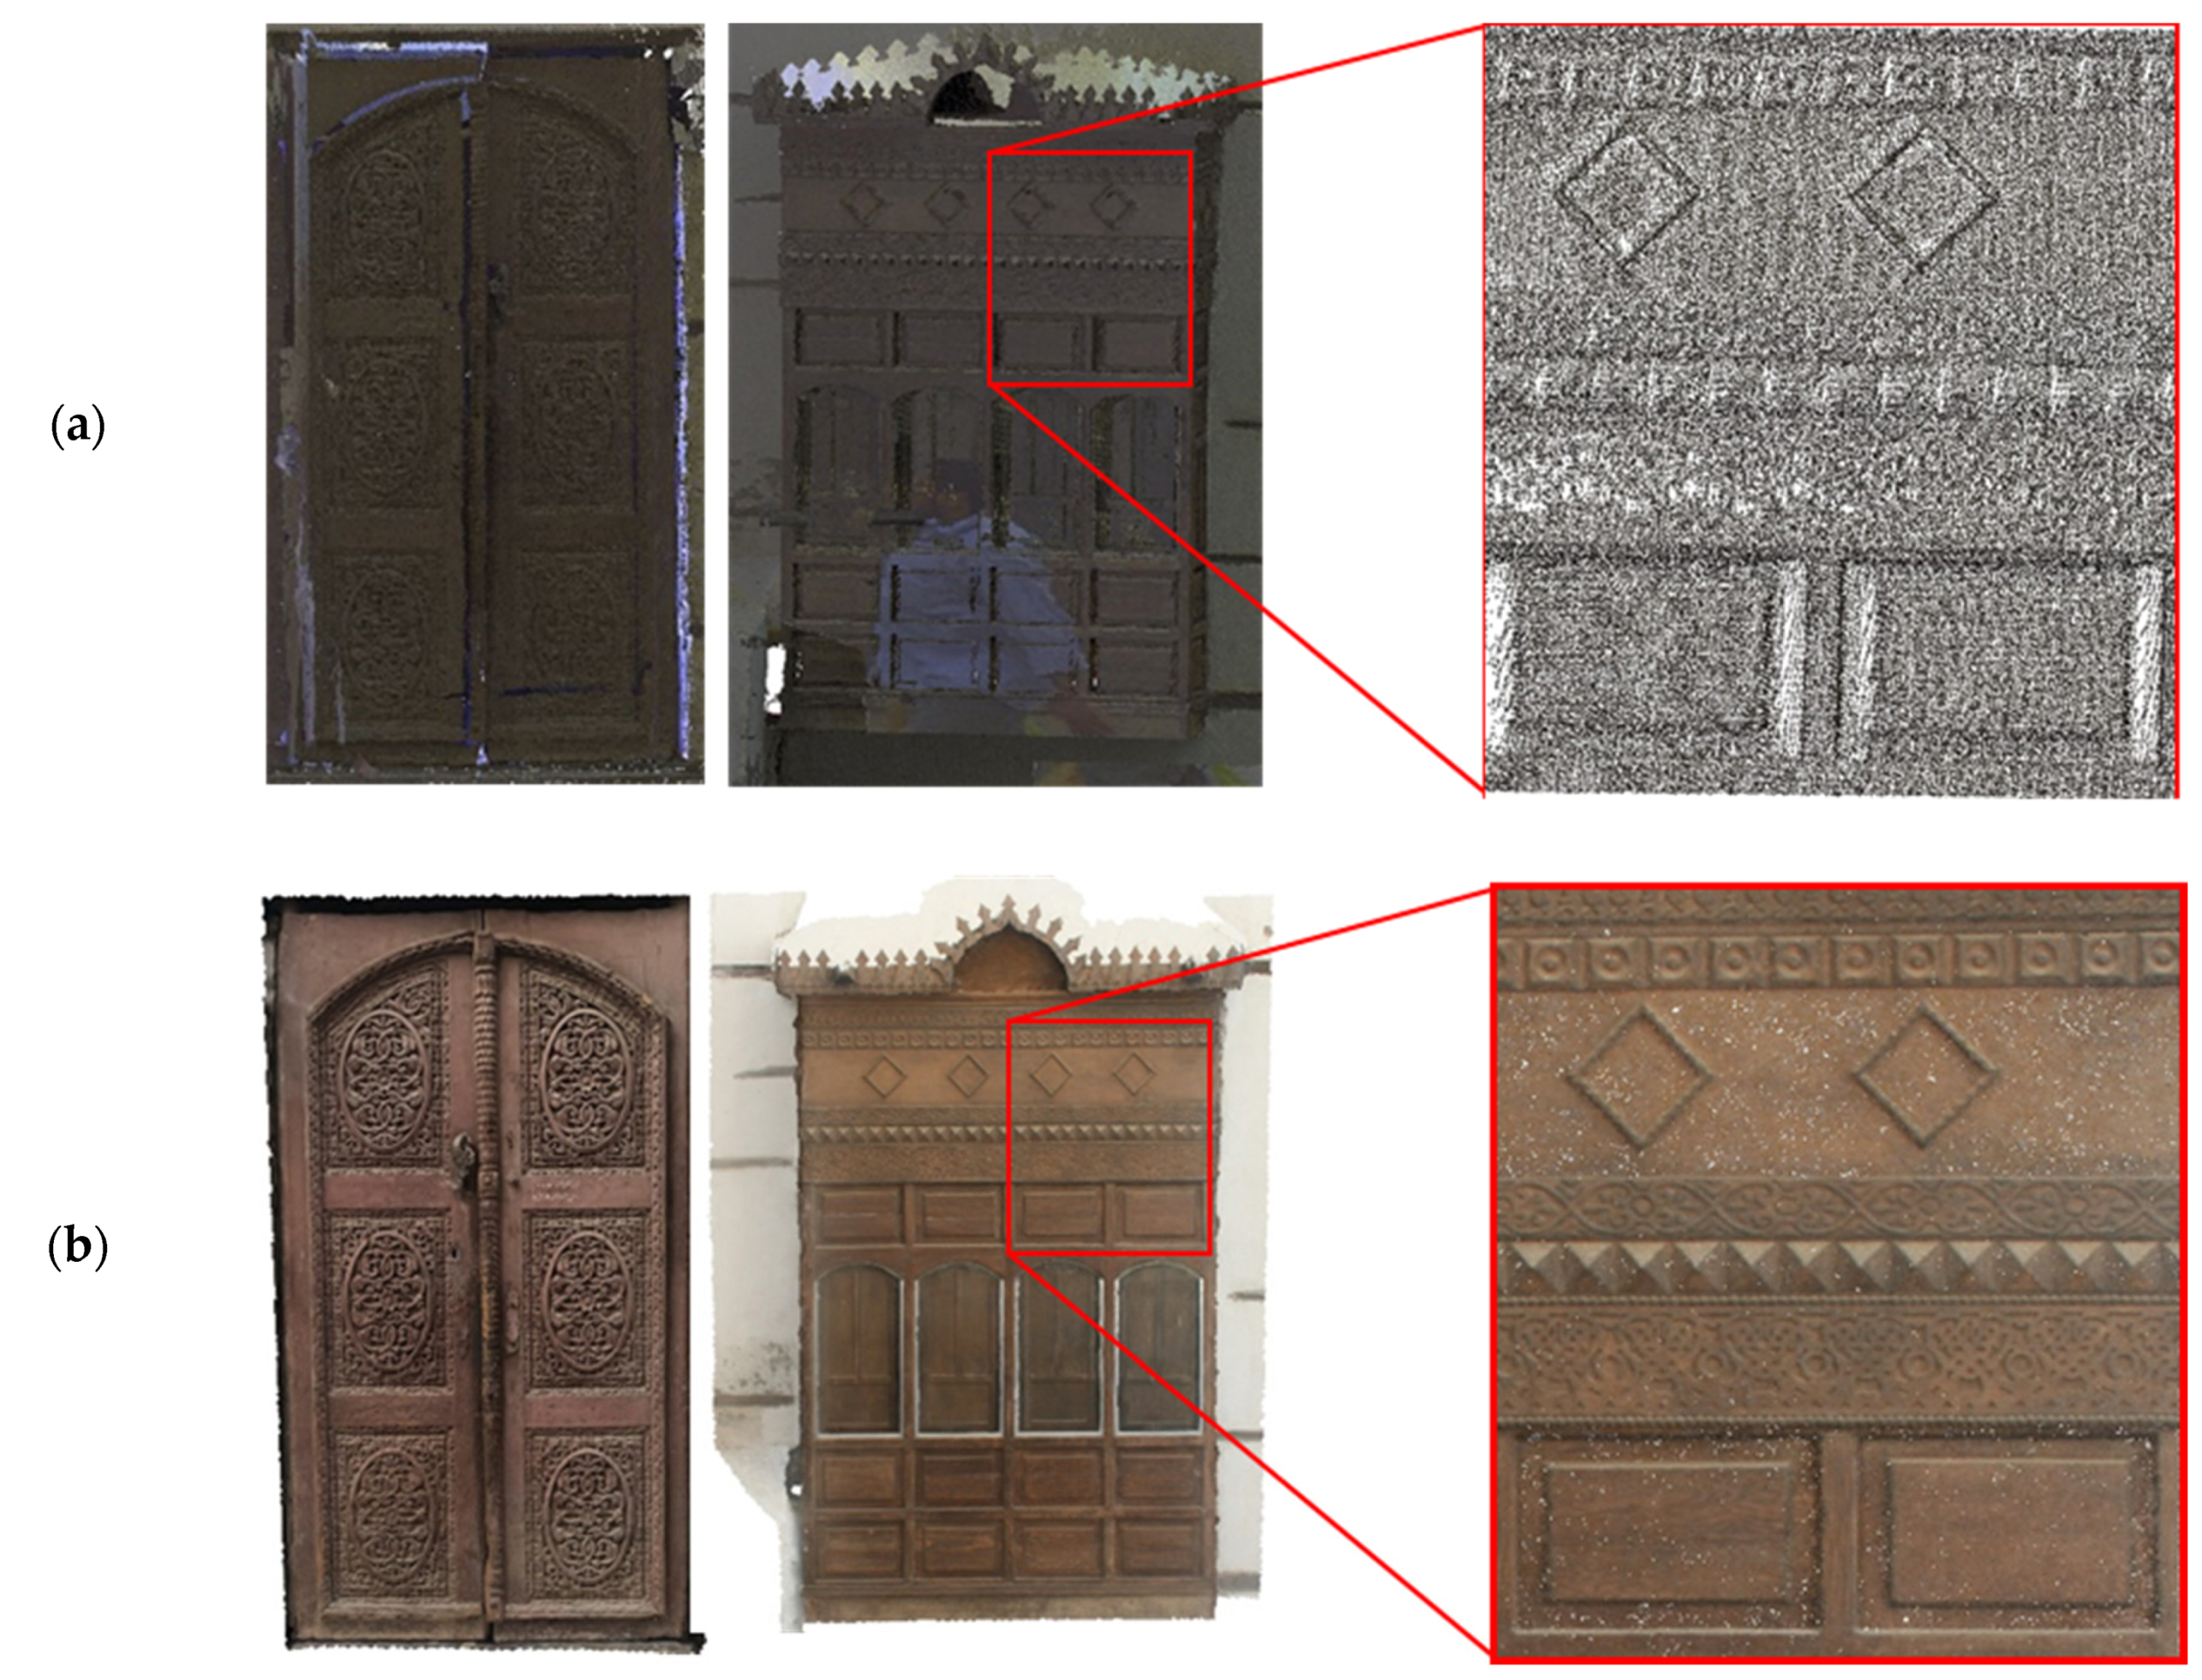
The Structure from Motion (SfM) algorithm was used to determine the external orientation parameter for all photos and to generate a sparse point cloud in an arbitrary space model. Automatic image matching was performed using the camera position and orientation parameters, to generate points for each overlapping pixel. The Roshan and the door were reconstructed at 4.7 million points, with an average ground sampling distance (GSD) of 1.6 mm; depicted in Figure 9. As the main door had 3.2 million points with an average GSD of 1.3 mm, the resultant dense point cloud could help improve the texture and data interpretation of objects; as shown in Figure 10, which compares the photogrammetry and TLS datasets.
4.2. Asfan Castle
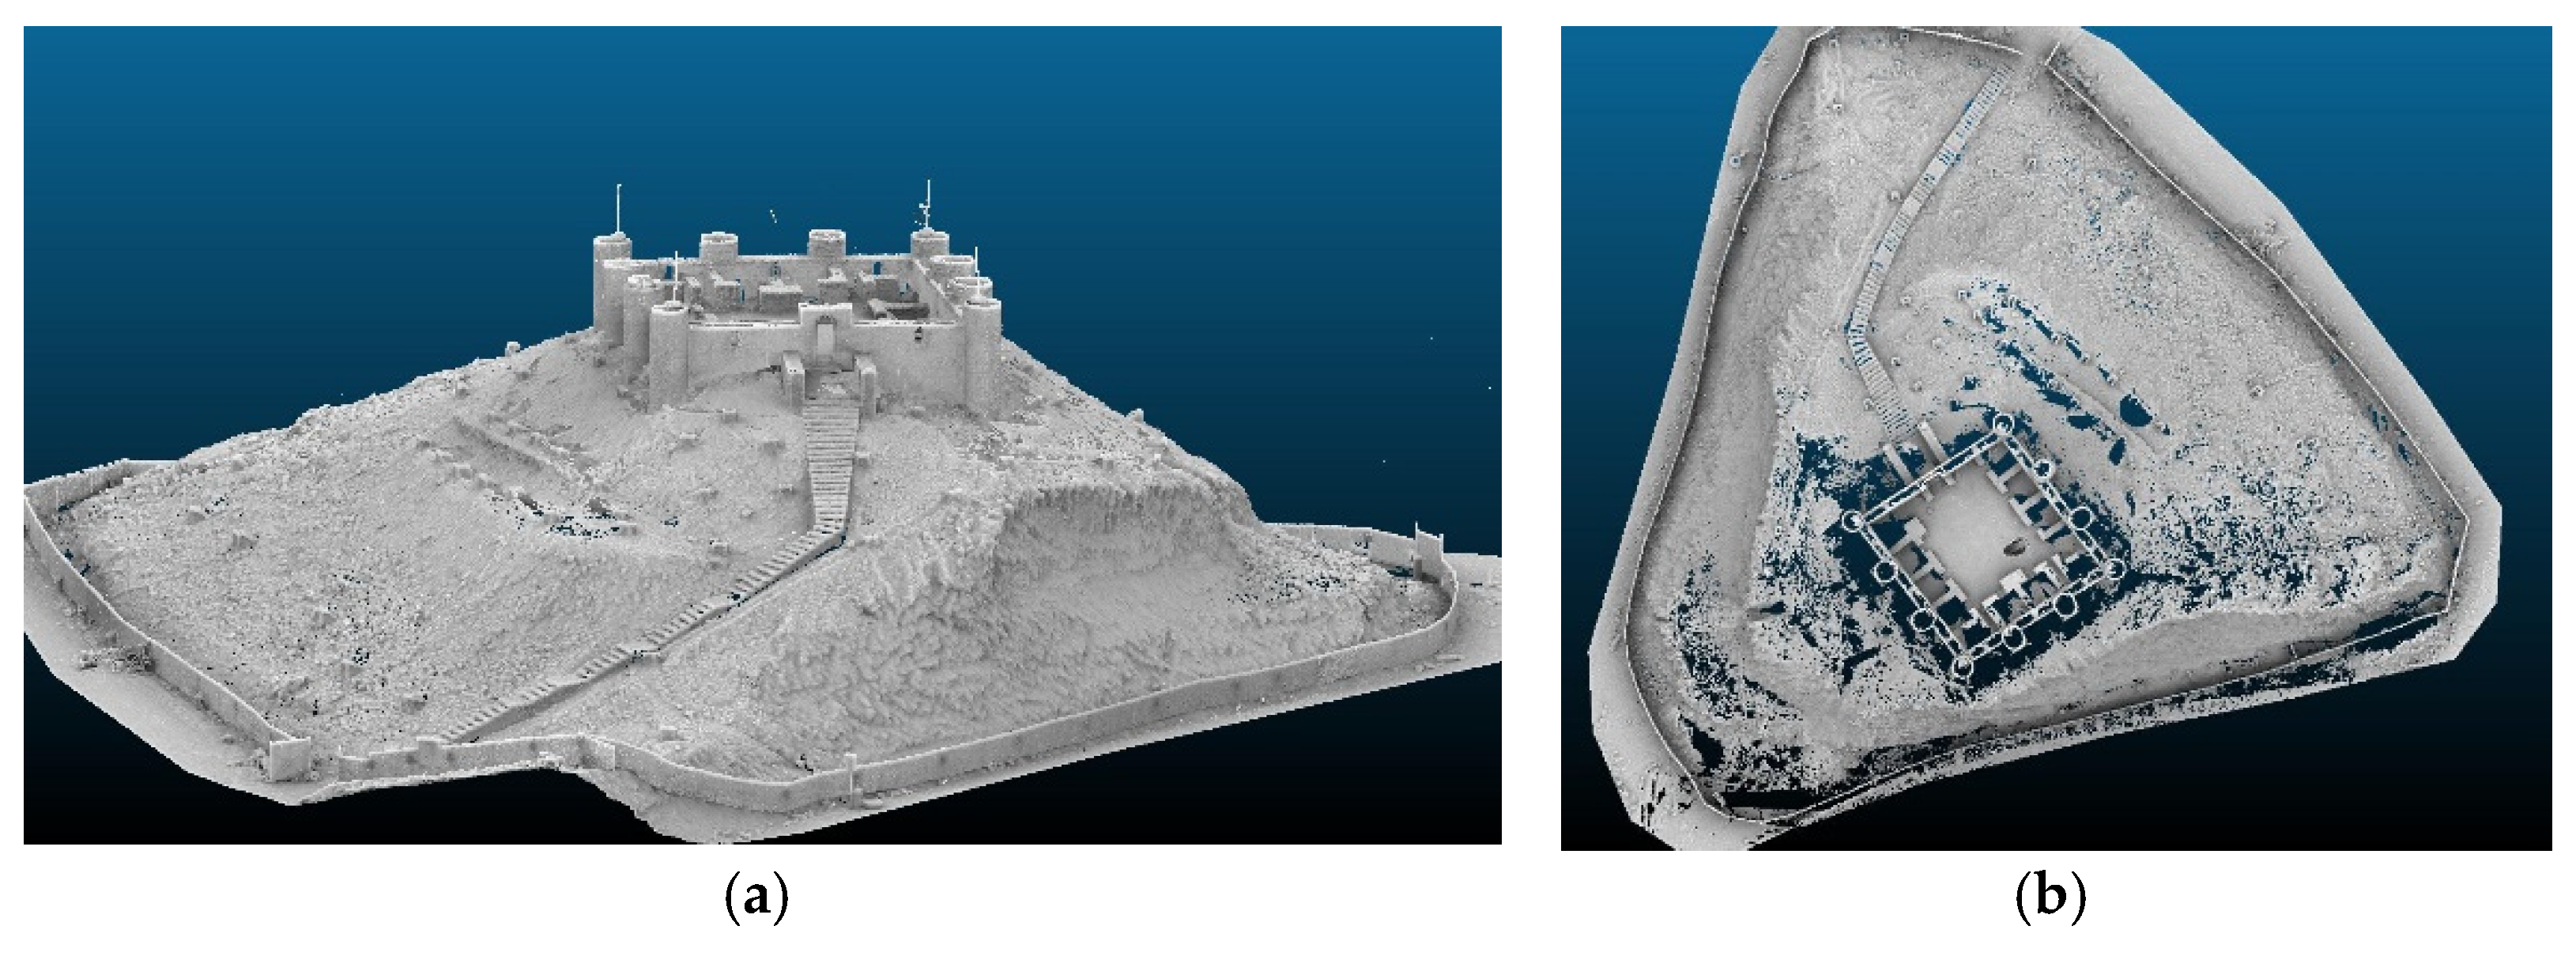
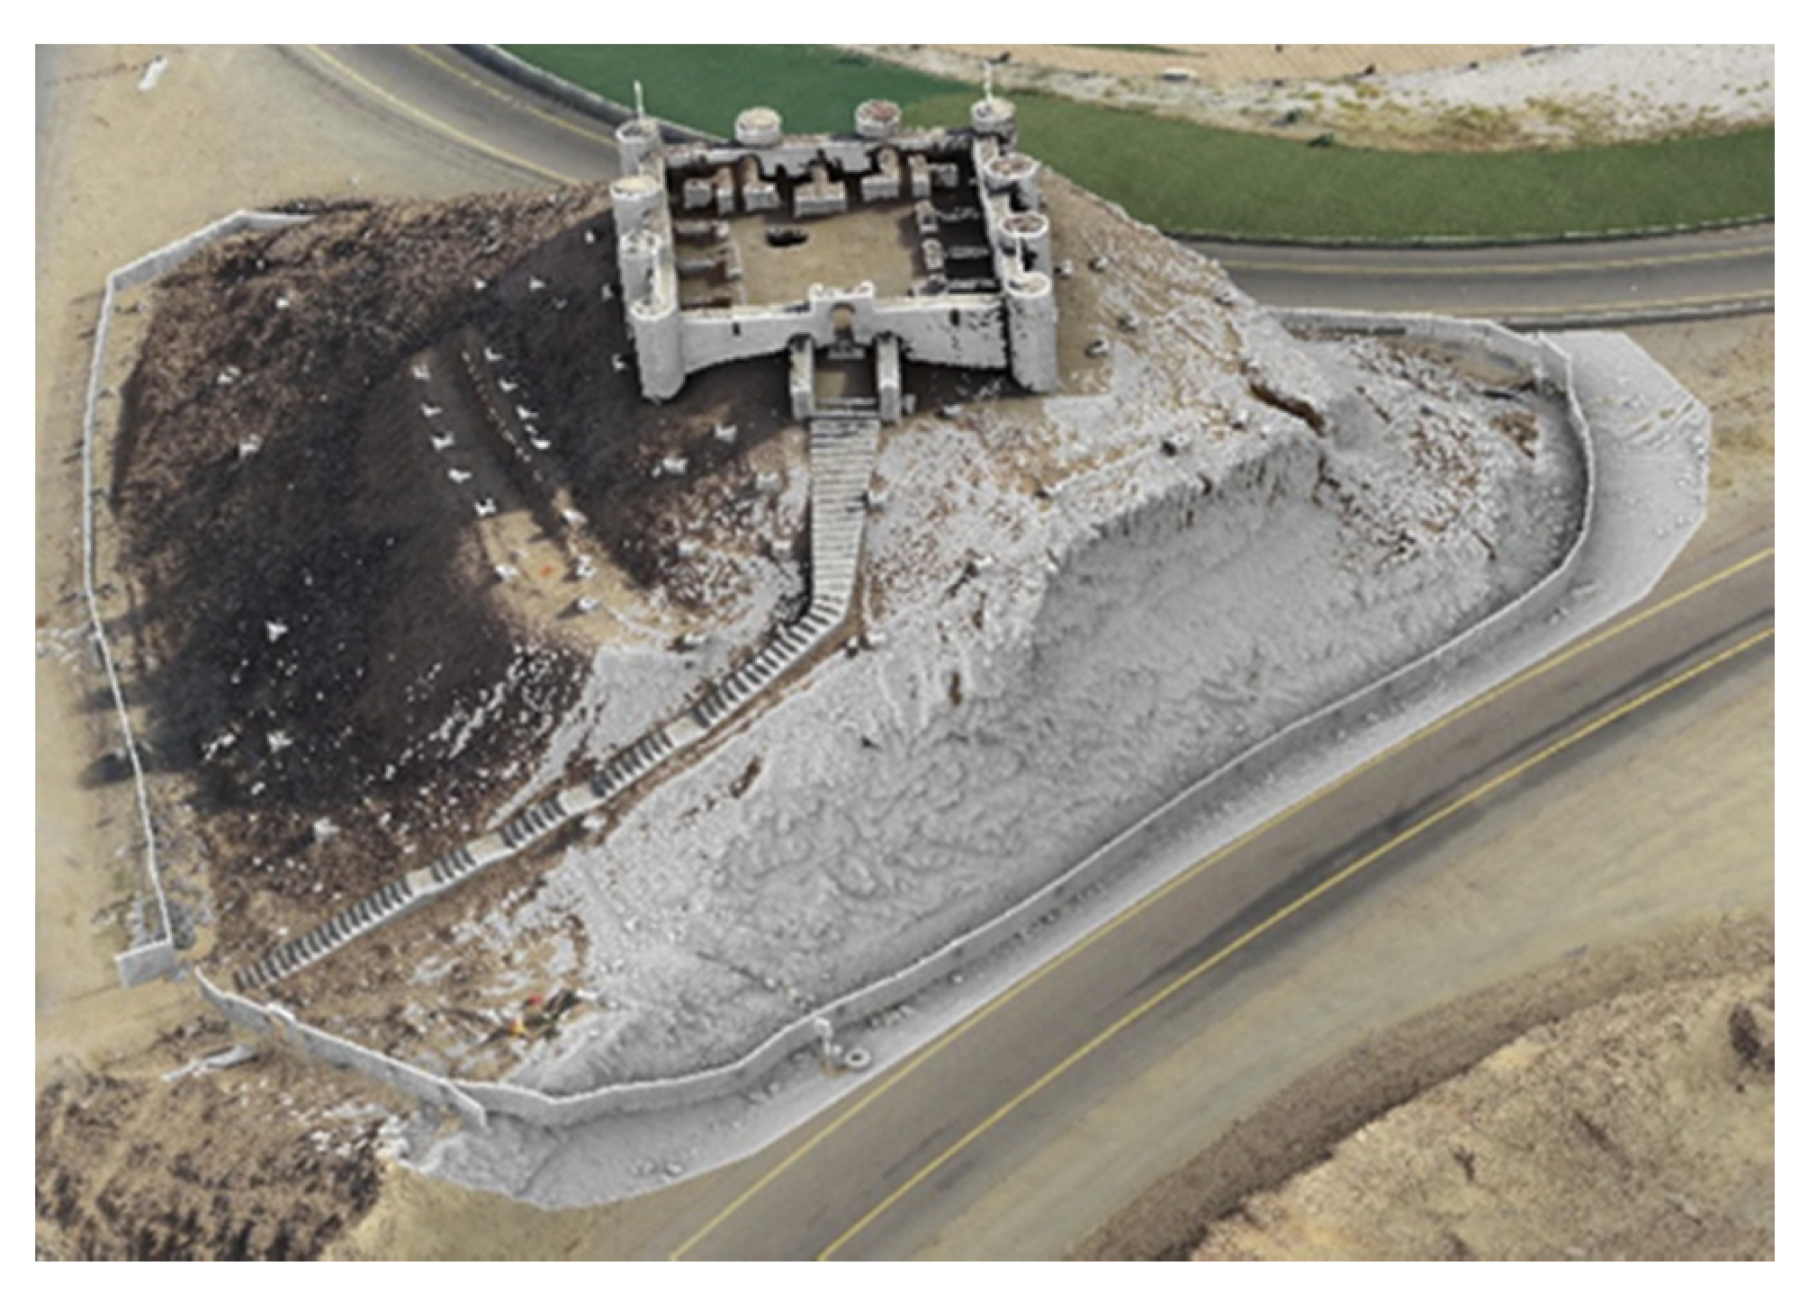
The work at the castle was guided by careful planning. The available orthoimagery and topographical elevations on Google Earth were analyzed to perform a preliminary evaluation of visibility for the optimal laser scanner pathway and positioning. The preliminary plan for scanner positions had to be changed in some cases for safety reasons; the adopted layout of scanner positions and control points is shown in Figure 8. The scanner was preferably positioned at locations where it was possible to accurately map large portions of the region of interest. Sixteen scans georeferenced in the national coordinate system (Ain el Abd UTM 37 North) were taken from outside and inside the castle, to provide potential 3D coverage of the site, as shown in Figure 11. Figure 12 shows the produced model, which had 124 million points. Here, the time gaps between the successive scans gave rise to varying lighting conditions, the homogeneity of the assembly of the different scans was poor, and the color jumping affected the appearance of the model. Another problem was shadow data (unsampled areas) from the hidden regions not within the laser field of view, such as the upper part of the castle, as shown in Figure 13.
A further campaign for the data voids presented in the TLS point clouds was conducted. Aerial photogrammetry with improved mobility and visibility was involved in mapping, to complement the point data. The combined approach has the benefit of significantly reducing data shadows, while also improving the quality of photographic images for photorealistic interpretation. For the aerial surveys, we used a Phantom 4RTK multi-copter rotary wing drone with D-RTK 2 Mobile Stations. It weighed 1391 g and travelled at a speed of 50 km per hour, equipped with an 18-megapixel digital camera. Despite the fact that the UAV could follow a pre-programmed trajectory and camera configuration, we chose to operate it manually. The reason for this was to ensure the aircraft’s stability and safety, which required direct flight control during wind gusts. The UAV took 220 pictures with 2.1 million points and a 10-cm average resolution for the interest region, at a low average flight height of 90 m. The positioning data observed by the on-board GPS antenna were georeferenced in the WGS84 geographic coordinate system. The focal length of the camera should be set when adjusting the steps used in SfM to simplify the bundle’s adjustment and self-calibration. For each part of the surface to be reconstructed, photos were taken to keep an 80–90% overlap. The production pipeline typically consisted of several phases. First, the parameters of the camera were determined by matching the corresponding features shared between the various viewpoints and overlapping regions. The bundle adjustment procedure was used to increase the precision of camera trajectory estimation, eliminate prediction errors, and avoid camera tracking error accumulation. The SfM method tried to retrieve the camera parameters and the scene’s sparse point cloud; then, pixel-wise matching was created by the dense point cloud. In Figure 14a, the UAV picture trajectories were represented. The digital surface model (DSM) of the castle with a 6.8-cm/pixel resolution is shown in Figure 14b. Figure 14c shows the final 3D model, where the missing and occluded areas of the TLS are sampled with UAV point clouds.
5. TLS and UAV Data Fusion
The most challenging aspect of multi-sensor data fusion is aligning and converting all point cloud data to the same coordinate system, i.e., the two datasets should be associated with the same spatial location. Besl and McKay [57] developed the Iterative Closest Point (ICP) algorithm, which is now a widely used method of dataset registration. The basic principle of ICP is to consider the nearest point to be a correlated point in the other cloud. It is carried out by iteratively converting and rotating a free dataset to a fixed one with six degrees of freedom, until the data transformation change converged within the required tolerance. The registration form was of a non-target nature that completely automated the process. The scans, on the other hand, should be positioned in a reasonable manner for the process to converge efficiently and quickly [58]. In this case, the homologous points were defined manually in order to calculate the initial motion between the two clouds, by using a set of correlated features in the corners and roof boundaries. The relationship between the TLS coordinate systems and image models is described in the translation and rotation parameters (Tx, Ty, Tz, ω Φ ƙ), shown in Figure 15. The ICP algorithm could then be used as a fine or local registration process. This procedure was repeated until all sensors’ point clouds were precisely registered. The photogrammetric data of the Hijazi architecture elements (Roshan and door) were combined with the TLS data; as shown in Figure 16. Figure 17 depicts the process of integrating the UAV model with the TLS data. The final textured model of the castle as a result of data integration is shown in Figure 18.
6. BIM Implementation
The noise in the point cloud was cleaned and filtered after combining the TLS and photogrammetry point clouds to improve scene interpretation (e.g., clean points of people, trees, cars, and furniture). After that, a BIM platform was used to index the optimized point cloud. The Autodesk Revit Architecture Software was used as the modeling tool. Revit uses two coordinate systems—the project base point, which represents the position of objects within the model’s local context, and the survey coordinate system, which provides a real-world context for the model. In order to insert the point clouds with their georeferenced coordinates, the first step was to obtain the coordinates of a selected point in the point cloud (for example, a point on the ground level) and assign the same coordinates to the survey point in Revit. The point cloud was then imported into Revit by selecting the shared coordinates option.
The building components were categorized into regular and irregular surfaces, in order to perform detailed building information modeling of the architectural elements. The classification criteria were based on the complexity of the shape, quantity, and type of detail. Simple or uniform objects, such as floors, roofs, columns, and walls, were considered regular surfaces. Hijazi architectural elements, such as doors and windows, were considered to be irregular surfaces because they have many details.
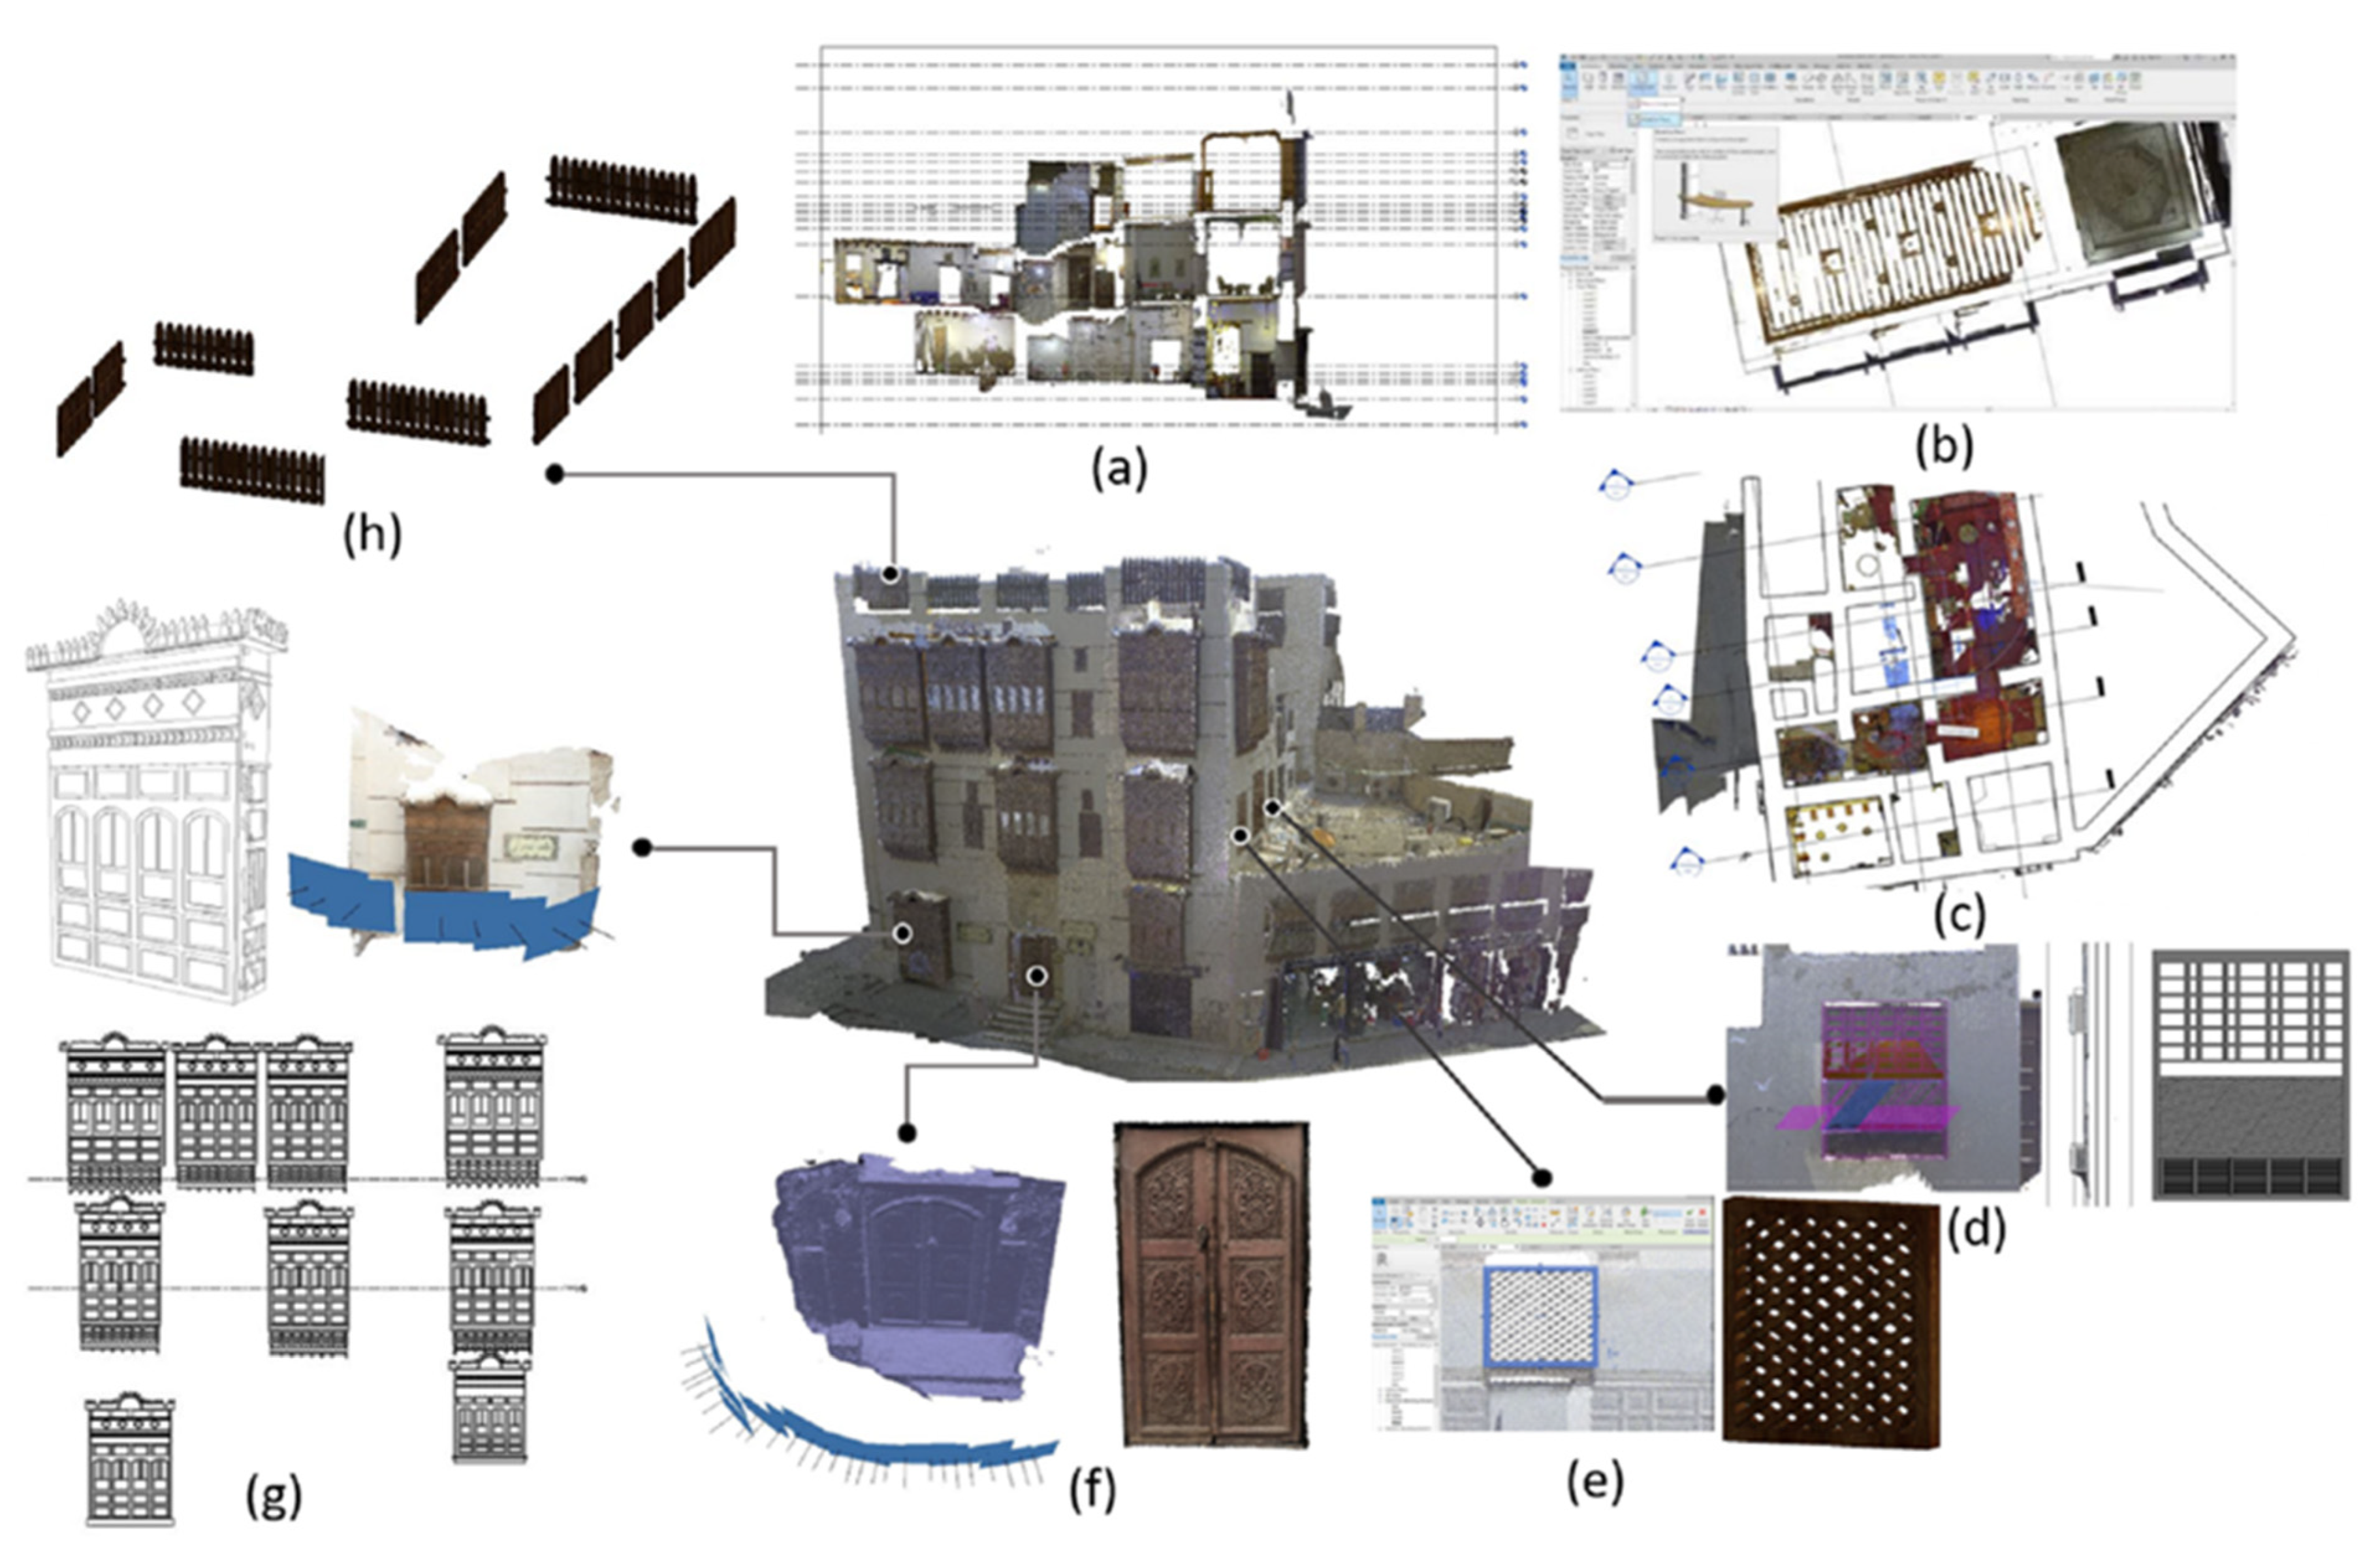
The point cloud for the Matbouli House Museum was first segmented to provide the plans and elevations. The point cloud was sliced longitudinally and transversally, as shown in Figure 19a,b. These cuts were used to demonstrate the structure’s internal layout and composition, and to determine the dimensions of the elements. Subsequently, a set of grids at a given level were created on the planimetry; shown in Figure 19c. These grids, which run along the center of the point boundary regions, define the outline of the cloud surfaces. The resulting point cloud views was used to create a profile that would represent the model’s levels at various heights, so that the vertical distances between two points could be estimated.
Once these actions were completed, the planes, vertical grid sections, and regular simple objects were manually traced on the point cloud. The point cloud was characterized by closed polygons to be used as a guide for modeling the various architectural elements, as depicted in Figure 19a–e,h. Where the geometry of a given surface was regular and simple (walls, floors, columns, arches, and stairs), modeling was performed using the basic tools of the BIM platform and modified to properly describe the current component, as shown in Figure 20.
However, when the surface geometry was irregular or complex, the point clouds obtained from the imaging point cloud survey could provide details about the object components, allowing the correct dimensions and sizes to be estimated, as shown in Figure 19f,g and Figure 21. Modeling mainly began with the segmentation of the point cloud representing the object. Secondly, simple drawing tools, such as polyline, were used to draw the outline of the object and identify all of its components—frames, exact edges, and sophisticated decorative items. The details depended on the precision required for the final 3D models to be achieved. The material, texture, and historical data of the modeled elements were then inserted into the HBIM library. The library was linked to the different elements’ database, thus enabling users to modify the shape of the architectural elements by adjusting the corresponding parameters. This library is regarded as a practical solution for repetitive 3D modeling of a wide range of buildings with similar forms without the need to start from scratch.
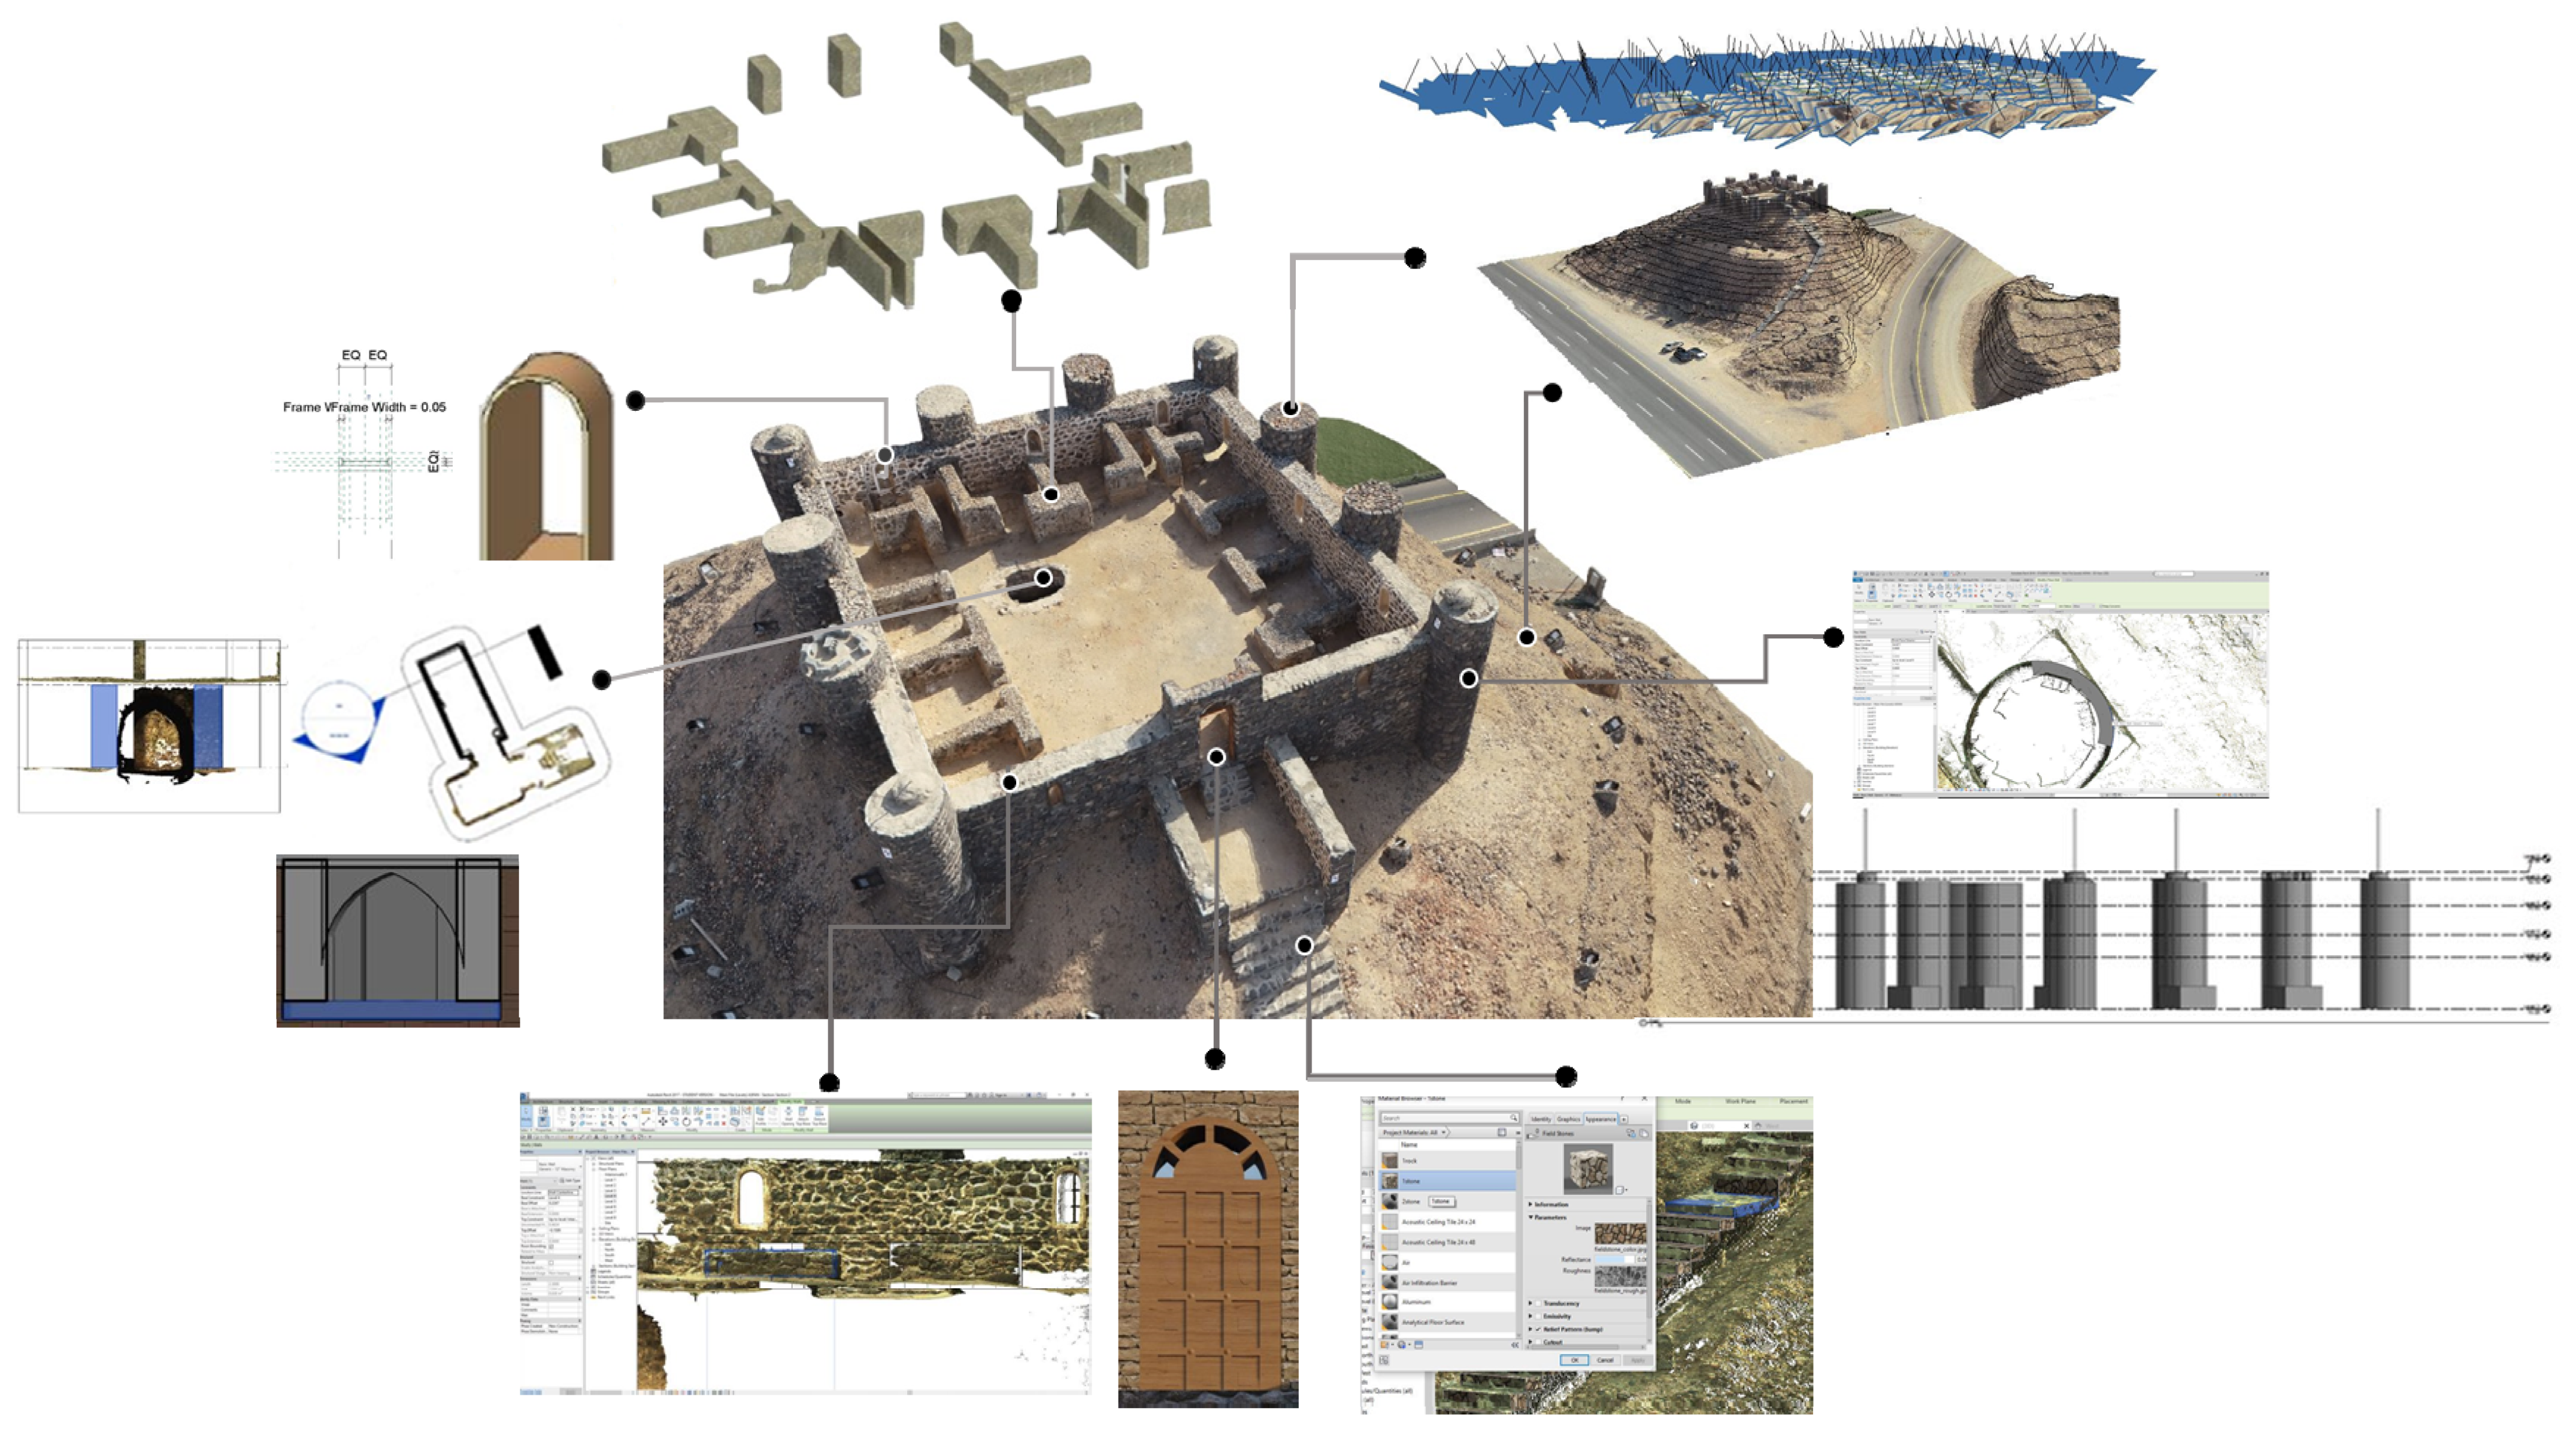
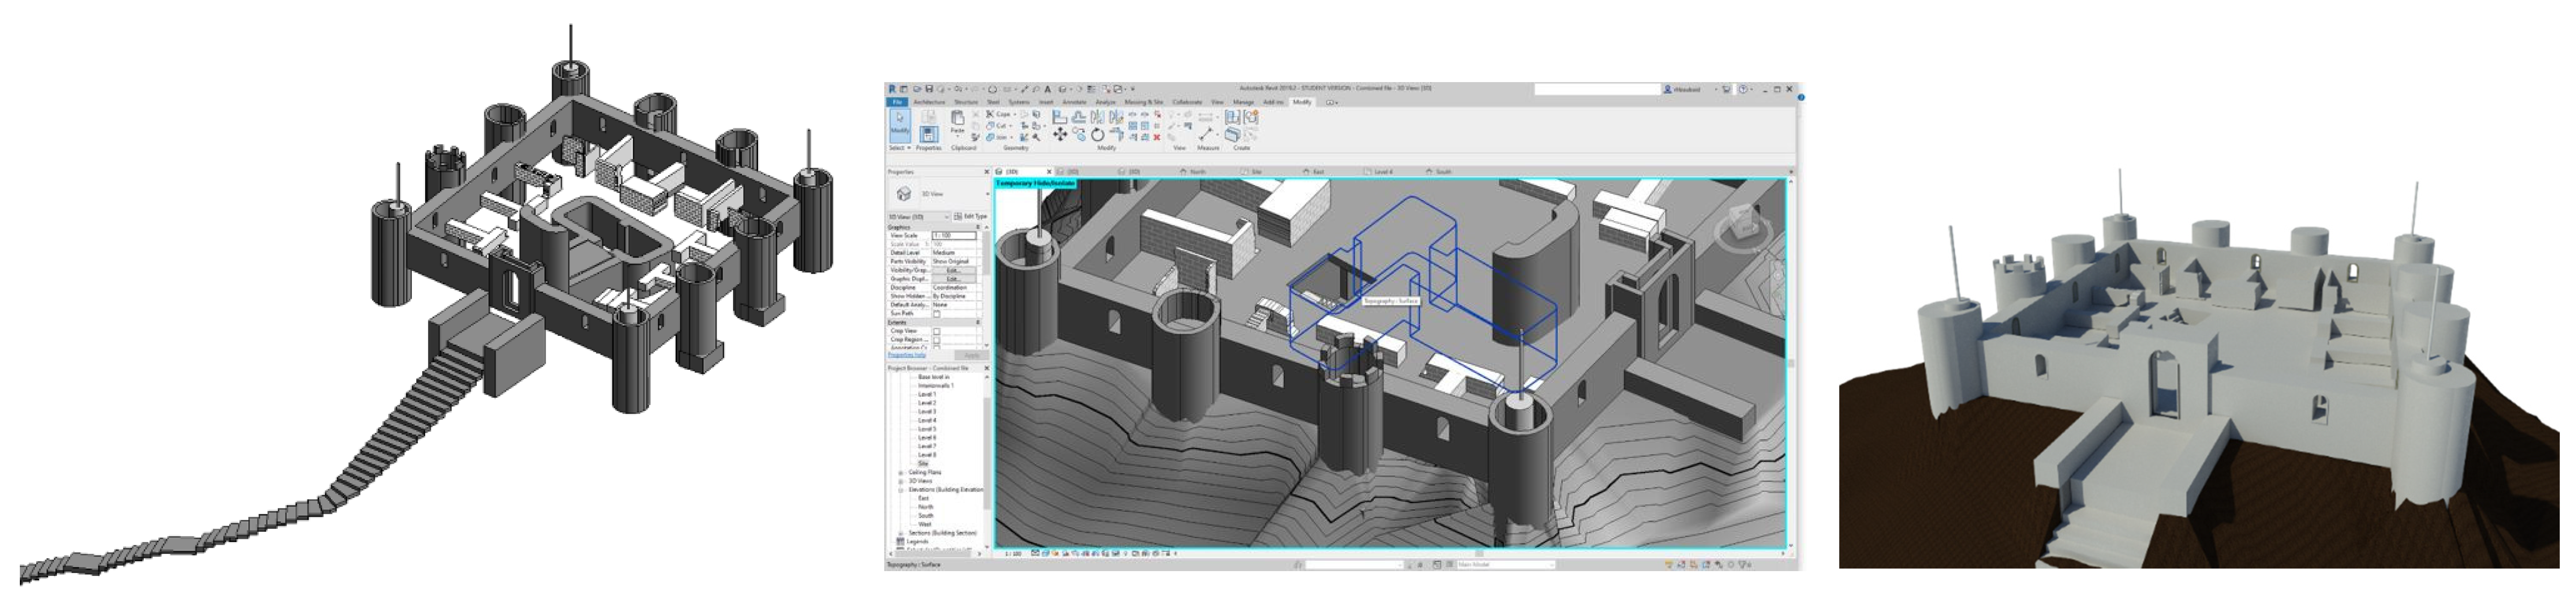
The Asfan Castle’s architectural elements were modeled using the previously described method. The point cloud was segmented to provide sections and elevations as a map for finding and drawing different library objects, such as walls, towers, arches, vaults, floors, and other accessibility and interior features, as shown in Figure 22. In the tower modeling example, it was essential to incorporate length, depth, internal and external height, base dimensions, and external and upper widths, in order to provide a parametric function that could be modified in all its components. Another unique feature was the staircase. The investigation started with the development of the exact 3D contour of the structure and was then transformed into 3D elements for each step of the stairs, taking into consideration the height increments; the resultant model is shown in Figure 23.
7. Discussion
The key challenges in the building information modeling of existing building components are the uniqueness of their artifacts and their complexity, which has a major impact on the 3D data acquisition and organization. Capturing methods such as TLS can help to improve the level of detail of each recorded component and determine its location, size, physical attributes, and, in particular, its shapes and irregularities. Accurate 3D mapping is a challenge due to the positioning of the points and the detection of the edges of the laser data. For this purpose, the present investigation presents a workflow using both TLS and imagery datasets to enhance the digitization of built heritage sites for the detailed HBIM plotting. The Matbouli House Museum and the Asfan Castle are two cases that were used to demonstrate the validity of our methodology. After defining the proposed methods and evaluating the results obtained in the experiments, it is important to summarize their contribution, as compared to the other state-of-the-art workflows used for HBIM.
1. As stated in Section 2, several methods were developed within the scientific community to build workflows to enhance the interpretation and plotting of complex parametric objects in laser point clouds using non-metric images [6,54]. Tracing object features in 2D images that have no scale information will not ensure the correct tracing and positioning of object shapes in the corresponding laser data. In comparison, the proposed approach identifies complex and irregular objects in the context of a scaled dense point cloud that is effectively blended with TLS data.
2. Some other approaches [34,55] used SfM photogrammetry for capturing occluded areas or specific building parts. Although these elements are georeferenced to the TLS model, individual, separate BIM modeling of the object surfaces would result in a loss of topological information needed for structure component analysis. Therefore, the proposed workflow processes and manages the BIM elements in their actual position in the built environment. This creates intelligent interactions between the architectural components that make up the model and ensures the efficient study of buildings for conservation and restoration activities.
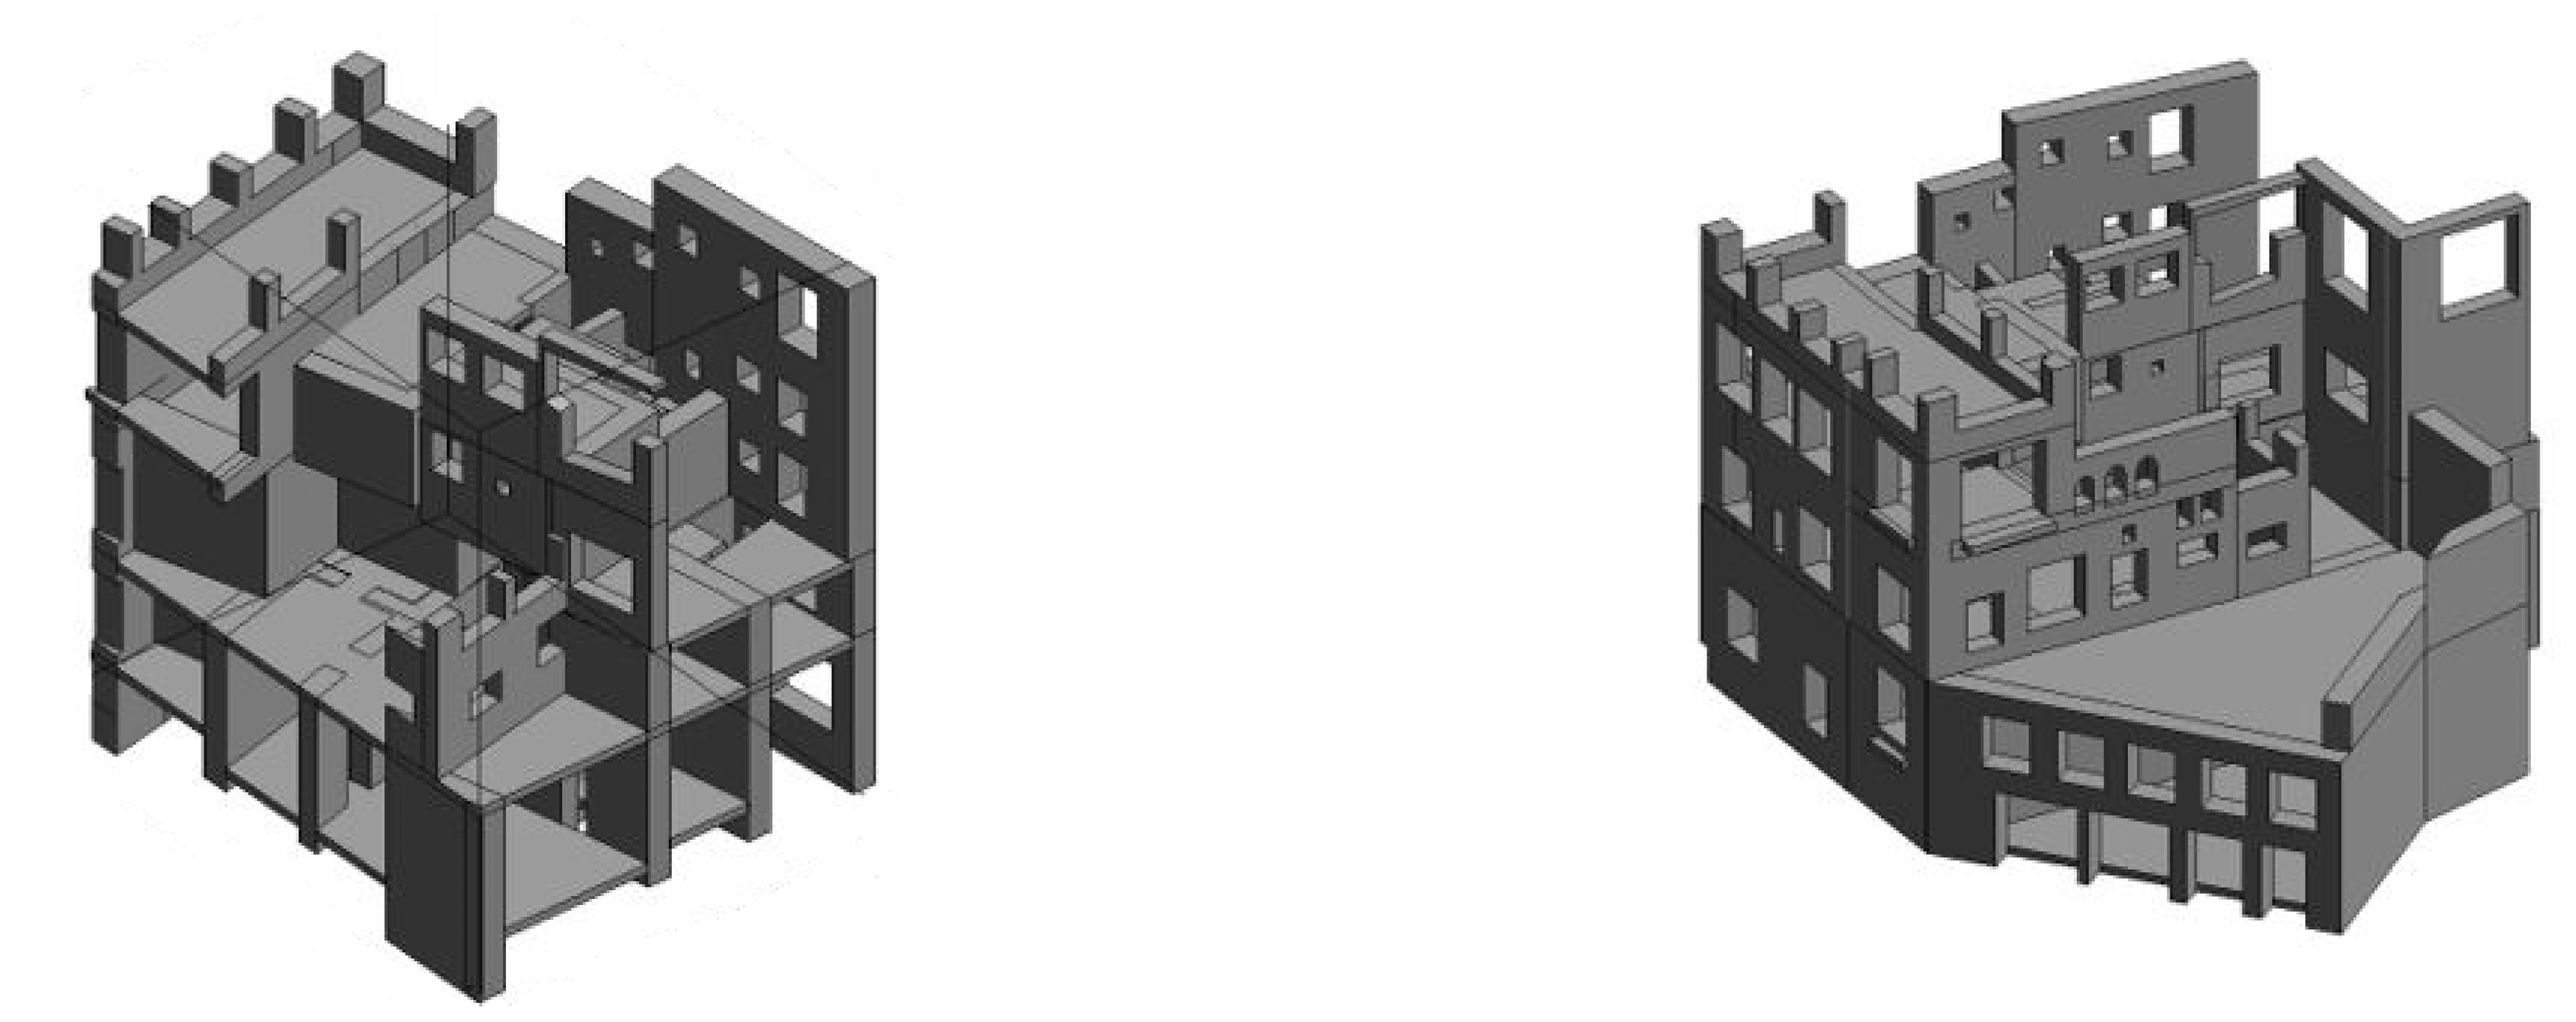
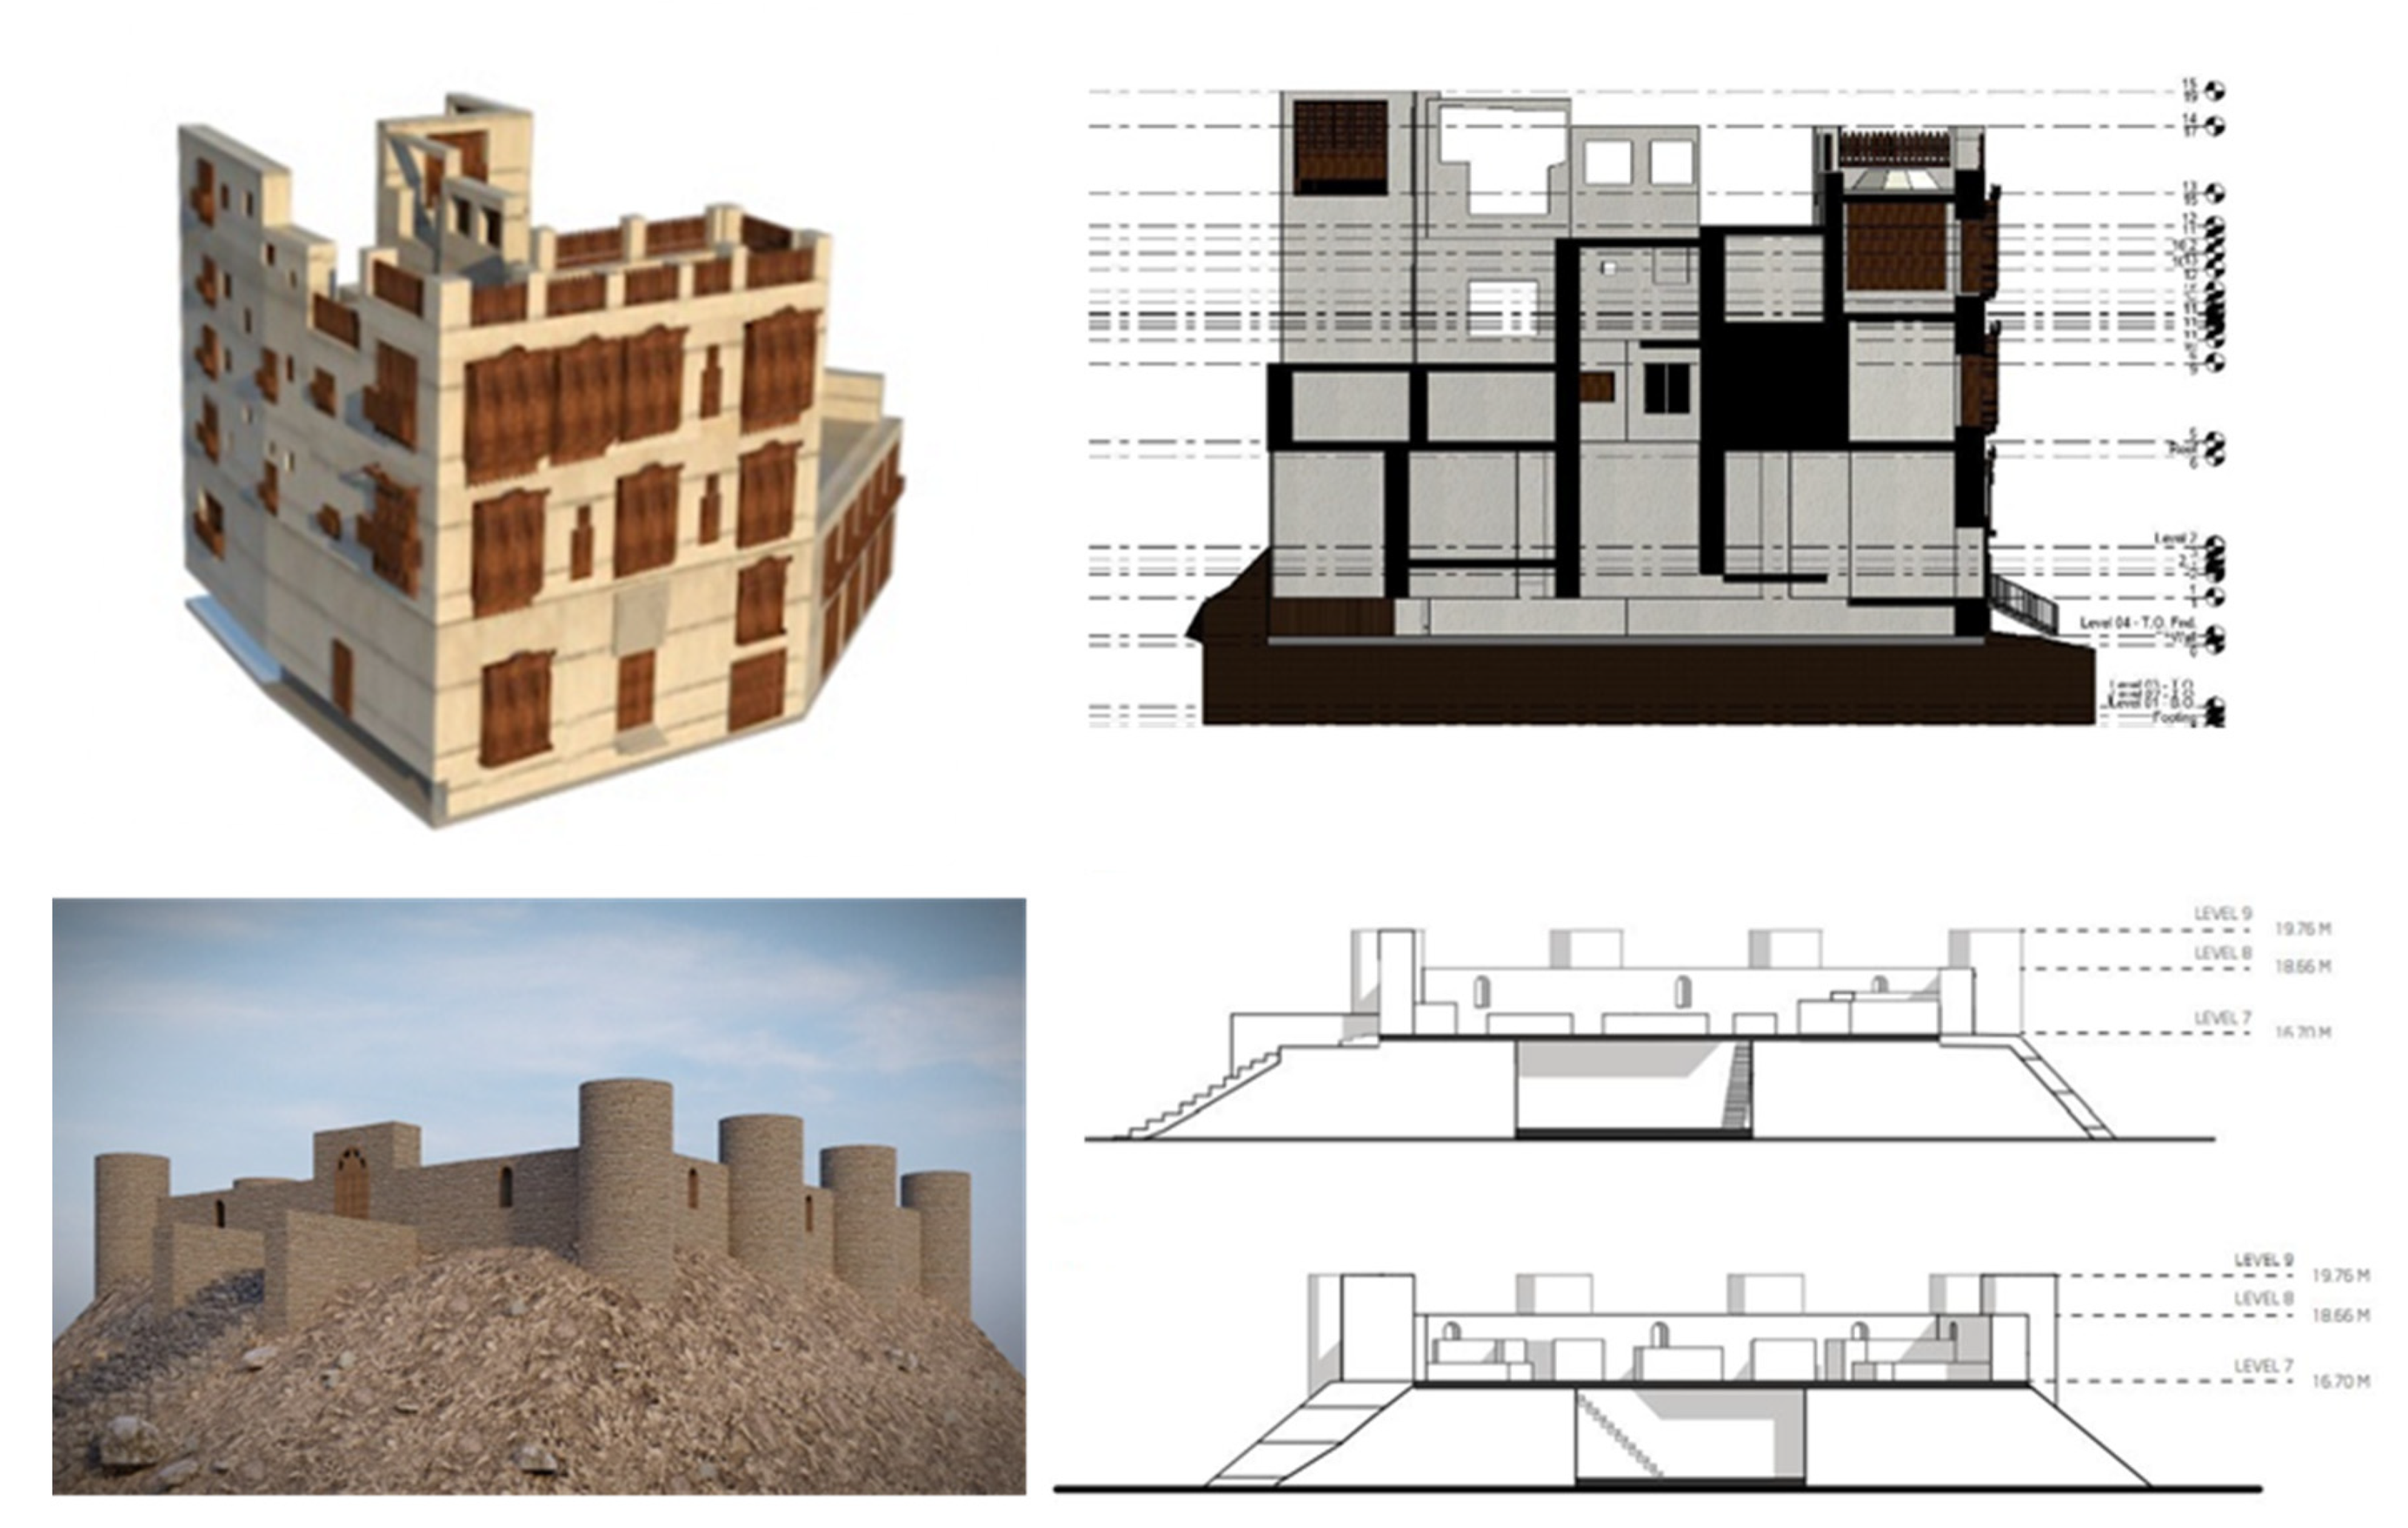
However, in the model design process, vertical and horizontal elements are not time or labor intensive, but Hijazi elements and surfaces with more complicated geometry entail complex and manual operations. Furthermore, occlusions and the partial point coverage problem have an impact on the conversion process (e.g., the interior surfaces that are not visible from the laser scanners or cameras would have poor point coverage). As a result, the walls, floors, columns, and other construction elements were carefully constructed to ensure that the intersection was appropriate. After the elements were modeled with their attributes, the full HBIM model enabled better spatial data representation and management. Furthermore, these components could be used to automatically produce technical documents such as sections, elevations, and floor plans. Figure 24 depicts the longitudinal cross-sections created from the BIM models. Switching between 3D and 2D documentation and layouts is useful for architects and conservators.
8. Conclusions
Heritage building information modeling provides a common platform for engineers, architects, historians, and public authorities to integrate and access spatial information and attribution data. The task, here, is to reconstruct and model the as-built conditions of architectural elements. The challenges of modeling the occluded parts, edge borders, and gilded surfaces might not be adequately addressed when plotting a parametric heritage building information model using only laser data. In this context, the proposed work presents an efficient workflow combining TLS and photogrammetry point clouds to ensure representation of the complete geometrical reality of the structure with the required level of detail. During the modeling phase, it is necessary to understand the different architectural components from a typological context, allowing for the advanced analysis necessary for the conservation and management of buildings. For this purpose, the proposed workflow models HBIM objects with their actual 3D position within the construction system. Complex and occluded objects are modeled using photogrammetry in the context of a scaled dense point cloud that is effectively blended with TLS data. The proposed case studies of the Matbouli House Museum and the Asfan Castle appear to be good examples. A library of parametric BIM elements, including traditional architectural features of the Hejazi style, was developed during the project’s development and would be available for future use. Future studies should explore the usability of the proposed workflow for automating the HBIM process using hybrid point clouds. In order to automate the parametric reconstruction of complex objects, a reliable approach for intelligent geometric feature detection and recognition is required. New algorithms based on the intensity values of color images might be used in this context to automatically segment and quantify the perimeter of the object shape in the corresponding point cloud.
Author Contributions
Conceptualization, Yahya Alshawabkeh, Ahmad Baik and Yehia Miky; methodology, Yahya Alshawabkeh, Ahmad Baik and Yehia Miky; software, Yahya Alshawabkeh and Ahmad Baik; validation, Yahya Alshawabkeh and Ahmad Baik and Yehia Miky; resources, Ahmad Baik; data curation, Yahya Alshawabkeh; writing—original draft preparation, Yahya Alshawabkeh and Yehia Miky; writing—review and editing, Yahya Alshawabkeh, Ahmad Baik and Yehia Miky; All authors have read and agreed to the published version of the manuscript.
Funding
This research received no external funding.
Acknowledgments
The authors would like to thank the reviewers for their constructive comments that greatly contributed to improve the manuscript.
Conflicts of Interest
The authors declare no conflict of interest.
References
- Andriasyan, M.; Moyano, J.; Nieto-Julián, J.E.; Antón, D. From Point Cloud Data to Building Information Modelling: An Automatic Parametric Workflow for Heritage. Remote Sens. 2020, 12, 1094. [Google Scholar] [CrossRef] [Green Version]
- Rocha, G.; Mateus, L.; Fernández, J.; Ferreira, V. A Scan-to-BIM Methodology Applied to Heritage Buildings. Heritage 2020, 3, 4. [Google Scholar] [CrossRef] [Green Version]
- Jo, Y.H.; Hong, S. Three-Dimensional Digital Documentation of Cultural Heritage Site Based on the Convergence of Terrestrial Laser Scanning and Unmanned Aerial Vehicle Photogrammetry. ISPRS Int. J. Geo-Inf. 2019, 8, 53. [Google Scholar] [CrossRef] [Green Version]
- Anil, E.B.; Tang, P.; Akinci, B.; Huber, D. Deviation analysis method for the assessment of the quality of the as-is Building Information Models generated from point cloud data. Autom. Constr. 2013, 35, 507–516. [Google Scholar] [CrossRef]
- Larsen, K.E.; Lattke, F.; Ott, S.; Winter, S. Surveying and digital workflow in energy performance retrofit projects using prefabricated elements. Autom. Constr. 2011, 20, 999–1011. [Google Scholar] [CrossRef]
- Sztwiertnia, D.; Ochałek, A.; Tama, A.; Lewińska, P. HBIM (heritage Building Information Modell) of the Wang Stave Church in Karpacz–Case Study. Int. J. Arch. Herit. 2019, 5238. [Google Scholar] [CrossRef]
- Tang, P.; Akinci, B.; Huber, D. Quantification of edge loss of laser scanned data at spatial discontinuities. Autom. Constr. 2009, 18, 1070–1083. [Google Scholar] [CrossRef]
- Mechelke, K.; Kersten, T.P.; Lindstaedt, M. Comparative investigations into the accuracy behaviour of the new generation of terrestrial laser scanning systems. Opt. 3D Meas. Tech. VIII 2007, 1, 319–327. [Google Scholar]
- Meschini, A.; Petrucci, E.; Rossi, D.; Sicuranza, F. Point cloud-based survey for cultural heritage–An experience of integrated use of range-based and image-based technology for the San Francesco convent in Monterubbiano. ISPRS-Int. Arch. Photogramm. Remote Sens. Spat. Inf. Sci. 2014, 40, 413–420. [Google Scholar] [CrossRef] [Green Version]
- Dostal, C.; Yamafune, K. Photogrammetric texture mapping: A method for increasing the Fidelity of 3D models of cultural heritage materials. J. Archaeol. Sci. Rep. 2018, 18, 430–436. [Google Scholar] [CrossRef]
- Alshawabkeh, Y. Linear feature extraction from point cloud using color information. Herit. Sci. 2020, 8, 3826. [Google Scholar] [CrossRef]
- Banfi, F. HBIM, 3D drawing and virtual reality for archaeological sites and ancient ruins. Virtual Archaeol. Rev. 2020, 11, 16–33. [Google Scholar] [CrossRef]
- Themistocleous, K.; Agapiou, A.; Hadjimitsis, D. 3D documentation and bim modeling of cultural heritage structures using uavs: The case of the foinikaria church. ISPRS-Int. Arch. Photogramm. Remote Sens. Spat. Inf. Sci. 2016, 42, 45–49. [Google Scholar] [CrossRef] [Green Version]
- Tscharf, A.; Rumpler, M.; Fraundorfer, F.; Mayer, G.; Bischof, H. On the use of uavs in mining and archaeology—Geo-accurate 3d reconstructions using various platforms and terrestrial views. ISPRS Ann. Photogramm. Remote Sens. Spat. Inf. Sci. 2015, 2, 15–22. [Google Scholar] [CrossRef] [Green Version]
- Mikita, T.; Balková, M.; Bajer, A.; Cibulka, M.; Patočka, Z. Comparison of Different Remote Sensing Methods for 3D Modeling of Small Rock Outcrops. Sensors 2020, 20, 1663. [Google Scholar] [CrossRef] [Green Version]
- Arza-García, M.; Gil-Docampo, M.; Ortiz-Sanz, J. A hybrid photogrammetry approach for archaeological sites: Block alignment issues in a case study (the Roman camp of A Cidadela). J. Cult. Herit. 2019, 38, 195–203. [Google Scholar] [CrossRef]
- Remondino, F.; Nocerino, E.; Toschi, I.; Menna, F. A critical review of automated photogrammetric processing of large datasets. ISPRS-Int. Arch. Photogramm. Remote Sens. Spat. Inf. Sci. 2017, 42, 591–599. [Google Scholar] [CrossRef] [Green Version]
- Chiabrando, F.; Sammartano, G.; Spanò, A.; Spreafico, A. Hybrid 3D Models: When Geomatics Innovations Meet Extensive Built Heritage Complexes. ISPRS Int. J. Geo-Inf. 2019, 8, 124. [Google Scholar] [CrossRef] [Green Version]
- Barazzetti, L.; Banfi, F.; Brumana, R.; Gusmeroli, G.; Previtali, M.; Schiantarelli, G. Cloud-to-BIM-to-FEM: Structural simulation with accurate historic BIM from laser scans. Simul. Model. Pr. Theory 2015, 57, 71–87. [Google Scholar] [CrossRef]
- Dore, C.; Murphy, M.; McCarthy, S.; Brechin, F.; Casidy, C.; Dirix, E. Structural Simulations and Conservation Analysis -Historic Building Information Model (HBIM). ISPRS-Int. Arch. Photogramm. Remote Sens. Spat. Inf. Sci. 2015, 40, 351–357. [Google Scholar] [CrossRef] [Green Version]
- Korumaz, M.; Betti, M.; Conti, A.; Tucci, G.; Bartoli, G.; Bonora, V.; Korumaz, A.G.; Fiorini, L. An integrated Terrestrial Laser Scanner (TLS), Deviation Analysis (DA) and Finite Element (FE) approach for health assessment of historical structures. A minaret case study. Eng. Struct. 2017, 153, 224–238. [Google Scholar] [CrossRef]
- Abbate, E.; Invernizzi, S.; Spanò, A. HBIM parametric modelling from clouds to perform structural analyses based on finite elements: A case study on a parabolic concrete vault. Appl. Geomat. 2020. [Google Scholar] [CrossRef]
- Altuntas, C.; Yildiz, F.; Scaioni, M. Laser Scanning and Data Integration for Three-Dimensional Digital Recording of Complex Historical Structures: The Case of Mevlana Museum. ISPRS Int. J. Geo-Inf. 2016, 5, 18. [Google Scholar] [CrossRef] [Green Version]
- Alshawabkeh, Y. Color and Laser Data as a Complementary Approach for Heritage Documentation. Remote Sens. 2020, 12, 3465. [Google Scholar] [CrossRef]
- Pierdicca, R.; Paolanti, M.; Matrone, F.; Martini, M.; Morbidoni, C.; Malinverni, E.S.; Frontoni, E.; Lingua, A.M. Point Cloud Semantic Segmentation Using a Deep Learning Framework for Cultural Heritage. Remote Sens. 2020, 12, 1005. [Google Scholar] [CrossRef] [Green Version]
- Fonnet, A.; Alves, N.; Sousa, N.; Guevara, M.; Magalhães, L. Heritage BIM Integration with Mixed Reality for Building Preventive Maintenance. In Proceedings of the 24th Encontro Português de Computação Gráfica e Interação (EPCGI 2017), Guimarães, Portugal, 12 October 2017; pp. 1–7. [Google Scholar]
- Conti, A.; Fiorini, L.; Massaro, R.; Santoni, C.; Tucci, G. HBIM for the preservation of a historic infrastructure: The Carlo III bridge of the Carolino Aqueduct. Appl. Geomat. 2020, 1044. [Google Scholar] [CrossRef]
- Bacci, G.; Bertolini, F.; Bevilacqua, M.G.; Caroti, G.; Zaragoza, I.M.-E.; Martino, M.; Piemonte, A. HBIM methodologies for the architectural restoration. the case of the ex-church of san quirico all’olivo in lucca, tuscany. ISPRS-Int. Arch. Photogramm. Remote Sens. Spat. Inf. Sci. 2019, 42, 121–126. [Google Scholar] [CrossRef] [Green Version]
- Tsilimantou, E.; Delegou, E.T.; Nikitakos, I.A.; Ioannidis, C.; Moropoulou, A. GIS and BIM as Integrated Digital Environments for Modeling and Monitoring of Historic Buildings. Appl. Sci. 2020, 10, 1078. [Google Scholar] [CrossRef] [Green Version]
- Antón, D.; Pineda, P.; Medjdoub, B.; Iranzo, A. As-Built 3D Heritage City Modelling to Support Numerical Structural Analysis: Application to the Assessment of an Archaeological Remain. Remote Sens. 2019, 11, 1276. [Google Scholar] [CrossRef] [Green Version]
- Tucci, G.; Conti, A.; Fiorini, L.; Corongiu, M.; Valdambrini, N.; Matta, C. M-BIM: A new tool for the Galleria dell’Accademia di Firenze. Virtual Archaeol. Rev. 2019, 10, 40–55. [Google Scholar] [CrossRef]
- Godinho, M.; Machete, R.; Ponte, M.; Falcão, A.P.; Gonçalves, A.B.; Bento, R. BIM as a resource in heritage management: An application for the National Palace of Sintra, Portugal. J. Cult. Herit. 2020, 43, 153–162. [Google Scholar] [CrossRef]
- Acampa, G.; Forte, F.; De Paola, P.B.I.M. Models and Evaluations. In Values and Functions for Future Cities. Green Energy and Technology; Mondini, G., Oppio, A., Stanghellini, S., Bottero, M., Abastante, F., Eds.; Springer: Cham, Switzerland, 2020. [Google Scholar] [CrossRef]
- Banfi, F.; Brumana, R.; Stanga, C. Extended reality and informative models for the architectural heritage: From scan-to-BIM process to virtual and augmented reality. Virtual Archaeol. Rev. 2019, 10, 14–30. [Google Scholar] [CrossRef]
- Adami, A.; Scala, B.; Spezzoni, A. Modelling and accuracy in a bim environment for planned conservation: The apartment of troia of Giulio Romano. ISPRS-Int. Arch. Photogramm. Remote Sens. Spat. Inf. Sci. 2017, 42, 17–23. [Google Scholar] [CrossRef] [Green Version]
- Díaz-Vilariño, L.; Khoshelham, K.; Martínez-Sánchez, J.; Arias, P. 3D Modeling of Building Indoor Spaces and Closed Doors from Imagery and Point Clouds. Sensors 2015, 15, 3491–3512. [Google Scholar] [CrossRef] [PubMed] [Green Version]
- Maalek, R.; Lichti, D.D.; Ruwanpura, J.Y. Automatic Recognition of Common Structural Elements from Point Clouds for Automated Progress Monitoring and Dimensional Quality Control in Reinforced Concrete Construction. Remote Sens. 2019, 11, 1102. [Google Scholar] [CrossRef] [Green Version]
- Diara, F.; Rinaudo, F. IFC Classification for FOSS HBIM: Open Issues and a Schema Proposal for Cultural Heritage Assets. Appl. Sci. 2020, 10, 8320. [Google Scholar] [CrossRef]
- Prizeman, O.E.C. HBIM and matching techniques: Considerations for late nineteenth- and early twentieth-century buildings. J. Arch. Conserv. 2015, 21, 145–159. [Google Scholar] [CrossRef]
- Prieto, S.A.; Adán, A.; Quintana, B. Preparation and enhancement of 3D laser scanner data for realistic coloured BIM models. Vis. Comput. 2018, 36, 113–126. [Google Scholar] [CrossRef]
- Volk, R.; Stengel, J.; Schultmann, F. Building Information Modeling (BIM) for existing buildings—Literature review and future needs. Autom. Constr. 2014, 38, 109–127. [Google Scholar] [CrossRef] [Green Version]
- Dore, C.; Murphy, M. Integration of Historic Building Information Modeling (HBIM) and 3D GIS for Recording and Managing Cultural Heritage Sites. In Proceedings of the 2012 18th International Conference on Virtual Systems and Multimedia, Milan, Italy, 2–5 September 2012; pp. 369–376. [Google Scholar]
- López, F.J.; Lerones, P.M.; Llamas, J.; Gómez-García-Bermejo, J.; Zalama, E. A Review of Heritage Building Information Modeling (H-BIM). Multimodal Technol. Interact. 2018, 2, 21. [Google Scholar] [CrossRef] [Green Version]
- Brumana, R.; Banfi, F.; Cantini, L.; Previtali, M.; Della Torre, S. Hbim level of detail-geometry-Accuracy and survey analysis for architectural preservation. In Proceedings of the 2nd International Conference of Geomatics and Restoration (GEORES 2019), Milan, Italy, 8–10 May 2019; Copernicus GmbH: Göttingen, Germany, 2019; pp. 293–299. [Google Scholar]
- Baik, A.; Boehm, J. Building information modelling for historical building Historic Jeddah-Saudi Arabia. 2015 Digital Herit. 2015, 2, 125–128. [Google Scholar] [CrossRef] [Green Version]
- Oreni, D.; Brumana, R.; Georgopoulos, A.P.; Cuca, B. HBIM for conservation and management of built heritage: Towards a library of vaults and wooden bean floors. ISPRS Ann. Photogramm. Remote Sens. Spat. Inf. Sci. 2013, 2, 215–221. [Google Scholar] [CrossRef] [Green Version]
- Nieto-Julián, J.E.; Antón, D.; Moyano, J.J. Implementation and Management of Structural Deformations into Historic Building Information Models. Int. J. Arch. Herit. 2020, 14, 1384–1397. [Google Scholar] [CrossRef]
- Fryskowska, A.; Stachelek, J. A no-reference method of geometric content quality analysis of 3D models generated from laser scanning point clouds for hBIM. J. Cult. Herit. 2018, 34, 95–108. [Google Scholar] [CrossRef]
- D’Amico, A.; Currà, E. From TSL survey to HBIM, issues on survey and information modeling implementation for the built heritage the case study of the Temple di Bacco Ravello. In Proceedings of the 35th eCAADe 35-Digit Herit Shock-Shar Comput. Knowledge! Sapienza Universita di Roma, Rome, Italy, 20–22 September 2017; Volume 2, pp. 39–48. [Google Scholar]
- Barrile, V.; Fotia, A.; Candela, G.; Bernardo, E. Integration of 3D model from UAV survey in bim environment. ISPRS-Int. Arch. Photogramm. Remote Sens. Spat. Inf. Sci. 2019, 42, 195–199. [Google Scholar] [CrossRef] [Green Version]
- Bagnolo, V.; Argiolas, R.; Cuccu, A. HBIM for archaeological sites: From sfm based survey to algorithmic modeling. ISPRS-Int. Arch. Photogramm. Remote Sens. Spat. Inf. Sci. 2019, 42, 57–63. [Google Scholar] [CrossRef] [Green Version]
- Schonberger, J.L.; Frahm, J.M. Structure–from–Motion Revisited. In Proceedings of the IEEE Computer Society Conference on Computer Vision and Pattern Recognition, IEEE, Las Vegas, NV, USA, 27–30 June 2016; pp. 4104–4113. [Google Scholar]
- Furukawa, Y.; Curless, B.; Seitz, S.M.; Szeliski, R. Reconstructing building interiors from images. In Proceedings of the 2009 IEEE 12th International Conference on Computer Vision, Kyoto, Japan, 29 September–2 October 2010; pp. 80–87. [Google Scholar]
- López, F.J.; Lerones, P.M.; Llamas, J.; Gómez-García-Bermejo, J.; Zalama, E. A framework for using point cloud data of Heritage buildings towards geometry modeling in a BIM context: A case study on Santa Maria la Real de Mave Church. Int. J. Arch. Herit. 2017, 11, 965–986. [Google Scholar] [CrossRef]
- Murphy, M.; McGovern, E.; Pavia, S. Historic Building Information Modelling–Adding intelligence to laser and image based surveys of European classical architecture. ISPRS J. Photogramm. Remote Sens. 2013, 76, 89–102. [Google Scholar] [CrossRef]
- Telmesani, A.; Sarouji, F.; Adas, A. Old Jeddah a Traditional Arab Muslim City in Saudi Arabia; King Fahad National Library Cataloging: Jeddah, Saudi Arabia, 2009; ISBN 978-603-00-2663-0. [Google Scholar]
- Besl, P.; McKay, N.D. A method for registration of 3-D shapes. IEEE Trans. Pattern Anal. Mach. Intell. 1992, 14, 239–256. [Google Scholar] [CrossRef]
- Mitra, N.J.; Gelfand, N.; Pottmann, H.; Guibas, L. Registration of point cloud data from a geometric optimization perspective. In Proceedings of the 2004 Eurographics/ACM SIGGRAPH Symposium on Geometry Processing (SGP 2004); Scopigno, R., Zorin, D., Eds.; ACM Press: New York, NY, USA; p. 22. [CrossRef] [Green Version]
Figure 1.
Scan-to-BIM workflow.
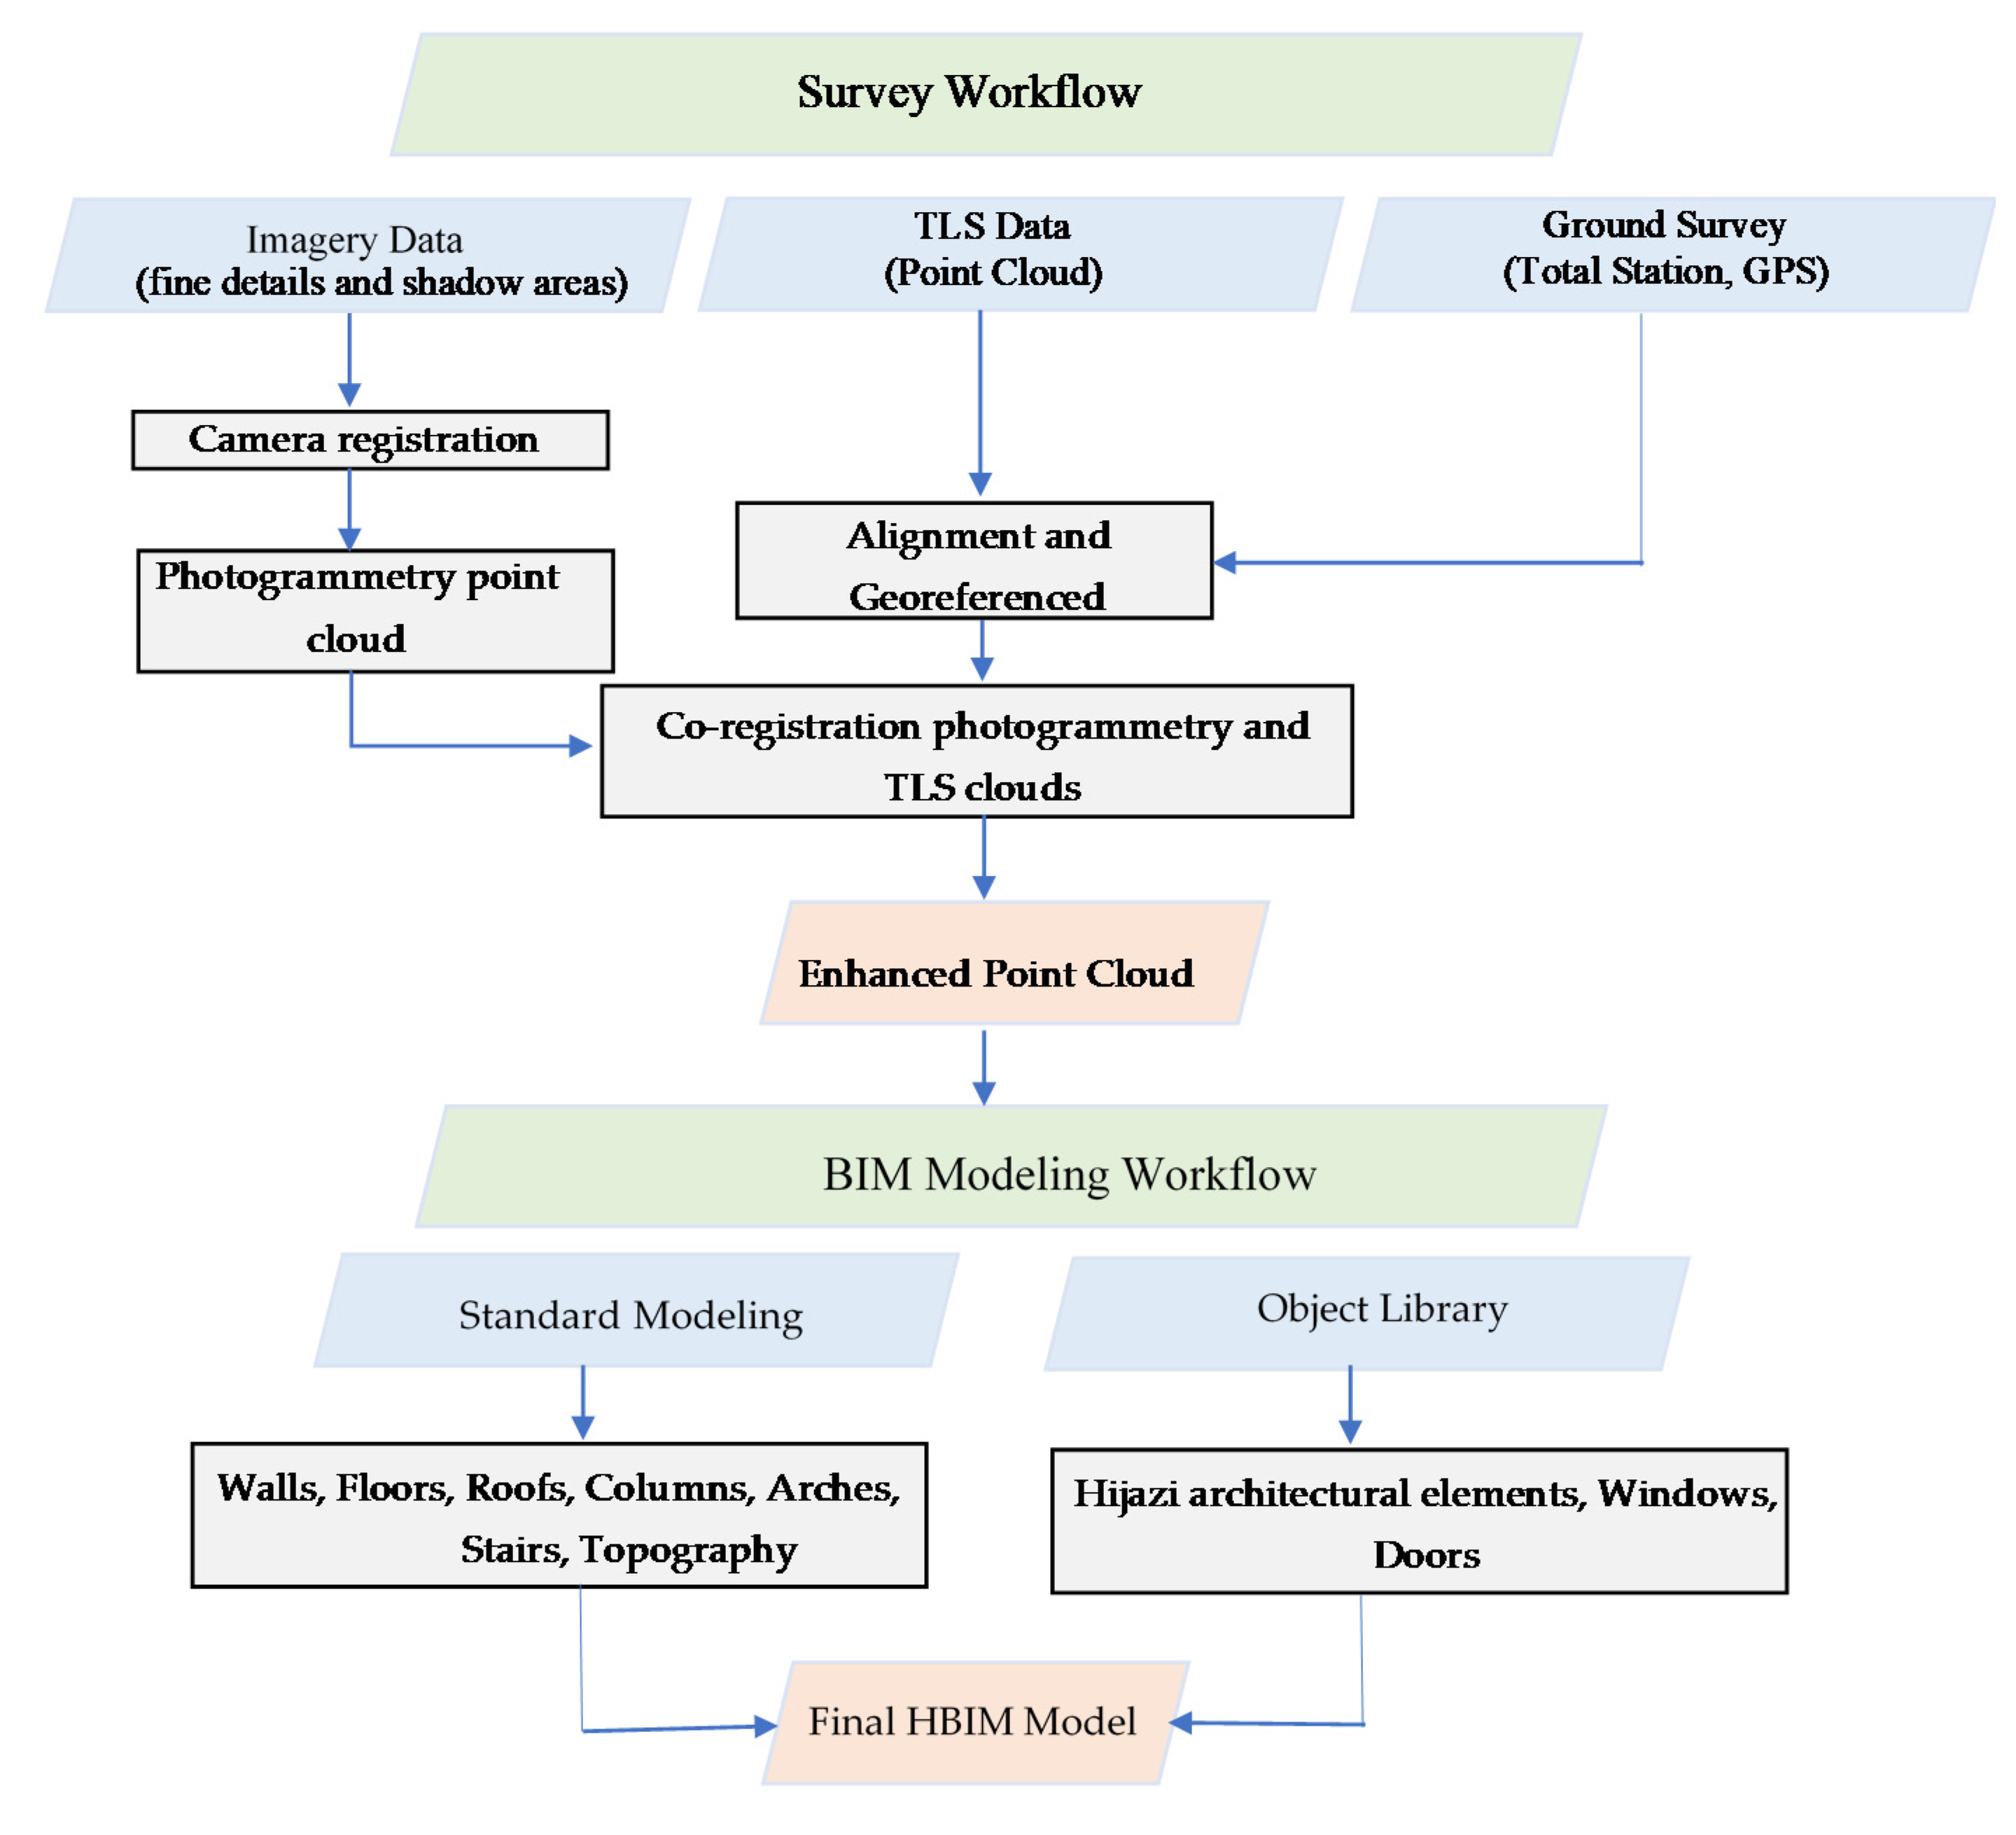
Figure 2.
Common architectural elements of Jeddah historic buildings (highlighted); (left to right)—Roshan, gate, Manjur, and decorated plaster.
Figure 2.
Common architectural elements of Jeddah historic buildings (highlighted); (left to right)—Roshan, gate, Manjur, and decorated plaster.
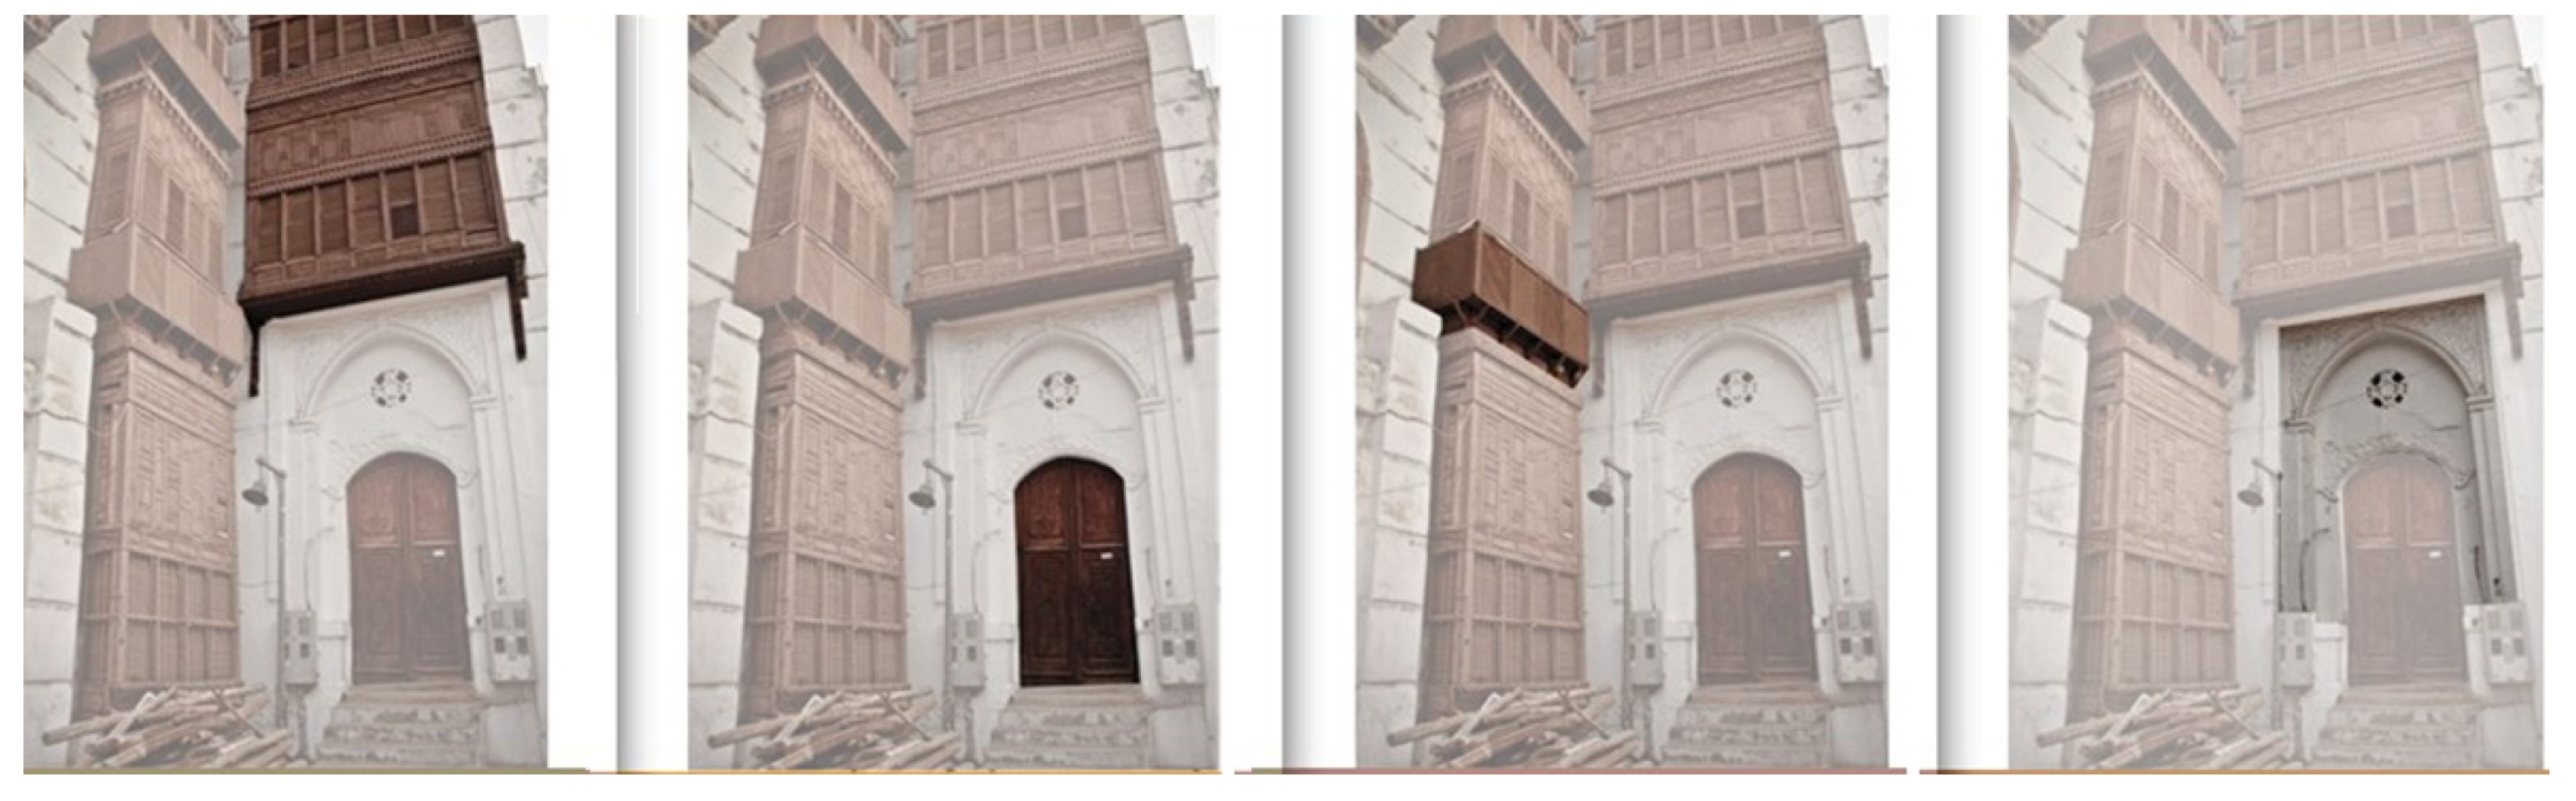
Figure 3.
Matbouli Museum House in Historic Jeddah.

Figure 4.
Roshan frame structure.
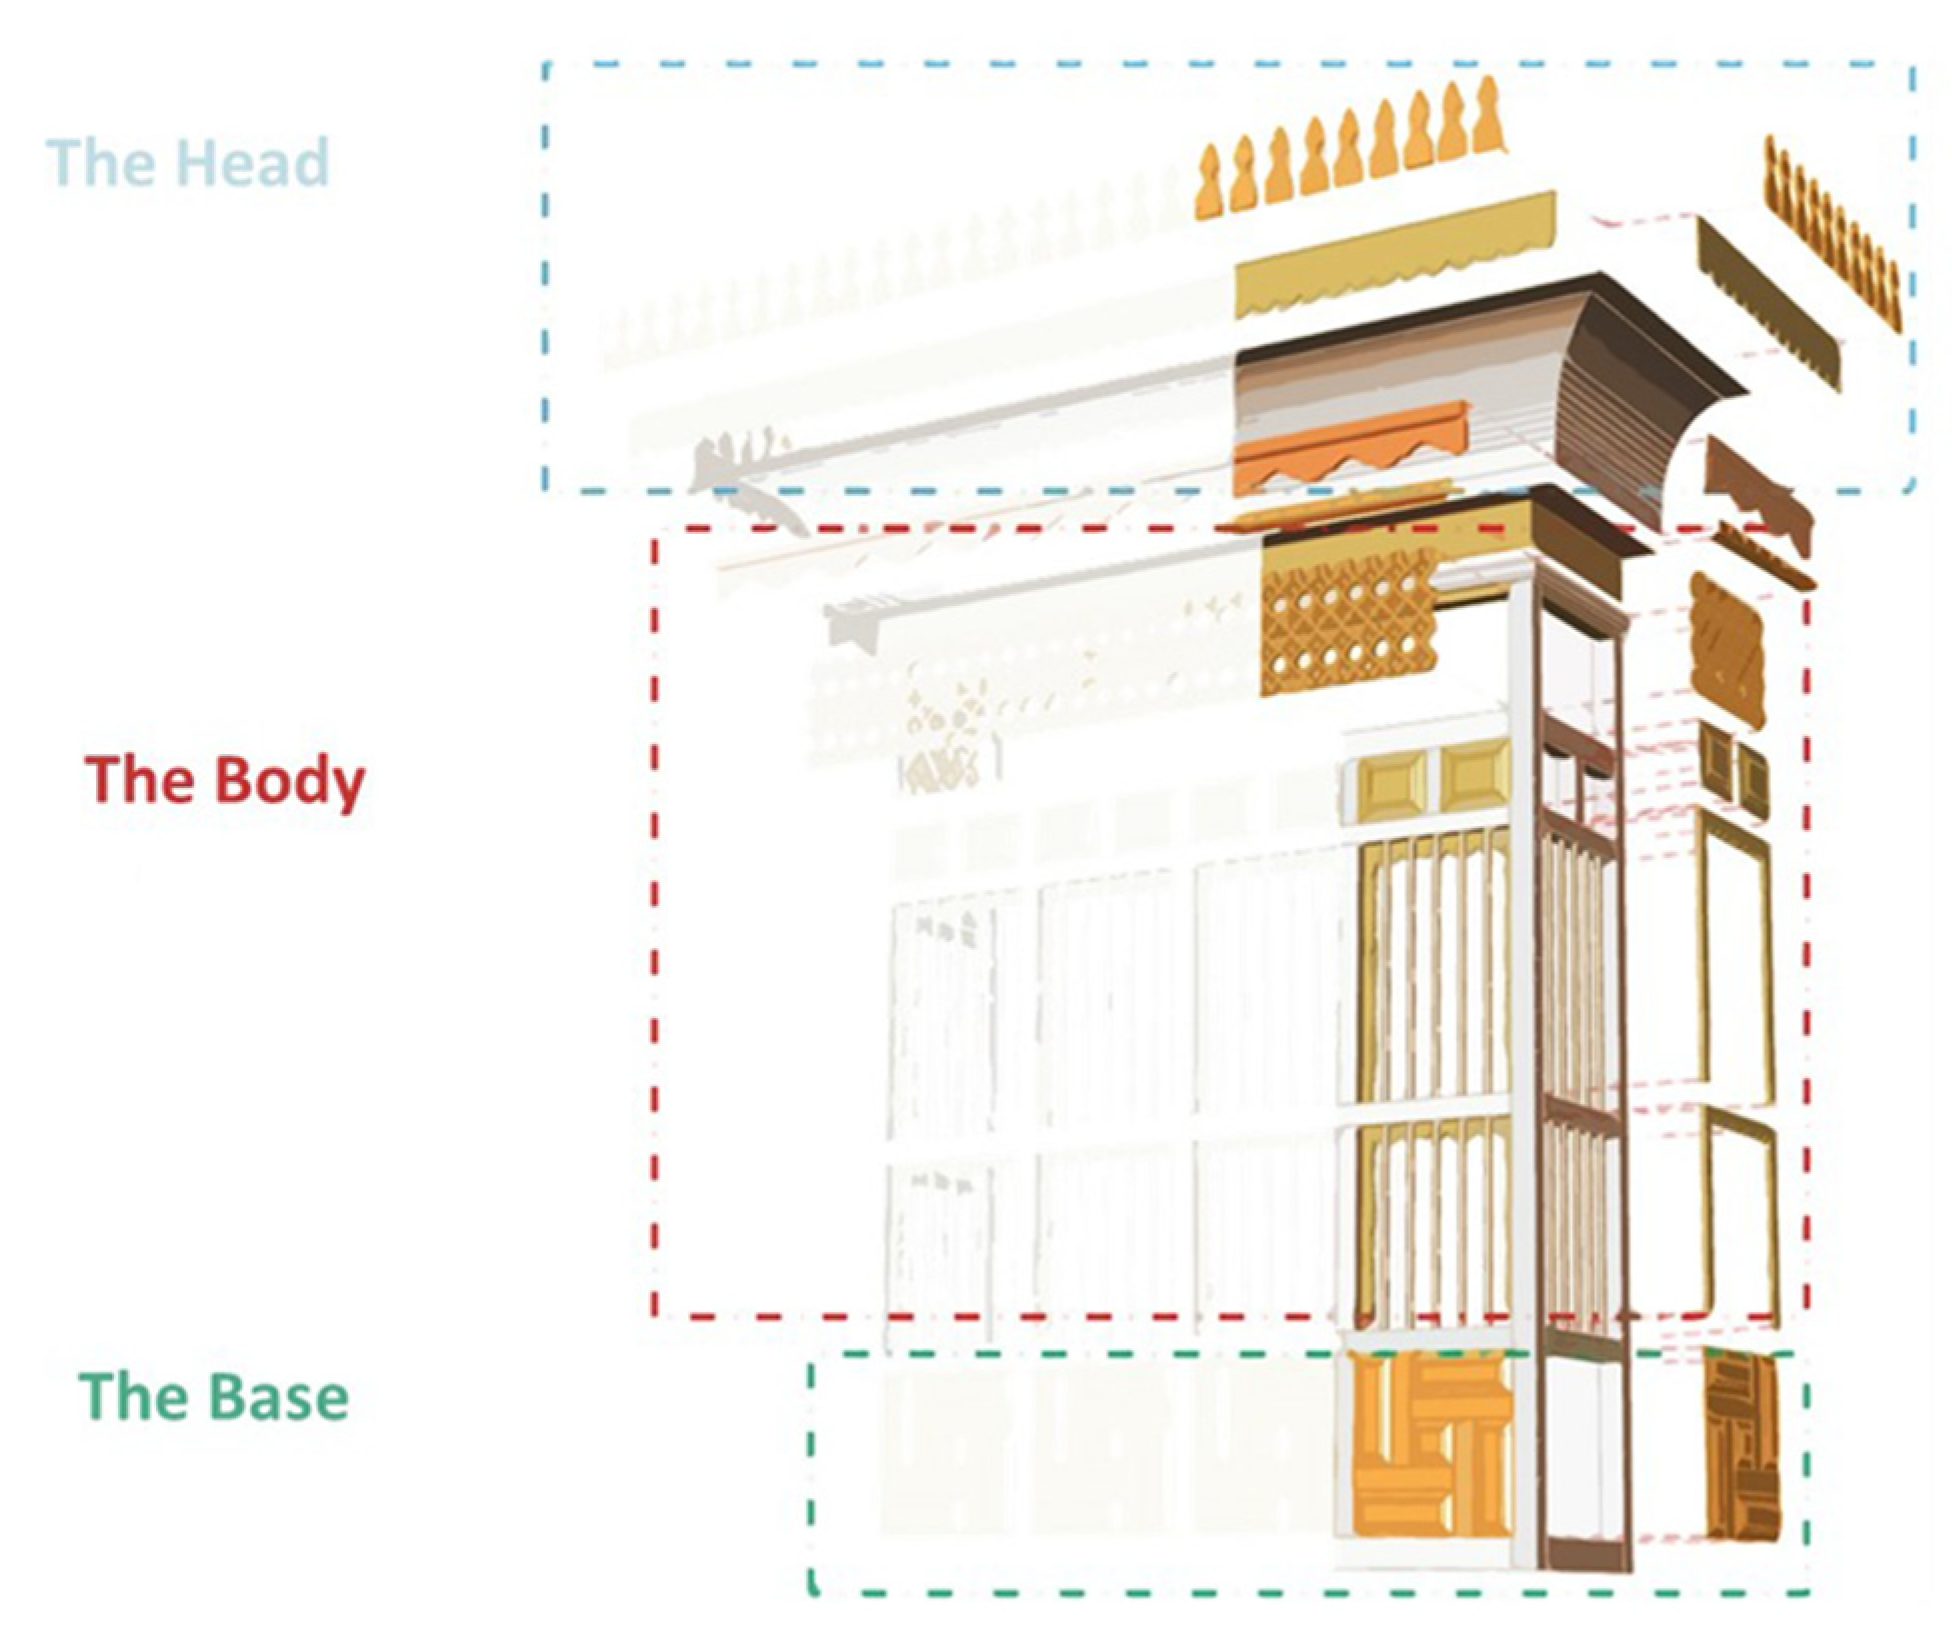
Figure 5.
Asfan Castle.

Figure 6.
General scanning work plan.
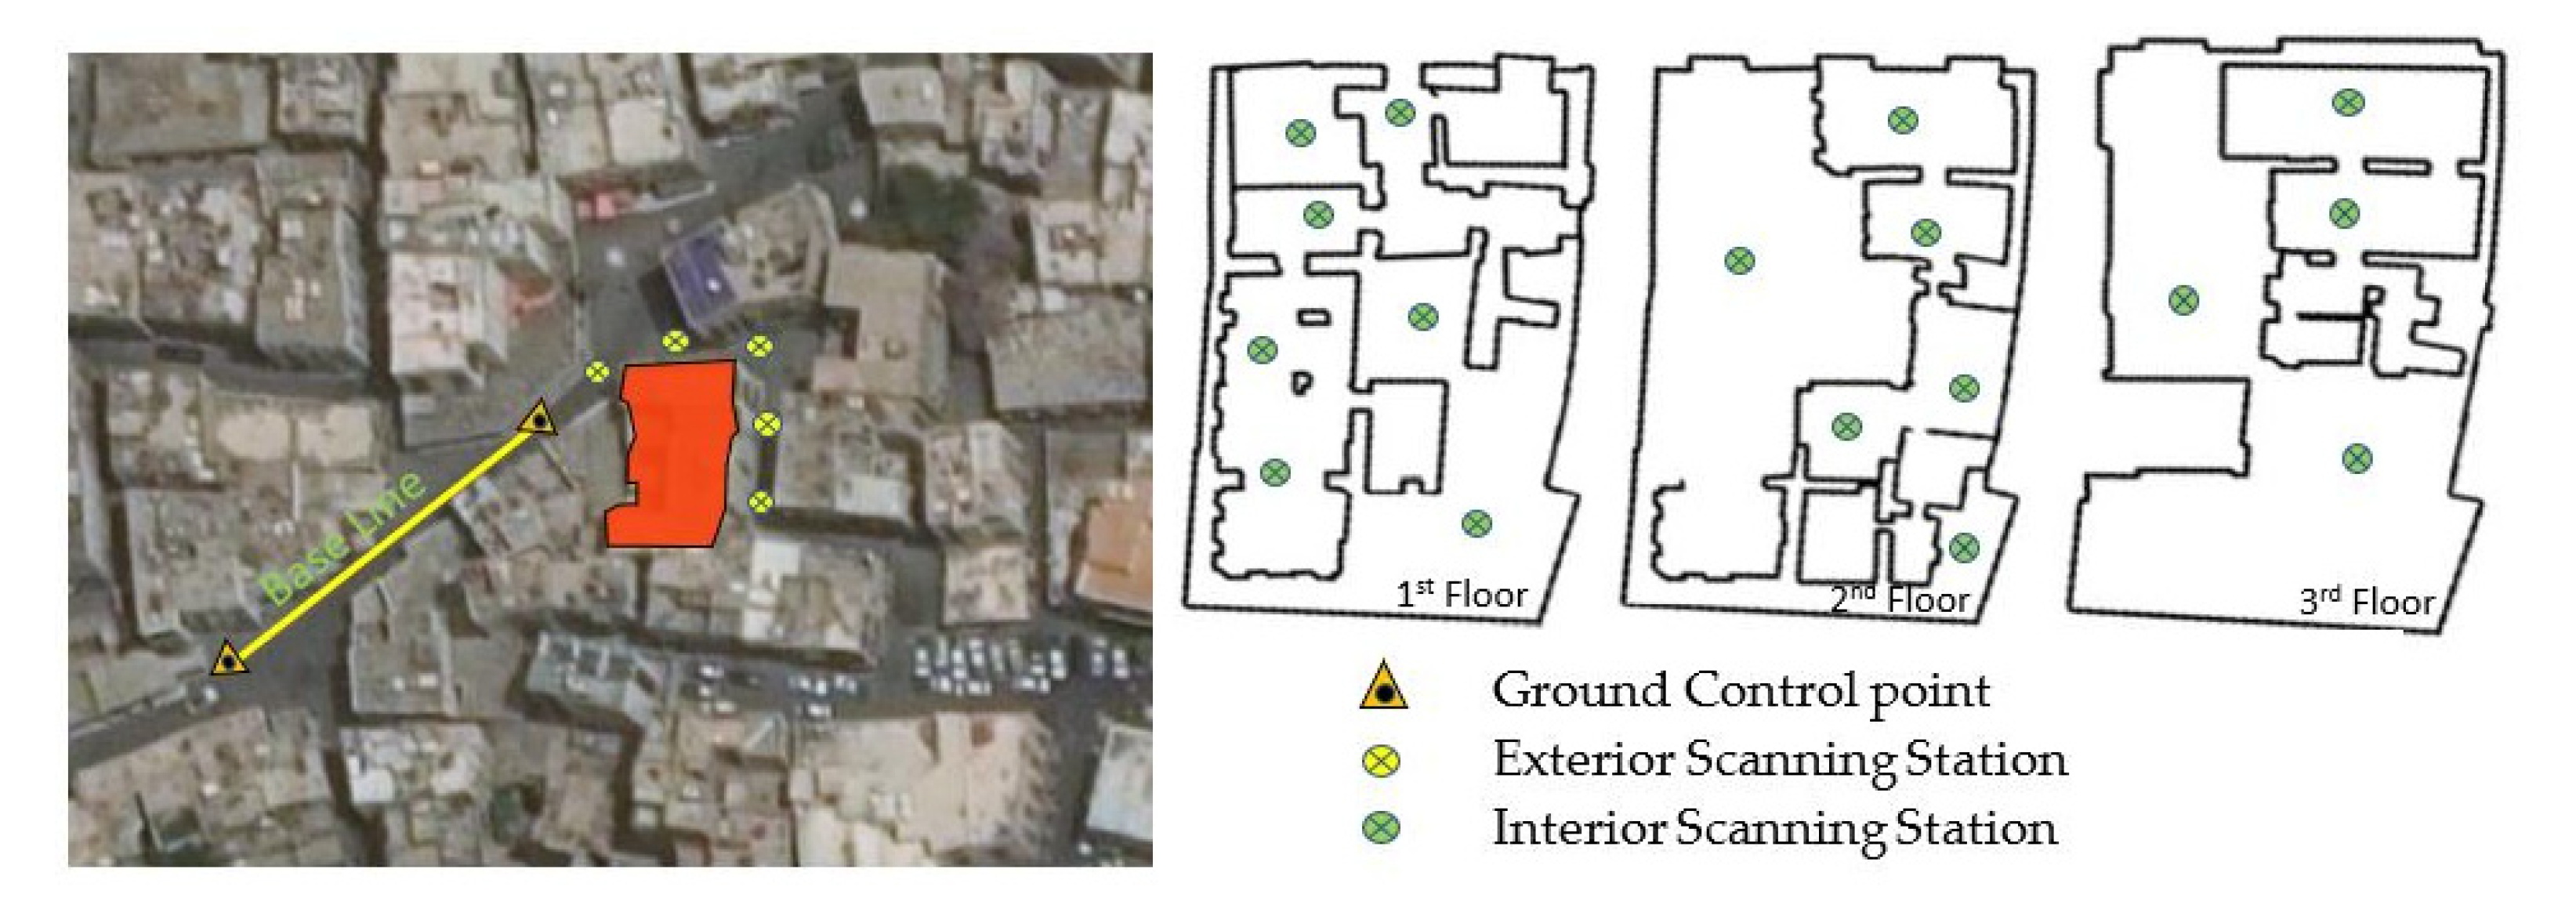
Figure 7.
Three-dimensional colored point cloud.

Figure 8.
Colored 3D point cloud for the interior of the Matbouli House Museum.

Figure 9.
Ground sampling distance (GSD) of Roshan photogrammetric data.
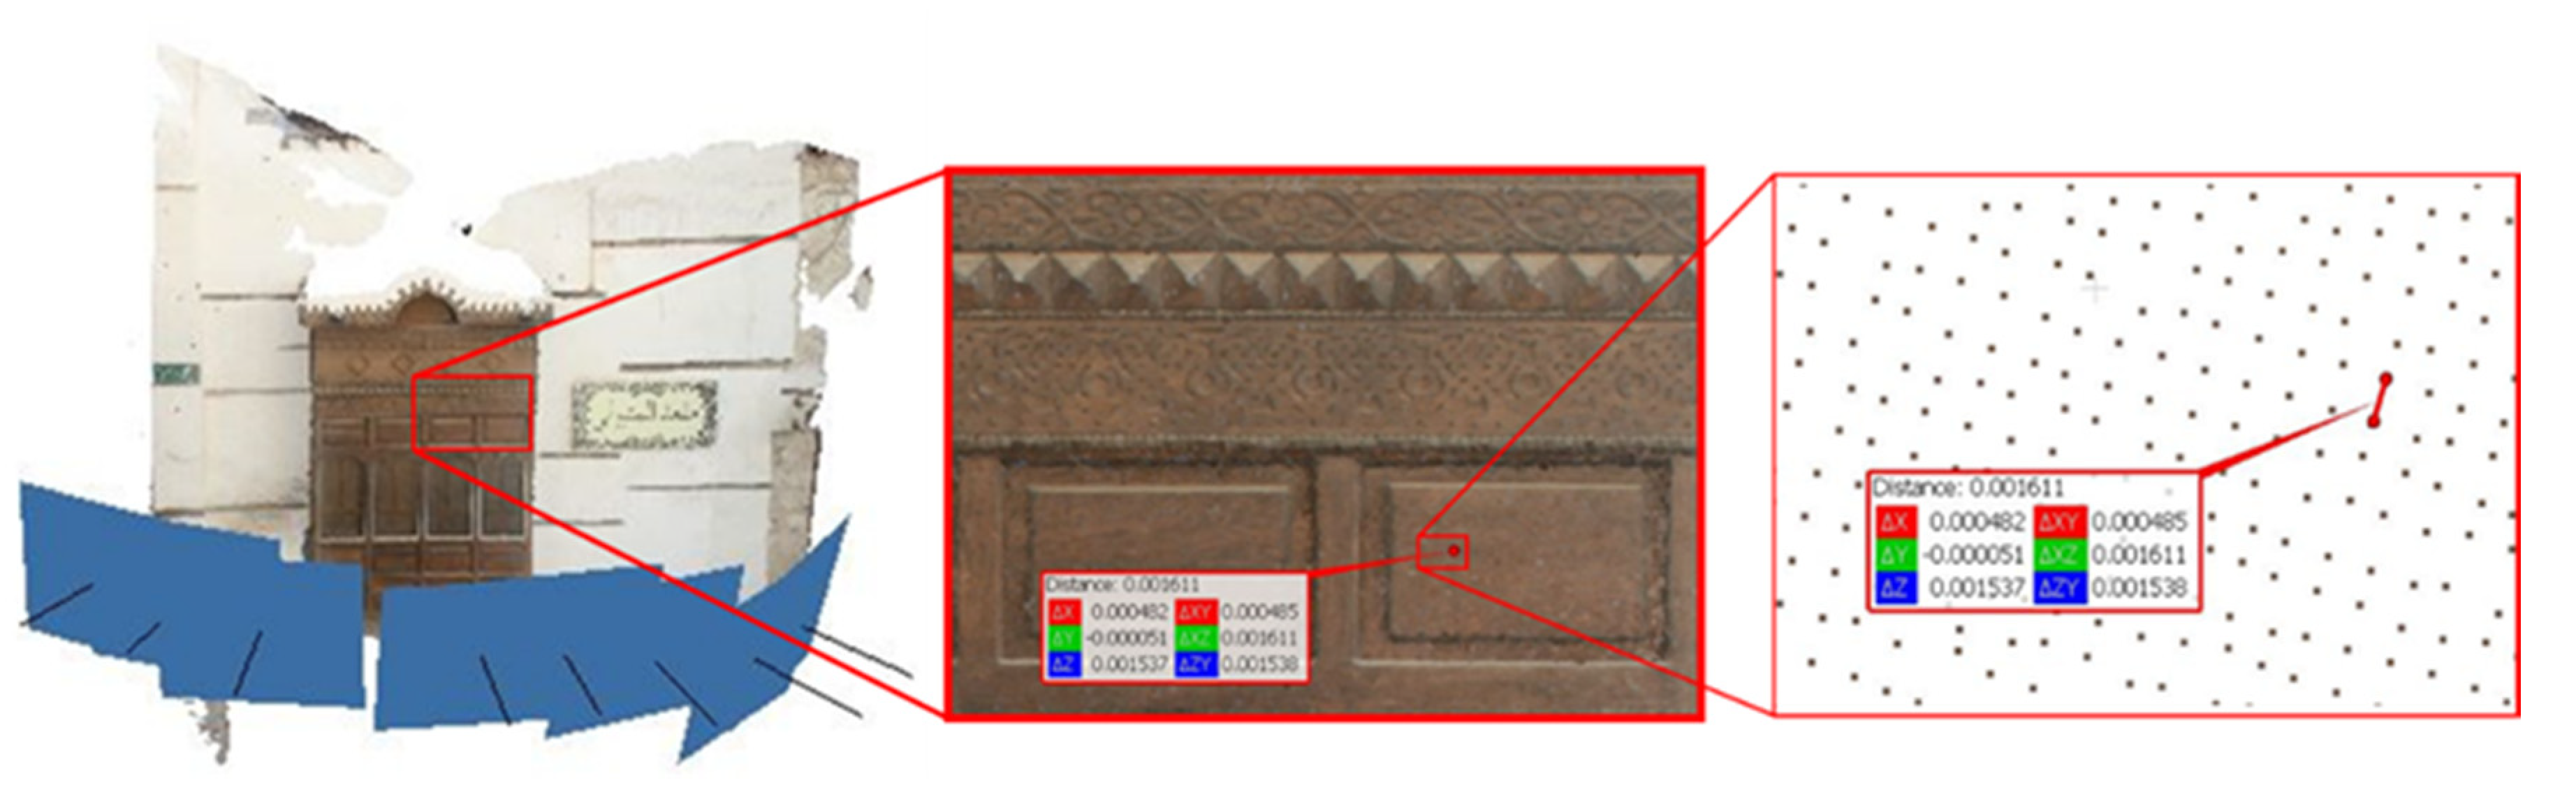
Figure 10.
Three-dimensional Hijazi architectural element modeling using (a) TLS and (b) photogrammetry.
Figure 10.
Three-dimensional Hijazi architectural element modeling using (a) TLS and (b) photogrammetry.

Figure 11.
The layout of the control points and scanning stations.

Figure 12.
TLS 3D colored point cloud of the Asfan Castle. The use of a TLS-attached camera results in low-resolution color information and poor color homogeneity.
Figure 12.
TLS 3D colored point cloud of the Asfan Castle. The use of a TLS-attached camera results in low-resolution color information and poor color homogeneity.
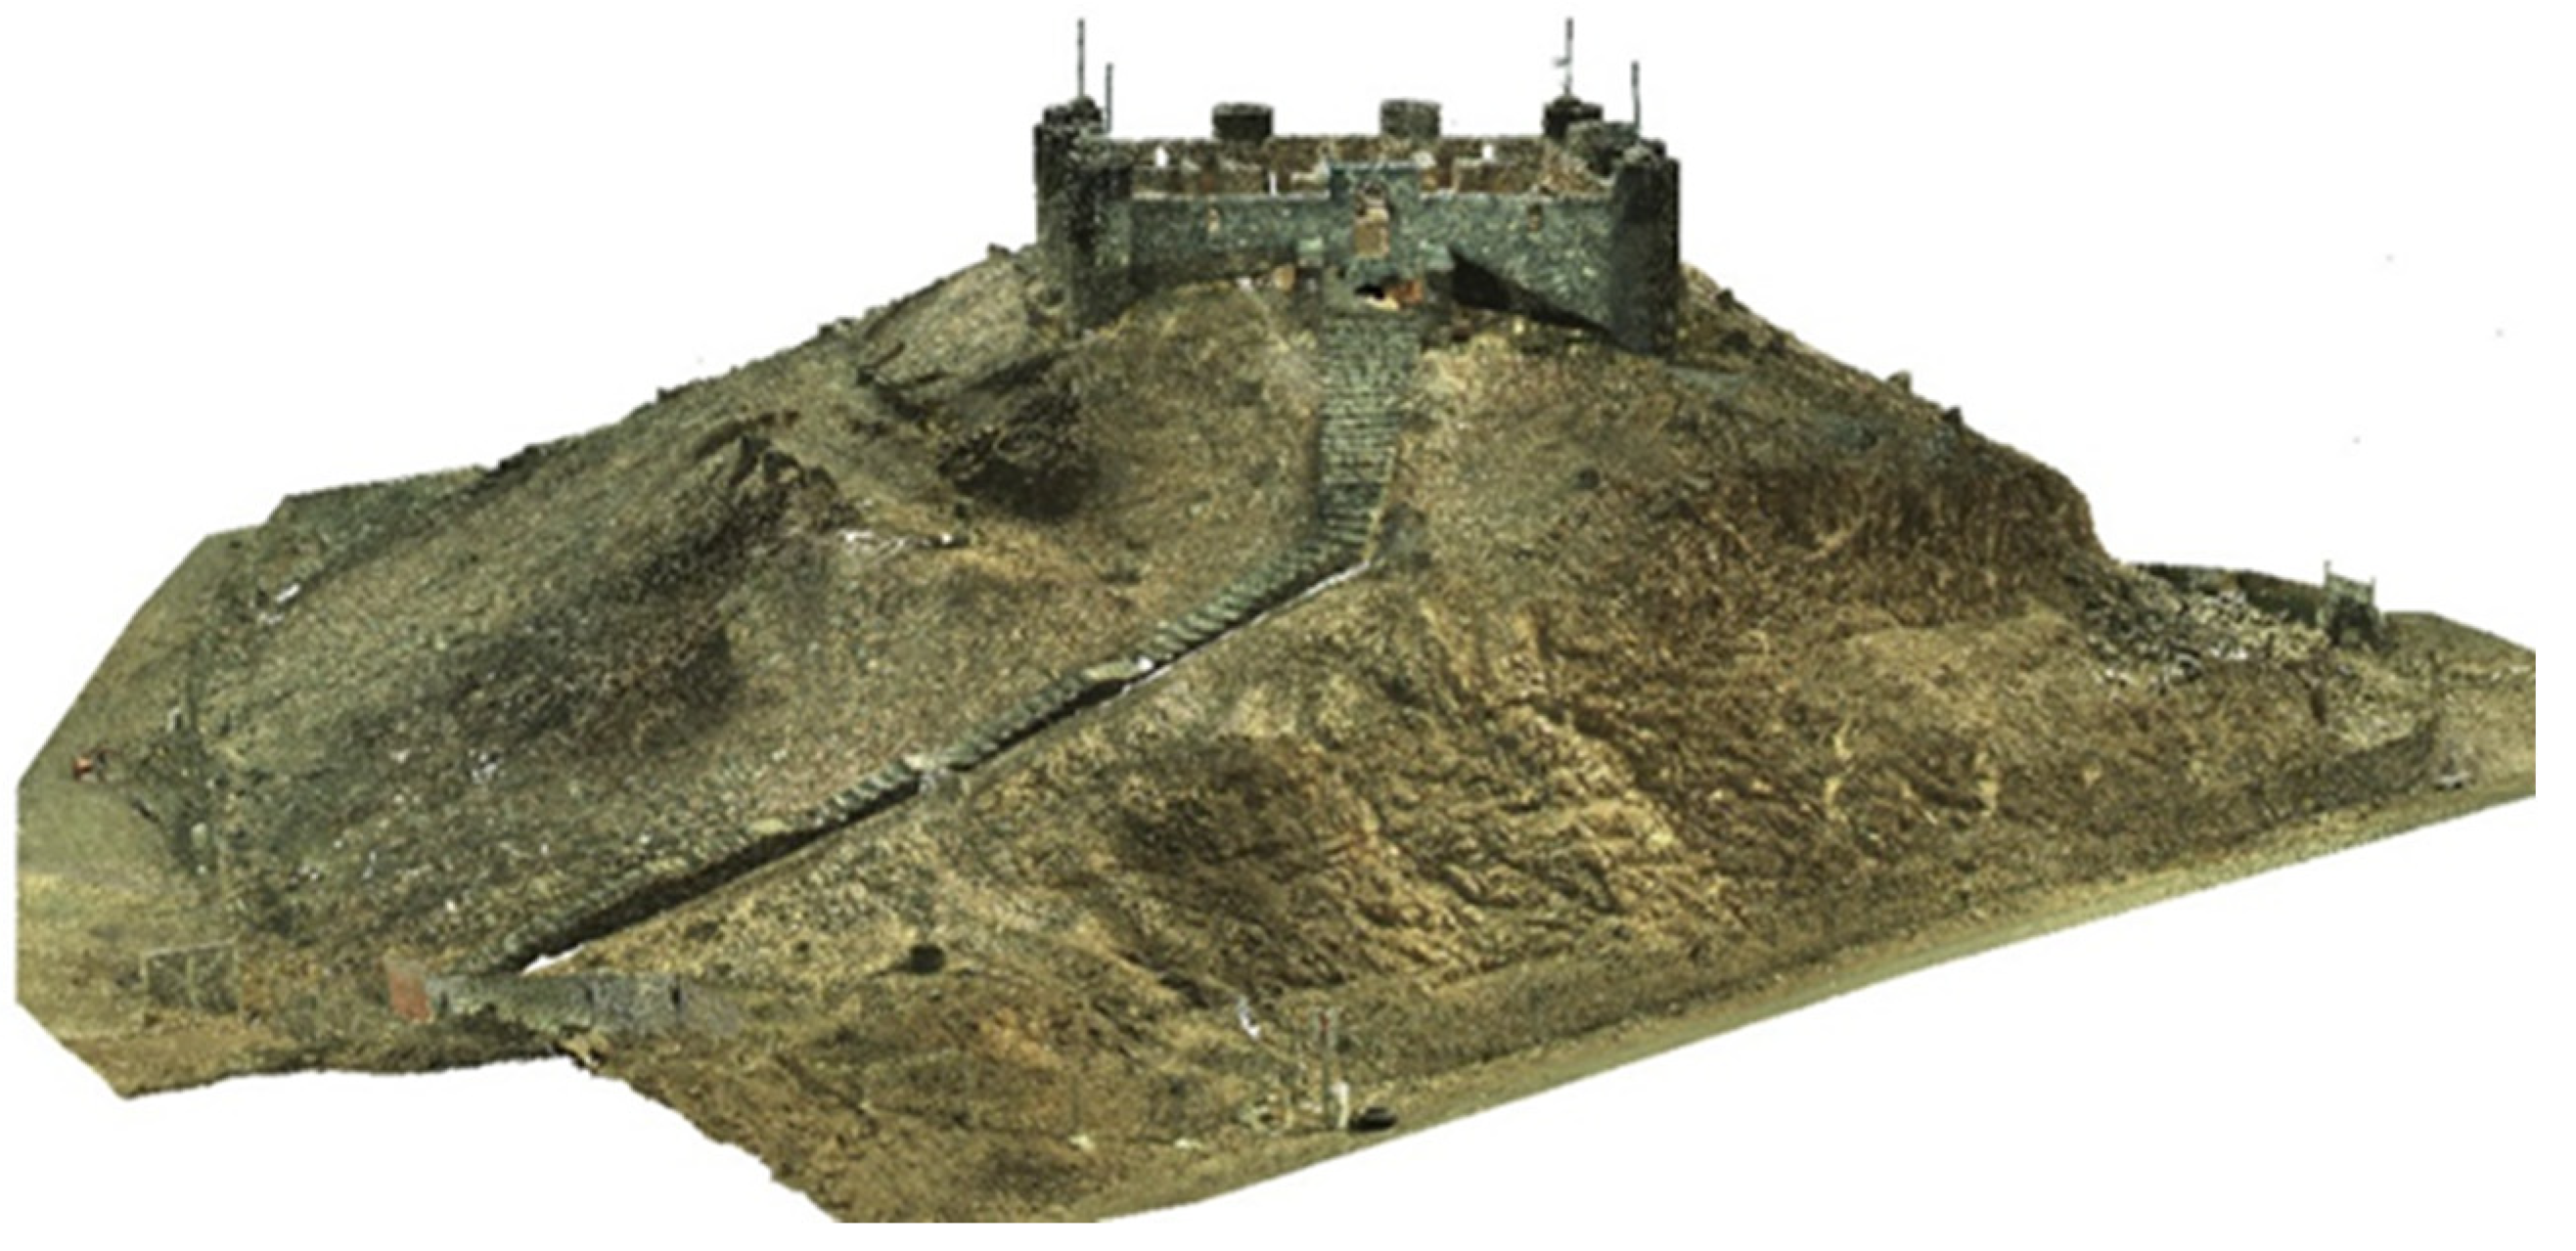
Figure 13.
(a) Three-dimensional point cloud using TLS. (b) Unsampled roofs and upper parts obscured from TLS.
Figure 13.
(a) Three-dimensional point cloud using TLS. (b) Unsampled roofs and upper parts obscured from TLS.

Figure 14.
(a) Point cloud generation from UAV images. (b) UAV–SfM digital surface model. (c) UAV 3D model.
Figure 14.
(a) Point cloud generation from UAV images. (b) UAV–SfM digital surface model. (c) UAV 3D model.
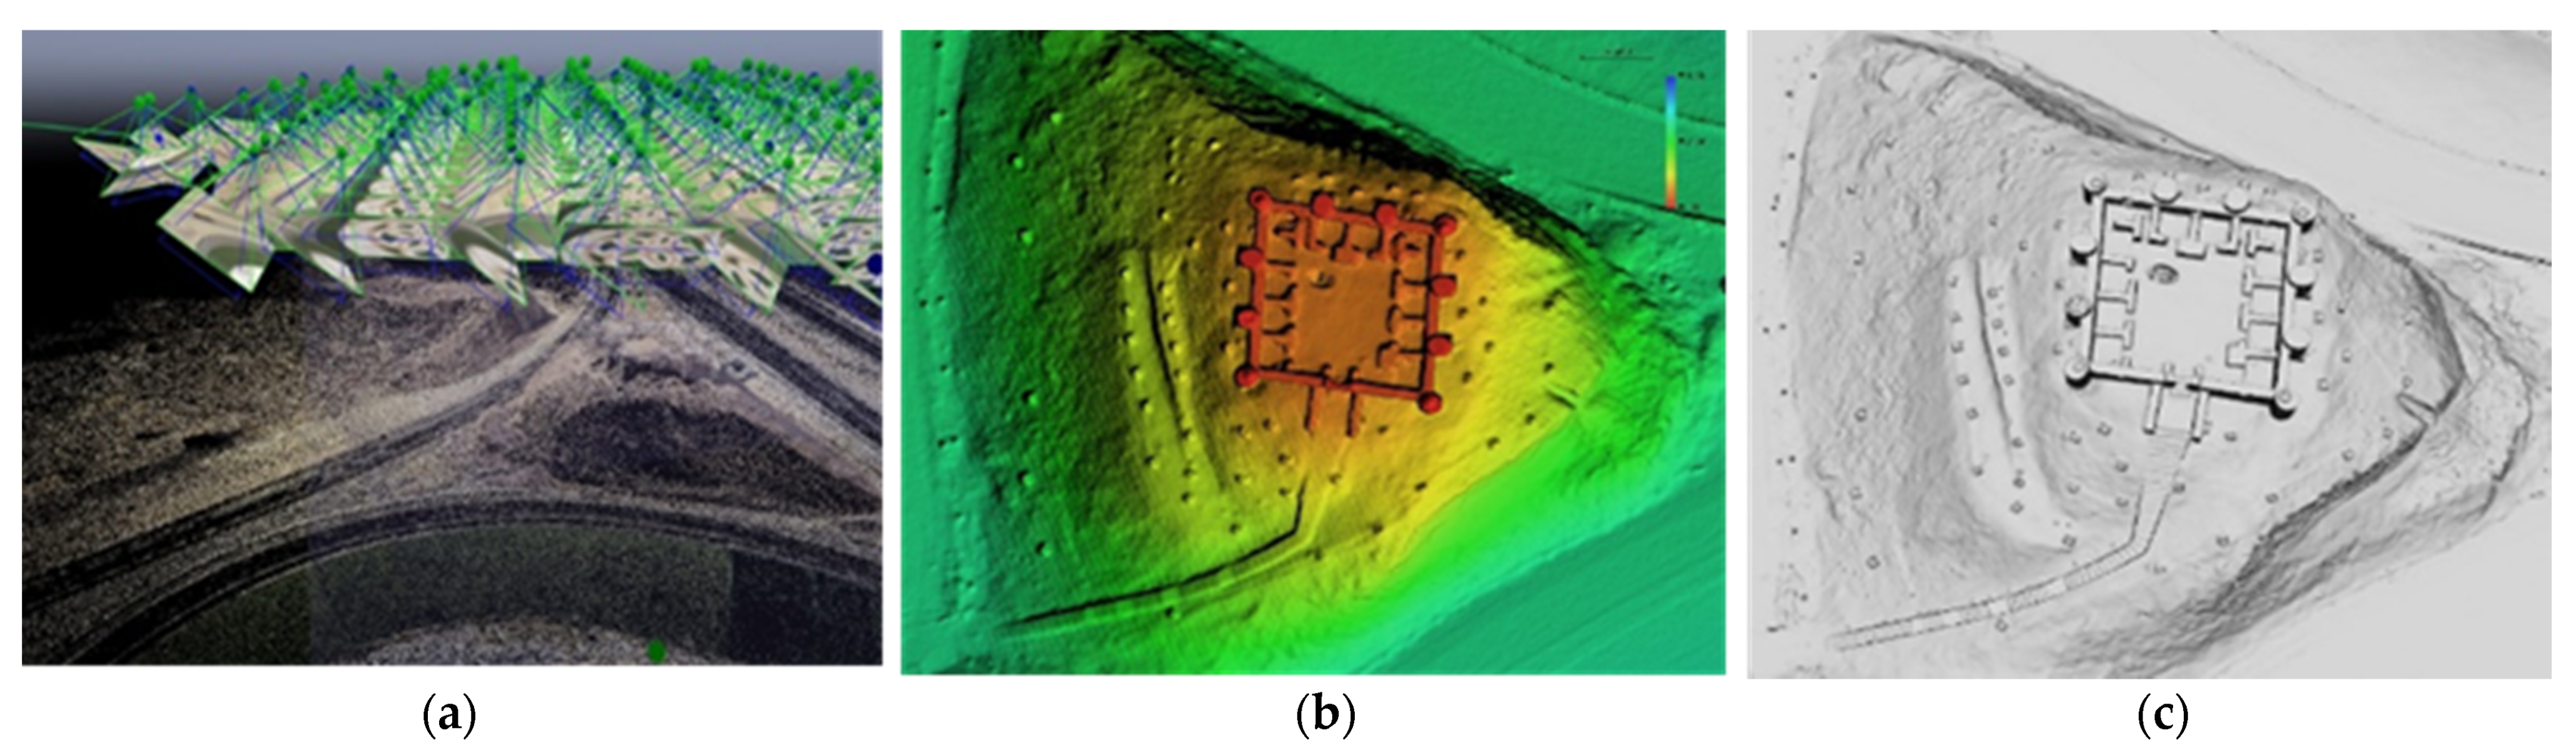
Figure 15.
Camera registration parameters.

Figure 16.
Data fusion of 3D image-based points cloud (Roshan and the main door) with the TLS point cloud (shaded).
Figure 16.
Data fusion of 3D image-based points cloud (Roshan and the main door) with the TLS point cloud (shaded).

Figure 17.
Data fusion of the UAV 3D textured model with the TLS point cloud (shaded).

Figure 18.
Enhanced 3D model of the Asfan Castle using the UAV and TLS data fusion.
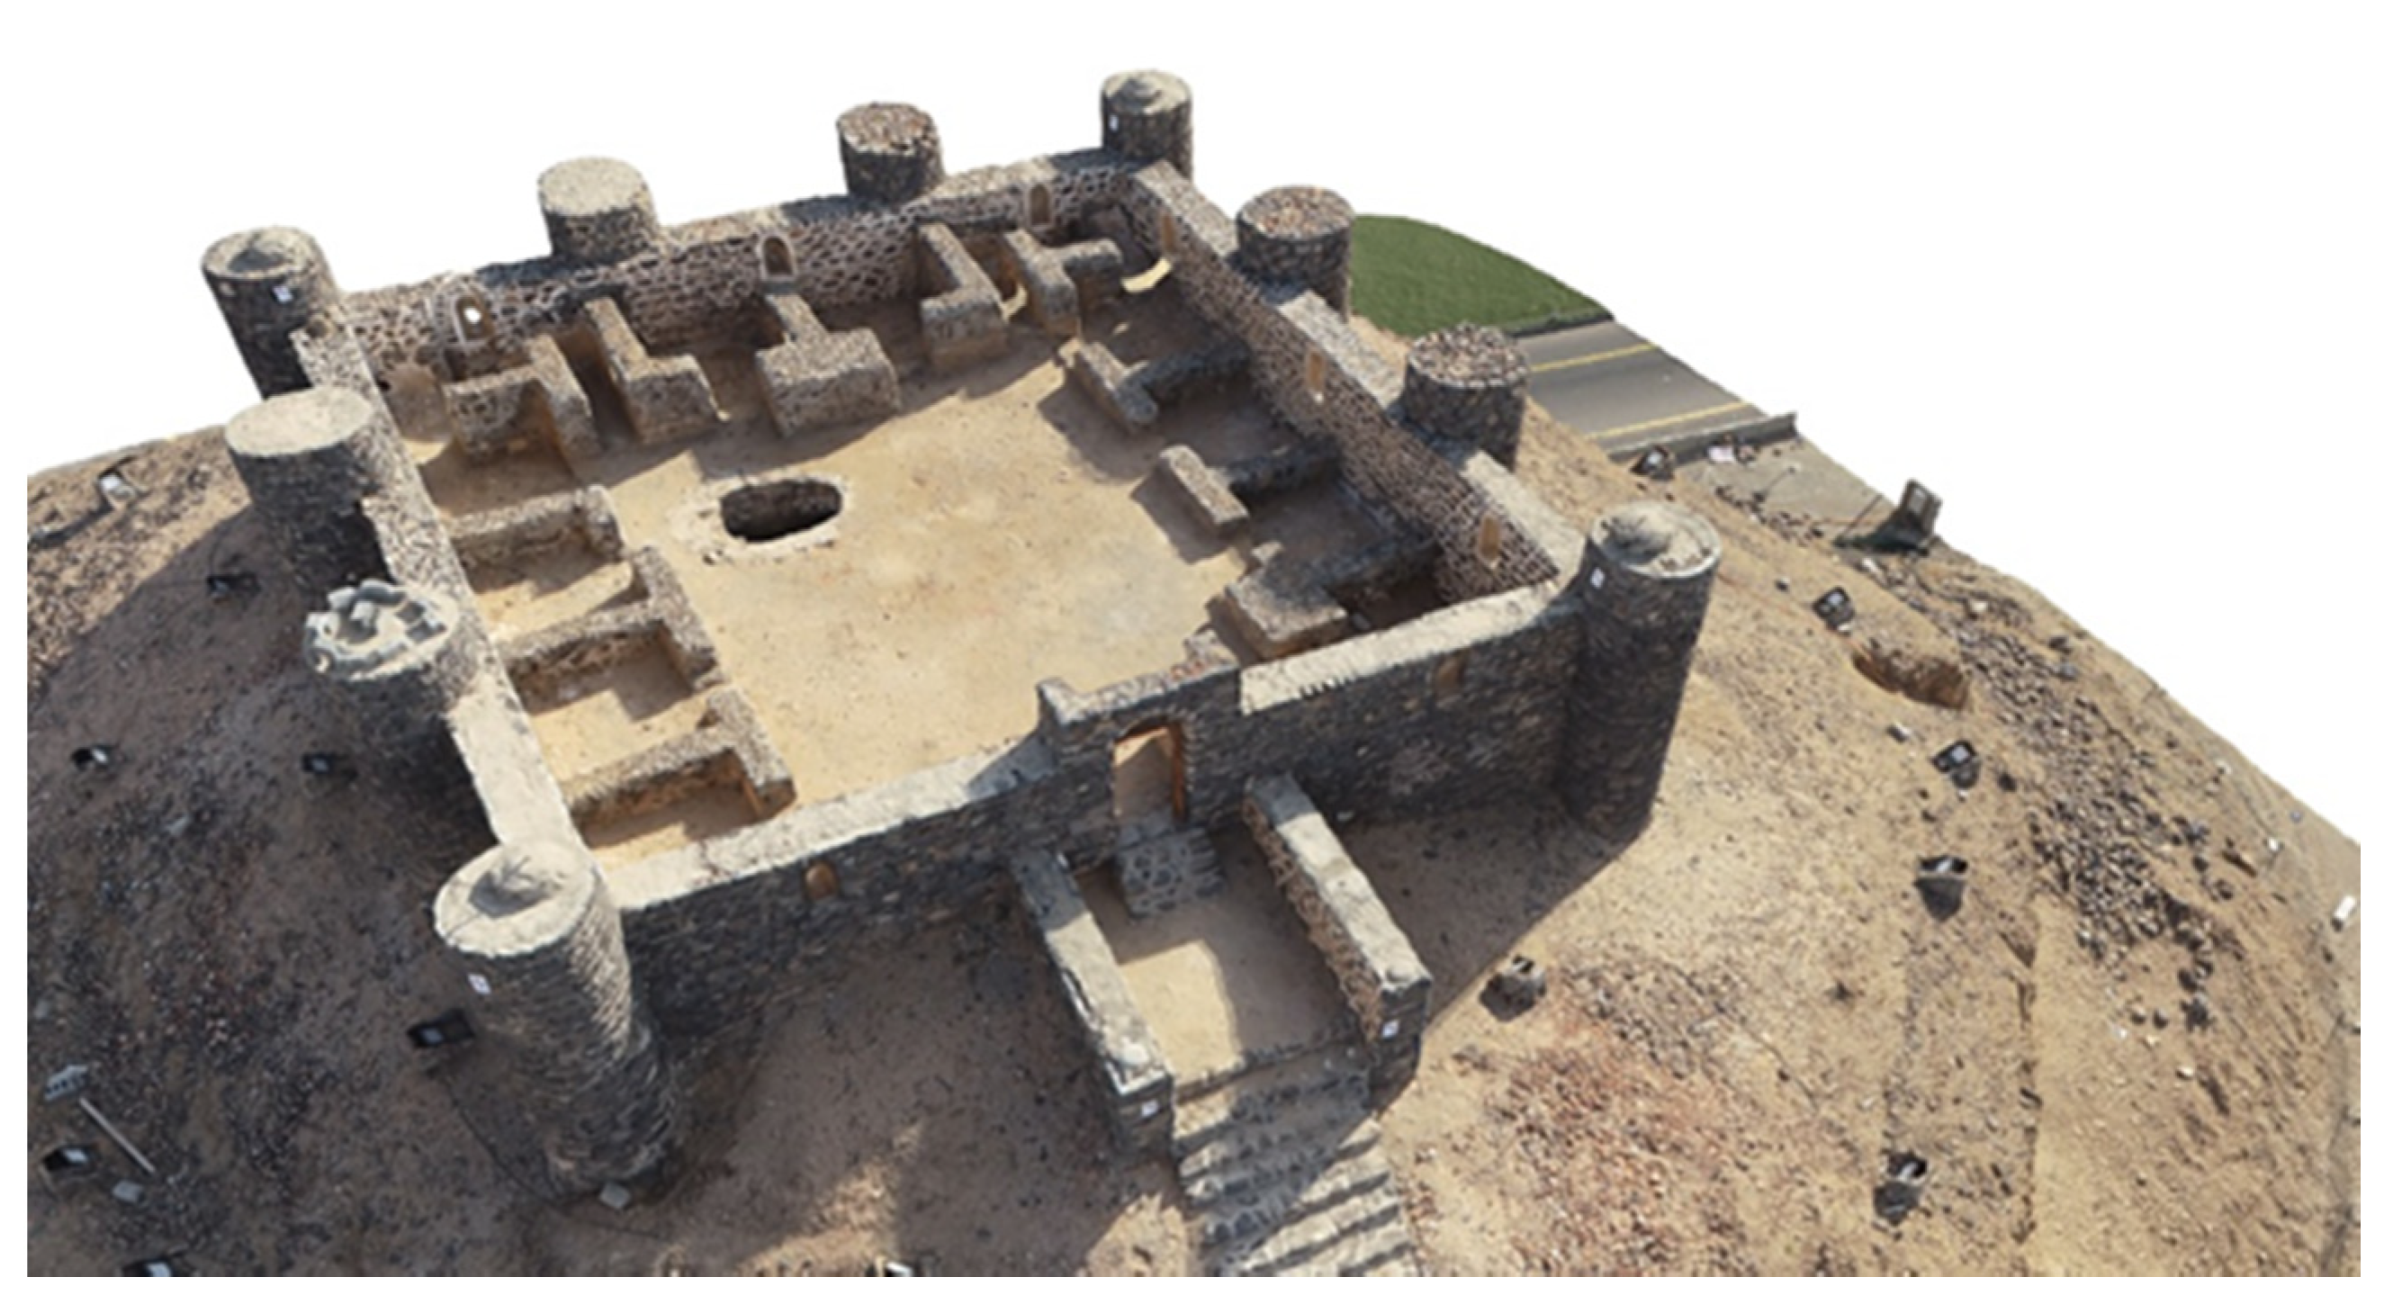
Figure 19.
From enhanced point clouds to a HBIM model—Matbouli House Museum. (a,b) Longitudinal and transversal cross-sections in point clouds. (c) Set of grids created on the planimetry. (d–h) Examples of different BIM elements.
Figure 19.
From enhanced point clouds to a HBIM model—Matbouli House Museum. (a,b) Longitudinal and transversal cross-sections in point clouds. (c) Set of grids created on the planimetry. (d–h) Examples of different BIM elements.

Figure 20.
HBIM model for the external and internal walls.

Figure 21.
The Roshan was created as a parametric family using the enhanced point cloud.
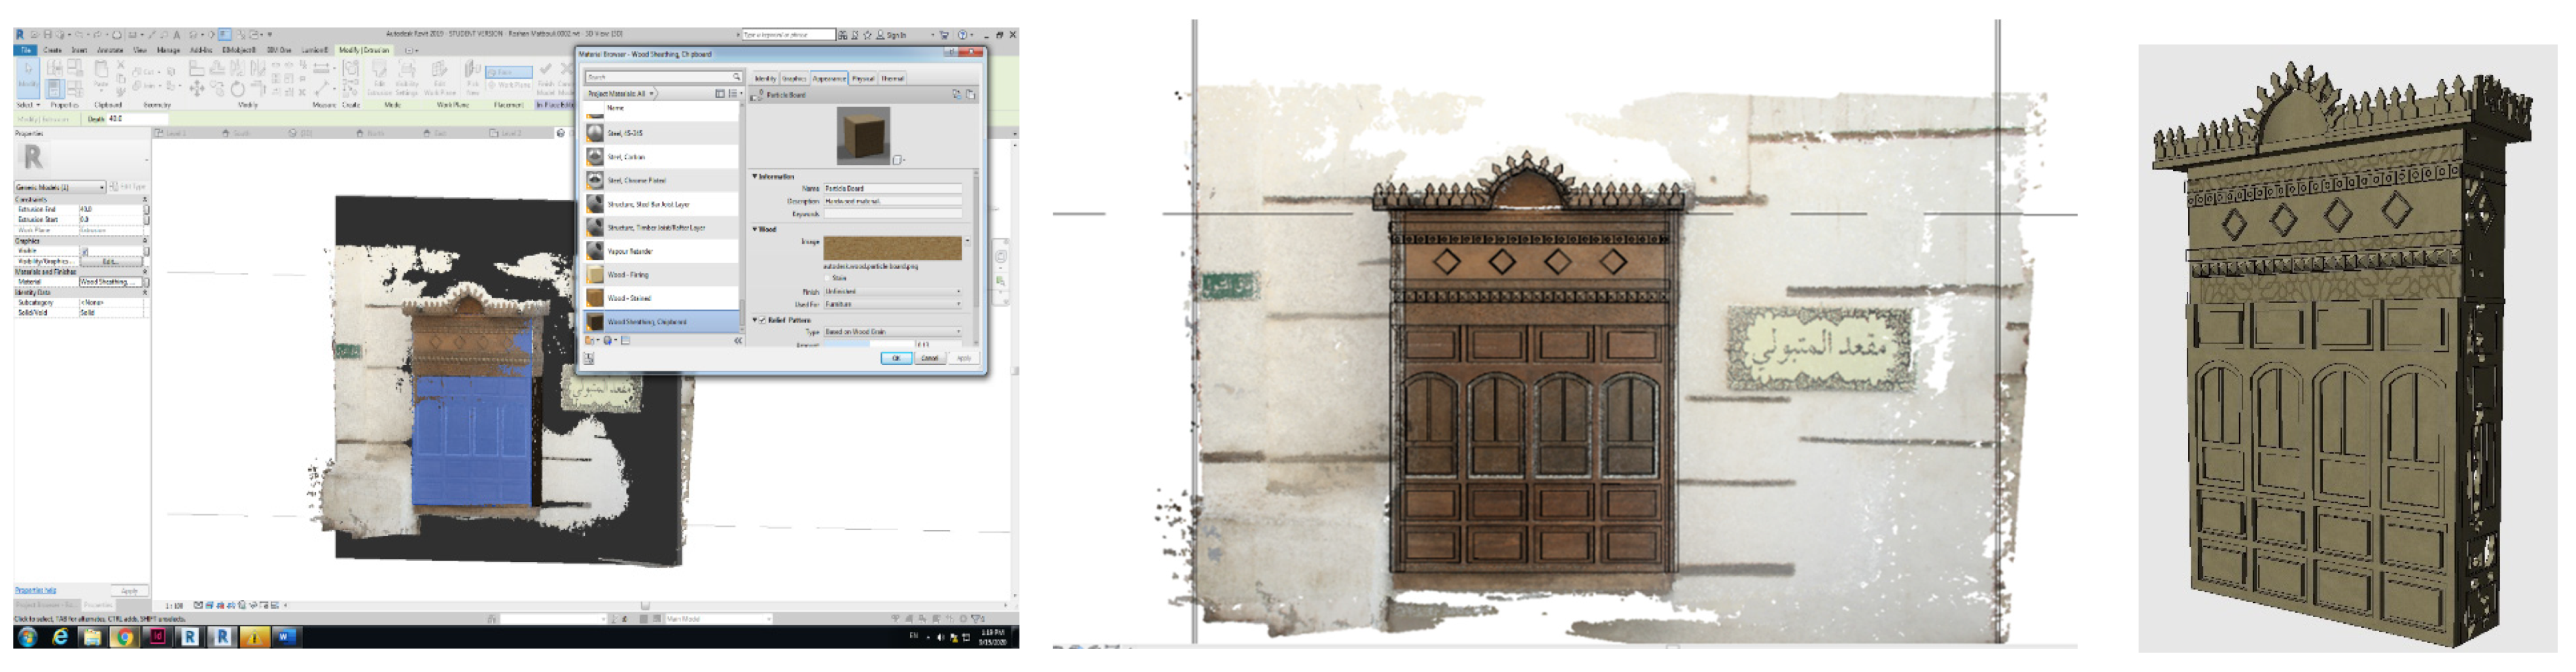
Figure 22.
From enhanced point clouds to a HBIM model—the Asfan Castle.

Figure 23.
The granular model of the Asfan Castle.

Figure 24.
The final BIM models and their cross-sections.

Publisher’s Note: MDPI stays neutral with regard to jurisdictional claims in published maps and institutional affiliations. |
© 2021 by the authors. Licensee MDPI, Basel, Switzerland. This article is an open access article distributed under the terms and conditions of the Creative Commons Attribution (CC BY) license (https://creativecommons.org/licenses/by/4.0/).
Share and Cite
MDPI and ACS Style
Alshawabkeh, Y.; Baik, A.; Miky, Y. Integration of Laser Scanner and Photogrammetry for Heritage BIM Enhancement. ISPRS Int. J. Geo-Inf. 2021, 10, 316. https://0-doi-org.brum.beds.ac.uk/10.3390/ijgi10050316
AMA Style
Alshawabkeh Y, Baik A, Miky Y. Integration of Laser Scanner and Photogrammetry for Heritage BIM Enhancement. ISPRS International Journal of Geo-Information. 2021; 10(5):316. https://0-doi-org.brum.beds.ac.uk/10.3390/ijgi10050316
Chicago/Turabian StyleAlshawabkeh, Yahya, Ahmad Baik, and Yehia Miky. 2021. "Integration of Laser Scanner and Photogrammetry for Heritage BIM Enhancement" ISPRS International Journal of Geo-Information 10, no. 5: 316. https://0-doi-org.brum.beds.ac.uk/10.3390/ijgi10050316
Note that from the first issue of 2016, this journal uses article numbers instead of page numbers. See further details here.