1. Introduction
Hot spot policing is a type of intervention that is increasingly used by police agencies for decreasing crime [
1]. Hot spot policing involves the targeted deployment of police patrols to locations where high levels of crime have previously been observed [
2,
3]. These police patrols in crime hot spots are most effective when they are targeted to the specific streets where crime has previously concentrated [
4]. This means that care is required in identifying the locations where hot spot policing patrols are deployed and that the selection of the streets to patrol is an important factor in the likely success of a hot spot policing patrol intervention.
To date, the creation of hot spot policing patrol routes has used a combination of spatial analysis and practitioner judgement to determine where patrols should be deployed. The spatial analysis involves a police crime analyst (or on some occasions, analysis assistance from an academic researcher) identifying where hot spots of crime are located. The results from this analysis are then used by a police officer who is familiar with the area and who has patrol resource deployment responsibility to determine the routes the patrols will cover. Sometimes, the police officer is guided through this task by the analyst that generated the hot spot analysis results and, on occasion, can include academic researchers also providing assistance see Chainey et al. [
5] and Ratcliffe et al. [
6] for examples of this type of assistance). How accurate is this approach in determining the areas where hot spot policing patrols should be deployed, and could computational assistance support or improve where hot spot policing patrols are deployed? Despite the creation of several computational approaches that have been developed to support the police patrolling function, to date this question has not been answered and therefore was the key motivation for the current study.
Hot spot policing is a type of intervention that has mainly been used in western urban settings. Its use is now growing in other settings and, in particular, in Latin American cities (we cite key references of hot spot policing studies in the next section). This includes Brazil, where, in 2020, a number of new hot spot policing programs were initiated. Analytical capacity in police agencies in Brazil (and in many other Latin American countries) is limited [
7,
8], with very few police agencies possessing the skills to perform and having access to geographic information system (GIS) software to complete the precise geographic crime analysis that is required to determine where crime hot spots are located. Additionally, the limited use of hot spot policing in Brazilian settings means that police officers rarely have experience in creating the specific patrol routes for a hot spot policing intervention. A second motivation to the current study was to design a computational spatial analysis application that creates hot spot policing patrol routes, and that overcomes the limitations of access to crime analysts and expert academic researchers in Brazil and in other settings where these limitations also exist. Once suitable hot spot policing patrol routes are created, decisions on how and when to resource the deployment of police patrol officers to these hot spots are more straightforward [
9].
In this paper, we report on the results that compare the performance of a manual process of hot spot policing patrol route creation to an automated spatial computation approach for creating these patrol routes. We describe the manual process for creating the patrol routes as a cognitive heuristic approach because it involves mental processes that a person performs to make decisions and find solutions. The cognitive heuristic approach involved a team of police officers for a police agency in Brazil, with the assistance of an academic researcher experienced in hot spot policing, analyzing spatial concentrations of crime, and using the results from the analysis and the team’s judgement to manually create the routes for the hot spot policing patrols. The automated spatial computation approach involved designing an algorithm that identified spatial concentrations of crime and then used the results to automate the creation of hot spot policing patrol routes. We used two different processes to automatically create hot spot policing patrol routes, with these processes differing in terms of how they decide to include street segments that experienced the highest levels of crime. We used the results from the three outputs—patrol routes created using the cognitive heuristic approach and the two automated spatial computation approaches—to compare which output performed best in creating hot spot policing patrol routes. We used a number of methods that are associated with measuring the distribution of crime and visual inspection to compare the outputs.
In the next section of the paper, we review in more detail the findings from previous research on hot spot policing, geographic crime concentration and patrol route creation. We then describe the methods and data that were used and how the two approaches were compared. In
Section 4 we present the results, and in
Section 5, we discuss the findings from the current study, implications, and limitations. Conclusions are provided in
Section 6.
2. Hot Spot Policing, Geographic Concentration of Crime, and the Creation of Hot Spot Patrol Routes
Police patrol has been a core function that police agencies have performed ever since police agencies were first established over 150 years ago. The physical presence of police officers patrolling the streets aims to prevent offending behavior and ensure that police officers can quickly respond to criminal incidents that occur nearby [
10]. Evidence shows that police patrols that are not directed to the areas in most need have limited impact in decreasing crime [
11,
12] whereas targeting the deployment of police patrols to crime hot spots, i.e., hot spot policing, can significantly decrease crime [
1,
13]. Crime hot spots are areas where crime is observed to highly concentrate, with this patterning observation being consistent in a range of international settings [
14,
15,
16] (and at different geographic scales of analysis [
17]). For example, in New York City, Vancouver, and Rio de Janeiro, studies have shown that less than 5% of places accounted for 50% of crimes [
18,
19,
20]. Focusing the deployment of police patrols to crime hot spots aims to deter criminal behavior [
21,
22] and restrict opportunities for crime commission in the places where there have previously been favorable conditions for committing crimes [
23].
Evaluations of hot spot policing interventions have shown that they can lead to significant decreases in crimes against property [
24,
25], violent assaults [
6,
26], drug offences [
27] and robbery [
3,
5]. Evidence also shows that crime does not significantly displace from the targeted patrol areas to other areas [
1]. Focusing police attention on the specific places within a city where a large proportion of crime is committed can also have an overall impact on decreasing crime in the city [
5]. Hot spot policing can also improve the public’s perception of security [
24].
When designing a hot spot policing patrol intervention, there are four tasks a police agency needs to complete: accurately determining where police patrols should be deployed; determining the type of patrol to deploy (foot, bicycle or vehicle); creating the patrol routes, and; determining the number of police officers that are required to cover the patrol routes. (We note that other tasks include choosing police personnel to perform the hot spot policing patrols, the supervision of these patrols and the logistics associated with their operational deployment e.g., ensuring that patrol officers comply with operational orders on where and when they are required to patrol. These tasks, while important, relate to the management of the patrols rather than the design of hot spot policing intervention.) First, the patrols need to be targeted to the specific streets where crime is known to concentrate. The geographic patterning of crime is highly heterogeneous. That is, although many areas of a city contain high crime areas, within these high crime areas only a small number of streets account for the area’s high level of crime [
28,
29]. Similarly, in areas considered to be low crime areas, there are often specific streets where the concentration of crime is high [
23]. This recognition has led to street segments being the geographic unit of choice in the analysis of crime when designing hot spot policing interventions so that specific high crime locations are identified [
29].
The first stage, therefore, requires an analysis of crime patterns that identifies the specific street segments that account for the highest levels of crime and hence where the hot spot policing patrols should be deployed. If the hot spot policing patrols are not deployed to the specific streets where crime is observed to highly concentrate, this can restrict the impact of these patrols. For example, a hot spot policing intervention in Bogotá, Colombia required police officers to patrol areas consisting of approximately 100 streets rather than only patrolling the specific streets within these areas where crime levels were highest. The hot spot policing intervention in Bogotá had very little impact on crime [
30]. In comparison, in Montevideo, Uruguay, a hot spot policing intervention that involved police officers being assigned to only patrol three to five connected street segments where crime had highly concentrated resulted in a 23% decrease in crime [
5]. Hence, it would seem that determining the specific locations where police patrols are deployed is an important factor in the likely success of a hot spot policing intervention.
Determining the type of patrol to deploy is related to the type of crime the hot spot policing intervention aims to address. Most hot spot policing interventions are designed to decrease certain types of crime (e.g., robbery, or theft of vehicles, or violent crime) rather than several types of crime. Therefore, the analysis of crime hot spots is most usually focused on examining hot spots of the type of crime the hot spot policing intervention aims to address (e.g., the analysis of hot spots of robbery for a robbery reduction intervention). The selection of crime type then influences the type of patrol to deploy. For crimes that occur against pedestrians in street settings, the type of patrol would most usually be foot patrol [
5,
6]. For crimes that involve offenders using vehicles in the commission of the crime, vehicle patrols are usually preferred [
9]. Bicycle patrols are used in settings that require the police to cover a longer distance in a shorter period of time than foot patrols and are most usually deployed when the crime to prevent takes place in street settings [
9].
The third task involves creating the hot spot policing patrol routes. Often, the street segments that have been identified in the hot spot analysis (we refer to these streets from this point forward as hot segments) may not be coterminous to each other, but are often located close to each other. This means a patrol that is directed to an area consisting of multiple hot segments will most likely need to traverse along streets that are not hot segments to reach other hot segments. The optimal hot spot policing patrol route, therefore, is one that covers street segments that have experienced the highest levels of crime and would include multiple hot segments. The length of the patrol route also needs to be considered. The length of the patrol route, based on the type of patrol, can be determined by estimating the pace of the patrol. For example, on average a person walks at a pace of six kilometers per hour, therefore, a patrol route that is one kilometer in length would take a police patrol ten minutes to walk the entire patrol route (if uninterrupted). Koper [
31] suggested that a patrol presence of 15 min in a hot spot for every hour is optimal for the deterrence effect of police patrols. Since this study, other researchers have tested Koper’s findings and have similarly suggested that 15 min in a hot spot is an optimal time for the presence of police patrols to deter offending behavior [
32,
33,
34]. Therefore, 15 min would give sufficient time for a foot patrol to walk a route of about one kilometer in length, stopping on occasion and optimizing their deterrence effect.
The fourth task involves determining the number of police officers that are required to cover the hot spot policing patrol routes that have been identified. Resources are finite, and therefore, police commanders need to decide on the resourcing that can be committed to a hot spot policing intervention. Each hot spot policing patrol usually consists of two police officers. (We note that in some settings where cars are used as the main type of patrol with only one police officer assigned to each car, such as in the United States, a hot spot policing patrol may consist of patrol officers being deployed to locations on their own.) If 20 hot spot patrol routes are identified, this would involve the allocation of 20 pairs of patrol officers if each was assigned to a single patrol route. As the optimal time to spend patrolling a hot spot is 15 min which, in turn, suggests a suitable foot patrol route is one kilometer in length, this could mean that a single police foot patrol could rotate between at least three hot spot policing patrol routes that were located nearby (i.e., within a five-minute walk of each other, and visiting each within a one-hour period), walking each route in turn. This would, therefore, reduce the number of patrol officers that would need to be allocated to the hot spot policing intervention from 20 pairs (if each pair was assigned to a single hot spot patrol route) to no more than seven pairs (each pair patrols no more than three patrol routes). Other roles, such as the supervision of the patrols and the duration of time that hot spot patrol routes would require police presence would also need to be considered to determine the exact number of police personnel to allocate to the intervention. Assigning resourcing to the supervision of patrols is useful because it ensures that patrol officers are monitored and comply with the instructions on where they need to patrol. We return to determining the number of police officers that are required to cover the hot spot policing patrol routes in the discussion section when we review the hot spot policing patrol routes that are created.
To date, there has been limited research in creating adequate hot spot policing patrol routes using computational approaches [
35,
36]. In computational terms, the creation of hot spot policing patrol routes is associated with the dynamic vehicle routing problem [
37] that involves determining optimal shortest paths. However, as described above, there are particular requirements that relate to the creation of hot spot policing patrol routes that require consideration, such as the creation of patrol routes only in areas that are crime hot spots and constraining the lengths of the patrol routes to optimize the deterrence effect of police patrols while maximizing the area a patrol can practically cover. Patrol routes also need to be created in which the paths within a route cover street segments where the levels of crime are highest rather than the path between two points being the shortest [
36]. Most solutions that have been designed to support the police patrol function have focused on how to dispatch and allocate police patrols to areas (for examples see Camacho-Collados and Liberatore [
38] and Chelst [
39] rather than determining the routes the patrols should take. Examples of computational approaches that target the deployment of patrols to crime hot spots include Kuo et al. [
40], who offered a solution using the shortest path approach to connect the crime hot spots where police patrols should be deployed. Chen et al. [
41] also developed a solution to assist the real-time deployment of police patrols that involved issuing instructions about where the next patrol should take place based on where crime hot spots were located. Albeit useful, these solutions have not involved creating patrol routes within hot spots of crime. One of the only known computational solutions for creating hot spot policing patrol routes was by Chawathe [
42] that involved modelling the street network as an edge-weighted graph (weighted by the incidence of crime) and using this to consider the importance (in crime terms) of each edge (i.e., each street segment) in the creation of patrol routes. While useful, Chawathe’s solution required the patrols to traverse each edge in both directions and hence potentially duplicating effort in certain street segments at the cost of not including other nearby street segments in the patrol’s coverage where crime had been observed. Additionally, the solution was not evaluated to determine how accurate it was in practice and, similar to most other computational solutions for creating police patrols, was developed by researchers with limited consultation with police officers responsible for patrol deployment. Collectively, this has meant there has been limited use of computational approaches in practice to support the creation of hot spot policing patrol routes.
To date, the design of hot spot policing patrol routes has remained a manual task for a crime analyst and a police officer to complete. For the design of the hot spot policing patrol intervention to be effective, it requires an analysis of spatial patterns of crime to determine the streets where police patrols should be deployed, from which patrol routes are created that effectively cover these hot spots. In this paper, we introduce a spatial computation approach that generates the routes for hot spot policing patrols. The spatial computation approach includes an analysis of crime concentration, and uses principles associated with addressing the travelling salesman problem and shortest path street routing in the creation of the patrol routes. We compare the hot spot policing patrol routes that are created using the spatial computation approach to the routes that were manually created by a team consisting of police commanders and police officers trained in hot spot analysis. The spatial computation approach was developed in consultation with these police personnel and practitioners experienced in hot spot policing and police resource deployment. We hypothesize that the automated spatial computation approach outperforms the cognitive heuristic approach in the creation of hot spot patrol routes.
3. Data and Methods
In the current study, we created hot spot policing patrol routes for two Brazilian cities—Florianópolis and Joinville. The population of each city was 509,000 and 598,000, respectively. These cities were chosen because they were cities where the police were keen to implement hot spot policing interventions to decrease robbery against pedestrians. Data on robberies against pedestrians for the period 1 February, 2019 to 31 January, 2020 were provided by the police agency for both cities. These data were geographically referenced to the specific locations where robberies occurred and were checked for accuracy. (The geocoding hit rate was above the 85% minimum threshold for reliability suggested by Ratcliffe [
43]). The number of robberies against pedestrians recorded in Florianópolis was 1184 for this period and was 1327 in Joinville. Most of the robbery data were geographically referenced to street segments (no data were geographically referenced to street junctions). When a robbery was geographically referenced a short distance from a street segment, these records were linked to their nearest street segment. A count of the number of robberies on each street segment in each city was calculated.
Three methods were used for creating hot spot policing patrol routes. The first was a cognitive heuristic approach involving the manual creation of patrol routes by a police commander using the results of an analysis of hot spots that other police officers had generated. The second and third methods involved an automated hot spot analysis operation and the creation of hot spot policing patrol routes using two slightly different computational techniques. We next describe each method in full.
The manual cognitive heuristic approach consisted of two stages: (1) A hot spot analysis of crime concentration in each city and (2) the creation of hot spot policing patrol routes using the results of the hot spot analysis. These manual tasks were completed by two police officers (a police officer for each city) who received training in geographic crime analysis and the police patrol deployment commanders for each city, supported by an academic consultant who had expertise in hot spot analysis and in designing effective hot spot policing interventions. The analysis training the police officers received included technical training in the mapping of crime data, hot spot analysis using kernel density estimation (KDE), and analysis of micro-place crime concentration using street segments. The training took two days to complete and used the robbery against pedestrians data as the data sample to create results that showed the street segments that accounted for 50% of crime and KDE maps showing areas of high crime density in each city. This approach followed the process used in several other studies (e.g., Chainey at al. [
5] and Ratcliffe et al. [
6]) for identifying where to target a hot spot policing intervention.
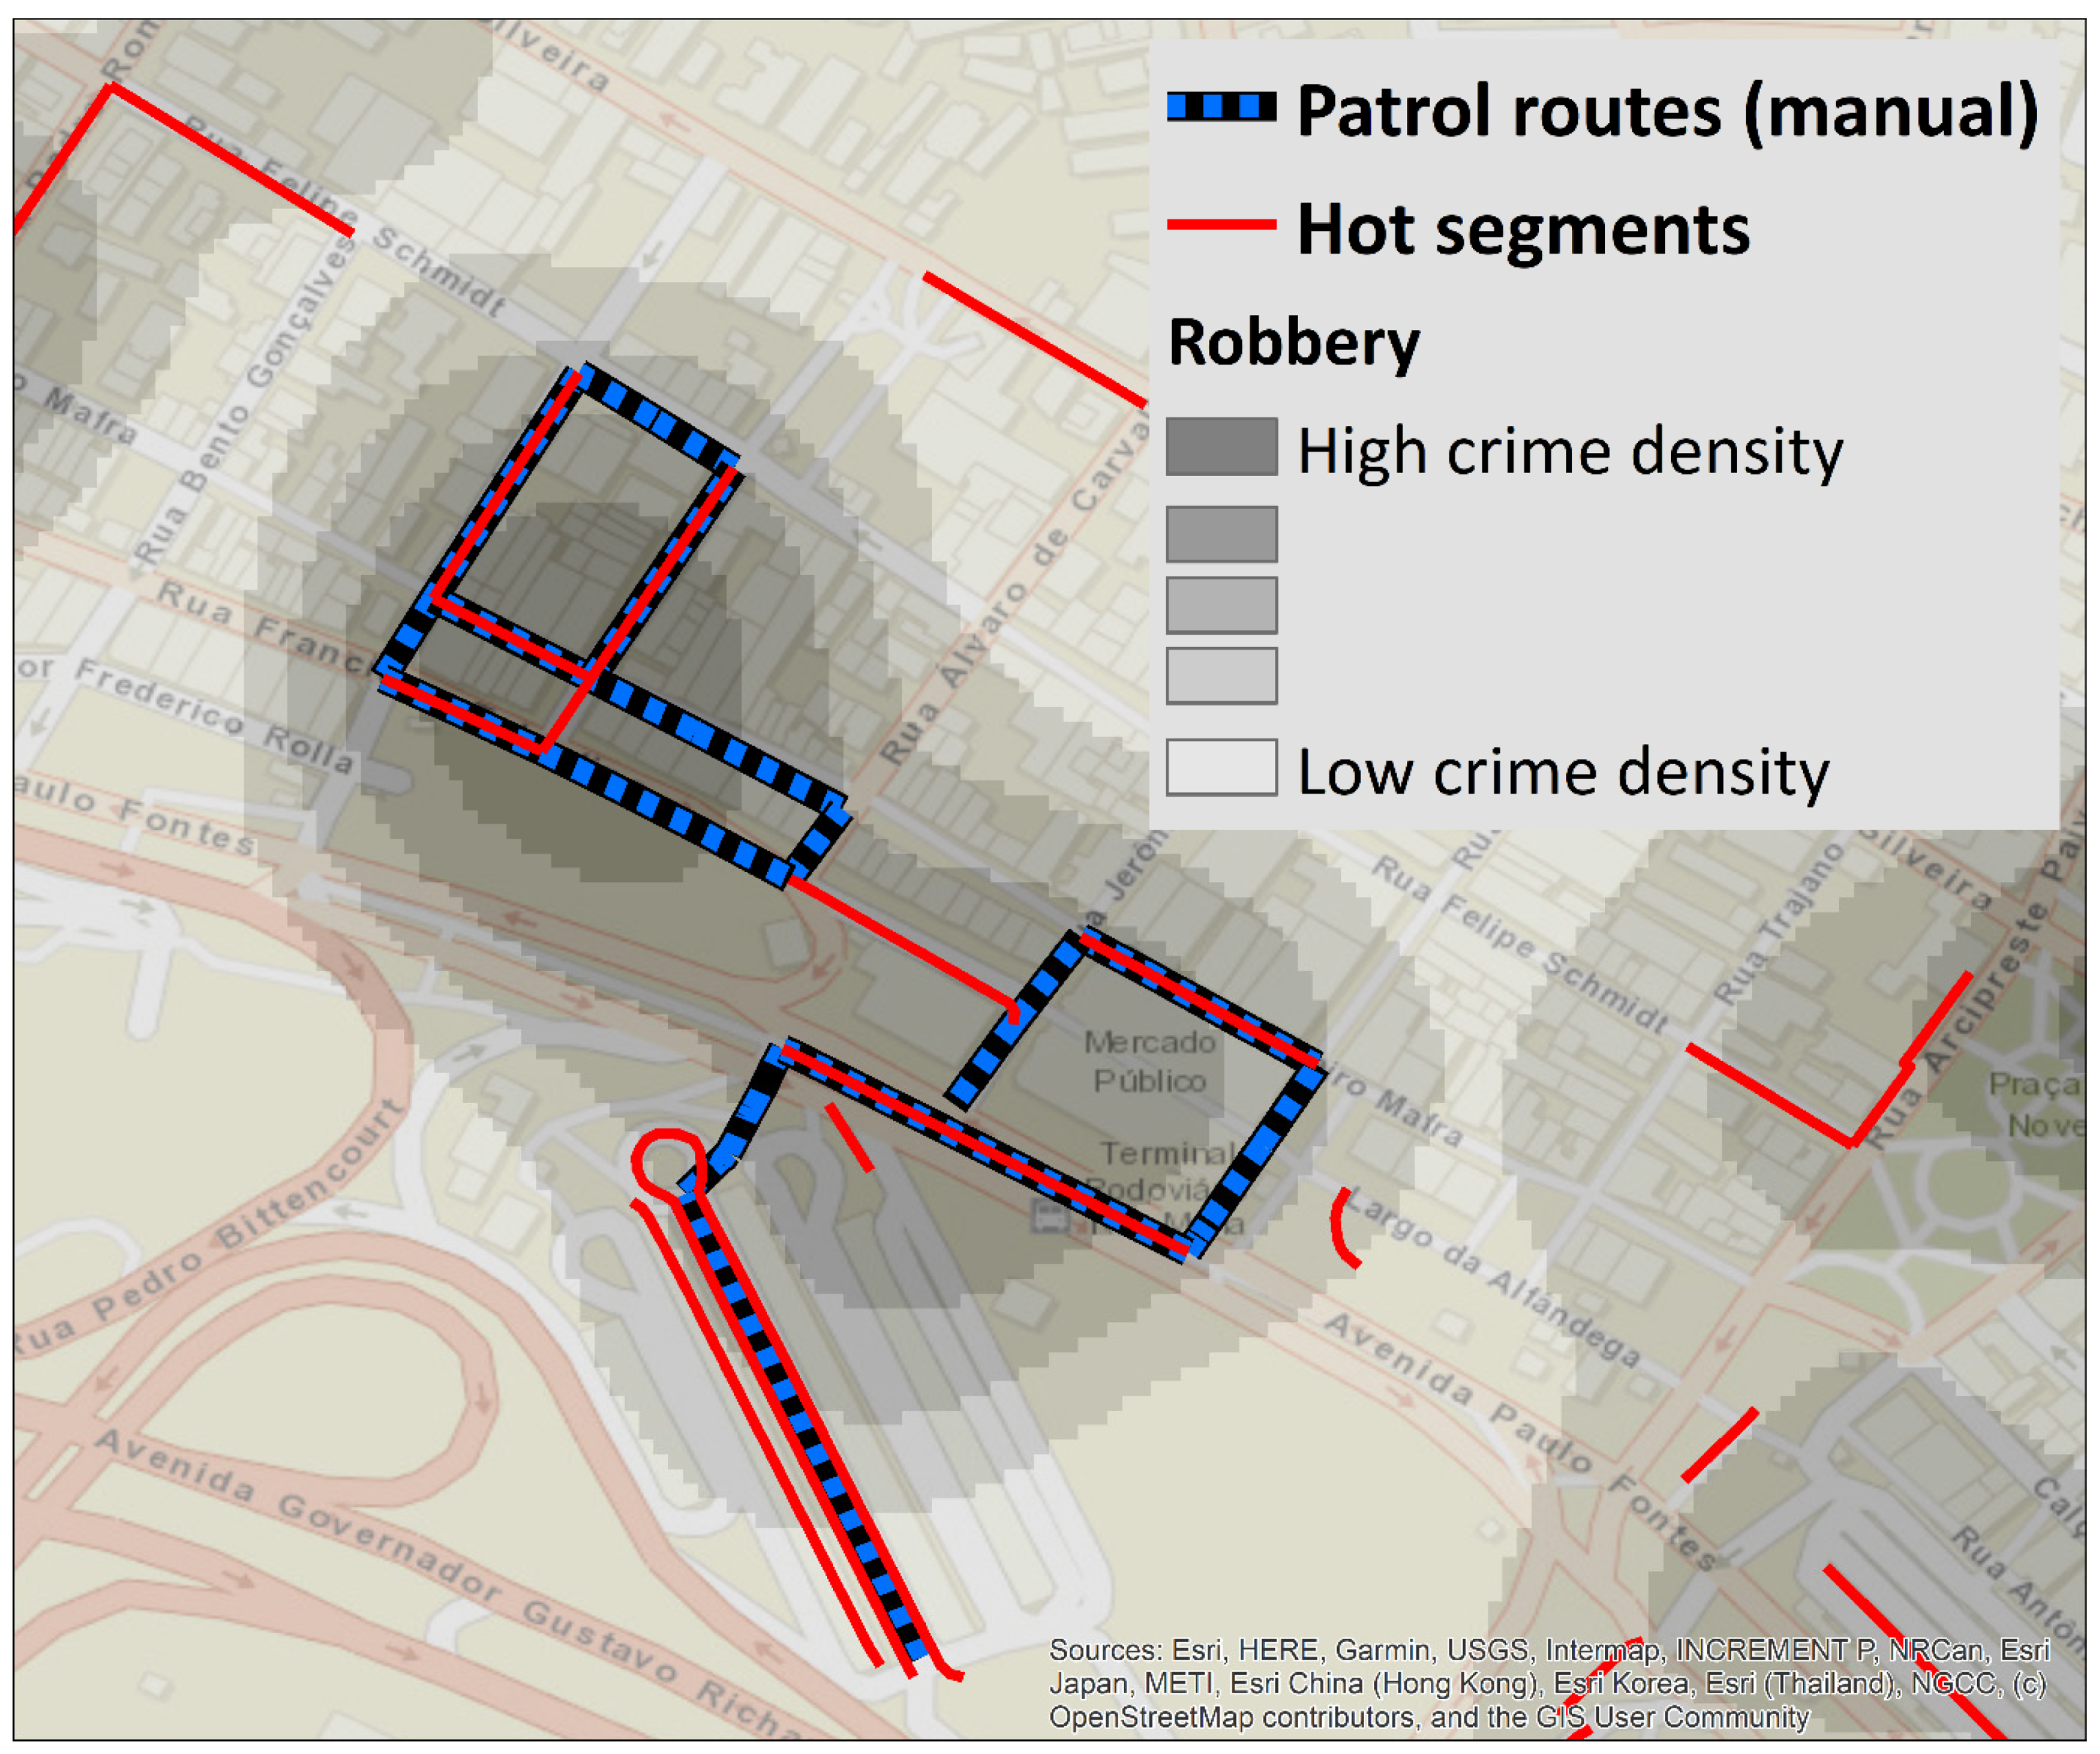
On the day after the training, the police officers and academic consultant met with the police commanders for each city and used the hot spot analysis results to draw hot spot policing patrol routes. Each route was confined to a minimum of 750 m and a maximum of 1250 m to conform with the average time of one kilometer it would take a police foot patrol to walk each route. These routes were drawn in a GIS so that the length of each route could be measured as the route was drawn. The routes were drawn so that they covered as many hot segments as possible. In most cases, hot segments were not coterminous. KDE maps were used to guide the drawing of the patrol route to connect multiple hot segments within an area while also covering an area where the clustering of crime was observed. For each route, the start and end locations were the same (because this would make the operational coordination of patrol assignments clearer). This meant that a route could be a simple circular path around street segments that were connected or proximal to the start and end location, or could contain paths that were circular within the patrol route but as long as the end point of the patrol route was the same as the starting point.
Figure 1 is an illustration of this process, showing hot segments and the KDE output, and two patrol routes that were manually drawn for this area.
The manual creation of the hot spot policing patrol routes went through several iterations before the police commander for each city was content with the hot spot policing patrol routes that had been created. The main objective was for the routes to cover the streets that had experienced the highest levels of crime; however, the knowledge that each police commander had of their city was also used to draw patrol routes that followed logical paths. For example, in Florianópolis, this included drawing the route shown in
Figure 1 so that it covered the streets around a market and the street through the city’s main open-air bus terminal. In total, 20 patrol routes were created in each city because it was estimated that no more than 18 police officers could be deployed to the hot spot policing intervention in each city during an operational police shift (i.e., eight pairs of patrol officers rotating between two or three patrol routes, and two supervisors).
The second and third approaches involved two stages to the computational process. The first stage was the same for both and involved the automated identification of street segments that accounted for 50% of robberies against pedestrians in each city. This was identical to the manual process for identifying the hot segments. In computational terms, this process involved identifying the smallest set of n street segments that accounted for 50% of all robberies in each city from a population of N street segments (all street segments in a city) from a graph G that represented the street network of each city, where G consisted of edges (street segments) and nodes (street junctions).
To compare with the manual approach, each computational approach was restricted to selecting the best
K routes, where
K was set to 20. Each route was also restricted to respect the minimum (
m) and maximum (
M) length of a patrol route, with these being set to 750 m and 1250 m, respectively. A condition placed on each computational approach was that the start and end location of the patrol route must be the same, complying with how the manual routes were created. The two computational approaches we designed then differed in terms of how they maximized the inclusion of hot segments in hot spot patrol route creation. We report in full on the mathematical and coding aspects of these computational approaches in a complementary article [
44] that also includes details about the software we created. In the current article we provide a technical description of each computational approach.
We named the first computational technique HotStar (standing for Hot Segments Linkage A* based Heuristic). The HotStar algorithm works by selecting a street segment that has been classified as a hot segment (that is an edge (
s,
t) on the street network
G) and then searches for a path
p on
G that begins at
s, ends at
t and that generates the highest count of crimes along path
p after considering all options for
p. Path
p cannot again travel through the edge (
s,
t) and must be within the patrol route parameters of
m and
M. An illustration of this process is shown in
Figure 2. HotStar repeats this procedure for each hot segment that has been identified in the study area, placing the additional condition that no edge on the street network
G is included more than once in any path
p, and finishes when
K patrol routes have been created that collectively account for the greatest number of crimes covered by these
K routes. The HotStar algorithm also includes a condition that avoids path
p doubling back on itself. This involves path
p only traversing along edges that have not already been included as edges in path
p. Nodes can be included more than once on path
p. We illustrate other examples of the patrol routes created using the HotStar algorithm in the Results Section.
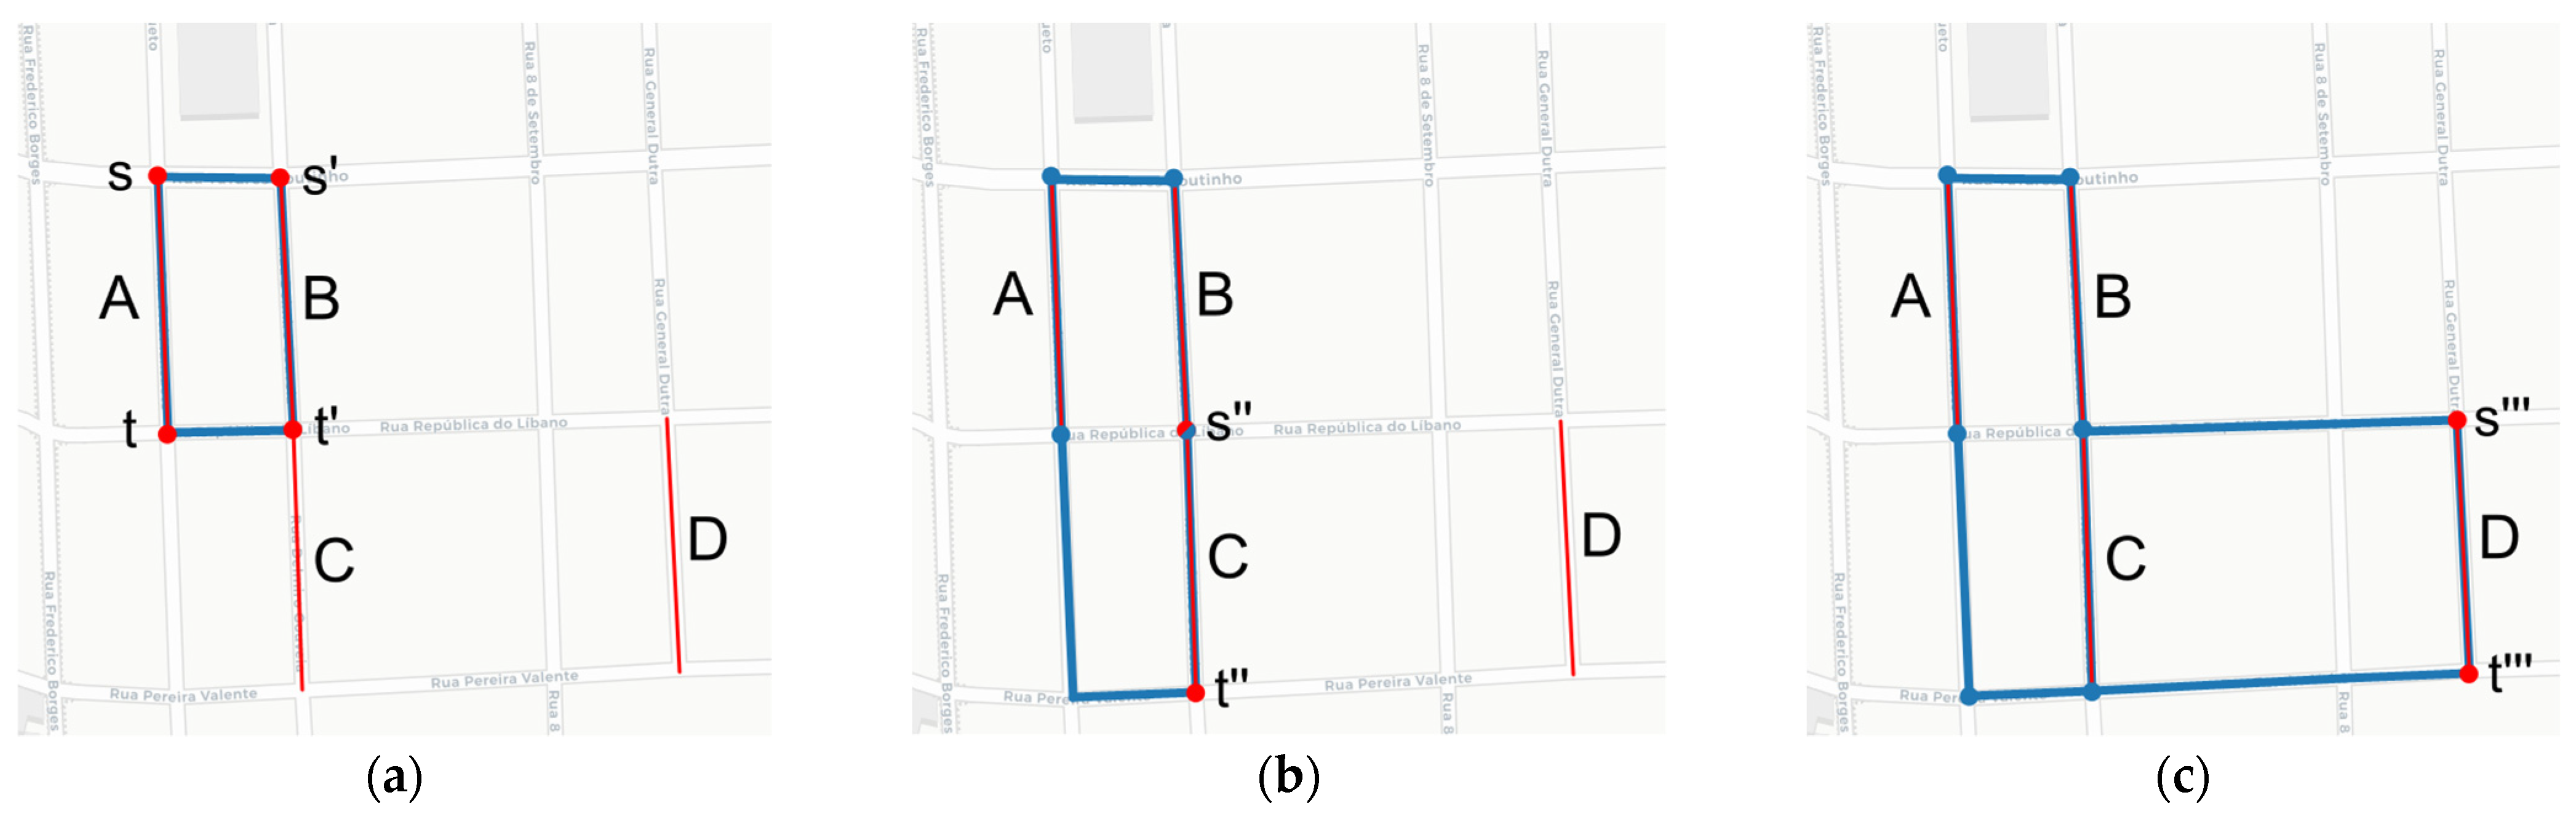
We named the second computational technique HotSee (standing for Hot Segments Linkage Route Generation Heuristic). The HotSee algorithm initially works in the same way as HotStar by selecting a street segment that has been classified as a hot segment and creates routes containing the highest count of crimes along path
p, but different from HotStar, it achieves this by also attempting to maximize the number of hot segments included in path
p. Once a hot segment has been identified, HotSee searches for the shortest path between the hot segment (
s,
t) and another hot segment (
s’,
t’) on
G, and where (
s’,
t’) does not already belong to another patrol route. The search for another hot segment is performed twice, commencing from
s and then
t in search of another hot segment and by testing options for path
p that arrive at either
s’ or
t’. Once the shortest path between (
s,
t) and (
s’,
t’) has been established, HotSee then progresses by attempting to join other hot segments (e.g., (
s’’,
t’’), (
s’’’,
t’’’),etc.) by connecting them to any node
u that belongs to path
p. A connection is made to another hot segment by searching the shortest path from any node
u in
p to one of the nodes of the new hot segment (e.g.,
s’’ or
t’’). This process is illustrated in
Figure 3, showing how a hot segment that was initially selected is then joined by a path to other hot segments nearby. The search for the shortest path is also performed in the opposite manner by starting from a node of the new hot segment (e.g., from the node
s’’) to node
u on path
p, with path
p extending to this new hot segment once the shortest path has been established.
HotSee repeats the procedure described above for each hot segment that has been identified in the study area and finishes when K patrol routes have been created that collectively account for the greatest number of crimes covered by these K routes. Different from HotStar, HotSee can include the same edge on the street network G within a path p, meaning that within a single route, an edge may be traversed more than once. However, recall that HotSee creates paths that aim to contain the highest count of hot segments (from all options of p). In this calculation, an edge that is included more than once in path p (and which may be a hot segment) is only included once in the calculation of the number of crimes (and the number of hot segments) along path p. Similar to HotStar, the length of path p using the HotSee approach is constrained by m and M, and the path selected is that which generates the highest count of crimes along path p after considering all options for p. An outcome of the HotSee approach is that it is more likely to generate patrol routes that contain small cyclical paths within a path p (e.g., a path around a single street block that is within a larger patrol route). We illustrate other examples of the patrol routes created using the HotSee algorithm in the Results Section.
To compare the hot spot patrol routes created using the cognitive heuristic approach and the two automated spatial computation approaches, we used four statistical measures. The first measure was the number of crimes that were previously committed on the routes, termed W. The greater the value of W, the better the routes were for hot spot policing purposes. The second measure, termed the Hot segments Length Factor (HLF), was the proportion of the patrol routes (in terms of length of the route) that were hot segments, with higher values of HLF indicating better hot spot policing patrol routes. The third measure was the density of crimes on the street segments across all routes created, termed the Crime Density Index (CDI, shown in Equation (1)). The CDI compares the number of crimes located on patrol routes and the length of these routes with the total number of crimes and the total length of all street segments in the study area. That is, it indicates how many times greater the hot spot policing patrol routes were
hotter than the street network in the study area as a whole. The greater the CDI, the better the routes were for hot spot policing purposes.
The fourth measure, termed the Non-Repeated Edges Factor (NREF), was the proportion of the total length of all the routes that did not consist of repeated edges (measured also by their length) on all routes. This measure was useful because, in practice, hot spot policing patrols aim to avoid traversing the same street more than once because this duplicates their presence on this street at the potential cost of not patrolling another street where their presence can be beneficial [
9,
10]. The greater the value of NREF, the better the routes were for hot spot policing purposes. We also calculated the level of crime concentration in each city (as the proportion of the most criminogenic street segments of all street segments that accounted for 50% of crime, i.e., hot segments), the mean and standard deviation of the patrol routes lengths, and the run time for the creation of patrol routes using HotStar and HotSee. We also performed a visual inspection of the patrol routes for further comparison between the manually generated routes and the routes created using HotStar and HotSee.
4. Results
Table 1 shows that the levels of crime concentration across street segments in Florianópolis and Joinville were high and similar: the proportion of street segments that accounted for 50% of crimes was 1.1% and 1.6%, respectively. These results are consistent with findings on the high levels of geographic crime concentration of robberies in other Latin American settings [
14] and that the implementation of a hot spot policing program in each city would be worthwhile.
Table 1 also shows the results for the hot spot patrol routes created using the cognitive heuristic approach (labelled ‘manual’ in the table) and the two automated spatial computation approaches—HotStar and HotSee. In terms of route lengths, the mean route lengths for each of the approaches for both Florianópolis and Joinville ranged between 1161 m for the manual approach (in Florianópolis) and 1066 m and 966 m for HotStar and HotSee (in Joinville), respectively. For both cities, HotStar and HotSee generated routes where the mean lengths were approximately 100 m shorter than those created using the manual approach. The standard deviation for the length of the hot spot policing routes was also much greater for routes created using the manual approach, indicating that the manual approach generated routes that varied much more in their length than the computational approaches.
For each city, both HotStar and HotSee created hot spot policing patrol routes where there had previously been a greater number of robberies than the patrol routes created using the manual approach. For example, in Florianópolis, when considering the W metric, the routes created using HotStar were where 226 robberies had previously occurred compared to 183 robberies on the manually created patrol routes. For both cities, the HotStar approach created patrol routes that contained more crimes than the routes created using HotSee: 226 robberies using HotStar and 207 using HotSee in Florianópolis; 224 robberies using HotStar, compared to 204 using HotSee in Joinville. Overall, the computational approaches generated hot spot policing patrol routes for Florianópolis that contained 19% more robberies than the routes created using the manual approach, and 44% more robberies than the routes created using the manual approach for Joinville. The computational approaches also generated routes that contained a greater proportion of hot segments (see
Table 1, HLF measure). For example, in Joinville, 42% (using HotStar) and 49% (using HotSee) of the patrol routes (in terms of length of the route) were hot segments, compared to 35% for the routes created from the manual approach.
The CDI values for the routes that were created using the two computational approaches were also greater than those calculated for routes created using the manual approach. In each city, the CDI values were similar for HotStar and HotSee and suggested that routes covered by the patrols were in places that were 20 to 21 times hotter (in terms of crime density) than that observed in each city as a whole. This compared to 18 times and 14 times hotter, for Florianópolis and Joinville, respectively, for the patrol routes that had been created manually. The computational approaches also performed better than the manual approach in minimizing the number of street segments that were traversed more than once on any patrol route (shown by the NREF measure in
Table 1). As this was a condition built into HotStar, all street segments on routes that were created using this approach were not traversed more than once. For HotSee, 99% of the patrol route lengths in both cities were traversed once. This compares to 82% and 97% in Florianópolis and Joinville, respectively, which were only traversed once using the manual approach. These NREF results suggest that the computational approaches created routes that would be more efficient in the street segments that would be patrolled than those routes created using the manual approach.
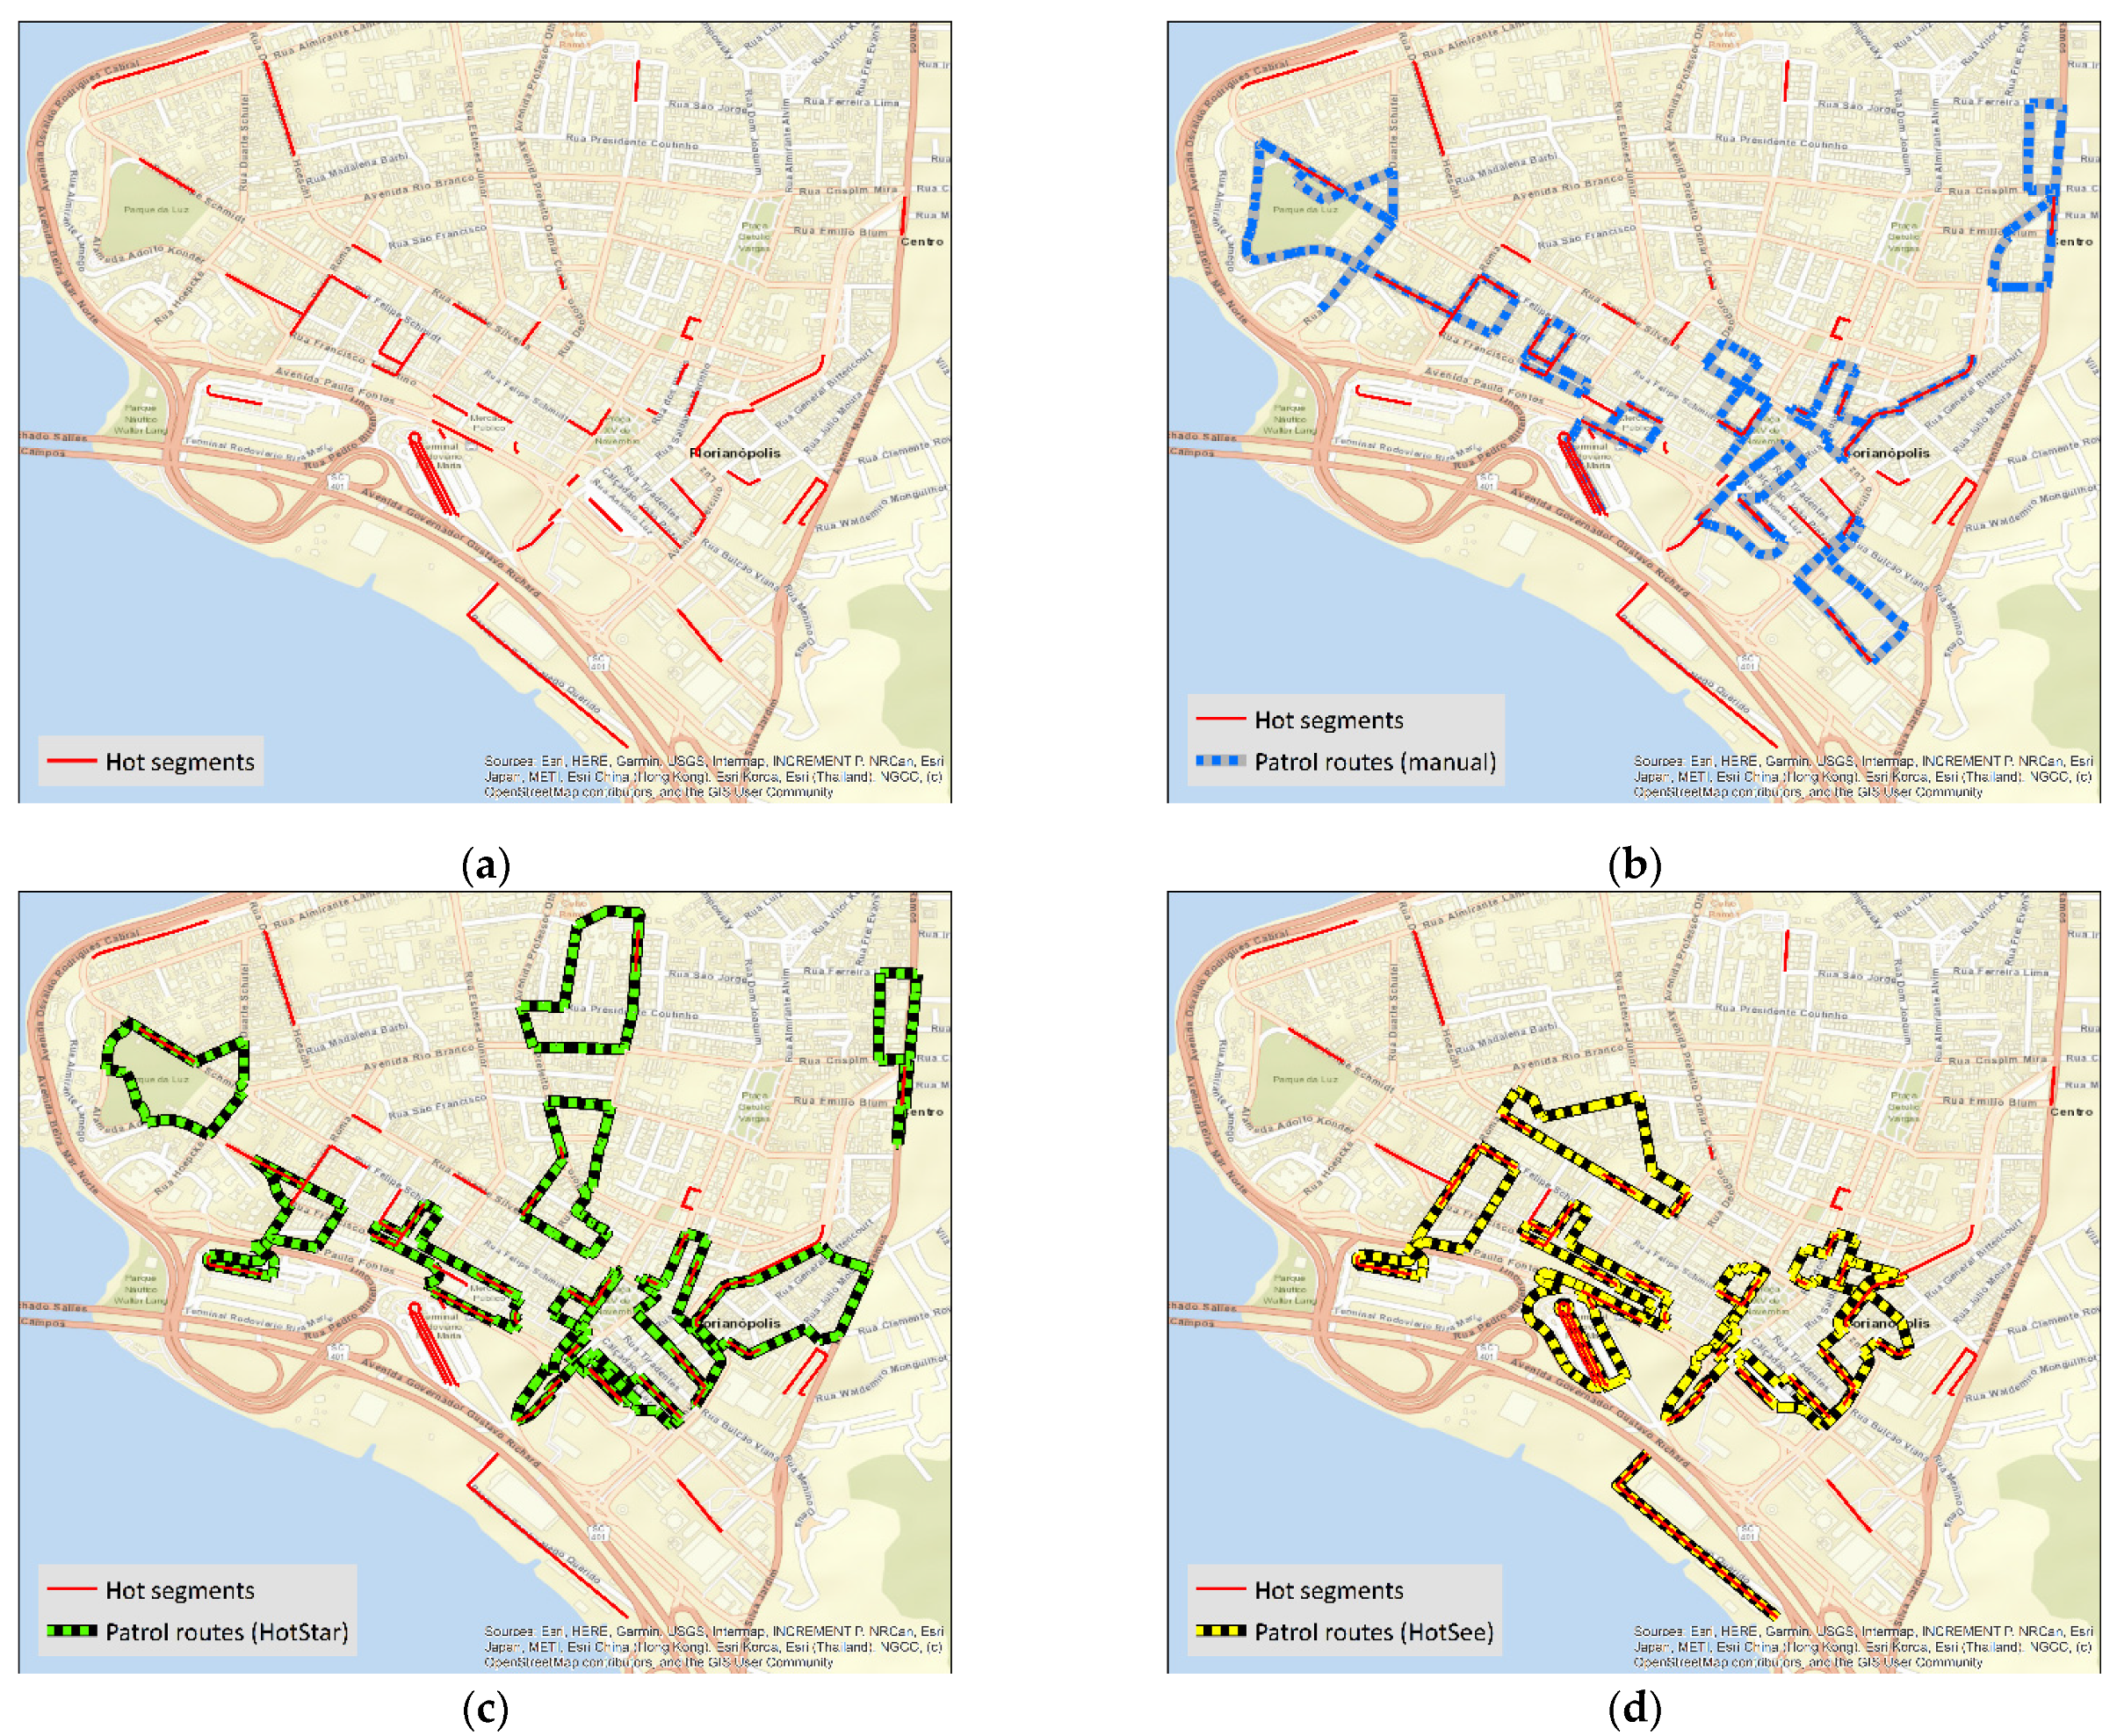
Figure 4 shows the downtown area of Florianópolis where several hot spot policing patrol routes were created using each approach.
Figure 4a shows the hot segments for this part of the city and illustrates that some of the hot segments were coterminous to others and other hot segments were not.
Figure 4b–d show the patrol routes created using the manual approach, HotStar, and HotSee. Each approach created patrol routes in similar areas.
Figure 4c shows how the HotStar approach avoids the inclusion of street segments that are traversed more than once, whereas
Figure 4d shows how the HotSee approach is more oriented to including hot segments in the creation of each patrol route and may do so at the expense of traversing a street segment more than once. The patrol routes created using the manual approach in
Figure 4b appear neater in comparison to those created using the computational approaches and show that in places the patrols would be directed to follow a path consisting of multiple segments along a single street rather than being directed at a street junction to turn down another street. It would appear that for these instances the computational techniques created routes that directed the patrols down the street segment where more crime had previously occurred.
Overall, the automated computational approaches outperformed the cognitive heuristic approach on each of the measures that were used to compare the patrol routes that were created. Additionally, the time taken to generate the patrol routes was significantly shorter for the computational approaches, each taking no more than a matter of a few minutes at most to create hot spot policing patrol routes in comparison to the multiple days it took for the manual creation of patrol routes to be completed.
5. Discussion
Hot spot policing is an effective type of intervention for decreasing crime [
13]. To date, the creation of hot spot policing patrol routes for these interventions has mainly been a manual task involving the analysis of crime hot spots and the use of the results from this analysis to determine the routes where police patrols should be deployed. Using a computational approach involving the use of two algorithms for creating hot spot policing patrol routes, the computational techniques created routes where more crime had been committed in comparison to a manual approach for creating patrol routes. The routes created using the computational techniques also covered more streets that contained the highest levels of crime (i.e., hot segments), and designed routes that better maximized the coverage of the streets that the patrols would cover while being constrained to the practical length of a patrol route. The two computational approaches—HotStar and HotSee—covered areas that accounted for 19% more robberies in Florianópolis and 44% more robberies in Joinville than the manual approach, suggesting that if either of the two computational techniques were used to decide where hot spot policing patrols were deployed, this could lead to a greater decrease in crime than if the patrol routes using the manual approach were used. There was little difference in the performance between HotStar and HotSee, albeit with HotStar generating slightly better results for the number of crimes along the patrol routes it created and with HotSee generating slightly better results for the crime density measure.
The COVID-19 pandemic in 2020 and 2021 in Brazil meant that the hot spot policing intervention was not implemented in Florianópolis and Joinville, but plans are still in place to implement these interventions in due course. Upon implementation of this plan, we anticipate experimenting with using the routes created from the computational approaches and the manual approaches to examine if the use of these routes leads to any differences they have in the impact of crime. In situations where this type of in-field experimental option is not possible, we encourage the use of agent-based modelling approaches that can generate simulated comparisons between the computational creation of hot spot policing routes and manually created routes.
The computational techniques we designed for creating hot spot policing patrol routes were based on the distribution of street segments and did not include information about the environmental landscape. This means that routes the computational techniques created did not consider lines of sight and the presence of physical obstacles that would limit the visibility of the police patrols, such as trees, buildings, and street furniture. The manual creation of the hot spot policing patrol routes draws on the local knowledge of the police officers who were involved in the creation of these routes, and therefore for some routes, the patrol route that was proposed using the manual approach may be more practical and potentially more impactful in deterring crime than for the routes created using the computational approach. Visual inspection along the routes created using the computational techniques (by visiting these locations) would identify if any physical obstacles may limit the police patrols being seen. This could lead to slight modifications of the routes created using the computational techniques, with the recalculation of the measures used in the current study (e.g., W and NREF) showing how these modifications may affect changes in the potential impact of the hot spot policing patrols. Visiting the proposed patrol routes is also important to check the routes are safe for police officers, especially at night and in Latin American settings where assaults against police officers are not uncommon [
45]. Visual inspection of the patrol routes created using the computational techniques may also result in identifying ways these routes may be even more impactful by identifying specific street segments or street junctions that could be included in the route that would further enhance the visible deterrence offered by the police patrols. For example, this could include an extra segment being added to a patrol route (while also being less than
M) that is a busy street with clear lines of sight that would add to the number of people (including potential offenders) who observed the police patrols. Thus, it is suggested that the patrol routes created using HotStar or HotSee (or other effective computational approaches) could be improved by visiting the routes these techniques create and identifying ways that the visible presence of the police patrols could be improved through small adjustments to these routes.
Once hot spot patrol routes are created, it can be more straightforward to determine the amount of resourcing that is required for patrolling these hot spots. As described in a previous section, rather than a police patrol being present only along a single patrol route, if other patrol routes are located nearby this may mean that a single police patrol could patrol more than one patrol route, rotating between them so they are present for at least 15 min per hour on each route. For example, using the results from the current study we estimated that eight pairs of police patrols would be sufficient in each city—Florianópolis and Joinville—to effectively cover the 20 patrol routes that were identified. After discussions with the police commanders for each city, they decided that they would assign two supervisors to each city to support the management of the hot spot policing deployment and who would visit the police patrols in a vehicle. Supervision of patrol officers is important because if unsupervised, patrol officers’ self-initiate where and when patrols should be present [
46] and often to areas where patrols are unnecessary. This meant that the initial level of police officer deployment would be 18 police officers in each of the cities included in the current study. In practice, rotating pairs of patrols between patrol routes also helps to reduce the boredom that can be associated with patrols being assigned to just a single area and can improve the commitment of patrol officers to the hot spot policing intervention [
10].
Hot spots of crime are not hot spots all of the time, so additional analysis is required when designing a hot spot policing intervention that determines when the hot spot policing patrol routes should receive patrols. Previous research shows that hot spots only experience high levels of crime on certain days of the week and times of the day, with the time duration for high levels of crime in areas where hot spot policing patrols are to be deployed being no more than six hours [
5,
6]. This would suggest that no more than a single patrol would be required to serve in a hot spot on a day of the week. However, in instances when hot spots experience high levels of crime for a longer duration, two patrols may be required—one that covers the first part of the time duration and the second that takes over for the second part of the time duration. Additionally, in instances when hot spot patrol routes require police presence on more than five days per week, this may require two sets of patrolling officers—one that covers the first part of the week and the second that takes over for the second part of the week. This type of resource allocation would need to be considered by police commanders to determine the number of police officers that would be required for the hot spot policing intervention.
A limitation of the methods described in the current study is that they only considered spatial patterns of crime rather than also considering temporal patterns of crime. As indicated in the paragraph above, consideration of temporal patterns of crime is important when designing a hot spot policing intervention. The process described above involves a manual inspection of temporal patterns to determine when hot spots are present. Further research could build on the results from the current study by including an analysis of temporal patterns within the design of computational algorithms for creating these patrol routes.
In the current study, we used data for a one-year period to create hot spot policing patrol routes. Hot spots of crime do not tend to change over time [
23,
47], and, as evidence from hot spot policing interventions suggests that spatial displacement of crime is rare [
1], it is unlikely that patrol routes need to frequently be changed. However, we suggest that the impact of the hot spot policing patrols are continually reviewed (e.g., on a monthly basis as a part of a police agency’s routine performance review meeting process) to identify if displacement has occurred. This review process may also identify if a diffusion of benefit effect has occurred, which can often be the case with hot spot policing interventions [
20]. If the hot spot policing intervention is implemented as a long-term solution, it is recommended that the patrol routes are reviewed every three to six months to identify if new hot spots have emerged and require attention [
9].
To date there is limited research about whether foot patrols in crime hot spots rather than vehicle patrols (or other types of patrol such as those on motorbikes or bicycles) have a greater impact on decreasing crime. As stated in a previous section, the types of patrol to deploy are most likely to depend on the type of crime that is the focus of the hot spot policing intervention, e.g., foot patrols for reducing robberies against pedestrians and vehicle patrols for reducing vehicle thefts. The focus of the current research was on creating foot patrols for a robbery hot spot policing intervention; however, the procedures we describe for how the algorithms work could be adapted to create other types of patrols in crime hot spots. This would involve changing the minimum and maximum lengths of the patrol route so it complied with the practical area that the patrol could cover. It would also require consideration of the paths that these modes of transport could take, such as car patrols that would only be able to traverse a one-way street in a single direction. We encourage further research that develops computational approaches for hot spot policing patrols that use cars, motorbikes. or bicycles.
The findings from the current study were for two Brazilian cities and compared the results from two computational techniques to a single manual approach. If multiple manual approaches were used, this would provide a more accurate comparison between the manual and computational approaches. Our analysis did not reveal significant differences in the performance of the two computational techniques, but there were differences in the two Brazilian cities in how the manual approaches performed in comparison to the computational techniques. For example, the computational techniques created patrol routes that covered areas that accounted for 19% more robberies in Florianópolis and 44% more robberies in Joinville in comparison to the routes that were created manually. Both manual approaches followed the same process in creating hot spot policing routes; therefore, it is not clear why there were differences. We encourage replication of our study to determine whether our results are generalizable to other settings.


 ,
, 


