Article

Generating Different Urban Land Configurations Based on Heterogeneous Decisions of Private Land Developers: An Agent-Based Approach in a Developing Country Context

School of Earth and Environmental Sciences, The University of Queensland, St Lucia 4072, Australia
*
Author to whom correspondence should be addressed.
ISPRS Int. J. Geo-Inf. 2019, 8(5), 229; https://0-doi-org.brum.beds.ac.uk/10.3390/ijgi8050229
Submission received: 19 March 2019 / Revised: 30 April 2019 / Accepted: 8 May 2019 / Published: 16 May 2019

Abstract

:
In the provision of urban residential areas, private land developers play critical roles in nearly all stages of the land development process. Despite their important role little is known about how the spatial decisions of individual developers collectively influence urban growth. This paper employs an agent-based modelling approach to capture the spatial decisions of private land developers in shaping new urban forms. By drawing on microeconomic theory, the model simulates urban growth in the Jakarta Metropolitan Area, Indonesia, under different scenarios that reflect the decision behaviours of different types of developers. Results reveal that larger developers favour sites that are more proximate to the city centre whilst smaller developers prefer sites that are located further away from the city, that drive a more sprawled urban form. Our findings show that new urban areas are generated by different developers through different processes. The profit maximisation behaviour by developers with large capital reserves is more predictable than those with small capital funds. The imbalance in capital holdings by different types of developers interacts with one another to exert adverse impacts on the urban development process. Our study provides supporting evidence highlighting the need for urban policy to regulate urban expansion and achieve more sustainable urban development outcomes in a developing world context.

Graphical Abstract

1. Introduction

Urban development, or the conversion of land from nonurban to urban, is contingent on the decisions of multiple actors [1]. Among the urban development actors, private land developers play a critical role driving the process of urban growth [1,2,3]. Their decisions to convert undeveloped rural land into urban use is a central process that drives the expansion of urban footprint [2,4]. Given that nearly 60 percent of the world’s population will live in an urban area by 2035 [5], a deeper understanding on how the spatial decision behaviours of land developers shape our urban footprints remains central to establish the necessary evidence on which smart policy that seeks to better regulate urban expansion and support sustainable urban development can be founded.
While the roles of developers on the urban development process are clearly important, current urban models often overlook the diversity of types, characteristics and behaviours of developers and the effects that this differentiation has across urban landscapes [6,7]. Past studies largely investigate the developers alongside other urban stakeholders including the government, the resident, landowners or the farmer [8,9]. The role and characteristics of land developers in current scholarship are considered as homogeneous with ‘undifferentiated whole, as if all developers were the same’ [2] (p. 353). In practice, developers exhibit distinct characteristics when designing multiple operation strategies or making spatial decisions concerning land development [3,10]. Furthermore, the lack of understanding of the various characteristics of developers leads to a policy to treat all types of developers in the same way. As a consequence, simplified policies applied to urban developers potentially result in an uncompetitive land and housing market, where a select few developers influence price [11]. In order to understand the heterogeneous role played by developers in the urban development process coupled with the consequences of this heterogeneity for urban planning, this study adopts an agent-based modelling (ABM) approach to explore the multifaceted characteristics of land developers and how their spatial decision behaviours affect the spatial form of the urban footprint.
Agent-based modelling is a computer-based approach with the capacity to simultaneously represent individual agent decisions and interactions, and collectively how these decisions and interactions result in emergent development patterns in space and over time [12,13]. In terms of urban development and land use change modelling, ABM models have previously been developed to analyse the role of the key players of ‘agents’—residents, government/planners and developers—in the land development process, and to simulate their behaviours and interactions among these ‘agents’ [14,15,16]. The advantage of ABM is that it has the capacity to go beyond some of the restrictive assumptions associated with other modelling techniques (such as cellular automata) in accommodating bounded rationality, heterogeneity among agents and out-of-equilibrium dynamics and interactions, enabling modellers to have flexibility in model design [14]. These advantages allow ABM-based approaches to incorporate human decision-making behaviours within the simulation of the urban development process [17,18,19]. As such, ABMs have received much attention in the urban modelling community in recent years with their application in a number of different contexts to simulate urban growth and land use change [17,18,20].
A number of ABM models have been developed to simulate the behaviours of agents based on microeconomic theory from three perspectives [21,22]: (i) a demand-side perspective where the emergence of new urban areas was generated by the demand of houses and for most of time determined by buyers; (ii) a supply-side perspective where land use transitions are driven by the behaviours of land developers; and (iii) market equilibrium, where a new urban area emerges through agreement being reached by agents representing both the supply and demand side (e.g., landowners and land buyers, or farmers and government). From the demand perspective, models such as the Spatial Land use Change and Ecological Effects (SLUCE) [23] were developed to simulate the microeconomic behaviours of sellers and buyers (and to a lesser extent renters), that is, buyers choosing a property that maximises their utility and sellers assuming that the potential buyer will outbid the current use. Caruso and Peeters [24] developed an ABM model to integrate the role of renters from the residential demand side, allowing relocation by renters and a competitive rental market. Parker and Meretsky [25] simulated the land conversion decisions of a hypothetical parcel manager through a fixed demand curve. Benenson [26] used a simple adaptation mechanism to set housing prices, assuming that the price of an occupied house adapts to reflect the wealth of the occupant and the average value of neighbouring houses. Some models also incorporate households’ characteristics to simulate the emergence of residential areas, such as households’ residential location choices according to their life cycle stage [27], maximisation of urban utilities [28,29] and their individual choice on open space [30].
From the market equilibrium perspective, Torrens [31] simulated the housing market interactions with dynamic price influenced by both the demand and supply sides, and the transaction prices of residences were based on market conditions or agent preferences. Some earlier work [32,33] applied ABM based on economics theory to simulate land market change. Such models also focus more on modelling explicitly the bilateral transactions between land buyers and sellers. The willingness of buyers and sellers to pay and accept land prices determine the success of land transactions under different market conditions [32,33].
With regard to supply-side models of the land conversion process, although it is fully acknowledged that developers play a critical role in shaping new urban development, especially under the increasing pressure on housing demand and a growing shortage of capital and land supply for urban use [34], few studies have attempted to model the decision behaviours of land developers to reveal how these decision behaviours impact urban growth [10]. This is possibly due to the dominant demand-side models focusing on the mature stage of land development where it is relatively easy to quantify and measure the impacts of agents when urban land has been converted with infrastructure development in place [6]. The role of developers, largely involved at the early development stage and related to how lands were acquired, prepared and converted into new urban areas, remains little known [10]. Some recent advances have emerged that incorporate multiple agents’ decision behaviours. For instance, Diappi and Bolchi [8] employed an agent-based model to simulate the supply-side redevelopment decisions of landlords and developers and examined the local housing market dynamics based on Smith’s rent gap theory [35]. Ligmann-Zielinska [4] developed an ABM to test different conceptions of risk-explicit decision making and decision rules that represent risk-taking and risk-averse attitudes of developers in the location decisions. Li and Liu [36] developed an integrated cellular-agent model to represent three categories of agents (resident, developer and government) and simulate the residential development of Guangzhou city in China. A similar work was done by Tan and Liu [9] in Wuhan and by Zhang and Zeng [37] in Changsha, China. Their supply-side model integrated government, landowners and developers and interactions amongst agents were schematised using a game theory framework. Nevertheless, the diversity of developer types, their characteristics and behaviours and the effects this differentiation has across large metropolitan areas is largely untacked [6,7].
This study presents an agent-based model based on the microeconomic theory to characterise the behaviours of different types of developers and their consequences on urban development. In particular, the model focus on the amount of capital that developers possess, the expected profit and market coverage. These factors can lead to different locational decisions, including land acquisition actions and adaptation strategies, which have been largely overlooked in current scholarship [10]. Spatial interactions between different types of agents reflecting the roles and decisions that developers play including securing land supply, realising urban development and setting land prices [1,3] are constructed and simulated under multiple scenarios, generating outcomes to understand how multiple types of developers play spatially and over time and how their decision behaviours can result in reshaping the urban spatial patterns and the urban land market.
The rest of the paper is organised as follows. Section 2 introduces the study area and analytic framework adopted to develop the ABM, followed by results from the model in Section 3. The discussion of the results is presented in Section 4, followed by conclusions and some future research directions in the final section.

2. Study Area and Model Development

2.1. Study Area

Jakarta Metropolitan Area (JMA), Indonesia was selected as the case study context (Figure 1) given that it is the third largest megacity in the world, serves as a typical example that has been experiencing substantial urban expansion over the past two decades [38]. With a total area of 6600 km2, JMA’s population has grown from 18.8 million in 1994 to 32.4 million in 2017 [39]. This metropolitan region contributes to nearly a quarter (24 percent) of Indonesia’s Gross Domestic Product (GDP) [40]. Numerous jobs opportunities in the JMA have attracted people from the neighbouring regions and across Indonesia to work and settle in the area [41]. The addition of 13.6 million habitants over the 17-year period creates substantial land demand not only for supporting the settlement, but also for commercial and urban services [42,43], resulting in an urban expansion of 40 km2 per annum on average over the period of 1994 to 2017 [38]. From the early 1980s, new urban areas in the form of large-scale housing and new towns have been constructed by private land developers targeting at accommodating its mid-income populations [44,45]. Land development driven by private developers dominates the overall urban expansion in JMA, which provides the experimental backcloth through which we can investigate developers’ impact on urban expansion and land market change.

2.2. Model Development

In the development of ABMs, the conceptual framework provides the underpinning foundation to the model construction and ensures that the selection of inputs and their interactions reflect the functions of the system, in reality. Our conceptual framework was constructed from the supply-side perspective where developers are the main actors in the urban development process. In essence, urban development starts when developers accrete information from their neighbourhood space (i.e., cells surrounding a developer). The developers then assess land suitability and affordability at particular location. Due to variation on the capital capability and the expected benefit from the investment, the land profit assessment may differ from one developer to another. Figure 2 illustrates this conceptual framework with three types of developer agents—large, medium and small developers—and how they interact within the urban space. There are three modules in the model: the agent module, the environment module and the interaction module. Each of the modules is described in more detail in the following section.

2.2.1. The Agent Module

The agent module in the ABM represents the residential land developers in the urban development process. This module was developed based on the microeconomic theory with the assumption of one monocentric city and three type of developers—large, medium and small—categorised according to their capital level, which are selected in line with a suite of empirical studies [7,34,45,46]. While the typology of land developers can vary by capital possession, operation scale or others, our primary interest is to investigate the influence of capital on the urban development. As such, we classified land developers into three types based on their capitals. In fact, the amount of capital that developers possess can lead to different locational decisions, land acquisition actions and adaptation strategies, all of which impact on the evolution of urban landscapes [10]. Although classifying the developers into these three types simplifies the real situation in the JMA’s land market, this simplification is necessary given the difficulty in obtaining reliable data to quantify the decision behaviour of agents in the model, specialising in the developing country context. The threshold of capital defining the type of developers may vary and there remains no consensus among researchers [45]. In this study, we defined developers’ characteristics based on information from three sources: (i) interviews with experts in the region, (ii) the literature study and (iii) local newspapers articles. The interviews were carried out in Jakarta from 13 to 25 June 2013 on sampled respondents representing the main development actors in the JMA and a private consultant who handles urban development projects carried by major developers in the JMA. Academic works focusing in the JMA and Indonesia’s urban development context have also been sources, including Winarso [45], Firman [44] and Struyk et al. [47]. In addition, studies from other countries, like Australia [10,48], the US [7,34], West Europe [49] and Canada [1], were also sources to complement and verify data from the interview and other local sources. Furthermore, newspapers articles were also sourced which provides information such as current market situations in the JMA, developers’ strategy for the coming year, or strategy towards meeting the target. The capital threshold was based on the initial testing and the findings reported in Winarso [45], which was designed to capture the maximum ability of developers in the acquisition of land for development. Large developers were defined as those who have the financial capacity to invest in developing a minimum land size of 100 hectares into urban area; this is the most common size (i.e., 57%) for land transformation in the JMA [45], which corresponds to approximately US$500 million or over for capital investment. Accordingly, we define the three types of developers using the following thresholds,
Dev = { US $ . 500   million < Z US $ . 700   million Large   developers US $ . 140   million < Z US $ . 500   million Medium   developers US $ . 70   million < Z US $ . 140   million Small   developers
where D e v is the type of developers; Z is the capital level. The capital level is continuously changing during the simulation process, reflecting the operational cost (overhead) and profit gains as a result from the previous simulation steps (Figure 2). With variations in the capital level, individual developers perceive and react differently to economic opportunities according to their cost–profit calculation. The variations of developers’ characteristics in the agent module were translated into parameters as shown in Table 1.

2.2.2. The Environment Module

The environment module was formulated using raster grids with 300-metre spatial resolution, resulting in a total of 372 by 335 cells covering the entire study area in JMA. Data used in the environment module include both the physical characteristics of the area such as land use, proximity to the city and other facilities such as toll roads, as well as the economic value of the land. We used Landsat TM5 with an acquisition date at 22 September 1994 and ETM+ 7 acquired on 27 June 2012 to obtain land use data at the two time points. Data on the initial land value for the JMA in 1994 were acquired from the Land and Building Tax Imposition database, or Nilai Jual Objek Pajak (NJOP, in Bahasa Indonesia), the municipal tax office and the land agency. Data on urban centres and toll roads were extracted from OpenStreetMap for 2013.
While the physical land features such as proximity to the city remain static during the simulation process, the land use and the corresponding land value change as a result of the decisions and actions made by the developers during the simulation process. Hence, land values on the newly constructed urban area would change as new infrastructure (such as better access to toll roads) promote the economic value of the area and surrounding locales. We used the NJOP data in one of the JMA municipalities—Kota Depok—as an exemplar to determine the rate of land value change. According to this data source, the land value of a site after development was about twice the initial value [50]. The land value in the nearby areas also increased, with decreasing scale as the distance from the centre of development increases. This decreasing scale of land value change is conceptualised in Equation (2) and visually presented in Figure 3.
I x = 1 + v × exp ( w × d x 2 d m a x 2 )
where I x is the multiplication factor to increase land values at cell x ; v and w are parameters of the Gaussian function regulating the sensitivity of decreasing rate; d x denotes the distance between cell x and the location where new development occurs; and d m a x denotes the maximum distance where land value change occurs due to the new development. The Gaussian function was selected based on our observation that the increasing rate of land value appears to be uniform within 1 km from a new urban area, but reduces in scale beyond 1 km and diminishes from 5 km and beyond. Using a trial-and-error approach, we tested different v and w values in Gaussian function to identify the optimal values (Figure 3a) that match the land value market change in the JMA (Figure 3).

2.2.3. The Interaction Module

The interaction module defines the relationship between developers and the environment they interact with (i.e., the cell space). Here, developers’ development decisions were designed to follow four sequential steps: land search, land assessment, land acquisition and land development action.
Land search. In the land search stage, developers collect information about the area for potential urban development. The radius of their land search varies depending on the commitment of the developers to meet certain policies and regulations set by local government. Large developers are typically more experienced and are therefore less constrained by these policies and regulations [3]; they can also allocate certain budget for processing the development permits to meet the regulatory requirements. On the other hand, small developers are typically constrained by both experience and limited budgets for processing the development permits to meet the local government requirements. Thus, those developers would prefer to invest in one territory and concentrate within a particular district rather than across multiple municipalities [2,45]. Therefore, we use a different search radius and constraints as shown in Table 2 to represent the differences in the land search strategy by different types of developers.
Land assessment. We assume that a typical land developer will adopt the microeconomic principle to assess the potential cost and profit of a target land site. Each cell in the model has the function to provide a developer with a perceived land value, an estimated construction cost, and an expected revenue return at each site if an individual developer makes an inquiry. The model generates some uncertainties to reflect imperfect information. Thus, different developers may receive slightly different information even when they visit the same site. For instance, land values as perceived by the developers tend to be overrated because of the additional services associated with the land broker who demands a commission. The uncertainty regarding the brokers’ commission is represented as random value between zero and ten percent of the original land value.
Land acquisition. For developers, a decision to develop land must contribute to the accumulation of profit that is dependent on the expected revenue of the developed land and the associated construction costs. Large developers must secure at least 15 percent profit on their capital investment to cover the operational costs and maintain a profitable company image on the stock exchange [45], which in turn gives them the capacity to secure more capital from the stock exchange. Similarly, the medium-size developers seek at least 15 percent potential profit on their initial investment to develop the site. In contrast, small developers can accept any positive revenue margin as they have neither the obligation to pay back loans (as they do not have loan during the development stage) nor do they allocate funds to retain their company image for marketing purpose (such as attracting the attention of investors or customers).
Land development action. Developers’ actions for land development is distinguished by the time needed to start the construction in a given area. The model assumes that a developer commences the development of a site immediately after the development permission is granted by the local government. The total development duration, including time spent to obtain the necessary permissions, land clearing and the construction of infrastructure and the transformation of land into urban area, ranges from 24 to 48 months depending on the size of the area (Table 1). In general, large developers will develop faster (100 ha per 48 month or 25 ha per year) than the medium (50 ha per 36 month or 16.7 ha per year) and small developers (10 ha per 24 month or 5 ha per year) given that the large developers tend to have more resources, capital and experience to undertake faster urban land construction.
In response to fluctuations in developers’ capital level where a small developer may grow in size to become a ‘medium developer’ following substantial profit being made from preceding land development, or a large developer may lose their capital stand due to bad investment, the model also incorporates the ability for developers to change types or even exit the market [51]. A developer’s market exit occurs when one has no capital left to perform land search or there is no land suitable for them to invest in.
Developers accrue profit (Profit) from the margin between revenue (Revenue) and the lending capital (Loan). The profit is accumulated and used to invest in their next project (Equations (3) and (4)).
P r o f i t ( t ) = R e v e n u e ( t ) L o a n ( t )
P r o f i t ( t + 1 ) = P r o f i t ( t ) + C a p i t a l
where P r o f i t ( t + 1 ) is the profit gain at time t + 1.

2.3. Temporal Dimension

The temporal dimension in agent-based modelling is regarded as one of the most critical issues in dynamic modelling [52]. The temporal dimension provides a meaningful way through which to interpret the simulation results in comparison with the observed reality. Assuming that an average time required by a developer to complete the four sequential stages from land search to final decision and action is one month (Figure 2), our model adopts a one-month temporal interval for model iterations, with a total simulation period of 18 years (or 216 months) from 1994 to 2012. This timeframe was selected given the land value data we can comfortably estimate from the NJOP data to 2012 for model validation.

2.4. Scenario Testing

The ABM allows the simulation and testing of alternate scenarios through the adjustment of different parameters within the model. Five scenarios are progressed in the current study, each reflecting a particular set of developers competing in the land market. The first three scenarios simulate the urban market where only one single type of developers (i.e., small, medium or large developers) operating in the market. In the last two scenarios, all three types of developers coexist and operate together in the land market, with the fourth scenario representing equal numbers of developers in each type while the fifth scenario represents a hierarchy in developer types, with more small and less large developers in the marketplace. The 6:3:1 ratio amongst the three types of developers in the fifth scenario corresponds to the housing policy implemented by the Indonesian government between 1992 and 2011 that developers have the obligation to maintain its development ratio to one large, three medium and six small houses. Table 3 list the number of developers in each category under each of the five scenarios.
The ABM is constructed and coded using NetLogo [53]. For each simulation, maps of urban land use and the associated land values at different time point were calculated in NetLogo and exported as ASCII files for mapping and spatial analyses in ArcGIS. The model was operated 100 times under each scenario, generating a series of Monte Carlo simulations and probabilities for urban land development across our case study context.

3. Results

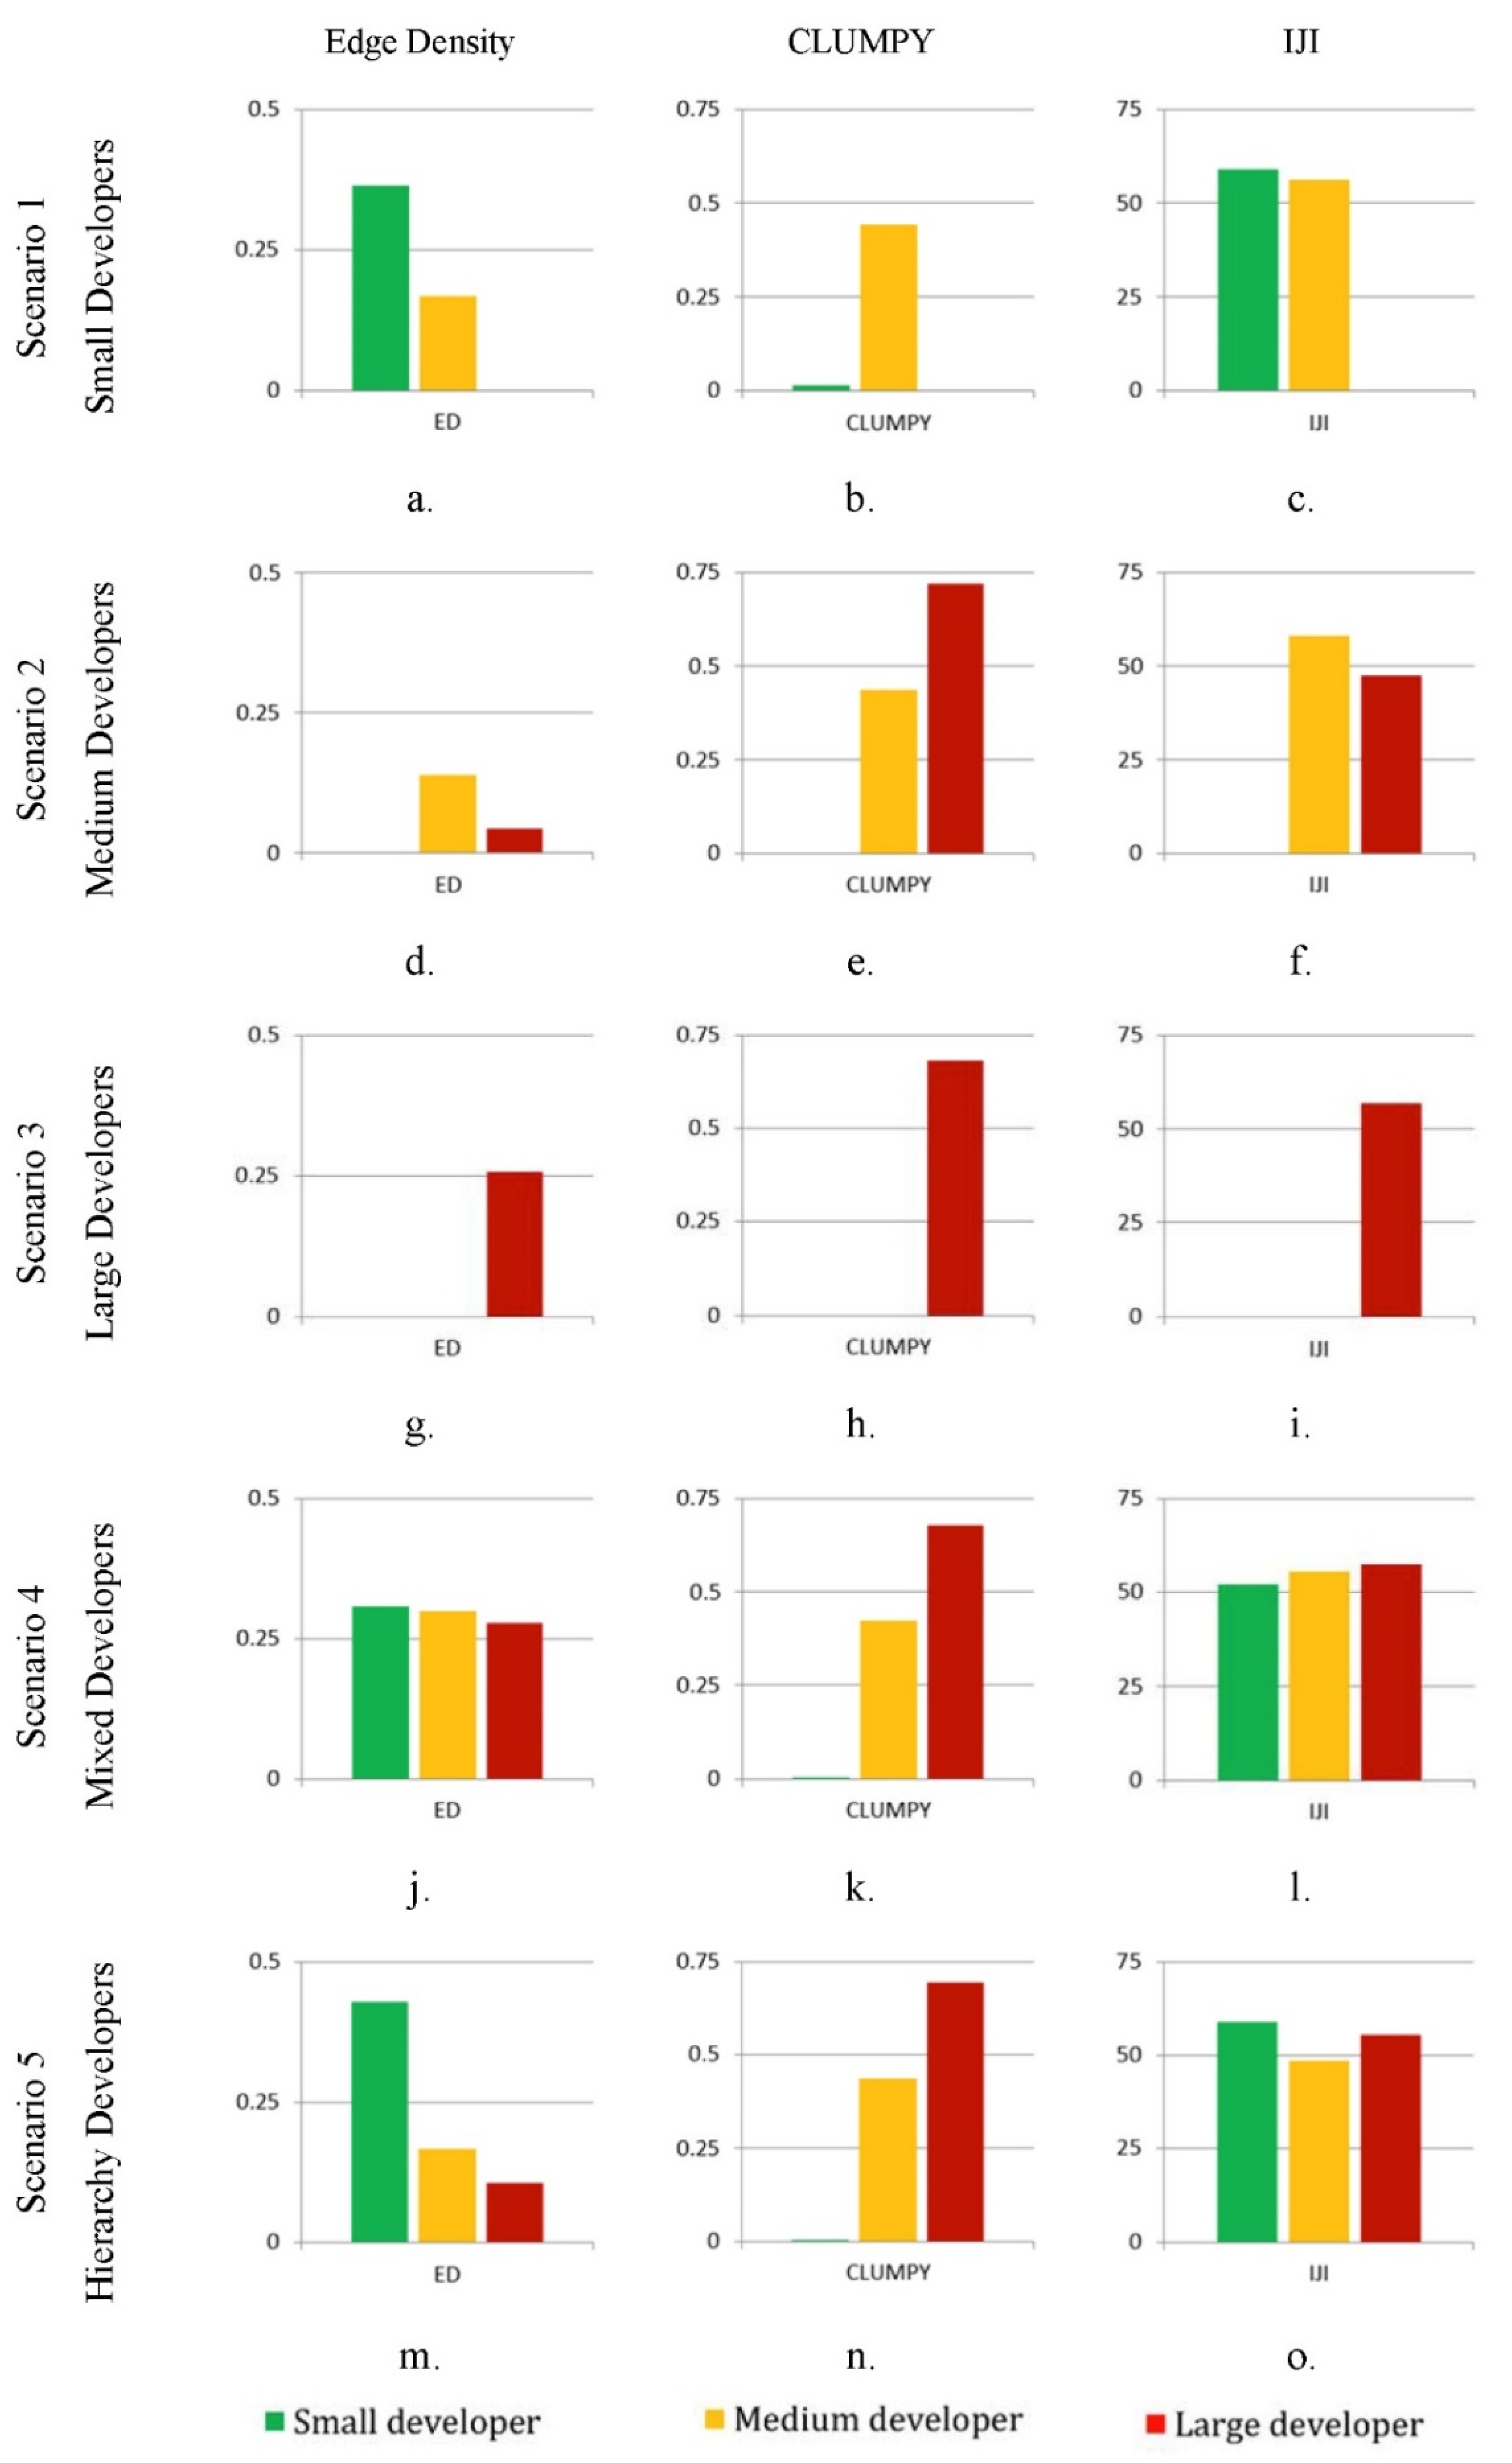
3.1. Urban Expansion

The locations of new urban areas by all developers appear in areas 15 km away from Jakarta’s CBD, while areas within Jakarta’s CBD exhibit very little urban growth. The new urban areas created by small developers (Scenario 1) appear in areas 25 km away from Jakarta’s CBD (Figure 4a) while developments by medium and large developers are concentrated around the 25 km radius line (Figure 4b,c). Notably and consistently, large and medium-size developers tend to select locations for development around the southwest and southeast Jakarta. The urban transition probability as observed by repeating the simulation 100 times on each scenario shows a high urban transition probability on both Scenarios 2 and 3. In contrast, small developers present a more dispersed pattern of land development in southeast Jakarta beyond the 25 km radial line, as is shown in Scenario 1.
The diverse spatial patterns of simulated urban form under the five development scenarios could be quantified using landscape matrices, including Edge Density (ED), Clumpiness index (CLUMPY) and Interspersion and Juxtaposition index (IJI) [54,55]. It can be confirmed that urban areas developed by small developers display a small and disconnected shape as indicated by high ED and low CLUMPY (Figure 5a,b). Large developers produce a more connected urban pattern as indicated by high CLUMPY (Figure 5g). When all types of developers appear on the market, the spatial pattern of new urban areas has little dissimilarity as shown by IJI, indicating a more mixed and complicated urban form across JMA (Figure 5l,o).

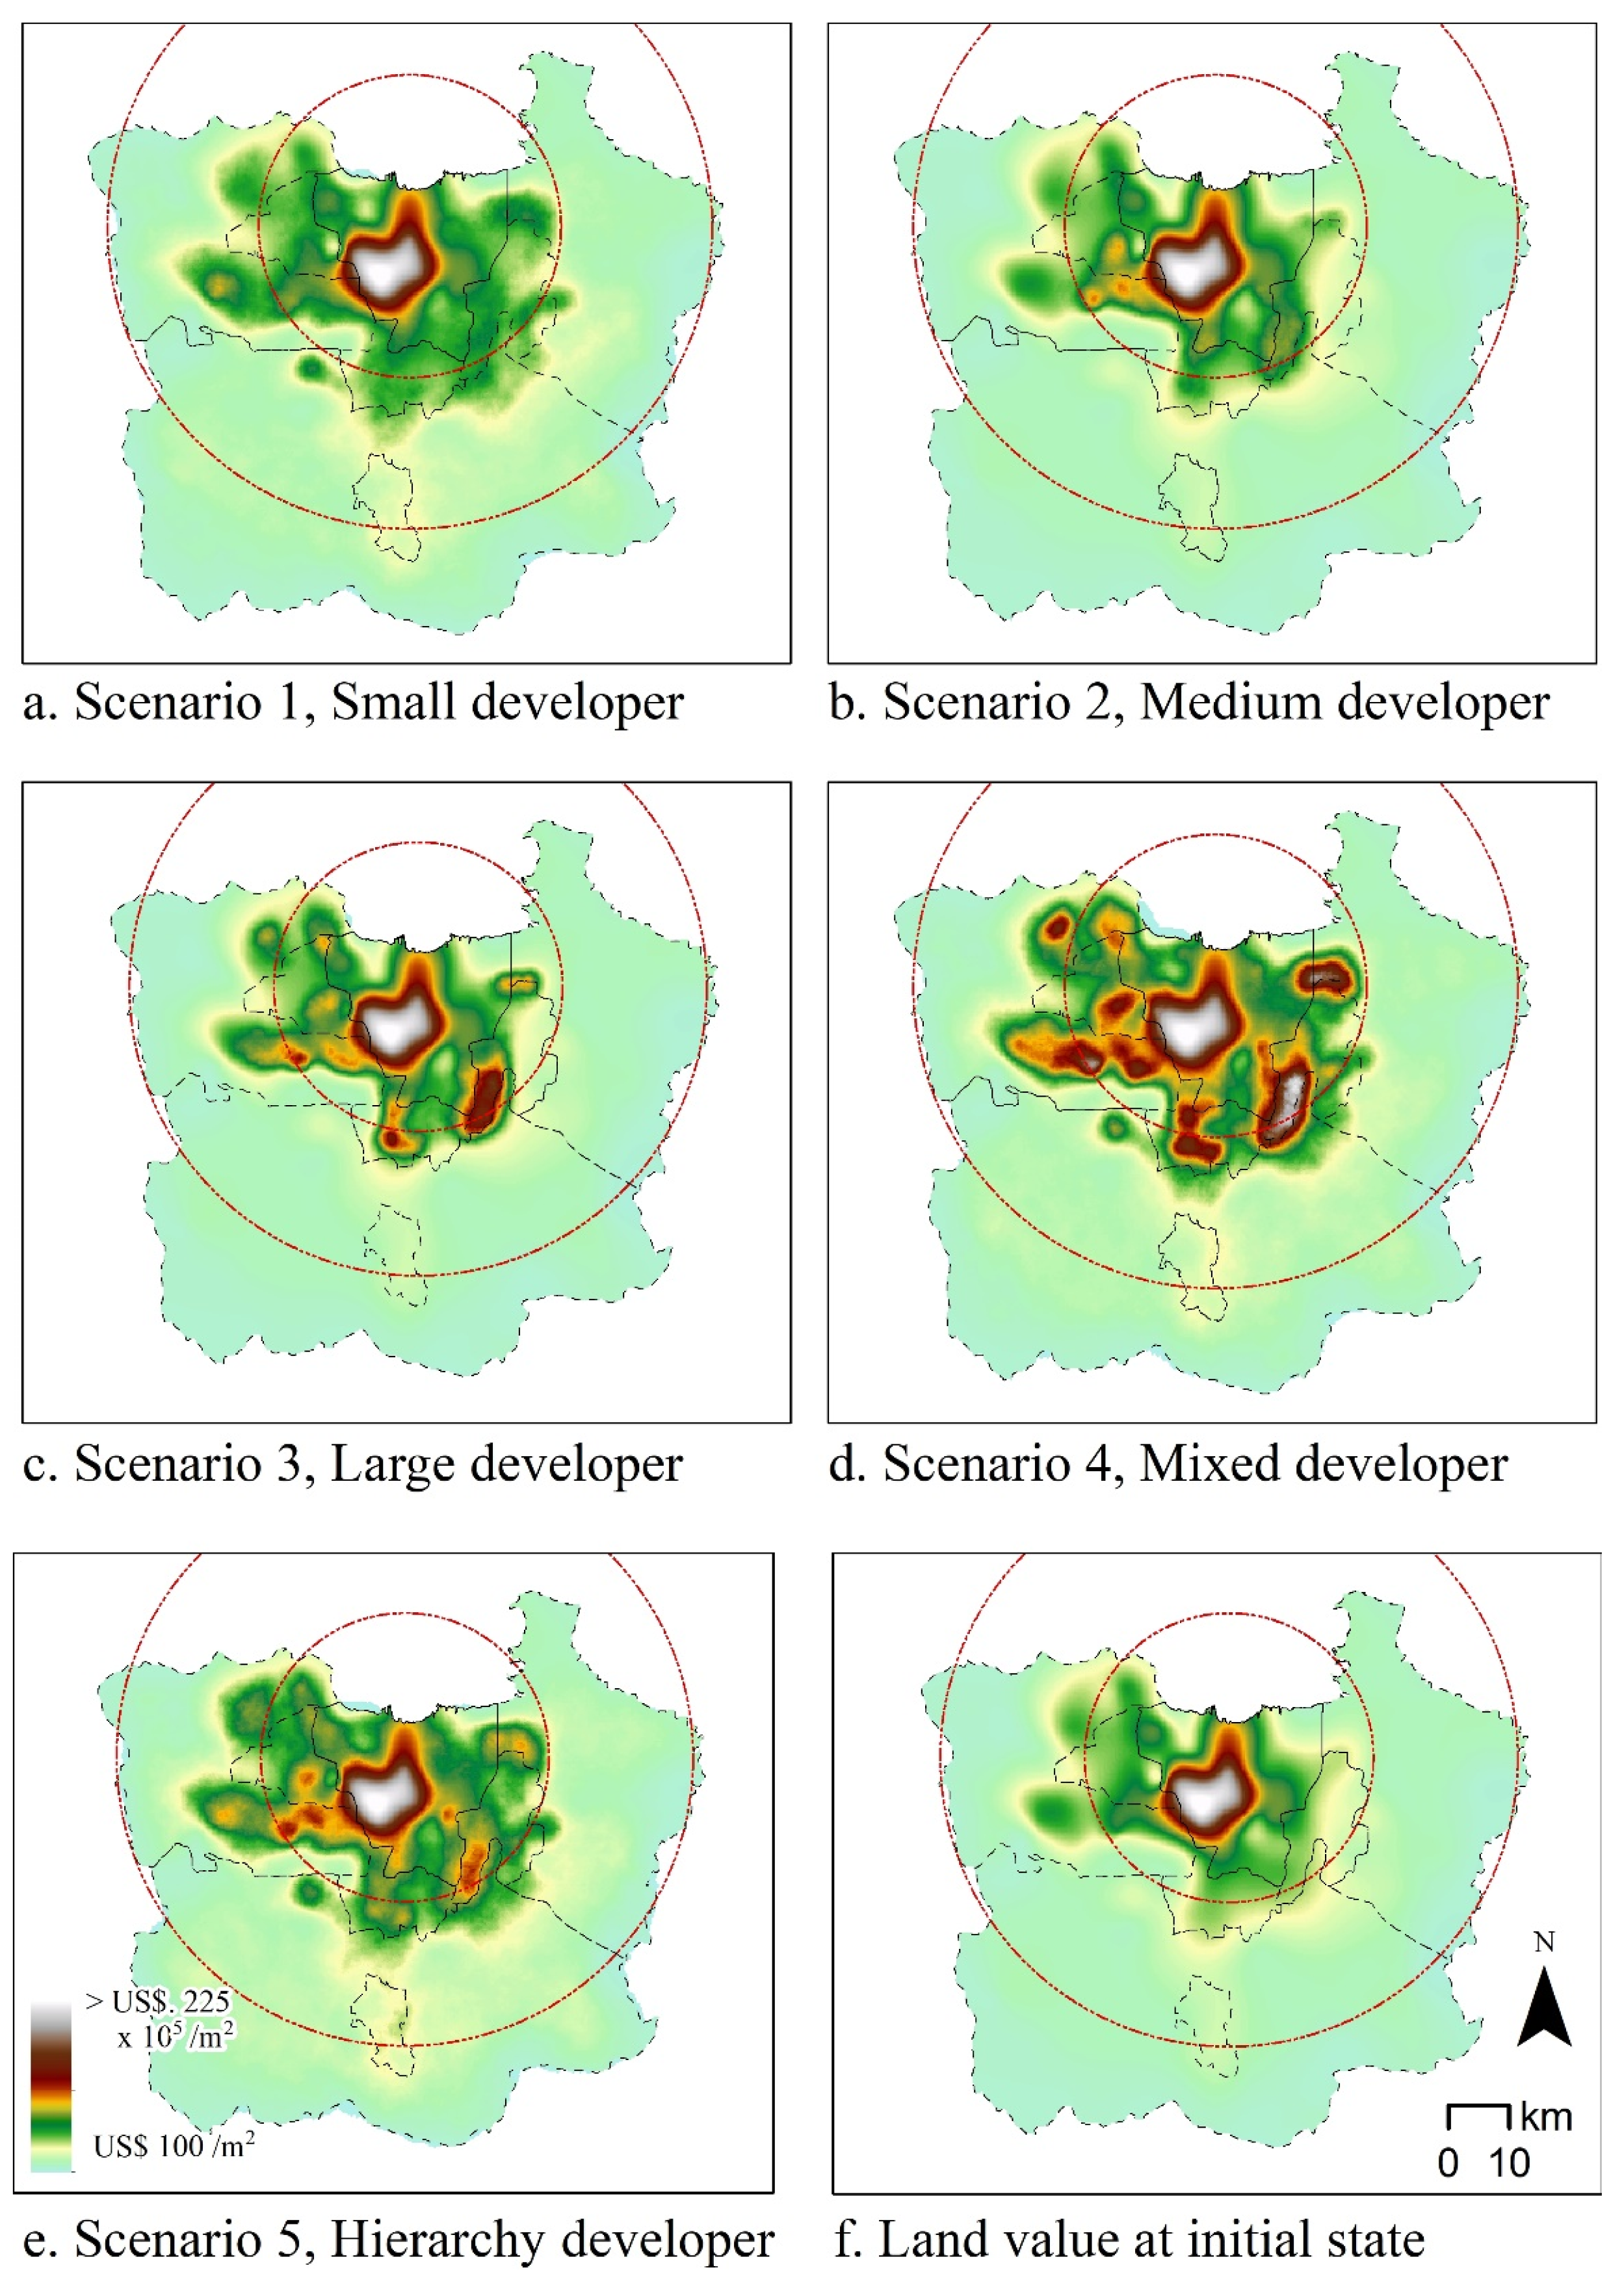
3.2. Simulated Land Values

Figure 6 shows the simulated land value changes as the consequences of new urban development. The simulated new urban development largely occurs in locales between 20 and 25 km from Jakarta’s CBD and remains consistent across all scenarios. However, the amounts of land value changes vary spatially under different scenarios. Compared to the land value map at the initial state in 1994 (Figure 6f), marginal land value increase was observed on the simulated land values due to the impact of small developers (Figure 6a) in areas about 25 km away from the Jakarta’s CBD. This increase in land values under Scenario 1 is attributable to the small developers’ preference to select small piece of land (i.e., one cell which equals to 9 ha) to develop, resulting in more disperse, uncontrolled or unplanned urban spatial structures, which are typical features of sprinkling [56]. In contrast, medium and large developers select large pieces of land for development, usually more than 10 ha with locations close to one another. As a result, development by such developers creates an accumulated increase in land values, as observed in southeast Jakarta (Figure 6b,c). With the competition between multityped developers introduced in the land market (Scenarios 4 and 5), the increase in land values are much higher than those under the scenarios of single-type agents (Scenarios 1–3), with particularly observable outcomes in the south and west of Jakarta (Figure 6d,e).

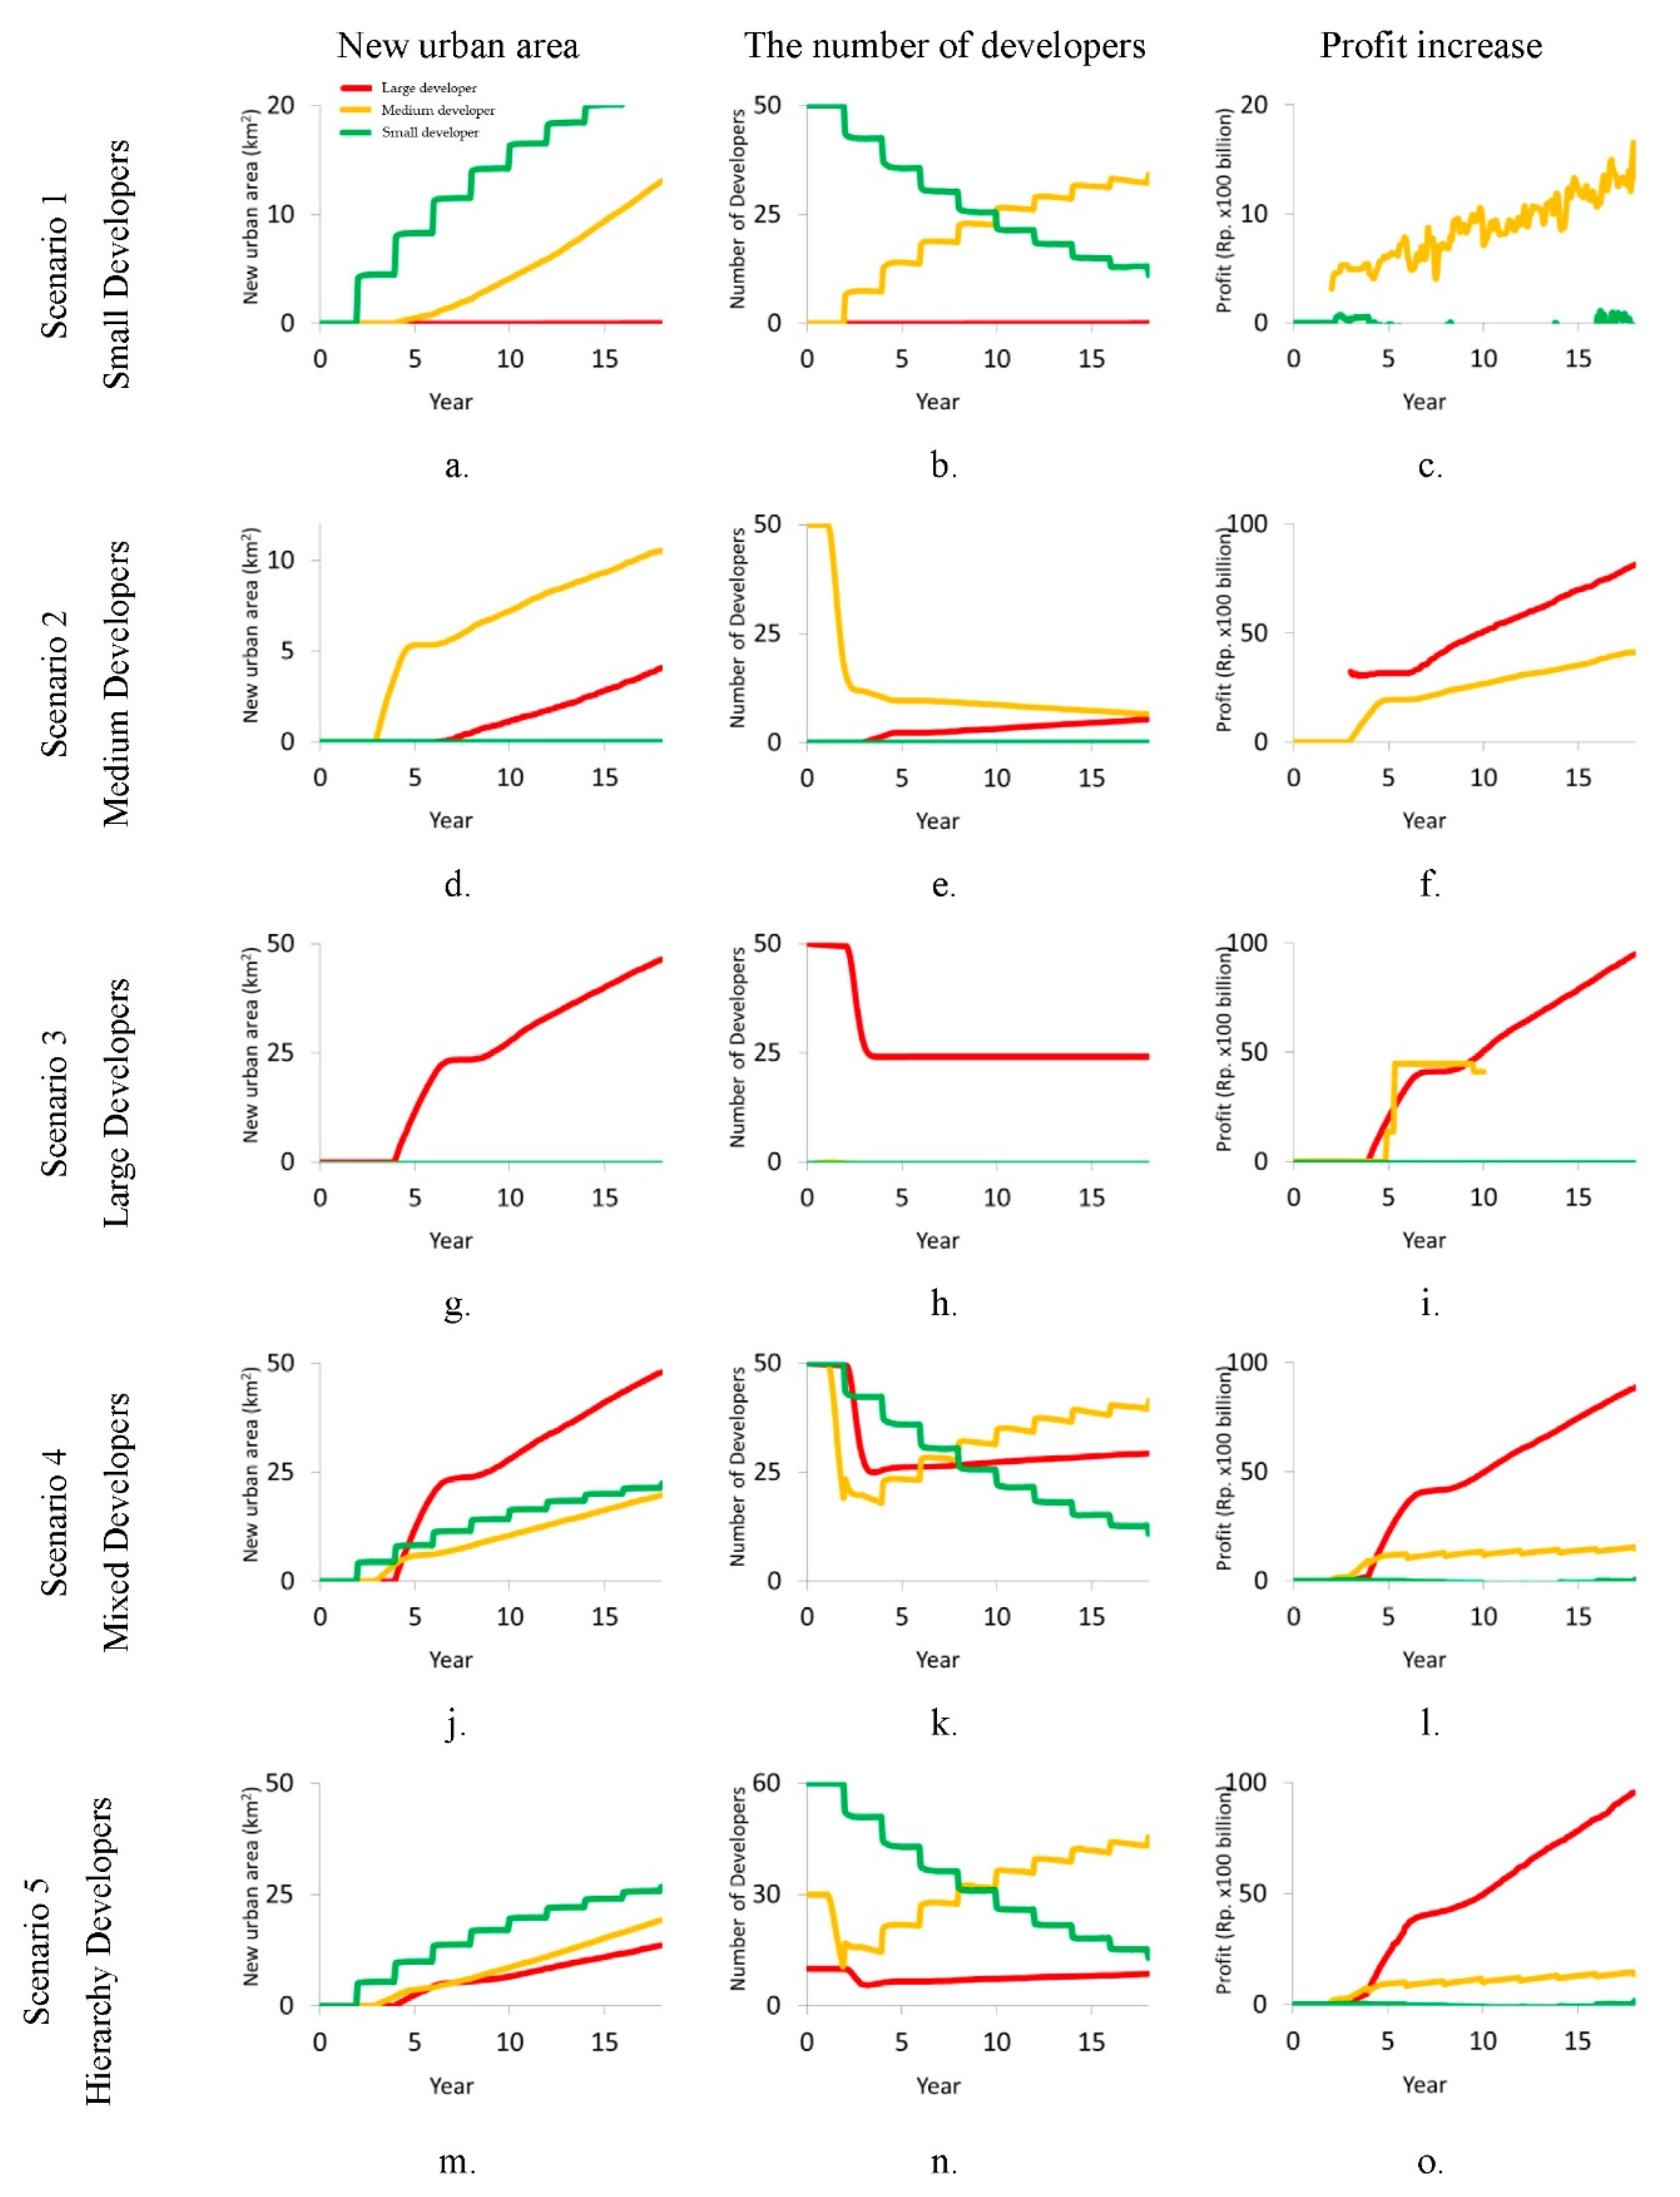
3.3. Urban Development over Time

We also assessed the development of urban areas over time under each of the five scenarios, which enables us to visualise the land market dynamics. Figure 7 illustrates the amount of new urban area being developed (left panel), number of developers (centre panel) and their profit increases (right panel) for each development scenario. Under Scenario 1, new urban areas initially emerged by small developers, but over time, some small developers have gain in size, resulting in the decrease in the number of small developers and increase in medium-sized developers in the market. Similar patterns exist under Scenarios 2 and 3. However, we also observe more fluctuation under Scenarios 2 and 3 as some developers have also reduced in size due to profit lose in the market, resulting in sudden decrease in the number of investors, as shown in Figure 7e,h.
Profit gains tend to be accumulated by large developers much faster (Figure 7, right panel) and are less related to the amount of acquired urban areas. For example, in Scenario 1, regardless of the size of urban areas, small developers gain marginal to no profit (Figure 7c), while under Scenarios 4 and 5, where mixed-typed developers coexist, large developers also display the highest increase in profit, followed by medium and then small developers (Figure 7l,o).

4. Discussion

The simulation results suggest that the locations and new urban forms are generated by different processes and actors, and concurs with the current scholarship [2,10]. Developers with large capital reserves are also able to leverage further funds through lending to maximise their capital return. These larger developers are capable of selecting land in the most profitable locations on the outskirts of the JMA, and in doing so have the greatest potential to transform large areas of nonurban land to urban use. In contrast, developers with less capital reserves choose smaller blocks of land to develop, resulting in a fragmented distribution of new urban areas.
The results also suggest that the development locations selected by large developers are more predictable than those by small developers. After running 100 simulations, there are higher probabilities of development by large developers for areas closer to toll roads and the CBD, as shown in Figure 4c. In contrast, the locations of new urban areas by small developers are less predictable and more scattered across the JMA (Figure 4a). The competition to acquire high-revenue areas can be succeeded by large developers whilst small developers are pushed to the outer rings of the JMA. The small developers have limited capital and no obligation to construct roads connecting their developments to the main transportation network, thus are more likely to acquire land that is further away from toll roads. In this case, their selected areas are low in revenue but nevertheless able to cover the development costs with marginal profit levels.
The simulation results indicated the imbalanced distribution of capital and revenue gains amongst different types of developers. Scenarios 4 and 5 demonstrate this point by showing that although the land market is initially occupied by three types of developers, the number of small developers tends to decrease over time (Figure 7k,n) whilst the profit of large developers increases (Figure 7l,o). These imbalanced distributions are inevitable in the competitive and nonregulated market [1,11]. In the case of the JMA, the reason might stem from the successful developers that accumulate the profit whilst unsuccessful developers exited the market to prevent further financial loss.
Our results have the potential to support evidence-based urban policy for the municipality governments in Jakarta with regard to the provision of land for housing development. Considering that developers are less favourable to developing settlement for small to medium income earners, the government could consider offer subsidies by lowering the necessary tax and development costs for developers who build small to medium sized housing, and encourage more higher density development in the form of in-fill and high-rise buildings. This could be targeted especially in areas away from the CBD but with the highest potential in land value appreciation where large developers would have particular interest in building large-scale and multistory housing.

5. Limitations and Conclusions

This study has developed an ABM to capture the impacts of developers with different investment capacities on urban development and the complexity in the urban land market. The model is developed from a developers’ perspective and incorporates both spatial and nonspatial factors influencing the developers’ investment decisions such as expected profit, and capital availability. These factors were then isolated and tested against microeconomic theory that links developers’ capital with the most profitable land to be acquired from empirical observations [3], Winarso [45]. The findings revealed the extent to which the developers’ profit-making behaviours and their capital possession can influence the urban spatial forms. Our findings are crucial for urban planners to design land policy that stimulates competitive urban land market without sacrificing the profit interest anticipated by the developers.
It is worthwhile noting that the purpose of the current study was to construct an ABM and employ it to understand the process of urban development and how this process is affected by the decision behaviours of developers, rather than to predict future urban development [57]. As such, we offer a proof-of-concept concerning the relationship between the economic behaviours of developers and the resulting spatial dynamics of urban growth. In doing so, we advance our understanding of the complex interactions that occur in the urban development process and offer a platform from which diverse policies toward particular types of developers can be formulated and tested. Furthermore, the current ABM and its findings serve as a logical envelope that encapsulates a range of possible extensions of newly developed urban areas rather than to predict a limited amount of simulated reality.
Despite the above findings and contributions, the current version of the model has a number of limitations that can be improved in future work. First, our model represents the heterogeneous characteristics of developers focusing on their capital possessions, lending capacities and development preferences. Whilst the developer’s competitive behaviours were implicitly involved during the process of land selection (for instance, land acquired by one developer would be excluded from subsequent selections by others), future studies can take into consideration the collaboration and/or competition strategies among developers. To better reflect the reality of open and competitive land market, combining capital with other developers and acquiring smaller developers based on cost–profit analysis would enhance the understanding about how developers behave in market and how this affects the landscape of urban area [58]. Second, the current model overlooks the accumulated knowledge crucial in the human decision process. With their learning capability, human agents would gradually gain knowledge through the exchange of information, social interactions or artificial intelligence [59]. This can lead to the change of perceptions of human agents at a later stage of their decision process. Thus, embedding accumulated knowledge in future work could potentially lead to a more suited developers’ decision for a given market situation as they can better plan and anticipate a loss event which in return optimizes their profit. A future version of the model could also add data with uncertainty (soft data) to better reflect the human perception of reality. Soft data reflect nonlogical decisions or speculative behaviour, which cannot be captured using only a single value in the variable [51]. Human behaviour has a degree of acceptance that even if the specific value that it pursues is not reached, it can still cope with this outcome and seek an alternative acceptable range of values [60]. Third, a future version of the model could also incorporate the development phase. The addition of the development phase could reveal new insights into how developers start projects, and when they start to gain profit. Adding a development phase in the agent’ development module may open up new knowledge about the speculative behaviour in microeconomic framework.
Furthermore, the introduction of big data to the development of ABMs has the potential to play a significant role in enhancing our explanation of the interactions between urban stakeholders and the impact on the urban landscape. Potential streams of data that are relevant for urban studies include land prices or recorded land transactions tax, which could be valuable for calibrating and refining the parameterisation of the model. Challenges also lie in extracting and structuring these streams of big data into more meaningful forms that can readily be incorporated with an ABM framework. To this end, collective efforts by the urban modelling community are critical in order to improve ABM and in doing so enhance our understanding of human behaviour and these impact the process of urban development.

Author Contributions

Conceptualisation, Agung Wahyudi, Yan Liu and Jonathan Corcoran; Methodology, Agung Wahyudi and Yan Liu; Software, Agung Wahyudi; Validation, Agung Wahyudi; Formal Analysis, Agung Wahyudi; Writing—Original Draft Preparation, Agung Wahyudi; Writing—Review and Editing, Yan Liu and Jonathan Corcoran; Visualization, Agung Wahyudi; Supervision, Yan Liu and Jonathan Corcoran; Funding Acquisition, Yan Liu and Agung Wahyudi.

Funding

The research was funded by the International Postgraduate Research Scholarship (IPRS) and the Australian Research Council Discovery grant [DP170104235].

Conflicts of Interest

The authors declare no conflicts of interest.

References

  1. Rudin, J.R. The Changing Structure of the Land Development Industry in the Toronto Area; University of Toronto, Centre for Urban and Community Studies: Toronto, ON, Canada, 1978. [Google Scholar]
  2. Coiacetto, E.J. Places shape place shapers? Real estate developers’ outlooks concerning community, planning and development differ between places. Plan. Pract. Res. 2000, 15, 353–374. [Google Scholar] [CrossRef]
  3. Kaiser, E.J. Locational decision factors in a producer model of residential development. Land Econ. 1968, 44, 351–362. [Google Scholar] [CrossRef]
  4. Ligmann-Zielinska, A. The impact of risk-taking attitudes on a land use pattern: An agent-based model of residential development. J. Land Use Sci. 2009, 4, 215–232. [Google Scholar] [CrossRef]
  5. UN-DESA. World Urbanization Prospects: The 2014 Revision; UN: New York, NY, USA, 2014. [Google Scholar]
  6. Morgan, F.; O’Sullivan, D. Residential Developers: Competition, Behaviour and the Resulting Urban Landscape. 2009. Available online: http://www.geocomputation.org (accessed on 4 January 2019).
  7. Mohamed, R. Why do residential developers prefer large exurban lots? Infrastructure costs and exurban development. Environ. Plan. B Plan. Des. 2009, 36, 12–29. [Google Scholar] [CrossRef]
  8. Diappi, L.; Bolchi, P. Smith’s rent gap theory and local real estate dynamics: A multi-agent model. Comput. Environ. Urban Syst. 2008, 32, 6–18. [Google Scholar] [CrossRef]
  9. Tan, R.; Liu, Y.; Zhou, K.; Jiao, L.; Tang, W. A game-theory based agent-cellular model for use in urban growth simulation: A case study of the rapidly urbanizing Wuhan area of central China. Comput. Environ. Urban Syst. 2015, 49, 15–29. [Google Scholar] [CrossRef]
  10. Coiacetto, E. Diversity in real estate developer behaviour: A case for research. Urban Policy Res. 2001, 19, 43–59. [Google Scholar] [CrossRef]
  11. Coiacetto, E. Real estate development industry structure: Consequences for urban planning and development. Plan. Pract. Res. 2006, 21, 423–441. [Google Scholar] [CrossRef]
  12. Grimm, V.; Railsback, S.F. Individual-Based Modeling and Ecology; Princeton University Press: Princeton, NJ, USA, 2005. [Google Scholar]
  13. Auchincloss, A.H.; Diez Roux, A.V. A new tool for epidemiology: The usefulness of dynamic-agent models in understanding place effects on health. Am. J. Epidemiol. 2008, 168, 1–8. [Google Scholar] [CrossRef]
  14. Huang, Q.; Parker, D.C.; Filatova, T.; Sun, S. A review of urban residential choice models using agent-based modeling. Environ. Plan. B Plan. Des. 2014, 41, 661–689. [Google Scholar] [CrossRef]
  15. An, L. Modeling human decisions in coupled human and natural systems: Review of agent-based models. Ecol. Model. 2012, 229, 25–36. [Google Scholar] [CrossRef]
  16. Parker, D.C.; Manson, S.M.; Janssen, M.A.; Hoffmann, M.J.; Deadman, P. Multi-agent systems for the simulation of land-use and land-cover change: A review. Ann. Assoc. Am. Geogr. 2003, 93, 314–337. [Google Scholar] [CrossRef]
  17. Matthews, R.B.; Gilbert, N.G.; Roach, A.; Polhill, J.G.; Gotts, N.M. Agent-based land-use models: A review of applications. Landsc. Ecol. 2007, 22, 1447–1459. [Google Scholar] [CrossRef]
  18. Robinson, D.T.; Murray-Rust, D.; Rieser, V.; Milicic, V.; Rounsevell, M. Modelling the impacts of land system dynamics on human well-being: Using an agent-based approach to cope with data limitations in Koper, Slovenia. Comput. Environ. Urban Syst. 2012, 36, 164–176. [Google Scholar] [CrossRef]
  19. Wu, J.; Mohamed, R.; Wang, Z. Agent-based simulation of the spatial evolution of the historical population in China. J. Hist. Geogr. 2011, 37, 12–21. [Google Scholar] [CrossRef]
  20. Jjumba, A.; Dragićević, S. High Resolution Urban Land-use Change Modeling: Agent iCity Approach. Appl. Spat. Anal. Policy 2012, 5, 291–315. [Google Scholar] [CrossRef]
  21. Kaiser, E.J. A decision Agent Modeling Approach to Planning for Urban Residential Growth; University of North Carolina: Chapel Hill, NC, USA, 1970. [Google Scholar]
  22. Goldberg, M.A. Residential Developer Behavior: Some Empirical Findings. Land Econ. 1974, 50, 85–89. [Google Scholar] [CrossRef]
  23. Brown, D.G.; Robinson, D.T.; An, L.; Nassauer, J.I.; Zellner, M.; Rand, W.; Riolo, R.; Page, S.E.; Low, B.; Wang, Z. Exurbia from the bottom-up: Confronting empirical challenges to characterizing a complex system. Geoforum 2008, 39, 805–818. [Google Scholar] [CrossRef]
  24. Caruso, G.; Peeters, D.; Cavailhès, J.; Rounsevell, M. Spatial configurations in a periurban city. A cellular automata-based microeconomic model. Reg. Sci. Urban Econ. 2007, 37, 542–567. [Google Scholar] [CrossRef]
  25. Parker, D.C.; Meretsky, V. Measuring pattern outcomes in an agent-based model of edge-effect externalities using spatial metrics. Agric. Ecosyst. Environ. 2004, 101, 233–250. [Google Scholar] [CrossRef]
  26. Benenson, I. Multi-agent simulations of residential dynamics in the city. Comput. Environ. Urban Syst. 1998, 22, 25–42. [Google Scholar] [CrossRef]
  27. Fontaine, C.M.; Rounsevell, M.D.A. An agent-based approach to model future residential pressure on a regional landscape. Landsc. Ecol. 2009, 24, 1237–1254. [Google Scholar] [CrossRef]
  28. Lemoy, R.; Raux, C.; Jensen, P. An agent-based model of residential patterns and social structure in urban areas. Cyber. Eur. J. Geogr. 2010. [Google Scholar] [CrossRef]
  29. Heckbert, S.; Smajgl, A. Analysing urban systems using agent-based modelling. In Proceedings of the MODSIM, Melbourne, Australia, 12–15 December 2005; pp. 134–140. [Google Scholar]
  30. Caruso, G.; Vuidel, G.; Cavailhes, J.; Frankhauser, P.; Peeters, D.; Thomas, I. Morphological similarities between DBM and a microeconomic model of sprawl. J. Geogr. Syst. 2011, 13, 31–48. [Google Scholar] [CrossRef]
  31. Torrens, P.M. A Geographic Automata Model of Residential Mobility. Environ. Plan. B Plan. Des. 2007, 34, 200–222. [Google Scholar] [CrossRef] [Green Version]
  32. Parker, D.C.; Filatova, T. A conceptual design for a bilateral agent-based land market with heterogeneous economic agents. Comput. Environ. Urban Syst. 2008, 32, 454–463. [Google Scholar] [CrossRef]
  33. Filatova, T.; Parker, D.; van der Veen, A. Agent-based urban land markets: Agent’s pricing behavior, land prices and urban land use change. JASSS 2009, 12, 3. [Google Scholar]
  34. Gillen, M.; Fisher, P. Residential developer behaviour in land price determination. J. Prop. Res. 2002, 19, 39–59. [Google Scholar] [CrossRef]
  35. Smith, N. Gentrification and the Rent Gap. Ann. Assoc. Am. Geogr. 1987, 77, 462–465. [Google Scholar] [CrossRef]
  36. Li, X.; Liu, X. Defining agents’ behaviors to simulate complex residential development using multicriteria evaluation. J. Environ. Manag. 2007, 85, 1063–1075. [Google Scholar] [CrossRef] [PubMed]
  37. Zhang, H.; Zeng, Y.; Bian, L.; Yu, X. Modelling urban expansion using a multi agent-based model in the city of Changsha. J. Geogr. Sci. 2010, 20, 540–556. [Google Scholar] [CrossRef]
  38. Wahyudi, A.; Liu, Y.; Corcoran, J. Combining Landsat and landscape metrics to analyse large-scale urban land cover change: A case study in the Jakarta Metropolitan Area. J. Spat. Sci. 2018, 1–20. [Google Scholar] [CrossRef]
  39. Statistics Indonesia. Population of Indonesia by Province 1971, 1980, 1990, 1995, 2000 and 2010; BPS: Jakarta, Indonesia, 2015.
  40. URDI. Jakarta Metropolitan Region Policy Analysis: Final Report; Urban and Regional Development Institute: Jakarta, Indonesia, 2012. [Google Scholar]
  41. Dardak, A.H. Metropolitan di Indonesia: Kenyataan dan Tantangan Dalam Penataan Ruang; Direktorat Jenderal Penataan Ruang, Departemen Pekerjaan Umum: Jakarta, Indonesia, 2006. [Google Scholar]
  42. Firman, T. From ‘global city’ to ‘city of crisis’: Jakarta metropolitan region under economic turmoil. Habitat Int. 1999, 23, 447–466. [Google Scholar] [CrossRef]
  43. Silver, C. Planning the Megacity: Jakarta in the Twentieth Century; Routledge: New York, NY, USA, 2007. [Google Scholar]
  44. Firman, T. Large-Scale Housing and New Town Development in Jakarta Metropolitan Area (JMA): Towards an Urban Spatial Segregation; Department of Regional and City Planning, Institute of Technology Bandung: Bandung, Indonesia, 2004. [Google Scholar]
  45. Winarso, H. Developer’s Behaviour in Residential Land Development in Jabotabek, Indonesia; University of London: London, UK, 2000. [Google Scholar]
  46. Firman, T. Major issues in Indonesia’s urban land development. Land Use Policy 2004, 21, 347–355. [Google Scholar] [CrossRef]
  47. Struyk, R.J.; Hoffman, M.L.; Katsura, H.M. The Market for Shelter in Indonesian Cities; The Urban Insitute: Washington, DC, USA, 1990. [Google Scholar]
  48. Nichols, M. Road Costs Associated with Differing Forms of Urban Development; University of Sydney: Sydney, Australia, 2013. [Google Scholar]
  49. Kamps, S. Dual-Agent Simulation Model of the Residential Development Process: An Institutional Approach to Explaining the Spatial Patterns of Residential Developments in France, England and the Netherlands; Université de Franche-Comté: Besançon, France, 2013. [Google Scholar]
  50. Setiady, D. Daftar Harga Pasaran Tanah Menurut Klasifikasi jalan dan Peruntukan per Kelurahan se Kota Depok (Market Land Prices per District in Kota Depok); Depok City: Depok, Indonesia, 2011. [Google Scholar]
  51. Bonabeau, E. Agent-based modeling: Methods and techniques for simulating human systems. Proc. Natl. Acad. Sci. USA 2002, 99, 7280–7287. [Google Scholar] [CrossRef] [Green Version]
  52. Simmonds, D.; Waddell, P.; Wegener, M. Equilibrium versus dynamics in urban modelling. Environ. Plan. B Plan. Des. 2013, 40, 1051–1070. [Google Scholar] [CrossRef]
  53. Wilensky, A. NetLogo. Available online: http://ccl.northwestern.edu/netlogo/ (accessed on 4 January 2019).
  54. McGarigal, K. FRAGSTATS: Spatial Pattern Analysis Program for Quantifying Landscape Structure; General Technical Report PNW-351; USDA Forest Service: Portland, OR, USA, 2013.
  55. Deng, J.S.; Wang, K.; Hong, Y.; Qi, J.G. Spatio-temporal dynamics and evolution of land use change and landscape pattern in response to rapid urbanization. Landsc. Urban Plan. 2009, 92, 187–198. [Google Scholar] [CrossRef]
  56. Romano, B.; Zullo, F.; Fiorini, L.; Ciabò, S.; Marucci, A. Sprinkling: An approach to describe urbanization dynamics in Italy. Sustainability 2017, 9, 97. [Google Scholar] [CrossRef]
  57. Malanson, G.P.; Walsh, S.J. Agent-based models: Individuals interacting in space. Appl. Geogr. 2015, 56, 95–98. [Google Scholar] [CrossRef]
  58. Xie, Y.; Batty, M.; Zhao, K. Simulating emergent urban form using agent-based modeling: Desakota in the Suzhou-Wuxian region in China. Ann. Assoc. Am. Geogr. 2007, 97, 477–495. [Google Scholar] [CrossRef]
  59. Ligtenberg, A.; Wachowicz, M.; Bregt, A.K.; Beulens, A.; Kettenis, D.L. A design and application of a multi-agent system for simulation of multi-actor spatial planning. J. Environ. Manag. 2004, 72, 43–55. [Google Scholar] [CrossRef] [PubMed]
  60. Simon, H. Bounded rationality in social science: Today and tomorrow. Mind Soc. 2000, 1, 25–39. [Google Scholar] [CrossRef]
Figure 1. The Jakarta Metropolitan Area in Indonesia.
Ijgi 08 00229 g001
Figure 2. Conceptual framework of agent-based modelling (ABM) with multiple types of developers in the urban development process.
Ijgi 08 00229 g002
Figure 3. The rate of land value change as a distance decay function from a new urban area.
Ijgi 08 00229 g003
Figure 4. New urban areas at t = 216 months (or 18 years) generated from the ABM after 100 simulations under different scenarios. The first and second radial lines represent 25 km and 50 km distance to Jakarta’s CBD, respectively.
Ijgi 08 00229 g004
Figure 5. Landscape matrices under different scenarios.
Ijgi 08 00229 g005
Figure 6. The increase in average land values at t = 216 months (or 18 years) in new urban areas, generated from 100 simulations of the ABM under each scenario. The first and second radial lines represent 25 km and 50 km distance to Jakarta’s CBD, respectively.
Ijgi 08 00229 g006
Figure 7. New urban areas; number of developers and profit increase from 100 simulations under five scenarios.
Ijgi 08 00229 g007
Table 1. Developers’ characteristics used to configure the initial state in the model.
Key ParametersSmall DeveloperMedium DeveloperLarge Developer
Capital (US$. million)70–140140–500500–700
Initial loan (% of capital)205075
Profit margin (% of capital)>01515
Search radius (km)930150
Operation cost (US$ per month)70035007000
Urban land per development (ha)1050100
Construction time (months)243648
Table 2. Decision behaviours of developers during different land development stages.
Development StageSmall DeveloperMedium DeveloperLarge Developer
Land searchingSearch in the area where no developer has visited before, within a 10 km radius and in the municipality where the developer is located.Search in an area where no developer has visited before.Search in an area where no developer has visited before.
Land assessmentAssess development cost, including land acquisition and land clearing costs.Assess development cost, including land acquisition and land clearing costs and costs for the construction of connection road.Assess development cost, including land acquisition and land clearing costs and costs for the construction of connection road.
Land acquisitionPurchase when cost is lower than capital possession and revenue is positive;
otherwise, leave the site.
Purchase when cost is lower than capital, revenue is 15% more than initial investment and the profit is more than the expected;
otherwise, leave the site.
Purchase when cost is lower than capital, revenue is 15% more than initial investments and the profit is more than expected;
otherwise, leave the site.
Land development actionDevelop the land and release it to market in 24 months.Develop the land and release it to market in 36 months.Develop the land and release it to market in 48 months.
Table 3. The number of developers under each development scenarios.
ScenariosNumber of Developers
SmallMediumLarge
Scenario 1 (small developers only)5000
Scenario 2 (medium developers only)0500
Scenario 3 (large developers only)0050
Scenario 4 (equal mixed of developers)505050
Scenario 5 (hierarchical mix of developers)603010

