Local Segregation of Realised Niches in Lizards

 ,
,  ,
,
Abstract
:1. Introduction
- (1)
- Species occurring in syntopy might use microhabitats in the same way, as Iberian wall lizards are considered generalists [32].
- (2)
- (3)
2. Materials and Methods
2.1. Study Species
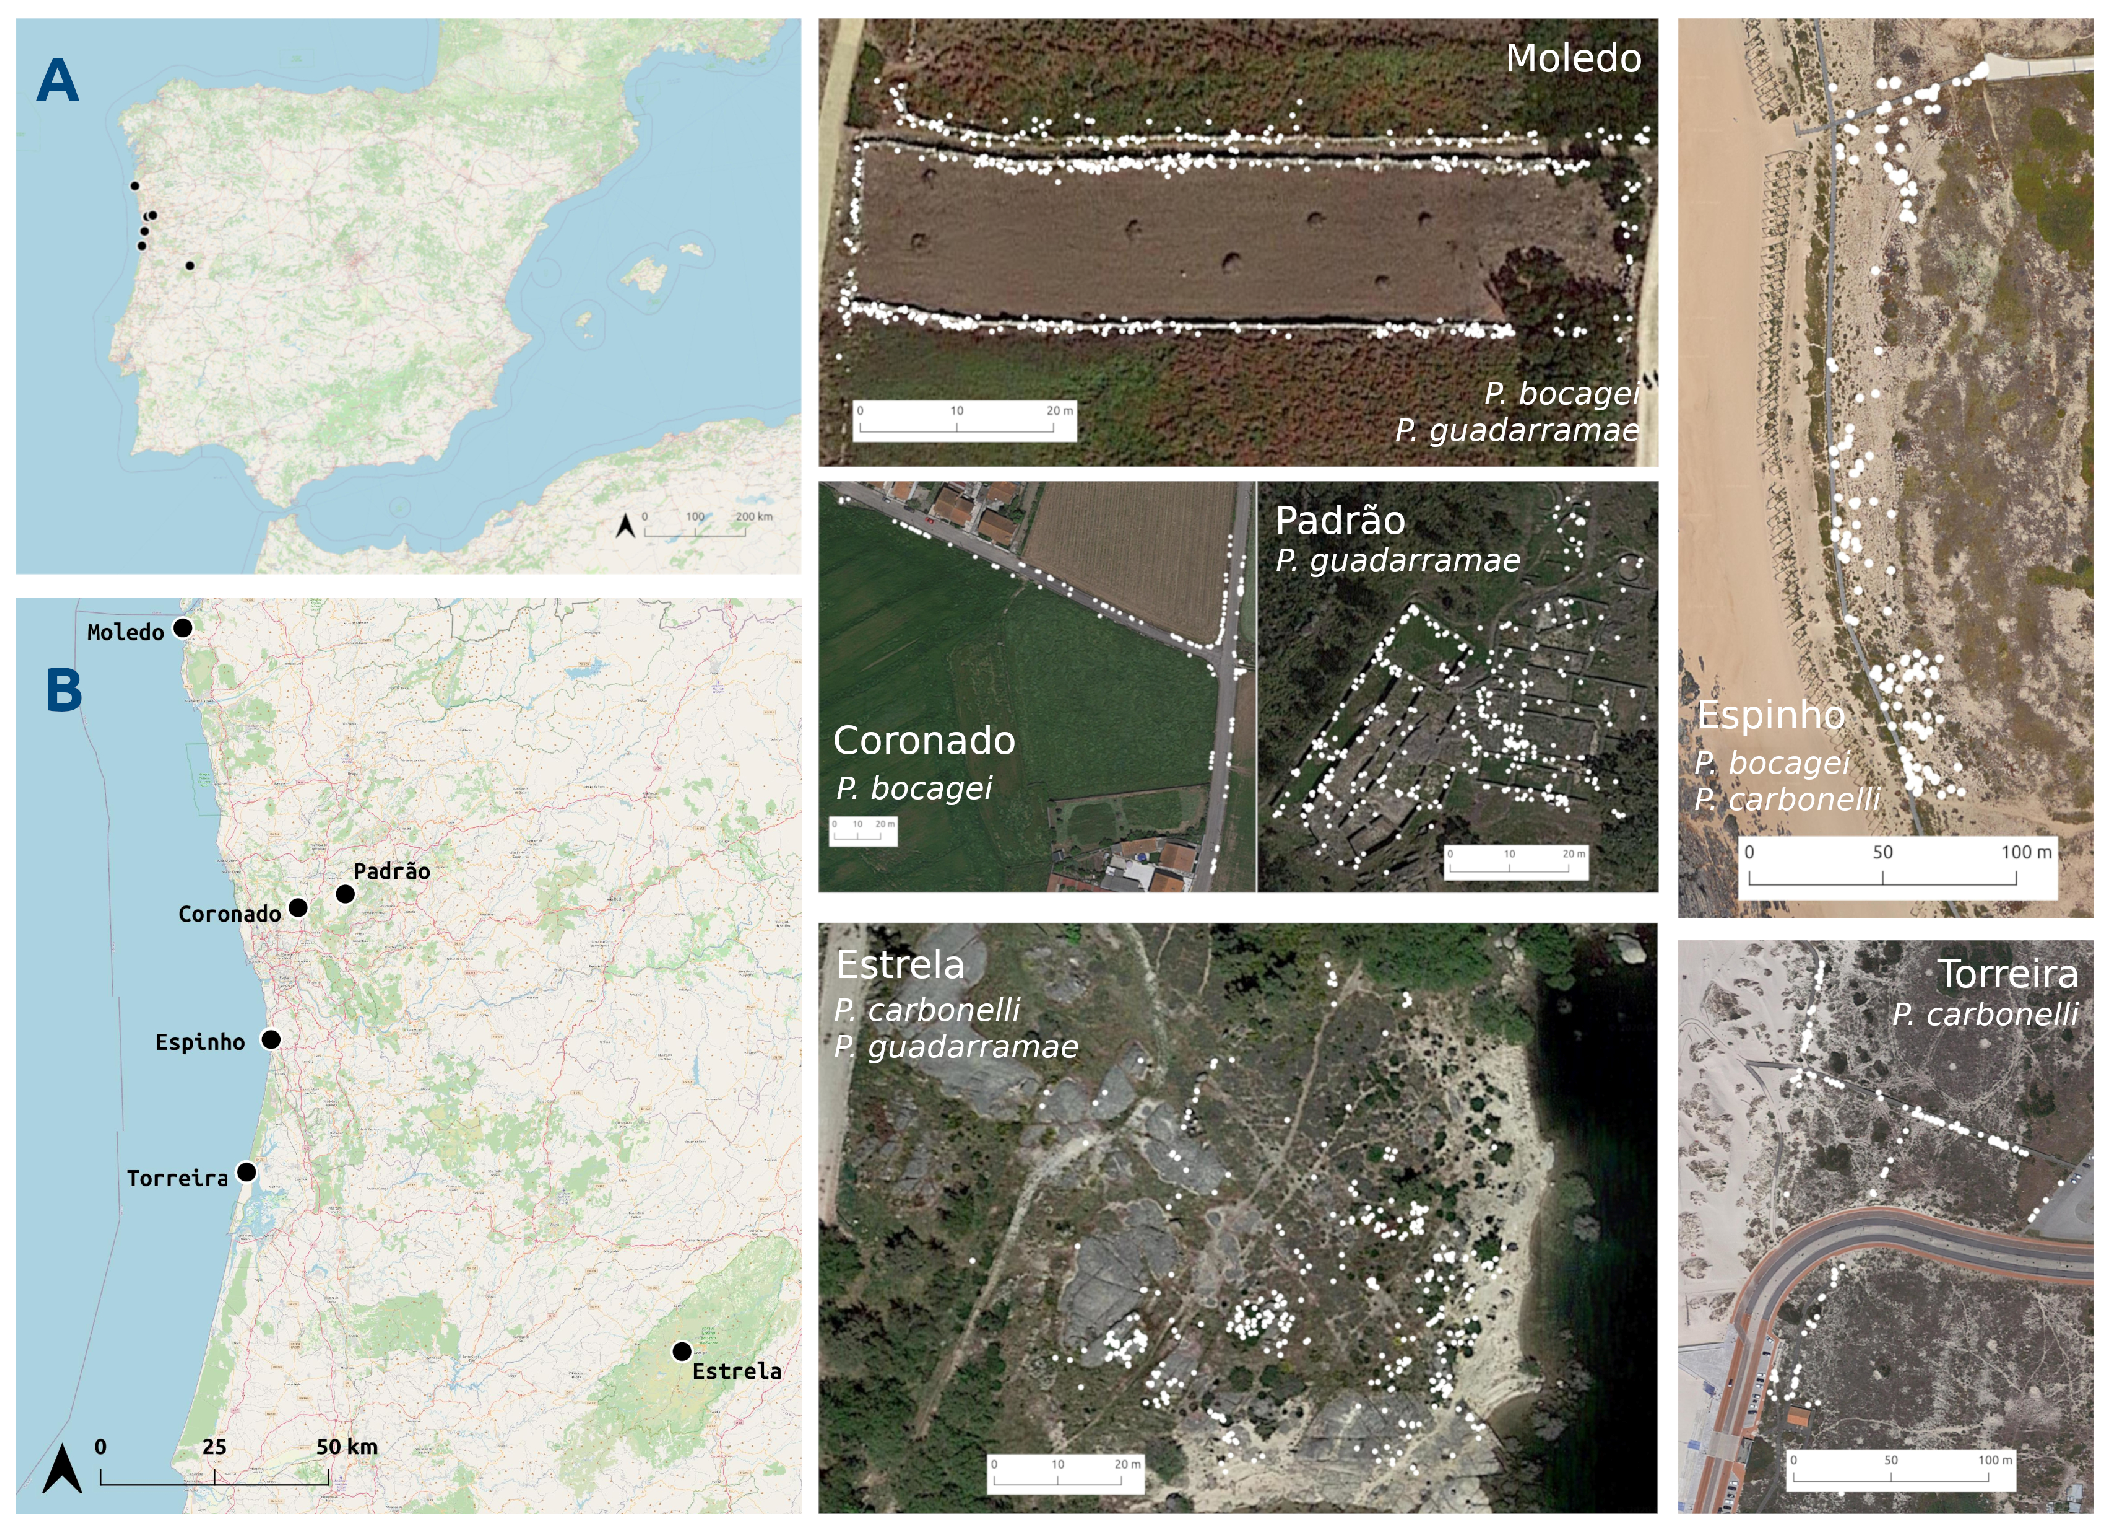
2.2. Study Areas
- 1
- Coronado: an agricultural area of irrigated crops separated by high stone walls (>150 cm) inside a lax urban matrix. Only P. bocagei is present. Lizards were captured on 9 and 10 June 2013, and resighted between 12 and 17 June 2013.
- 2
- Padrão: area composed by restored ruined walls (always lower than 50 cm) of a prehistorical village and surrounded by a forest of oaks and cork trees. Only P. guadarramae is present. Lizards are more frequent on the walls. Lizards were captured on 26 May 2013 and resighted between 28 May and 4 June 2013.
- 3
- Torreira: area of coastal dunes with wooden boardwalks. Only P. carbonelli is present. Lizards can be found everywhere, but more frequently on the woody passages. Lizards were captured on 11 and 12 May 2013 and resighted between 14 and 23 May 2013.
- 4
- Moledo: agricultural area of irrigated crops with stone walls (~150 cm) separating the crops. Podarcis bocagei and P. guadarramae occur sympatrically, although the latter in lesser numbers. Lizards occur in the walls. Lizards were captured on 10 June 2014 and resighted between 12 and 20 June 2014.
- 5
- 6
- Estrela: area composed by rock boulders on the shore of a reservoir. P. guadarramae and P. carbonelli are present in this area, although the latter in less number. Lizards were captured on 16 and 17 May 2012, and resighted between 19 and 24 May 2012.
2.3. Fieldwork
2.4. Niche Segregation between Species
3. Results
- (1)
- When comparing species between syntopic areas (Espinho, Estrela, Moledo), all species pairs occupied very similar niches (Table 3): Schoener’s D indices were high, stability values were close or equal to 1, and the unfilling and expansion indices were very low (<0.1). The overlaps between niches were almost complete, while the distances between centroids were very small (Figure 2).
- (2)
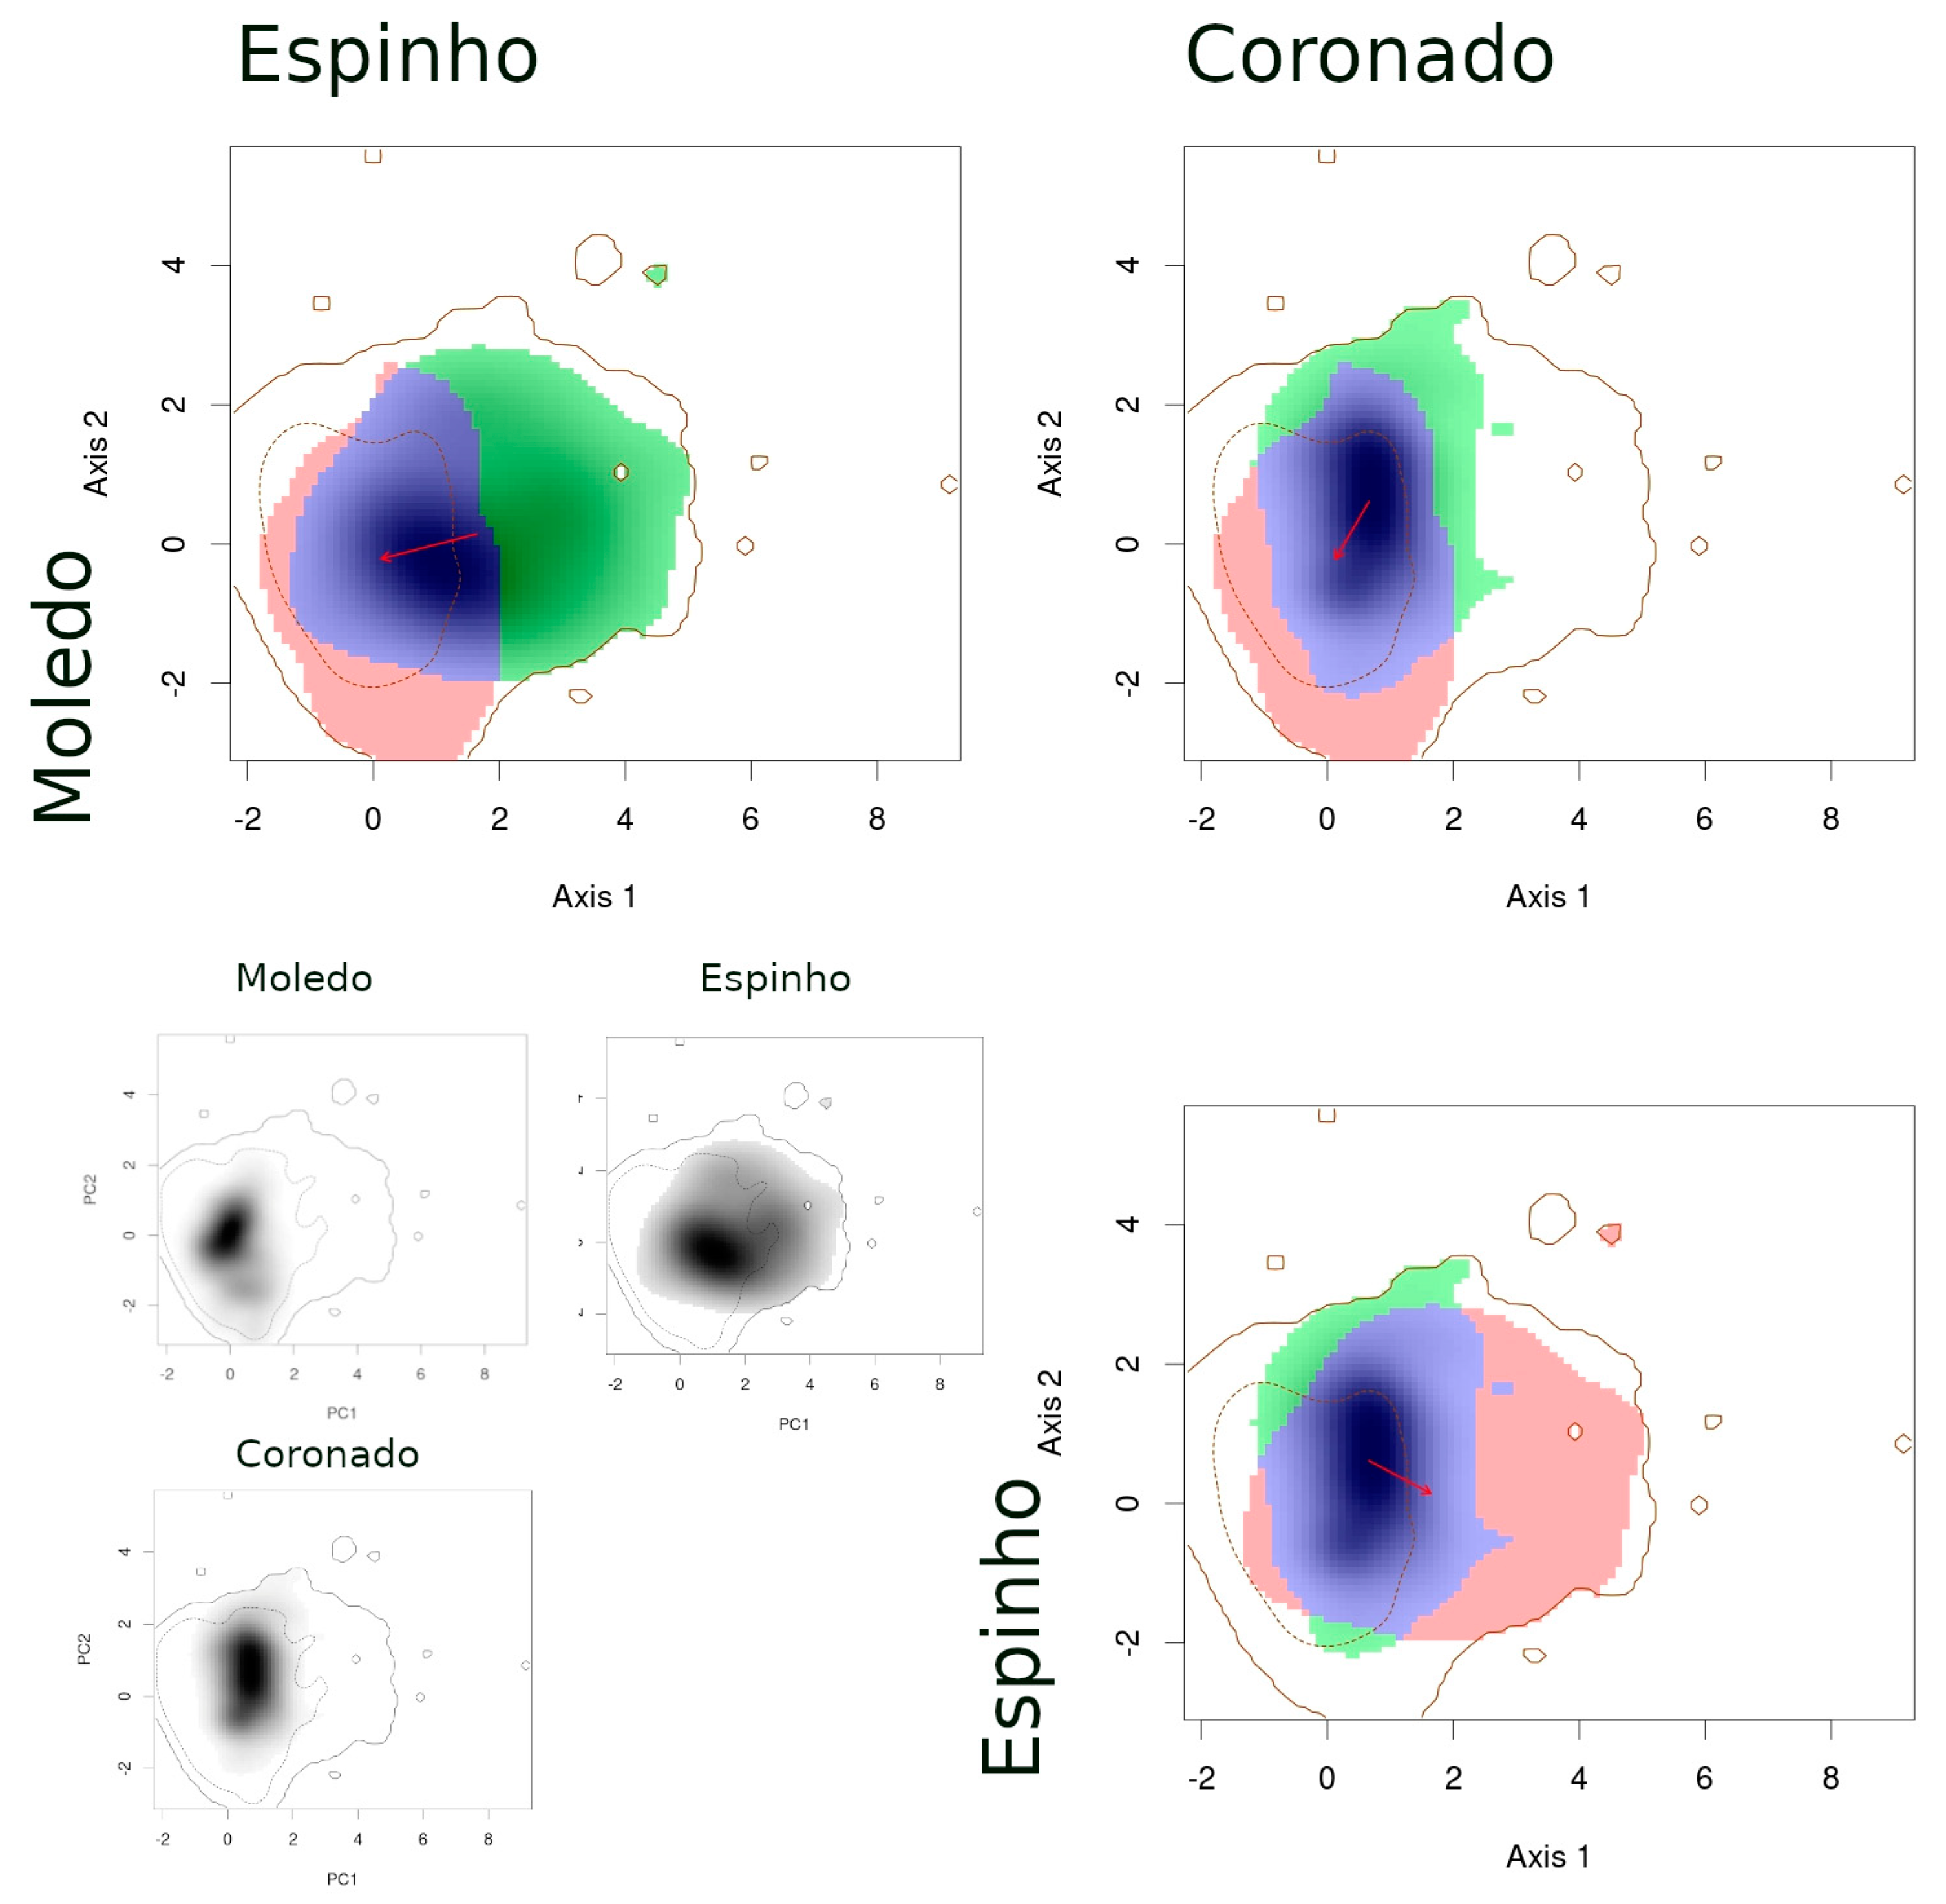
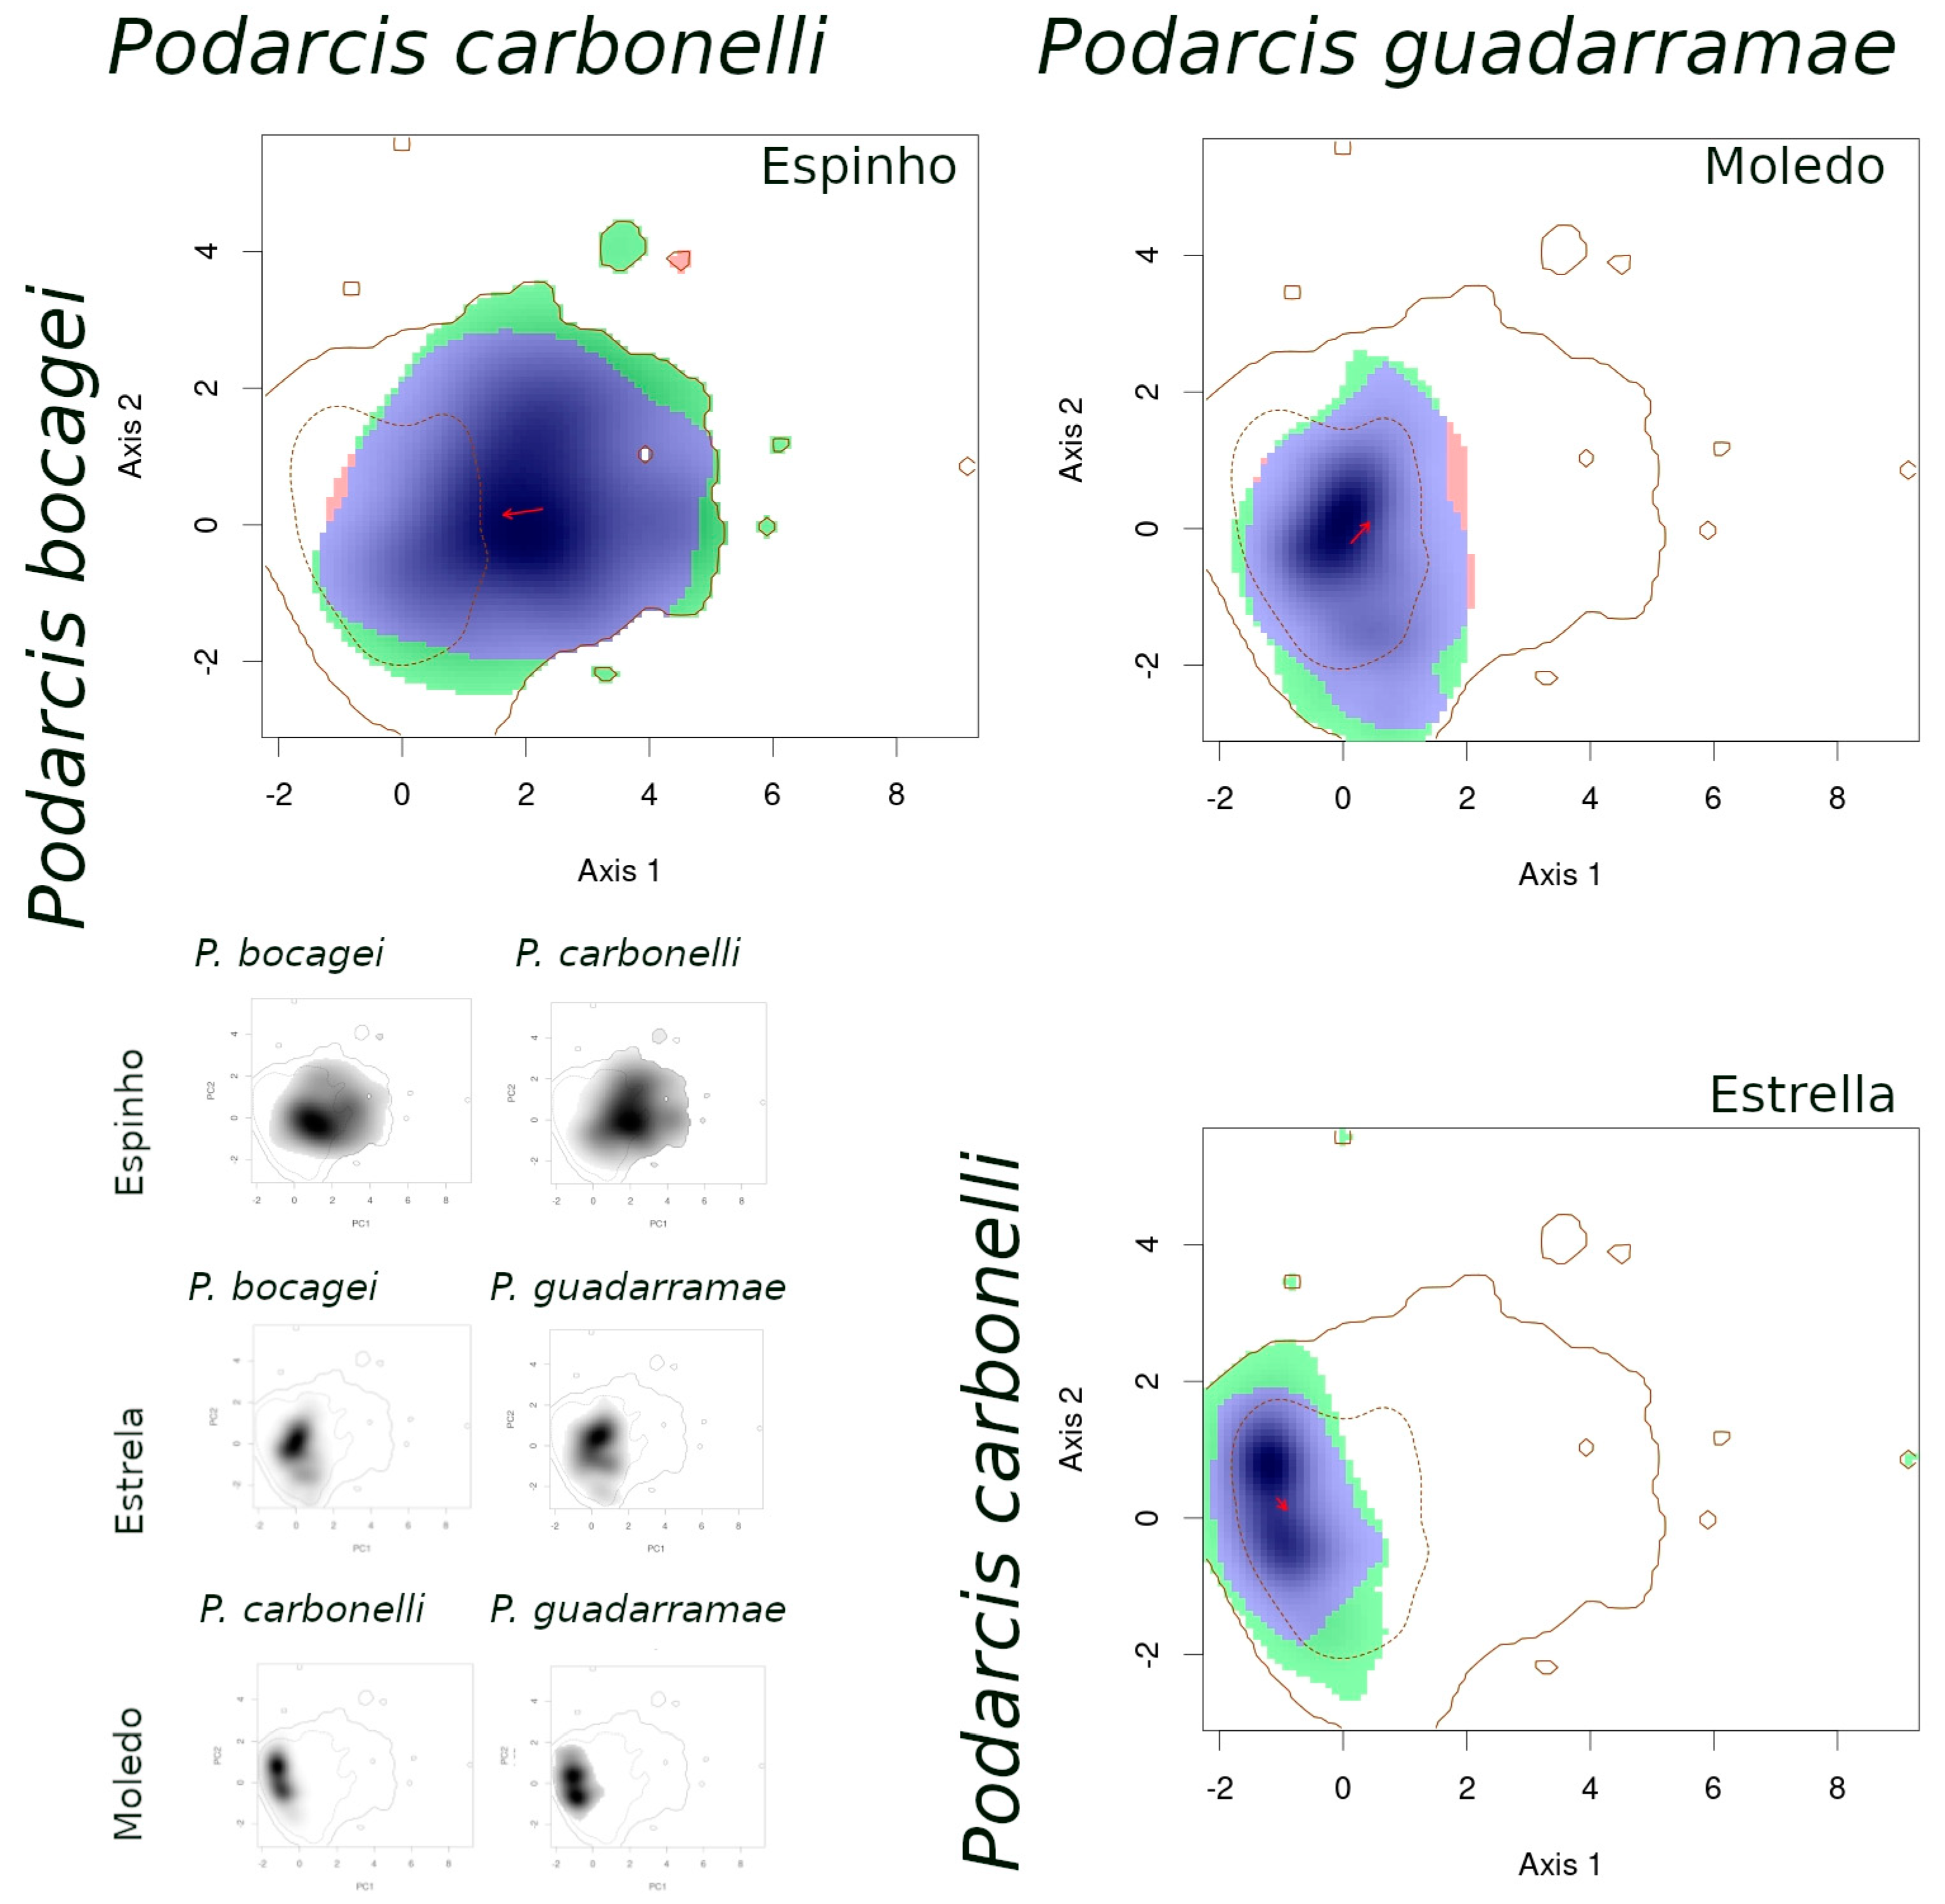
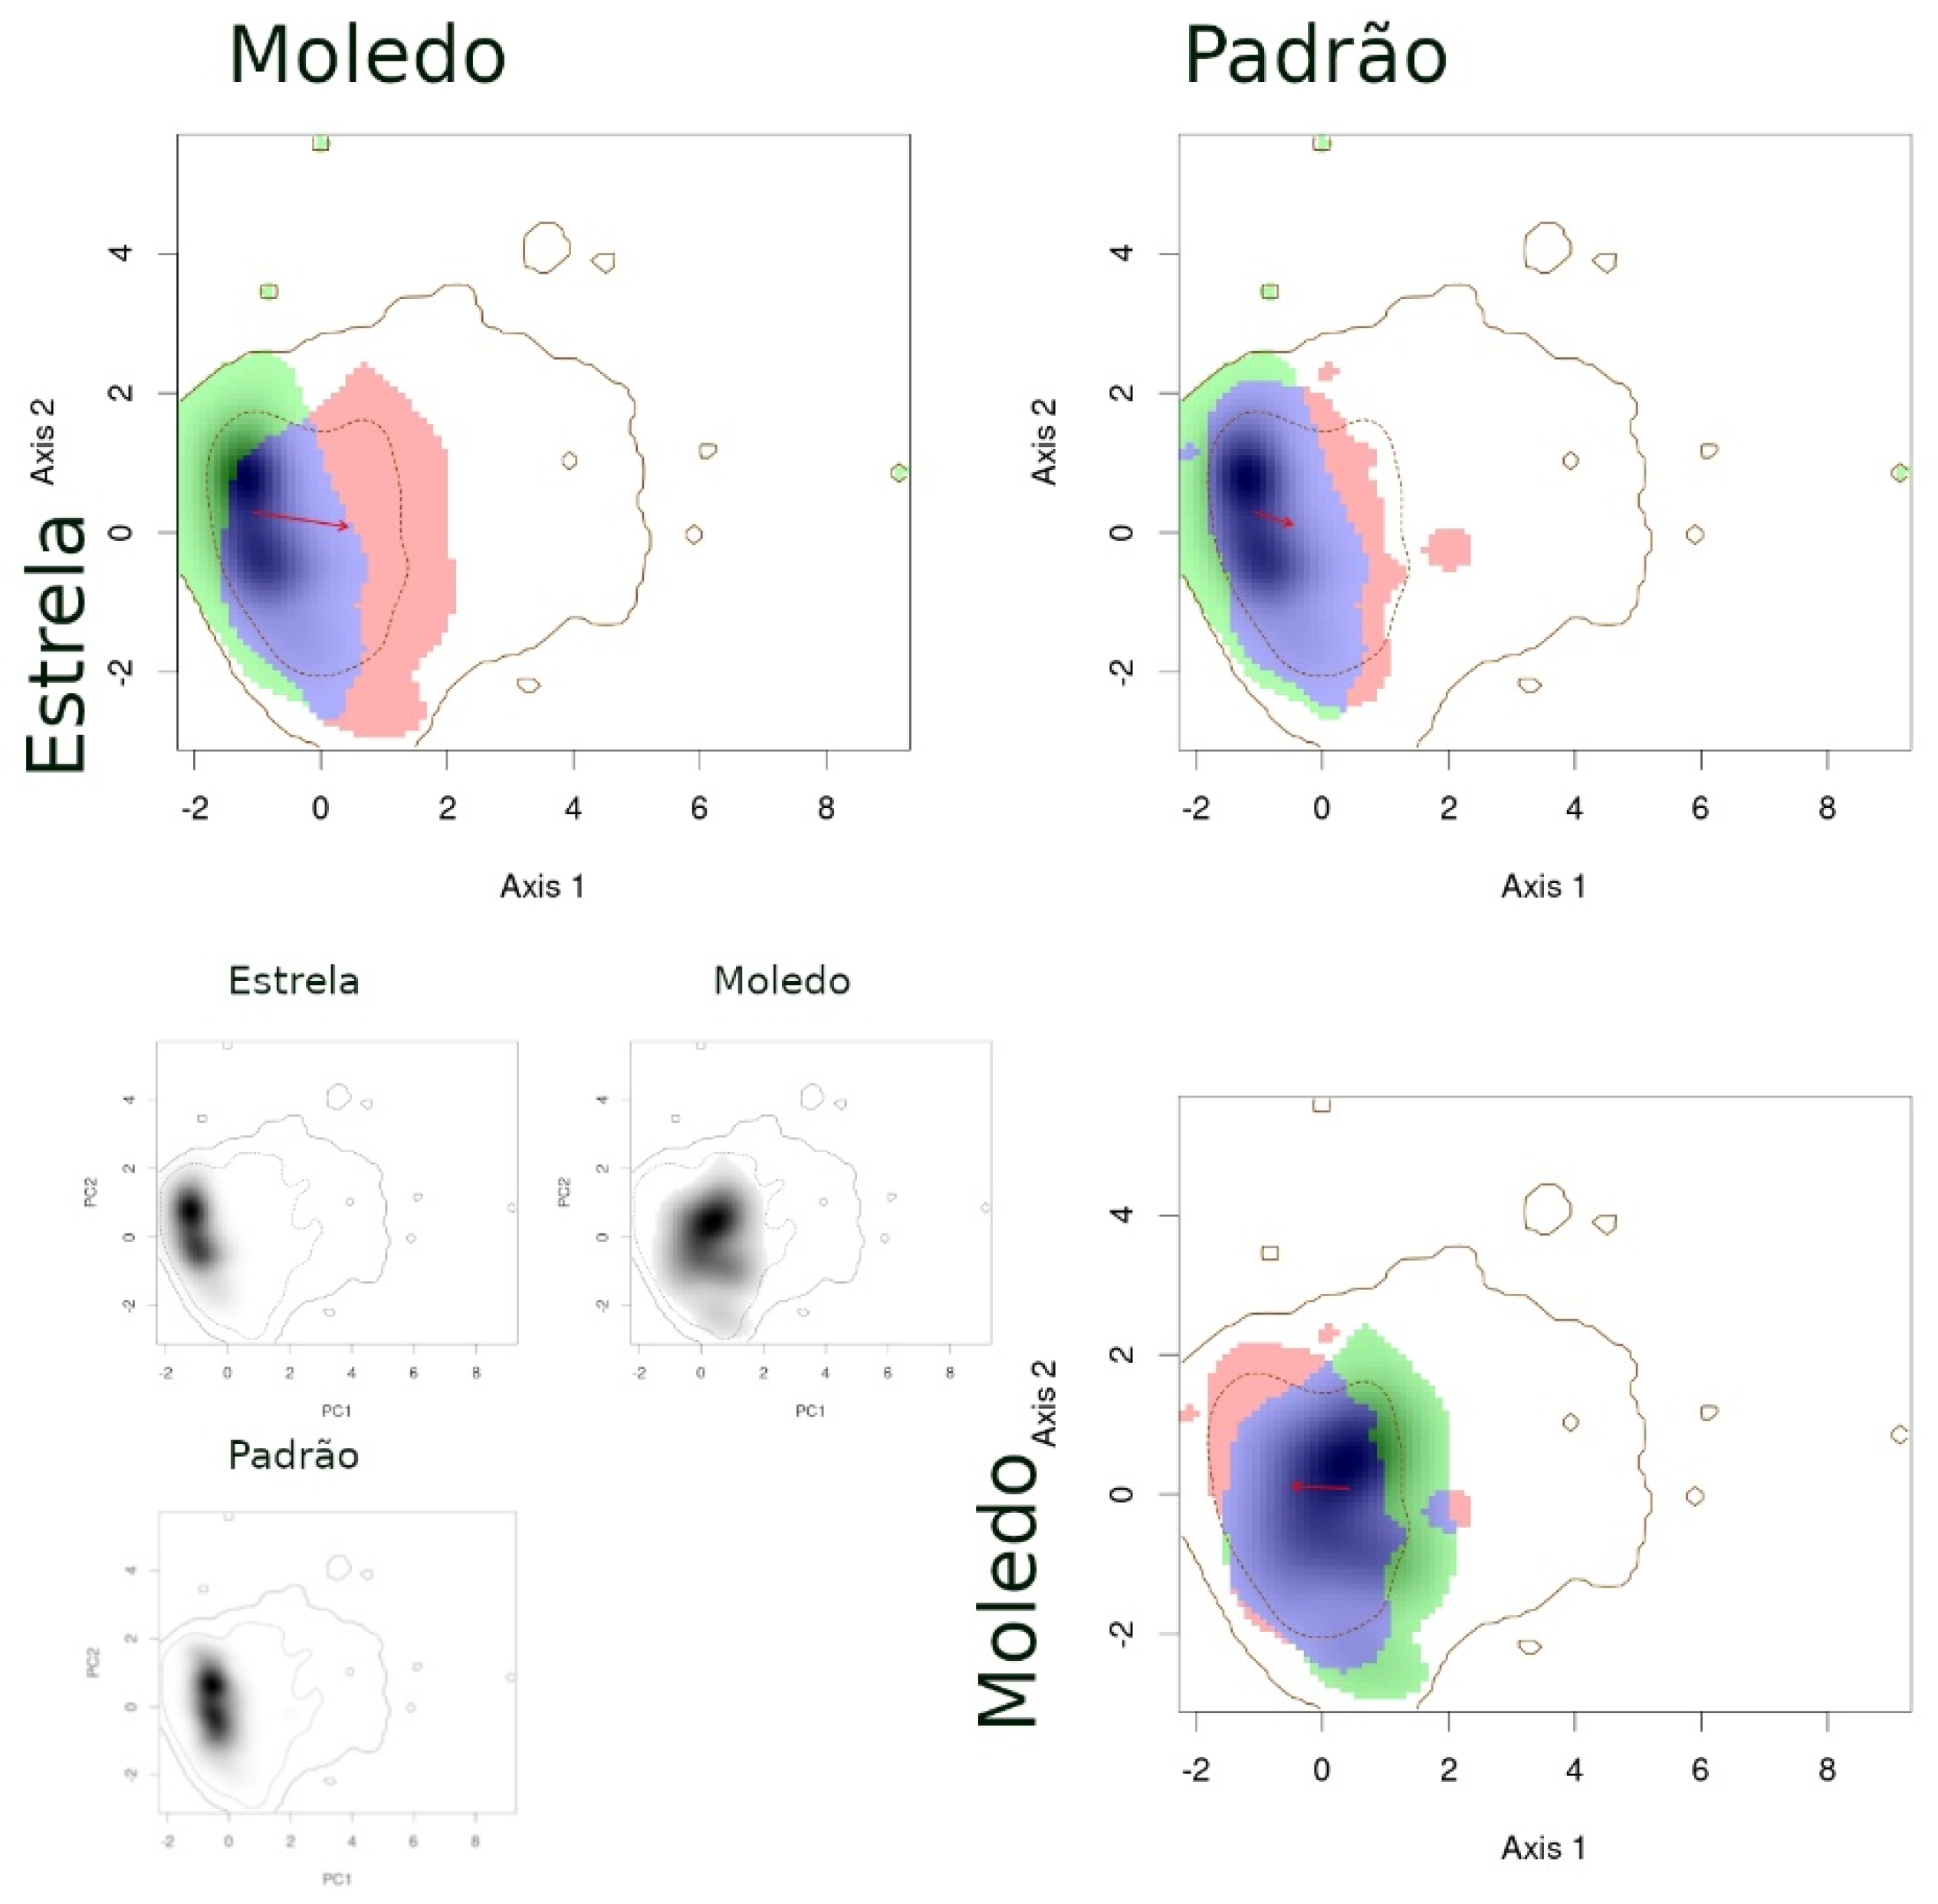
- When comparing populations of the same species between a syntopic (Espinho, Estrela, Moledo) and an allopatric area (Coronado, Padrão, Torreira), similarities were intermediate (Table 3): Schoener’s D indices were close to 0.3 and stability indices were very high (around 0.8–0.9). Here, the exception is the comparison between Torreira and Espinho populations of P. carbonelli, which presented always lower values (below 0.2). Niche overlaps across areas were high, but not total, while the distances between centroids were large (Figure 3, Figure 4 and Figure 5).
- (3)
- When comparing populations of the same species between syntopic study areas (Espinho, Estrela, Moledo), similarities values were very low (Table 3): Schoener’s D indices were lower than 0.15 and stability indices were lower than 0.8–0.9 (except the comparison between Espinho and Moledo for P. bocagei). The expansion and unfilling indices presented the maximum values considering all comparisons. Niche overlaps were moderate while the distances between centroids were very large (see the red arrows in Figure 3, Figure 4 and Figure 5).
4. Discussion
- (1)
- Considering the environmental micro-niche variables analysed here, all Podarcis species tend to use similar microhabitats, as indicated by ecospat results between syntopic populations.
- (2)
- When in syntopy with another congeneric species, a species tends to occupy different microhabitats if it is relatively less abundant.
Supplementary Materials
Author Contributions
Funding
Acknowledgments
Conflicts of Interest
References
- Sillero, N.; Argaña, E.; Freitas, S.; García-Muñoz, E.; Arakelyan, M.; Corti, C.; Carretero, M.A. Short term spatial structure of a lizard (Darevskia sp.) community in Armenia. Acta Herpetol. 2018, 13, 155–163. [Google Scholar] [CrossRef]
- Sillero, N.; Gomes, V. Living in clusters: The local spatial segregation of a lizard. Basic Appl. Herpetol. 2016, 30, 61–75. [Google Scholar] [CrossRef] [Green Version]
- Prinzing, A.; Durka, W.; Klotz, S.; Brandl, R. Geographic variability of ecological niches of plant species: Are competition and stress relevant? Ecography 2002, 6, 721–729. [Google Scholar] [CrossRef] [Green Version]
- Hutchinson, G.E. Concluding remarks. Cold Spring Harb. Symp. Quant. Biol. 1957, 22, 415–427. [Google Scholar] [CrossRef]
- Diaz-Paniagua, C. Temporal segregation in larval amphibian communities in temporary ponds at a locality in SW Spain. Amphib. Reptil. 1988, 9, 15–26. [Google Scholar] [CrossRef]
- Ficetola, G.F.; Pennati, R.; Manenti, R. Spatial segregation among age classes in cave salamanders: Habitat selection or social interactions? Popul. Ecol. 2013, 55, 217–226. [Google Scholar] [CrossRef]
- Schenk, H.J.; Holzapfel, C.; Hamilton, J.G.; Mahall, B.E. Spatial ecology of a small desert shrub on adjacent geological substrates. J. Ecol. 2003, 91, 383–395. [Google Scholar] [CrossRef]
- Grinnell, J. The niche-relationships of the California Thrasher. Auk 1917, 34, 427–433. [Google Scholar] [CrossRef]
- Pearson, R.G. Species’ Distribution Modeling for Conservation Educators and Practitioners; American Museum of Natural History: New York, NY, USA, 2007. [Google Scholar]
- Sillero, N.; Gonçalves-Seco, L. Spatial structure analysis of a reptile community with airborne LiDAR data. Int. J. Geogr. Inf. Sci. 2014, 28, 1709–1722. [Google Scholar] [CrossRef]
- Frost, C.L.; Bergmann, P.J. Spatial Distribution and Habitat Utilization of the Zebra-tailed Lizard (Callisaurus draconoides). J. Herpetol. 2012, 46, 203–208. [Google Scholar] [CrossRef]
- Gray, L.; He, F. Spatial point-pattern analysis for detecting density-dependent competition in a boreal chronosequence of Alberta. For. Ecol. Manag. 2009, 259, 98–106. [Google Scholar] [CrossRef]
- Getzin, S.; Dean, C.; He, F.; Trofymow, J.A.; Wiegand, K.; Wiegand, T. Spatial patterns and competition of tree species in a Douglas-fir chronosequence on Vancouver Island. Ecography 2006, 29, 671–682. [Google Scholar] [CrossRef]
- Condit, R.; Ashton, P.S.; Baker, P.; Bunyavejchewin, S.; Gunatilleke, S.; Gunatilleke, N.; Hubbell, S.P.; Foster, R.B.; Itoh, A.; Lafrankie, J.V.; et al. Spatial Patterns in the Distribution of Tropical Tree Species. Science 2000, 288, 1414–1418. [Google Scholar] [CrossRef] [PubMed]
- Moody, A.L.; Thompson, W.A.; De Bruijin, B.; Houston, A.I.; Goss-Custard, J.D. The Analysis of the Spacing of Animals, with an Example Based on Oystercatchers during the Tidal Cycle. J. Anim. Ecol. 1997, 66, 615–628. [Google Scholar] [CrossRef]
- Sillero, N.; Dos Santos, R.; Teodoro, A.C.; Carretero, M. Ecological niche models improve home ranges estimations. J. Zool. 2020. [Google Scholar] [CrossRef]
- Pearman, P.B.; Guisan, A.; Broennimann, O.; Randin, C.F. Niche dynamics in space and time. Trends Ecol. Evol. 2008, 23, 149–158. [Google Scholar] [CrossRef]
- Guisan, A.; Petitpierre, B.; Broennimann, O.; Daehler, C.; Kueffer, C. Unifying niche shift studies: Insights from biological invasions. Trends Ecol. Evol. 2014, 29, 260–269. [Google Scholar] [CrossRef] [Green Version]
- Wiens, J.J.; Ackerly, D.D.; Allen, A.P.; Anacker, B.L.; Buckley, L.B.; Cornell, H.V.; Damschen, E.I.; Jonathan Davies, T.; Grytnes, J.-A.; Harrison, S.P.; et al. Niche conservatism as an emerging principle in ecology and conservation biology. Ecol. Lett. 2010, 10, 1310–1324. [Google Scholar] [CrossRef]
- Peterson, A.T. Ecological niche conservatism: A time-structured review of evidence. J. Biogeogr. 2011, 38, 817–827. [Google Scholar] [CrossRef]
- Sillero, N. What does ecological modelling model? A proposed classification of ecological niche models based on their underlying methods. Ecol. Model. 2011, 222, 1343–1346. [Google Scholar] [CrossRef]
- Barbosa, M.A.; Sillero, N.; Martínez-Freiría, F.; Real, R. Ecological niche models in Mediterranean herpetology: Past, present and future. In Ecological Modelling; Zhang, W., Ed.; Nova Publishers: Hauppauge, NY, USA, 2012; pp. 173–204. [Google Scholar]
- Bogosian, V., III; Hellgren, E.C.; Sears, M.W.; Moody, R.W. High-resolution niche models via a correlative approach: Comparing and combining correlative and process-based information. Ecol. Model. 2012, 237–238, 63–73. [Google Scholar] [CrossRef] [Green Version]
- Descombes, P.; Petitpierre, B.; Morard, E.; Berthoud, M.; Guisan, A.; Vittoz, P. Monitoring and distribution modelling of invasive species along riverine habitats at very high resolution. Biol. Invasions 2016, 18, 3665–3679. [Google Scholar] [CrossRef]
- Turner, J.A.; Babcock, R.C.; Kendrick, G.A.; Hovey, R.K. How does spatial resolution affect model performance? A case for ensemble approaches for marine benthic mesophotic communities. J. Biogeogr. 2019, 46, 1249–1259. [Google Scholar] [CrossRef]
- Lassueur, T.; Joost, S.; Randin, C.F. Very high resolution digital elevation models: Do they improve models of plant species distribution? Ecol. Model. 2006, 1–2, 139–153. [Google Scholar] [CrossRef]
- Jiménez-Alfaro, B.; Draper, D.; Nogués-bravo, D. Modeling the potential area of occupancy at fine resolution may reduce uncertainty in species range estimates. Divers. Distrib. 2012, 147, 190–196. [Google Scholar] [CrossRef]
- Svensson, J.R.; Jonsson, L.; Lindegarth, M. Excessive spatial resolution decreases performance of quantitative models, contrary to expectations from error analyses. Mar. Ecol. Prog. Ser. 2013, 485, 57–73. [Google Scholar] [CrossRef]
- Brown, W.L.; Wilson, E.O. Character Displacement. Syst. Zool. 1956, 5, 49–64. [Google Scholar] [CrossRef]
- Beaumont, L.J.; Gallagher, R.V.; Thuiller, W.; Downey, P.O.; Leishman, M.R.; Hughes, L. Different climatic envelopes among invasive populations may lead to underestimations of current and future biological invasions. Divers. Distrib. 2009, 3, 409–420. [Google Scholar] [CrossRef]
- Broennimann, O.; Treier, U.A.; Müller-Schärer, H.; Thuiller, W.; Peterson, A.T.; Guisan, A. Evidence of climatic niche shift during biological invasion. Ecol. Lett. 2007, 8, 701–709. [Google Scholar] [CrossRef] [Green Version]
- Arnold, E.N. Resource partition among lacertid lizards in southern Europe. J. Zool. 1987, 1, 739–782. [Google Scholar] [CrossRef]
- Law, R.; Marrow, P.; Dieckmann, U. On evolution under asymmetric competition. Evol. Ecol. 1997, 11, 485–501. [Google Scholar] [CrossRef] [Green Version]
- Abrams, P.A. Alternative models of character displacement and niche shift. I. Adaptive shifts in resource use when there is competition for nutritionally nonsubstitutable resources. Evolution 1987, 41, 651–661. [Google Scholar] [CrossRef] [PubMed]
- Broennimann, O.; Fitzpatrick, M.C.; Pearman, P.B.; Petitpierre, B.; Pellissier, L.; Yoccoz, N.G.; Thuiller, W.; Fortin, M.-J.; Randin, C.; Zimmermann, N.E.; et al. Measuring ecological niche overlap from occurrence and spatial environmental data. Glob. Ecol. Biogeogr. 2012, 21, 481–497. [Google Scholar] [CrossRef] [Green Version]
- Di Cola, V.; Broennimann, O.; Petitpierre, B.; Breiner, F.T.; D’Amen, M.; Randin, C.; Engler, R.; Pottier, J.; Pio, D.; Dubuis, A.; et al. ecospat: An R package to support spatial analyses and modeling of species niches and distributions. Ecography 2017, 40, 774–787. [Google Scholar] [CrossRef]
- Pé rez-Mellado, V. Podarcis Bocagei (Seoane, 1884). Reptiles. Salvador, A. (Coordinador), 1998; Ibérica, F., Ramos, M.A., Eds.; Museo Nacional Ciencias Naturales, CSIC: Madrid, Spain, 1998; Volume 10, pp. 243–257. [Google Scholar]
- Geniez, P.; Sá-Sousa, P.; Guillaume, C.P.; Cluchier, A.; Crochet, P.A. Systematics of the Podarcis hispanicus complex (Sauria, Lacertidae) III: Valid nomina of the western and central Iberian forms. Zootaxa 2014, 3794, 1–51. [Google Scholar] [CrossRef] [Green Version]
- Loureiro, A.; Ferrand, N.; Carretero, M.A.; Paulo, O. (Eds.) Atlas dos Anfíbios e Répteis de Portugal; Esfera do Caos: Lisboa, Portugal, 2010. [Google Scholar]
- Sillero, N.; Corti, C.; Carretero, M.A. Home ranges of parthenogenetic and bisexual species in a community of Darevskia lizards (Reptilia: Lacertidae). Zool. Middle East 2016, 62, 306–318. [Google Scholar] [CrossRef]
- Sillero, N.; Skidmore, A.K.; Toxopeus, A.G.; Brito, J.C. Biogeographical patterns derived from remote sensing variables: The amphibians and reptiles of the Iberian Peninsula. Amphib. Reptil. 2009, 30, 185–206. [Google Scholar] [CrossRef]
- Carretero, M.A.; Sá-Sousa, P.; Barbosa, D.; Harris, D.J.; Pinho, C. Sintopía estricta entre P. bocagei y P. carbonelli. Boletín Asoc. Herpetol. Española 2002, 13, 20–24. [Google Scholar]
- Pinho, C.; Kaliontzopoulou, A.; Carretero, M.A.; Harris, D.J.; Ferrand, N. Genetic admixture between the Iberian endemic lizards Podarcis bocagei and Podarcis carbonelli: Evidence for limited natural hybridization and a bimodal hybrid zone. J. Zool. Syst. Evol. Res. 2009, 47, 368–377. [Google Scholar] [CrossRef]
- Galan, P. Reproductive ecology of the lacertid lizard Podarcis bocagei. Ecography 1997, 20, 197–209. [Google Scholar] [CrossRef]
- Carretero, M.; Ribeiro, R.; Barbosa, D.; Sá-Sousa, P.; Harris, D.J. Spermatogenesis in two Iberian Podarcis lizards: Relationships with male traits. Anim. Biol. 2006, 56, 1–12. [Google Scholar] [CrossRef] [Green Version]
- Pérez-Mellado, V. Podarcis Hispanica (Steindachner, 1870). Reptiles. Salvador, A. (Coordinador), 1998; Ibérica, F., Ramos, M.A., Eds.; Museo Nacinal Ciencias Naturales, CSIC: Madrid, Spain, 1998; Volume 10, pp. 258–272. [Google Scholar]
- García-Muñoz, E.; Sillero, N. Two new types of noose for capturing herps. Acta Herpetol. 2010, 5, 259–263. [Google Scholar]
- Stamps, J.A. Conspecifics as Cues to Territory Quality: A Preference of Juvenile Lizards (Anolis aeneus) for Previously Used Territories. Am. Nat. 1987, 129, 629–642. [Google Scholar] [CrossRef]
- Eifler, D.A.; Eifler, M.A. Foraging Behavior and Spacing Patterns of the Lizard Cnemidophorus uniparens. J. Herpetol. 1998, 32, 24–33. [Google Scholar] [CrossRef]
- Schoener, T.W.; Schoener, A. Intraspecific Variation in Home-Range Size in Some Anolis Lizards. Ecology 1982, 63, 809–823. [Google Scholar] [CrossRef]
- Boudjemadi, K.; Lecomte, J.; Clobert, J. Influence of connetivity on demography and dispersal in two contrasting habitats: An experimental approach. J. Anim. Ecol. 1999, 68, 1207–1224. [Google Scholar] [CrossRef]
- Hulbert, S. Pseudoreplication and the design of ecological field experiments. Ecol. Monogr. 1984, 54, 187–211. [Google Scholar] [CrossRef] [Green Version]
- Bivand, R.S.; Pebesma, E.J.; Gómez-Rubio, V. Applied Spatial Data Analysis with R, 2nd ed.; Springer: New York, NY, USA, 2008; Available online: http://www.asdar-book.org/ (accessed on 21 December 2020).
- Warren, D.L.; Glor, R.E.; Turelli, M. ENMTools: A toolbox for comparative studies of environmental niche models. Ecography 2010, 33, 607–611. [Google Scholar] [CrossRef]
- Warren, D.L.; Glor, R.E.; Turelli, M. Environmental niche equivalency versus conservatism: Quantitative approaches to niche evolution. Evolution 2008, 62, 2868–2883. [Google Scholar] [CrossRef]
- R Core Team. R: A Language and Environment for Statistical Computing; R Foundation for Statistical Computing; R Core Team: Vienna, Austria, 2020; Available online: https://www.R-project.org/ (accessed on 21 December 2020).
- Gomes, V.; Carretero, M.A.; Kaliontzopoulou, A. The relevance of morphology for habitat use and locomotion in two species of wall lizards. Acta Oecologica 2016, 70, 87–95. [Google Scholar] [CrossRef]
- Kaliontzopoulou, A.; Carretero, M.A.; Llorente, G.A. Intraspecific ecomorphological variation: Linear and geometric morphometrics reveal habitat-related patterns within Podarcis bocagei wall lizards. J. Evol. Biol. 2010, 23, 1234–1244. [Google Scholar] [CrossRef] [PubMed]
- Kaliontzopoulou, A.; Carretero, M.A.; Adams, D.C. Ecomorphological variation in male and female wall lizards and the macroevolution of sexual dimorphism in relation to habitat use. J. Evol. Biol. 2015, 28, 80–94. [Google Scholar] [CrossRef] [PubMed]
- Román, R.; Ruiz, G.; Delibes, M.; Revilla, E. Factores ambientales condicionantes de la presencia de la lagartija de Carbonell Podarcis carbonelli (Pérez-Mellado, 1981) en la comarca de Doñana. Anim. Biodivers. Conserv. 2006, 29, 73–82. [Google Scholar]
- Sillero, N.; Carretero, M.A. Modelling the past and future distribution of contracting species. The Iberian lizard Podarcis carbonelli (Squamata: Lacertidae) as a case study. Zool. Anz. 2013, 252, 289–298. [Google Scholar] [CrossRef]
- Liu, X.; Petitpierre, B.; Broennimann, O.; Li, X.; Guisan, A.; Li, Y. Realized climatic niches are conserved along maximum temperatures among herpetofaunal invaders. J. Biogeogr. 2017, 44, 111–121. [Google Scholar] [CrossRef] [Green Version]
- Petitpierre, B.; Kueffer, C.; Broennimann, O.; Randin, C.; Daehler, C.; Guisan, A. Climatic Niche Shifts Are Rare Among Terrestrial Plant Invaders. Science 2012, 335, 1344–1348. [Google Scholar] [CrossRef] [Green Version]
- Kaliontzopoulou, A.; Pinho, C.; Harris, D.J.; Carretero, M.A. When cryptic diversity blurs the picture: A cautionary tale from Iberian and North African Podarcis wall lizards. Biol. J. Linn. Soc. 2011, 103, 779–800. [Google Scholar] [CrossRef] [Green Version]
- Kaliontzopoulou, A.; Adams, D.C.; Meijden, A.; Perera, A.; Carretero, M.A. Relationships between head morphology, bite performance and ecology in two species of Podarcis wall lizards. Evol. Ecol. 2012, 26, 825–845. [Google Scholar] [CrossRef]
- Kaliontzopoulou, A.; Carretero, M.A.; Llorente, G.A. Morphology of the Podarcis wall lizards (Squamata: Lacertidae) from the Iberian Peninsula and North Africa: Patterns of variation in a putative cryptic species complex. Zool. J. Linn. Soc. 2012, 164, 173–193. [Google Scholar] [CrossRef] [Green Version]
- Kaliontzopoulou, A.; Carretero, M.A.; Llorente, G.A. Multivariate and geometric morphometrics in the analysis of sexual dimorphism variation in Podarcis lizards. J. Morphol. 2007, 268, 152–165. [Google Scholar] [CrossRef]
- Carretero, M.A. An integrated assessment of the specific status in a group with complex systematics: The Iberomaghrebian lizards genus Podarcis (Squamata, Lacertidae). Integr. Zool. 2008, 4, 247–266. [Google Scholar] [CrossRef] [PubMed]
- Pleguezuelos, J.M.; Márquez, R.; Lizana, M. Atlas de Distribución y Libro Rojo de los Anfibios y Reptiles de España; Dirección de Conservación de la Naturaleza-Asociación Herpetológica Española: Madrid, Spain, 2002. [Google Scholar]
- Blonder, B.; Lamanna, C.; Violle, C.; Enquist, B.J. The n-dimensional hypervolume. Glob. Ecol. Biogeogr. 2014, 23, 595–609. [Google Scholar] [CrossRef]


| Species | Podarcis bocagei | Podarcis carbonelli | Podarcis guadarramae |
|---|---|---|---|
| Podarcis bocagei | Coronado | ||
| Podarcis carbonelli | Espinho | Torreira | |
| Podarcis guadarramae | Moledo | Estrela | Padrão |
| P. bocagei | P. carbonelli | P. guadarramae | ||||||
|---|---|---|---|---|---|---|---|---|
| Locality | Individuals | Sightings | Individuals | Sightings | Individuals | Sightings | All individuals | All sightings |
| Moledo | 37 | 419 | 6 | 70 | 43 | 489 | ||
| Padrão | 38 | 391 | 38 | 391 | ||||
| Coronado | 25 | 174 | 25 | 174 | ||||
| Espinho | 6 | 32 | 32 | 118 | 38 | 150 | ||
| Torreira | 20 | 184 | 20 | 184 | ||||
| Estrela | 9 | 29 | 46 | 368 | 55 | 397 | ||
| Total | 68 | 625 | 61 | 331 | 90 | 829 | 219 | 1785 |
| Species | Locality 1 | Locality 2 | D | ET p | ST 1 → 2p | ST 2 → 1p | Expansion | Stability | Unfilling |
|---|---|---|---|---|---|---|---|---|---|
| PB-PC | Espinho | Espinho | 0.745 | 0.446 | 0.941 | 0.951 | 0.003 | 0.997 | 0.077 |
| PC-PG | Estrela | Estrela | 0.619 | 0.673 | 0.960 | 0.960 | 0.000 | 1.000 | 0.063 |
| PB-PG | Moledo | Moledo | 0.693 | 0.446 | 0.901 | 0.911 | 0.011 | 0.989 | 0.021 |
| PB | Coronado | Moledo | 0.320 | 0.009 * | 0.653 | 0.653 | 0.126 | 0.874 | 0.093 |
| PB | Espinho | Moledo | 0.114 | 0.009 * | 0.317 | 0.416 | 0.108 | 0.892 | 0.461 |
| PB | Coronado | Espinho | 0.232 | 0.009 * | 0.574 | 0.535 | 0.336 | 0.664 | 0.048 |
| PC | Torreira | Espinho | 0.032 | 0.009 * | 0.188 | 0.238 | 0.024 | 0.976 | 0.790 |
| PC | Estrela | Espinho | 0.004 | 0.009 * | 0.067 | 0.089 | 0.395 | 0.605 | 0.919 |
| PC | Torreira | Estrela | 0.170 | 0.009 * | 0.614 | 0.713 | 0.368 | 0.632 | 0.419 |
| PG | Padrão | Estrela | 0.366 | 0.009 * | 0.822 | 0.792 | 0.042 | 0.958 | 0.077 |
| PG | Moledo | Estrela | 0.133 | 0.009 * | 0.465 | 0.564 | 0.476 | 0.524 | 0.286 |
| PG | Padrão | Moledo | 0.304 | 0.009 * | 0.743 | 0.634 | 0.062 | 0.938 | 0.243 |
Publisher‘s Note: MDPI stays neutral with regard to jurisdictional claims in published maps and institutional affiliations. |
© 2020 by the authors. Licensee MDPI, Basel, Switzerland. This article is an open access article distributed under the terms and conditions of the Creative Commons Attribution (CC BY) license (http://creativecommons.org/licenses/by/4.0/).
Share and Cite
Sillero, N.; Argaña, E.; Matos, C.; Franch, M.; Kaliontzopoulou, A.; Carretero, M.A. Local Segregation of Realised Niches in Lizards. ISPRS Int. J. Geo-Inf. 2020, 9, 764. https://0-doi-org.brum.beds.ac.uk/10.3390/ijgi9120764
Sillero N, Argaña E, Matos C, Franch M, Kaliontzopoulou A, Carretero MA. Local Segregation of Realised Niches in Lizards. ISPRS International Journal of Geo-Information. 2020; 9(12):764. https://0-doi-org.brum.beds.ac.uk/10.3390/ijgi9120764
Chicago/Turabian StyleSillero, Neftalí, Elena Argaña, Cátia Matos, Marc Franch, Antigoni Kaliontzopoulou, and Miguel A. Carretero. 2020. "Local Segregation of Realised Niches in Lizards" ISPRS International Journal of Geo-Information 9, no. 12: 764. https://0-doi-org.brum.beds.ac.uk/10.3390/ijgi9120764