Recent Sea Level Change in the Black Sea from Satellite Altimetry and Tide Gauge Observations


Department of Geomatics Engineering, Zonguldak Bülent Ecevit University, Incivez, 67100 Zonguldak, Turkey
*
Author to whom correspondence should be addressed.
ISPRS Int. J. Geo-Inf. 2020, 9(3), 185; https://0-doi-org.brum.beds.ac.uk/10.3390/ijgi9030185
Submission received: 30 January 2020
/
Revised: 19 March 2020
/
Accepted: 22 March 2020
/
Published: 24 March 2020
(This article belongs to the Special Issue GI for Disaster Management)
Abstract
:Global mean sea level has been rising at an increasing rate, especially since the early 19th century in response to ocean thermal expansion and ice sheet melting. The possible consequences of sea level rise pose a significant threat to coastal cities, inhabitants, infrastructure, wetlands, ecosystems, and beaches. Sea level changes are not geographically uniform. This study focuses on present-day sea level changes in the Black Sea using satellite altimetry and tide gauge data. The multi-mission gridded satellite altimetry data from January 1993 to May 2017 indicated a mean rate of sea level rise of 2.5 ± 0.5 mm/year over the entire Black Sea. However, when considering the dominant cycles of the Black Sea level time series, an apparent (significant) variation was seen until 2014, and the rise in the mean sea level has been estimated at about 3.2 ± 0.6 mm/year. Coastal sea level, which was assessed using the available data from 12 tide gauge stations, has generally risen (except for the Bourgas Station). For instance, from the western coast to the southern coast of the Black Sea, in Constantza, Sevastopol, Tuapse, Batumi, Trabzon, Amasra, Sile, and Igneada, the relative rise was 3.02, 1.56, 2.92, 3.52, 2.33, 3.43, 5.03, and 6.94 mm/year, respectively, for varying periods over 1922–2014. The highest and lowest rises in the mean level of the Black Sea were in Poti (7.01 mm/year) and in Varna (1.53 mm/year), respectively. Measurements from six Global Navigation Satellite System (GNSS) stations, which are very close to the tide gauges, also suggest that there were significant vertical land movements at some tide gauge locations. This study confirmed that according to the obtained average annual phase value of sea level observations, seasonal sea level variations in the Black Sea reach their maximum annual amplitude in May–June.

1. Introduction
Sea level changes occur at various time scales. Throughout geologic eras, sea levels have changed drastically many times, primarily following tectonic processes and glacial cycles [1]. During the Last Glacial Maximum (LGM), sea levels were about 130 m lower than today, because of the large amount of water held by glaciers and ice sheets [2]. After the major deglaciation (~21,000 years ago), sea levels have remained almost stable over the last 2–3 millennia [3,4]. However, with the beginning of the industrial age (late 18th to early 19th century), global sea level rise has accelerated [5,6,7,8,9], triggered by abrupt changes in temperature, ice cover, precipitation, etc., rather than being part of a natural cycle. Furthermore, if considering possible greenhouse gas concentration scenarios, by the end of the 21st century, global mean sea levels may rise in the range of 43 cm to 84 cm [10].
Regional sea level changes deviate substantially from that of the global mean, and some regions even reveal a condition opposite that of the global trend [11]. In this case, in addition to the global sea level change and its causes, it is essential to understand the regional variability in rates of this change (i.e., its evolution with time and space and its drivers) in order to assess the potential impacts of sea level rise in coastal areas [12]. General forcing for regional (or local) sea level patterns can be basically linked to (1) surface warming and cooling of the ocean, (2) exchange of freshwater with the atmosphere and land through evaporation, precipitation, and runoff, and (3) changes in the surface wind stress [11]. The complex response of the ocean to these forcing mechanisms causes changes in ocean circulation (hence density) and mass transport.
Sea level rise poses a significant threat to areas with low topography such as coasts, islands, and deltas. From the past to present, coastal regions have always attracted high interest in terms of their social and economic impacts [13]. Increasing human migration to these regions has made the possible consequences of sea level rise even more important. Flooding, inundation, storm, erosion, habitat loss, ecosystem damage, and contamination of underground water are the most damaging/catastrophic effects of sea level rise in coastal areas. The importance of these effects depends on the character of the coastal environment. Nevertheless, it is clear that some of them can threaten human life and coastal installations [10,14,15,16,17]. Eventually, in the near-future, rising sea levels and potentially more intense storms will exacerbate possible consequences, and more frequent extreme sea level events will occur. Therefore, effective management and sustainable use of coastal areas need multidisciplinary studies about the reasons and effects of sea level rise.
Tide gauges are one of the oldest instruments for measuring sea level changes [8]. A tide gauge measures the sea level relative to a fixed point on land, and therefore vertical movement of the point affects sea level measurements. It is necessary to perform geodetic measurements to determine sea level changes, independent of land movements at tide gauge stations. Ideally, Global Navigation Satellite System (GNSS) equipment is attached directly to the tide gauge or located nearby [18]. In addition to this, a network consisting of tide gauge stations that are referenced to the same datum and have a good distribution is needed to monitor long-term sea level changes. With the development of satellite systems, satellite altimetric techniques have been used for sea level measurements. Since 1993, the modern satellite altimetry record has provided accurate measurements of sea surface height with near-global coverage within latitudes of about 60° N and S. This technique is based on high precision measurement of the distance between the satellite and sea surface. Sea surface height is achieved by combining this information with precise satellite positional data [19].
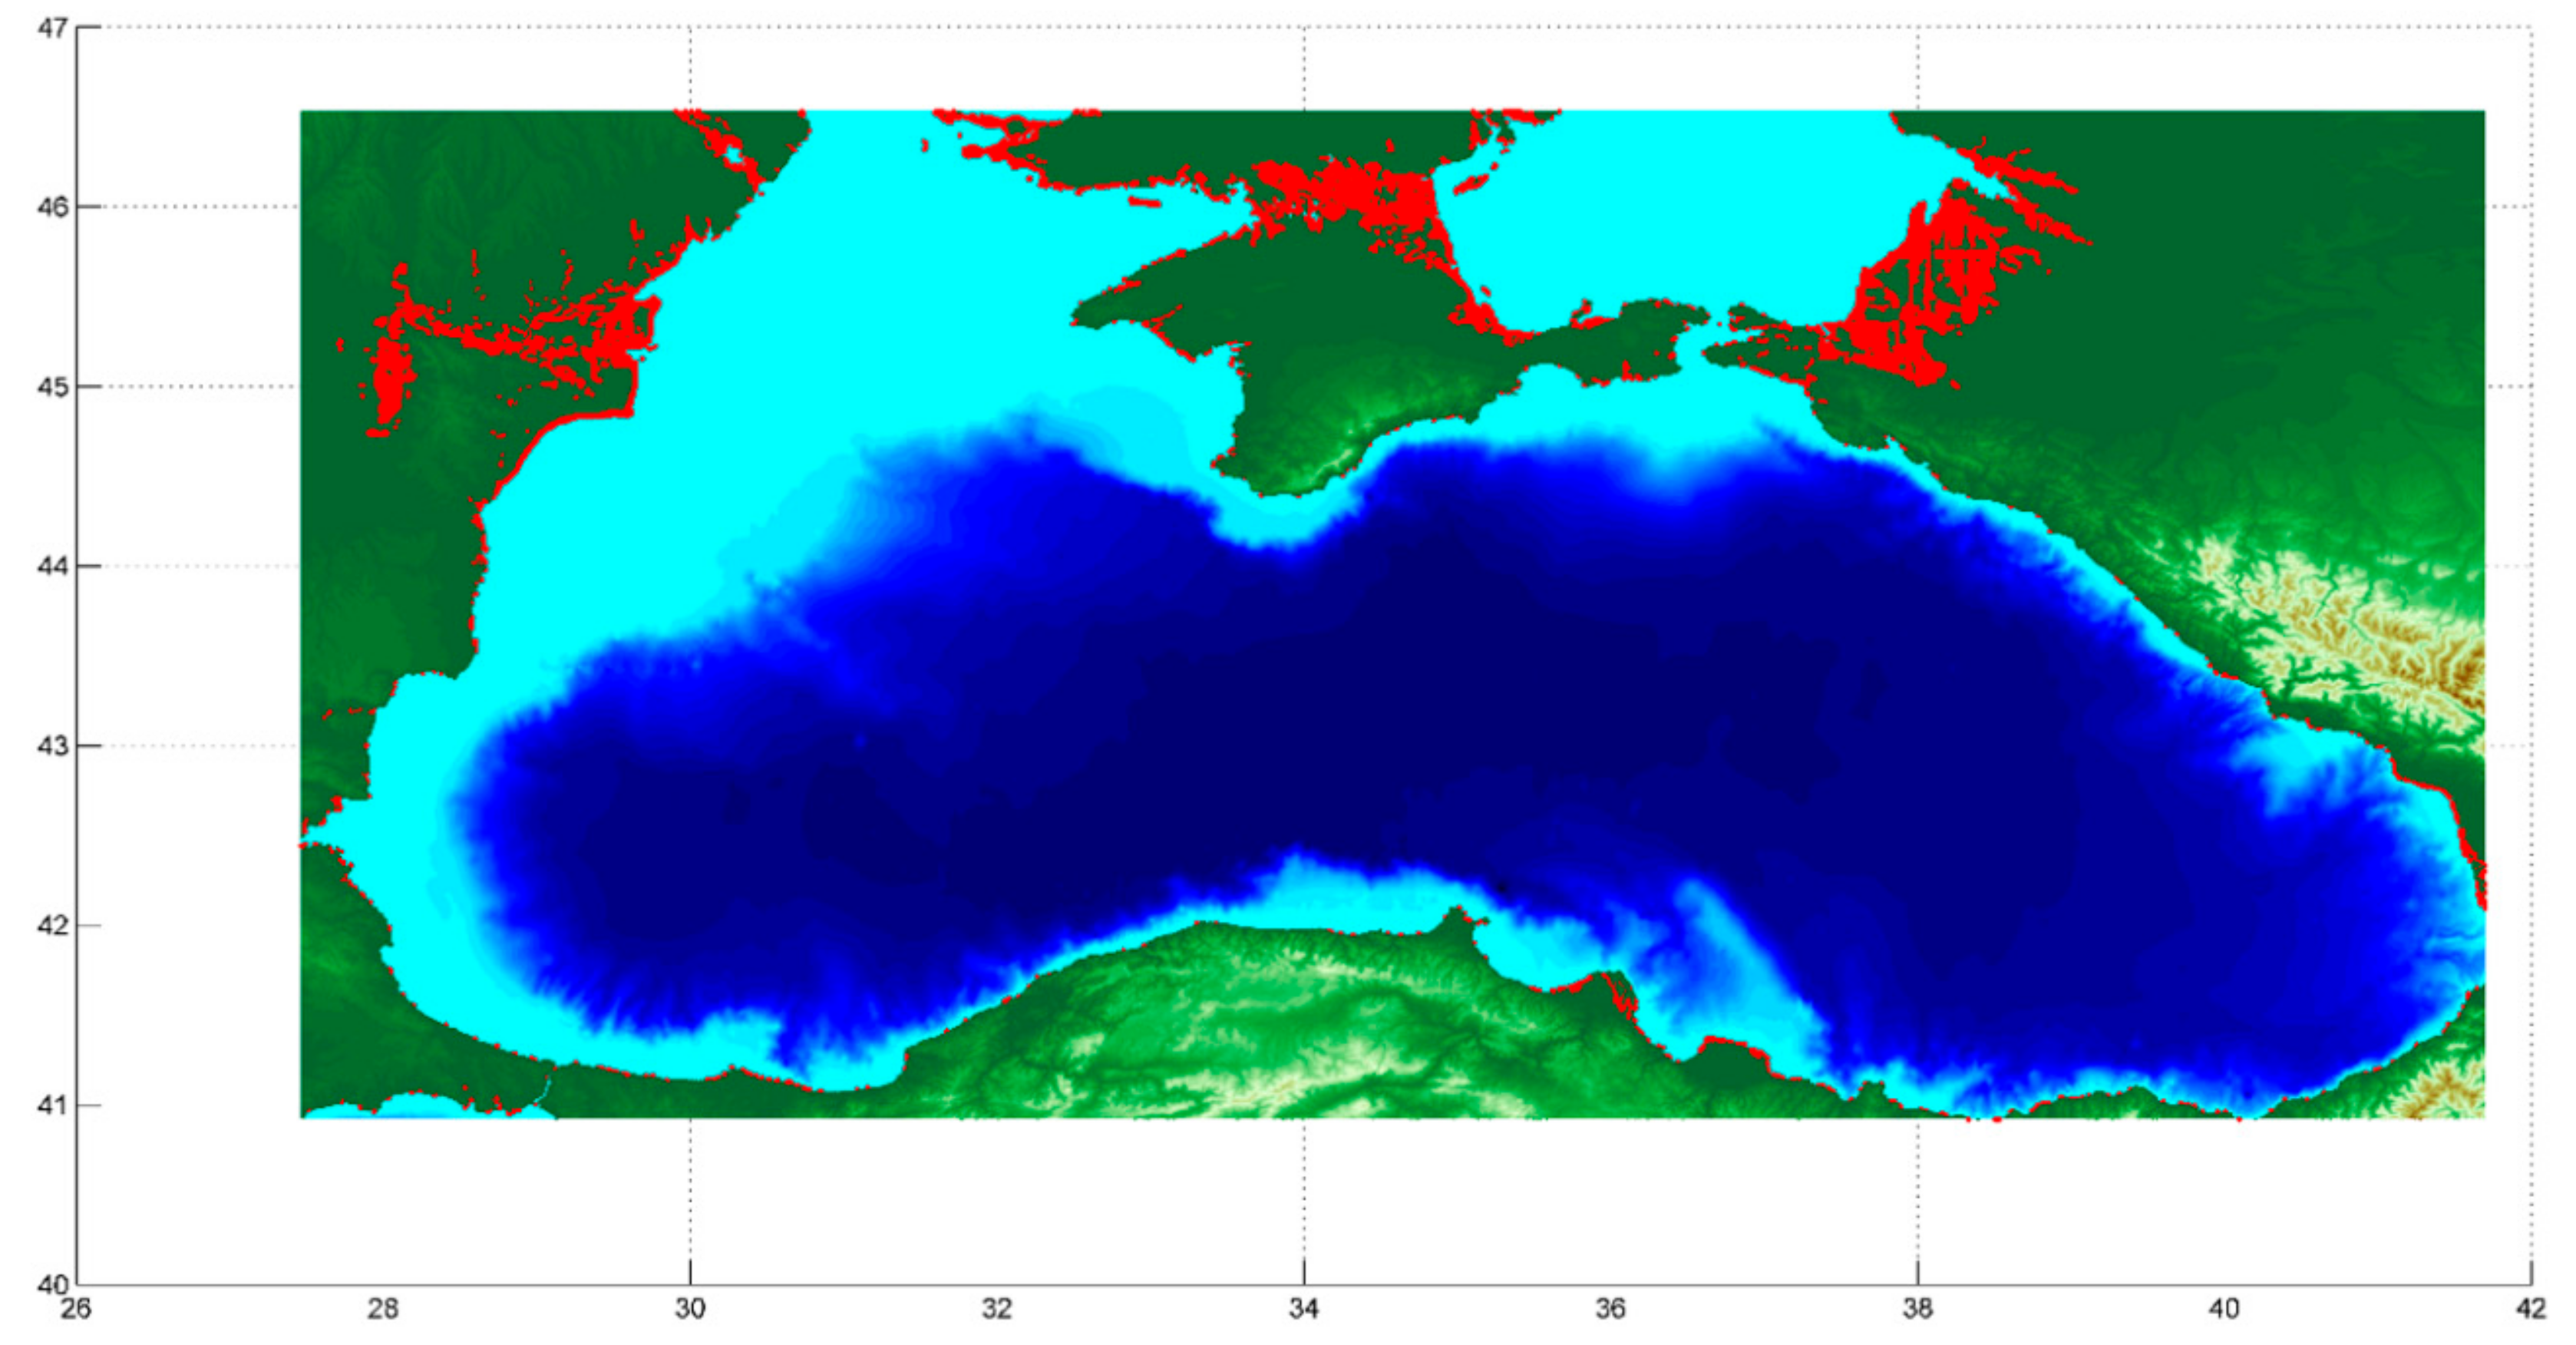
The Black Sea in southeastern Europe (Figure 1), which is semi-enclosed, has different characteristics from other seas. It is an isolated deep body of water (average depth ~1200 m) with a restricted saltwater exchange with the Mediterranean Sea through the Turkish Straits System (the Bosporus Strait–the Sea of Marmara–the Dardanelles Strait). Unlike the Mediterranean Sea (a concentration basin), the Black Sea is an estuarine basin fed by major European rivers [20]. Additionally, another feature supported by these conditions is that the Black Sea has a specific density stratification separated by a permanent halocline [21]. Due to its geographical location, the Black Sea has been of immense strategic importance over the centuries. Its coasts have favorable natural conditions in terms of ecosystem, warm climate, fertile soils, etc., so from antiquity to the present, it has been a desirable region for human habitation [22]. Consequently, the Black Sea and its coastal zone are very sensitive to climate change and anthropogenic forcing, and thus is an area that has attracted the considerable interest of scientists.
Coastal erosion and saltwater intrusion are major threats for the Black Sea coasts [24,25,26,27]. It is known that an important part of the most critical coastal erosion areas in Europe is the Black Sea coastline [28], and in particular, some coastal zones such as those in Bulgaria, Romania, and Turkey have far less protection than in other places.
Both tide gauge and altimetry observations show that sea level trends in the Black Sea vary over time. However, from the beginning of available tide gauge observations in the Black Sea, that is from the 1860s to the first decade of the 21st century, on average, an increase in sea level has been generally observed, with alternating periods of rise and fall. The Black Sea level has increased by 20 cm in the last 100 years [29]. A rise in the mean sea level of 1.83 ± 0.7 mm/year from the mid-1920s to about 1985 was mentioned in [30,31]. Forty-seven tide gauge observations, which were collected along the Black Sea coast except for the Anatolian coast before the year 1985, were evaluated by Boguslavsky et al. [32]. Considering the effects of continental discharge, atmospheric pressure, and density distribution, they asserted that the Black Sea mean level rate was 1.6 mm per year during the observational period. A rate of 2.2 mm/year from 1960 to the early 1990s was also determined by Tsimplis and Baker [33]. A rate of increase in the Black Sea level of 27.3 ± 2.5 mm/year for a period of six years (1993–1998), determined from satellite altimetry and tide gauge data, was estimated in [34]. Sea level change in the Black Sea obtained from along-track altimetry data indicated that sea level rose at a rate of 13.4 ± 0.11 mm/year over 1993–2008; in the western and eastern regions, this rate became 14.2 ± 0.16 and 12.8 ± 0.12 mm/year, respectively [30]. In the same study, the in situ and satellite results were compared and correlation coefficients ranging 0.4 to 0.7 were calculated between the tide gauge and altimeter measurements. Minimum values were obtained for tide gauges at the western and eastern coasts, whereas maximum ones were at the northern and southern coasts. The altimeter-derived Black Sea levels and corresponding independent in situ measurements have also been compared in other studies. Reasonable correlations between the data from tide gauges and the matching TOPEX/Poseidon along-track passes in the period 1992–1996 were found by Stanev et al. [35], which were 0.76, 0.68, 0.65, and 0.51 at the Tuapse, Bourgas, Varna, and Nesebar Stations, respectively. From the comparison of data over 1992–1998, the following correlation coefficients were achieved by Goryachkin and Ivanov [31], as referred to in Ginzburg et al. [30]: 0.93 for Sevastopol, 0.92 for Yalta, and 0.77 for Tuapse. High correlation coefficients varying from 0.66 to 0.89 at the tide gauge stations along the Black Sea coast (except for Batumi) have also been reported for the changing periods during 1993–2014 using gridded altimetry data [36].
Regarding coastal sea level changes, the highest change was recorded at the Poti tide gauge station (8.2 mm/year) along the Black Sea coast, whereas the lowest change was recorded at Kerci tide gauge station (1.3 mm/year) between 1860 and 1990 [37]. While at the Varna, Constantza, Sulina, Odessa, and Sevastopol Stations, the rates of sea level rise were 3.3, 2.7, 3.7, 7.1, and 3.0 mm/year, respectively; the mean subsidence rates were about 5.2, 1.1, and 6.5 mm/year at Odessa, Sevastopol and Poti, respectively. At Samsun Station, the sea level fell at a rate of −6.9 mm/year from 1963 to 1977. In order for a comparison with tide gauge records, the altimetry time series at the closest grid points to the tide gauge locations along the Black Sea coast were analyzed over the common data periods by Avsar et al. [38]. For stations with long-term records such as Poti and Tuapse, the rates of sea level changes from the satellite altimetry and tide gauges showed good agreement, and by considering the vertical land motion, the results were greatly improved. Kubryakov and Stanichnyi [39] asserted that due to the cyclonic rim current intensification for the period of 1992–2005, the sea level was rising 1.5–2 times faster in areas close to the shore than in the offshore (8–9 mm/year versus 4.5–6 mm/year). The spatial distribution of the Black Sea level trends over 1993–2014 showed that rates of sea level change during this period varied from 0.2 to 5.0 mm/year [40,41]. The southeastern region indicated a faster rise than in the other parts. Kubryakov et al. [41] pointed out that the spatial differences observed in the sea level rise were again related to basin dynamics on account of the intensification of cyclonic wind curl (3.2–4 mm/year in the coastal areas versus 1.5–2.5 mm/year in the offshore area).
In order to estimate and model regional sea level change accurately, it is important to detect sea level forcing mechanisms. According to Volkov and Landerer [42], the forcing of sea level in the Black Sea is dominated by the basin’s freshwater budget (river + precipitation inputs > evaporation output) and water exchange through the Bosporus Strait as well as depth-integrated changes in seawater density. This means that changes in the water balance are the main factors for sea level variability in the Black Sea. First, it requires an investigation of long-term total sea level change in the Black Sea. This study presents an analysis of sea level changes in the Black Sea using satellite and in situ data. It aims to provide a reliable estimate of the present-day sea level rise using the data from tide gauge stations along the Black Sea coast and satellite altimetry. This study including information on absolute sea level change obtained from satellite data in the Black Sea, contributes to the relative sea level estimates by Avsar and Kutoglu [43]. Sea level observations from satellite altimetry as well as tide gauge stations have been used to infer trends in changes in Black Sea levels and their periodicity. In addition, in order to determine vertical land motion along the Black Sea coast, the data of six continuous GNSS stations, which are nearly co-located with the available tide gauge locations, were used in this study. Thus, the contribution of land motion to the coastal sea level change was also investigated.
2. Methodology and Data
2.1. Method: Harmonic Analysis
In the study, first, outlier detection was performed using the 3σ-rule. Then, monthly averaged time series of the sea level observations were obtained to provide concurrent analysis. The harmonic analysis method is preferred for sea level time series analysis, as suggested in Avsar et al. [38] and Feng et al. [44]. Harmonic analysis describes periodically recurrent phenomena and allows for the analysis of sinusoidal variation with time. Sea level changes have a periodic character. In this context, sea level time series exhibit a strong seasonality as well as a linear trend [45]. Accordingly, the seasonal variation of sea level time series can be determined by harmonic analysis, which is expressed as the sum of a number of sine and cosine terms. Simple linear regression can be used to determine the long-term trend in the sea level time series. So, a model including seasonal components (annual and semi-annual harmonics) and linear trend was used in this study [44]:
where M(t) is the sea level time series; t is the time; t0 is the beginning time (for example for altimetry: 1 January 1993); M(t0) is the mean sea level at t0; v is the rate of sea level change (linear trend); k = 1 is the annual signal; k = 2 is the semi-annual signal; A is the amplitude; ω is the angular frequency; φ is the phase; and ε(t) is the unmodelled residual term. Here, in order to estimate trend, phase, and amplitude, the least squares method was employed [46]. In order to determine the vertical velocities of the GNSS stations in this study, the same approaches as for the sea level changes were used.
2.2. Satellite Altimetry Observations in the Black Sea
Satellite altimetry measurements have improved our understanding of how sea levels are changing regionally [47]. The Data Unification and Altimeter Combination System (DUACS) is one of the processing systems used to produce altimetry sea level products. Here, along-track (L3) and gridded (L4) sea level products are processed over different regions and in near real time (NRT) and delayed time (DT) conditions [48]. These products were previously distributed by the French Archiving, Validation and Interpretation of Satellite Oceanographic Data (AVISO) [49], and are now produced and distributed as part of the Copernicus Marine Environment Monitoring Service (CMEMS) [50]. In this study, multi-mission (gridded) satellite altimetry data were used to investigate mean sea level change throughout the Black Sea. These grid data provide more acceptable sampling achieved by pooling measurements in a given range of latitudes and longitudes in comparison to the along-track data [51]. Additionally, the merged datasets enable high resolution sea surface height measurements [49].
The altimetry dataset in this study was daily sea surface heights from 1 January 1993 to 15 May 2017 for the Black Sea, provided by the CMEMS. These data in delayed-time are gridded (1/8° by 1/8°) sea level anomalies (SLA)s computed with respect to a twenty-year 2012 mean. SLAs have been estimated by optimal interpolation, merging the measurements from different altimeter missions: Jason-3, Sentinel-3A, HY-2A, Saral/AltiKa, Cryosat-2, Jason-2, Jason-1, TOPEX/Poseidon, ENVISAT, GFO, and ERS1/2. Necessary geophysical (solid earth, ocean and pole tides, ocean tide loading effect, sea state bias, and inverse barometer response of the ocean) and atmospheric (ionosphere, and dry/wet troposphere effects) corrections have been applied to the dataset by the data center [48]. Further information on the data can be found in Copernicus [50].
The Black Sea area comprises 3249 altimetric grid points in total. For the evaluation, at each grid point, monthly averages were computed from the daily altimetry data, and then the monthly mean sea level changes over the entire Black Sea were obtained by averaging spatially. Figure 2 shows the evolution over time of the Black Sea level based on the monthly averages from January 1993 to May 2017.
2.3. Tide Gauge Records along the Black Sea Coast
While satellite altimetry data have been available since early 1993, the availability of long-term data at many tide gauge stations is still one of the most important reasons for using these stations in sea level measurements. The Permanent Service for Mean Sea Level (PSMSL) [52] is a global data center that is responsible for the collection, publication, analysis, and interpretation of sea level data from global tide gauge station networks like the Global Sea Level Observing System (GLOSS) Core Network [53]. Sea level monitoring in Turkey is carried out by the General Directorate of Mapping (GDM) within the Turkish National Sea Level Monitoring System (TUDES) [54] stations that are in accordance with the GLOSS standards. Nevertheless, note that the amount of obtainable data from the tide gauge stations is limited. The poor spatial distribution of tide gauge stations along the coasts is a common problem for some areas including the Black Sea. Tide gauge stations have different data quality and length of records and inhomogeneous geographical distribution, and most of the data records suffer from gaps due to reasons such as equipment failure, power failure, etc., at the stations.
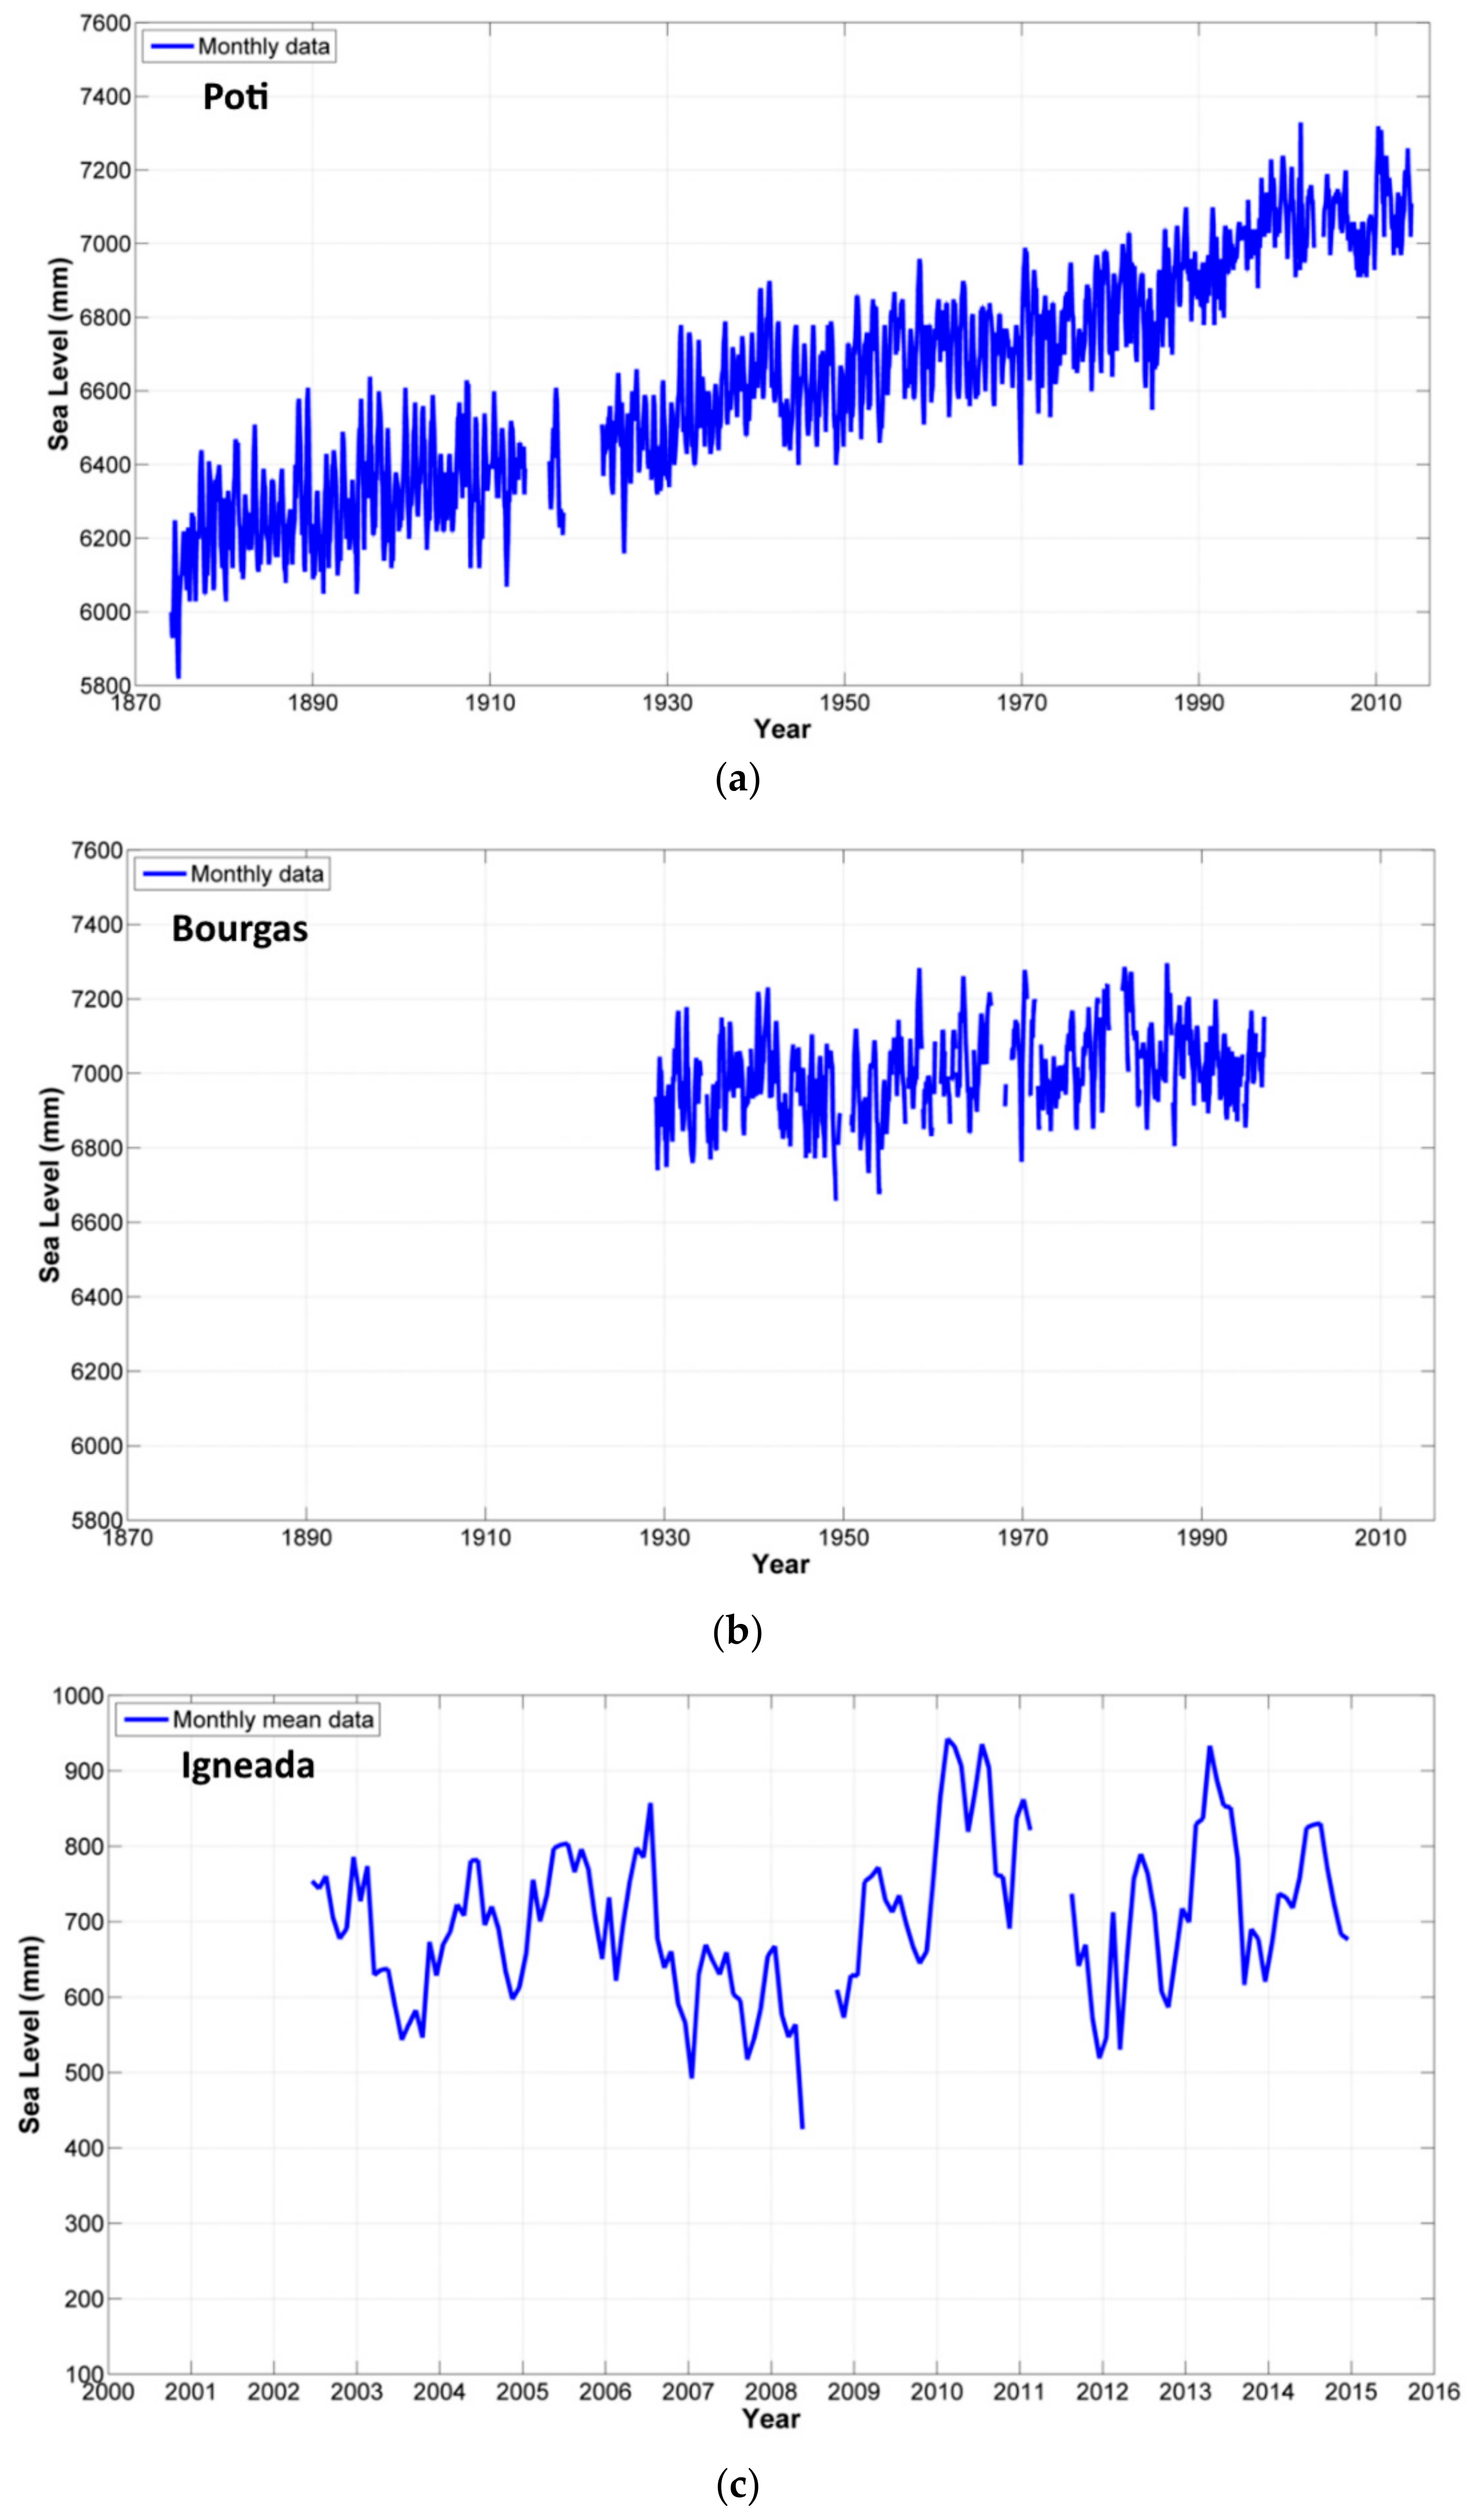
In this study, data from 12 tide gauge stations (having different data length) on the Black Sea coast were used. Seven tide gauge stations (Poti, Batumi, Sevastopol, Tuapse, Varna, Bourgas, and Constantza) were chosen from the PSMSL and another five (Amasra, Igneada, Trabzon, Sinop, and Sile) were from the TUDES network. Figure 3 shows the locations of all the stations in this study, and an overview of the tide gauges is given in Table 1. The Revised Local Reference (RLR) (a common datum performed by the PSMSL for each tide gauge station is approximately 7000 mm below mean sea level to avoid negative numbers in a sea level time series) data from the PSMSL are the monthly averaged time series, spanning from 65 to 140 years in the period of 1874–2013. The TUDES data are released every 15 min in the Turkish National Vertical Control Network-1999 (TUDKA-99) datum. The TUDKA-99 datum was defined based on the International Terrestrial Reference Frame-1996 (ITRF96). In the study, the monthly averaged time series of the TUDES data were derived at each station. The record with the longest time period among these stations extends to mid-2001 at Amasra. The sea level time series from some tide gauge stations have observation gaps, for example, nearly 13.4% of the records at Batumi and nearly 13.7% of those at Bourgas are void (see Table 1). Figure 4a–c show the sea level time series at the Poti, Bourgas, and Igneada tide gauges, respectively.
3. Sea Level Changes in the Black Sea
In order to minimize the impact of low-frequency variability, records longer than 50 years should be used for long-term sea level trend estimates [8]. However, as mentioned before, although tide gauges have a good record length, they have poor spatial distribution, and only measure changes in sea level relative to the land to which they are attached. Conversely, although satellite altimetry has a short time period, it enables basin-averaged sea level change to be determined. Sea level data in the Black Sea (especially for TUDES tide gauge stations) are mostly short-term, but nevertheless the time series indicate trends and seasonal fluctuations.
3.1. Long-Term Trend and Seasonal Variation from Satellite Altimetry Observations
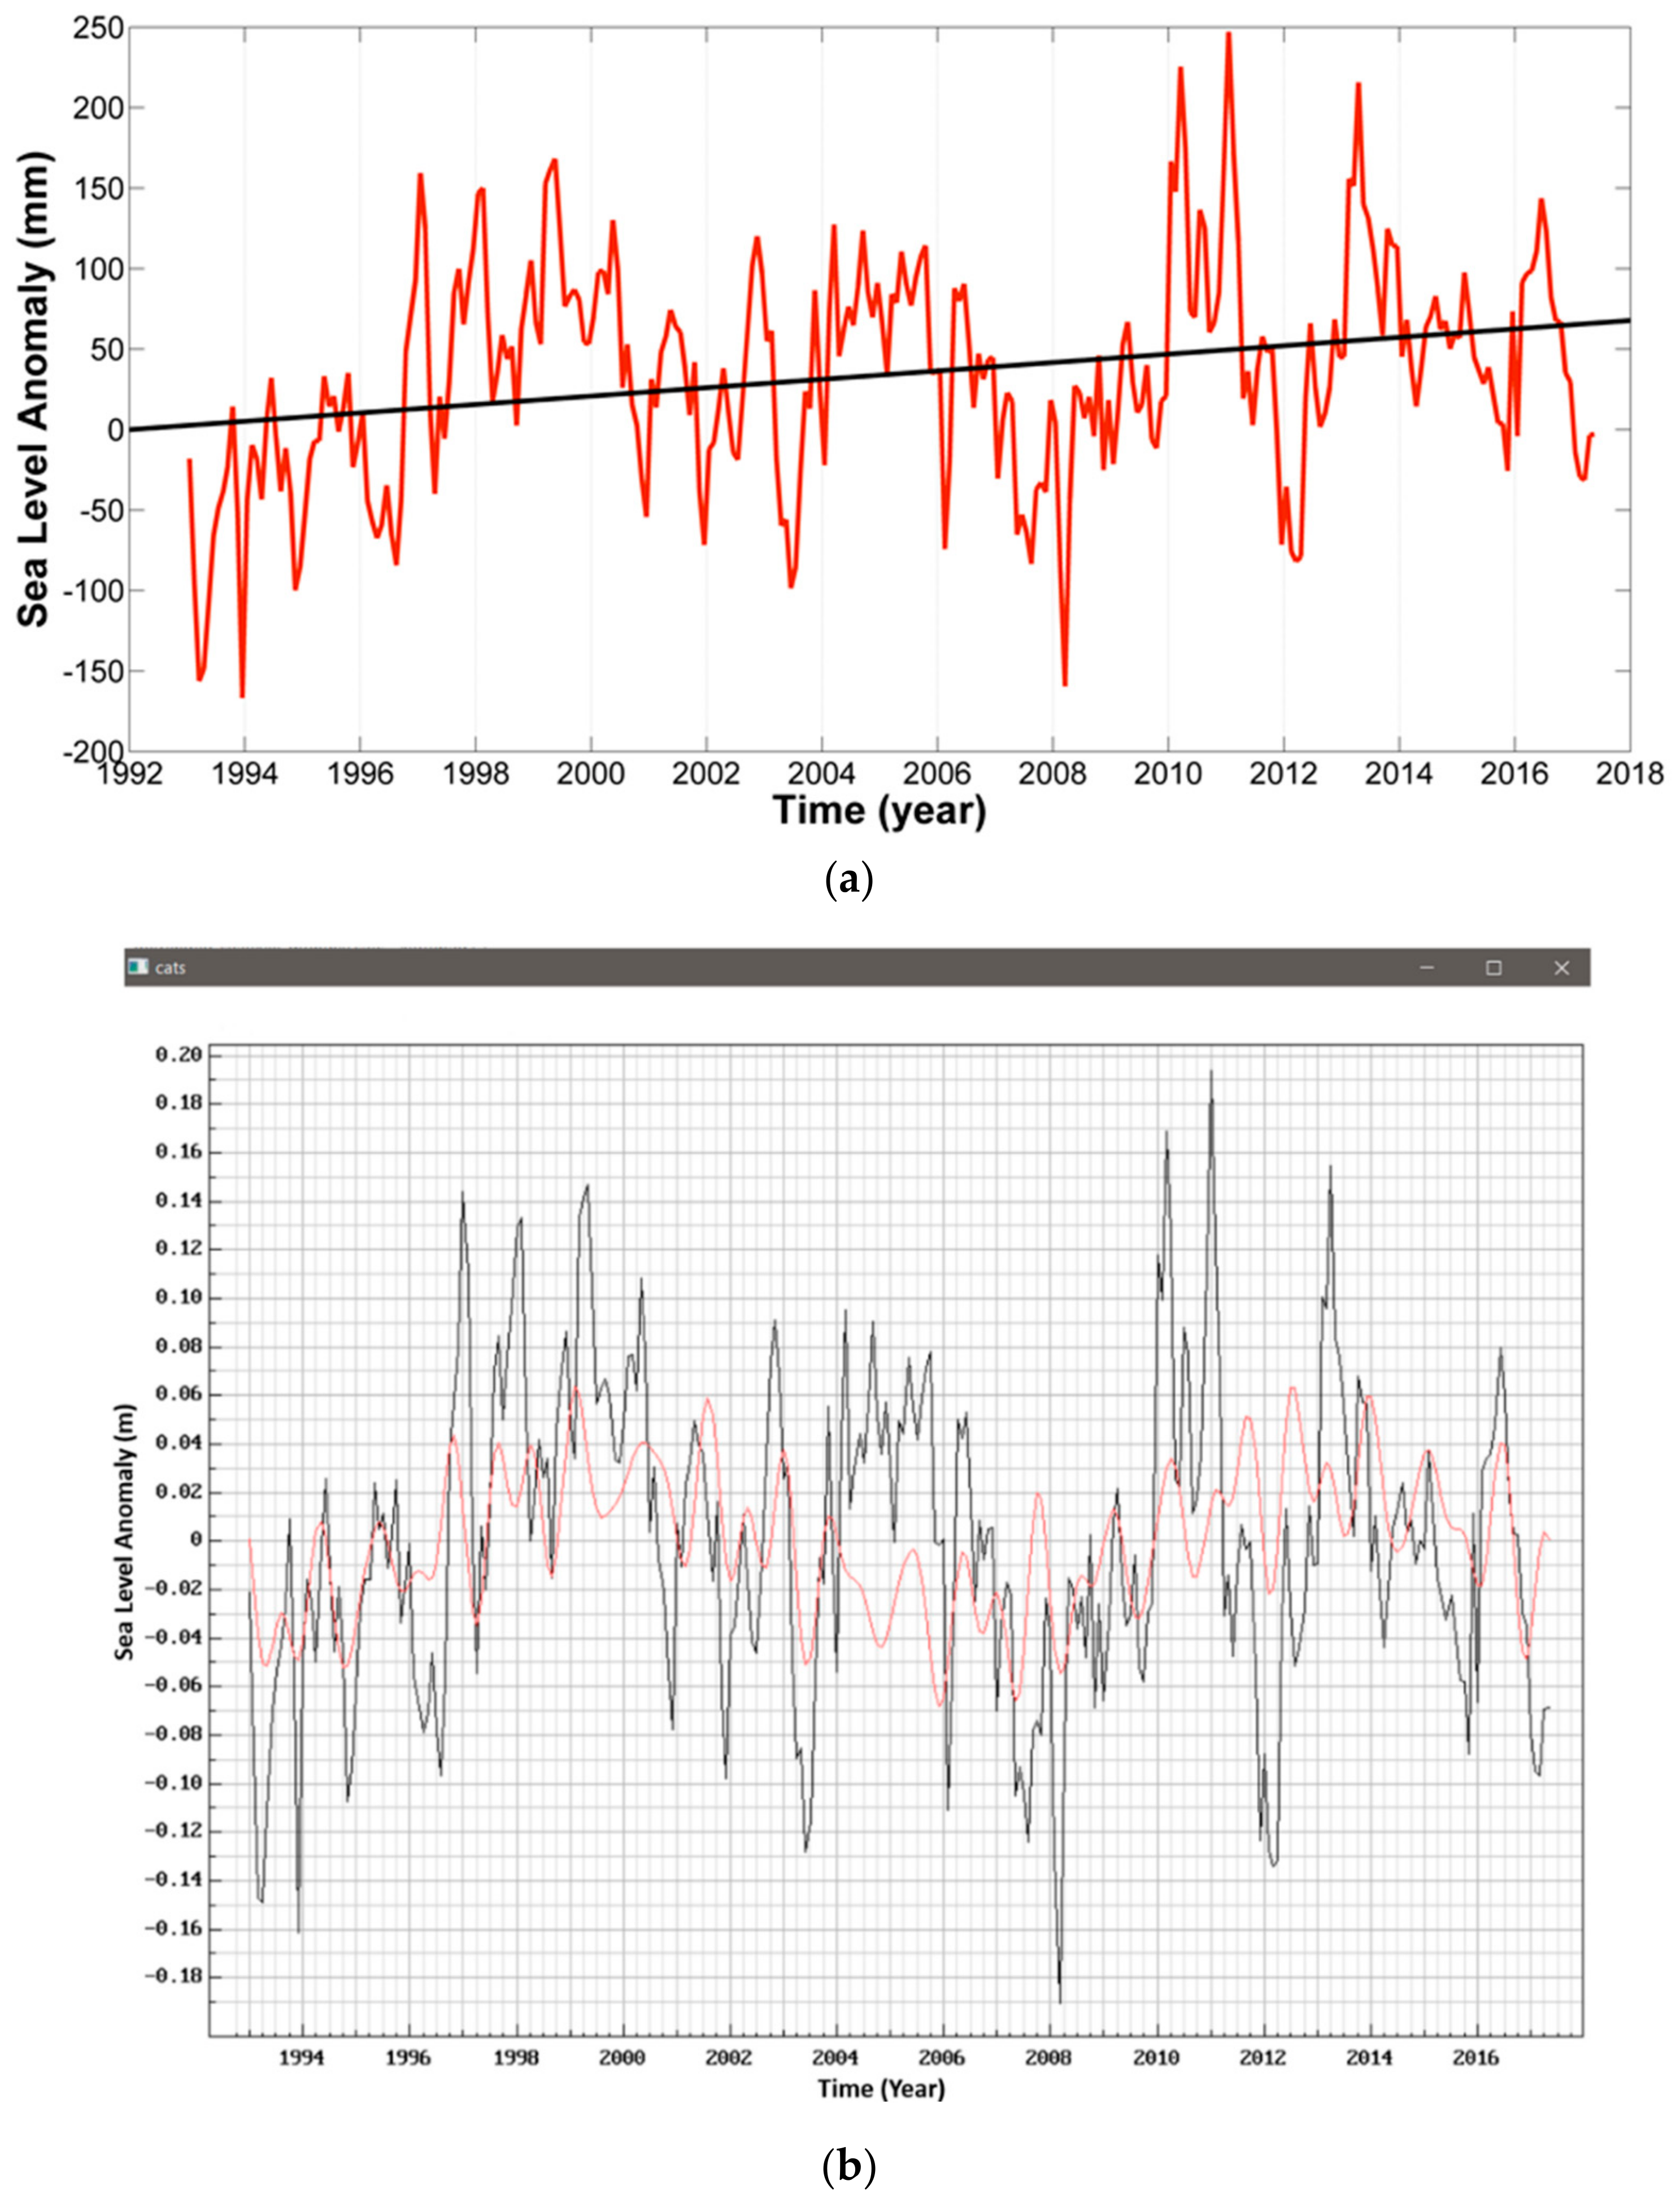
The linear trend and seasonal components (annual plus semi-annual) of sea level variability in the basin average in the Black Sea were obtained through a least-squares fit of Equation (1). Here, in order to examine the long-term variability of the time series, the seasonal components were removed from the monthly values by simple subtraction of the estimates obtained by least squared fitting of seasonal sinusoids with annual and semi-annual periods (Figure 5a). The results show that the sea level in the Black Sea has risen at a rate of about 2.5 ± 0.5 mm/year between January 1993 and May 2017. In addition, the other dominant periodic behaviors (after removing seasonal cycles) in the altimetry time series were determined using Cycles Analysis & Timeseries Software (CATS) v1.0 [57]. Figure 5b demonstrates the dominant cycles over the Black Sea level time series from January 1993 to May 2017. As seen in the figure, the period of January 1993–December 2014 indicates a more apparent trend for this sea level time series. An average trend of 3.2 ± 0.6 mm/year over the Black Sea was determined for the period 1993–2014.
The satellite altimetry observations from 1993 to 2014 yielded a standard deviation of 7.5 cm for sea level anomalies in the Black Sea. The mean sea level anomaly in 2010 was about 20 cm above the 1993 average. This was the highest annual average in the satellite record from 1993 to the present, with the record high sea level anomalies occurring in March 2010, January 2011, and April 2013. Moreover, satellite altimetry data show there have been some strong fluctuations of sea level in the Black Sea; the difference between the mean sea level anomalies from December 2009 to January 2010 was about 15 cm.
For the seasonal components of the sea level variations in the Black Sea, the average annual and semi-annual amplitudes were detected as 38.02 ± 6.01 mm and 23.74 ± 6.01 mm, respectively, from the satellite altimetry. The average annual and semi-annual phases were 147.38 ± 0.17° (~4.9th month) and 338.04 ± 0.26° (~11.3rd month), respectively. Accordingly, the annual cycle of the sea level variations measured by the altimetry attained its maximum value in about May. Many studies have reported that the mean sea level reaches the highest levels in May–June in the Black Sea [37,58,59,60]. Our results confirm this condition.
3.2. Coastal Sea Level Changes from Tide Gauge Records
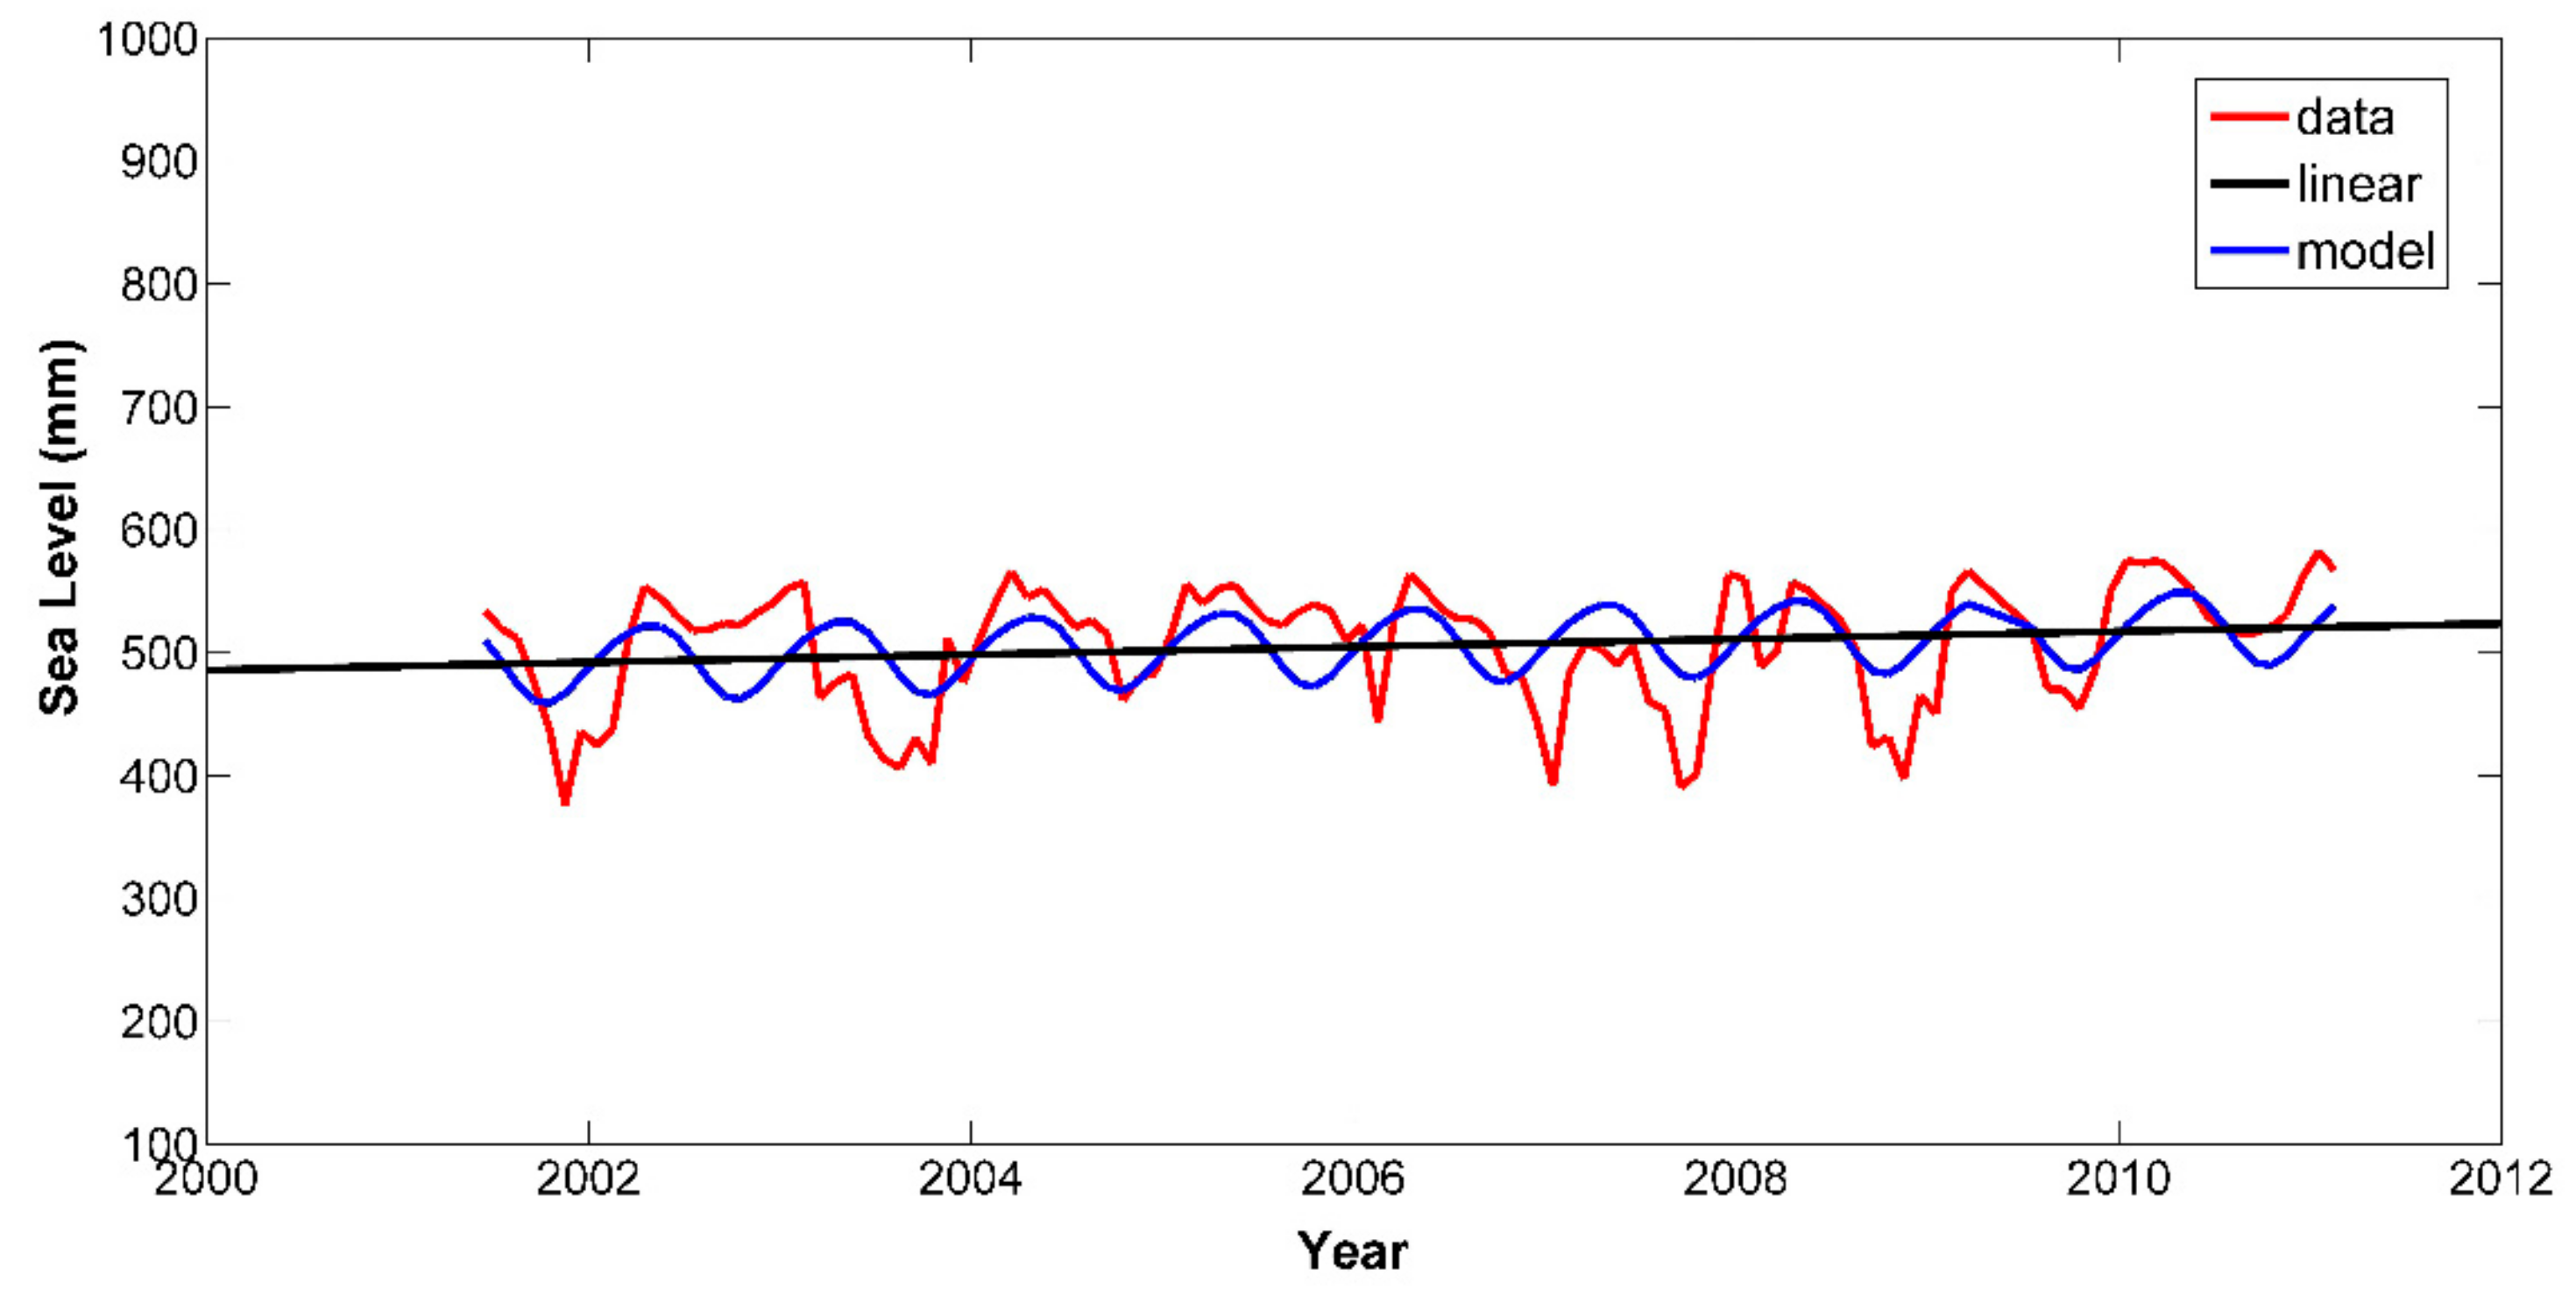
In the evaluation, the data gaps were excluded, and the data periods of the tide gauges were rearranged (see Table 2). However, data with less than four consecutive missing months were used through linear interpolating. Eventually, Equation (1) was used in the analysis of the sea level time series from the tide gauge stations. As an example, the trend and harmonic model of the Amasra tide gauge station are shown in Figure 6.
After removing seasonal variations, the trend of each tide gauge station along the Black Sea coast was derived from the varying record lengths considering the data gaps. The linear variation with time and seasonal components of the observed sea level in the tide gauge stations are given in Table 2. Accordingly, the results show that the rates of the sea level change vary from coast to coast. Consequently, nearly all the tide gauge stations (except for Bourgas) indicated rising sea levels. The greatest rise along the Black Sea coast was recorded in Poti (7.01 mm/year), and the lowest ones in Varna (1.53 mm/year) and Sevastopol (1.56 mm/year). The distribution of the data gaps in the Bourgas sea level time series (see Figure 4b) did not allow a reliable trend to estimate for this station, despite the interpolation. In addition, Sinop Station showed no significant sea level change. The non-significant results may be related to the short records, since trend estimations are sensitive to the length of the record. It would be unsafe to detect long-term trends from the short datasets [37].
As shown in Table 2, the semi-annual amplitudes of coastal sea changes were about 2–3 times smaller than the annual amplitudes. Seasonal (annual and semi-annual) sea level change signals generally reach their maximum values in May–June. However, the maximum annual amplitude of the sea level change at Amasra occurs in April, nearly one month earlier than those of the other stations.
In many studies, the results showed that tide gauge records along the Black Sea coast were in reasonable agreement with the satellite altimeter observations [30,31,35,36]. Nevertheless, in order to detect absolute sea level changes in the tide gauge locations, the vertical land motions obtained from GNSS measurements should be separated from sea level records [18,36,38]. In this study, unfortunately, the data periods of the GNSS time series did not exactly coincide with those of the tide gauges (see Table 3). However, the GNSS-derived estimates can give information on the recent land motions along the Black Sea coast. Here, the vertical coordinate time series from the nearby GNSS stations were analyzed using Equation (1), and thus the vertical velocities of these six GNSS stations were estimated. Accordingly, for the Tuapse, Varna, Bourgas, Trabzon, Sinop, and Sile tide gauge locations, the GNSS-derived vertical land motions are presented in Table 3, along with the distances between the tide gauge and related GNSS stations. The results in Table 3 show land subsidence motions at the Tuapse, Varna, Trabzon, and Sile locations. On the other hand, land uplift motions were seen at the Bourgas and Sinop locations. Especially for Sile, the high relative sea level rise may result from the land subsidence.
4. Discussion
In the Black Sea, having a limited interaction with the Atlantic Ocean, there are strong temporal mass variations due to its wide drainage area covering a large part of Europe and Asia, and sea level change is closely related to its hydrological balance. The results of this study confirmed that the Black Sea level has continued to rise over the near satellite altimetry era (1993–2017). In this context, monitoring sea level change in the Black Sea is critical for determining its long-term variability and mitigating its negative impacts.
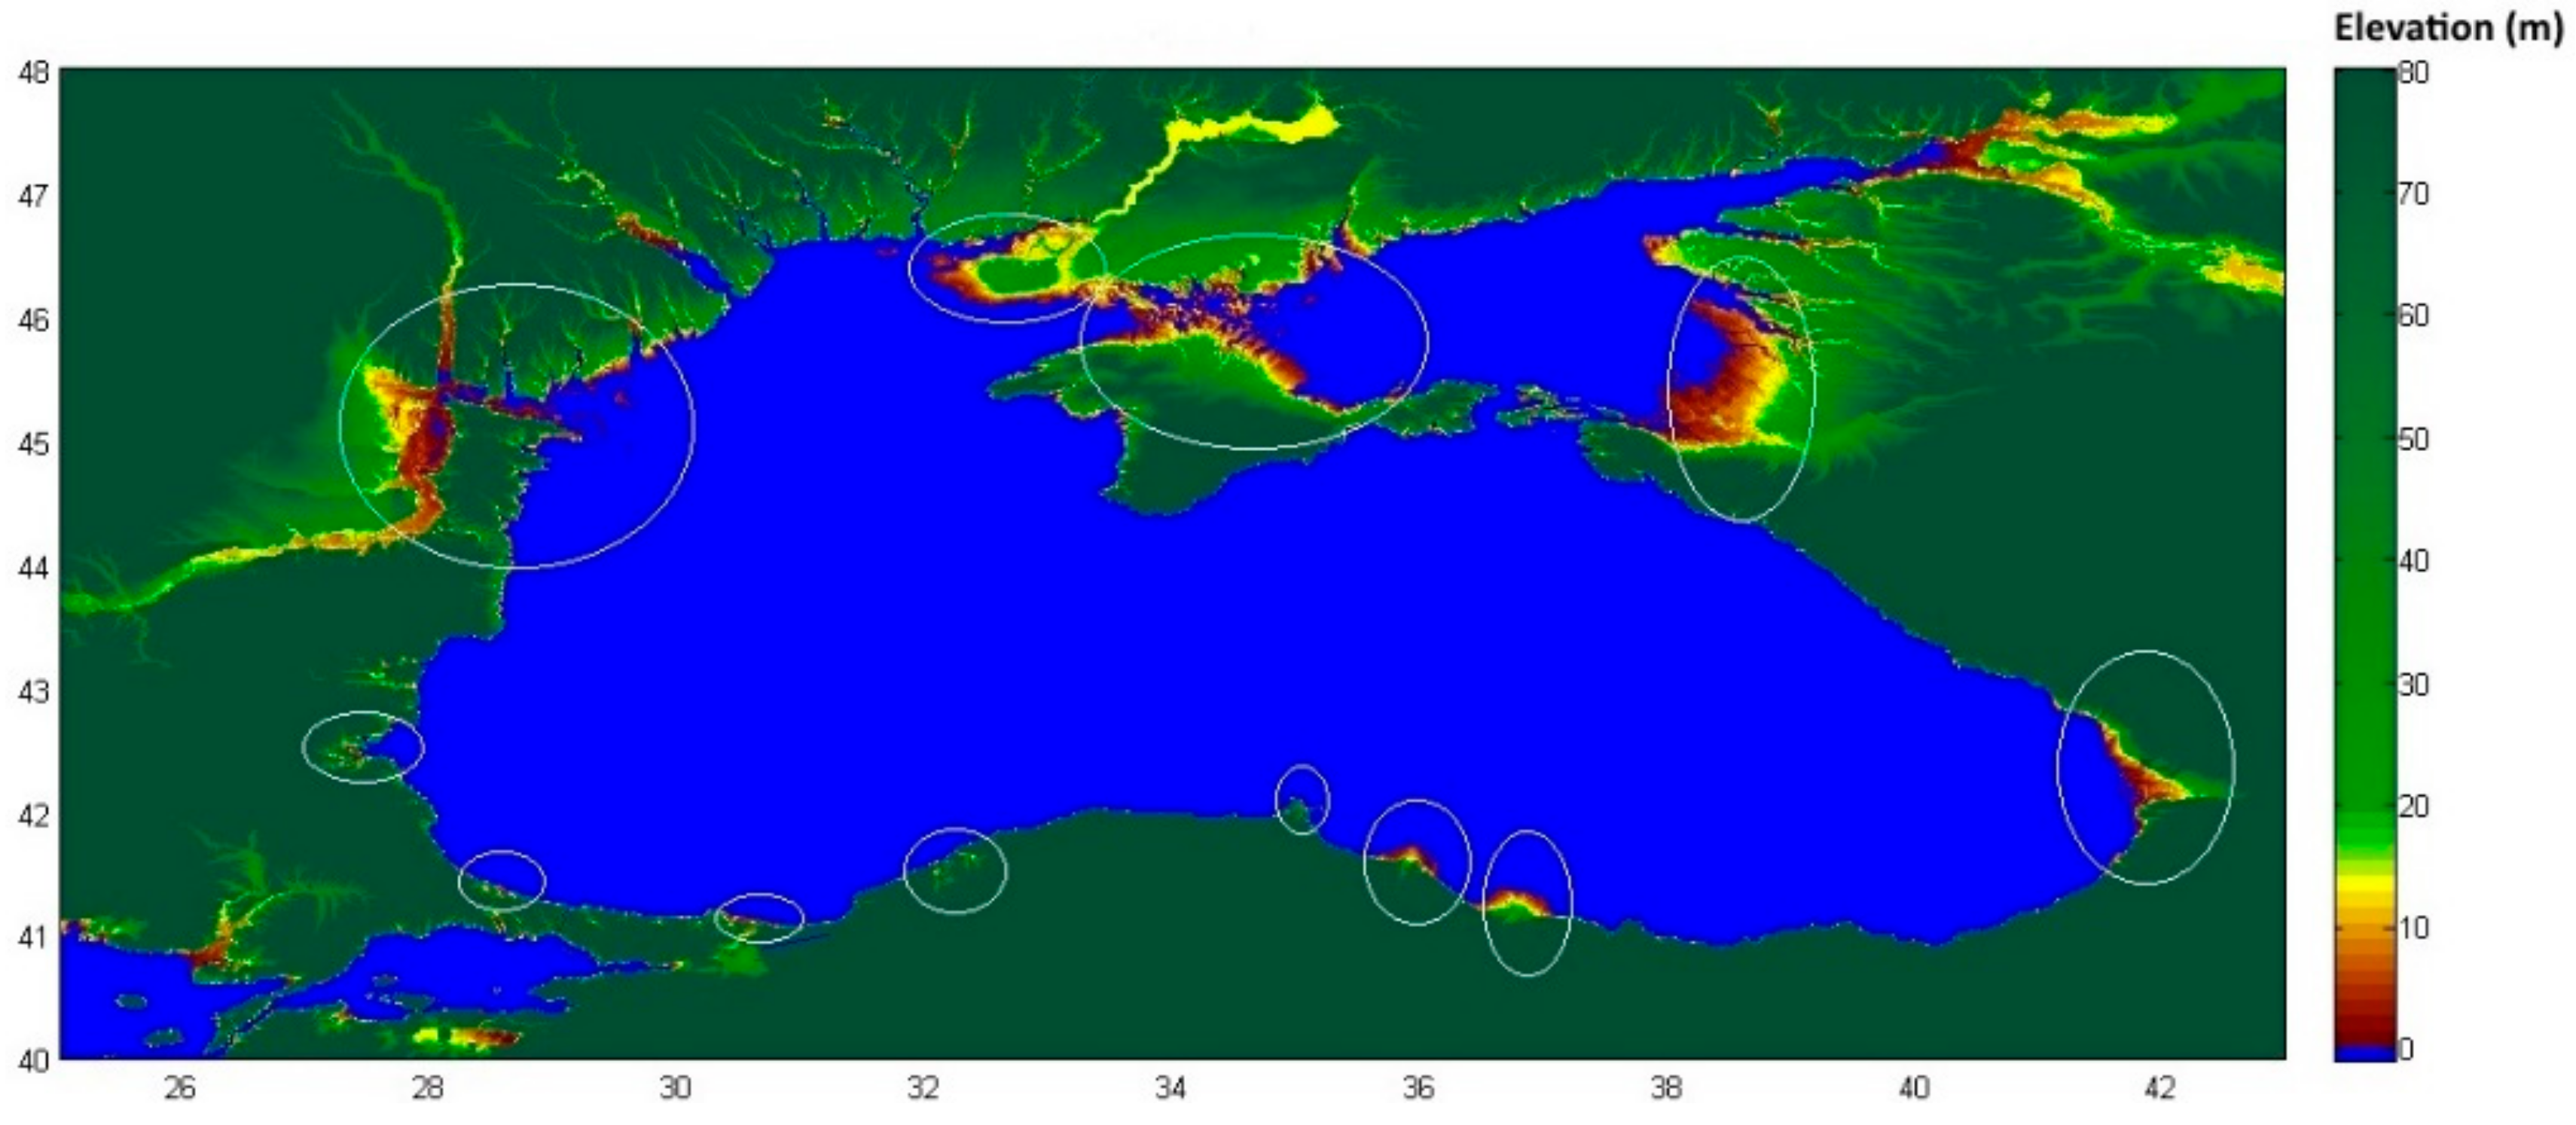
Figure 7 focuses on the spatial distributions of low-lying areas surrounding the Black Sea. Since coastal slope is the main indicator, these areas are highly vulnerable to sea level rise. In order to estimate the vulnerability of these areas, the general characteristic of the regions should be examined in terms of soil type, land use, population, income, etc.
The level of the Black Sea has been rising at a mean rate of ~2.5 mm/year from January 1993 to May 2017, although a slowdown of this rate was recorded over the last about three years. Nevertheless, in order to confirm this supposition, the dominant cycles in the Black Sea level time series should be examined spectrally. Thus, the recent rate of sea level rise can be estimated more accurately. Note that, the dominant cycles of sea level change indicate that the Black Sea rose at a rate of about 3.2 ± 0.6 mm/year until December 2014. This rate was nearly identical to the global trend, which was reported by Legeais et al. [61]; this common tendency may be attributed to global warming [30]. Here, it is appropriate to summarize the available literature on the Black Sea level changes for a rightful evaluation (Table 4). When considering the rate values in Table 4 as well as the character of sea level fluctuations in the Black Sea, the sea level generally tends to rise in the long-term. The estimated rates for the short periods were higher than the estimates for the long periods (note that a period under five years is not significant for statistics). The rate of sea level rise estimated in this study for a period of approximately 22 years was about 1.8 times greater than the rate in the preceding half a century (1920–1985), as quoted from Goryachkin and Ivanov [31]. However, the fluctuations in the Black Sea from 1993 to 2014 were not uniform: the sea level rose in general for the period of January 1993–June 1999, fell during July 1999–April 2006 (even though it slightly increased from the beginning of 2001 to about 2005), and rose again until 2014. Then, it started to fall again; throughout the 1993–2017 period mentioned in this study, the mean sea level displayed a positive trend of 2.5 ± 0.5 mm per year. According to Ginzburg et al. [30], the sea level increase from 1993 to 1999, and then decrease from 1999 to 2001 are in agreement with data on the Danube River discharge. In addition, it was mentioned in Cazenave et al. [34], Avsar et al. [62], and Vigo et al. [63] that sea level rise over 1993–1999 showed good correlation with the increase in sea surface temperature in the Black Sea over this period.
Along the coasts, complex ocean dynamics occur at shorter spatial and temporal scales. For example, tides are much more complex near the shore than in the open sea. Moreover, the high frequency variations due to atmospheric pressure and tides must be taken into account in these areas. Over shorter periods, sea levels rise faster at the coasts than offshore [65]. The main feature of sea dynamics in the Black Sea is the cyclonic rim current flowing along the continental slope, and it leads to lower sea level in the interior of the basin and higher sea level along the coast [40]. Table 5 presents an extensive review of the rates of the sea level changes at common tide gauges from different studies. Although the data periods are different, the results obtained in this study showed similar characteristics with Alpar et al. [37] and Avsar et al. [38], especially for Poti and Tuapse. At Poti Station, a high sea level trend has been generally estimated. This relative sea level rise may have resulted from subsidence at the Poti coast [30]. At Tuapse, ground subsidence may be a determinant in the sea level rise at this station [38]. While our results indicate that the rate of sea level rise during 1945–1994 slowed down at the Sevastopol tide gauge station, the trend estimates in Alpar et al. [37] and Kubryakov and Stanichnyi [39] were higher. The trend estimates in this study were calculated after removing the seasonal cycles. Thus, there was a small discrepancy in the trend estimates along the southern coast of the Black Sea compared to Avsar et al. [38].
Figure 8 depicts the coastal areas in the Black Sea, which would be under water if the sea level rises 1 m. As previously outlined, coastal erosion is also a remarkable problem along the Black Sea coastline. The observed rise rates (see Table 2) along the Black Sea coast and the basin-averaged rate (from the gridded altimetry data) of the sea level rise may be significant for the threat of coastal erosion. It has been estimated by Allenbach et al. [24] that a 50 cm rise in sea level might lead to about a 50% reduction in the Black Sea beach area. According to Goryachkin and Ivanov [31], the shore might retreat 1–2 m for a rise in the sea level by 1 cm [41].
5. Conclusions
Numerous studies have been carried out to determine the long-term variability of sea level in the Black Sea. These studies, based on altimetry and tide gauge data, have revealed that the level of the Black Sea has risen. Our study dealt with recent sea level changes in the Black Sea over a time period for which data from tide gauges and satellite altimetry are available. The mean rate of the sea level rise has been estimated as 2.5 ± 0.5 mm/year over the entire Black Sea by using the gridded satellite altimetry data covering January 1993–May 2017. During this period, it was seen that inter-annual variability of non-seasonal sea level change was quite strong (with a standard deviation of about 6.7 cm). In addition, coastal sea level changes were analyzed from 12 tide gauge stations along the Black Sea coast. However, most tide gauge data are not up to date and the spatial distribution of the stations is sparse. Nevertheless, using the available data, relative sea level changes along the Black Sea were assessed, and the results generally reflect a rise in the sea level. The highest rate of rise (7.01 ± 0.12 mm/year) was at the Poti tide gauge station. These results, combined with the vertical rates of GNSS stations, showed that at some tide gauge locations, there were significant vertical movements. This study suggests that a regional network of tide gauge stations with a suitable spatial distribution, along with co-located continuous GNSS stations along the Black Sea coastline, should be established. Continuous geodetic measurements can be used to monitor vertical land movements to estimate absolute sea level changes independent of vertical motions of the land.
The results of this study demonstrate that accurate modeling of sea level changes depending on time and location in the Black Sea, which is semi-enclosed, is crucial for risk assessments related to sea level rise, analysis of coastal change, and planning of coastal area use. Local, regional, and national patterns of potential consequences of sea level rise should be assessed, and coastal vulnerabilities should be identified in this region. The implications of sea level rise should be considered for population location, economic, infrastructure, and construction planning. This issue should be regarded as higher priority in coastal management. The related governments and local authorities should design long-term policy for coastal planning. The necessary precautions for reducing the effects of sea level rise should be implemented for all coastal areas.
Author Contributions
Conceptualization, methodology, and validation, Nevin Betül Avşar and Şenol Hakan Kutoğlu; investigation, formal analysis, writing—original draft preparation, visualization, resources, and writing—review & editing, Nevin Betül Avşar; supervision, and project administration, Şenol Hakan Kutoğlu; Both authors have read and agreed to the published version of the manuscript.
Funding
This research received no external funding.
Acknowledgments
The authors express their gratefulness to the anonymous reviewers for their valuable suggestions. The authors are also grateful to the organizations that provided the data including the Copernicus Marine Environment Monitoring Service (CMEMS), the General Directorate of Mapping (Turkey) – GDM, the Permanent Service for Mean Sea Level – PSMSL, and the Nevada Geodetic Laboratory – (NGL). The authors would like to thank Dr. Gokhan Gurbuz for his contribution in the evaluation of the GNSS data. This study was based on the first author’s PhD thesis titled as “Sea level changes in the Black Sea and its impacts on the coastal areas”.
Conflicts of Interest
The authors declare no conflicts of interest. In addition, the funders had no role in the design of the study; in the collection, analyses, or interpretation of data; in the writing of the manuscript, or in the decision to publish the results.
References
- Miller, K.; Mountain, G.S.; Wright, J.D.; Browning, J.V. A 180 million year record of sea level and ice volume variations from continental margin deep sea isotopic records. Oceanography 2011, 24, 40–53. [Google Scholar] [CrossRef]
- Clark, P.U.; Mix, A.C. Ice sheets and sea level of the last glacial maximum. Quat. Sci. Rev. 2002, 21, 1–7. [Google Scholar] [CrossRef]
- Cazenave, A. Sea Level Changes Recent Past, Present, Future. In Proceedings of the EGU General Assembly 2014 GIFT Workshop, Vienna, Austria, 27–30 April 2014; Available online: https://cdn.egu.eu/media/filer_public/2014/05/09/5_-_cazenave_anny.pdf (accessed on 27 February 2020).
- Lambeck, K.; Chappell, J. Sea level change through the last glacial cycle. Science 2001, 292, 679–686. [Google Scholar] [CrossRef] [PubMed]
- Church, J.A.; Clark, P.U.; Cazenave, A.; Gregory, J.M.; Jevrejeva, S.; Levermann, A.; Merrifield, M.A.; Milne, G.A.; Nerem, R.S.; Nunn, P.D.; et al. Sea level change. In Climate Change 2013: The Physical Science Basis. Contribution of Working Group I to the Fifth Assessment Report of the Intergovernmental Panel on Climate Change; Stocker, T.F., Qin, D., Plattner, G.-K., Tignor, M., Allen, S.K., Boschung, J., Nauels, A., Xia, Y., Bex, V., Midgley, P.M., Eds.; Cambridge University Press: Cambridge, UK; New York, NY, USA, 2013; pp. 1137–1216. [Google Scholar]
- Church, J.A.; White, N.J. A 20th century acceleration in global sea-level rise. Geophys. Res. Lett. 2006, 33, L01602. [Google Scholar] [CrossRef]
- Church, J.A.; White, N.J. Sea-level rise from the late 19th to the early 21st century. Surv. Geophys. 2011, 32, 585–602. [Google Scholar] [CrossRef] [Green Version]
- Douglas, B.C. Sea level change in the era of the recording tide gauge. In Sea Level Rise, History and Consequences, 1st ed.; Douglas, B.C., Kearney, M.S., Leatherman, S.P., Eds.; Academic Press: Cambridge, MA, USA, 2001; Volume 75, pp. 37–64. [Google Scholar]
- Nerem, R.S.; Leuliette, E.; Cazenave, A. Present-day sea-level change: A review. CR Geosci. 2006, 338, 1077–1083. [Google Scholar] [CrossRef]
- Oppenheimer, M.; Glavovic, B.C.; Hinkel, J.; van de Wal, R.; Magnan, A.K.; Abd-Elgawad, A.; Cai, R.; CifuentesJara, M.; DeConto, R.M.; Ghosh, T.; et al. Sea level rise and implications for low-lying islands, coasts and communities. In IPCC Special Report on the Ocean and Cryosphere in a Changing Climate; Pörtner, H.-O., Roberts, D.C., Masson-Delmotte, V., Zhai, P., Tignor, M., Poloczanska, E., Mintenbeck, K., Alegria, A., Nicolai, M., Okem, A., et al., Eds.; IPCC: Geneva, Switzerland, 2019; (in press). Available online: https://www.ipcc.ch/site/assets/uploads/sites/3/2019/12/SROCC_FullReport_FINAL.pdf (accessed on 29 February 2020).
- Stammer, D.; Cazenave, A.; Ponte, R.M.; Tamisiea, M.E. Causes for contemporary regional sea level changes. Annu. Rev. Mar. Sci. 2013, 5, 21–46. [Google Scholar] [CrossRef] [Green Version]
- Meyssignac, B.; Cazenave, A. Sea level: A review of present-day and recent-past changes and variability. J. Geodyn. 2012, 58, 96–109. [Google Scholar] [CrossRef]
- Creel, L. Ripple Effects: Population and Coastal Regions. Available online: https://www.prb.org/rippleeffectspopulationandcoastalregions/ (accessed on 27 February 2020).
- Douglas, B.C.; Kearney, M.S.; Leatherman, S.P. (Eds.) Sea Level Rise History and Consequences, 1st ed.; Academic Press: Cambridge, MA, USA, 2001; Volume 75, p. 232. [Google Scholar]
- Karaca, M.; Nicholls, R.J. Potential implications of accelerated sea-level rise for Turkey. J. Coast. Res. 2008, 24, 288–298. [Google Scholar] [CrossRef]
- Nicholls, R.J. Impacts of and responses to sea level rise. In Understanding Sea-Level Rise and Variability; Church, J.A., Woodworth, P., Aarup, T., Wilson, W.S., Eds.; Wiley-Blackwell Publishing: London, UK, 2010; pp. 17–51. [Google Scholar]
- Nicholls, R.J.; Cazenave, A. Sea-level rise and its impact on coastal zones. Science 2010, 328, 1517–1520. [Google Scholar] [CrossRef]
- Woodworth, P.L.; Wöppelmann, G.; Marcos, M.; Gravelle, M.; Bingley, R.M. Why we must tie satellite positioning to tide gauge data. Eos 2017, 98, 13–15. [Google Scholar] [CrossRef] [Green Version]
- Fu, L.-L.; Cazenave, A. Satellite Altimetry and Earth Sciences: A Handbook of Techniques and Applications. International Geophysics Series; Fu, L.-L., Cazenave, A., Eds.; Academic Press: San Diego, CA, USA, 2001; Volume 69, p. 463. [Google Scholar]
- Jaoshvili, S. The Rivers of the Black Sea; European Environmental Agency Technical Report No: 71; Khomerki, I., Gigineishvili, G., Kordzadze, A., Eds.; European Environmental Agency: Copenhagen, Denmark, 2002; p. 58. Available online: https://www.eea.europa.eu/publications/technical_report_2002_71 (accessed on 5 February 2019).
- Oguz, T.; Tugrul, S.; Kideys, A.E.; Ediger, V.; Kubilay, N. Physical and biogeochemical characteristics of the Black Sea. In The Sea; Robinson, A.R., Brink, K.H., Eds.; Harward University Press Cambridge: Cambridge, MA, 2006; Volume 14, pp. 1333–1371. [Google Scholar]
- Grinevetsky, S.R.; Zonn, I.S.; Zhiltsov, S.S.; Kosarev, A.N.; Kostianoy, A.G. The Black Sea Encyclopedia; Springer Verlag: Berlin/Heidelberg, Germany, 2015; p. 889. [Google Scholar]
- Amante, C.; Eakins, B.W. ETOPO1 Arc-Minute Global Relief Model: Procedures, Data Sources and Analysis; NOAA Technical Memorandum NESDIS NGDC-24; NOAA: Boulder, Colorado, 2009; p. 19. [Google Scholar]
- Allenbach, K.; Garonna, I.; Herold, C.; Monioudi, I.; Giuliani, G.; Lehmann, A.; Velegrakis, A.F. Black Sea beaches vulnerability to sea level rise. Environ. Sci. Policy 2015, 46, 95–109. [Google Scholar] [CrossRef]
- Kale, M.M.; Ataol, M.; Tekkanat, İ.S. Assessment of shoreline alterations using a digital shoreline analysis system: A case study of changes in the Yeşilırmak Delta in northern Turkey from 1953 to 2017. Environ. Monit. Assess. 2019, 191, 398. [Google Scholar] [CrossRef] [PubMed]
- Simav, Ö. Investigation of the Potential Impacts of the Sea Level Rise on Coastal Areas. Ph.D. Thesis, Istanbul Technical University, Istanbul, Turkey, 2012. (in Turkish). [Google Scholar]
- Tatui, F.; Pirvan, M.; Popa, M.; Aydogan, B.; Ayat, B.; Görmüș, T.; Korzinin, D.; Vaidianu, N.; Vespremeanu-Stroe, A.; Zainescu, F.; et al. The Black Sea coastline erosion: Index-based sensitivity assessment and management-related issues. Ocean Coast. Manag. 2019, 182, 104949. [Google Scholar] [CrossRef]
- Brown, S.; Nicholls, R.J.; Vafeidis, A.; Hinkel, J.; Watkiss, P. The Impacts and Economic Costs of Sea-Level Rise on Coastal Zones in the EU and the Costs and Benefits of Adaptation, Summary of Results from the EC RTD Climate Cost Project; The Climate Cost Project, Final Report; Volume 1: Europe; Watkiss, P., Ed.; Stockholm Environment Institute: Stockholm, Sweden, 2011; p. 44. [Google Scholar]
- Terziev, F.S. (Ed.) Hydrometeorology and Hydrochemistry of the USSR Seas; Project: Seas of the USSR; Volume IV: The Black Sea; Issue 1: Hydrometeorological Conditions; Gidrometeoizdat: St. Petersburg, Russian, 1991; p. 429. (in Russian) [Google Scholar]
- Ginzburg, A.I.; Kostianoy, A.G.; Sheremet, N.A.; Lebedev, S.A. Satellite altimetry applications in the Black Sea. In Coastal Altimetry; Vignudelli, S., Kostianoy., A.G., Cipollini, P., Benveniste, J., Eds.; Springer: Berlin/Heidelberg, Germany, 2011; pp. 367–387. [Google Scholar]
- Goryachkin, Y.N.; Ivanov, V.A. Black Sea Level: The Past, Present and Future; MHI NANU: Sevastopol, Russian, 2006; p. 210. (in Russian) [Google Scholar]
- Boguslavsky, S.G.; Kubryakov, A.I.; Ivashchenko, I.K. Variations of the Black Sea level. Phys. Oceanogr. 1998, 9, 199–208. [Google Scholar] [CrossRef]
- Tsimplis, M.N.; Baker, T.F. Sea level drop in the Mediterranean Sea: An indicator of deep water salinity and temperature changes? Geophys. Res. Lett. 2000, 27, 1731–1734. [Google Scholar] [CrossRef]
- Cazenave, A.; Bonnefond, P.; Mercier, F.; Dominh, K.; Toumazou, V. Sea level variations in the Mediterranean Sea and Black Sea from satellite altimetry and tide gauge. Glob. Planet. Chang. 2002, 34, 59–86. [Google Scholar] [CrossRef]
- Stanev, E.V.; Le Traon, P.-Y.; Peneva, E.L. Sea level variations and their dependency on meteorological and hydrological forcing: Analysis of altimeter and surface data for the Black Sea. J. Geophys. Res. Ocean. 2000, 105, 17203–17216. [Google Scholar] [CrossRef] [Green Version]
- Avsar, N.B.; Jin, S.; Kutoglu, S.H.; Gurbuz, G. Vertical land motion along the Black Sea coast from satellite altimetry, tide gauges and GPS. Adv. Space Res. 2017, 60, 2871–2881. [Google Scholar] [CrossRef]
- Alpar, B.; Dogan, E.; Yuce, H.; Altıok, H. Sea level changes along the Turkish coasts of the Black Sea, the Aegean Sea and the Eastern Mediterranean. Mediterr. Mar. Sci. 2000, 1, 141–156. [Google Scholar] [CrossRef]
- Avsar, N.B.; Jin, S.; Kutoglu, H.; Gurbuz, G. Sea level change along the Black Sea coast from satellite altimetry, tide gauge and GPS observations. Geod. Geodyn. 2016, 7, 50–55. [Google Scholar] [CrossRef] [Green Version]
- Kubryakov, A.A.; Stanichnyi, S.V. The Black Sea level trends from tide gauges and satellite altimetry. Russ. Meteorol. Hydrol. 2013, 38, 329–333. [Google Scholar] [CrossRef]
- Avsar, N.B.; Kutoglu, S.H.; Erol, B.; Jin, S. Sea level changes in the Black Sea using satellite altimetry and tide gauge observations. In Proceedings of the 26th IUGG General Assembly, Prague, Czech Republic, 22 June–2 July 2015; Available online: http://www.czech-in.org/cmdownload/IUGG2015/presentations/IUGG-5542.pdf (accessed on 27 February 2020).
- Kubryakov, A.A.; Stanichny, S.V.; Volkov, D.L. Quantifying the impact of basin dynamics on the regional sea level rise in the Black Sea. Ocean Sci. 2017, 13, 443–452. [Google Scholar] [CrossRef] [Green Version]
- Volkov, D.L.; Landerer, F.W. Internal and external forcing of sea level variability in the Black Sea. Clim. Dyn. 2015, 45, 2633–2646. [Google Scholar] [CrossRef]
- Avsar, N.B.; Kutoglu, S.H. Relative sea level change along the black sea coast from tide gauge observations. In the international archives of the photogrammetry, remote sensing and spatial information sciences. In Proceedings of the GeoInformation for Disaster Management (Gi4DM 2019), Prague, Czech Republic, 3–6 September 2019; Volume XLII-3/W8, pp. 43–47. [Google Scholar] [CrossRef] [Green Version]
- Feng, G.; Jin, S.; Zhang, T. Coastal sea level changes in Europe from GPS, tide gauge, satellite altimetry and GRACE, 1993–2011. Adv. Space Res. 2013, 51, 1019–1028. [Google Scholar] [CrossRef]
- Cazenave, A.; Cabanes, C.; Dominh, K.; Mangiarotti, S. Recent sea level changes in the Mediterranean Sea revealed by TOPEX/POSEIDON satellite altimetry. Geophys. Res. Lett. 2001, 28, 1607e10. [Google Scholar] [CrossRef]
- Pugh, D.T. Tides, Surges and Mean Sea-Level, Reprinted with Corrections; John Wiley & Sons Ltd.: Chichester, UK, 1996; p. 486. [Google Scholar]
- Cazenave, A.; Palanisamy, H.; Ablain, M. Contemporary sea level changes from satellite altimetry: What have we learned? What are the new challenges? Adv. Space Res. 2018, 62, 1639–1653. [Google Scholar] [CrossRef]
- QUID forSea Level TAC DUACS Products. Quality Information Document, Copernicus Marine Environment Monitoring ServiceREF: CMEMS-SL-QUID-008-032-062, 10.09.2019, Issue: 2.1REF: CMEMS-SL-QUID-008-032-062, 10.09.2019, Issue: 2.1. 2019, p. 78. Available online: http://resources.marine.copernicus.eu/documents/QUID/CMEMS-SL-QUID-008-032-062.pdf (accessed on 29 February 2020).
- AVISO+ Satellite Altimetry Data. Available online: https://www.aviso.altimetry.fr/en (accessed on 25 April 2019).
- COPERNICUS—Marine Environment Monitoring Service. Available online: http://marine.copernicus.eu/ (accessed on 27 April 2019).
- Woolf, D.; Tsimplis, M. The influence of the North Atlantic oscillation on Sea level in the Mediterranean and the Black Sea derived from satellite altimetry. In Proceedings of the Second International Conference on Oceanography of the Eastern Mediterranean and Black Sea: Similarities and Differences of Two Interconnected Basins, Ankara, Turkey, 14–18 October 2002; pp. 145–150. Available online: https://www.noc.ac.uk/publication/115146 (accessed on 27 February 2020).
- Permanent Service for Mean Sea Level. Available online: http://www.psmsl.org/ (accessed on 14 April 2019).
- Global Sea Level Observing System. Available online: https://www.gloss-sealevel.org/ (accessed on 14 April 2019).
- General Directorate of Mapping. Turkish National Sea Level Monitoring System. Available online: https://tudes.harita.gov.tr/tudesportal/AnaEkranEN.aspx (accessed on 13 April 2019).
- Nevada Geodetic Laboratory. Available online: http://geodesy.unr.edu/ (accessed on 19 June 2019).
- General Directorate of Mapping. Turkish National Permanent RTK Network (CORS-TR/TUSAGA-Aktif). Available online: https://www.harita.gov.tr/english/u-13-turkish-national-permanent-rtk-network--tnpgn-active--and-determination-of-the-datum-transformations-parameters.html (accessed on 16 June 2019).
- CATS. CATS Cycles Analysis and Timeseries Software, Version 1.0, Ray Tomes and Radiance Trust. 2010, p. 30. Available online: https://cyclesresearchinstitute.org/cats/ (accessed on 18 March 2020).
- Avsar, N.B.; Kutoglu, S.H. Analysis of Seasonal Cycle of Sea Level Variations in the Black Sea. In Proceedings of the International Symposium on Applied Geoinformatics (ISAG-2019), Istanbul, Turkey, 7–9 November 2019; Bayram, B., Ed.; pp. 185–188. Available online: https://www.kongresistemi.com/panel/UserUploads/Files/c42d925e45daf45.pdf (accessed on 27 February 2020).
- Korotaev, G.; Oguz, T.; Nikiforov, A.; Koblinsky, C. Seasonal, interannual, and mesoscale variability of the Black Sea upper layer circulation derived from altimeter data. J. Geophys. Res. Ocean. 2003, 108, 3122. [Google Scholar] [CrossRef]
- Yildiz, H.; Andersen, O.B.; Kilicoglu, A.; Simav, M.; Lenk, O. Sea Level Variations in the Black Sea for 1993–2007 Period from GRACE, Altimetry and Tide gauge Data. In Proceedings of the EGU General Assembly 2008, Vienna, Austria, 13–18 April 2008; Available online: https://www.psmsl.org/about_us/news/2008/egu_2008/EGU2008-A-08684.pdf (accessed on 27 February 2020).
- Legeais, J.-F.; Ablain, M.; Zawadzki, L.; Zuo, H.; Johannessen, J.A.; Scharffenberg, M.G.; Fenoglio-Marc, L.; Fernandes, M.J.; Andersen, O.B.; Rudenko, S. An improved and homogeneous altimeter sea level record from the ESA climate change initiative. Earth Syst. Sci. Data 2018, 10, 281–301. [Google Scholar] [CrossRef] [Green Version]
- Avsar, N.B.; Jin, S.; Kutoglu, S.H. Interannual variations of sea surface temperature in the black sea. In Proceedings of the 2018 IEEE International Geoscience and Remote Sensing Symposium (IGARSS 2018), Valencia, Spain, 22–27 July 2018; pp. 5617–5620. [Google Scholar] [CrossRef]
- Vigo, I.; Garcia, D.; Chao, B.F. Change of sea level trend in the Mediterranean and Black Seas. J. Mar. Res. 2005, 63, 1085–1100. [Google Scholar] [CrossRef] [Green Version]
- Tsimplis, M.N.; Josey, S.A.; Rixen, M.; Stanev, E.V. On the forcing of sea level in the Black Sea. J. Geophys. Res. 2004, 109. [Google Scholar] [CrossRef] [Green Version]
- Fenoglio-Marc, L.; Tel, E. Coastal and global sea level. J. Geodyn. 2010, 49, 151–160. [Google Scholar] [CrossRef]
Figure 1.
Black Sea with its location. Topographic data were used from the ETOPO1 1 Arc-Minute Global Relief Model bedrock data [23].
Figure 1.
Black Sea with its location. Topographic data were used from the ETOPO1 1 Arc-Minute Global Relief Model bedrock data [23].

Figure 2.
Monthly sea level time series from January 1993 to May 2017.

Figure 3.
Locations of the tide gauges and Global Navigation Satellite System (GNSS) stations used in the study.
Figure 3.
Locations of the tide gauges and Global Navigation Satellite System (GNSS) stations used in the study.

Figure 4.
Three examples of the relative mean sea level changes at tide gauge stations along the Black Sea coast: (a) Poti from the Permanent Service for Mean Sea Level (PSMSL); (b) Bourgas from the PSMSL; (c) Igneada from the Turkish National Sea Level Monitoring System (TUDES).
Figure 4.
Three examples of the relative mean sea level changes at tide gauge stations along the Black Sea coast: (a) Poti from the Permanent Service for Mean Sea Level (PSMSL); (b) Bourgas from the PSMSL; (c) Igneada from the Turkish National Sea Level Monitoring System (TUDES).

Figure 5.
Monthly sea level time series in the Black Sea from 1993 to 2017 from the satellite altimetry data: (a) Non-seasonal sea level time series with its linear fitting. (b) Dominant cycles (red) over the detrended and non-seasonal sea level time series (black).
Figure 5.
Monthly sea level time series in the Black Sea from 1993 to 2017 from the satellite altimetry data: (a) Non-seasonal sea level time series with its linear fitting. (b) Dominant cycles (red) over the detrended and non-seasonal sea level time series (black).

Figure 6.
Trend and harmonic model of ~10-year sea level time series at the Amasra tide gauge station.
Figure 6.
Trend and harmonic model of ~10-year sea level time series at the Amasra tide gauge station.

Figure 7.
Areas with low slope along the Black Sea shore.

Figure 8.
Coastal areas under water (marked in red), if the sea level rises 1 m.


Table 1.
General information on all the tide gauge stations used in this study.
| Tide Gauge Station (Country) | Location | Data Period | Data Gaps (%) | |
|---|---|---|---|---|
| Latitude | Longitude | |||
| Poti (Georgia) | 42°10′ N | 41°41′ E | Jan. 1874–Dec. 2013 | ~5.7 |
| Batumi (Georgia) | 41°38′ N | 41°42′ E | Jan. 1882–Dec. 2013 | ~13.4 |
| Sevastopol (Ukraine) | 44°37′ N | 33°32′ E | Jan. 1910–Dec. 1994 | ~3.1 |
| Tuapse (Russia) | 44°06′ N | 39°04′ E | Jan. 1917–Dec. 2011 | ~1.0 |
| Varna (Bulgaria) | 43°11′ N | 27°55′ E | Jan. 1929–Dec. 1996 | ~4.9 |
| Bourgas (Bulgaria) | 42°29′ N | 27°29′ E | Jan. 1929–Dec. 1996 | ~13.7 |
| Constantza (Romania) | 44°10′ N | 28°40′ E | Jan. 1933–Dec. 1997 | ~5.0 |
| Amasra (Turkey) | 41°45′ N | 32°24′ E | Jun. 2001–Dec. 2014 | ~9.4 |
| Igneada (Turkey) | 41°53′ N | 28°01′ E | Jun. 2002–Dec. 2014 | ~5.3 |
| Trabzon (Turkey) | 41°00′ N | 39°44′ E | Jul. 2002–Dec. 2014 | ~0.7 |
| Sinop (Turkey) | 42°01′ N | 35°09′ E | Jun. 2005–Dec. 2014 | 0 |
| Sile (Turkey) | 41°11′ N | 29°37′ E | Jul. 2008–Dec. 2014 | 0 |
Table 2.
Trend and seasonal components of coastal (relative) sea level changes at the tide gauge stations along the Black Sea coast (the longest available data periods of the tide gauges were used for the analysis).
Table 2.
Trend and seasonal components of coastal (relative) sea level changes at the tide gauge stations along the Black Sea coast (the longest available data periods of the tide gauges were used for the analysis).
| Tide Gauge Station | Data Period | Trend (mm/year) | Annual | Semi-Annual | ||
|---|---|---|---|---|---|---|
| Amplitude (mm) | Phase (°) | Amplitude (mm) | Phase (°) | |||
| Poti | Aug. 1922 Dec. 2002 | 7.01 ± 0.12 | 77.42 ± 4.05 | 157.76 ± 0.05 | 35.86 ± 4.05 | 26.52 ± 0.11 |
| Batumi | Jan. 1925 Dec. 1996 | 3.52 ± 0.15 | 78.93 ± 4.43 | 158.48 ± 0.06 | 35.19 ± 4.43 | 22.01 ± 0.13 |
| Sevastopol | Sep.1944 Dec. 1994 | 1.56 ± 0.22 | 79.41 ± 4.58 | 139.65 ± 0.06 | 30.07 ± 4.59 | 16.25 ± 0.15 |
| Tuapse | Jan. 1943 Dec. 2011 | 2.92 ± 0.14 | 70.42 ± 3.85 | 142.41 ± 0.06 | 37.00 ± 3.85 | 29.78 ± 0.10 |
| Varna | Jan. 1926 Nov. 1961 | 1.53 ± 0.48 | 69.54 ± 6.42 | 152.73 ± 0.09 | 27.38 ± 6.41 | 344.06 ± 0.23 |
| Bourgas | Feb. 1981 Jan. 1996 | −7.52 ± 1.33 | 67.23 ± 8.13 | 141.78 ± 0.12 | 20.84 ± 8.12 | 19.83 ± 0.39 |
| Constantza | Jan. 1945 Dec. 1979 | 3.02 ± 0.46 | 78.14 ± 6.55 | 127.94 ± 0.08 | 15.74 ± 6.55 | 26.34 ± 0.42 |
| Amasra | Jun. 2001 Feb. 2011 | 3.43 ± 1.42 | 30.69 ± 5.71 | 104.70 ± 0.18 | 3.47 ± 5.66 | 340.66 ± 1.63 |
| Igneada | Jun. 2002 Dec. 2014 | 6.94 ± 2.18 | 49.16 ± 11.17 | 130.14 ± 0.23 | 16.01 ± 11.22 | 50.66 ± 0.70 |
| Trabzon | Jul. 2002 Dec. 2014 | 2.33 ± 1.75 | 62.77 ± 8.93 | 153.45 ± 0.14 | 27.09 ± 8.93 | 17.09 ± 0.33 |
| Sinop | Jun. 2005 Dec. 2014 | 0.43 ± 2.88 | 49.04 ± 11.26 | 135.82 ± 0.23 | 29.53 ± 11.28 | 12.06 ± 0.38 |
| Sile | Jul. 2008 Dec. 2014 | 5.03 ± 4.84 | 62.92 ± 12.84 | 128.86 ± 0.20 | 22.90 ± 12.84 | 49.11 ± 0.56 |
Table 3.
Vertical land motions at the tide gauge locations along the Black Sea coast.
| Tide Gauge Station | GNSS Station | Data Period | Distance (km) | Vertical Velocity (mm/year) | |
|---|---|---|---|---|---|
| Tide Gauge | GNSS | ||||
| Tuapse | TUAP | 1943–2011 | 2015–2017 | 0.05 | −1.7 ± 0.5 |
| Varna | VARN | 1926–1961 | 2005–2017 | 2.1 | −1.1 ± 0.1 |
| Bourgas | BUR3 | 1981–1996 | 2009–2014 | 1.5 | 4.2 ± 0.2 |
| Trabzon | TRBN | 2002–2014 | 2009–2014 | 2.8 | −1.9 ± 0.3 |
| Sinop | SINP | 2005–2014 | 2010–2014 | 0.8 | 6.2 ± 2.5 |
| Sile | SLEE | 2008–2014 | 2009–2014 | 1.2 | −3.0 ± 0.6 |
Table 4.
Estimates of the rate of the basin-averaged sea level rise in the Black Sea.
| Reference | Data Type | Period | Value of Rise or Linear Trend |
|---|---|---|---|
| [29] | Tide Gauge | 1890–1990 | 20 cm |
| [31] | Tide Gauge | 1920–1985 | 1.83 mm/year |
| [32] | Tide Gauge | 1873–1985 | 1.6 mm/year |
| [33] | Tide Gauge | 1960–1990 | 2.2 mm/year |
| [34] | Along-Track Altimetry | 1993–1998 | 27.3 mm/year |
| [64] | In-Situ 1 | 1944–2003 | 2.5 mm/year |
| [39] | Along-Track Altimetry | 1992–2005 | 7.6 mm/year |
| [30] | Along-Track Altimetry | 1993–2008 | 13.4 mm/year |
1 Steric data and precipitation/evaporation data provided from climatology and meteorological stations.
Table 5.
Estimates of the rates of sea level changes at some tide gauge stations along the Black Sea coast (the data periods from [37] are approximately known, except for Samsun).
Table 5.
Estimates of the rates of sea level changes at some tide gauge stations along the Black Sea coast (the data periods from [37] are approximately known, except for Samsun).
| Tide Gauge Station | Period | Reference | Linear Trend of Sea Level Change | Linear Trend of Vertical Land Motion |
|---|---|---|---|---|
| Poti | 1890–1950 | [37] | 8.2 mm/year | −6.5 mm/year |
| 1993–2013 | [38] | 4.1 mm/year | ||
| Constantza | 1860–1990 | [37] | 2.7 mm/year | |
| Odessa | 1870–1960 | [37] | 7.1 mm/year | −5.2 mm/year |
| 1993–2005 | [39] | −4.2 mm/year | ||
| Sevastopol | 1870–1960 | [37] | 3.0 mm/year | −1.1 mm/year |
| 1993–2005 | [39] | 8.3 mm/year | ||
| Tuapse | 1993–2011 | [38] | 4.3 mm/year |
© 2020 by the authors. Licensee MDPI, Basel, Switzerland. This article is an open access article distributed under the terms and conditions of the Creative Commons Attribution (CC BY) license (http://creativecommons.org/licenses/by/4.0/).
Share and Cite
MDPI and ACS Style
Avşar, N.B.; Kutoğlu, Ş.H. Recent Sea Level Change in the Black Sea from Satellite Altimetry and Tide Gauge Observations. ISPRS Int. J. Geo-Inf. 2020, 9, 185. https://0-doi-org.brum.beds.ac.uk/10.3390/ijgi9030185
AMA Style
Avşar NB, Kutoğlu ŞH. Recent Sea Level Change in the Black Sea from Satellite Altimetry and Tide Gauge Observations. ISPRS International Journal of Geo-Information. 2020; 9(3):185. https://0-doi-org.brum.beds.ac.uk/10.3390/ijgi9030185
Chicago/Turabian StyleAvşar, Nevin Betül, and Şenol Hakan Kutoğlu. 2020. "Recent Sea Level Change in the Black Sea from Satellite Altimetry and Tide Gauge Observations" ISPRS International Journal of Geo-Information 9, no. 3: 185. https://0-doi-org.brum.beds.ac.uk/10.3390/ijgi9030185
Note that from the first issue of 2016, this journal uses article numbers instead of page numbers. See further details here.