A Social–Aware Recommender System Based on User’s Personal Smart Devices


1
Dept. of GIS, Faculty of Geodesy and Geomatics Engineering, K.N. Toosi University of Technology, Tehran 19967-15433, Iran
2
Department of Geomatics Engineering, University of Calgary, Calgary, AB T2N 4V8, Canada
*
Author to whom correspondence should be addressed.
ISPRS Int. J. Geo-Inf. 2020, 9(9), 519; https://0-doi-org.brum.beds.ac.uk/10.3390/ijgi9090519
Submission received: 6 August 2020
/
Accepted: 29 August 2020
/
Published: 30 August 2020
(This article belongs to the Special Issue Recent Trends in Location Based Services and Science)
Abstract
:Providing recommendations in cold start situations is one of the most challenging problems for collaborative filtering based recommender systems (RSs). Although user social context information has largely contributed to the cold start problem, most of the RSs still suffer from the lack of initial social links for newcomers. For this study, we are going to address this issue using a proposed user similarity detection engine (USDE). Utilizing users’ personal smart devices enables the proposed USDE to automatically extract real-world social interactions between users. Moreover, the proposed USDE uses user clustering algorithm that includes contextual information for identifying similar users based on their profiles. The dynamically updated contextual information for the user profiles helps with user similarity clustering and provides more personalized recommendations. The proposed RS is evaluated using movie recommendations as a case study. The results show that the proposed RS can improve the accuracy and personalization level of recommendations as compared to two other widely applied collaborative filtering RSs. In addition, the performance of the USDE is evaluated in different scenarios. The conducted experimental results on USDE show that the proposed USDE outperforms widely applied similarity measures in cold start and data sparsity situations.
1. Introduction
With the tremendous growth of the Internet of things (IoT), smart devices, and social networks (SNs), information load is growing every day [1]. Mobile computing as indicated in [2,3] IoT, and sensing devices are becoming more intelligent so that they can socially interact with each other like humans and generate a large amount of data on a daily basis [4]. Recent advances in localization techniques has made location-based SNs popular as the convergence of location-based services and SNs [5]. Fast-developing location-related contents generated by location-based SNs has stimulated research into developing novel filtering and exploring tools that provide users with more personalized information [5]. Oceans of data generated by smart devices and SNs makes the fast development of recommender systems (RS) inevitable [6,7,8]. The RS can be used as a tool to filter items that are more likely to be preferred by users [9]. They have also been proposed as knowledge management services to analyze and filter efficient information on users [10]. Due to their importance in the daily lives of users in recent decades, RSs have gained attention especially from the social and computer science communities [6,11].
A challenge for RSs is providing personalized recommendations to users when there is not enough information describing users or items, also known as the cold start problem (CSP) [12,13,14,15,16,17]. The similarity between users or items can be considered to be the most commonly applied approach for addressing the CSP [12,18]. For conventional RSs, the similarities between users were identified by either their user-created comments, or by ratings of different items. However, empirical research demonstrated that only 15 percent of similar users can be identified by their created comments or ratings [13]. Utilizing social relations to identify similar users for social-aware RSs can be considered a recent advancements in SNs for addressing the CSP [12,19]. Although applying this approach can largely eliminate the CSP, it imposes a new constraint on the RS, which relies on SNs to identify similar users. In addition, social-aware RSs still suffer from the lack of initial social links for newcomers (i.e., the CSP is still a bottleneck for RSs when there is no information describing the user’s social interactions).
Apart from the development of various feature-rich, location-based SNs, the CSP still persists in the provision of highly personalized recommendations for new users and locations. Utilizing user mobility patterns and geographical properties such as movement trajectories and common check-ins, can be considered recent advancements in finding similar users for location-based RSs [20]. Torrijos et al. [20], demonstrated that applying the similarity detection technique based on user trajectories can result in more reliable recommendations in comparison to other similarity approaches such as considering similar ratings in order to find similar users. However, the trajectory-based similarity detection approach is more computationally expensive than the other competitive approaches [20,21].
In addition to the CSP, providing more personalized recommendations which are more in-line with user preferences can be considered the underlying goal for social-aware RSs. Recommending more personalized items requires a deeper understanding of users’ dynamic behaviors [22]. User preferences can be automatically reasoned and extracted using smart devices [23,24,25]. Different types of contextual information including user interests, activities, physical environments, social circles, devices, times, and locations have been considered for different RSs in order to provide more personalized recommendations. However, manually collecting user preferences is neither always possible, nor sufficient. Investigated contexts in most of the recent studies are limited to those that can be extracted from embedded sensors in smartphones [26]. For this research, we are going to use different smart devices in addition to smartphones to automatically extract profile information.
For this research, a combination of different technologies including smart devices, SNs, artificial intelligence (AI), and context awareness (CA), are integrated into a hybrid RS to address the CSP and provide more personalized recommendations. To summarize, the main contributions of this research are as follow:
- Proposing a novel user similarity detection engine (USDE) that can model similarities between users by considering social interactions created in the real world or virtually through SNs;
- Integrating the potential of users’ personal smart devices with RSs to capture a wide variety of contextual information about users and consequently provide more personalized recommendations;
- Equipping the proposed USDE with a user clustering algorithm to enable the proposed RS to face even the most challenging cold start situations for which other RSs, including location-based RSs, fail to provide personalized recommendations.
The architecture of the proposed hybrid RS consists of four different layers. As seen in Figure 1, the “Data Acquisition and Accumulation” layer is the bottom layer of this architecture. Smart devices such as Google Home, smart wearables, and smartphones are mainly responsible for collecting data that can be used to extract user-related contextual information. The data acquisition layer also contains different types of SNs that provides users social links that provides users social links that were made virtually through SNs. A variety of common data types such as events, locations, tips, and multimedia information are also extracted from different types of SNs. As various smart devices and sensors export their data in different formats, the accumulation layer is in charge of collecting and storing data in the required format in a central data repository. Finally, providing access to various kinds of online RESTful (Representational State Transfer) Application Programming Interfaces (APIs), datasets, and databases is defined as the other responsibility of the accumulation layer.
The “Dynamic User Profile” layer utilizes different context extraction algorithms to extract meaningful contexts from data provided by the “Data Acquisition and Accumulation” layer. Then, the user profile is created from a categorization of contextual information such as user activities, user interests, and other similar context categories by using a context reasoning engine. In other words, the user profile summarizes meaningful information that explicitly or implicitly expresses user preferences. The “User Similarity Detection Engine” layer plays a crucial role for the proposed RS. It generally detects user similarities based on social interactions between users as well as smart devices. Finally, the “Recommender Services” for our proposed architecture uses information provided by the USDE and offers personalized recommendations.
We face several limitations for the proposed RS. Firstly, it is assumed that internet infrastructure and cloud storage are available for data exchange and data management. Secondly, social interactions between users are assumed to be one of the similarity measures for our proposed RS. Hence, users who intend to use this proposed recommender system should be aware that their recommendations are partially influenced by their social circles. The quality of data for information such as heart rate and sleep quality that is obtained from smart wearables varies based on the different models applied by manufacturers and is beyond the scope of this paper. Moreover, the proposed RS does not fully support a privacy preservative algorithm and thus this aspect is also outside the scope of this research study.
The remainder of this article is structured as follows: In Section 2 of this paper, we briefly survey different types of RSs and similarity measures that have recently been proposed for mitigating the CSP. In Section 3, the creating and updating of user profiles using personal smart devices is described. A detailed explanation of the proposed user similarity detection engine and recommender algorithm are presented in Section 4 and Section 5, respectively. In addition, the functionality of our proposed RS in two different scenarios is investigated in Section 5. Section 6 presents the results obtained from our experiments. Finally, Section 7 discusses conclusions and future directions.
2. Literature Review
Content-based (CB) and collaborative filtering (CF) algorithms are recognized as the two most widely used recommendation approaches [13,27]. Although their main purpose is estimating user interest in new items, CB algorithms recommend items that are similar to the ones previously preferred by the user; whilst CF algorithms recommend items based on what like-minded people preferred in the past. The generic nature of the CF was the underlying reason to achieve a broader success [8,27]. CF algorithms are widely applied in Web and IoT services [28,29,30]. CF recommender algorithms can further be categorized into model-based and neighborhood-based approaches. Data mining techniques, such as matrix factorization [31] are mostly applied to figure out relationships between users and items in model-based approaches. The neighborhood approach, in comparison, utilizes statistical techniques to find out neighborhoods between users (user-based CF [32]) or between items (item-based CF [33]).
Although the traditional CF algorithms have achieved great success, the CSP is still a challenge [34]. This problem arises when a new user (referred to as “user CSP”) or item (referred to as “item CSP”) is added to the RS and there is no historical information to explicitly or implicitly express user preferences [35]. Lack of sufficient information for new items will cause them to be ranked at the bottom of the recommendation list [36]. User CSP negatively affects the performance of the RS to provide meaningful recommendations for new users. Providing prior ratings to new items by staff members can largely eliminate the item CSP. However, privacy concerns in RSs do not allow applying a similar approach to address the user CSP which greatly captured the attention of researchers. Note that, for the rest of this paper, the term CSP is used exclusively for the user CSP. The common approaches to address the user CSP can be classified into three main categories: (1) evaluating the interaction between users and items to detect the most prominent groups of similar users [30], (2) using some additional context information such as demographic data [37], and (3) using hybrid RSs or a combination of recommender algorithms to enhance the functionality of the prediction method [36].
Cosine similarity, Pearson’s correlation, and Spearman’s rank correlation can be mentioned as the most widely applied similarity measure to identify similar users [30]. Cosine similarity measures the angle between two vectors of ratings and a smaller angle means greater similarity between users. Pearson’s correlation looks at the linear correlation between the two vectors of ratings. Lastly, Spearman’s rank correlation measures the similarity between the two rating vectors by considering ranks that have been given to co-rated items by users [38]. The definitions of similarity measures between two users are summarized in Table 1 [30].
Data sparsity causes different limitations for the above-mentioned similarity measures. For example, when there is only one item in the co-rated item set, Pearson’s correlation cannot be calculated, and cosine similarity results “1” regardless of differences between the two ratings given to the same item by two users. In another situation, when two users give the same ratings for all co-rated items (e.g., and are ratings given by two users for three items), Pearson’s correlation cannot be calculated and cosine similarity reports the maximum similarity between users regardless of differences between rating values.
The user CSP and data sparsity are a serious issue for most real-world RSs [38]. Considering historical interactions between users and items to identify similar users can partially resolve this problem. However, when there is a limited number of co-ratings or semantically similar comments, the CSP becomes more serious. Empirical research demonstrated that only 15 percent of similar users can be identified by their created comments or their ratings [13]. Simple experiments using publicly available MovieLens dataset [39] showed that cosine similarity and Pearson’s correlation measures can be applicable only for 26.2% and 15.9% of 7650 pairs of randomly chosen users respectively [38]. As a result, relying only on the rating information to apply similarity measures is not sufficient for real-world scenarios. Therefore, identifying similar users for solving the user CSP using some additional data sources is a popular topic in the RSs research community [8,37].
Contextual information plays an important role in providing additional information to identify similar users with regards to user preferences [37]. Context-aware algorithms provide users with more personalized recommendations [27]. The location history context [40] or similarity between users’ trajectories [41] can be mentioned as one of the mostly applied contexts. However, most of the context-aware algorithms impose a computationally expensive cost to the RS. Starting with the research of Adomavicius et al. [42], context-aware algorithms attempt to estimate user interests in different items by considering additional user/item contextual information. Using demographic data such as users’ age, occupation, and gender is one of the most popular approaches to identify similar users and mitigate user CSP [36]. Alliouli Y.L. [36], proposed a novel approach based on using demographic data and classification techniques to address the CSP in a CF recommender algorithm. This approach can be summarized in three phases [36]: building C4.5 and Naïve Bayes classifier using demographic data, identifying similarity between the new cold start user and its neighbors inside the class, and predicting ratings for the new user based on the users in that class. However, classification techniques require prior knowledge of data. Applying clustering techniques instead overcomes the limitation of classification approaches [37]. Clustering similar users based on their contextual information is where context-awareness plays an important role to overcome the CSP raised in CF recommender algorithms.
In the Hybrid RS category, Chatzidimitris et al. [37], designed and implemented an advanced e—business RS, called SMARTBUY, that provides mobile users with location-based recommendations for retail products and services. CF is the core recommender algorithm in SMARTBUY. Applying different contextual information such as demographic data not only empowers the CF in mitigating the CSP; but also, provides more personalized recommendations. Carvalho et al. [35], proposed a Hybrid RS that uses association rules to identify similar users and overcome CSP. The objective of this research is to identify like-minded people and recommend to the target user those items liked by other cluster members. Euclidian distance based on users’ historical locations and also using demographic data including age, gender, nationality, and search history have been applied in SMARTBUY to cluster similar users [37]. In SMARTBUY [37], the context-aware RS relies on smartphones and social networks (here only Facebook API) as the only source to provide contextual information. To cover some of the research gaps in the above-mentioned methods [35,37,40,41], we propose a hybrid RS to address the following issues:
- Although using additional data sources like users’ preferences can address the CSP, asking users to manually provide such information is not always possible. In addition, this information is changing over time. For example, users’ favorite music or movie genres can change over time. Asking users to regularly update their preferences is a limitation of some RSs that have been recently developed. With the tremendous growth of smart devices, we are no longer restricted to a limited number of context providers such as smartphones and tablets; therefore, in this research, we automatically update the user’s profile based on his/her personal smart devices.
- Relying on SNs to detect socially similar users imposes a new constraint for RSs (i.e., users have to be members of a SN). In addition, RSs still suffer from the CSP when there is no information explicitly or implicitly express the user’s social interaction in SNs. In previous studies, only virtual interactions were extracted from SNs to identify socially connected users [12]. However, in this research, real-world social interactions extracted from users’ smart devices are added to our USDE. These real-world social interactions play an important role as an additional data source to identify the similarity between users.
- Cosine and Pearson’s correlation similarity measures can be mentioned as the most widely applied similarity measures [30,37] in CF–based RSs. Similarity measures that have been proposed show very low utilization under the harsh conditions of the CSP. In comparison with applied similarity measures, a new trust-based similarity measure is proposed in this research. In this study, a swarm-based clustering technique is used in the USDE to make the proposed RS more powerful to address the CSP. In other words, the proposed USDE is empowered by a clustering algorithm to identify similar users based on their real-world social interactions and contextual information included in their profiles.
3. Updating User Profile Using Smart Devices
The user profile is a profile containing contextual information about the user’s identity, activity, location, social circle, and preferences in different aspects such as events and movies. These items can be considered as “user’s context” as well [43]. Most current RSs [37] manually collect user explicit preferences, which is time-consuming. In addition, the dynamic aspects of the user’s profile (i.e., contexts) cannot be addressed. Automatically creating a dynamic user profile leaves many opportunities to enhance the functionality of RSs. Firstly, they can provide context-aware recommendations that are more personalized than the recommendations provided by the conventional RSs. Secondly, dynamically updating user profiles can better model changes that might happen in user preferences over time. Finally, user profiles can be considered as a criterion to identify similar users in situations where other similarity measures like social interactions are not available. For this study, contextual information will be used to form a dynamic user profile. The categorization of contextual information in the user profile is summarized in Figure 2. The proposed conceptual categorization provides a flexible and structured method to organize and extend contexts.
A variety of contexts can be extracted from data collected by users’ smart devices. As an example, a smart speaker like Google Home provides data based on users’ voice commands. For example, playing a Google Play movie using Google Home to Google Chromecast requires following a specified voice command (i.e., “Watch/Play” on ) which is explicitly explained by Google LLC (https://support.google.com/googlehome/). By analyzing such information, user preferences can be extracted in different aspects such as their favorite movie genres, music styles, singers, and radio stations. In this research, three types of context providers have been considered including smart speakers, wearable devices, and smartphones.
Extracting desired contexts from smart speakers (e.g., Google Home) necessitates applying string matching algorithms [44,45]. There are different text mining methodologies such as Knuth–Morris–Pratt, Rabin–Karp, and brute-force [40]. It has been proved that the Knuth–Morris–Pratt algorithm solves a keyword matching problem in time whilst the other two similar algorithms solve it in time, in which m and n are the number of characters in keyword and input string respectively [46]. Due to the better functionality of the Knuth–Morris–Pratt algorithm [44,45], this algorithm is applied to extract context from textual information collected by smart speakers. The applied Knuth–Morris–Pratt algorithm to extract movie names from textual information collected by Google Home smart speaker is shown in Table 2.
Wearable devices such as smart watches/bands, fitness trackers, and smart headsets are the second context provider considered in this research. Wearable devices are equipped with a diverse range of sensors such as the in-ear thermometer, Global positioning system (GPS), accelerometer, and gyroscope. These sensors provide users with the ability to monitor their daily activities and health-related information. In this study contextual information such as physical exercise, mobility level, transportation mode, and sleep quality are extracted from wearable devices APIs.
Sensing and computing capabilities of smartphones and tablets [47] motivated us to utilize them as the third context providers. A variety of contexts can be extracted from smartphones sensors as well as their installed apps such as social media, phone, calendar or emails. Check-ins information, social graphs of connected users, physical environments, daily schedules, favorite applications, and favorite internet search topics are among the possible context information that can be extracted from smartphones [18]. A mobile application has been developed in this research to extract and access desired contexts from smartphones and tablets. A further explanation of our developed application to extract desired contexts is given in the Section 6. For example, the application extracts user’s social circles based on the social network’s friends, phone contacts, calendar invites, emails and text messages, frequent phone calls.
Finally, extracted contexts from all three types of smart devices can be integrated into the context reasoning layer. The main responsibility of this layer is to integrate primary context data (e.g., movie names, check-ins, and user activity) to infer high-level user context (e.g., preferences in movie genres, semantic category of venues, and mobility levels) by incorporating various sources of information. To achieve this goal, a rule engine is designed and applied. Defining different rules requires basic knowledge that comes from expert suggestions in different areas. As an example rule, if the number of user’s daily steps is more than 10,000, or if the total number of miles moved is more than four miles per day, and the user’s heartbeat is between 135–155 beats per minutes (https://www.verywellfit.com/target–heart–rate–calculator–3878160), then the user is having a high level of mobility. Three examples of rules applied in the context reasoning layer are shown in Table 3 to extract higher level contexts.
User privacy is a big challenge in context-aware systems. There is a trade-off between efficiency of context-aware computation and preserving privacy. Technology can help minimize trade-offs, but it cannot eliminate them. Although applying privacy protection techniques is outside the scope of this paper, some considerations have been taken into account to protect user privacy in updating user profiles using smart devices. We used a local memory approach for user context detection and profile updating. The information from the user’s smart devices is privately stored on the user’s phone. To share every device’s data locally, every service uses basic authentication and asks for user’s privacy policy rules to protect user’s data. Users are asked whether they are willing to incorporate their data to receive more personalized recommendations. In other words, they have been given full control of how much of the data they want to be used in the recommendation process. Next, the RS provides users with the option to manually edit their preferences in their profile if they are not willing to share any of their personal data. However, if the user wants to collect his profile information automatically, their personal data will be permanently deleted after being used for the context reasoning engine. For example, communication with their Google Home devices will be deleted after their preferred movie genres are extracted. Using this method, which is one of the most common techniques on both academic and industry social applications (e.g., Facebook, Twitter), the user can control the rules for sharing profile data and be accountable for the information revealed to other users, and it can change dynamically.
4. User Similarity Detection Engine
To consider real-world social interactions and smart devices, two algorithms are used to group similar users. These algorithms were added to the USDE to make the proposed RS more powerful in addressing the CSP. The first method which makes a social-aware USDE is defined based on the strength of bonds in users’ social interactions [48]. In this component, both social interactions created either in the real-world or virtual networks are considered as a similarity parameter. The second method is using a clustering algorithm to identify similar users based on different contexts in the users’ profile. For the proposed similarity detection approach it is worth mentioning that if we have a significant number of people (the threshold is considered 30 persons [49]) in the social circle, then the user preference can be inferred based on his/her social circle. Otherwise, the clustering method is used to find similar users with common interests.
Another challenge here is how to use a USDE while protecting user’s privacy. Although detailed user privacy research needs to be conducted especially on resource-restrained devices such as cellphones, in this paper we used user profile anonymization to support user’s privacy. The user’s ID and profile are shared using a secure hash algorithms (SHA)-512 approach for the user’s social circle. USDE utilizes a list of user profiles (with a constantly updated list) with hashed user IDs in the process of making recommendations. Using an anonymization technique, the user profiles and their social circles are delivered without users’ real identity information in the case of user similarity clustering. In this way, their identity remains anonymous on the server while similar user profiles can be used in the proposed RS.
4.1. Social Interaction Classification
The similarity between users can be identified by analyzing their social interactions such as emails, call logs, and bidirectional social relationships extracted from SNs. Inspired by Elsesser and Peplau [48], social interactions between users can be categorized into two different categories due to the strength of bonds existing in their social interactions. The first category is called primary social interactions (PSIs), that includes real-world relationships between users such as making a call and sending or receiving messages and emails. The number of members placed in the group of similar users with PSIs is usually small and characterized by extensive and real-world interactions between group members on a regular basis. The second category is called secondary social interactions (SSIs) includes interactions made in the virtual world such as relationships between users on social networking sites such as Facebook. Similar users with SSIs can be characterized by almost larger numbers of members and more impersonal and virtual interactions.
Using this classification, users placed in the social circle of the target user can be seen as a group of similar users with PSIs or SSIs. The social circle of the target user is created from the contact list of the user’s smartphone, list of the user’s friends in SNs, senders and receivers of emails and text messages. The frequency and number of times that a user contacts the target user can define the strength of bonds existing in their social interactions. Although the social interaction can be further expanded in future research, in this paper, we considered only two categories (i.e., PSI and SSI) based on the frequent contact concept. If a person in the social circle of the target user contacts him/her more than once a week; then, the RS considers this person as a user with PSIs with the target user. After the labeling of target user’s PSIs, the rest of the target user’s social circle are classified as users with SSIs. As an example, consider the situation that {u1, u2, u3, u4} is extracted as the social circle of the target user X. If u2 has made a phone call to the user X three times a week, and u3 frequently sent an email to the user X last week, then, u2 and u3 are classified as the target user X’s PSIs. While u1 and u4 are labeled as users with SSIs.
It is assumed in this paper that the similarity between the target user and users with PSIs is greater than the similarity of users with SSIs. It appears obvious that the recommendations made by people who are in the group of similar users with PSIs would be considered more reliable than those made by the group of similar users with SSIs. Based on this assumption, we consider the trust in the recommendations made by the group of similar users with PSIs as being twice as much as those from the group of similar users with SSIs. However, if we don’t have a significant number (i.e., 30 [49]) of people in the social circle, the user clustering method is used and the trust weight is considered 1 again. Hence, the trust weights are considered as follows:
This trust weight can be used in computing the average rating for the new user based on the other similar users. The trust weight of the group of similar users with PSIs is set to twice as much as those from the group of similar users with SSIs for this paper, however, this value can be modified by users if they want to trust their social contacts more than their group of similar users. If the target user has two users and in his/her social circle of similar users with SSIs and PSIs respectively, the effect of the trust weight on their recommendation can be measured. Consider the case that user and gave ratings 4 and 5 to item and the trust weight is set to 3 instead of 2 for users with PSIs, here the user . In this situation, the final recommendation will be 9% closer to the rating given by user compared to that given in the situation that the trust weight has been set to 2 for users with PSIs. This value is 6% more than the rating from user in situation that the trust weight is set to 1.5 instead of 2 for users with PSIs.
4.2. User Profile Clustering
A variety of attributes can be included in the user profile to describe a user as context information. The greater the number of profile attributes, the better the understanding of the user. When the CSP occurs, finding implicit similarities between users addresses profile matching and user clustering. User profile clustering is an analytic process designed to explore users by discovering consistent patterns and/or systematic relationships between contexts, and then validate the findings by applying the detected patterns to new subsets of users. Generally, clustering algorithms can be categorized into partitioning methods, hierarchical methods, density-based methods, grid-based methods, and model-based methods. An excellent survey of clustering techniques can be found in a study done by Kameshwaran et al. [50].
Given a data set where is a pattern in the –dimensional feature space, and is the number of patterns in , then the clustering of is the partitioning of into clusters that satisfies the following conditions:
- Each pattern should be assigned to a user cluster, i.e., .
- Each user cluster has at least one context pattern assigned to it, i.e., .
- Each context pattern is assigned to one and only one user cluster, i.e., .
Clustering is the process of identifying clusters of users within multidimensional user profile data (contexts) based on feature space (i.e., user profile items) through similarity measure. The most popular way to evaluate a similarity measure is through the use of distance measures [51]. The most widely used distance measure is the Euclidean distance, defined as:
Recently, a huge increase in the use of Swarm-based optimization techniques for clustering has been observed [52]. Swarm Intelligence is an innovative distributed intelligent paradigm for solving optimization problems that were originally inspired by the biological examples of the swarming, flocking, and herding phenomena in vertebrates [53]. These techniques incorporate swarming behaviors observed in flocks of birds, schools of fish, swarms of bees, or even human social behavior, from which the idea emerged [54,55,56]. They can also be used especially when other methods are too expensive or difficult to implement [57]. For clustering of massive user profile data, we used artificial bee colony (ABC) algorithm because of its potential in solving complex optimization problems, flexibility, simplicity, self-organizing and extensibility [53,58]. To evaluate the performance of ABC, its performance is compared with K-means as a popular clustering algorithm in data mining [51].
A colony of honey bees can spread itself out over long distances to exploit a large number of food sources [53]. The foraging process begins in a colony by scout bees sent to search for promising flower patches. Flower patches with large amounts of nectar or pollen that can be collected with less effort tend to be visited by more bees, whereas patches with less nectar or pollen receive fewer visits from bees [57]. The artificial swarm bee colony clustering method exploits the search capability of the bee algorithm to overcome the local optimum problem of the –means algorithm. More specifically, its task is to search for the appropriate cluster centers (, ,…, ) so that the clustering metric (2) is minimized. The basic steps of this clustering operation are listed in the Table 4.
In the initialization stage (Step 1 in Table 4), a set of scout bee population () is randomly selected to define the clusters. The Euclidean distances between each user profile data pattern and all centers are calculated to determine the assigned cluster to each user profile. For example, in the case of the movie RS, user profile items such as movie genres and social circles are considered for the clustering. This way, initial clusters can be constructed. After the clusters have been formed, the original cluster centers are replaced by the actual centroids of the clusters to define a particular clustering solution i.e., a bee). This initialization process is applied each time new bees are created.
In Step 2 of Table 4, the fitness computation process is carried out for each site visited by a bee by calculating the clustering metric (2), which is inversely related to fitness.
Step 3 is the main step of bee colony optimization, which starts by forming a new population (Step 3a). In Step 3b, sites with the highest fitness are designated as “selected sites” and chosen for the neighborhood search. In Steps 3c and 3d, the algorithm conducts searches around the selected sites, assigning more bees to search in the area of the best sites. Selection of the best sites can be made directly according to their associated fitness. Alternatively, the fitness values are used to determine the probability of the sites being selected. Searches in the neighborhood of the best sites—those that represent the most promising solutions—are carried out in greater detail. As mentioned previously, this is done by recruiting more bees for the best sites than for the other selected sites. Together with scouting, this differential recruitment is a key operation of the bee algorithm. In Step 3d, only the bee that has found the site with the highest fitness (i.e., the “fittest” bee) will be selected to form part of the next bee population. In nature, there is no such restriction. The restriction is introduced here to reduce the number of points to be explored. In Step 3e, the remaining bees in the population are randomly assigned to the search space to scout for new potential solutions.
At the end of each loop, the colony will have two parts to its new population: representatives from the selected sites, and scout bees assigned to conduct random searches. These steps are repeated until the stopping criterion is met.
Each bee represents a potential user similarity clustering solution as a set of cluster centers, and each site represents the patterns or user profile data objects. The algorithm requires some parameters to be set, namely: number of scout bees (), number of sites selected for neighborhood searching (), number of top-rated () sites among selected sites (), number of bees recruited for the best sites (), number of bees recruited for the other () selected sites (), and the stopping criterion for the loop. In the Table 5, the list of initial values for the parameters are presented.
For the presented user dataset (Section 6), each of the ABC and -means algorithm is applied 30 times individually to a random initial solution. The parameters of all the algorithms are set as per Table 5. The sum of the intra-cluster distances, i.e., the distances between the data vectors within a cluster and the centroid of this cluster, as defined in (2), are used to measure the quality of a clustering. Clearly, the smaller the sum of the distances, the higher the quality of clustering. The effectiveness of stochastic algorithms is greatly dependent on the generation of the initial solutions. For every dataset, algorithms performed their own effectiveness tests 30 times individually, each time with randomly generated initial solutions. The values reported are the averages of the sums of intra-cluster distances and the fitness values of the worst and best solutions which can indicate the range of values that the algorithms span. Table 6 summarizes the intra-cluster distances and performance time on the server obtained from all the algorithms for the data sets above.
From the values in Table 6, we can conclude that the results obtained by ABC outperforms a -means clustering algorithm in both accuracy and the average time (number of iteration steps). A sample distribution in user clustering by the ABC algorithm is shown in Figure 3 in which the social circle cluster graphs are represented by lines. As seen from the Figure 3, cluster heads are uniformly selected by the ABC algorithm provided that clusters have regions that are approximately equal in size.
5. Proposed Recommender Algorithm
In the proposed RS, two spaces including user and item sets are defined. Let us consider the user set as and item set as . Detecting similarity between items and users and grouping items and users can be considered as basic tasks that should be done in a RS. In the item space, classes of similar items can be statically created by taking their hierarchical descriptive features into consideration. The applied categorization methodology to classify similar items is shown in Figure 4 as a hierarchical tree.
For the proposed recommender algorithm, we consider five different heterogeneous subsets of items in the main item set including movies, venues, events, music, and radio stations. Therefore, the combination of all the subsets is stated as follows:
In which, and define all of the items with a specific tag such as movie, venue, music, event, and radio station set. In addition, defines the number of items in a specific subset. If we consider the movie items recommender service, all of items placed in the movie set are categorized into eight different categories based on their genres as shown in Figure 4. If we explicitly recognize the movie genre that is interesting to the target user, then the CF recommender algorithm is used to recommend the target user the -top highly ranked movies in the desired genre. Let us consider this -top highly ranked list of recommended movies as matrix, . Given people in the social circle of the target user as a set defined by . Using their ratings for the item , a neighbor rating matrix is defined as follows:
In which is the ranking considered for item by user who is part of the similar user circle of user . For the proposed RS, if we have a significant number of people (the threshold is considered 30 persons [49]) in the social circle, social circle is used for user similarity evaluation. Otherwise, the user clustering method is used to find similar users with common interests.
It appears obvious that the recommendations made by people who are in the group of similar users with PSIs would be considered more reliable than those made by the group of similar users with SSIs. Based on the trust weight (1), the trust based average ranking for item is defined by as:
where is the trust weight for the user based on (1). After calculating the average ranking for all of the items, the preferred items are sorted. Recommending duplicated items which users have already interacted with is considered inefficient recommendations [59]. For example, if the target user has already watched a movie, recommending the same movie is ineffective. To overcome this problem, we consider a post-processing mechanism based on historical information to remove duplicated items. If a user has already watched a movie, that information is stored in the database. After preparing the -top highly ranked recommendations, we will compare the recommendation list with historical information in the database. For the duplicated item, we will replace it with the next highly ranked recommendation.
Challenging Scenario Examples
In the first scenario, consider the situation that a user has no explicit preferences in relation to movies genres or the user signs up for our RS for the first time. This means that data collected by the user’s personal network was not explicitly express user’s preferences. This problem is a widely known as the CSP. In this situation instead of relying on explicit user preferences, the likeliest preferred option from the user’s social circle is going to be extracted. It is worth noting that the functionality of our proposed RSs does not only depend on data extracted from SNs. Social interactions between users can be extracted either from their social interaction in SNs (i.e., users with SSI) or their real-world social interactions (i.e., users with PSI). We aim to find out the average preference of the target user’s social circle for each category of movie genre. If the social circle of the target user is shown as , their personal preferences are extracted from their dynamic profiles. As seen in Figure 4, there are eight different movie genres. Thus, we define the user preference matrix as follows:
In which defines the number of movie genres including, action, horror, war, drama, adventure, comedy, and historical films. Note that is a numerical index that depicts whether the user is interested in movie genre or not. Taking both the group of similar users with PSIs and SSIs into consideration, we can apply a similar trust criterion to calculate the weighted average preference as follows:
In which shows the weight assigned to the user using the (1) and shows the weighted average preference of all the social users for the movie genre . After calculating the weighted average preference matrix for the target user , we can then identify the genre with the highest preference. Next, we consider this explored genre as the user more likely preferred genre and calculate the weighted average ratings for items associated with this specific genre. Finally, we would use the proposed recommender algorithm to provide the target user with the -top highly ranked movies. It is worth noting that the recommendation process is initialized using the average preferences to face the cold start problem. However, the user profile is dynamic and can be updated by new preferences extracted by the context reasoning engine. For example, when the target user explicitly shows his/her interest in a specific movie genre, the new information will be used in the recommendation process.
For the second scenario, as the most challenging scenario of existing the CSP, consider the situation in which none of the people in the social circle of the target user have no explicit preference with regard to the area of movies. Although the possibility of such a situation occurring is negligible, our system can address this problem as well. In this situation, there is no way to extract a possible user preference with regards to the area of movies. Clustering similar users based on their profiles using the ABC approach can address this problem. Thus, people placed in the same cluster with the target user are not necessarily people in his or her social circle. This means that the social circle defines the interaction between people, whereas people placed in the same cluster do not possess such interaction and similarity. In other words, we applied ABC to cluster all the users based on their implicit similarities in terms of contextual information extracted from the dynamic user profiles. The integration of ABC user clustering in USDE can be considered as an alternative solution to address the CSP in situations that there are no information explicitly express user preferences to initialize the recommendation process. After identifying similar users, we can then deal with this scenario in a way similar to the first scenario.
6. Experiments and Results
To evaluate the functionality of the proposed RS, after describing the datasets and data provided by user’s smart devices, we evaluate the proposed RS in comparison with the other two of the most widely applied recommender algorithms. Finally, the CSP is considered to examine the ability of the proposed USDE in different scenarios.
6.1. Updating User Profile
Data used for this research is gathered from the Manhattan Island area located in New York City (NYC) and includes six data sources which are described in Table 7. The data sets needed to be cleaned and preprocessed to remove outliers and irrelevant data [60]. Irrelevant data columns were ignored to reduce data dimensionality and only relevant attributes were chosen from the available data sets [60].
The datasets described in Table 7 are considered general-purpose datasets that will be used for evaluating the performance of both the proposed movie RS and the USDE. Different datasets in this paper can be classified into two main categories. The first category is collected by smartphones to extract desired contexts, so called context related datasets. These contexts will then be used to update user profiles. The second category will be stored in the cloud database as the metadata information, so called meta datasets.
6.1.1. Context Related Datasets
The first dataset is collected by smartphones. An Android mobile application is developed. A total of 150 users, so called “application users”, were asked to install the developed application on their mobile phones and register in the system. They can register in the system using their email address, a combination of their first and last name, or their phone number. As seen in Figure 5, the developed application is mainly responsible to collect data, extract profile items describing users’ preferences, and extract their social circles. In the next step, identity information of all users in the social circle of the application user will be hashed using secure hash algorithms (SHA)-512 function and finally, a JSON payload will be sent to the RS.
In this experiment, 63 of application users have used their Google Home smart speakers. This dataset, as the second dataset, consists of users’ communications with their personal Google Home smart speaker. The My Google Activity platform (https://myactivity.google.com/myactivity) is the Google cloud storage that is helping users rediscover translations of their communication with their Google Assistants including, Google Home smart speakers. We extracted 56,769 rows of information from July 01, 2018 to August 30, 2018, from the data provided by Google Home devices. In addition, 135 of application users have utilized their smart watches. This dataset, as the third dataset, is then processed by the developed application to extract desired contexts such as mobility level. In this research, Google Fit APIs (https://developers.google.com/fit) is used to access historical data provided by smart wearables paired with Android devices. Totally 7832 rows of information are extracted from users’ smart watches/bands which were including diverse attributes ranging from their total burned calories to average heart rate. More details about the data collected from smart watches and speakers are given in Table 7. A rule engine is then applied to extract contextual information such as user activities from the data collected by smart-watches/bands.
Different services are developed in the proposed mobile application to extract the social circle of the user. The social circle dataset, as the fourth dataset, includes users who are either in the contact list of the user’s smart phone, call log history, or extracted from social networks (e.g., Facebook using the Facebook API [61]). We extracted 2,813,940 social links between 189,106 users by using the Graph API [61]. This group of users is called “contact users”. For example, if the user “X” installed the mobile application, this user is called the application user. As an example, the user “X” might have a contact like “John W: +1 (123) 456–1111” in his/her contact list. Therefore, “John W” is recognized as the contact user for the application user “X”. It is worth mentioning that users are required to grant the Android application permission to access each of the aforementioned services ranging from their Google activities to internally stored data in their smartphones. In this experiment, totally 189,106 users (including 150 application users and 188,956 contact users) are extracted by using the proposed mobile application on all 150 application users’ mobile phones.
The Google Home and smart watch datasets are used to create and update the user profile. In other words, profile items are assigned to the application users and then a JSON payload including the user profile and his/her social circle is sent by application users. As the application user requests for movie recommendations, a list of hashed information of the user social circle and also his/her updated profile information will be sent to the server. Three different keys have been used to secure user identity using secure hash algorithms (SHA)-512 function. These keys can be “first name +’ ‘+ last name”, “phone number”, and “email address”. For example, the user “X” as an application user might have a contact user in the contact list of his/her smart phone like “Y: +1 587 664 XXXX”. In this case, both “first name + ‘ ‘ + last name” and the “phone number” will be hashed separately using the SHA-512 hash function. In addition, user “Y” registered in the system using his phone number, as an example. Therefore, his phone number will be hashed, and, it will be assigned to the user as his userID. This userID refers to the user “Y” for any further communication with the server. Since user “Y” identity information (i.e., his phone number) is hashed using the same SHA-512 function in both smartphones, userID will be the same in both datasets. The cloud database is designed in such a way that when user information is sent to the cloud, it will firstly look for the same hashed information in all three different keys. If it finds the same hashed information in each of those three keys, it does not create a new user and only updates information. Otherwise, it will create a new user and store information for this user. Using the above algorithm assures that the identity of users will be kept anonymized in the cloud database. In addition, the system can recognize two or more users as the same user in different JSON payloads as long as their hashed information is the same.
6.1.2. Meta Datasets
The fifth data source was collected by Foursquare LBSN (https://foursquare.com/). This dataset was created using the collection of data for user check-ins in NYC over a period of approximately 10 months between April 12, 2012 to February 16, 2013 [10]. Although this dataset consists of information such as User ID, Venue ID, and coordinated universal time (UTC), for all of the check-ins, we only considered the name, semantic category, and GPS coordinates of venues as relevant information. In other words, this dataset contains metadata of venues located in NYC. Finally, the movie dataset, as the sixth dataset, was extracted from the Internet Movie Database (IMDb (https://www.imdb.com/)) in June 2018. Although this dataset covers all the movies from the last century, only movies that were released between 2016 to 2018 were selected. This database is freely available in [62] and contains different attributes such as movie_title, director_name(s), genres, language, country, year, actor_1_name, actor_2_name, actor_3_name, and average user ratings. In other words, this dataset contains metadata of movies.
The profile information is only extracted and updated for application users using their mobile phones. Therefore, it is obvious that there is no profile information with regards to the most of contact users in the cloud database. We used the word “most” because some of the users who are in the social circle of application users are application users as well. For example, “Sarah” has “Steve” in her social circle. “Steve” is an application user as well. Steve’s profile should be empty as a contact user in Sara’s social circle. However, Steve’s profile is not empty because he is an application user at the same time.
To fill empty profile information of contact users in terms of their preferences in movie genres, other publicly available datasets are used as Meta datasets. This dataset is used to fill empty profile information with real data. This dataset, called “Movie Dataset” (https://www.kaggle.com/rounakbanik/the–movies–dataset), contains 26 million ratings from 270,000 users for 45,000 IMDB movies and extracted from the official GroupLens website. A random unique ID between 1 and 188,956 is assigned to each of the contact users that do not have any information showing their preferences in movie genres. Then, all rated movies in the “Movie Dataset” is extracted where the userID equals to the unique randomly assigned userID for the contact users. The second meta dataset is the Foursquare user check-ins dataset (i.e., Foursquare dataset). A similar process will be done to fill user check-ins information for the contact users who do not have any information showing their check-ins information. By doing these two procedures, it is assumed that the profile information is filled out for the contact users using real data extracted from the official GroupLens website and Foursquare LBSN. Finally, MySQL is chosen as one of the most popular open-source relational database management systems to store the collected data [26]. Detailed information on datasets that have been used in this study is summarized in Table 7.
6.2. Evaluation of the Proposed Recommendation System
To prove the functionality of the proposed RS, we compared our RS with two of the most widely applied recommender algorithms: the rating-based CF and the item-based CF. As seen in Table 8, to evaluate the quality of the movie recommendations, 1080 users who rated at least 30 movies were selected from the general purpose database, described in Section 6.1. This sampling condition of selecting users who has rated at least 30 movies is used to avoid the CSP. The impact of existing CSP will be investigated in Section 6.3.
To evaluate different RSs, we used five criteria including: mean absolute error (10), normalized mean absolute error (11), precision (12), recall (13) and inter-diversity measures (14) [13] as described in Table 9. Let’s consider movie recommendations as one of the provided services. We can then show -top recommended movies to the user by , as a subset of movie items already rated by the target user in the validation set, with as the cardinality of set . Let M be a set of user-item pairs for which the recommender algorithm made the prediction.
Cross-validation is one of the most commonly used techniques to evaluate and compare the performance of different algorithms [64]. For this study, the quality of the proposed recommendation algorithm, item-based CF, and rating-based CF is evaluated by the five-fold cross-validation technique. In this technique, sample data is partitioned into complementary subsets (which is equal to five here) [65]. The recommender algorithm then performs its analysis on the training set, following which the validation analysis will be done on the other remaining subset. As a rule [66], the size of the validation set should be less than the size of the training set. Hence, we chose to use 20% and 80% respectively. Our sample dataset was shuffled and partitioned into five equal-sized sets namely, , , , , and . Then, each of the mentioned subsets used for testing the performance of the RS was put through five rounds. After five rounds, the five calculated results were averaged to produce a single estimation. In other words, the average outcome will be the aggregated result from all of the five-folds.
The five-fold cross-validation technique is used to evaluate the proposed RS. The user set is randomly split into five disjoint subsets of 216 users. For each round, all the users in one of those subsets is chosen for the evaluation. The average value for all of the five rounds in the five-fold cross validation is the estimated performance of the recommender system. The average results of using five-fold cross-validation to evaluate the functionality of the proposed algorithm, item-based CF, and rating-based CF in the case of 10 movie recommendations are shown in Figure 6.
The length of the recommendation list plays an important role in the performance analysis [13]. In this paper, we evaluate the performance of all three RSs (i.e., the proposed algorithm, item-based CF, and rating-based CF) with different numbers of recommended items (i.e., ). The number of items on the recommendation list varies from ten to 50 with intervals of ten. Figure 7a–c show the accuracy comparison between three RSs.
Figure 7a illustrates how the proposed algorithm achieves better NMAE when the number of recommended items is lower than 30. Although increasing the number of recommended items results in reducing the accuracy of our proposed algorithm, the accuracy of the proposed algorithm does not differ significantly from the other two methods. We believe that the underlying reason for this gradual decline of the accuracy of our proposed algorithm lies in the utilization of more personalized features to find similar users. In other words, when the user personalized features become larger, the number of recognized similar users is reduced. On the other hand, a larger desired number of recommendation items requires finding more users similar to the target user. Although applying more personalized descriptive features to find similar users results in a higher level of personalization, recognizing larger numbers of populations of similar users is also more difficult. Hence by increasing the number of expected items in the recommendation list, the accuracy of the proposed method gradually declines. As both item-based and rating-based CF follows the same approach to identify similar users, the value of the NMAE for both is similar. Figure 7b–c show that the accuracy of our proposed recommender algorithm is better than the others for when . The best precision and recall values are when the desired number of recommended items is ten. In this case, we can conclude that the three methods present the maximum discrepancy in their accuracy. Besides the accuracy evaluation of three RSs, Figure 7d depicts the personalization level of RSs. Figure 7d illustrates that the proposed method provides the most personalized recommendations for different users.
6.3. Evaluation of the Proposed USDE under CSP
The previous experiments have been carried out in a situation in which there were no cold start problems in the evaluation process. For example, let us look at the situation in which there are three users in our proposed RS namely, , , and . Their preferences in movies are clearly detected and stored in their user profile as per those listed in Table 10. In this situation, all three RSs can provide a list of movie recommendations for these three users because their preferences are explicitly expressed in their profiles. However, if there is a new registered user, for example, user who does not have any rating or any chosen movie item we will face the CSP.
In this situation, item-based and rating-based CF algorithms wants to apply cosine similarity technique to cluster similar users. However, the lack of descriptive information about user D results in a sparse user-item rating matrix and consequently recommendations will be randomly prepared without being personalized for this user. However, our proposed USDE faces the CSP without any drops in the accuracy of the RS. More specifically, different types of social relationships and contextual information in their profile is used to find similar users and predict their most likely preferences. Considering the situation in which we detect that user D has user A in his/her primary group of socially connected users, we can then predict that user D has similar preferences to user A and thus, like user A, is most probably interested in the movie genres of science-fiction, action, and drama.
To evaluate the functionality of our proposed USDE, it will be compared with other popular similarity measures (i.e., cosine similarity and Pearson’s correlation [30]) in the case of existing the CSP and data sparsity problem. To include more advanced similarity detection methods (e.g., using demographic data and social interactions [37]), a context-aware similarity detection engine (CSDE) is also compared with the proposed USDE. These different similarity measures are applied in a CF-based RS and compared to evaluate their performance. For this evaluation, the publicly available MovieLens [39] data set was used and the cold start and data sparsity situation was created artificially (Table 11). This dataset of users who have rated at least 20 movies was generated on 26 September 2019. For the artificial dataset, we randomly chose 488 users (i.e., 80% of users) and considered only 10% of all possible ratings that means the sparsity level is 0.9 for 80% of users. For the rest 20% of users, 10% of users (i.e., 61 users) were considered with no ratings as cold start users and only one rating was assigned to the remaining 10% of users. The number of users’ ratings for both original MovieLens and artificial datasets is shown in Figure 8.
As MovieLens data doesn’t demographic data or social interactions, we artificially simulated those attributes. As the MovieLens dataset includes users who had rated at least 20 movies, the cosine similarity measure has been applied on the MovieLens dataset to obtain a list of 10 similar users for each of 610 users. Using the list of 10 similar users the social interactions, demographic data, and mostly preferred movie genre have been artificially created and assigned to users. The cosine similarity and Pearson’s correlation measures will consider artificial ratings while CSDE considers social interactions and demographic data as well.
In this section, the mean absolute error (MAE) of the different user similarity measures are compared. The result of applying all four similarity measures on both MoveLens and artificial datasets is summarized in Table 12. For the MovieLens dataset, CSDE is showing slightly better performance than our proposed USDE. The reason is that CSDE considers social interactions between users and also demographic data as additional information to find similar users. However, the proposed USDE is showing better performance than the cosine similarity and Pearson’s correlation measures. On the other hand, the proposed USDE outperforms the other three similarity measures when the artificial dataset is used. As there is only one movie in the co-rated movie set between two users, Pearson correlation cannot be calculated, and cosine similarity considers similar users regardless of the difference between ratings. Our experimental results show that the proposed USDE outperforms the cosine similarity method by 23%, Pearson’s correlation by 25.33%, and CSDE by 17.66% under the cold start and data sparsity situations.
7. Conclusions and Future Work
In this paper, we proposed a mobile recommender system as a single framework for integrating the potential of smart devices together with social networks. Utilizing the potential of smart devices in our proposed RS opens up new windows of opportunity for RSs. Using the primary contexts provided by users’ smart devices, the proposed RS does not rely anymore on a limited number of context providers (i.e., smartphones and tablets). Instead, all smart devices registered by users can be added to the RS daily. Creating an updated user profile that contains contexts extracted from users’ smart devices creates several advantages for our system. Firstly, by using data that is constantly being updated by the user’s smart devices, the issue of the changing nature of user preferences is addressed. Secondly, the proposed system is able to extract context (i.e., user heartbeat whilst performing different physical activities) that users were previously unable to report. Finally, the use of smart devices eliminates the need for any human intervention in data collection.
Providing more personalized recommendations and addressing the CSP are known as the most challenging issues for RSs. Reaching a better understanding of users can result in providing recommendations that are more in line with user preferences. Recent advances in RSs that include the integrating of context-awareness with traditional RSs have largely improved the functionality of RSs in relation to providing users with more personalized recommendations. However, the level of personalization provided by RSs can be further improved. For this research, a novel similarity detection engine is proposed and integrated into the CF-based RS in order to further improve the functionality of RSs.
In comparison to other studies that solely identify similar users by considering their interactions with items, we believe that social relationships can also be used to identify similar users. By utilizing the data provided by users’ smart devices for our proposed RS, our definition of similarity surpasses what has recently been provided by previous studies. In addition to the common social relationships (i.e., bidirectional social relationships in Facebook), we also consider closer relationships that users can have with phone calls and emails. In comparison to other similar studies, the similarity engine can identify the similarity between users by considering their close relationships that have been identified using data provided by their smart devices. Therefore, unlike other SN-based similarity detection engines, our proposed USDE identifies similar users even when the user does not have any social interactions on SNs. The results show that the proposed USDE outperforms the cosine similarity method by 23%, Pearson’s correlation by 25.33%, and the CSDE by 17.66%, in cold start and data sparsity situations.
In the other case with an existing CSP (i.e., the conditions in which the new user has just signed up with the RS, his/her preferences are not explicitly identified, and he/she has no social relations on SNs, or who are using smart devices), our USDE identifies similar users by using swarm artificial intelligence. By considering user profiles and applying the artificial bee colony method, the similarity detection engine is able to find similar users based on the minimum contextual information reported in their profiles. The comparison between the ABC and a K-means clustering method shows that the quality of the clustering is increased by 9.3%, whilst the average time is decreased. The effectiveness of stochastic algorithms is greatly dependent on the generation of the initial solutions. For every dataset, algorithms performed their own effectiveness tests 30 times individually, each time with randomly generated initial solutions.
Although our system provides recommendations for five different areas simultaneously, we chose to evaluate the performance of our system in the area of movie recommendations for this paper. We compared the performance of the proposed recommender algorithm with two widely used recommender algorithms: the rating-based CF and the item-based CF. In comparison to those RSs, the precision and personalization levels of the proposed RS increased by four percent and 4.5 percent respectively.
Although increasing the level of personalization would result in greater user satisfaction, finding an increased number of similar users would be more arduous. As a result, when the number of recommended items increases, the performance of the proposed algorithm would be affected. Thus, proposing a suitable level of personalization related to the number of required recommendation items will be a challenging topic for future studies on context-aware RS. For this study, the simplest user-related contextual information ( time, location, and user activity) is extracted. However, by adding more complex rules to the context reasoning engine, it is possible to infer more complicated contextual information. Association rules between the users and their respective dynamic information from their smart devices can be mined; such rules provide learning capability for the system which in turn improves system reliability and robustness. As the quality of data provided by smart wearables varies depending on different manufacturers, improving the methods used in [2,3] on USDE and RS is on hold for future work. User privacy and data secrecy protection is another direction for future research, especially in relation to user privacy in the cloud [67]. To apply the proposed recommender system to large scale and industry-ready products, a detailed scalable user privacy research needs to be conducted especially on cloud and resource-constrained devices. Although privacy protection is out of the scope of this paper, we applied basic authentication and authorization security preserving techniques and user ID anonymization in different aspects of the proposed RS. Investigation of all existing security mechanisms to protect user privacy is also on hold for future work.
Author Contributions
This paper is part of a Ph.D. thesis written by Soroush Ojagh under the supervision of Mohammad Reza Malek. Soroush Ojagh jointly designed and developed the architecture and conceptual model of the proposed recommendation system. He implemented the user similarity detection engine based on social interactions and investigated experimental results. Mohammad Reza Malek conceived the main idea presented in this paper. He contributed to the architecture design and reviewed experimental results. Sara Saeedi designed, developed, and investigated the Artificial Bee Colony method in user profile clustering and contributed regarding experimental design. Soroush Ojagh took the lead in writing the manuscript. All authors provided critical feedback and helped shape the research, analysis, and manuscript. Also, All authors have read and agreed to the published version of the manuscript.
Funding
This research was supported by the K.N.Toosi University of Technology, grant number 107/1292, and in part by the GeoSensorWeb Lab at the University of Calgary.
Acknowledgments
The authors would like to acknowledge Steve Liang, director of the GeoSensorWeb lab at the University of Calgary for supporting this research, providing guidance and constructive comments while Soroush Ojagh was at the GeoSensorWeb Lab as a visiting Ph.D. student.
Conflicts of Interest
The authors declare no conflict of interest.
References
- Roopa, M.; Pattar, S.; Buyya, R.; Venugopal, K.R.; Iyengar, S.; Patnaik, L. Social Internet of Things (SIoT): Foundations, thrust areas, systematic review and future directions. Comput. Commun. 2019, 139, 32–57. [Google Scholar]
- Malek, M.R.; Frank, A.U. A mobile computing approach for navigation purposes. In International Symposium on Web and Wireless Geographical Information Systems; Springer: Berlin/Heidelberg, Germany, 2006; pp. 123–134. [Google Scholar]
- Mohammadi, N.; Malek, M. VGI and reference data correspondence based on location-orientation rotary descriptor and segment matching. Trans. GIS 2015, 19, 619–639. [Google Scholar] [CrossRef]
- Ursino, D.; Virgili, L. Humanizing IoT: Defining the Profile and the Reliability of a Thing in a Multi-IoT Scenario. In Toward Social Internet of Things (SIoT): Enabling Technologies, Architectures and Applications; Springer: Cham, Switzerland, 2020; pp. 51–76. [Google Scholar]
- Bao, J.; Zheng, Y.; Wilkie, D.; Mokbel, M. Recommendations in location-based social networks: A survey. GeoInformatica 2015, 19, 525–565. [Google Scholar] [CrossRef]
- Erdeniz, S.P.; Menychtas, A.; Maglogiannis, I.; Felfernig, A.; Tran, T.N.T. Recommender systems for IoT enabled quantified-self applications. Evol. Syst. 2019, 11, 291–304. [Google Scholar] [CrossRef] [Green Version]
- Raghuwanshi, S.K.; Pateriya, R. Recommendation Systems: Techniques, Challenges, Application, and Evaluation. In Soft Computing for Problem Solving; Springer: Singapore, 2019; pp. 151–164. [Google Scholar]
- Shao, Y.; Xie, Y.-H. Research on cold-start problem of collaborative filtering algorithm. In Proceedings of the 2019 3rd International Conference on Big Data Research, Paris, France, 27–29 November 2019; pp. 67–71. [Google Scholar]
- Rodas-Silva, J.; Galindo, J.A.; García-Gutiérrez, J.; Benavides, D.J.I.A. Selection of software product line implementation components using recommender systems: An application to Wordpress. IEEE Access 2019, 7, 69226–69245. [Google Scholar] [CrossRef]
- Yang, D.; Zhang, D.; Yu, Z.; Yu, Z. Fine-grained preference-aware location search leveraging crowdsourced digital footprints from LBSNs. In Proceedings of the 2013 ACM International Joint Conference on Pervasive and Ubiquitous Computing, Zurich, Switzerland, 8–12 September 2013; pp. 479–488. [Google Scholar]
- Serrat, O. Social network analysis. In Knowledge Solutions; Springer: Singapore, 2017; pp. 39–43. [Google Scholar]
- Zhang, Y.; Shi, Z.; Zuo, W.; Yue, L.; Liang, S.; Li, X.J.N. Joint Personalized Markov Chains with Social Network Embedding for Cold-Start Recommendation. Neurocomputing 2019, 386, 208–220. [Google Scholar] [CrossRef]
- Zhang, J.; Peng, Q.; Sun, S.; Liu, C. Collaborative filtering recommendation algorithm based on user preference derived from item domain features. Phys. A Stat. Mech. Appl. 2014, 396, 66–76. [Google Scholar] [CrossRef]
- Zhang, S.; Lv, Q. Hybrid EGU-based group event participation prediction in event-based social networks. Knowl. Based Syst. 2018, 143, 19–29. [Google Scholar] [CrossRef]
- Khrouf, H.; Troncy, R. Hybrid event recommendation using linked data and user diversity. In Proceedings of the 7th ACM Conference on Recommender Systems, Hong Kong, China, 12–16 October 2013; pp. 185–192. [Google Scholar]
- Ramirez-Garcia, X.; García-Valdez, M. Post-filtering for a restaurant context-aware recommender system. In Recent Advances on Hybrid Approaches for Designing Intelligent Systems; Springer: Cham, Switzerland, 2014; pp. 695–707. [Google Scholar]
- Xu, M.; Liu, S. Semantic-enhanced and Context-aware Hybrid Collaborative Filtering for Event Recommendation in Event-based Social Networks. IEEE Access 2019, 7, 17493–17502. [Google Scholar] [CrossRef]
- Ojagh, S.; Malek, M.R.; Saeedi, S.; Liang, S. A location-based orientation-aware recommender system using IoT smart devices and Social Networks. Future Gener. Comput. Syst. 2020, 108, 97–118. [Google Scholar] [CrossRef]
- Hosseinpour, M.; Malek, M.R.; Claramunt, C. Socio-spatial influence maximization in location-based social networks. Future Gener. Comput. Syst. 2019, 101, 304–314. [Google Scholar] [CrossRef]
- Torrijos, S.; Bellogín, A.; Sánchez, P. Discovering Related Users in Location-Based Social Networks. In Proceedings of the User Modeling, Adaptation, and Personalization-28th International Conference, UMAP, Genoa, Italy, 12–18 July 2020; pp. 12–18. [Google Scholar]
- Ravi, L.; Subramaniyaswamy, V.; Vijayakumar, V.; Chen, S.; Karmel, A.; Devarajan, M. Hybrid location-based recommender system for mobility and travel planning. Mob. Netw. Appl. 2019, 24, 1226–1239. [Google Scholar] [CrossRef]
- Braunhofer, M.; Ricci, F. Context-aware recommender systems are information filtering and decision support applications that generate recommendations by exploiting context-dependent user preference data, such as ratings augmented with the description of the contextual situation detected when the user experienced the item. In fact, many contextual factors (e.g., weather, season, mood or companion) may potentially affect the. Inf. Technol. Tour. 2017, 17, 101–119. [Google Scholar]
- Wu, W.; Zhao, J.; Zhang, C.; Meng, F.; Zhang, Z.; Zhang, Y.; Sun, Q. Improving performance of tensor-based context-aware recommenders using Bias Tensor Factorization with context feature auto-encoding. Knowl. Based Syst. 2017, 128, 71–77. [Google Scholar] [CrossRef]
- Panniello, U.; Tuzhilin, A.; Gorgoglione, M. Comparing context-aware recommender systems in terms of accuracy and diversity. User Modeling UserAdapt. Interact. 2014, 24, 35–65. [Google Scholar] [CrossRef]
- Adomavicius, G.; Tuzhilin, A. Context-aware recommender systems. In Recommender Systems Handbook; Springer: Boston, MA, USA, 2011; pp. 217–253. [Google Scholar]
- Colombo-Mendoza, L.O.; Valencia-García, R.; Rodríguez-González, A.; Alor-Hernández, G.; Samper-Zapater, J.J. RecomMetz: A context-aware knowledge-based mobile recommender system for movie showtimes. Expert Syst. Appl. 2015, 42, 1202–1222. [Google Scholar] [CrossRef]
- Eirinaki, M.; Gao, J.; Varlamis, I.; Tserpes, K. Recommender Systems for Large-Scale Social Networks: A Review of Challenges and Solutions; Elsevier: Amsterdam, The Netherlands, 2018. [Google Scholar]
- Liu, L. Services computing: From cloud services, mobile services to internet of services. IEEE Trans. Serv. Comput. 2016, 9, 661–663. [Google Scholar] [CrossRef]
- Cui, Z.; Xu, X.; Xue, F.; Cai, X.; Cao, Y.; Zhang, W.; Chen, J. Personalized Recommendation System based on Collaborative Filtering for IoT Scenarios. IEEE Trans. Serv. Comput. 2020, 13, 685–695. [Google Scholar] [CrossRef]
- Ahn, H.J. A new similarity measure for collaborative filtering to alleviate the new user cold-starting problem. Inf. Sci. 2008, 178, 37–51. [Google Scholar] [CrossRef]
- Fernández-Tobías, I.; Cantador, I.; Tomeo, P.; Anelli, V.W.; Di Noia, T. Addressing the user cold start with cross-domain collaborative filtering: Exploiting item metadata in matrix factorization. User Modeling UserAdapt. Interact. 2019, 29, 443–486. [Google Scholar] [CrossRef]
- Akama, S.; Kudo, Y.; Murai, T. Neighbor Selection for User-Based Collaborative Filtering Using Covering-Based Rough Sets. In Topics in Rough Set Theory; Springer: Cham, Switzerland, 2020; pp. 141–159. [Google Scholar]
- Xue, F.; He, X.; Wang, X.; Xu, J.; Liu, K.; Hong, R. Deep item-based collaborative filtering for top-n recommendation. ACM Trans. Inf. Syst. (TOIS) 2019, 37, 1–25. [Google Scholar] [CrossRef] [Green Version]
- Amato, F.; Moscato, V.; Picariello, A.; Piccialli, F. SOS: A multimedia recommender System for Online Social networks. Future Gener. Comput. Syst. 2017, 93, 914–9223. [Google Scholar] [CrossRef]
- de Carvalho, L.C.; Rodrigues, F.; Oliveira, P. A Hybrid Recommendation Algorithm to Address the Cold Start Problem. In Proceedings of the International Conference on Hybrid Intelligent Systems; Springer: Cham, Switzerland, 2018; pp. 260–271. [Google Scholar]
- Allioui, Y.E. A novel approach to solve the new user cold-start problem in recommender systems using collaborative filtering. Int. J. Sci. Eng. Res. 2017, 8, 273–281. [Google Scholar]
- Chatzidimitris, T.; Gavalas, D.; Kasapakis, V.; Konstantopoulos, C.; Kypriadis, D.; Pantziou, G.; Zaroliagis, C.J.P.; Computing, U. A Location History-Aware Recommender System for Smart Retail Environments; Personal and Ubiquitous Computing: London, UK, 2020; pp. 1–12. [Google Scholar]
- Herlocker, J.L.; Konstan, J.A.; Terveen, L.G.; Riedl, J.T. Evaluating collaborative filtering recommender systems. ACM Trans. Inf. Syst. (TOIS) 2004, 22, 5–53. [Google Scholar] [CrossRef]
- Harper, F.M.; Konstan, J.A. The MovieLens Datasets: History and Context. ACM Trans. Interact. Intell. Syst. 2015, 5, 1–19. [Google Scholar] [CrossRef]
- Yu, X.; Pan, A.; Tang, L.-A.; Li, Z.; Han, J. Geo-friends recommendation in gps-based cyber-physical social network. In Proceedings of the 2011 International Conference on Advances in Social Networks Analysis and Mining, Kaohsiung, Taiwan, 25–27 July 2011; pp. 361–368. [Google Scholar]
- Xiao, X.; Zheng, Y.; Luo, Q.; Xie, X. Inferring social ties between users with human location history. J. Ambient Intell. Humaniz. Comput. 2014, 5, 3–19. [Google Scholar] [CrossRef]
- Adomavicius, G.; Sankaranarayanan, R.; Sen, S.; Tuzhilin, A. Incorporating contextual information in recommender systems using a multidimensional approach. ACM Trans. Inf. Syst. (TOIS) 2005, 23, 103–145. [Google Scholar] [CrossRef] [Green Version]
- Saeedi, S.; Moussa, A.; El-Sheimy, N. Context-aware personal navigation using embedded sensor fusion in smartphones. Sensors 2014, 14, 5742–5767. [Google Scholar] [CrossRef]
- Alfred, V. Algorithms for finding patterns in strings. Algorithms Complex. 2014, 1, 255. [Google Scholar]
- Nusret Buluş, H.; Uzun, E.; Doruk, A. Comparison of String Matching Algorithms in Web Documents. In Proceedings of the 2017 International Scientific, Gabrovo, Bulgaria, 17–18 November 2017; Volume 2, pp. 279–282. [Google Scholar]
- Pandiselvam, P.; Marimuthu, T.; Lawrance, R. A Comparative Study on String Matching Algorithm of Biological Sequences. In Proceedings of the International Conference on Intelligent Computing, Taiyuan, China, 3–6 August 2014. [Google Scholar]
- Ehatisham-ul-Haq, M.; Azam, M.A.; Naeem, U.; Amin, Y.; Loo, J. Continuous authentication of smartphone users based on activity pattern recognition using passive mobile sensing. J. Netw. Comput. Appl. 2018, 109, 24–35. [Google Scholar] [CrossRef] [Green Version]
- Elsesser, K.; Peplau, L.A. The glass partition: Obstacles to cross-sex friendships at work. Hum. Relat. 2006, 59, 1077–1100. [Google Scholar] [CrossRef] [Green Version]
- Kar, S.S.; Ramalingam, A. Is 30 the magic number? Issues in sample size estimation. Natl. J. Community Med. 2013, 4, 175–179. [Google Scholar]
- Kameshwaran, K.; Malarvizhi, K. Survey on clustering techniques in data mining. Int. J. Comput. Sci. Inf. Technol. 2014, 5, 2272–2276. [Google Scholar]
- Abraham, A.; Grosan, C.; Ramos, V. Swarm Intelligence in Data Mining (Studies in Computational Intelligence); Springer: Berlin/Heidelberg, Germany, 2006; Volume 34. [Google Scholar]
- Katarya, R. Movie recommender system with metaheuristic artificial bee. Neural Comput. Appl. 2018, 30, 1983–1990. [Google Scholar] [CrossRef]
- Saeedi, S.; Samadzadegan, F.; El-Sheimy, N. Object extraction from lidar data using an artificial swarm bee colony clustering algorithm. CMRT09 IAPRS 2009, 38, 133–138. [Google Scholar]
- Zhongzhi, S. A clustering algorithm based on swarm intelligence. In Proceedings of the Info-tech and Info-net, 2001. ICII 2001-Beijing. 2001 International Conferences, Beijing, China, 29 October–01 November 2001; pp. 58–66. [Google Scholar]
- Pham, D.T.; Ghanbarzadeh, A.; Koç, E.; Otri, S.; Rahim, S.; Zaidi, M. The Bees Algorithm—A Novel Tool for Complex Optimisation Problems. In Intelligent Production Machines Systems; Elsevier: Amsterdam, The Netherlands, 2006; pp. 454–459. [Google Scholar]
- Paterlini, S.; Krink, T. Differential evolution and particle swarm optimisation in partitional clustering. Comput. Stat. Data Anal. 2006, 50, 1220–1247. [Google Scholar] [CrossRef]
- Roy, A.; Tavana, M.; Banerjee, S.; Caprio, D.D. A secured context-aware tourism recommender system using artificial bee colony and simulated annealing. Int. J. Appl. Manag. Sci. 2016, 8, 93–113. [Google Scholar] [CrossRef]
- Gao, W. Improved ant colony clustering algorithm and its performance study. Comput. Intell. Neurosci. 2016, 2016, 1–14. [Google Scholar] [CrossRef] [Green Version]
- Zhou, T.; Su, R.Q.; Liu, R.R.; Jiang, L.L.; Wang, B.H.; Zhang, Y.C. Accurate and diverse recommendations via eliminating redundant correlations. New J. Phys. 2009, 11, 123008. [Google Scholar] [CrossRef]
- Han, J.; Pei, J.; Kamber, M. Data Mining: Concepts and Techniques; Elsevier: Amsterdam, The Netherlands, 2011. [Google Scholar]
- Facebook. Facebook for Developers, Graph API. Available online: https://developers.facebook.com/docs/graph-api/overview (accessed on 1 March 2020).
- IMDB. IMBD Datasets. Available online: https://www.imdb.com/interfaces/ (accessed on 1 June 2020).
- Goldberg, K.; Roeder, T.; Gupta, D.; Perkins, C. Eigentaste: A constant time collaborative filtering algorithm. Inf. Retr. 2001, 4, 133–151. [Google Scholar] [CrossRef]
- Salam Patrous, Z.; Najafi, S. Evaluating Prediction Accuracy for Collaborative Filtering Algorithms in Recommender Systems; KTH Royal Institute of Technology: Stockholm, Sweden, 2016. [Google Scholar]
- Refaeilzadeh, P.; Tang, L.; Liu, H. Cross-validation. In Encyclopedia of Database Systems; Springer: New York, NY, USA, 2009; pp. 532–538. [Google Scholar]
- Ignatov, D.I.; Poelmans, J.; Dedene, G.; Viaene, S. A new cross-validation technique to evaluate quality of recommender systems. In Perception and Machine Intelligence; Springer: Berlin/Heidelberg, Germany, 2012; pp. 195–202. [Google Scholar]
- Au, M.H.; Liang, K.; Liu, J.K.; Lu, R.; Ning, J. Privacy-preserving personal data operation on mobile cloud—Chances and challenges over advanced persistent threat. Future Gener. Comput. Syst. 2018, 79, 337–349. [Google Scholar] [CrossRef]
Figure 1.
System architecture for a hybrid recommender system based on the social interactions and smart devices.
Figure 1.
System architecture for a hybrid recommender system based on the social interactions and smart devices.

Figure 2.
Context categorization applied to create the user profile.

Figure 3.
User distribution and clustering: (a) a graph representation of user clustering result by applying the ABC algorithm in the situation we do not have any other information to explicitly recognize similar users; (b) research geographic area which shows user geographic distribution, their check-in information, and similar users to the target user extracted from the ABC clustering as indicated by the pink solid lines.

Figure 4.
Categorization of different types of heterogeneous items based on their descriptive features.
Figure 4.
Categorization of different types of heterogeneous items based on their descriptive features.

Figure 5.
The swim-lane diagram showing the process flow of the proposed system.

Figure 6.
The average performance of the proposed algorithm in comparison with item-based collaborative filtering (CF) and rating-based CF.
Figure 6.
The average performance of the proposed algorithm in comparison with item-based collaborative filtering (CF) and rating-based CF.

Figure 7.
Performance evaluation of the proposed algorithm versus rating-based CF and item-based CF algorithm where Q is the number of recommended items; (a) normalized mean absolute error (NMAE); (b) precision; (c) recall; and (d) inter-diversity criteria comparison.
Figure 7.
Performance evaluation of the proposed algorithm versus rating-based CF and item-based CF algorithm where Q is the number of recommended items; (a) normalized mean absolute error (NMAE); (b) precision; (c) recall; and (d) inter-diversity criteria comparison.

Figure 8.
MovieLens and artificial datasets in terms of the number of cold start users and data sparsity: (a) MovieLens dataset of users who have rated at least 20 movies; (b) artificial dataset that includes 80% of users with 10% of their available ratings, 10% cold start users and 10% of users with a single rating.


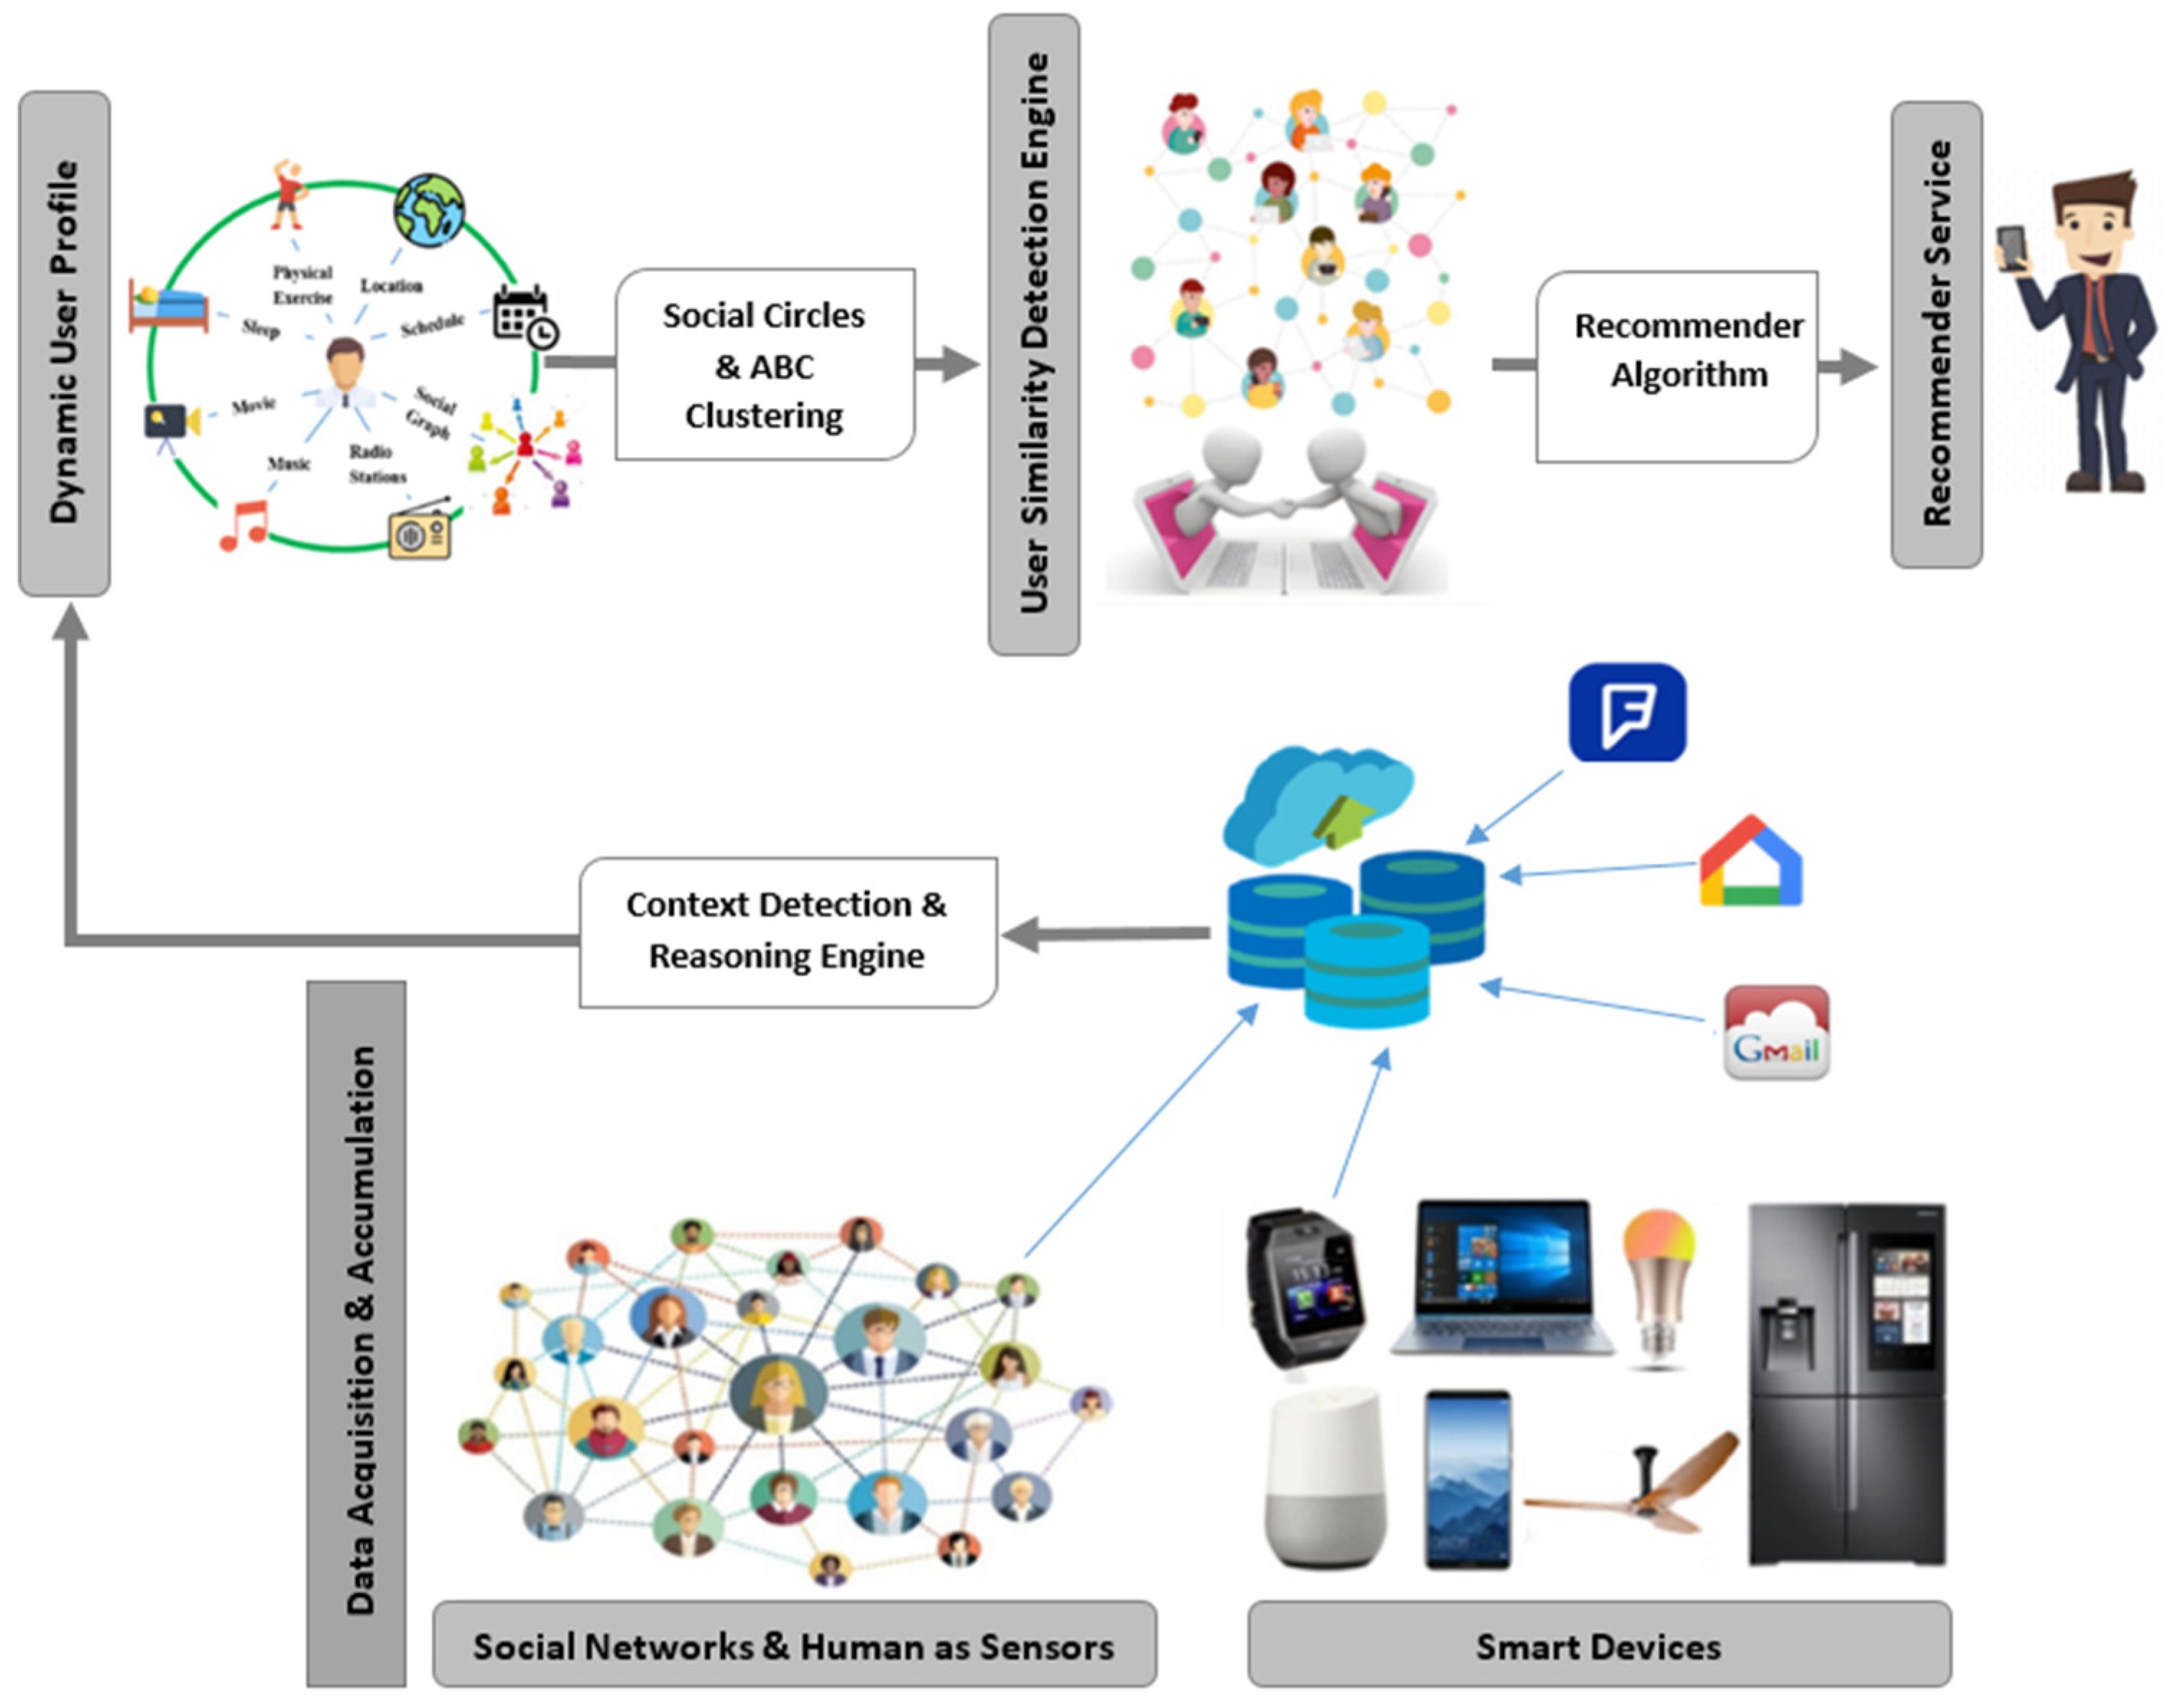
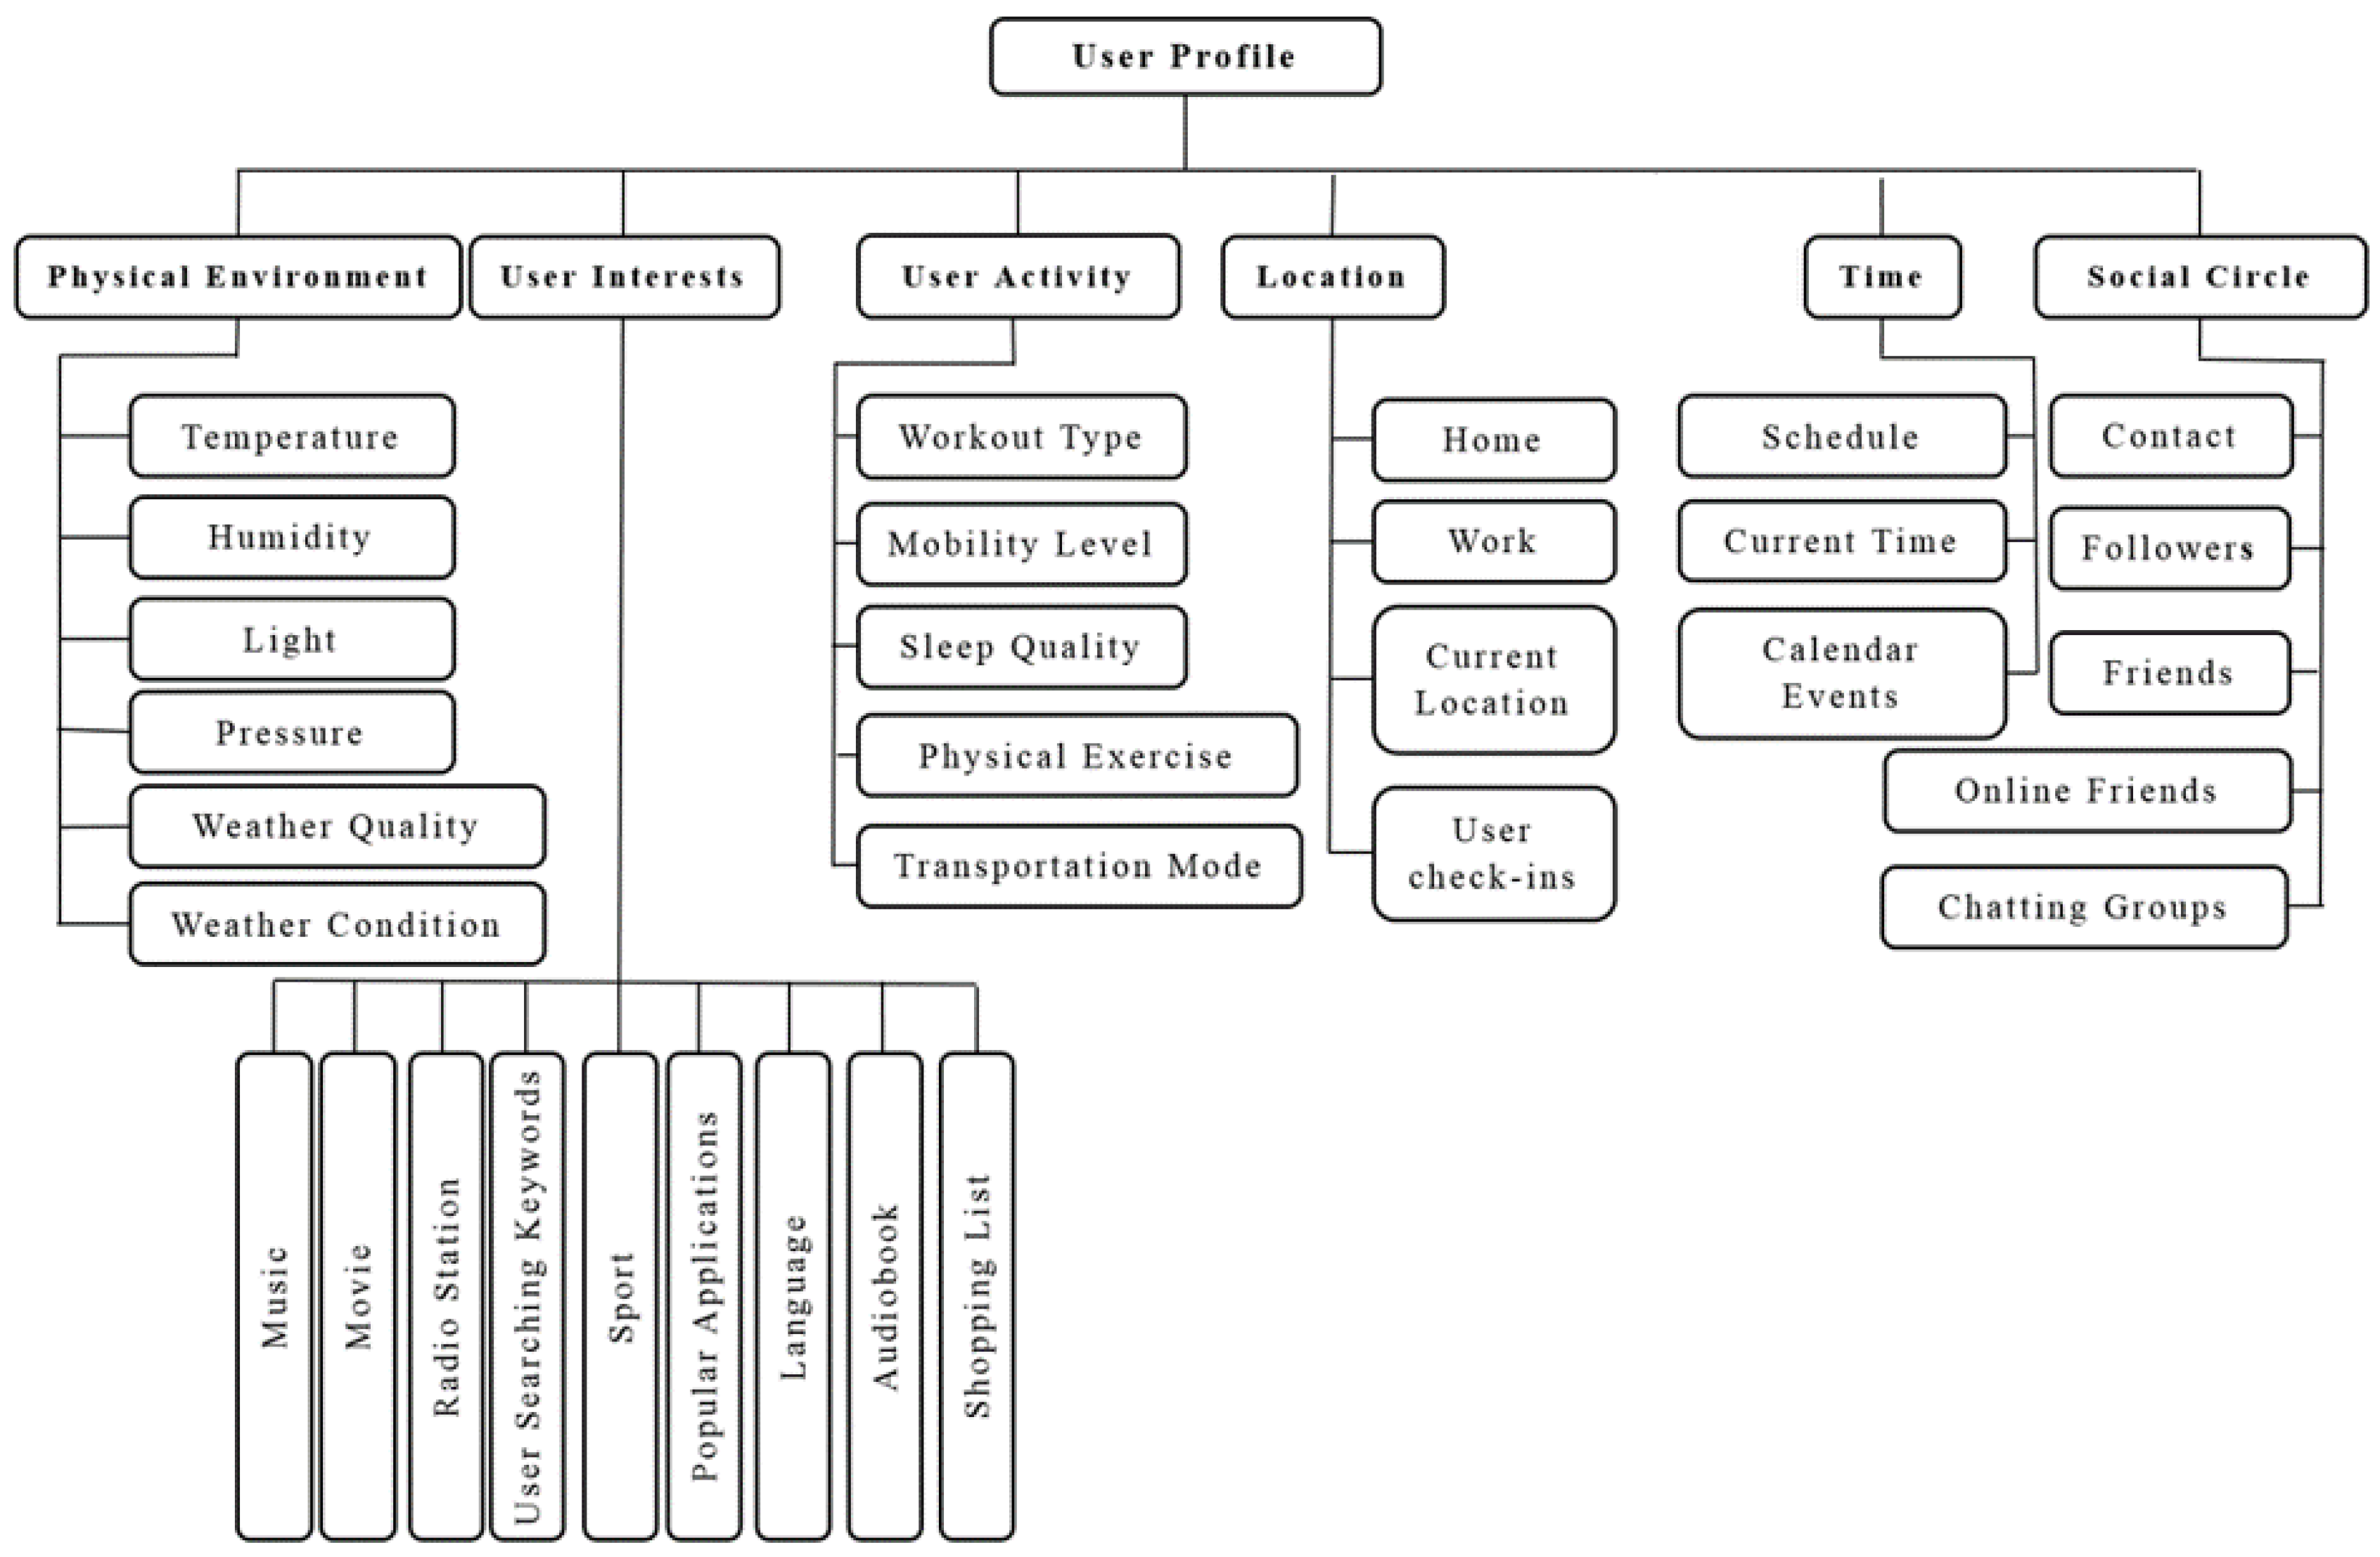
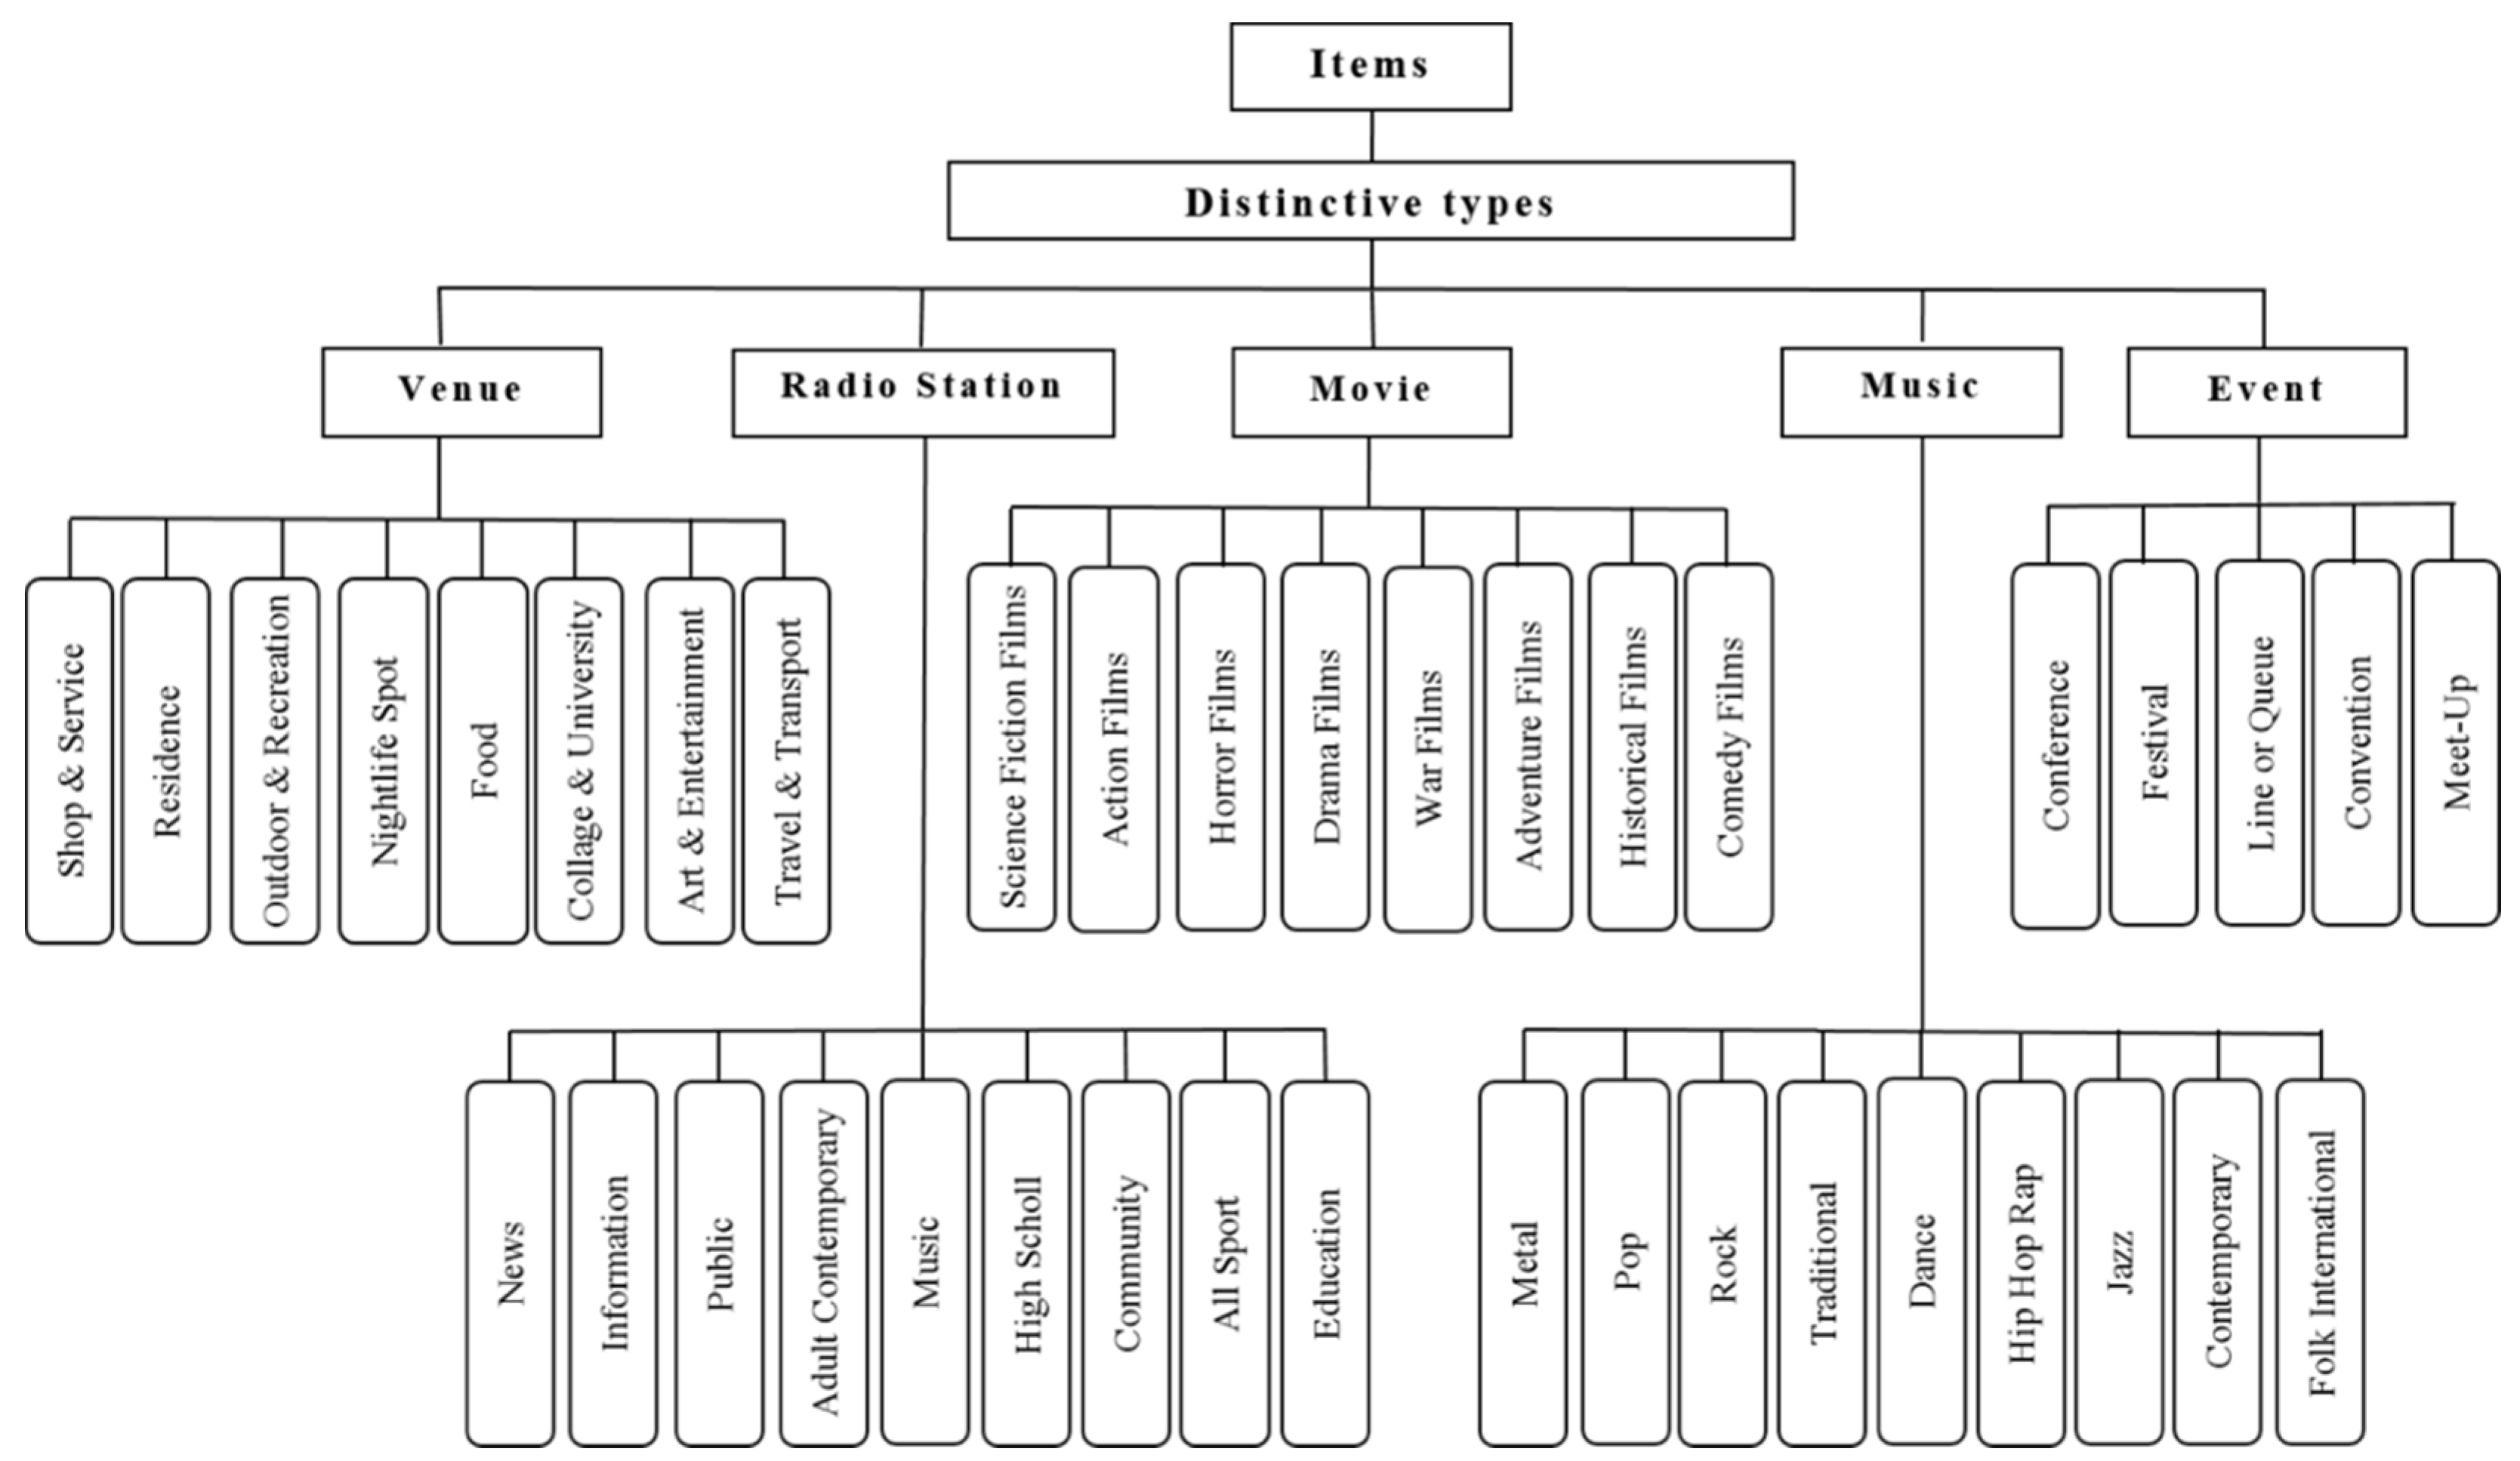
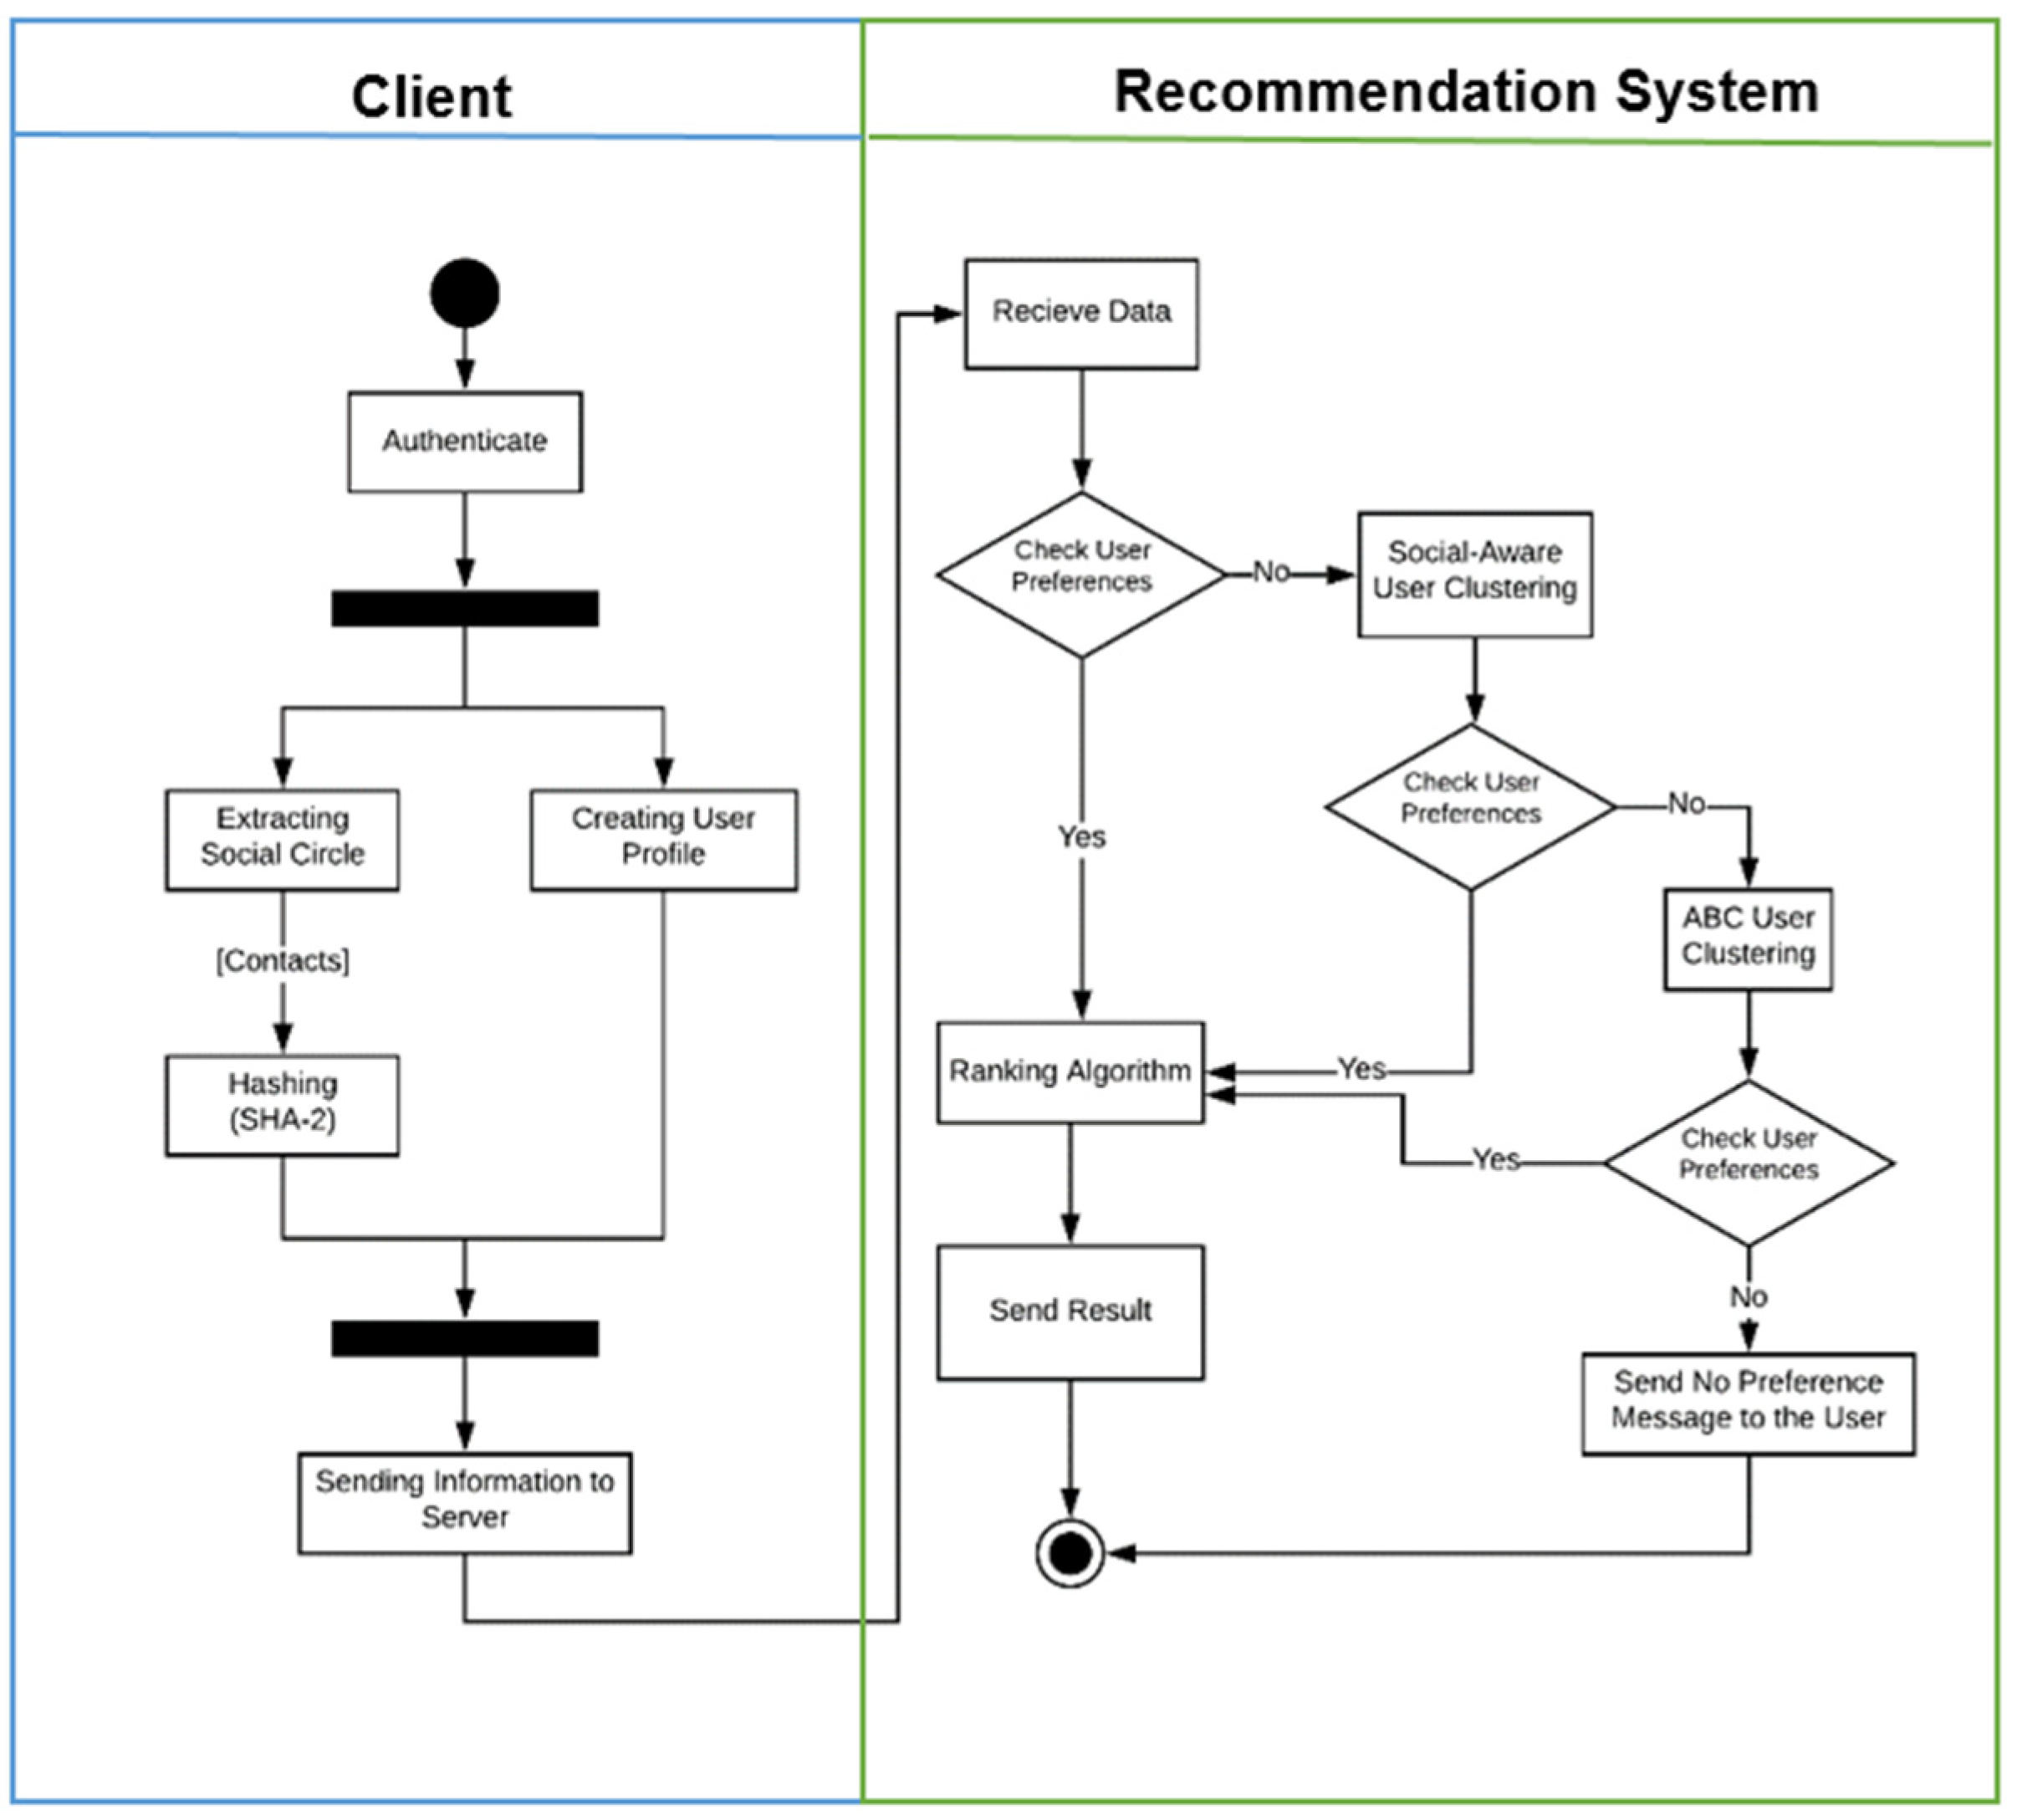
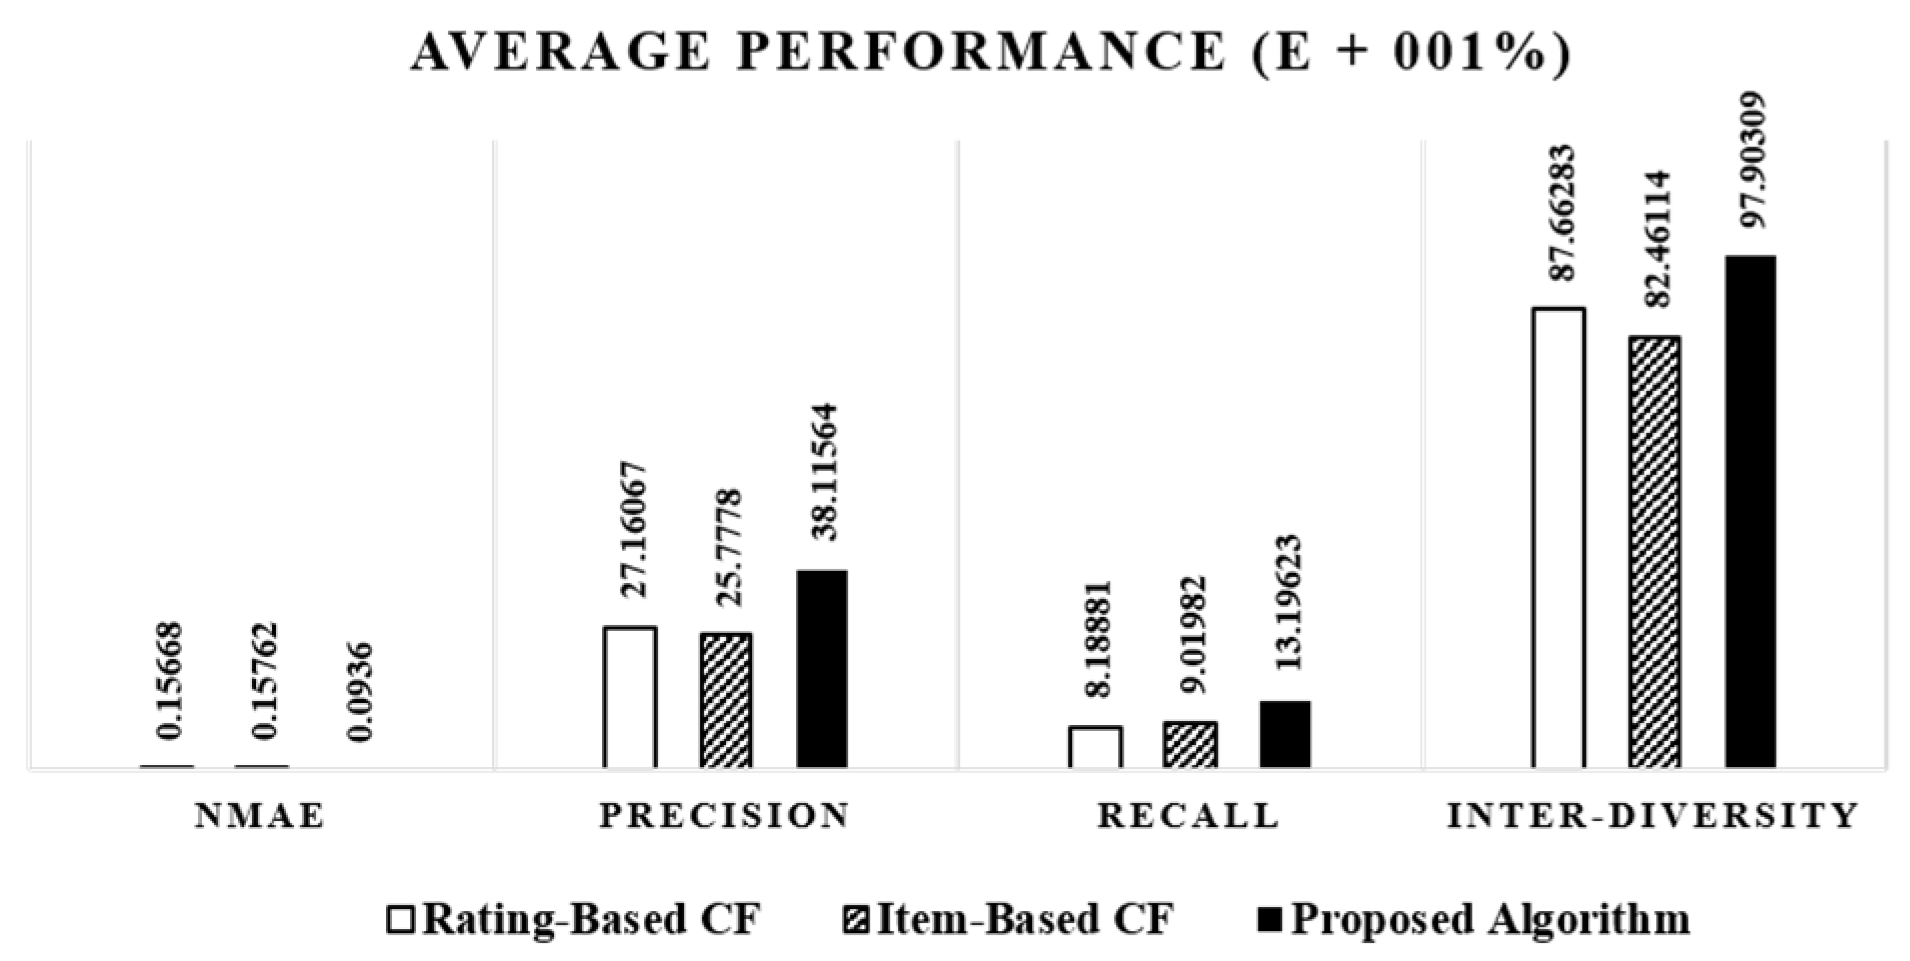
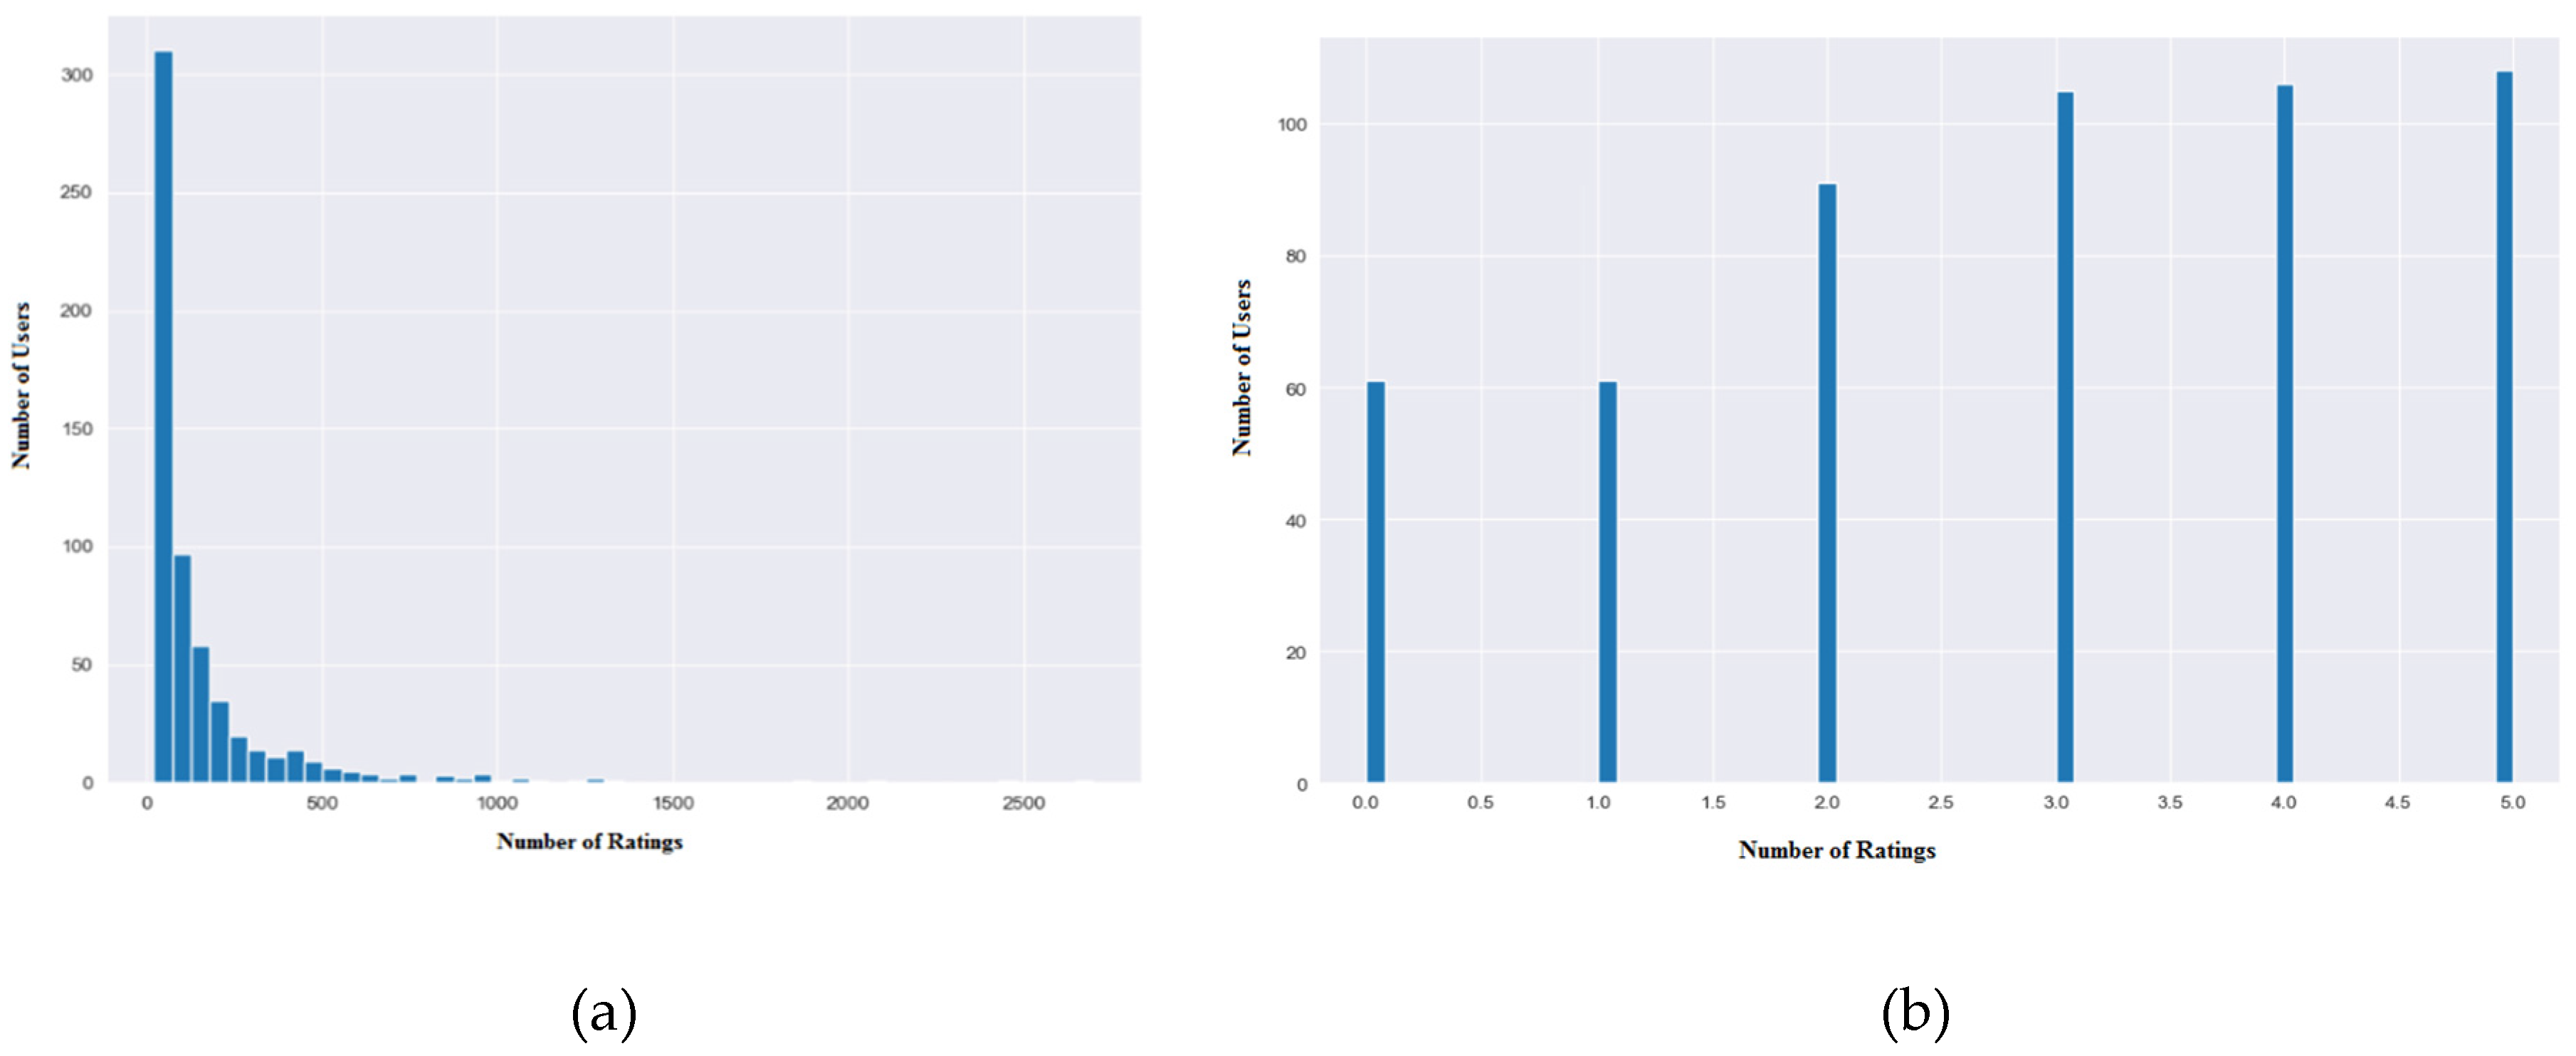
Table 1.
Mostly applied similarity measures [30].
Table 1.
Mostly applied similarity measures [30].
| Similarity Measure | Equation | Description |
|---|---|---|
| Cosine | is the rating given by user to item , and is the number of items in the co-rated item set. | |
| Pearson’s Correlation | is the rating given by user to item , is the average rating given by , and is the number of items in the co-rated item set. | |
| Spearman’s Rank Correlation | is the difference in ranks given by two users to item , and is the number of items in the co-rated item set. |
Table 2.
Knuth–Morris–Pratt Algorithm to extract users’ played movies from Google Home’s textual dataset.
Table 2.
Knuth–Morris–Pratt Algorithm to extract users’ played movies from Google Home’s textual dataset.
| Algorithm Extract—Movie Names: |
|---|
| input: |
| a pattern include characters, W(the pattern used to extract the name of user’s played movies) |
| an array of characters, S (the raw data retrieved from Google Home) |
| Output: |
| an array of integers, P (positions in S at which W is found) |
| an integer nP (number of positions) |
| define variables: |
| an integer, j ← 0 (the position of the current character in S) |
| an integer, k ← 0 (the position of the current character in W) |
| an integer, l ← 0 (the number of line in S) |
| an array of integers, T (the table, computed elsewhere) |
| an array of strings, O (extracted user’s played movies) |
| let nP ← 0 |
| while j < length(S) do |
| if W[k] = S[j] then |
| let j ← j + 1 |
| let k ← k + 1 |
| if k = length(W) then |
| T[nP] ← the next word after found pattern (For example the next word after the word “Play or Watch”) |
| let l ← l + 1, nP ← nP + 1, P[nP] ← j − k, |
| else |
| let k ← T[k] |
Table 3.
Examples of applied rules in the context reasoning layer.
| Primary Context | Context Source | Rule-Based Inference | Higher Level Context |
|---|---|---|---|
| Movie Names | Google Home | If user plays movie X and the movie genre of movie X is G, then user interests in movie genre G. | Movie Genre |
| Check-ins | Smartphone | If user visits venue V and its semantic category is S, then user interests in venues with semantic category of S. | Semantic Venue Category |
| Physical Activities | Smart Watch | If the number of user’s daily steps is between 5000–10,000, or if the total number of miles moved is between two to four miles per day, and the user’s heartbeat is between 110–130 beats per minutes, then the user mobility level is average. | Mobility level |
Table 4.
The basic steps of the artificial bee colony clustering method.
End While. |
Table 5.
Parameters used in the user clustering using swarm artificial bee colony (ABC) algorithm.
| Parameters | Parameters Value |
|---|---|
| Number of Scout Bees, | 35 |
| Number of Sites Selected for Neighborhood Search, | 11 |
| Number of Best “Elite” Sites Out of Selected Sites, | 2 |
| Number of Bees Recruited for Best Sites, | 7 |
| Number of Bees Recruited for the Other () Selected Sites, | 3 |
| Number of Iterations, | 200 |
Table 6.
Comparison of intra-cluster distances for ABC and K–means clustering algorithms.
| Evaluation Parameters | ABC Clustering Algorithm | K-Means Clustering Algorithm |
|---|---|---|
| Average Intra-Cluster Distances | 9.3208e + 001 | 1.0605e + 002 |
| Worst Intra-Cluster Distances | 9.3244e + 001 | 1.5605e + 002 |
| Best Intra-Cluster Distances | 9.3203e + 001 | 9.6333e + 001 |
| Average Number of Clusters (k) | 27 | 15 |
| Average Time (sec) | 0.29 | 0.48 |
Table 7.
List of different data sources applied in this study.
| Data Sets | Data Columns | User Profile Context | Description | |
|---|---|---|---|---|
| Foursquare | Venue’s
|
|
| This dataset provides location information for 72,490 venues in NYC |
|
| Social links between 189,106 users were extracted from Facebook | ||
| IMDB | Movie’s
|
|
| All movie-related information for 5043 movies extracted from the dataset provided by IMDB |
| Smart- Watch/Band |
|
|
| Data extracted from 135 smart-watches fed into a context reasoning rule engine |
| Google Home |
|
|
| Extracted and analyzed 56,769 data rows collected by Google Homes to provide user contextual information |
| Smartphone/Tablet |
|
|
| Developed an android application to extract the desired data from a smartphone or tablet |
Table 8.
Applied dataset for evaluating the quality of movie recommendations.
| Users | Movies | Rating Scale | Ratings |
|---|---|---|---|
| 1080 | 1432 | 1–5 | 115,777 |
Table 9.
Evaluation metrics.
| Evaluation Measures | Equations | Description |
|---|---|---|
| Mean Absolute Error | Let M be a set of user-item pairs for which the recommender algorithm made the prediction. If is the predicted value for how the user rates item , and is the raw rating of item by the user , and denotes the cardinality of set M. | |
| Normalized Mean Absolute Error | and depict the maximum and minimum values in the rating range (e.g., [0–5]). The smaller the NMAE, the higher the accuracy for the recommender algorithm. | |
| Precision | This is defined as the ratio of the total number of items appearing in both and to the total number of [63]. is the total number of users. A higher value for the Precision means better performance and higher accuracy. | |
| Recall | The recall measure is defined as the ratio of the total number of items appearing in both and to the number of [63]. Similar to the precision measure, a higher value for the recall means a better performance and higher accuracy for the recommender algorithm. | |
| Inter-diversity measure () | and are recommendation lists for users and , is the length of the recommendation list, and is the Inter-diversity measure between the two aforementioned users. Thus, RS with greater provides a more personalized recommendation for different users. |
Table 10.
User preferences in movie genres extracted from user personal profiles.
| User | Preference in Movie Genres |
|---|---|
| A | 1: Science-Fiction, 3: Action, 4: Drama |
| B | 1: Horror, 2: War, 3: Adventure, 4: Drama |
| C | 1: Action, 2: War |
| D | Not Defined |
Table 11.
Summary of datasets for user similarity detection engine (USDE) comparison.
| Dataset | Users | Movies | Ratings | Rating Scale |
|---|---|---|---|---|
| MovieLens [39] | 610 | 9742 | 100,836 | 1–5 |
| Artificial dataset | 610 | 246 | 1554 | 1–5 |
Table 12.
Summary of mean absolute error (MAE) for various datasets.
| Measure | Full Ratings | Users with 2 to 5 Ratings | Users with 1 Rating | Cold Start Users |
|---|---|---|---|---|
| Cosine | 0.78 | 0.81 | 0.91 | 0.97 |
| Pearson’s Correlation | 0.69 | 0.84 | 0.93 | 0.99 |
| CSDE | 0.62 | 0.79 | 0.87 | 0.87 |
| USDE | 0.65 | 0.68 | 0.67 | 0.65 |
© 2020 by the authors. Licensee MDPI, Basel, Switzerland. This article is an open access article distributed under the terms and conditions of the Creative Commons Attribution (CC BY) license (http://creativecommons.org/licenses/by/4.0/).
Share and Cite
MDPI and ACS Style
Ojagh, S.; Malek, M.R.; Saeedi, S. A Social–Aware Recommender System Based on User’s Personal Smart Devices. ISPRS Int. J. Geo-Inf. 2020, 9, 519. https://0-doi-org.brum.beds.ac.uk/10.3390/ijgi9090519
AMA Style
Ojagh S, Malek MR, Saeedi S. A Social–Aware Recommender System Based on User’s Personal Smart Devices. ISPRS International Journal of Geo-Information. 2020; 9(9):519. https://0-doi-org.brum.beds.ac.uk/10.3390/ijgi9090519
Chicago/Turabian StyleOjagh, Soroush, Mohammad Reza Malek, and Sara Saeedi. 2020. "A Social–Aware Recommender System Based on User’s Personal Smart Devices" ISPRS International Journal of Geo-Information 9, no. 9: 519. https://0-doi-org.brum.beds.ac.uk/10.3390/ijgi9090519
Note that from the first issue of 2016, this journal uses article numbers instead of page numbers. See further details here.