1. Introduction
The Arctic has undergone dramatic changes over the recent decade in conjunction with a warming climate. The Arctic Ocean sea ice extent reaches its maximum in spring and minimum during the fall, mostly in March and September, respectively. Some of the record low values of sea ice extent in September have been recorded in the last decade. As a result, there has been a lot of studies investigating the effect of low sea ice in summer and fall. The Arctic Ocean has lost 40% of its multiyear ice between 2004 and 2009 [
1]. In 2007, the year with the second lowest sea ice area during the satellite record, the highest mean SAT on record was observed over the Arctic [
2]. The overall pattern of warming is generally characterized by lower SAT anomalies in lower latitude regions and higher SAT anomalies over the Arctic, known as Arctic Amplification [
3,
4,
5,
6,
7,
8]. Advective transport is among the major causes of enhanced Arctic warming [
5,
9,
10,
11]. Variations in the atmospheric circulation represented by the Arctic Oscillation [
12] and modulated by the Pacific Decadal Oscillation also influence recent spatial patterns of temperature change [
13]. Several recent studies also indicate that a spatial transformation of the atmospheric circulation, described by the 201CArctic Rapid Change Pattern201D for the entire Northern Hemisphere [
10], or “Arctic Dipole” for the Arctic Ocean [
14], can substantially amplify Arctic warming and decrease sea ice.
Herman and Johnson [
15] in a global modeling study found, by imposing pan-Arctic maximum and minimum sea-ice edge variations, that sea-ice extent anomalies are correlated with atmospheric pressure anomalies. Decreased sea ice also causes increased surface heat fluxes and an increase of SAT due to ice-albedo feedbacks [
3,
4,
16,
17]. Although the strongest decay of Arctic sea ice is in summer and fall, the largest surface flux and temperature responses were found in winter over the Atlantic-Asian region of the Arctic [
6,
18,
19].
Consequences of changes in Arctic sea ice are not limited to the Arctic region only; there is evidence that these changes in Arctic sea ice affect lower latitudes through circulation anomalies by altering large-scale patterns of variability such as the Arctic Oscillation and the North Atlantic Oscillation or exciting Rossby wave train propagation [
20,
21,
22,
23,
24,
25,
26,
27,
28,
29,
30,
31]. Petoukhov and Semenov [
32] show that decreased sea ice in the Barents and Kara seas can change the atmospheric circulation and can cause severe cold events. Dethloff at al. [
33] argued that changes in surface processes impact global climate systems through an atmospheric wave bridge between the Arctic and lower latitudes.
In addition to the changes in the large-scale atmospheric circulation, much attention has been recently paid to extreme weather events in the mid-latitudes, which are generally driven by synoptic weather systems including storms and anticyclones. Thus, mid-latitude extreme weather events could be linked to changes in Arctic sea ice through changes in extratropical cyclone activity. Observational data analysis and climate model simulations indicate an overall poleward shift of storm tracks and an intensification of storm activity in northern high latitudes and the Arctic along with a warming climate [
34,
35,
36,
37,
38,
39]. However, Semmler et al. [
40] show reduced cyclone activity over the Arctic in autumn and they argue that sea ice decline cannot explain all of the changes in the Northern Hemisphere storm tracks. A closer examination further suggests a strong regional and seasonal dependence of storm activity [
35], which may cause various extreme weather events. Severe cold winters with intensified anticyclones and weakened cyclones have been observed over the mid-latitudes (especially Eurasia) in recent years [
41].
However, there have been only a few attempts to identify the discrete role of Arctic sea ice in the variability and changes in Northern Hemisphere extratropical storm activities over different high and mid-latitude regions in spring when the sea ice extent is at its maximum peak of the seasonal variability.
In this study, we investigate changes in extratropical storms in response to the observed Arctic sea ice change and variability in spring (March–May) using a global climate model. The corresponding changes in surface climate are also examined. To this end, we adopted a Lagrangian approach [
35] to study the storm tracks. The changes in storm activity can also impact surface climate. Thus, we further examine the changes in surface climate parameters such as SAT, surface wind, and total precipitation over the mid-latitudes and the Arctic.
2. Model Experiment Designs and Data Analysis Method
We employed the National Center for Atmospheric Research (NCAR) Community Atmosphere Model (CAM) version 3.1_p2 [
42,
43]. For our modeling experiments, we configured the model at T85 resolution (approximately 1.4° in both latitude and longitude) with 26 vertical levels. Monthly SST and sea ice data sets [
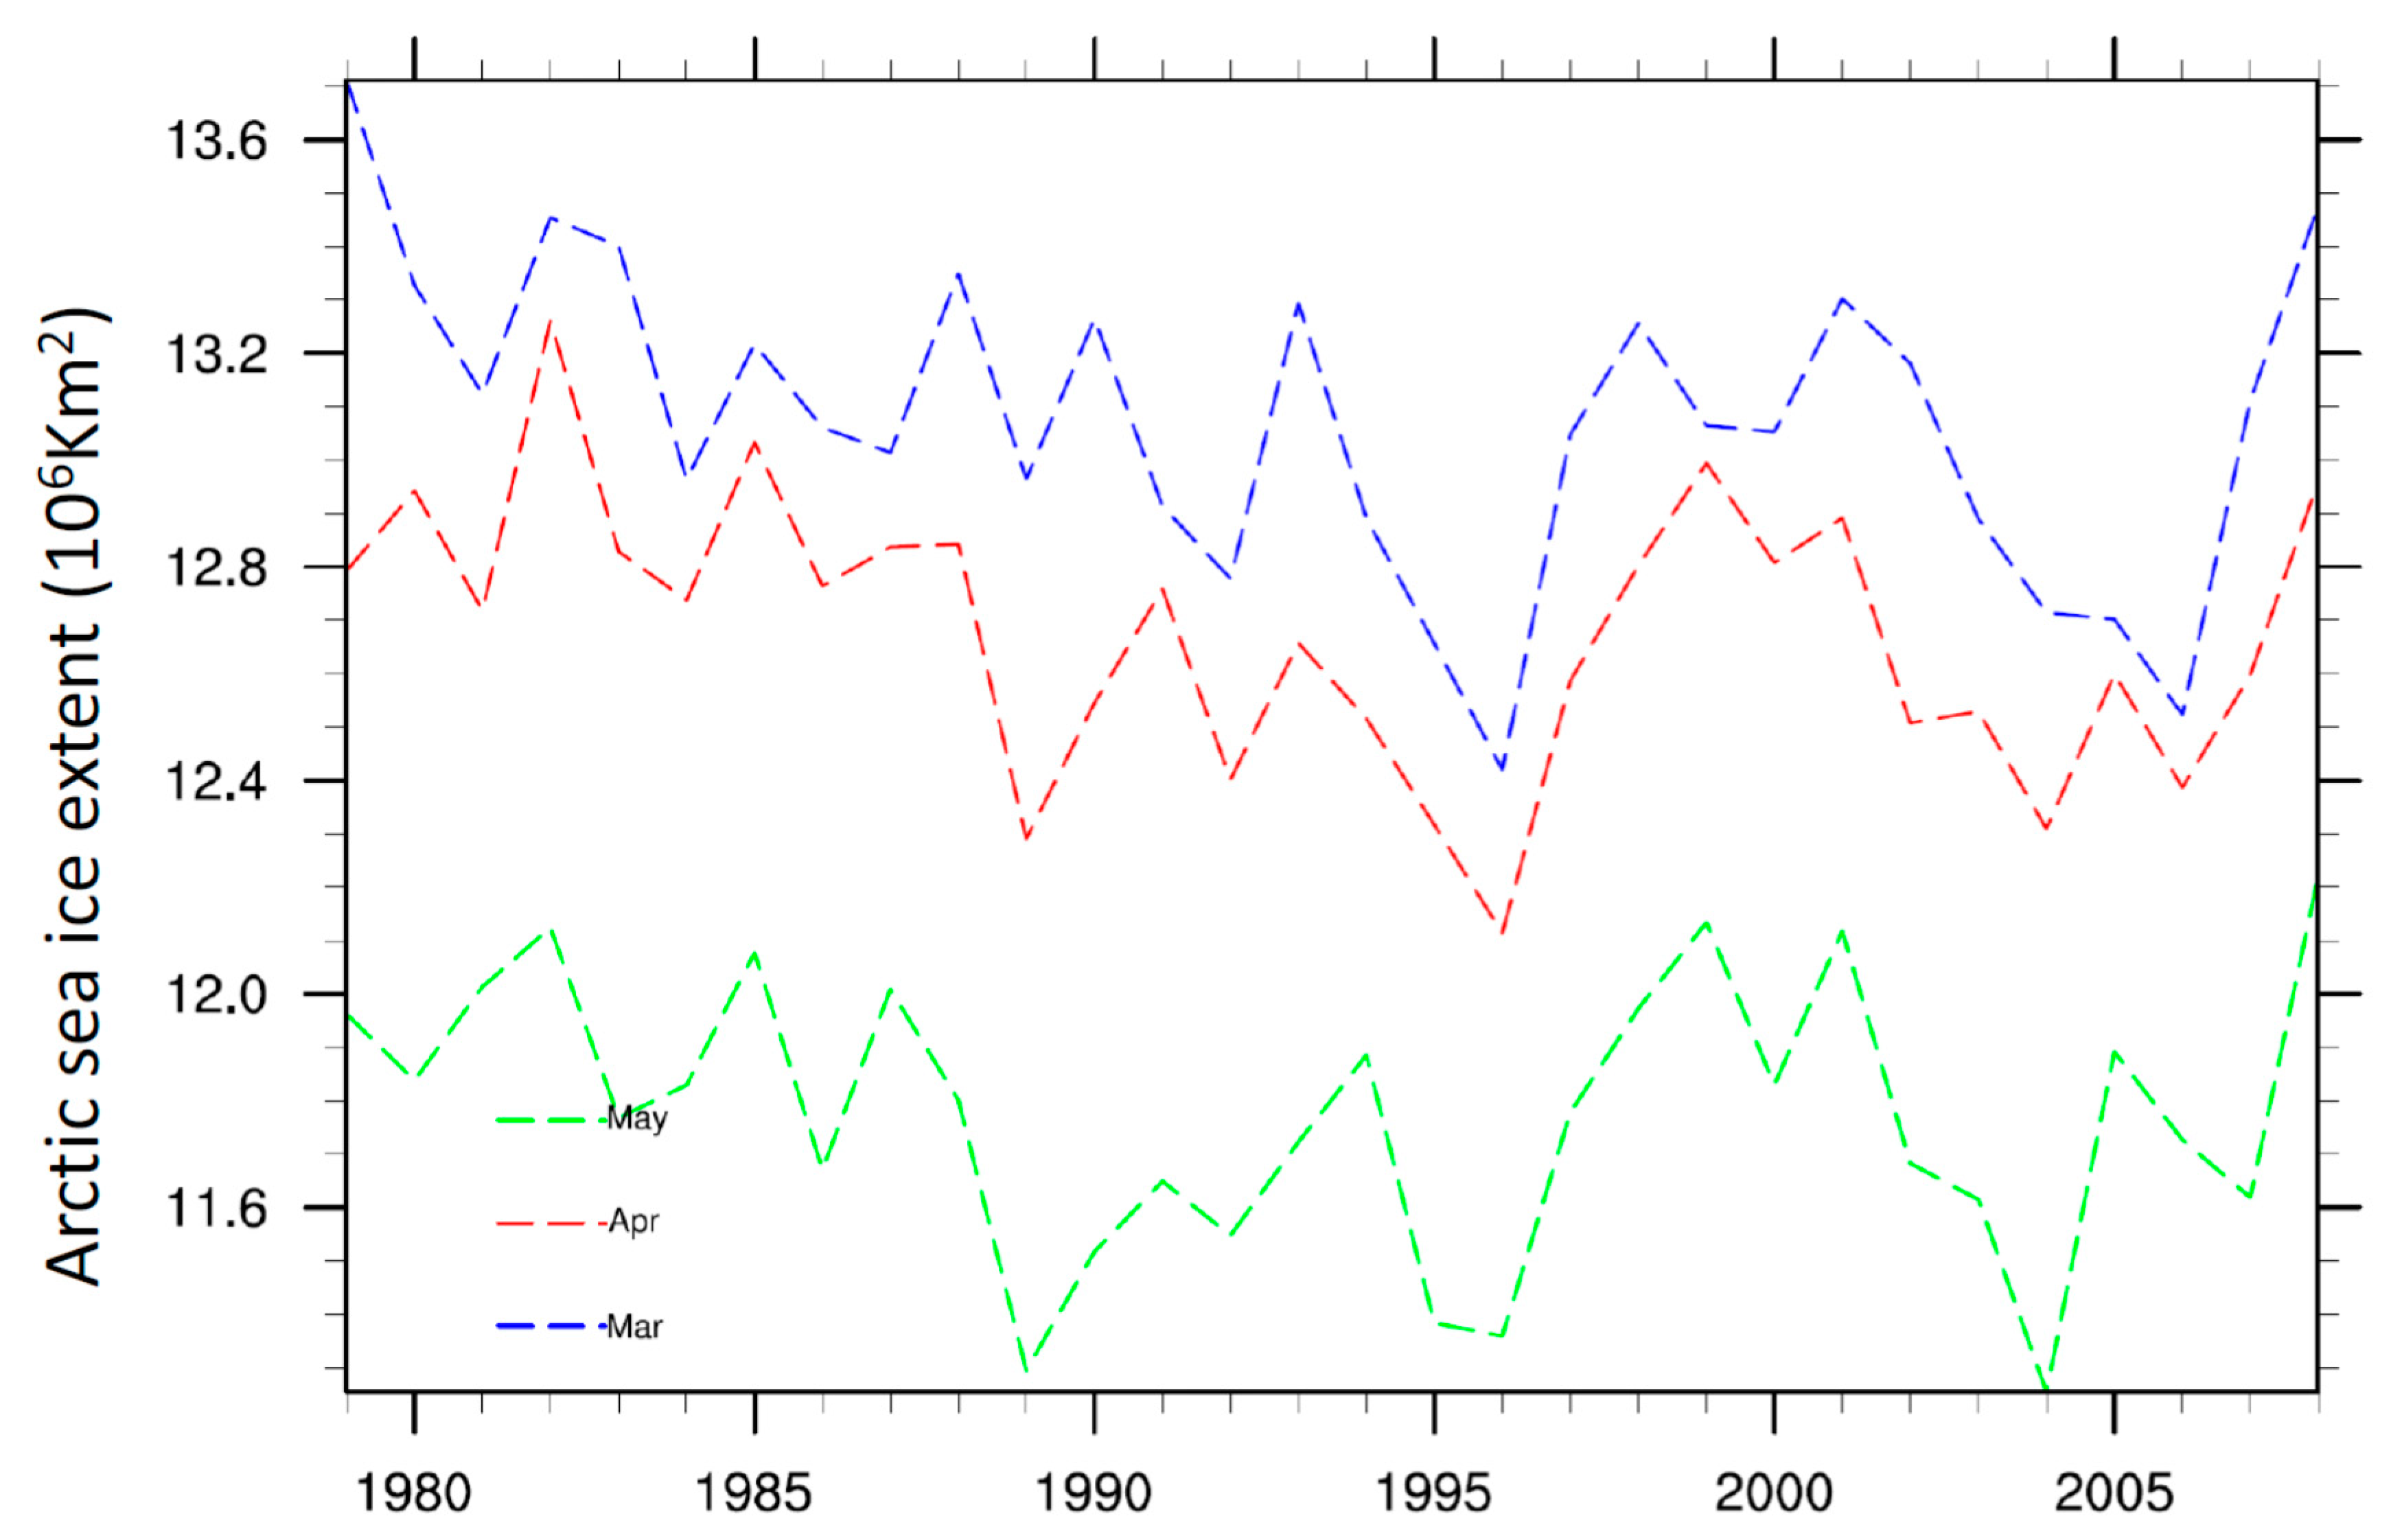
44] at T85 resolution were used as the surface boundary forcings (
Figure 1). We studied the impact of Arctic sea ice on mid- and high-latitudes storms over the Northern Hemisphere only; however, the model simulations were global. To construct robust results, we conducted five ensembles of our experiment with each ensemble starting from different initial conditions and each ensemble was run from January 1979 to December 2008, saving 6-hourly instantaneous outputs of selected variables. A control simulation was performed with climatological forcing to generate the different initial conditions used in the sensitivity experiments. Each model run has a spin up time of 1 month. Thus, we have a statistically robust sample size of 30 years in each run, i.e., a total of 150 spring (MAM) periods, for our study.
In our experiments, sea-ice concentration over the Arctic was assigned to observed values for the period of January 1979 to December 2008. Sea-ice concentration over the Southern Hemisphere was prescribed to its climatological values. SSTs were fixed at their monthly climatological values globally. The Poisson Equation was used to interpolate SST for the grid cells contiguous to the southern sea-ice edge in the Arctic. In this method, non-missing values are considered boundary points and a form of sequential over-relaxation is used until successive iterations yield minimal change.
To investigate extratropical storms, we employed a storm identification and tracking algorithm and applied this algorithm to the 6-hourly SLP outputs from each model ensemble. Following the classical definition of cyclone being always a closed system, we used this SLP based storm identification and tracking algorithm. This algorithm first identifies a low SLP center that has at least a minimum SLP difference of 0.15 hPa with the surrounding grid points and survives for more than 12 h. More details about this algorithm and its application for investigating Northern Hemisphere storm tracks can be found in [
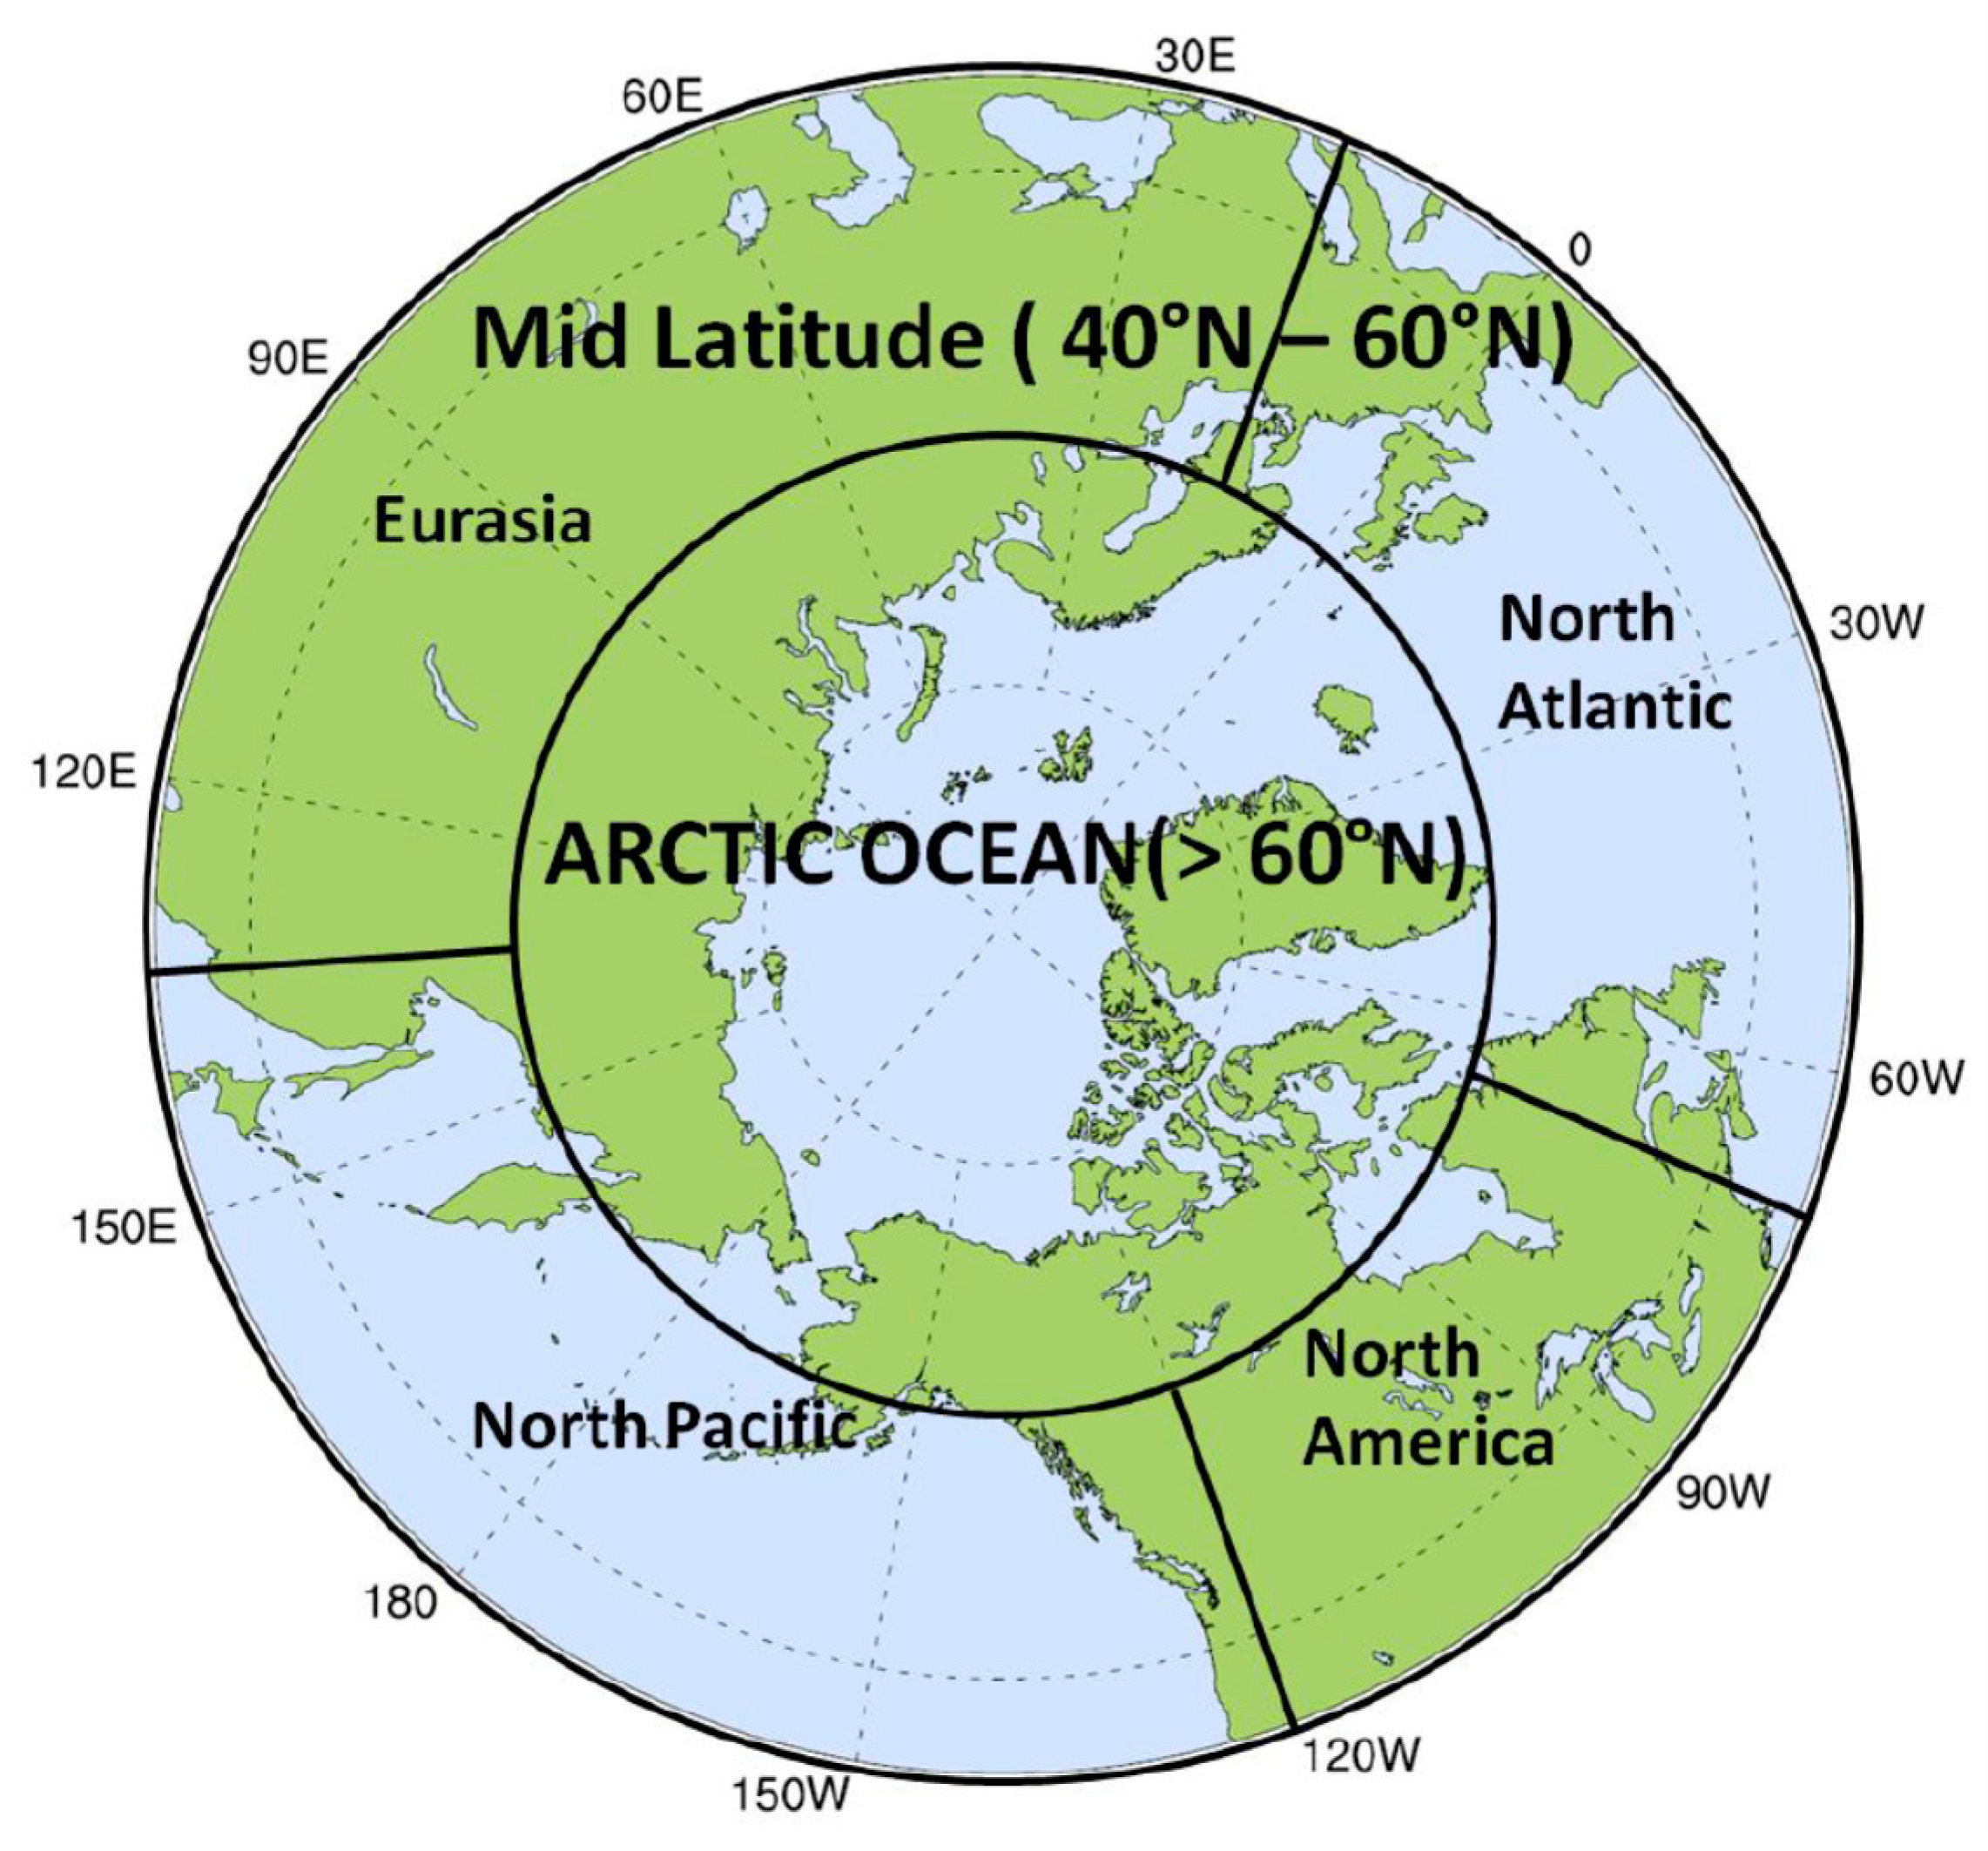
35]. Considering distinct regional features of climatological storm activity, we divided the Northern Hemisphere (NH) and continents into two sub-regions in this study: the mid-latitude and the Arctic. The changes in storm activity are not uniform across different geographical regions of NH mid-latitudes. Hence, the mid-latitude region was further divided into four sub-regions with prominent storm activities i.e., North Atlantic, North Pacific, Eurasia and North America (
Figure 2) to understand the regional variability of storm activity.
The storm identification and tracking algorithm provided various parameters describing storm activity, including duration or lifetime, central location, and central SLP for each individual storm occurring over the study area. By using the data sets of these parameters from each ensemble member of our experiment, we obtained the number of storm trajectories, mean storm duration, and mean storm intensity for each sub-region in spring (March–May). The storm trajectory was defined from the time of storm generation until dissipation within the region or from the time when the storm entered the region until the time it left the region. The mean duration for each region was the averaged duration of the total number of storm trajectories. The storm intensity for each individual storm was calculated as a mean absolute value of the difference between the storm’s central SLP and the monthly mean climatological SLP at the corresponding location. The mean storm intensity for each region was obtained by averaging storm intensities throughout their duration and over the number of storm trajectories within each region.
3. Results
3.1. Storm Activity
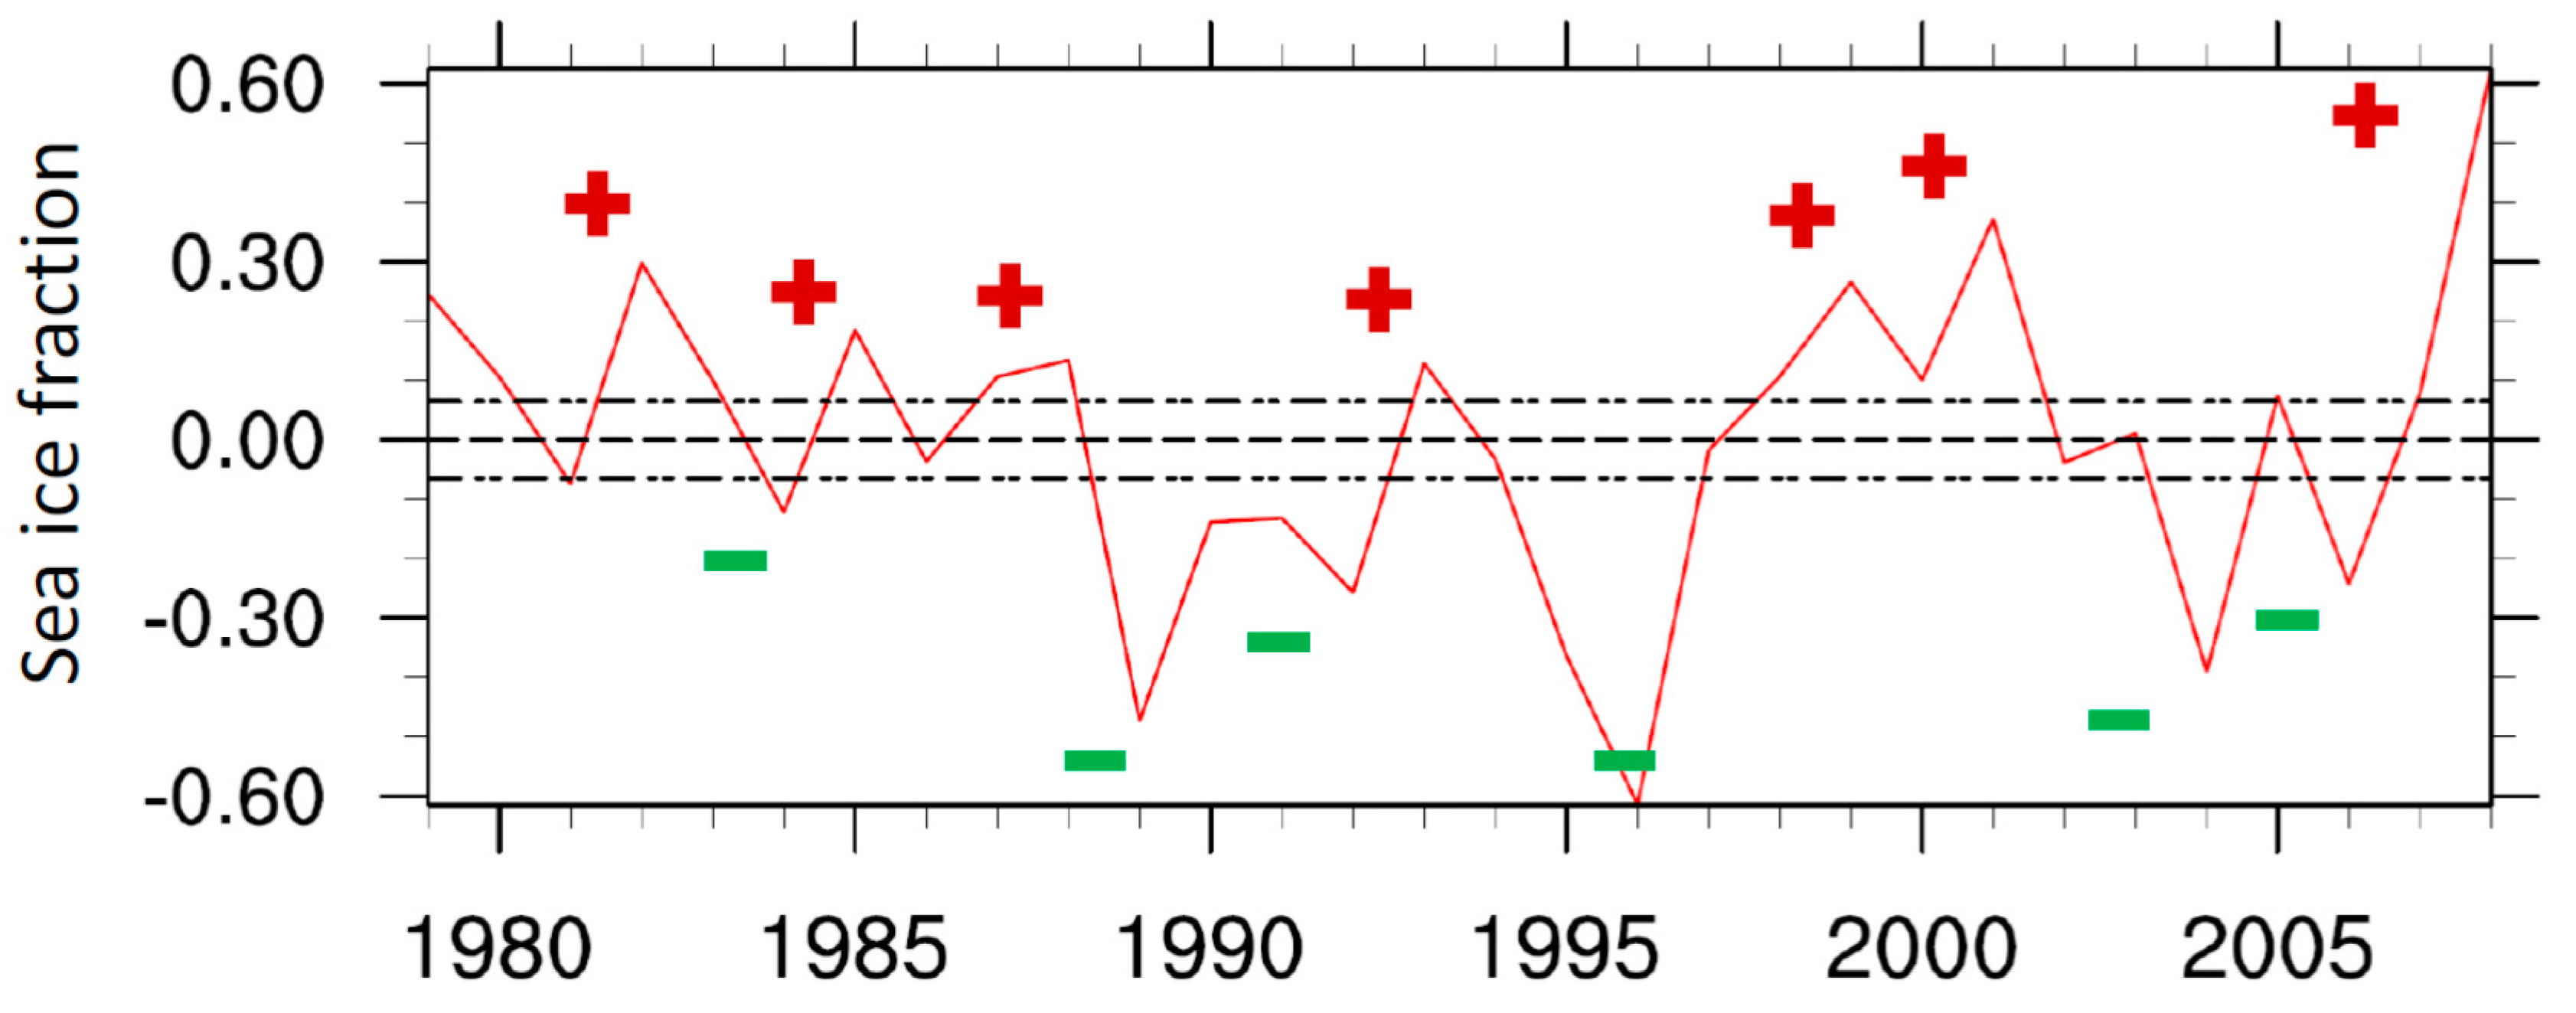
To study sea ice induced changes in storm activity, including the mean number of storm trajectories, mean intensity and mean duration, a probability density function (PDF) analysis was performed based on the years with detrended sea ice extent outside a threshold of ± 0.5 standard deviations (σ) (
Figure 3). This threshold was chosen to maximize the number of years for each composite. We named the composite of the years above positive critical value as Pos and the combined years below the negative critical value as Neg and we will use these acronyms hereafter. To assess the statistical significance of the difference in means between the Pos and Neg years, a student
t-test was applied to the parameters describing storm activity, and for the analysis of the other surface climate parameters in the following section.
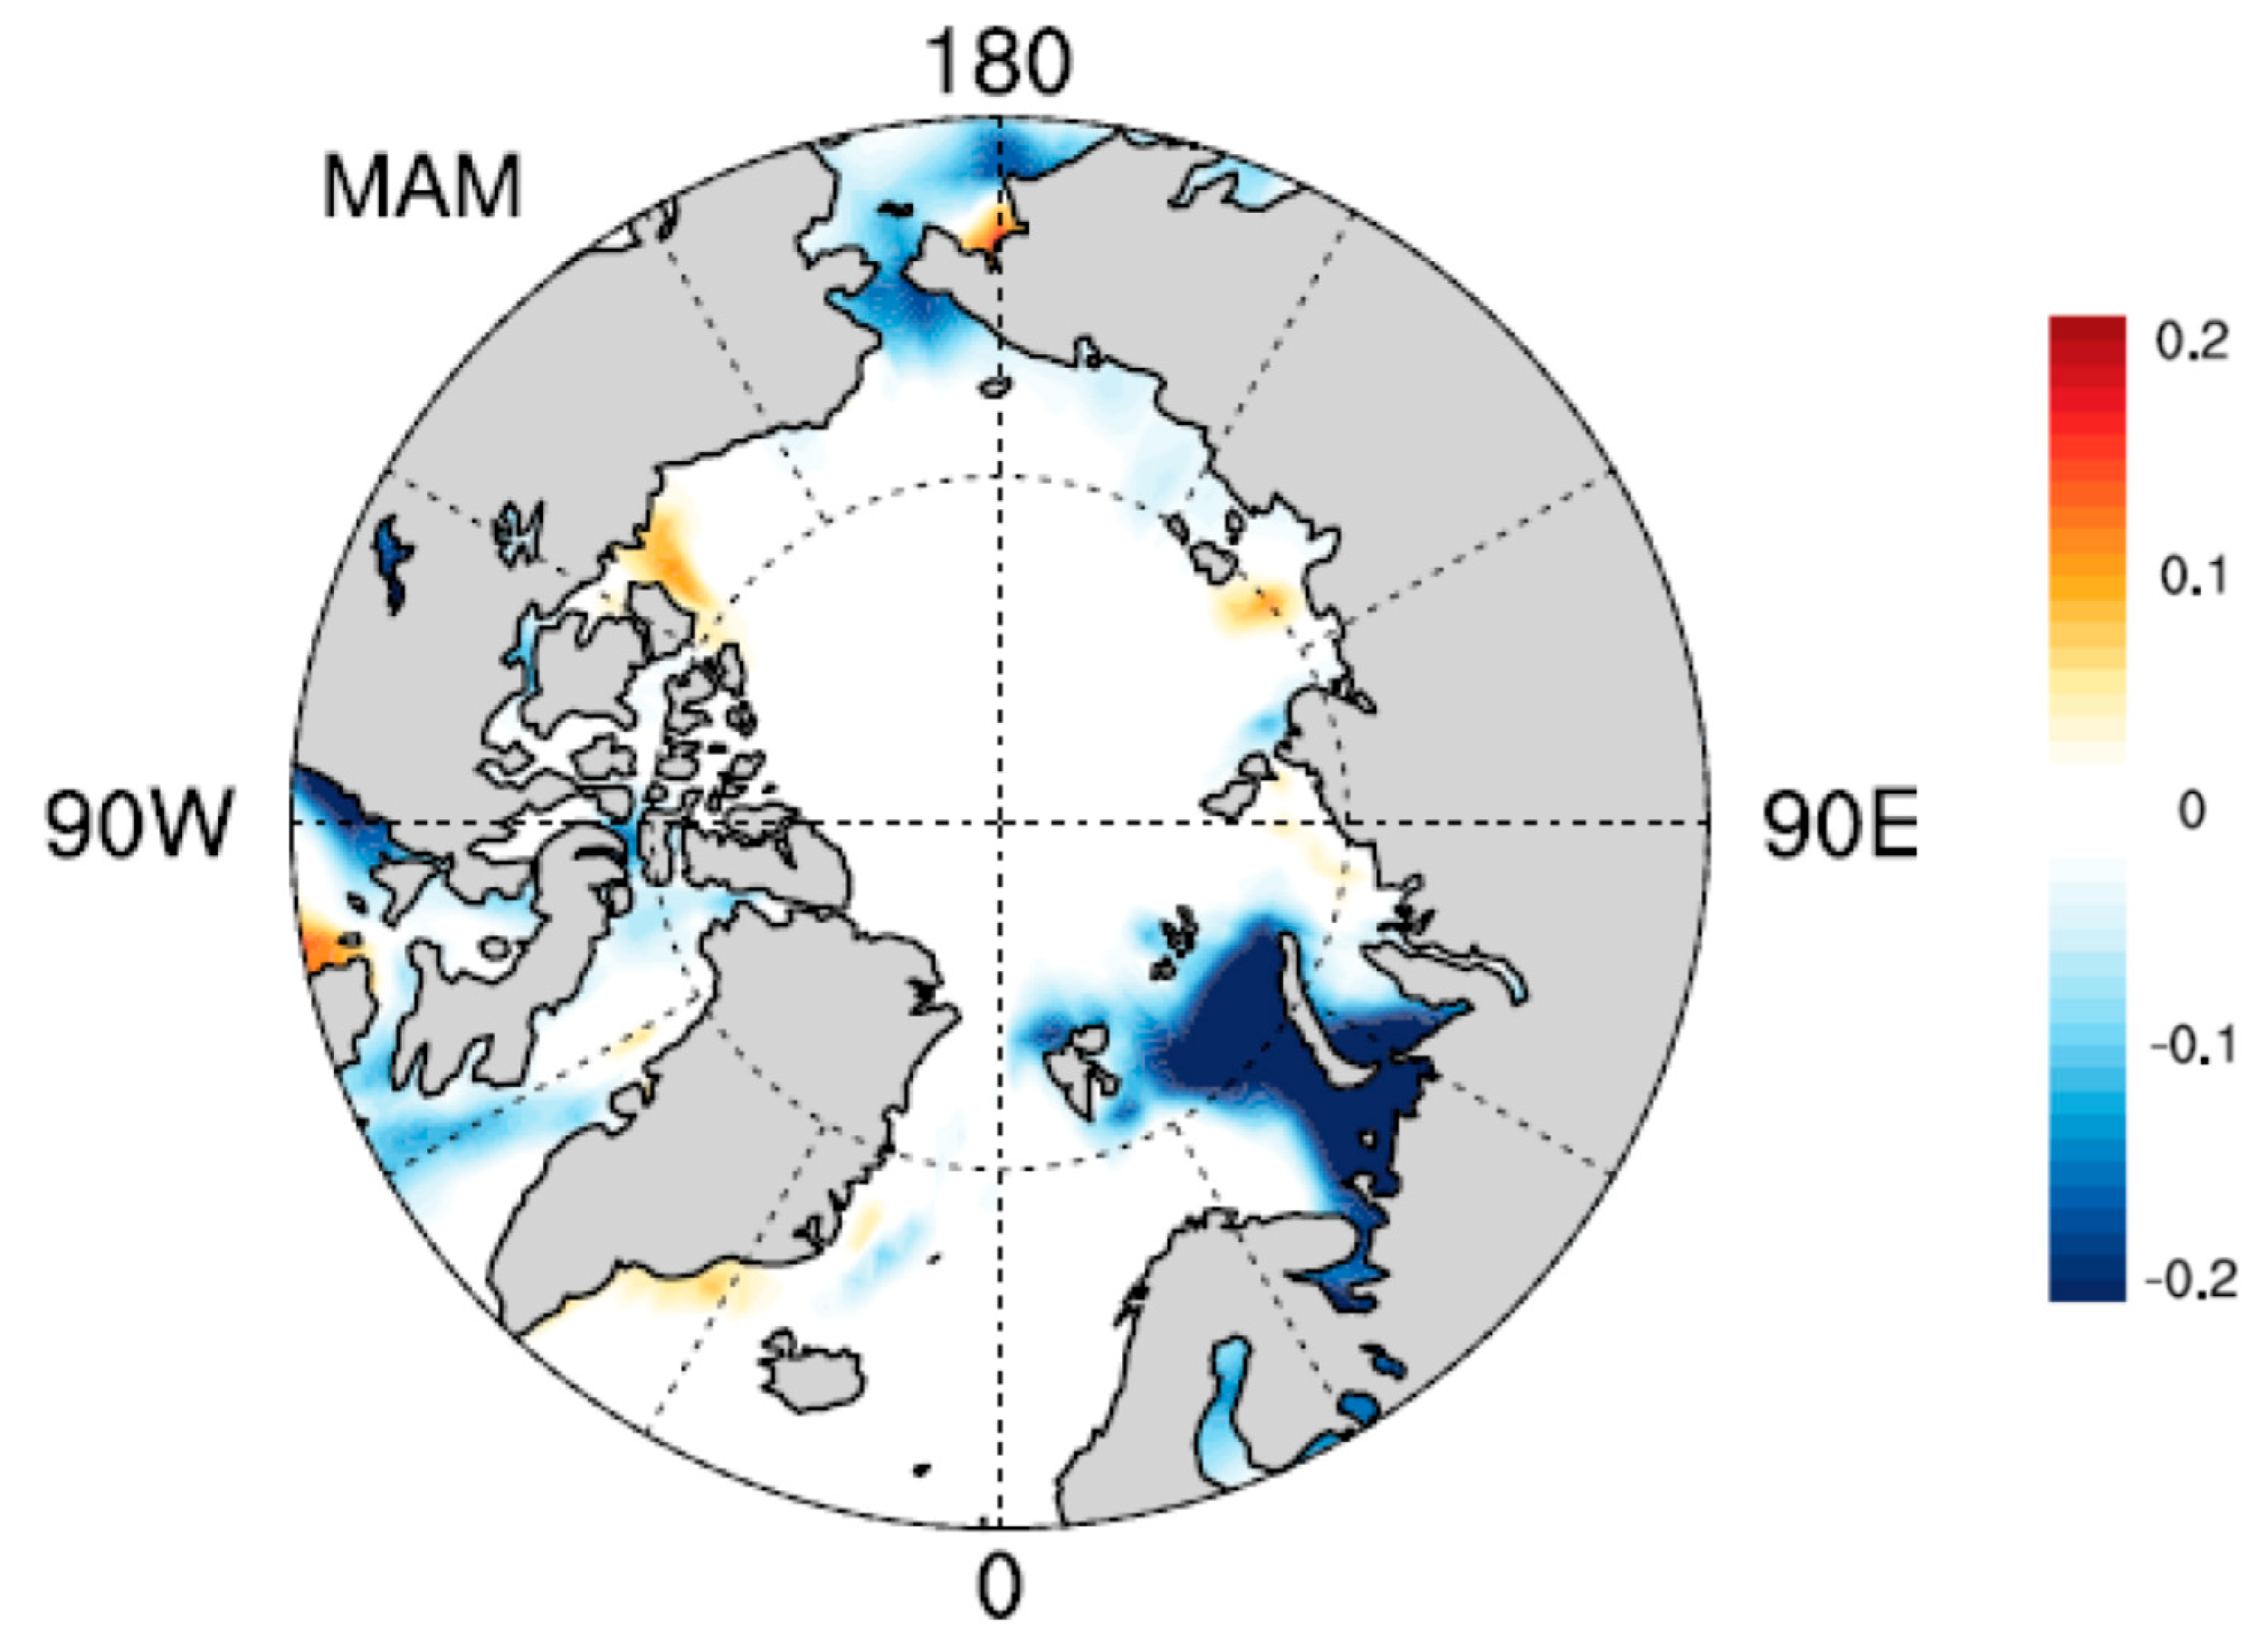
The spatial pattern of seasonal differences in sea-ice concentration in Neg—Pos are shown in
Figure 4. In spring, the largest anomaly is over the Barents and Bering seas.
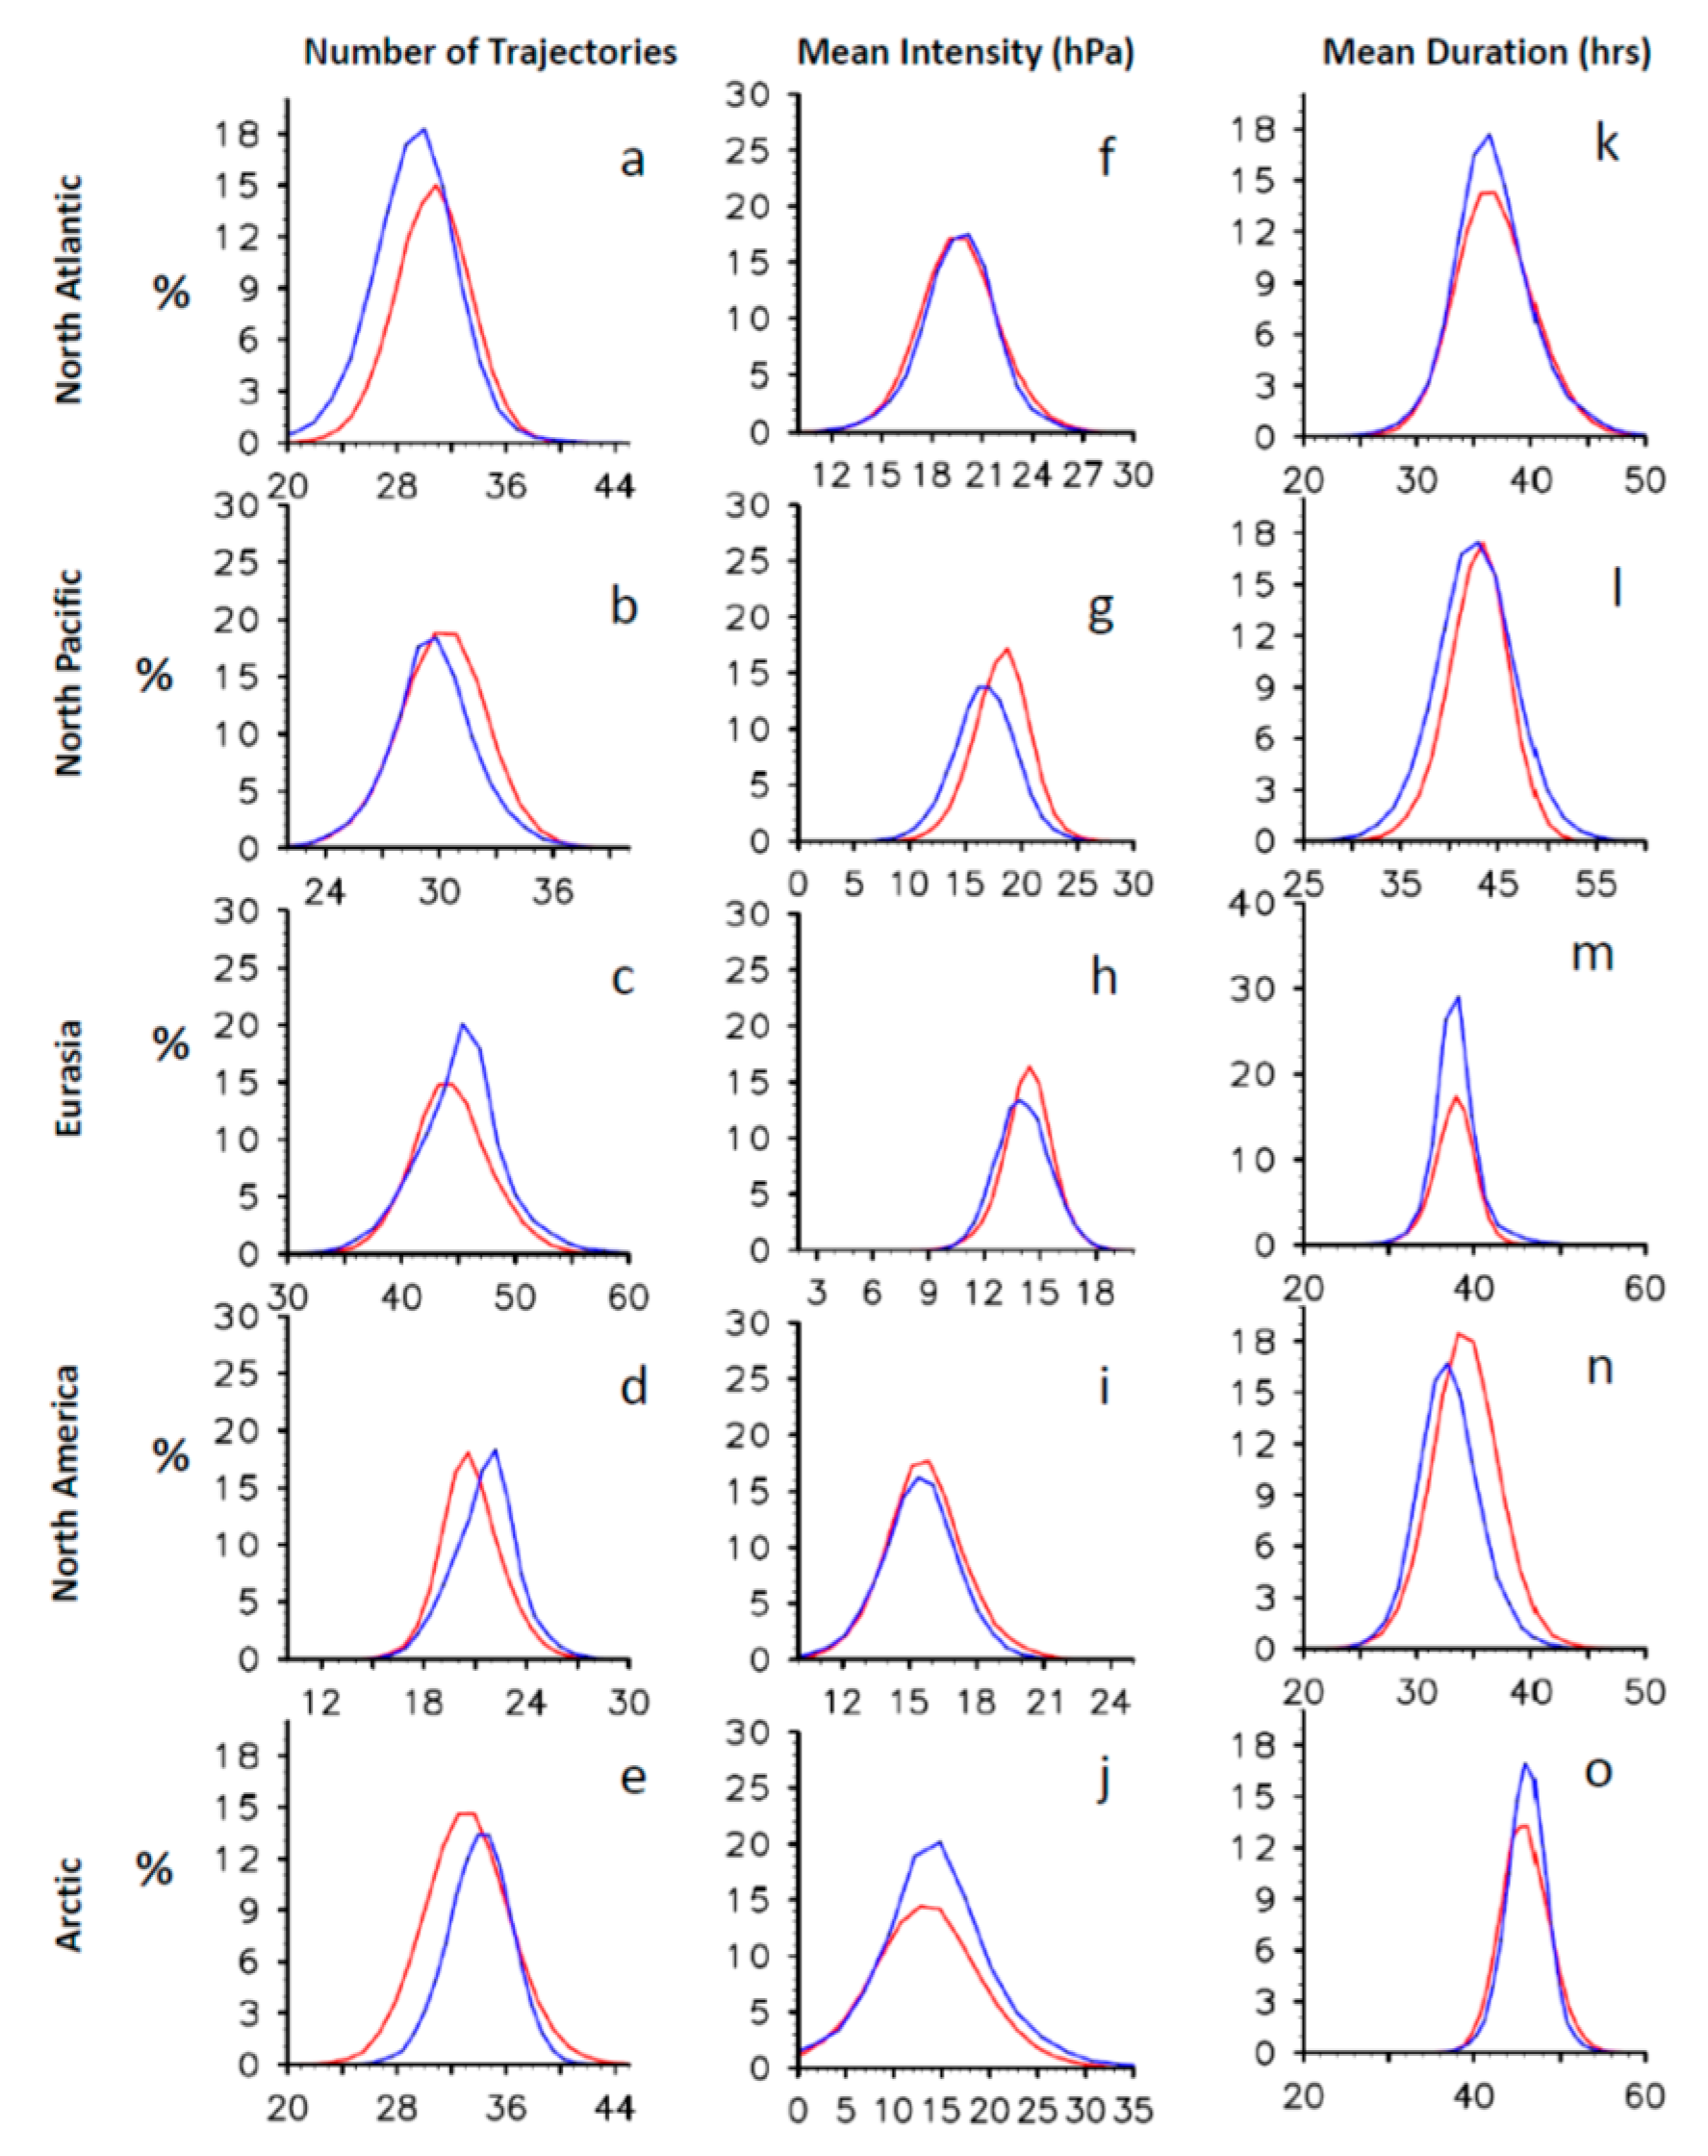
Figure 5 shows the PDFs of the number of trajectories (5a–5e), mean intensity (5f–5j) and mean duration (5k–5o) for each of the sub-regions. The number of storm trajectories in spring is highest over Eurasia followed by the North Pacific and North Atlantic. On comparison between Pos and Neg, the North Atlantic exhibits an increased frequency over the lower number of storm trajectories when there is less sea ice. However, over the Eurasia, and the North America the frequency of higher number of storm trajectories increases in Neg. The peak frequency shifts right in Neg towards higher number of storm trajectories in North America and the Arctic with changes in mean from 20 to 22 and 32 to 34 respectively. There might be inter links between the different regions, but this study looks at each region separately. For example: a storm in North Pacific or North Atlantic can continue into the Arctic Ocean region and hence it will count as 1 trajectory for each region.
On the other hand, most of the intense storms occur over the North Atlantic and North Pacific with some of the most intense storms occurring over the Arctic. The frequency of storms with low mean intensity increases over the North Pacific in Neg. But there is an increased frequency of extreme intense storms over the Arctic when there is less sea ice. The frequency of occurrences of storm with mean intensity of 15 hPa over the Arctic increases from 14% to 20% in Neg.
The mean duration of the storms is highest over the Arctic followed by the North Pacific, Eurasia and the North Atlantic. The frequency of occurrences of storms with mean duration between 30–40 h increases from 14% to 18% over the North Atlantic and from 18% to 30% over Eurasia when there is less sea ice. The frequency of storms with lower duration increases over North America in Neg. Over the Arctic, the peak frequency of mean duration of storm slightly increases from 13% to 17% in Neg.
To express the overall storm activity over each region during each season, we calculated the cyclone activity index (CAI) anomaly [
35]. CAI is an integrated index that simultaneously characterizes several storm parameters—number of storm trajectories, mean intensity and mean duration. This index was calculated by summing the differences in storm center SLPs and the climatological SLPs at the corresponding grid points over each region. An increase (decrease) in the CAI anomaly indicates an increase (decrease) in storm activity.
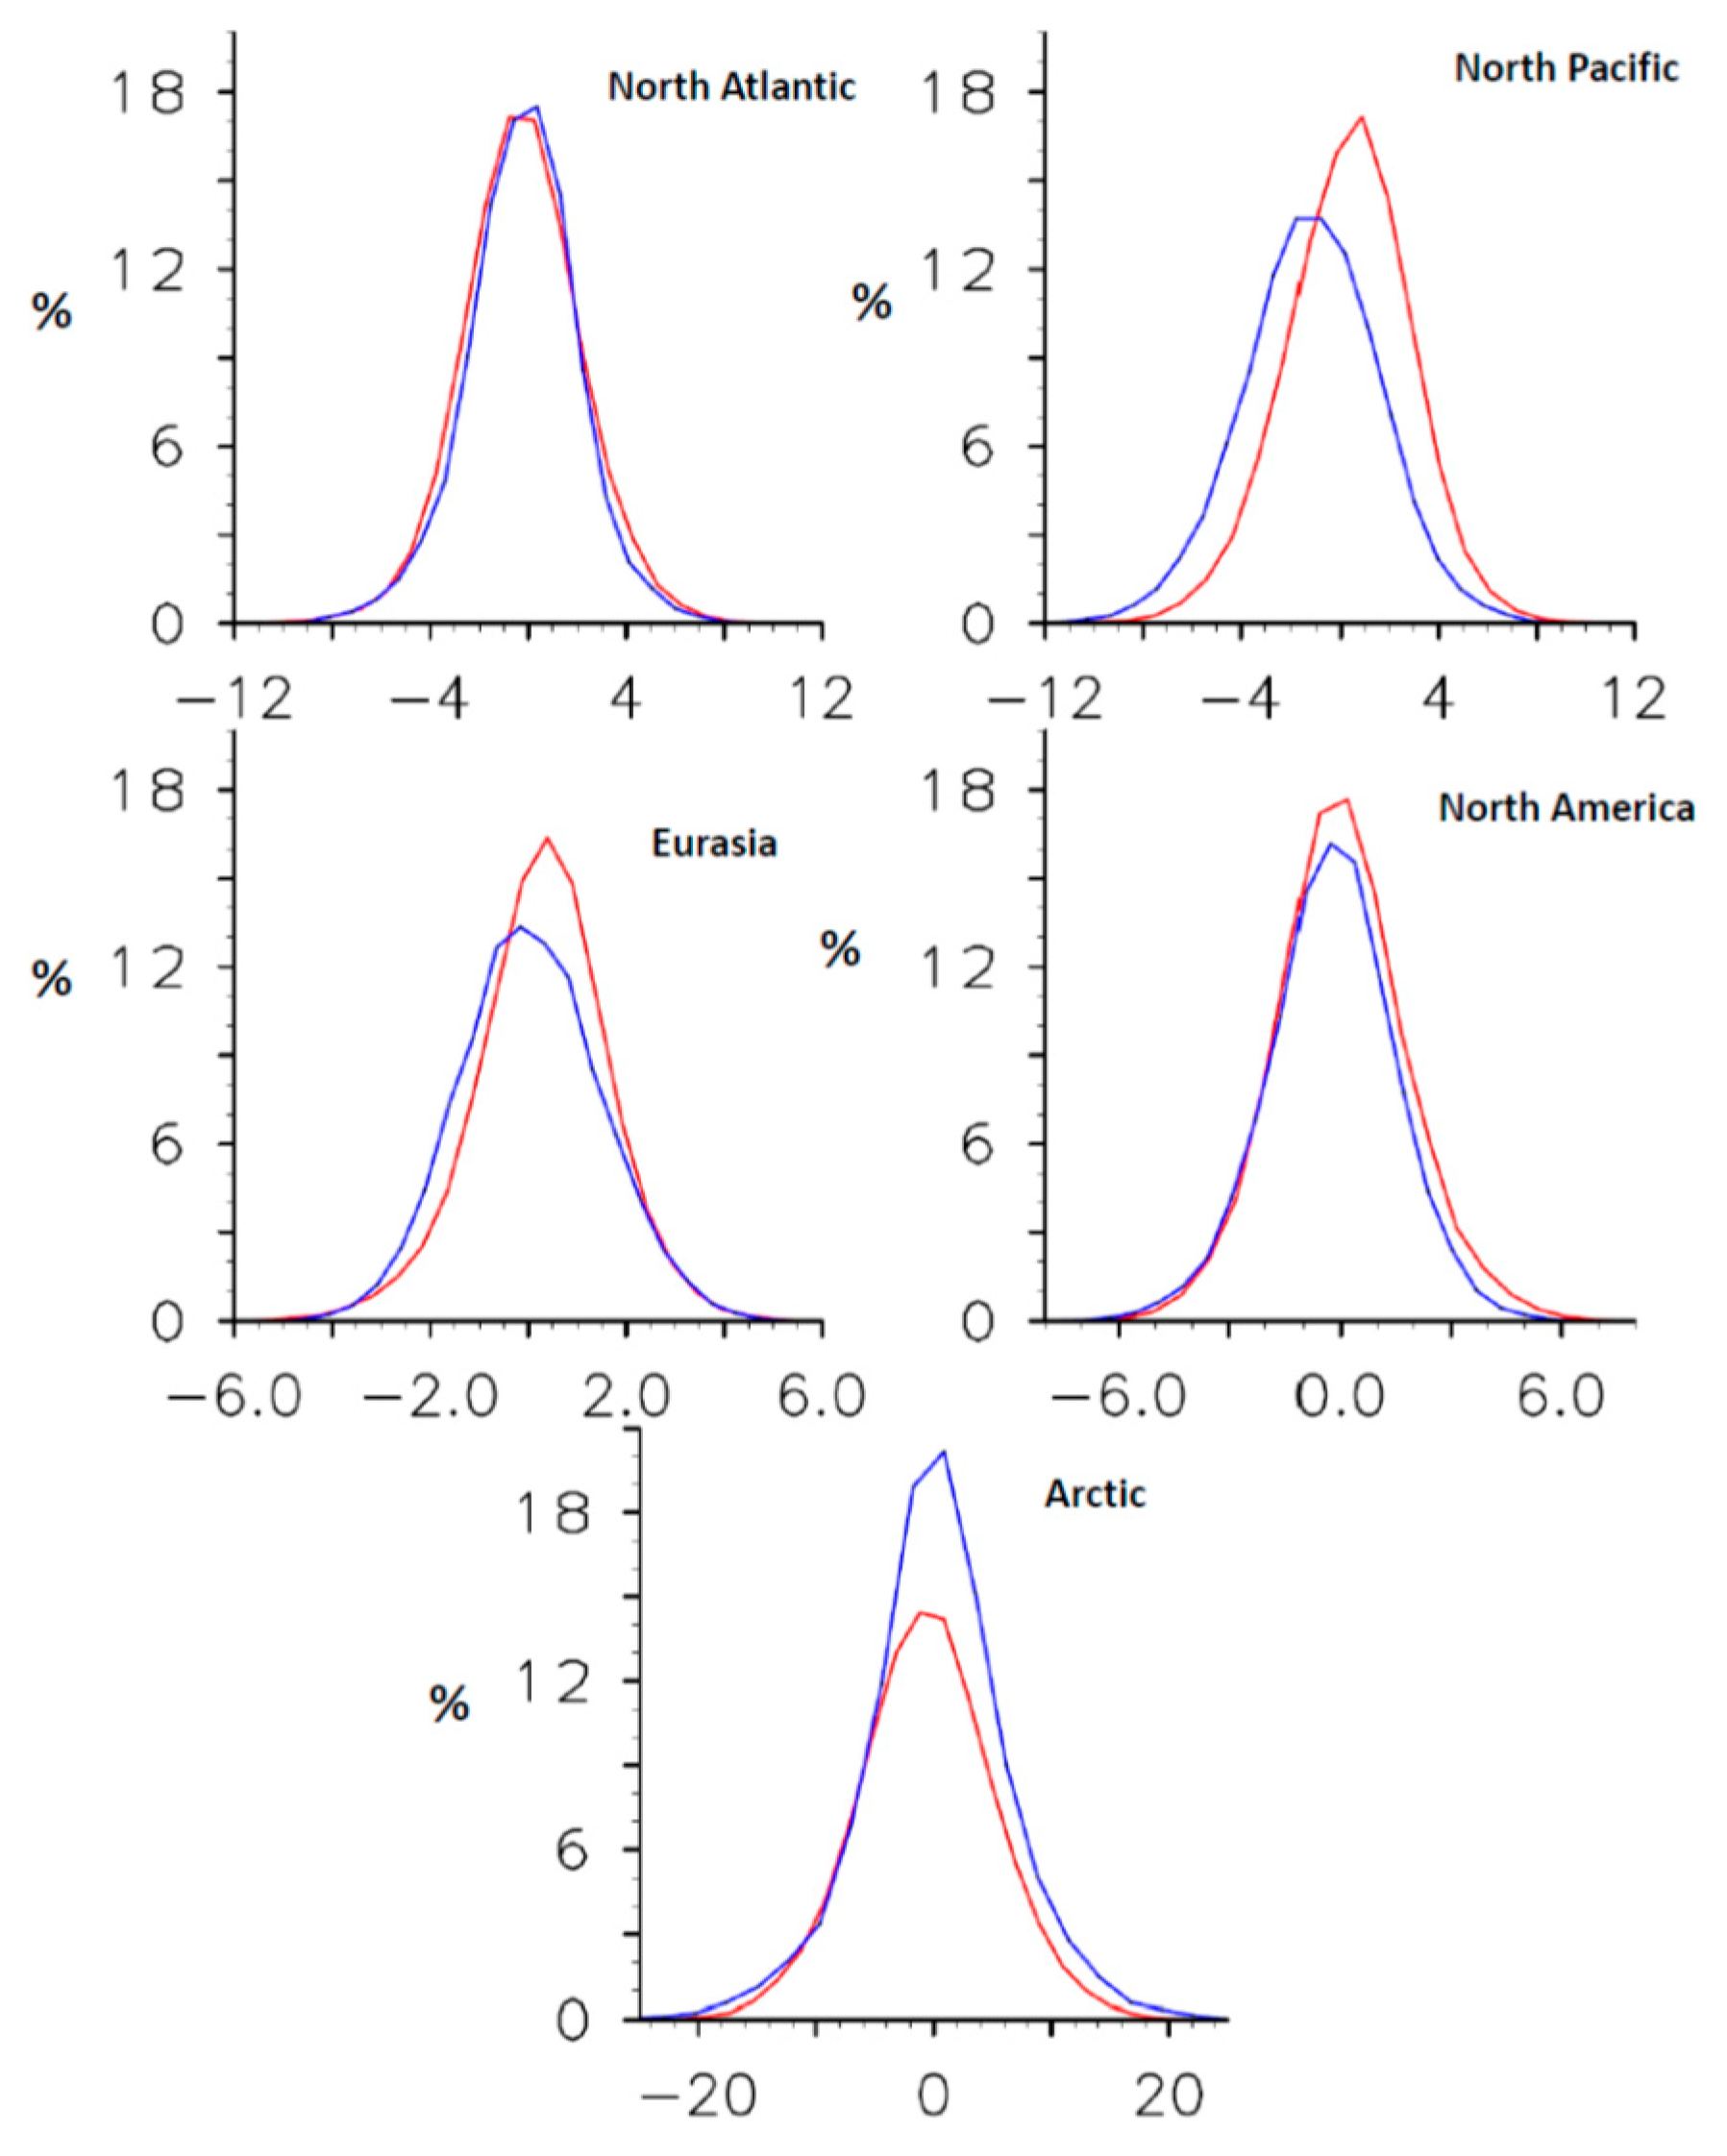
Figure 6 shows the PDF distribution of CAI anomalies where positive (negative) anomalies indicates an increase (decrease) of storm activity over a region. The Arctic exhibits the highest and lowest storm activity as the CAI anomalies range from −20 to +20. A comparison between Pos and Neg indicates an overall decrease in storm activity over the North Pacific and Eurasia as the frequency of negative CAI anomalies increases when there is less sea ice. Over the Arctic the frequency of positive CAI anomalies increases in Neg indicating an overall increase in storm activity in spring.
From our analysis of the PDFs, we conclude that in response to reduced Arctic sea ice there are increases in storm activity over the Arctic in spring. This contrasts with reduced storm activity over Eurasia and North Pacific. Reduced sea ice which has both local and remote impacts on the atmosphere can modulate anomalous local heating of the lower troposphere. This may cause baroclinic instability in the lower atmosphere making it favorable for cyclogenesis [
18]. This anomalous heating due to the reduced sea ice can induce circulation anomalies by altering the jet stream pattern which may play a prominent role in changing the storm activity in the mid-latitudes. Under reduced Arctic sea-ice conditions we expect that these changes in storm activities are associated with extreme weather events by alteration of surface climate over the mid- and high-latitudes.
3.2. Changes in Total Precipitation and Snowfall Rate
Extratropical cyclones are the primary driver for heavy rainfall and snowfall events over the mid-latitude and Arctic region. In this study, in relation to changes in storm activity, we examine the spatial distribution of total precipitation (
Figure 7) and complement the changes with a PDF analysis of total regionally averaged precipitation (
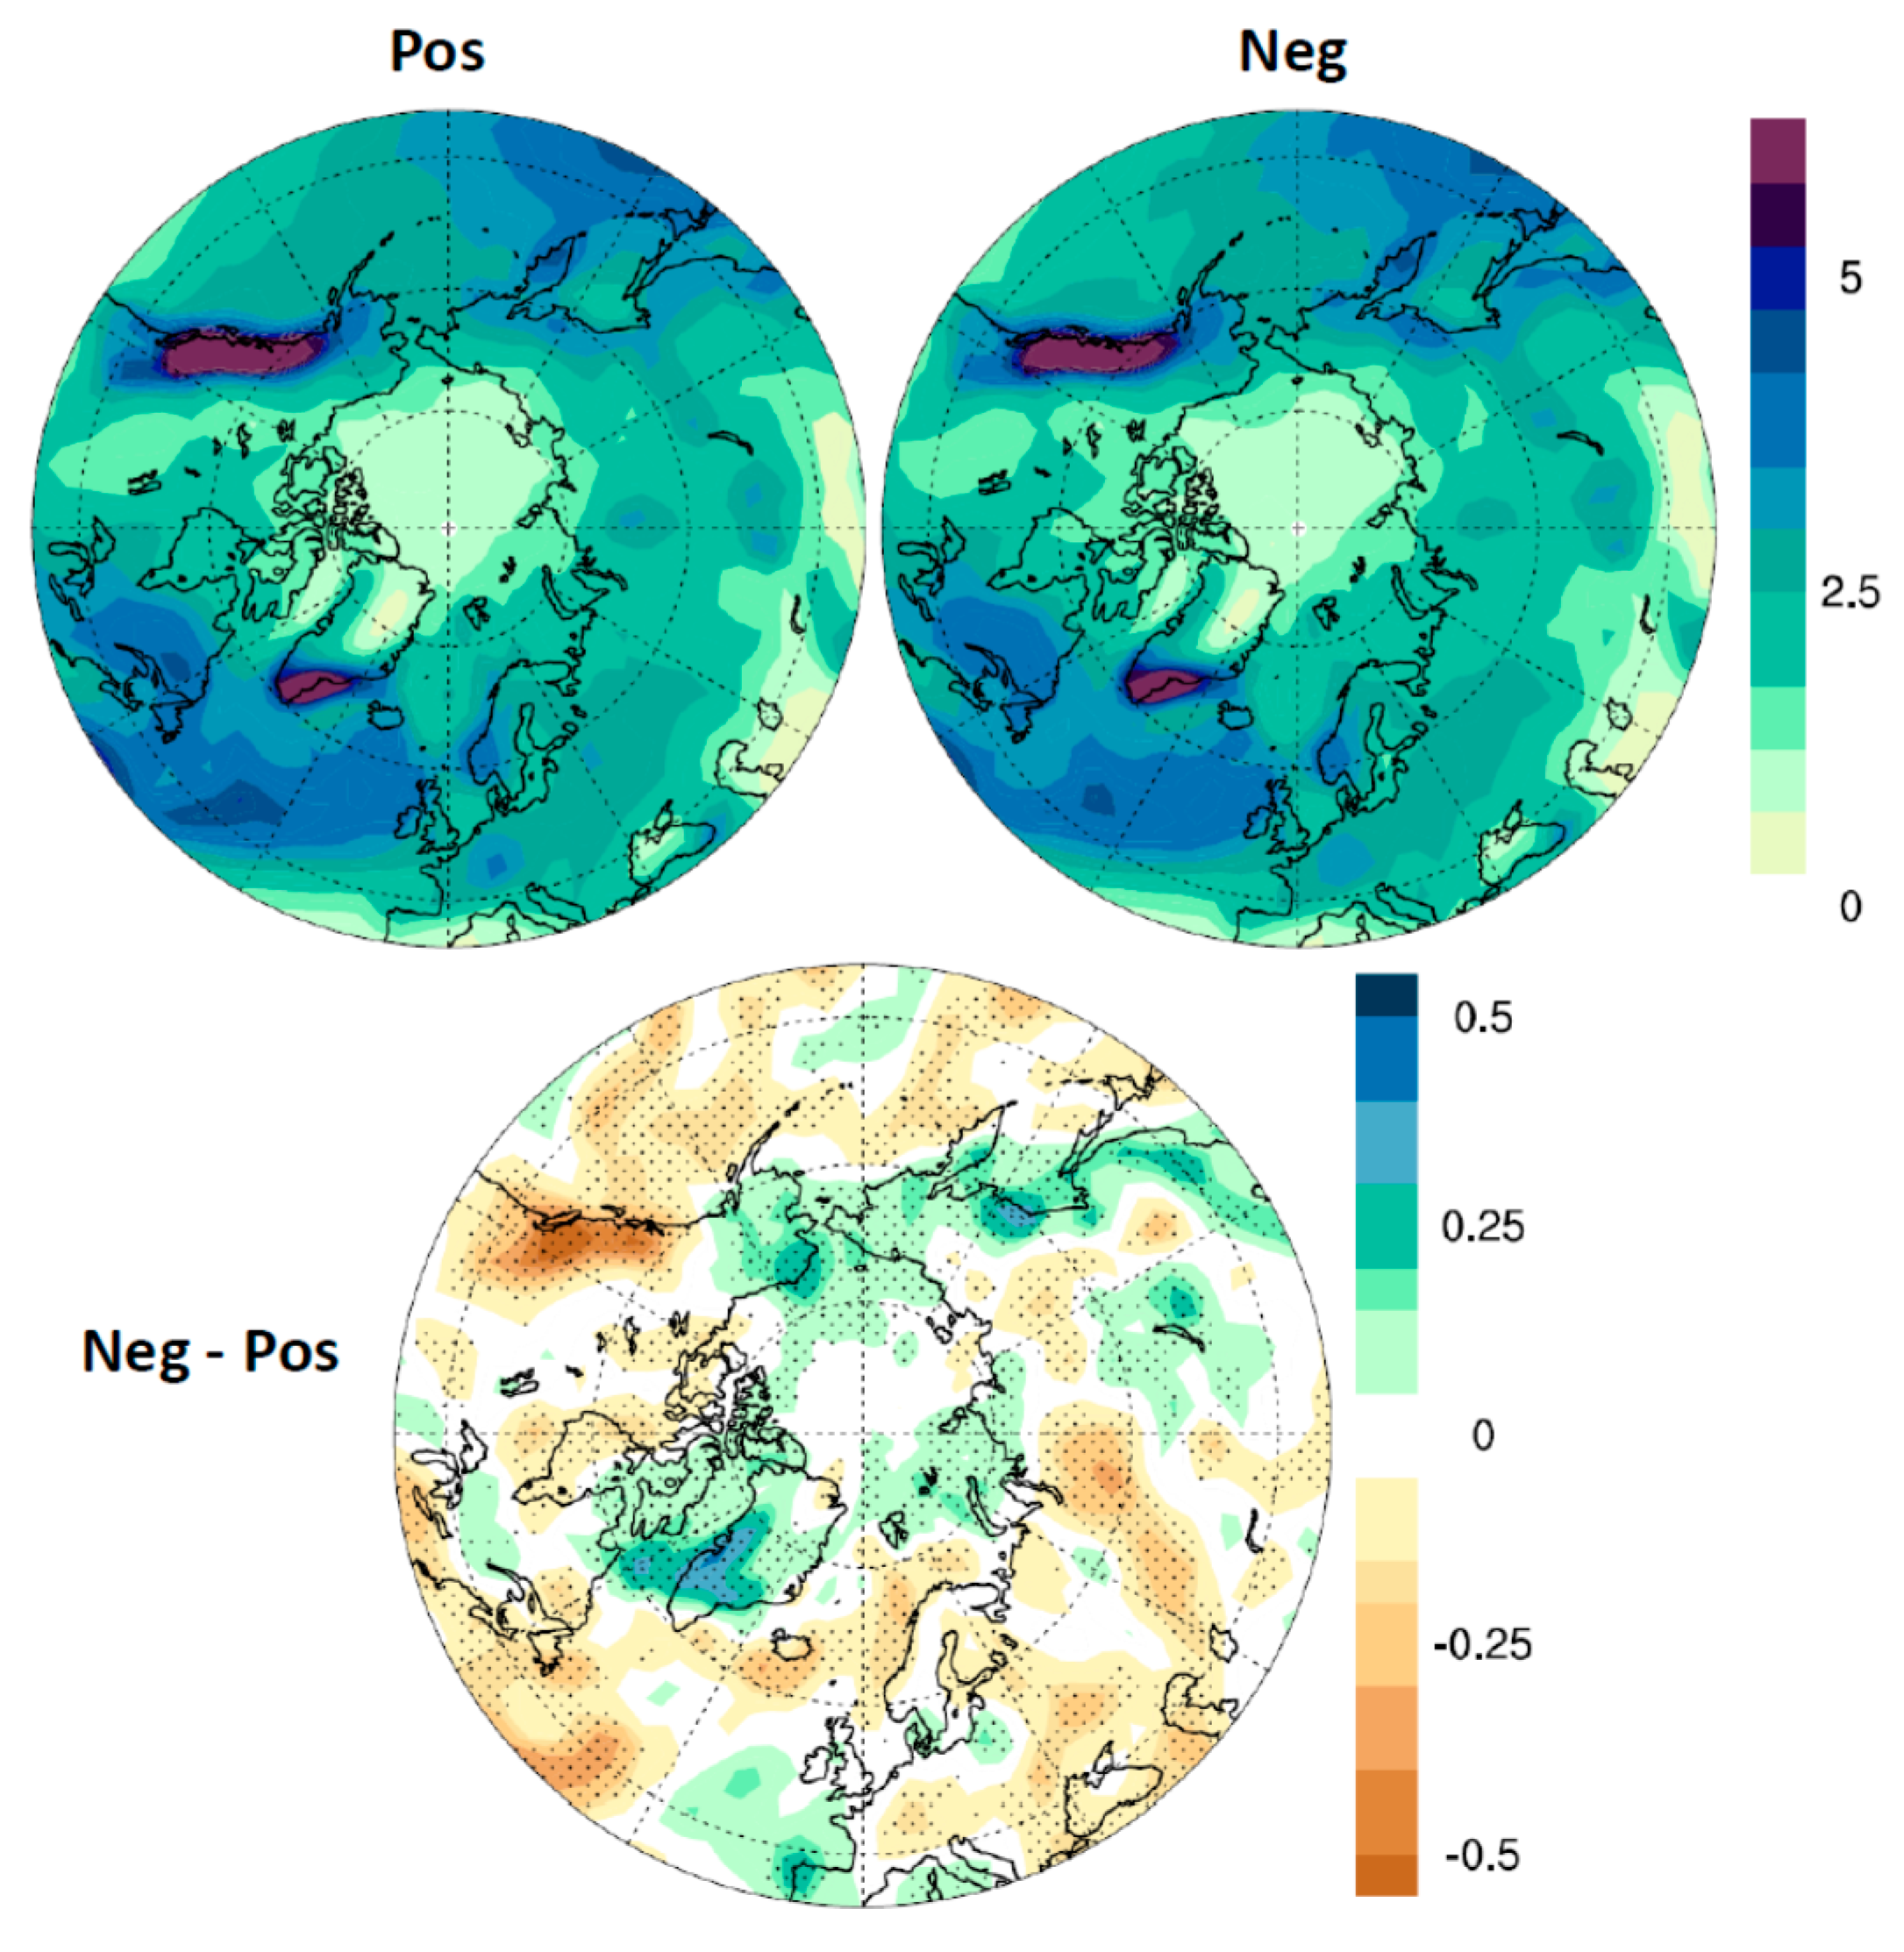
Figure 8). The storm track regions show the highest amount of total precipitation rate especially over the North Pacific, North Atlantic, central Eurasia, west and east coast of North America and western Europe and UK. A comparison between Neg and Pos shows a prominent increase in total precipitation rate in Neg over Alaska, Beaufort, Chukchi and Barents Seas, Sea of Okhotsk, North Labrador Sea, southwest Greenland and the coastal regions of north east Eurasia.
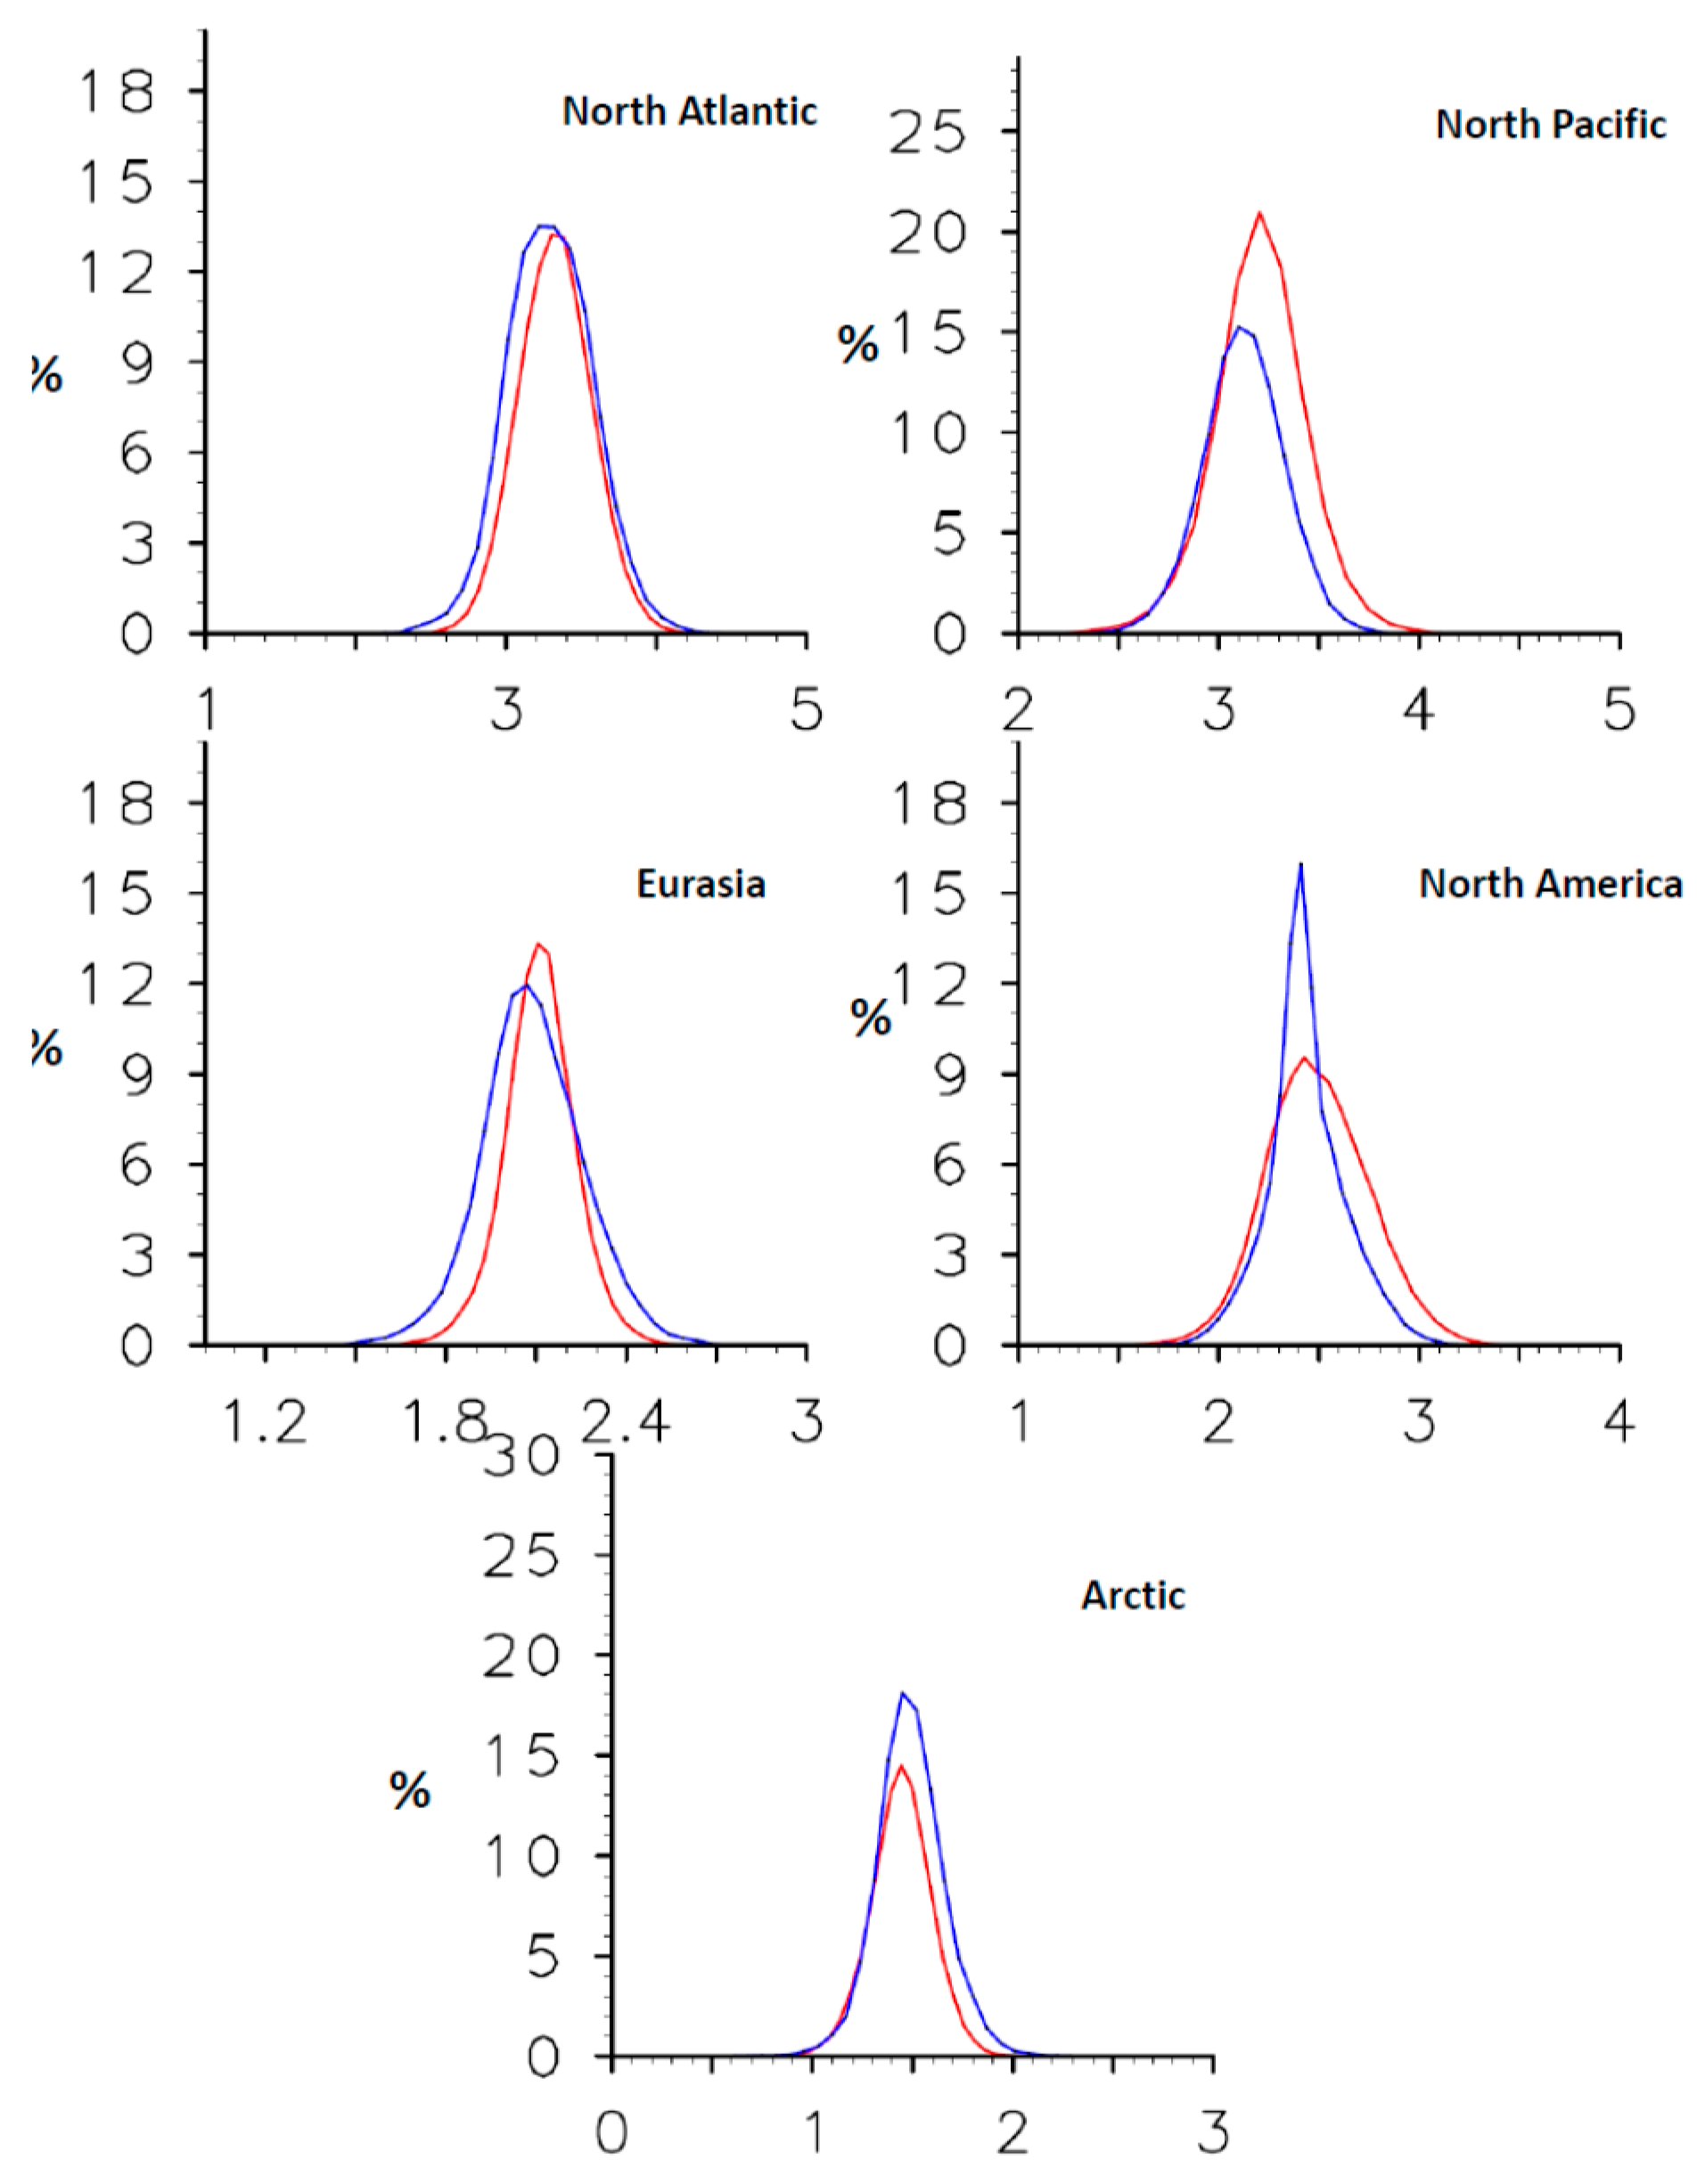
In
Figure 8 the PDF distribution of regionally averaged total precipitation rate shows that the highest precipitation in spring occurs over North Atlantic and North Pacific. Over Eurasia and North Atlantic, the frequency of lower total precipitation rate increases when there is less sea ice. However, over the Arctic and Eurasia the frequency of higher total precipitation rate enhances in Neg.
Total precipitation, especially the snow cover along with the radiative feedback from the cloud cover plays a driving role in changing SAT over a region. In the next section, we examine the changes in SAT and surface wind due to the changes in storm activity over a region.
3.3. Changes in SAT and Surface Wind
Extratropical cyclones are associated with fronts between the cold and warm air and thus the passage of these cyclones can bring rapid changes in the air temperature of a place.
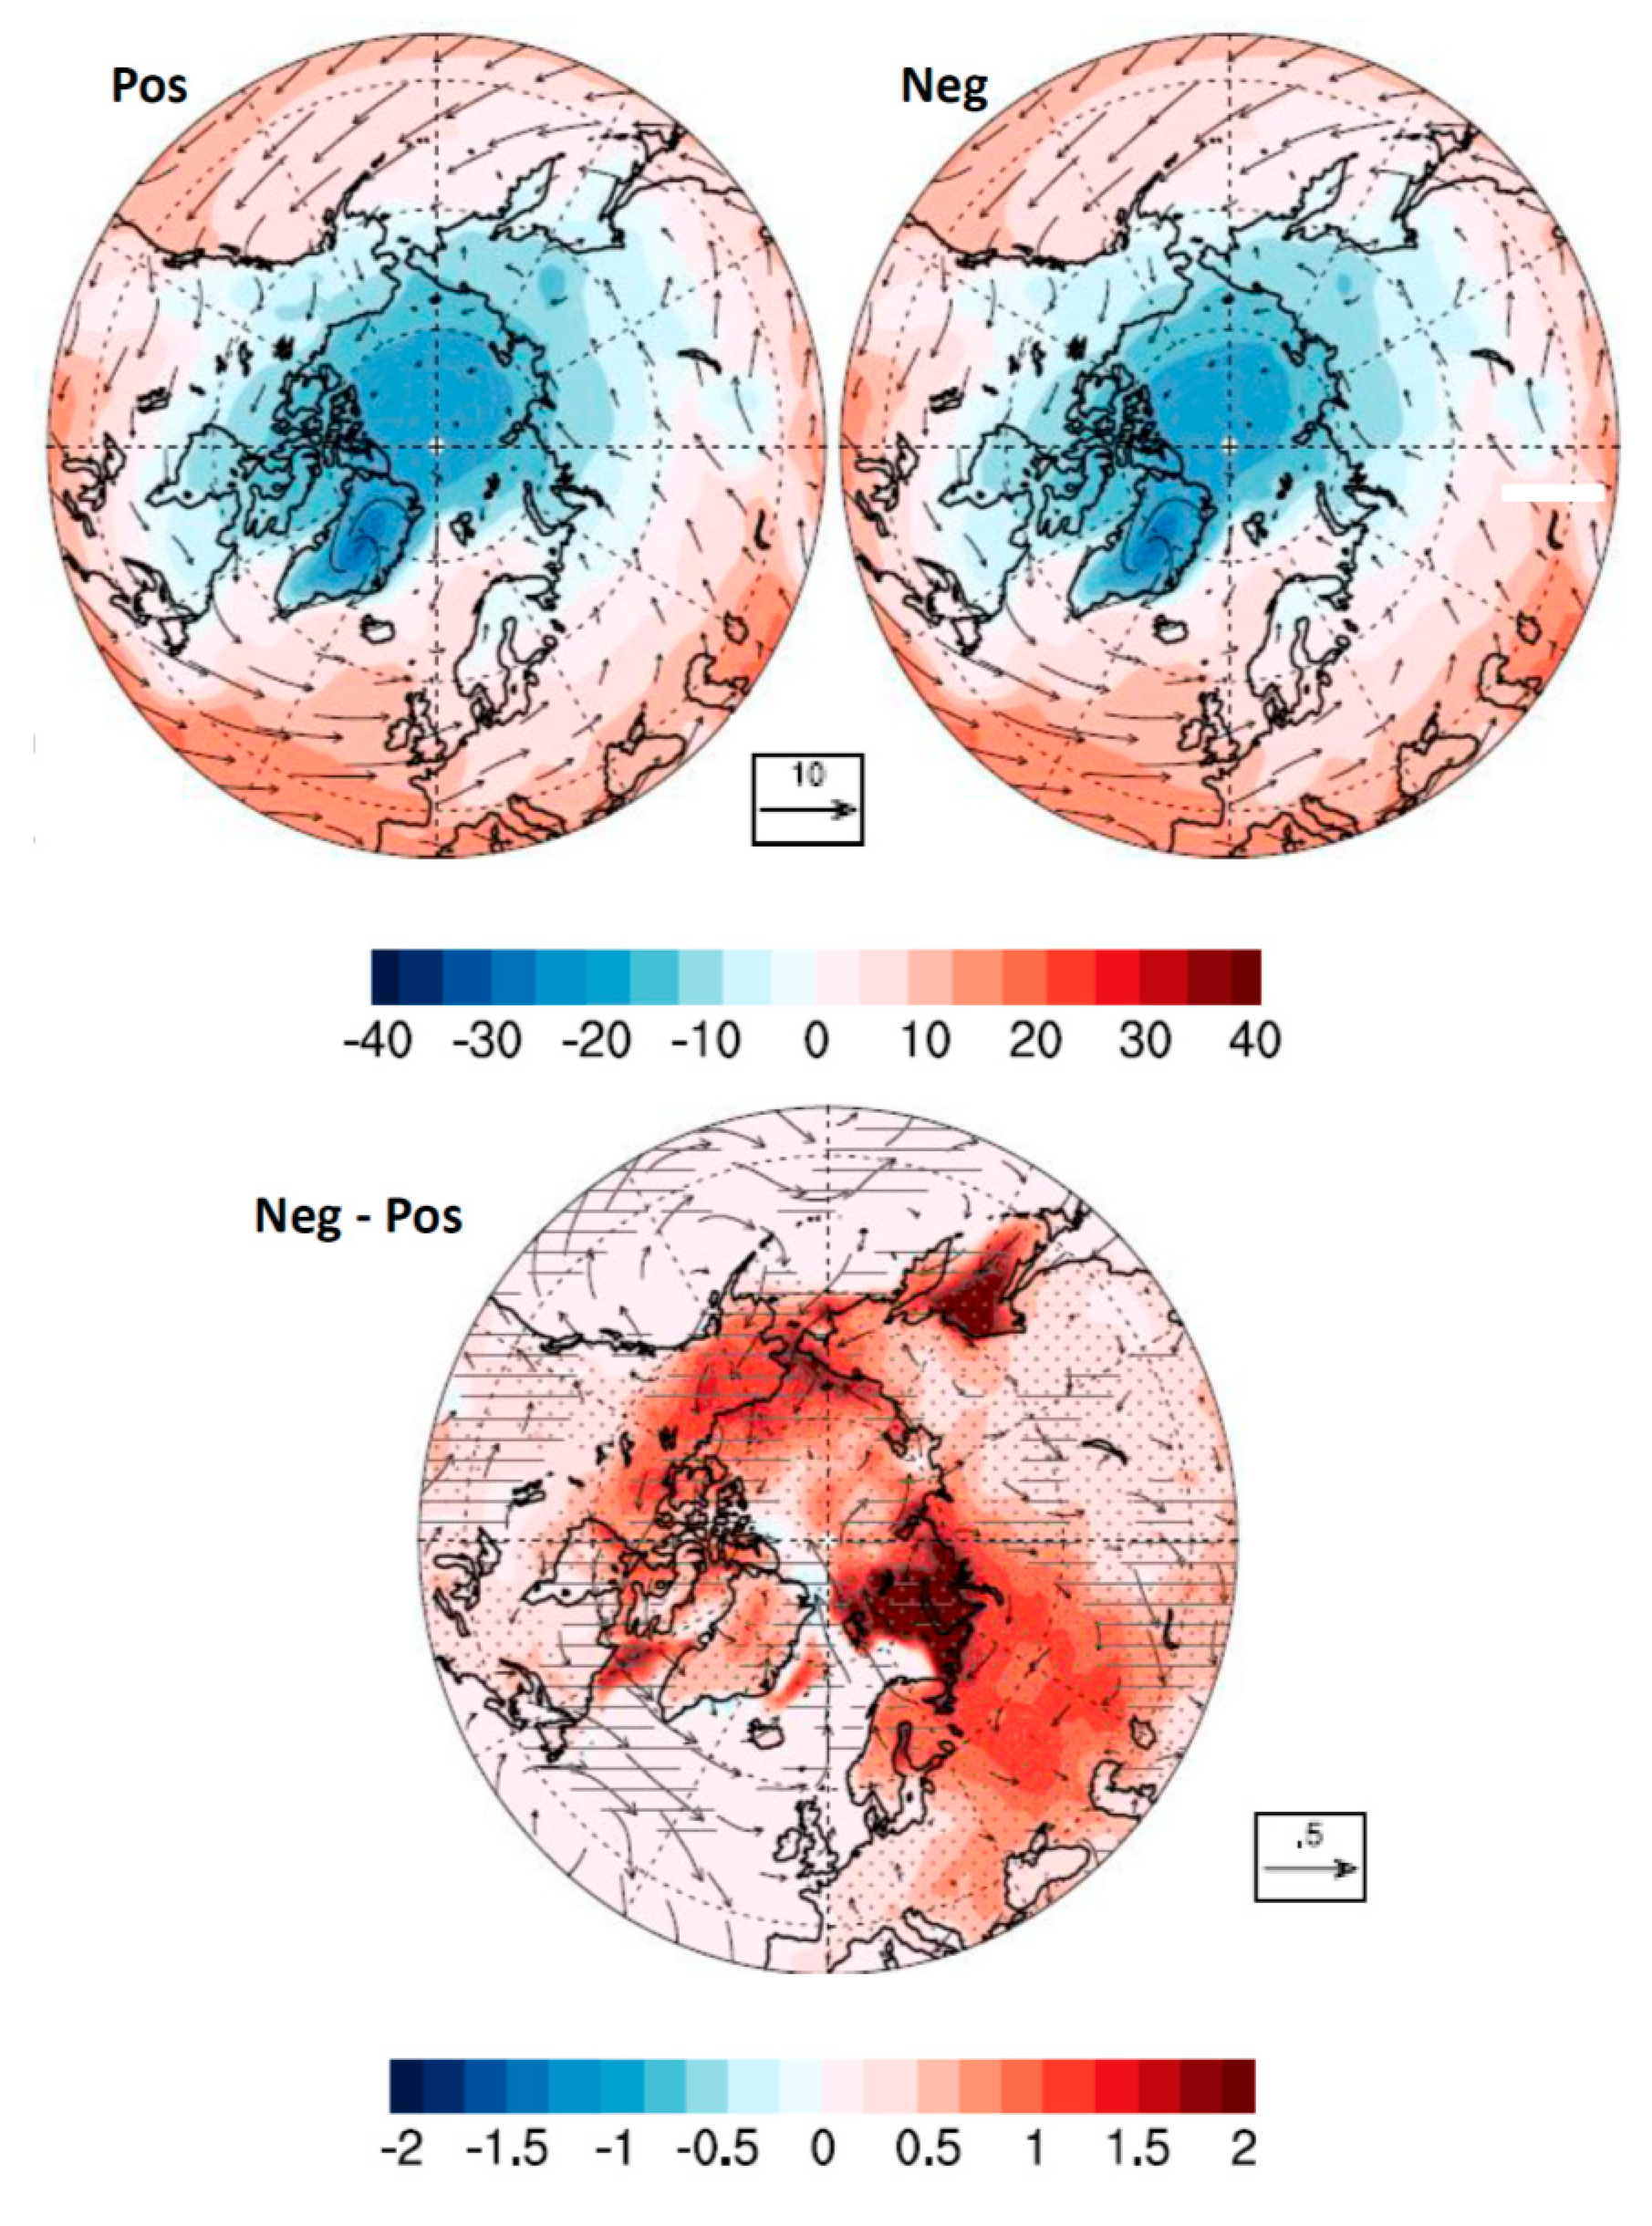
Figure 9 shows the spatial distribution of the surface air temperature (SAT) and surface wind in Pos and Neg and the difference between Neg and Pos. The air temperature at the lowest model level is termed as SAT for this study. The Arctic region exhibits the coldest temperatures with gradual warming as we move towards the south, away from the polar region. In spring, a comparison between Neg and Pos shows a large widespread warming in response to the reduced Arctic sea ice is found over the entire Arctic and the northern part of Eurasia and North America (
Figure 9). A cyclonic wind anomaly is located over the Arctic in association with the increased storm activity and there are anticyclonic wind anomalies over Eurasia and North Pacific.
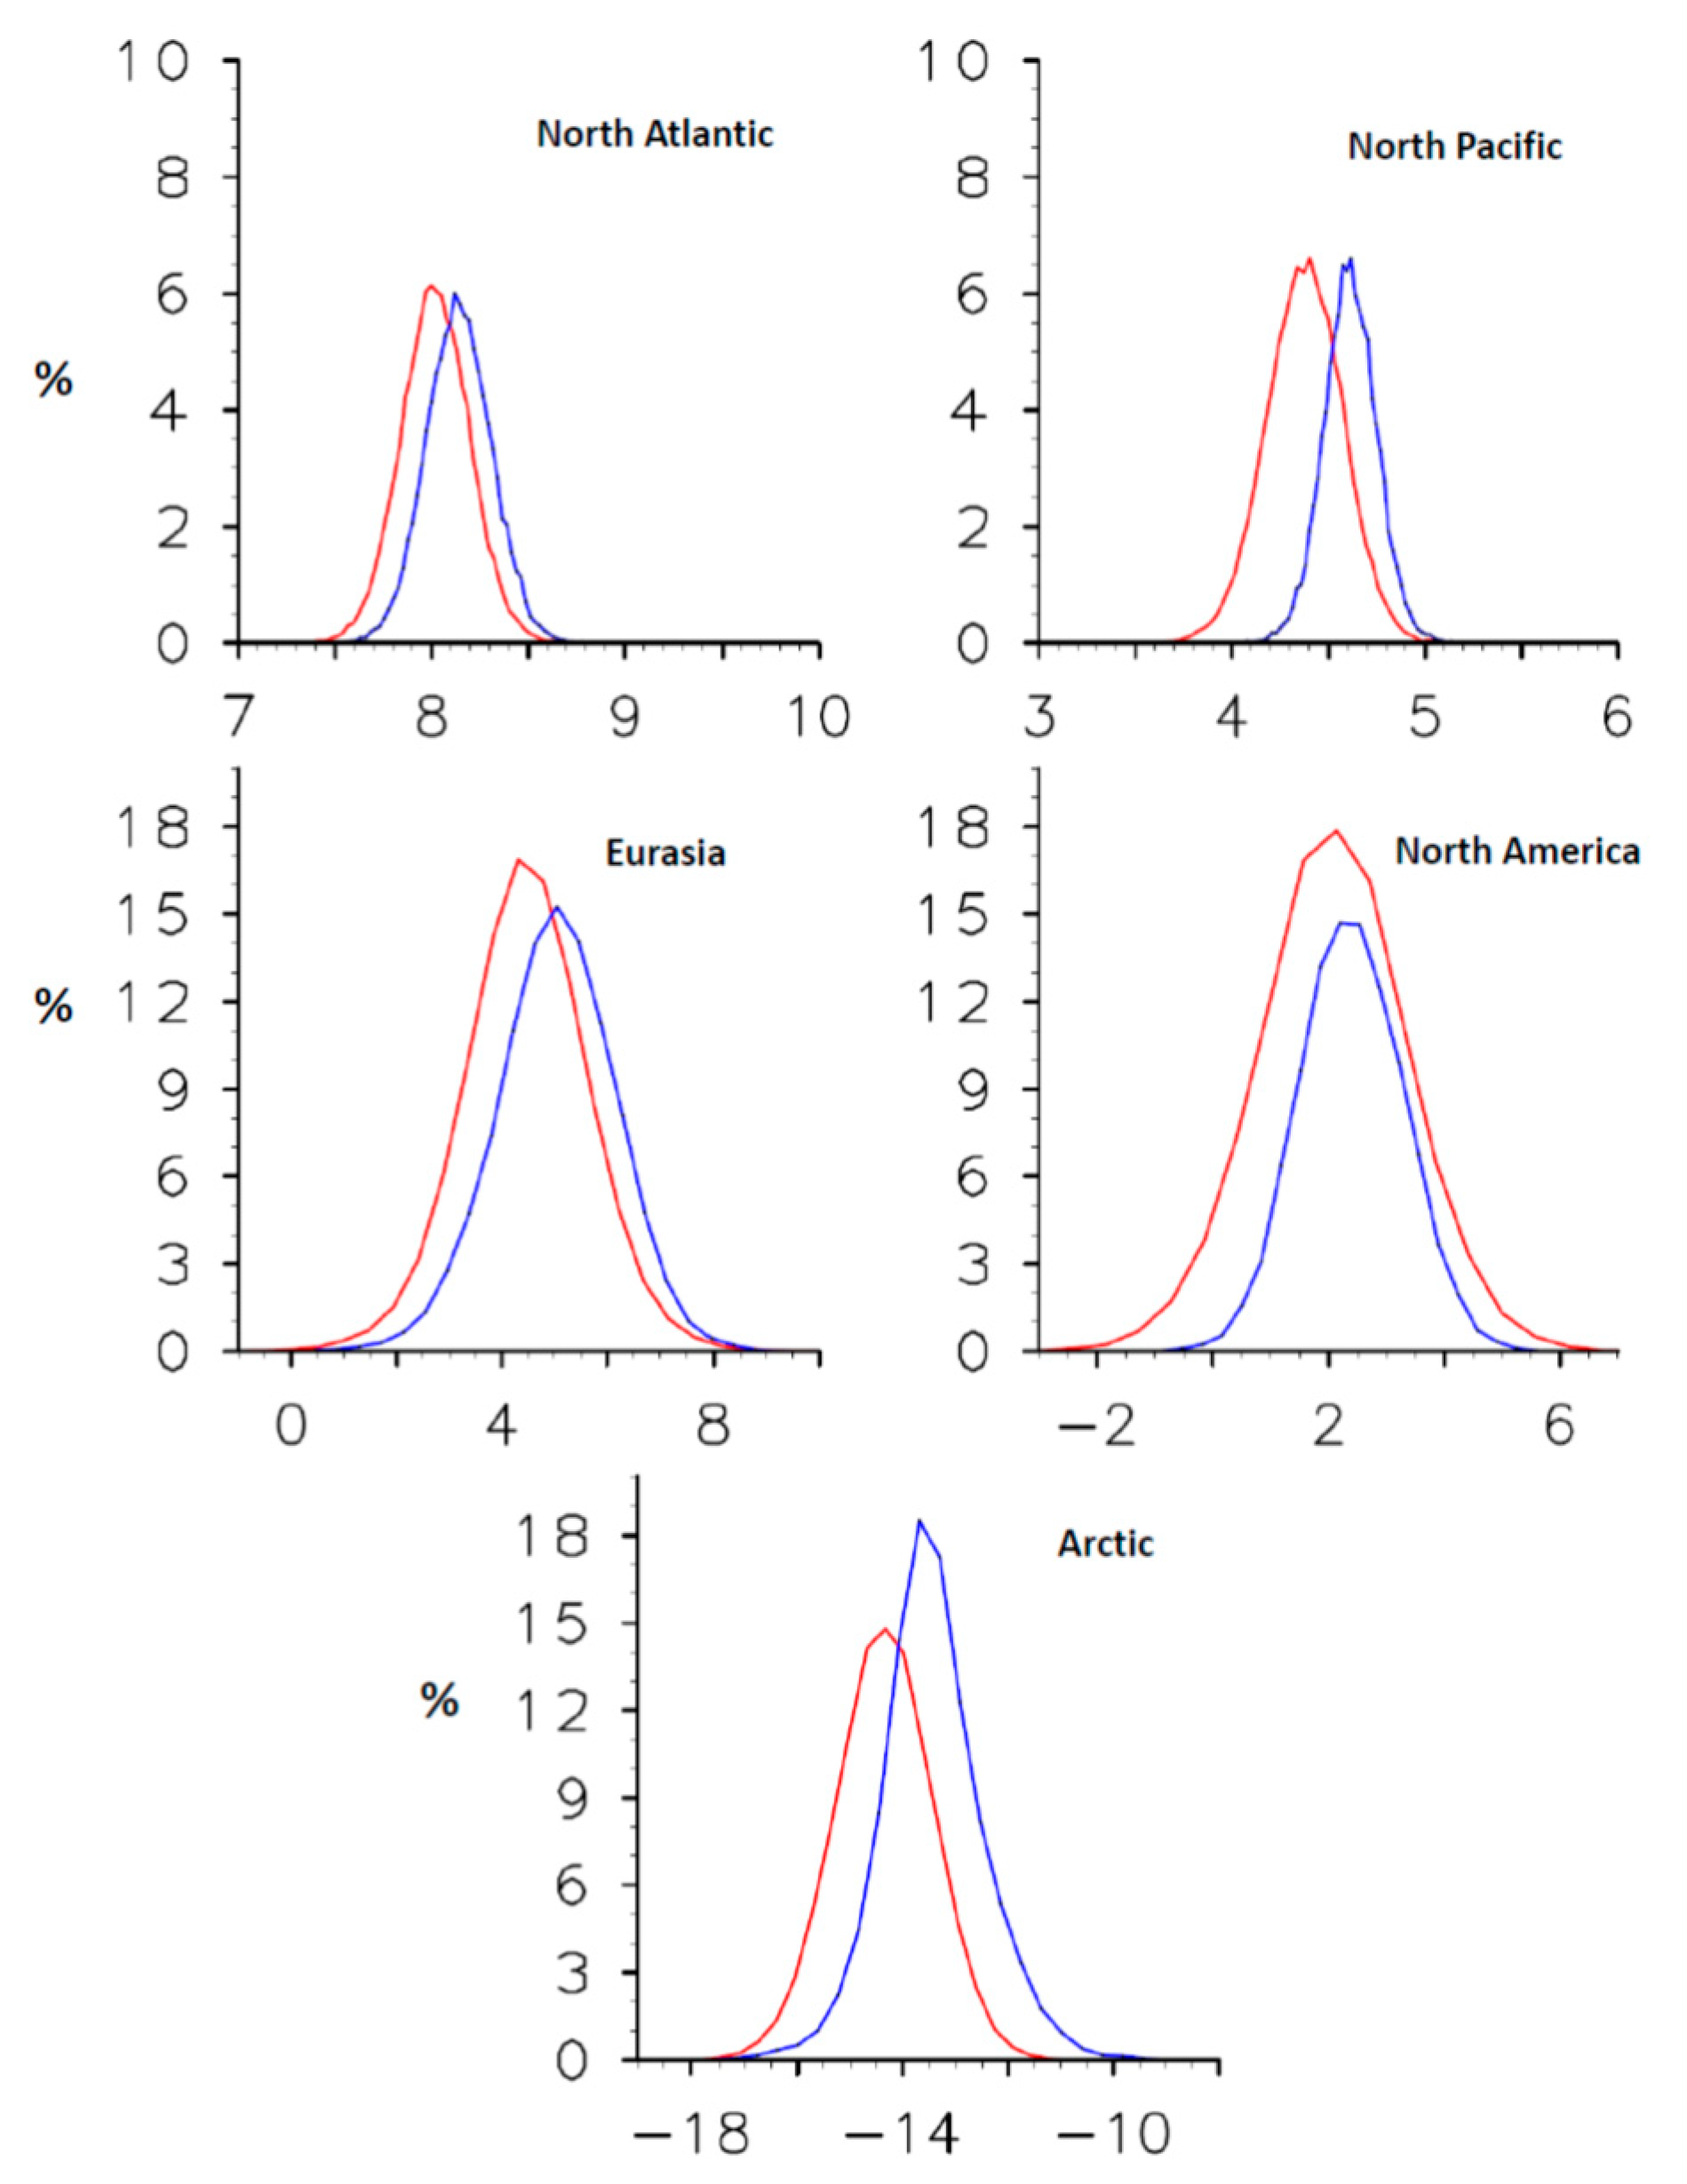
The PDF analysis of regionally averaged SAT (
Figure 10) complements our findings from the spatial analysis of SAT mentioned in the above paragraph. As expected, the coldest SATs are in the Arctic with North Atlantic being the warmest. The frequency of the warmer temperatures increases over all the regions except North America with the largest warming over the Arctic when there is less sea ice. Over the Arctic, the peak frequency shifts towards warmer temperatures in Neg with the mean changing from −15 °C to −13 °C.
A potential mechanism for the noticed changes in surface climate parameters could be as follows. The negative anomalies of Arctic sea ice in spring mainly occur over the Bering and Barents seas. Reduced sea ice results in dramatic warming over the Arctic and (to a lesser degree) mid-latitudes—one of the most pronounced changes in SAT in our experiments. There are prominent positive SAT anomalies located over the Barents Sea which extend into the Eastern Eurasian continent and extends over the western Arctic. A decrease in storm activity is associated with increased SLP and fewer clouds which results in enhanced shortwave (SW) heating over the continental mid-latitude regions by 3 W/m2 and 4 W/m2 respectively for Eurasia and North America. A prominent land-ocean temperature contrast over the high-latitudes contributes to the increased storm activity which results in decreased SLP, cyclonic wind anomalies and increased precipitation, over the Arctic. The increased storm activity causes increased temperature advection into the Arctic, through the Bering Strait along the eastern coast of Eurasia and through the Nordic Seas contributing to the anomalous warming pattern in spring. Anomalous sensible and latent heat fluxes (3 W/m2) due to reduced sea ice makes a local contribution to these regional warmings over the Arctic.
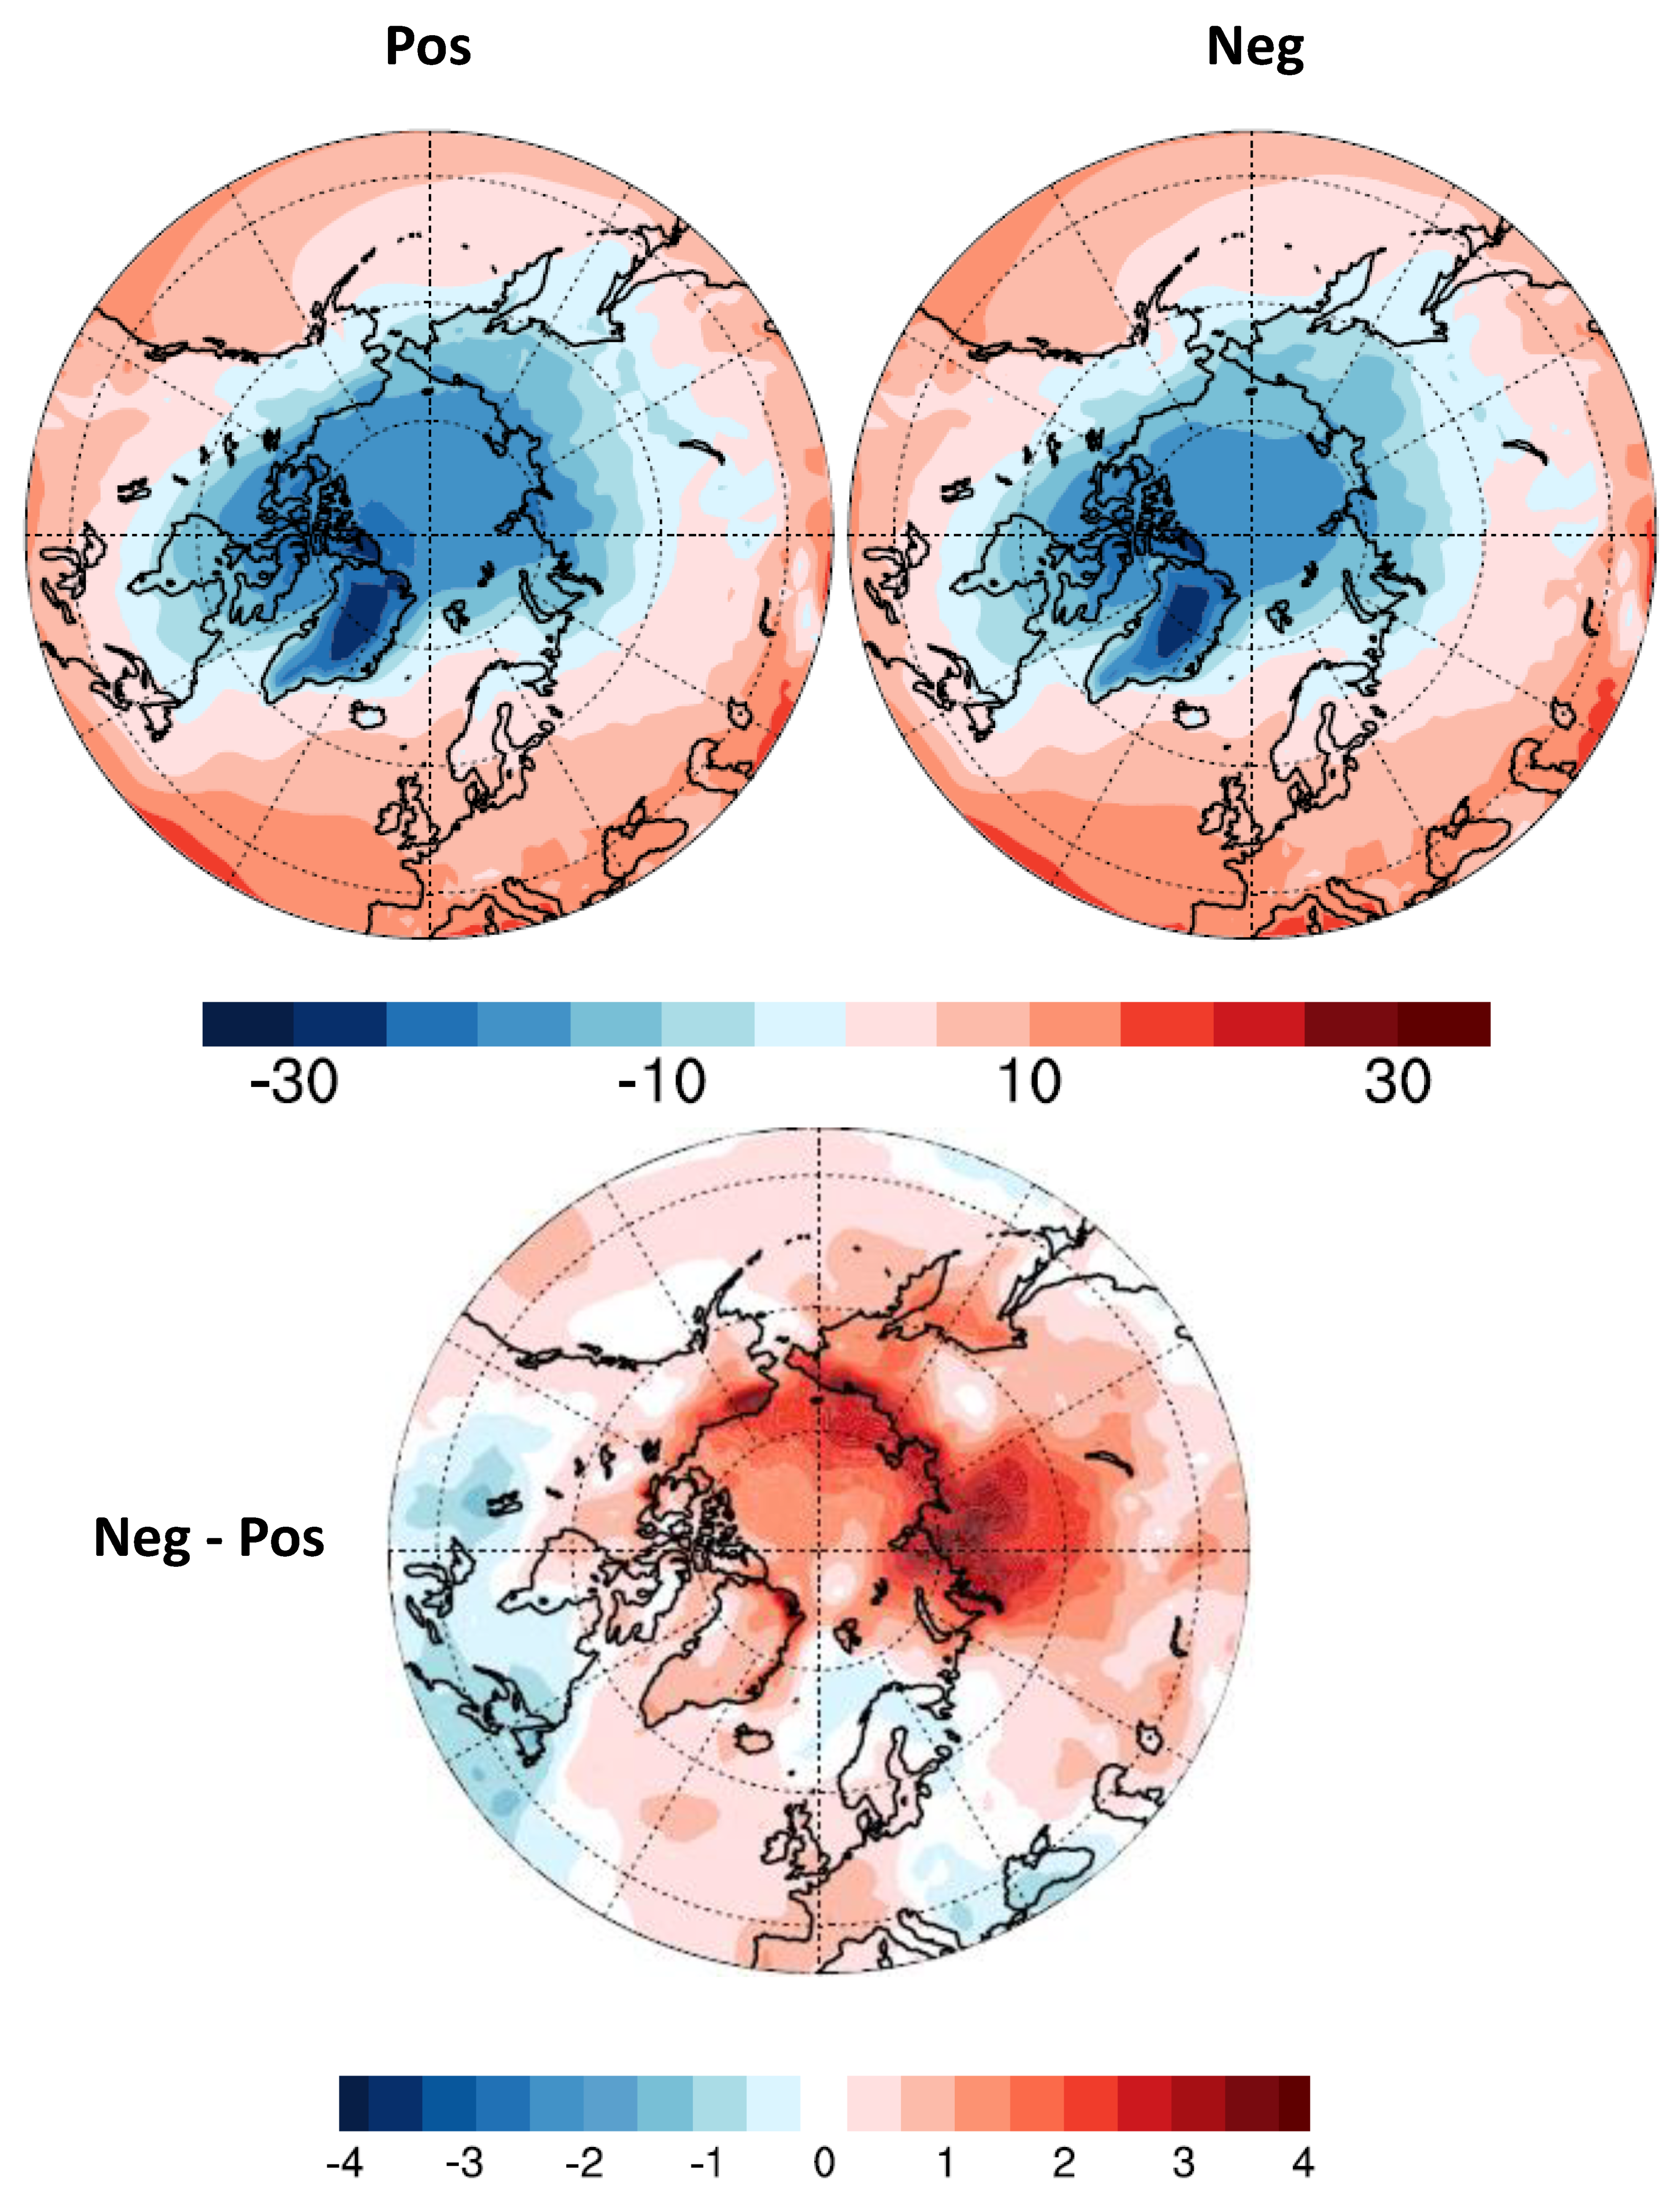
To compare our prominent changes in SAT with the observations, a similar composite analysis based on Arctic sea ice extent was performed on monthly global SATs from the ERA Interim reanalysis datasets (
Figure 11). The comparison shows, most of our findings of SAT anomalies in response to reduced Arctic sea ice corresponds well with the observed SAT anomalies. A similar warming pattern persists over the Arctic in spring.
4. Discussion
In the previous sections, we have shown that reduced Arctic sea ice extent causes substantial anomalies in storm activity and surface climate parameters.
There is a growing number of studies which suggest that storm activity has increased over the Arctic in a warmer climate that is linked to the loss of sea ice [
35,
40]. In this study, we have linked the changes in Arctic sea ice extratropical cyclone activity and we have further linked these changes cyclone activity to extreme weathers through changes in surface wind, precipitation and air temperature. We have demonstrated that in response to reduced Arctic sea ice there is indeed increased storm activity over the Arctic in spring. We have also found a dramatic springtime warming in response to reduced sea ice, which is consistent with the findings from previous studies [
45]. Rapid sea-ice decline affects the overlying atmospheric circulation pattern by exciting stationary Rossby wave train propagation towards Eurasia and East Asia [
21]. This altered circulation pattern influences the cyclones and anticyclones [
41]. We note that previous studies [
30,
46,
47] have linked reduced sea ice and Eurasian cold weather events to increased snow cover; however, we have demonstrated that the cooling may be associated with intensified anticyclones over Eurasia along with reduced total precipitation in response to decreased sea ice.
5. Conclusions
Increased storm activity observed over the Arctic in recent years has been a hot topic in the scientific community. To understand the response of the extratropical storms to observed Arctic sea ice, we conducted a modeling experiment, using the NCAR Community Atmosphere Model (CAM) version 3.1. A Lagrangian approach, a storm identification and tracking algorithm [
35], was used to derive statistics of the 6-hourly based storm activity for a composite analysis corresponding to the years with below and above average sea-ice extent. In this modeling study, we identified the sole impacts of sea ice change on storm activity and surface climate parameters like SAT, surface wind, total precipitation, and total snowfall. Thus, through altering extratropical storm activities Arctic sea ice changes indirectly affects the extreme weather events. The new scientific findings obtained in this study are summarized below:
We note that the present analyses are subject to certain limitations. The Arctic climate system and its relationship with mid-latitude weather systems is driven by many complex physical mechanisms and is difficult to fully understand. Climate models are known to have biases compared to observations. A comprehensive evaluation of the model biases of climatology simulated by this model has been done for example, by [
42] and can be found at NCAR’s webpage (
http://www.cesm.ucar.edu/models/atm-cam). Also, the sea ice data, derived from satellite measurements, are known to have biases. Thus, due to the impact of biases in both the model and the observational data sets on our results, they are somewhat limited. In the future, improved sea ice and ocean data and improved model physics will help minimize these uncertainties. Note also that in order to identify the response of climate parameters to changes in Arctic sea ice we have fixed SST and Southern Hemisphere sea ice, thus limiting somewhat the impacts of the feedback mechanisms on atmospheric variability. Despite these limitations, the results we have presented in this study provide insight and contribute towards our understanding of the impact of Arctic sea ice on individual extreme weather events through changes in extratropical storms in the Northern Hemisphere and corresponding changes in surface climate.
Increased storm activities over the Arctic have notable implications for humans and the natural environment. Results from this study will help improve understanding, enhance predictive capability, and reduce uncertainties of future projection of storm events over mid-latitudes and the Arctic Ocean Sector, which is important for advancing policy for decision-making processes.


