
Relational Structure-Aware Knowledge Graph Representation in Complex Space


1
School of Software, Dalian University of Technology, Dalian 116620, China
2
Institute of Innovation, Science and Sustainability, Federation University Australia, Ballarat, VIC 3353, Australia
3
Department of Mathematics, National Tsing Hua University, Hsinchu 30013, Taiwan
4
Computer Science Department, Community College, King Saud University, Riyadh 11437, Saudi Arabia
*
Author to whom correspondence should be addressed.
Mathematics 2022, 10(11), 1930; https://0-doi-org.brum.beds.ac.uk/10.3390/math10111930
Submission received: 5 May 2022
/
Revised: 2 June 2022
/
Accepted: 2 June 2022
/
Published: 4 June 2022
(This article belongs to the Special Issue New Trends in Graph and Complexity Based Data Analysis and Processing)
Abstract
:Relations in knowledge graphs have rich relational structures and various binary relational patterns. Various relation modelling strategies are proposed for embedding knowledge graphs, but they fail to fully capture both features of relations, rich relational structures and various binary relational patterns. To address the problem of insufficient embedding due to the complexity of the relations, we propose a novel knowledge graph representation model in complex space, namely MARS, to exploit complex relations to embed knowledge graphs. MARS takes the mechanisms of complex numbers and message-passing and then embeds triplets into relation-specific complex hyperplanes. Thus, MARS can well preserve various relation patterns, as well as structural information in knowledge graphs. In addition, we find that the scores generated from the score function approximate a Gaussian distribution. The scores in the tail cannot effectively represent triplets. To address this particular issue and improve the precision of embeddings, we use the standard deviation to limit the dispersion of the score distribution, resulting in more accurate embeddings of triplets. Comprehensive experiments on multiple benchmarks demonstrate that our model significantly outperforms existing state-of-the-art models for link prediction and triple classification.
Keywords:
message passing; complex space; knowledge representation learning; link prediction; triple classificationMSC:
68T07; 68T301. Introduction
Knowledge graphs are large-scale semantic network knowledge bases that utilise a graph-structured topology to integrate data [1,2]. They are widely used in multiform real-world applications. For instance, recommender systems can leverage knowledge graphs to establish semantic connections between items to improve the accuracy of recommendation [3,4]. Search engines can utilise knowledge graphs to establish user’s interest collection through a variety of relations to provide intelligent and personalised search results [2,5,6]. To conveniently and efficiently utilise knowledge graph information, recent advances in this domain focus on learning effective representations of knowledge graphs, also known as knowledge representation learning (knowledge graph embedding) [7,8]. Knowledge graph representation learning can learn distributed representations of the knowledge graphs, which can significantly improve computing efficiency, effectively alleviate the data sparseness of knowledge graphs, etc. Thus, knowledge representation learning can further facilitate knowledge graphs in real applications, such as providing personalised recommendations and optimising intelligent search services.
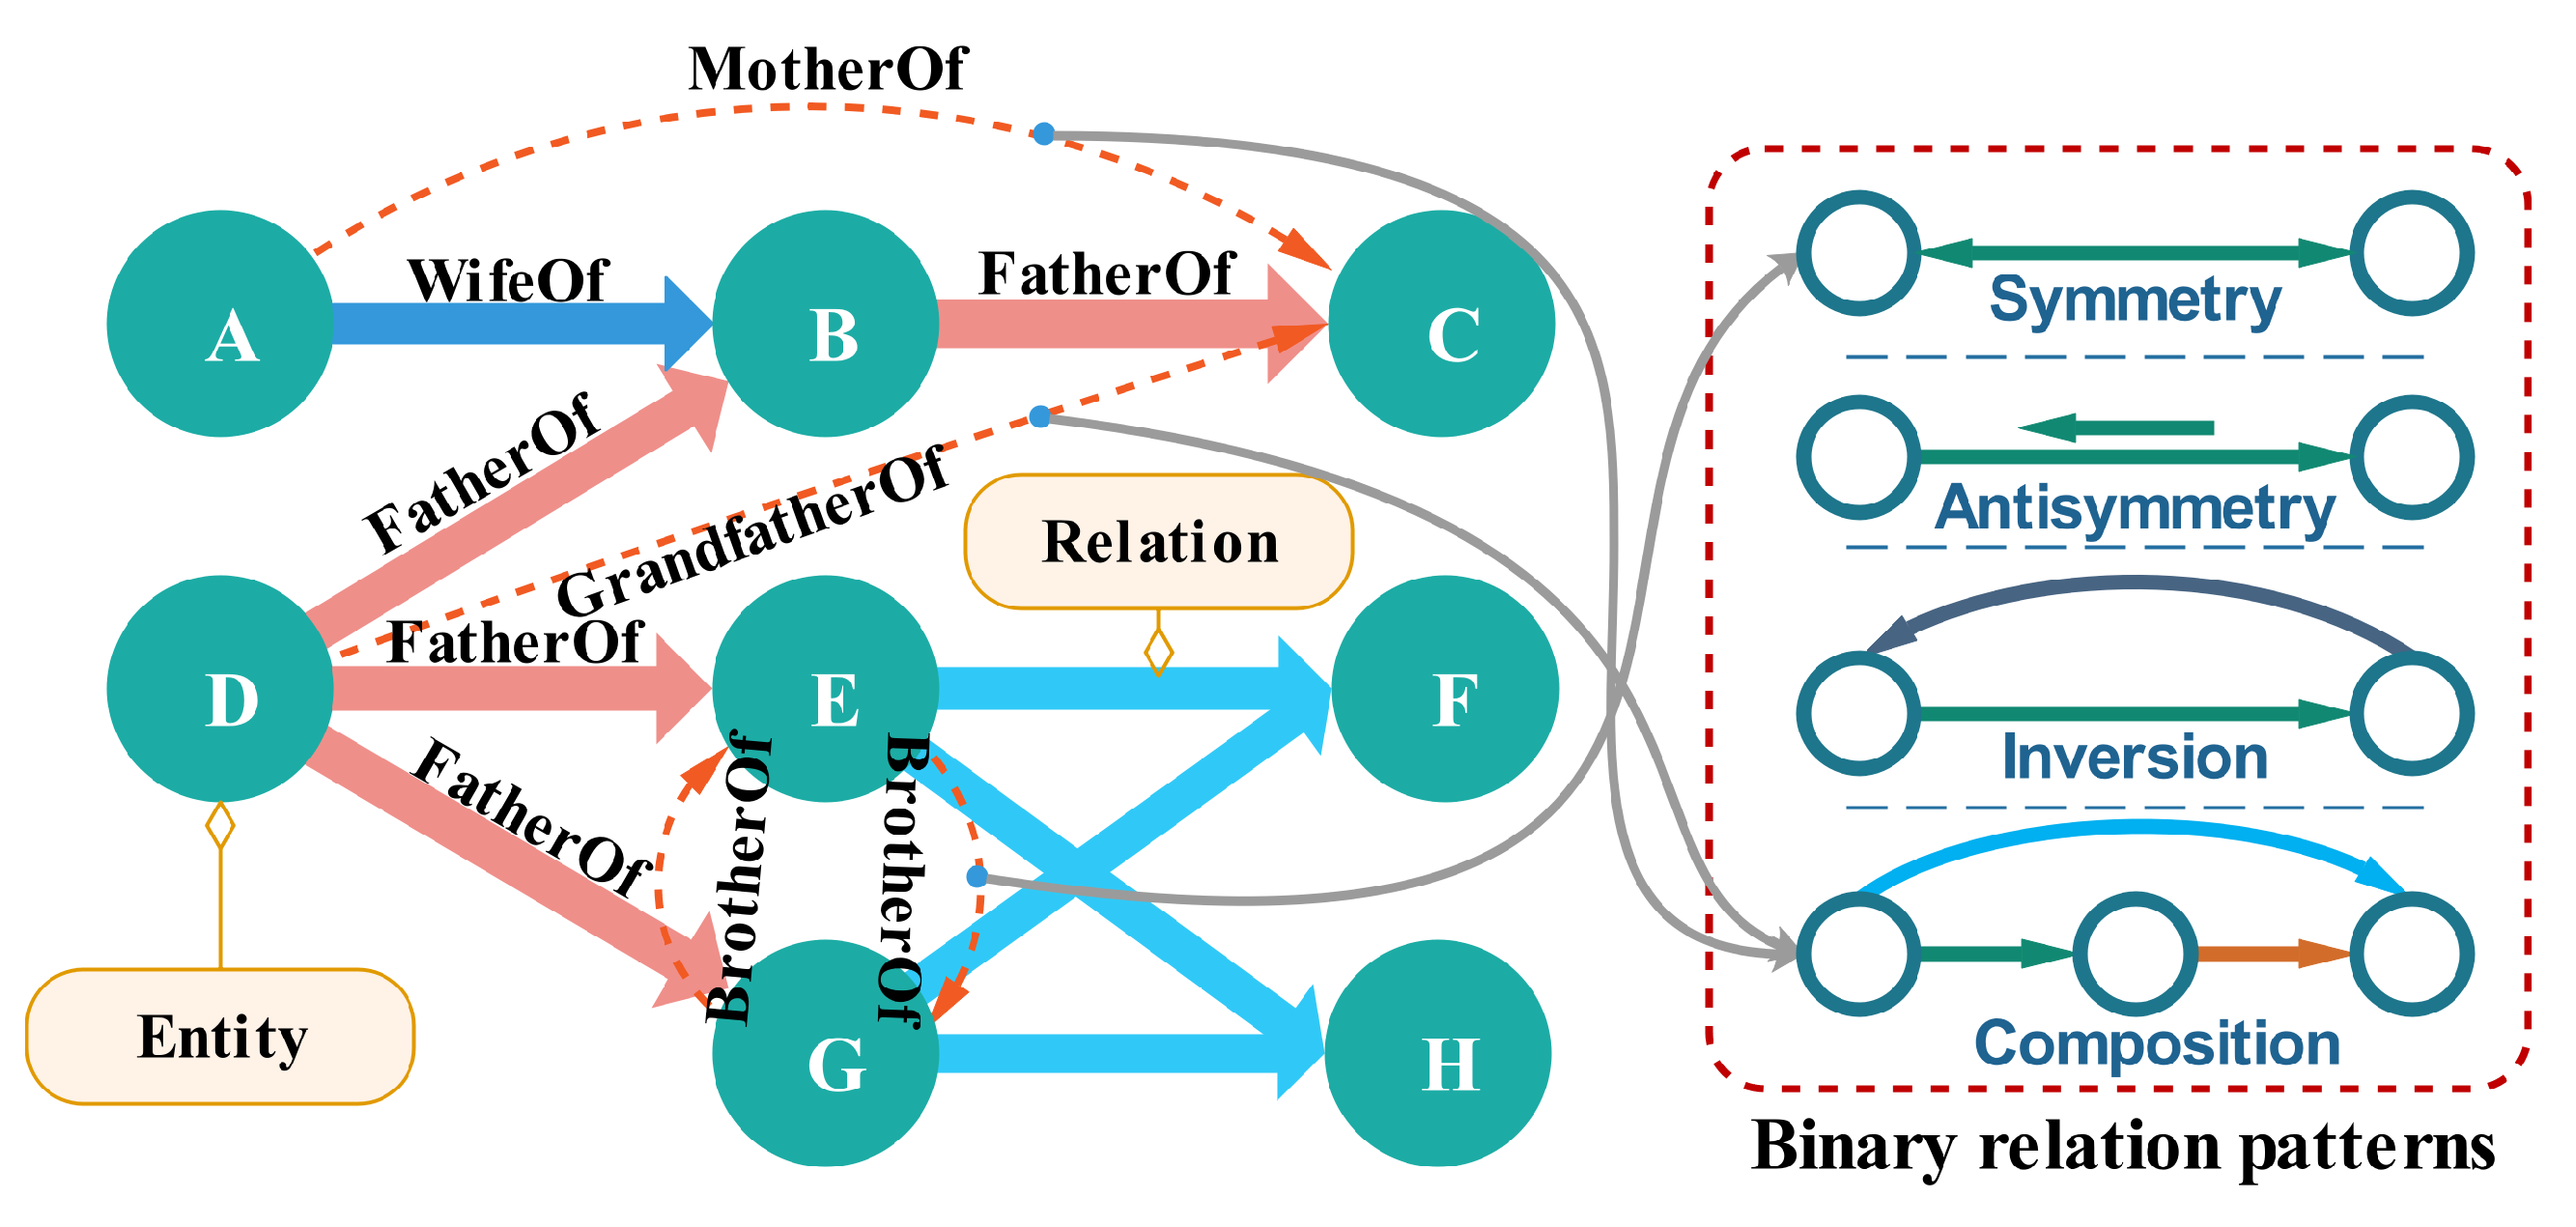
In knowledge graphs, various complex relations establish associations between entities, playing a major part in the expression of semantic information. These complex relations have rich relational structures [9] and binary relational patterns [10]. For instance, given triplets (D, FatherOf, B), (D, FatherOf, E), (D, FatherOf, G), (B, GrandfatherOf, C), the entity “D” has multiple relations to multiple entities. Moreover, a relation can have various binary relation patterns, for example the relation “GrandfatherOf” is the combination of two “FatherOf” relations. A simple illustration of complexity of relations is shown in Figure 1. Thus, how to effectively model various complex relations to capture the rich semantic information in knowledge graphs is a challenging area of knowledge representation learning, which has attracted much attention from many researchers [11,12,13,14].
Recently, extensive and various solutions for modelling complex relations of knowledge graphs have been proposed [15,16,17]. These solutions usually contain three steps: (1) defining a relation modelling strategy; (2) defining a score function that measures positive and negative triplets; (3) minimising the loss function based on the defined score function. For example, TransE [18] is a promising natural-language-based model. It treats a relation between two entities as a translation process following the translational principle and builds a two-way model to capture relations between entities. However, both entities and relations are embedded in a single space. Inspired by TransE, TransH [9] and TransR [19] embed entities and relations based on the translation process. They map entities and relations into different spaces; thus, they can preserve rich relational structures (multi-mapping relations), such as many-to-many (M2M), many-to-one (M2O), and one-to-many (O2M) relations. However, these methods lack the ability to address various types of binary relations [20,21,22,23], such as symmetric (e.g., brothers), antisymmetry (e.g., father), and inversion (e.g., hypernym). However, some knowledge representation learning methods are designed to solve this problem. For example, ComplEx [24] can capture (anti)symmetry and inversion relations, but it maps relation and entity vectors into a single complex space. Specifically, RotatE [10] has a similar translation strategy to TransE [18]. It treats a relation as a rotation from source entities to target entities in a single complex space. These complex-number-based methods only map various complex relations into a single feature space. Thus, they cannot hold the various relational structures.
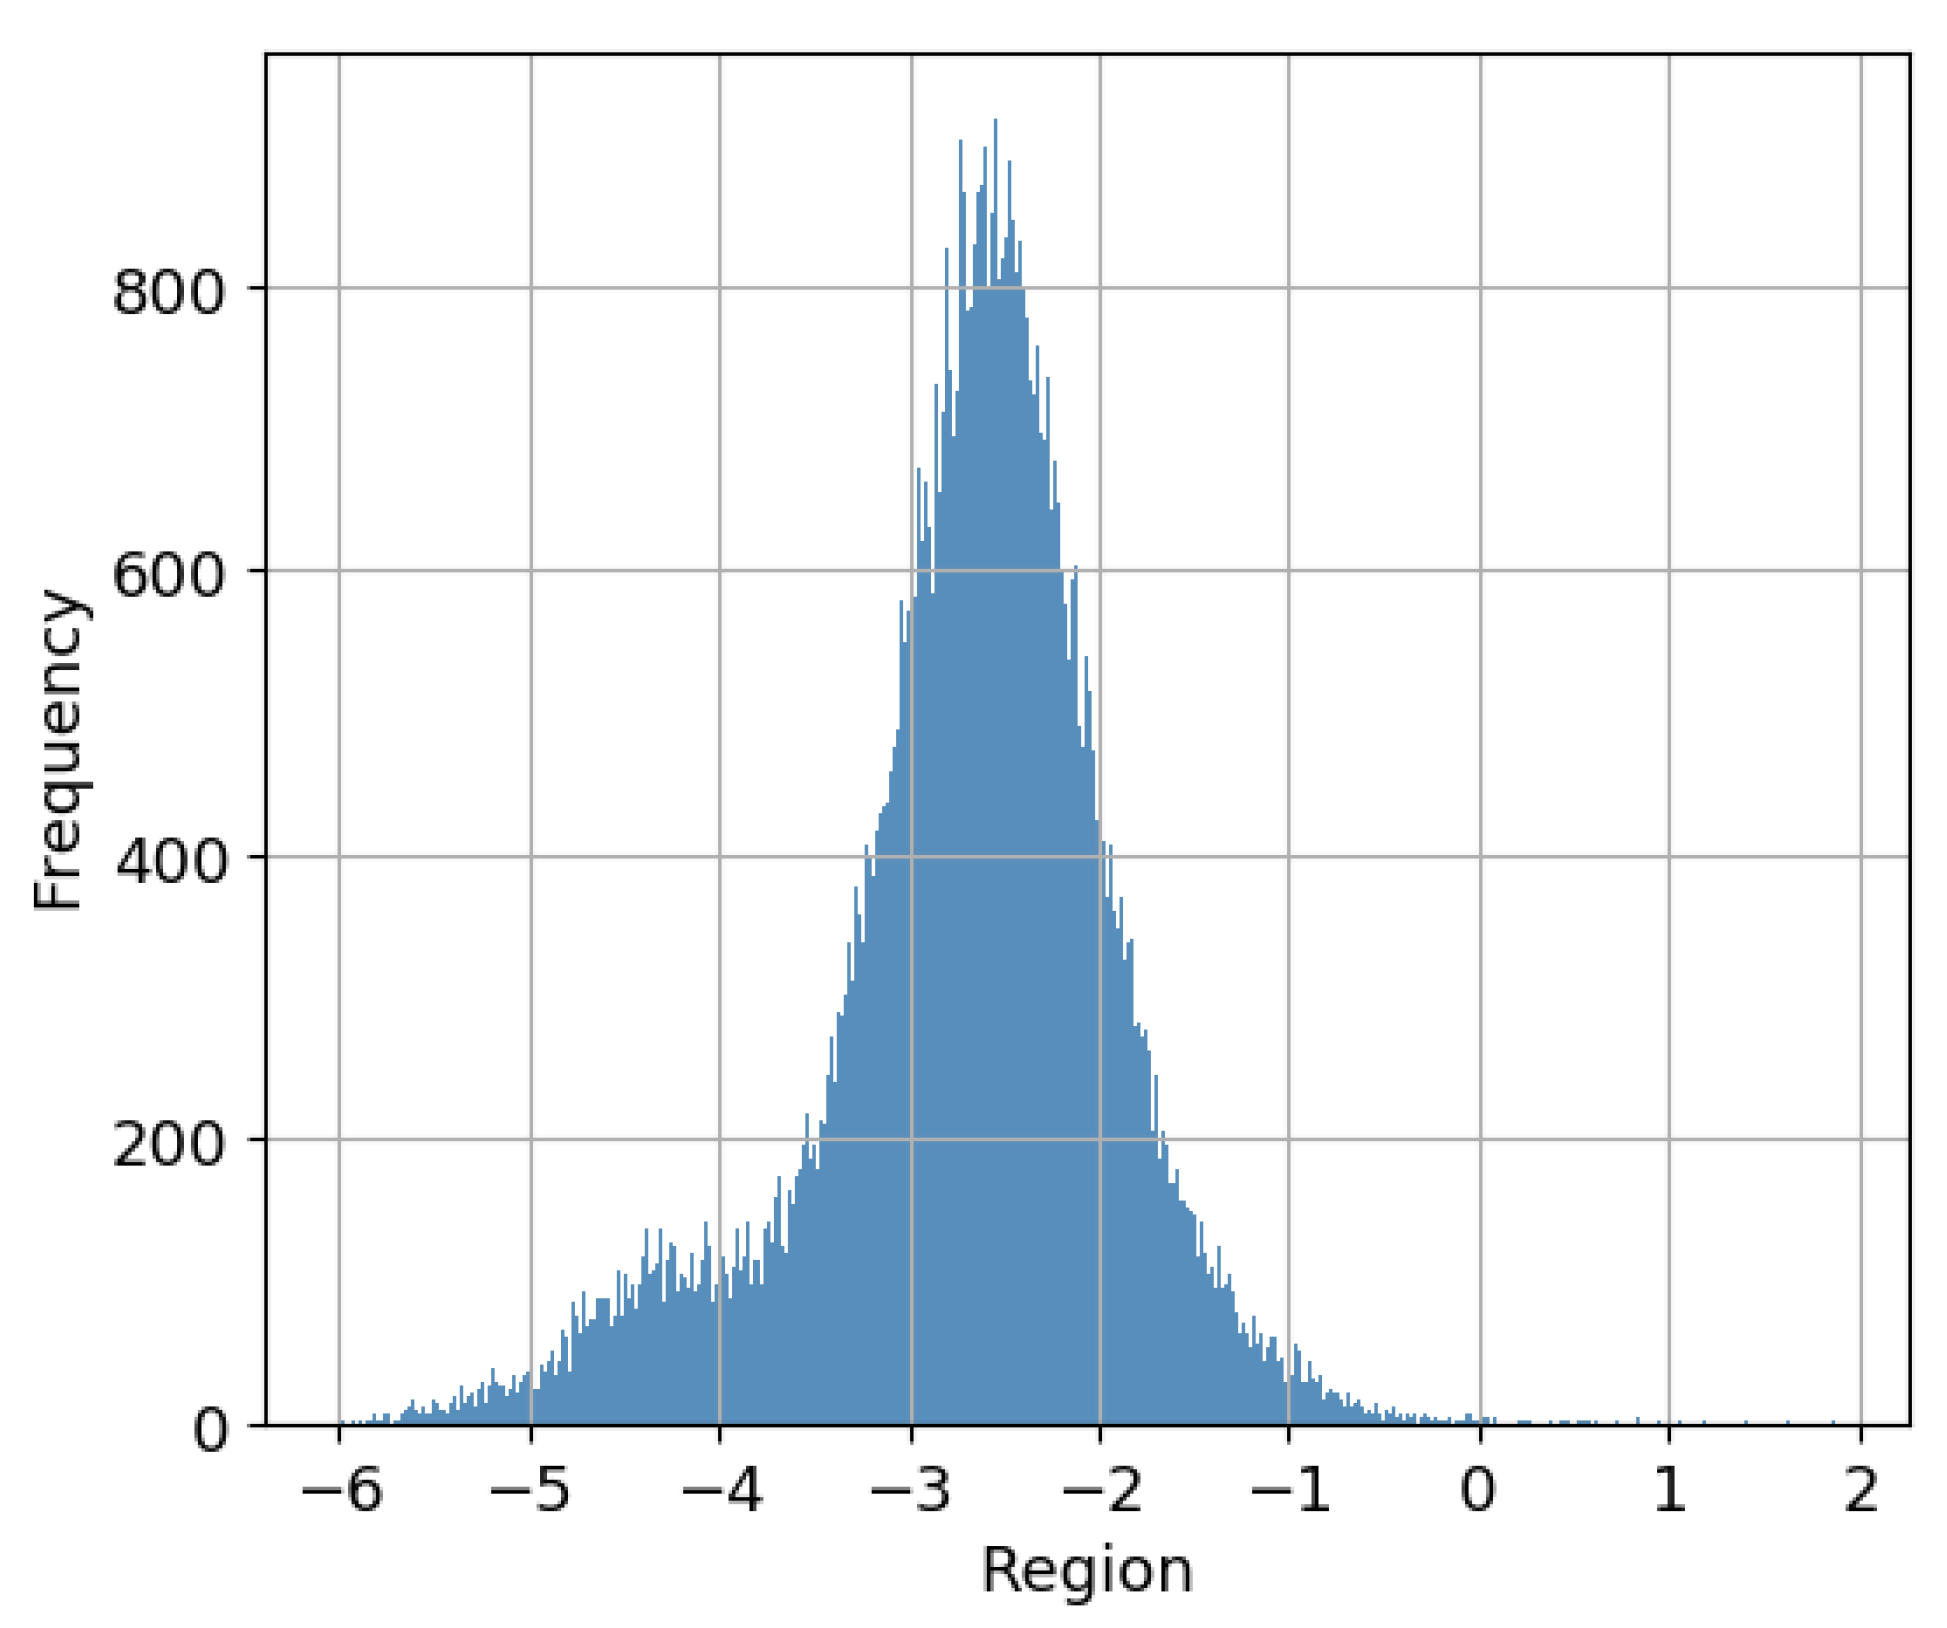
Due to the complexity of relations, previous solutions are not flexible enough to capture the various binary relation patterns and structural information simultaneously. Therefore, we deployed multiple complex spaces and propose a novel knowledge representation learning model, namely MARS, to explore complex relations to embed knowledge graphs. MARS takes advantage of RotatE [10], which can fully preserve various binary relation patterns including (anti)symmetry, inversion, and composition. Furthermore, our proposed model maps embeddings of entities and relations into multiple feature spaces, thus leading to preserving rich relational structures, such as multi-mapping relations. To strengthen the assumption in the network representation learning, that is the connected nodes have similar representations, we utilised the message propagation mechanism [25] to restrict feature vectors of entities following the graph connectivity structure. This simple trick makes embeddings of entities able to well preserve local and global structural information. In addition, we found that the scores generated from the original score function approximate a Gaussian distribution. A simple illustration is shown in Figure 2. The scores in the tail part cannot correctly represent the corresponding positive and negative samples. Thus, we involved the standard deviation approach in solving this problem to obtain more accurate embeddings of triplets. The main contributions of our work are summarised as follows:
- We present a novel knowledge graph representation learning framework, namely MARS, to exploit complex relations for embedding knowledge graphs. MARS can effectively capture various binary relation patterns, as well as rich relational structures in knowledge graphs. Thus, our model can achieve more accurate embeddings.
- We find that the scores of triplets that preserve rich relational structures and various binary relational patterns approximate a Gaussian distribution. The scores in the tail have negative influences on tasks. To overcome this weakness and optimise the accuracy of embedding triplets, we specifically involved the standard deviation approach to alleviate the deviation caused by the scores of the triplets located in the tail of the distribution, leading to better performance in triple classification and link prediction.
- We conducted comprehensive experiments on several benchmark datasets. The experimental results of MARS consistently outperformed state-of-the-art models on the tasks of link prediction and triple classification. This demonstrates the effectiveness of our proposed model.
This paper is divided into six sections. Section 2 deals with the previous relevant research related to our study. Section 3 introduces some involved basic concepts and definitions. Section 4 presents the details of our model. Towards the end of our study, Section 5 provides a detailed experiment introduction and the related experimental results. Finally, Section 6 summarises our contributions.
2. Related Work
As we know, knowledge bases store triplets in the form of one-hot vectors. With this representation, we need to design special graph algorithms to calculate the semantic and reasoning relations between entities. These one-hot-vector-based models have a high computational complexity and are hard to transfer to other datasets. Compared with these traditional models, knowledge representation learning can learn distributed representations of triplets in a low-dimensional continuous feature space; thus, it can efficiently calculate semantic similarity, leading to higher computing efficiency. In addition, the representations can effectively alleviate the problem of data sparsity and can effectively fuse the heterogeneous information of knowledge graphs. In recent years, numerous investigations have been conducted in this domain. We introduce several representative models, including classical models and the recent deep-learning-based models in the following.
The classical knowledge embedding methods, for instance TransE [18], are derived from a natural language model [26,27]. TransE projects both entities and relations to feature vectors into a continual feature space. Let r represent a relation and s and t represent a source and target entity accordingly; the feature vectors follow the translational distance constraint . Given a triplet , if it describes a plausible or credible fact (golden triplets), r should be regarded as a translation from s to t. For example, given a triplet , this should satisfy the equation by a certain relation. Many subsequent models are proposed based on TransE with a more complex process of modelling relations. For instance, TransH [9] involves a plain vector space and relational projection matrix. TransR [19] involves two separate feature spaces for entity embedding and relation embedding. TransD [28] involves two mapping matrices for projecting source entities and target entities. It is a more fine-grained model compared with TransR. There are bilinear models, such as DISTMULT [29], ComplEx [24], SME [30], and ANALOGY [31]. Specifically, ComplEx and RotatE embed triplets into a complex feature space. The embeddings can well preserve binary relation patterns.
At present, one of the most popular knowledge representation learning methods is based on deep learning, as it can construct high-level semantic features from lower-level features suitable for tasks [15,32,33]. For instance, ConvE [34] utilises 2D-convolution to join features of triplets and then feeds the outputs from the fully connected layer to the logistic classification layer. R-GCN [35] is derived from graph convolutional networks (GCNs) [36,37,38]. The embeddings of entities are aggregated utilising the GCN method based on structural information. SCAN [39] benefits from both GCNs and ConvE [34]. SCAN introduces attributes’ information into the embedding vectors. There are some other methods for specific knowledge graph embedding. For example, wRAN [40] is based on an adversarial network. This method can be used for link prediction and relation extraction under low resource conditions. FSRL [41] is a few-shot knowledge graph completion framework based on LSTM. Some representative approaches and their abilities to model relations are summarised in Table 1.
Studies have shown the scalability and effectiveness of the above approaches. However, these approaches are still insufficient for modelling relations. Our proposed model (MARS) is a generalisation of RotatE in complex space, while we strengthen MARS’s ability to capture the structural information with the message-passing scheme [25]. Thus, MARS is capable of preserving both rich relational structures and binary connectivity patterns in knowledge graphs. In addition, we formally discuss the distribution of scores, and we involved the standard deviation method to alleviate the inaccurate representation problem caused by the unbalanced score distributions.
3. Preliminaries
Here, we firstly provide several introductions and explanations of the definitions and symbols that are used in our work:
Definition 1.
Multi-mapping relations. In knowledge graphs, entities connect through relations, and one entity may have multiple relations with entities. The multi-mapping relations (i.e., M2M, M2O, and O2M) were previously introduced by TransH [9]. The many-to-many (M2M) relation represents, for example, the parents-to-children relation; the one-to-many (O2M) relation represents, for example, the mother-to-children relation; the many-to-one (M2O) relation represents, for example, the children-to-father relation.
Definition 2.
Binary relation patterns. The definition of binary relation patterns in the knowledge graph domain was previously mentioned for ComplEx [24]. The binary relation has various relation patterns, such as symmetry/antisymmetry (like BrotherOf/FatherOf), inversion (like hypernym), and composition. If r is a symmetric relation, the triplet holds with ; if r is an antisymmetric relation, the triplet holds with ; if and are inverse, ; if is composed of and , .
Definition 3.
Embedding in complex space. The complex number is expressed in the form: , where and are both real numbers. The embedding vectors of entities and relations in complex space have the real part and the imaginary part .
Definition 4.
Positive (negative) triplet. A knowledge graph is a collection of triplets, which are usually golden triplets, also known as true facts. These golden triplets are also called positive triplets (samples). Negative triplets (samples) are the opposite of positive triplets, which are built by replacing their source or target entities.
To conveniently present our model, several main notations used in the following are listed in Table 2.
4. The Design of MARS
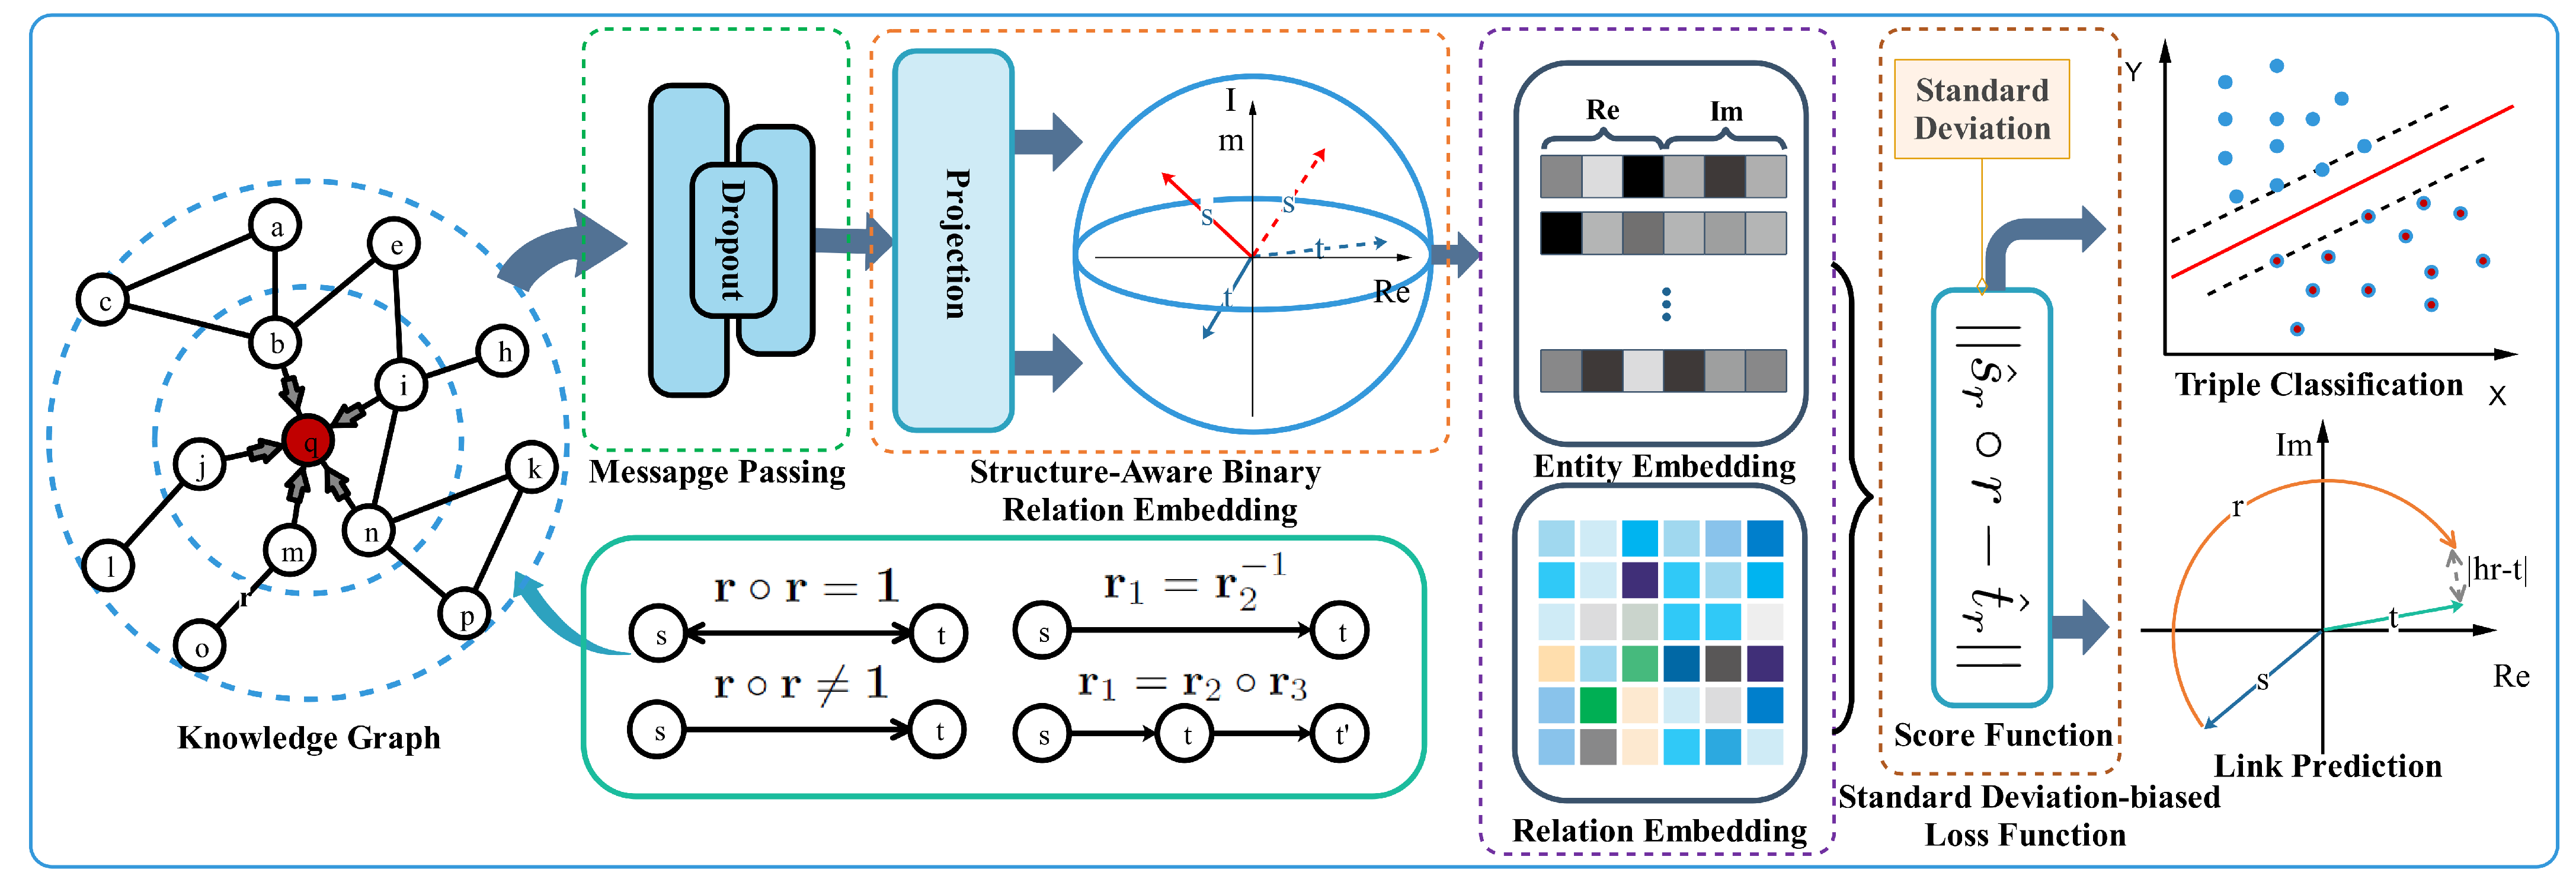
In this section, we introduce our proposed knowledge graph representation model, namely MARS, which is derived from RotatE [10] and focuses on representing triplets in a complex feature space. To strengthen the structural information of knowledge graphs, MARS firstly packs adjacency matrices of relations into entity feature vectors by leveraging the message-passing method [25]. Different from the strategy of RotatE, which embeds triplets into a single complex space, MARS maps triplets into different complex spaces based on the count of relations. In addition, to obtain more accurate embeddings of the original triplets, we involved the standard deviation method to alleviate the problem of the unbalanced score distributions. The framework of MARS is shown in Figure 3.
4.1. Message-Passing Scheme
The message-passing scheme [25] can aggregate neighbours’ features into the target node according to the structural information. The mechanism is expressed as follows:
where is the neighbour set of node i. is the weight of a relation. denotes the message function in the l-th layer, which aggregates features and according to . represents the update function, such as the Sigmoid function and Softmax function. In the complex space, the feature vector has two parts and ; thus the, hidden representation can be expressed as follows:
where is the message-passing weight of relation r in the l-th layer and is the weight of the self-loop of entity i. is the normalisation constant and is often set to .
4.2. Structure-Aware Binary Relation Embedding
To capture the rich relational structures, such as multi-mapping relations, MARS adopts the ideas of TransH and maps entities into the relation-specific complex hyperplanes. We obtain the conversions as follows:
where we restrict the conversion matrix to .
The RotatE algorithm [10] has proven that complex numbers can represent a binary relation pattern, such as (anti)symmetry, inversion, and composition. Thus, MARS projects triplets into complex spaces. The translation between entities and relations in complex space is defined as follows:
where , and . The notation ∘ represents the elementwise product. According to Euler’s formula , the translation can be treated as a rotation from the source entity to the target entity . That is shown in Figure 1. Given a triplet , the score function of MARS is defined as follows:
where and are the relation-specific projections of entities. The score of a triplet in complex space has a real part and an imaginary part. According to the product rule of complex numbers , the score function can be re-formed as
where is the concatenating operation. and return the real and imaginary part of a complex number. The source entity embedding , target entity embedding , and relation embedding r are the inputs of the following loss function part.
4.3. Standard-Deviation-Biased Loss Function
A common way to generate a negative sample is to replace the head or tail entities of a positive triplet with an entity selected from an entity set. However, the negative samples generated with the same probability p are not completely valid. To produce meaningful negative sampling, we adopted the self-adversarial negative sampling approach proposed by RotatE. The negative sampling approach could generate negative samples according to the following distribution:
where represents the free parameter of sampling. is the score function Equation (7), and is the j-th negative triplet of . The weight p of the negative sample is replaced with the above probability.
The scores of triplets from the original score function have an unbalanced distribution. The distribution phenomenon prevents obtaining high-precision embedding results. Thus, we designed a standard-deviation-biased loss function, which can adjust the score distributions of triplets. The smaller standard deviation makes the normal curve steeper and the score distributions more concentrated. We utilise x to represent the score of a triplet. More specifically, the standard deviation of x is expressed as follows:
where represents a triplet set. The notation is the mean of x. We treated the standard deviation of the scores as part of the loss. Therefore, it can reduce the negative effect of the scores of the triplets in the tail. The single loss of a triplet for MARS is expressed as follows:
where is the margin parameter and is a collection of negative samples generated from a positive triplet. Therefore, the final total or batch loss is:
where is the standard deviation of positive triplets, is a positive triplet set, and is the standard deviation of negative triplets generated by the self-adversarial negative sampling approach. In the total loss, we linearly combine two standard deviations with two hyperparameters and to balance the total loss. The pseudo-code of MARS is summed up in Algorithm 1.
| Algorithm 1 The pseudo-code of MARS |
|
5. Experiments
In this section, we thoroughly conduct experiments to verify the effectiveness of our model. This section is divided into five main subsections, an introduction to the used datasets and baselines, hyperparameter settings, evaluation protocols, and experiment results.
5.1. Datasets
Three common benchmark datasets, FB15K-237 (https://deepai.org/dataset/fb15k-237, accessed on 4 May 2022), FB15K (https://deepai.org/dataset/fb15k, accessed on 4 May 2022), and WN18 (https://deepai.org/dataset/wn18, accessed on 4 May 2022), were selected to evaluate the performance of our model in this study. The details are shown as follows:
- FB15K. The FB15k dataset contains triplets extracted from entity pairs of the freebase dataset. The entities and relations of the dataset are uniquely encoded and stored in the form of text in different files. The triplet file has 592,213 triplets; the entity dictionary file has 14,951 unique entities; the relation dictionary file has 1345 unique relations.
- FB15K-237. The FB15K-237 dataset is a subset of the Freebase knowledge base. It is extracted and purified from the FB15K dataset by removing the inverse relations from the original dataset. Here, “15K” means 15,000 keywords in the knowledge base and “237” means 237 relations in total. The training set contains 272,115 triplets; the validation set contains 17,535 triplets; the test set contains 20,466 triplets.
- WN18. The WN18 dataset is a subset of WordNet, having 18 kinds of relations and roughly 41,000 kinds of entities scraped from the original dataset. The source of WN18 has training, validation, and test sets, resulting in 151,442 triplets.
The statistical information of the three benchmark datasets is shown in Table 3.
5.2. Evaluation Protocols
The purpose of the structural preserving experiment is to explore the intuitive influence of the message-passing schema on entity embeddings. RotatE was selected as the comparison method. A random walk with a fixed step length was used to obtain subgraphs from knowledge graphs. We utilised PCA to reduce the dimensions (128) of the original embedding vector to 2 and 25 dimensions. The 2-dimensional embedding vectors were used to draw scatter diagrams of entities, and the 25-dimensional embedding vectors were used to draw heat maps. By following the visualisation of the embedding vectors, we conducted a qualitative analysis of the embedding vectors of the two methods.
The task of (semi-)supervised triple classification is to verify the capacity of models to predict positive or negative triplets. To construct negative triplets, we adopted the self-adversarial negative sampling approach proposed by RotatE. This approach generates meaningful negative samples with the self-adversarial technique. We simply performed the task with the FB15K, FB15K-237, and WN18 datasets. The principle of triple classification is to compare the score of samples with a manually set threshold. If the score of a sample is higher than the threshold, the sample is classified as positive or negative. Thus, the classification experiment can be treated as a binary classification problem. We utilised four classification metrics, accuracy , precision , recall , and , to measure the accuracy of triple classification.
The link prediction task deals with predicting the target/source entity given a source/ target entity and a relation (i.e., ). In other words, it assigns the most probable entity based on score function . The evaluation protocols for the link prediction experiment adopt the mean reciprocal rank (MRR) and Hit@n measures. For the MRR evaluation protocol, the scores of triplets are calculated and sorted in ascending order. The rank of a positive triplet is the score of one sample. This whole procedure is applied to all the test samples, and the average rank of all test samples is the final performance of link prediction. Different from MRR, Hit@n just measures the rank of ground-truth triplets in Top-n. Obviously, a good model should obtain a lower ranking in Top-n. In addition, these negative samples constructed through replacing the head/tail entity may contain correct triplets. Hence, these correct triplets that exist in negative samples in knowledge graphs need to be filtered out before computing the scores. Following the raw and filtered settings of RotatE [10], both filtered and raw MRR, and filtered Hits with , the results are reported in this link prediction experiment.
5.3. Baselines
For the comparison in our experiment, we compared our model with the recent state-of-the-art baselines, which include five different knowledge embedding models. TransE [18] is a kind of translational model for knowledge representation learning. It treats a relation as a translation in the feature space and optimises embeddings with the strategy. As the second translational model, TransH [9] can handle one-to-many, many-to-one, and many-to-many relations without increasing complexity. As the third translational model, TransR [19] is derived from TranE, but it maps entities and relations into two different spaces, namely entity space and multiple relation spaces, while preserving various multi-mapping relations patterns. We further compared our model with ComplEx [24], DISTMULT [29], and RotatE [10]. ComplEx can embed triplets in complex space as the previous description in Section 2. The ComplEx algorithm belongs to a semantic matching model, which is an expansion of DISTMULT in complex space. Different from other models, RotatE treats a relation as a rotation in complex space according to Euler’s formula. It can preserve (anti)symmetry, composition, and inversion relation patterns.
5.4. Hyperparameter Settings
A series of hyperparameters of MARS need to be set in advance during training. These hyperparameters determine the performance of the model. We empirically set the learning rate sequence: on the above different datasets during training. We accordingly set the batch size: for the three datasets. We set the negative sampling rate to 1:64, the same as RotatE [10], also known as 1 positive sample with 64 negative samples. We set the commonly used dimensions to 128 for both triple classification and link prediction. The message-passing layer for both tasks was empirically set to 2 layers. There is a dropout layer between the two message-passing layers. For different datasets, We empirically set the dropout rate sequence to . In addition, we used 8 threads for sampling in each dataset. In our experiment, each dataset was divided into three subsets, which included the training, validation, and test subsets. The training and validation subsets were used to train the models. According to Table 3, the ratios for training, validation, and testing for WN18, FB15K, and FB15K-237 were about .
We implemented our model leveraging the OpenKE-PyTorch (https://github.com/thunlp/OpenKE, accessed on 4 May 2022) and DGL (https://github.com/dmlc/dgl/, accessed on 4 May 2022) libraries. OpenKE-PyTorch is an open-source library for knowledge representation learning. The DGL library is a universal Python package for graph learning. Because a GPU can effectively improve the training speed of deep learning models, we implemented our model leveraging the GPU version of Pytorch. The training of the model was performed on NVIDIA 2080TI Graphics Processing Units. The training process of the model adopted the adaptive moment (Adam) algorithm to optimise the parameters. We performed training epochs on both triple classification and link prediction tasks on the benchmark datasets.
5.5. Experimental Results
The following gives the experimental results and analysis, including the models’ efficiency, structural preserving, triple classification, and link prediction tasks.
5.5.1. Structural Preserving Results and Analysis
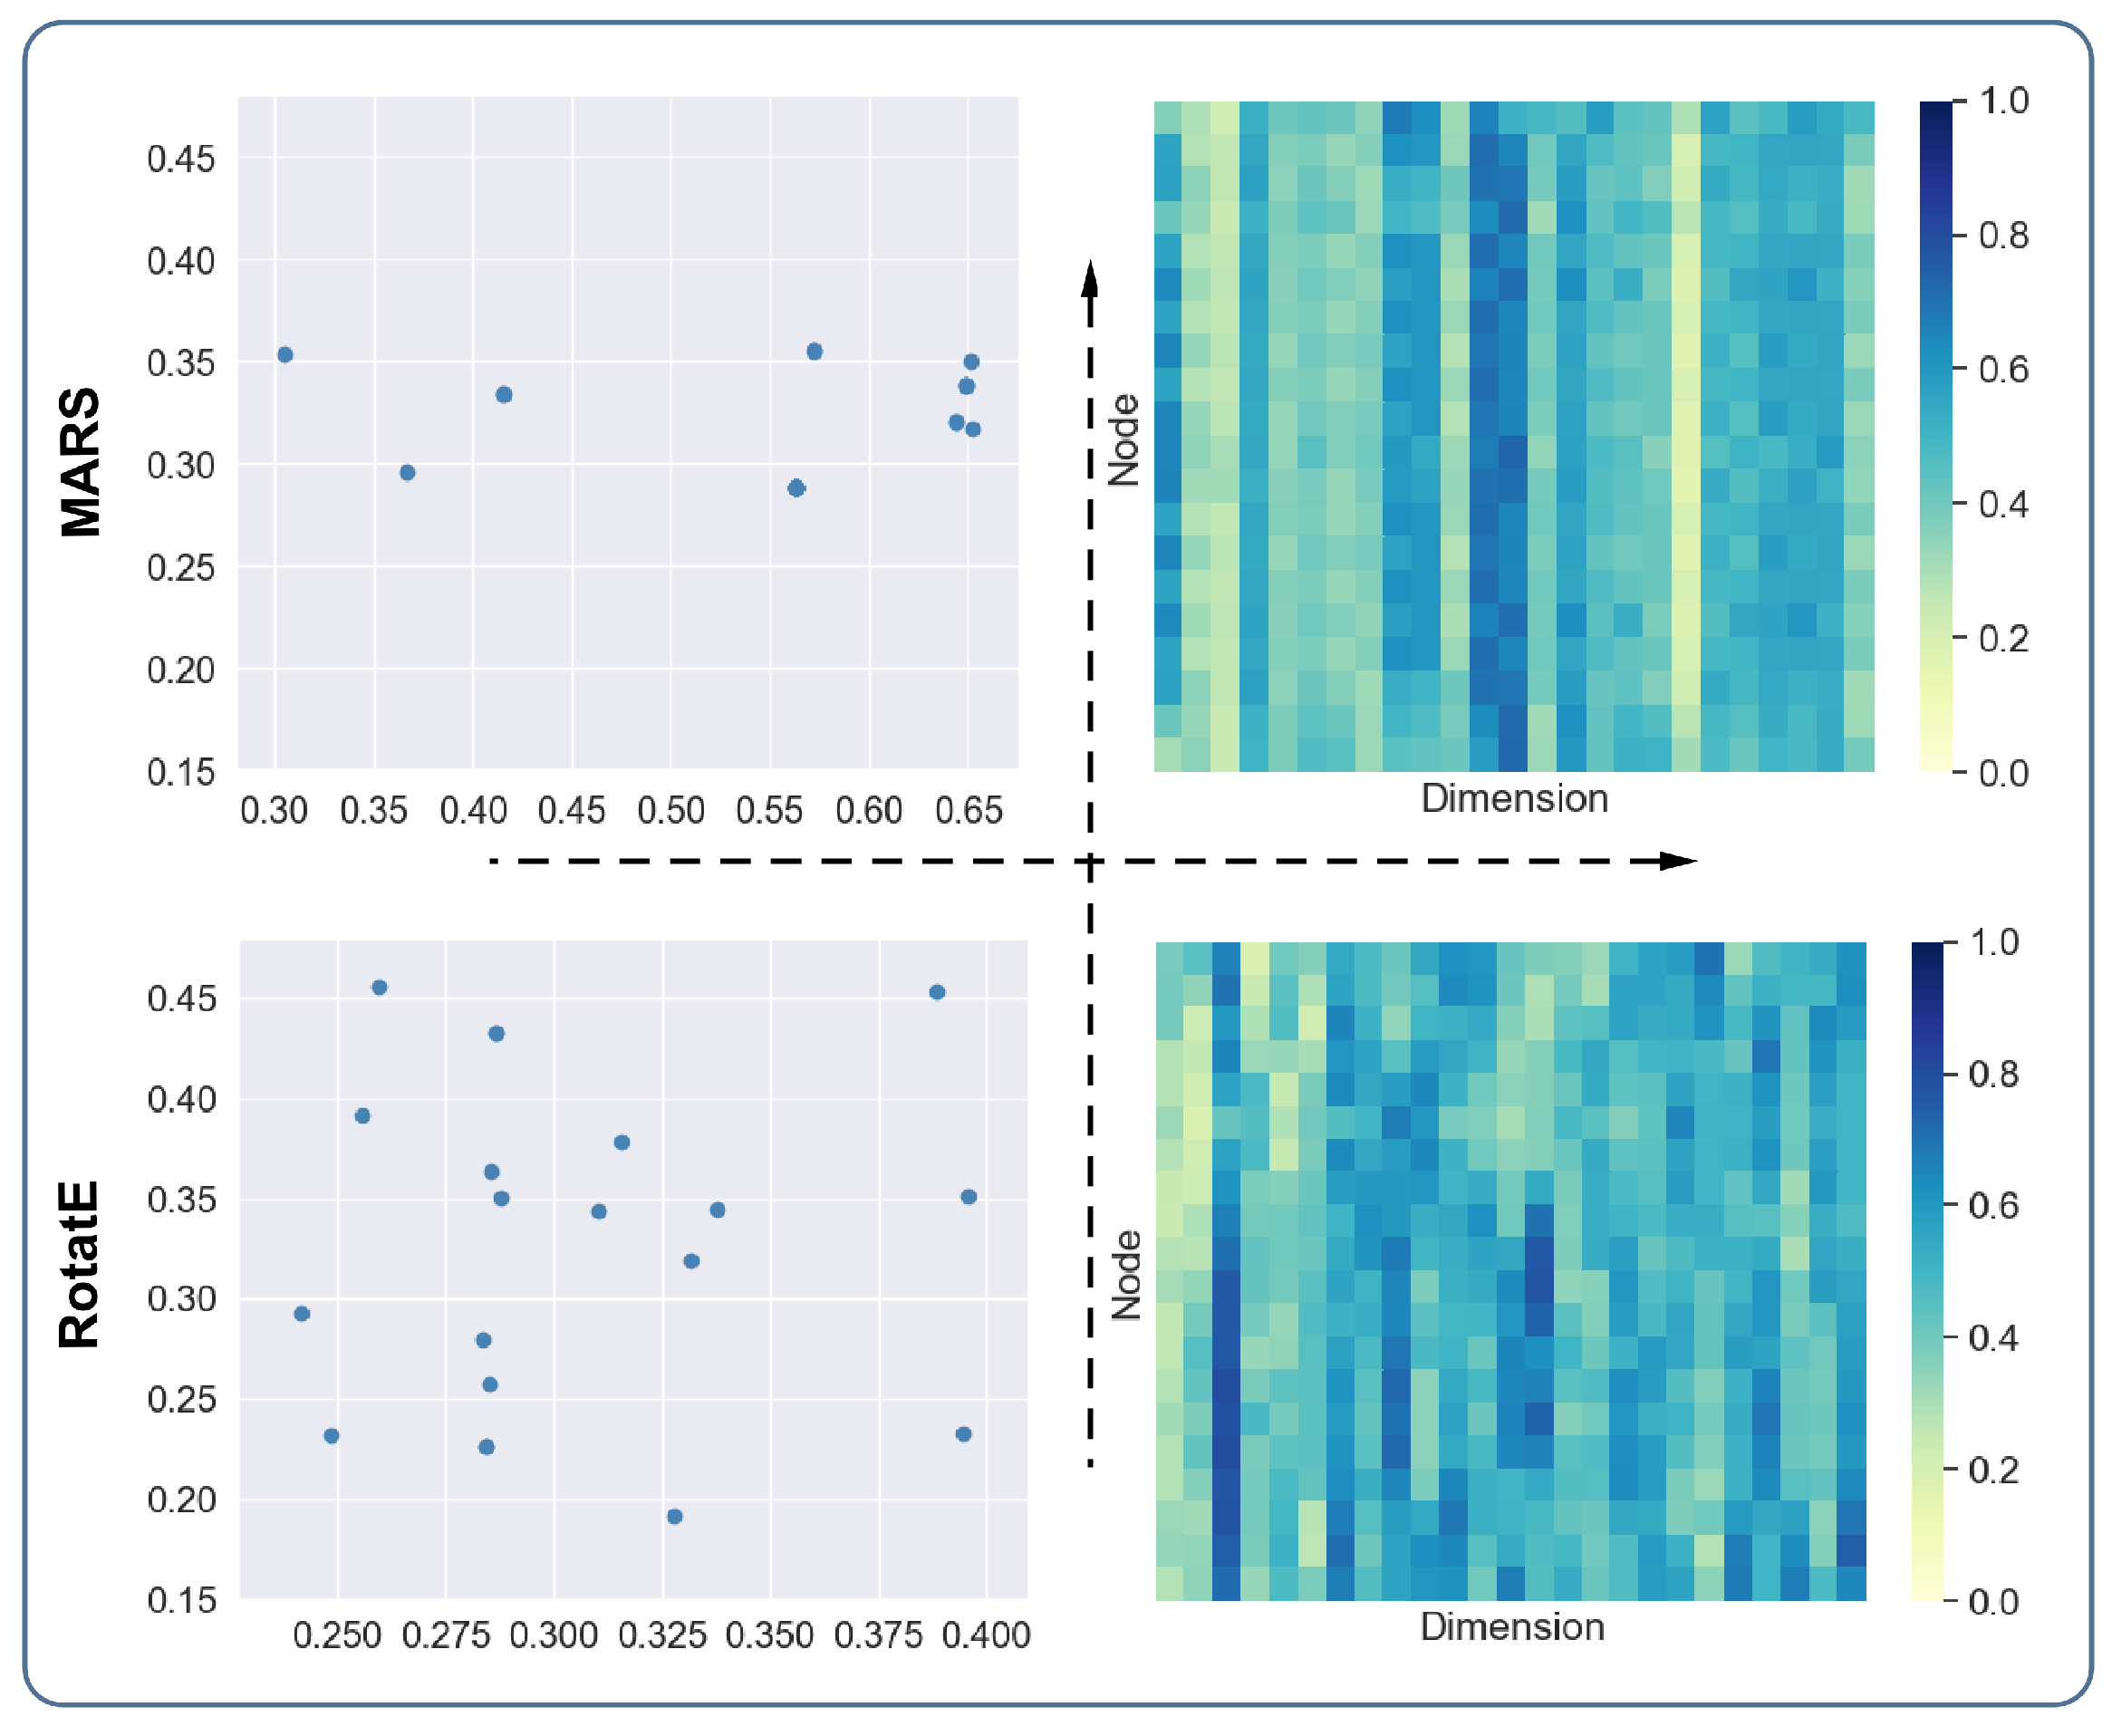
According to the two scatter diagrams in the second and third quadrant in Figure 4, we can see that the score distributions of the entities of RotatE are relatively scattered, while the distributions of the entities of MARS are relatively concentrated. We know that the connected entities tend to have similar representations. The visualisation can give an intuitive illustration that MARS has better performance in preserving the structural information of knowledge graphs. There are some overlapping entities in the scatter diagram due to the procedure of reducing high-dimensional vectors to low-dimensional vectors. According to the two heat maps in the first and fourth quadrant in Figure 4, we can see that the entity vectors of MARS in each row have relatively similar values, and the transition between vectors from top to bottom is relatively smooth. However, the vector distributions of RotatE are relatively scattered. Thus, the distributions of vectors shown in the heat maps are consistent with the distributions of the scatter diagrams. This result further supports the above conclusion.
5.5.2. Triple Classification Results and Analysis
Table 4 summarises the triple classification results on FB15K, FB15K237, and WN18. We can see that DISTMULT achieved the best performance of triple classification among the baselines on the FB15K dataset. The prediction scores (also known as the F1-score, accuracy, precision, and recall) of DISTMULT were slightly higher than those of ComplEx, as well as higher than those of the translational models. The performances of TransR, TransH, and TransE are similar, and TransH slightly outperformed the other two translational models. On the WN18 dataset, DISTMULT still outperformed ComplEx and was the best among the baselines. The prediction scores of TransR were higher than those of TranH and TransE. On the FB15K237 dataset, the performances of complEx and RotatE were better than the translational models on this dataset. Our model outperformed the baselines on the FB15K and WN18 datasets. On the FB15K237 dataset, the of triple classification of our model was slightly lower than the of ComplEx. In summary, the embeddings of our model were effective in triple classification, and our model obtained improvements compared to the baselines on the benchmark datasets.
5.5.3. Link Prediction Results and Analysis
According to the link prediction results on the FB15K dataset in Table 5, we can see that the scores of the filtered MRR were higher than those of the raw MRR. This was due to the setting of the raw MRR, for which some conflicting positive samples could influence the prediction results, and so were removed from the test set. Thus, the filtered MRR has the capacity to accurately measure the performance of link prediction. The performance of ComplEx and DISTMULT on FB15K was poorer than the other baselines. TransE and TransH had similar performances on this dataset. The scores on the MRR of TransE outperformed TransH. TransH performed better than TransE, when on hit@n. The RotatE and TransR algorithms had similar performance, while RotatE had the best performance among the baselines, and its scores outperformed all the other baselines. The scores of MARS are presented in the last line. We can see that the scores were always higher than RotatE. Thus, our model had the best performance compared all baselines on the FB15K dataset.
According to the results on the WN18 dataset in Table 6, the translational algorithms (also known as TransE, TransH, and TransR) had similar performance. These three algorithms had low scores for Hits@1, 0.089, 0.035, and 0.096, respectively. RotatE still achieved the best performance among all the baselines in link prediction on the WN18 dataset. Our model obtained slight improvements compared to RotatE on the WN18 dataset. However, our model still achieved the best performance among all the baselines.
According to the results of link prediction on the FB15K-237 dataset in Table 7, we can see that the three translational algorithms had similar experimental results on the WN18 dataset. The scores of TransR were slightly higher than the other two translational algorithms. RotatE and ComplEx had similar experimental performances. RotatE outperformed ComplEx for MRR and His@1. Similar to the results on the above two datasets, MARS outperformed all the baselines and obtained significant improvements compared to the other two complex-number-based algorithms.
In addition, we can see that the scores for triplet classification were significantly higher than those for link predictions. That is because the models only have two categories of prediction results (positive and negative) in the former, while in the latter, the models need to predict the right entity from an entity candidate set, so the hit probability is lower than the former.
5.5.4. Efficiency Analysis
We tested the running speed and resource consumption of our proposed model on the FB15K dataset. We recorded the average time (second) of an epoch and the GPU memory and the CPU memory of models. The experimental results are shown in Table 8.
According to the results in the table, we can see that TransE was the fastest and needed the least memory. The RotatE model was slightly slower than TransE. TransR was the slowest model, while it also needed the most memory among all the models. In order to capture the diversity of the relations in knowledge graphs, MARS has more parameters than most of the compared models, so it needs relatively more memory and is slightly slower than them. Anyway, from the results in the table, we can see that most GPU platforms could offer the computing resources necessary for our model. In addition, our model achieved better embedding accuracy while slightly sacrificing running efficiency.
6. Conclusions
In this paper, we focused on modelling complex relations in knowledge graphs and proposed a novel representation learning model, namely MARS. Our model takes the mechanisms of both complex numbers and message-passing and then embeds triplets into relation-specific complex hyperplanes, having the capacity to handle a large variety of binary relation patterns and rich relational structures. In addition, we discussed the score distributions and involved the standard deviation method to adjust the distributions of positive and negative triples, resulting in more accurate embeddings of knowledge graphs. Moreover, the empirical experiments proved that our model can effectively model various relations and outperformed the state-of-the-art baselines on three benchmark knowledge graph datasets. In the future, we would like to extend our model to address the challenge of embedding dynamic knowledge graphs in reality applications.
Author Contributions
Conceptualisation, O.A., A.T. and F.X.; investigation, K.S., S.Y. and C.P.; methodology, K.S. and S.Y.; supervision, A.T. and F.X.; validation, S.Y., Y.W. and O.A.; writing—original draft, K.S., S.Y. and C.P.; writing—review and editing Y.W., O.A., A.T. and F.X. All authors have read and agreed to the published version of the manuscript.
Funding
This work was funded by the Researchers Supporting Project No. RSP-2021/102 of King Saud University, Riyadh, Saudi Arabia. This work is partially supported by the National Natural Science Foundation of China under Grant No. 62102060.
Institutional Review Board Statement
Not applicable.
Informed Consent Statement
Not applicable.
Data Availability Statement
The three datasets used in this paper are publicly available.
Conflicts of Interest
The authors declare no conflict of interest.
References
- Ji, S.; Pan, S.; Cambria, E.; Marttinen, P.; Philip, S.Y. A survey on knowledge graphs: Representation, acquisition, and applications. IEEE Trans. Neural Netw. Learn. Syst. 2021, 33, 494–514. [Google Scholar] [CrossRef] [PubMed]
- Liu, J.; Ren, J.; Zheng, W.; Chi, L.; Lee, I.; Xia, F. Web of scholars: A scholar knowledge graph. In Proceedings of the 43rd International ACM SIGIR Conference on Research and Development in Information Retrieval, Virtual Event, China, 25–30 July 2020; pp. 2153–2156. [Google Scholar]
- Guo, Q.; Zhuang, F.; Qin, C.; Zhu, H.; Xie, X.; Xiong, H.; He, Q. A survey on knowledge graph-based recommender systems. IEEE Trans. Knowl. Data Eng. 2020. [Google Scholar] [CrossRef]
- Fang, H.; Chen, C.; Long, Y.; Xu, G.; Xiao, Y. DTCRSKG: A Deep Travel Conversational Recommender System Incorporating Knowledge Graph. Mathematics 2022, 10, 1402. [Google Scholar] [CrossRef]
- Dong, L.; Yang, N.; Wang, W.; Wei, F.; Liu, X.; Wang, Y.; Gao, J.; Zhou, M.; Hon, H.W. Unified language model pre-training for natural language understanding and generation. In Proceedings of the 33rd International Conference on Neural Information Processing Systems, Vancouver, BC, Canada, 8–14 December 2019; Volume 32, pp. 13063–13075. [Google Scholar]
- Huang, X.; Zhang, J.; Li, D.; Li, P. Knowledge graph embedding based question answering. In Proceedings of the 12th ACM International Conference on Web Search and Data Mining, Melbourne, VIC, Australia, 11–15 February 2019; pp. 105–113. [Google Scholar]
- Wang, Q.; Mao, Z.; Wang, B.; Guo, L. Knowledge graph embedding: A survey of approaches and applications. IEEE Trans. Knowl. Data Eng. 2017, 29, 2724–2743. [Google Scholar] [CrossRef]
- Xia, F.; Sun, K.; Yu, S.; Aziz, A.; Wan, L.; Pan, S.; Liu, H. Graph Learning: A Survey. IEEE Trans. Artif. Intell. 2021, 2, 109–127. [Google Scholar] [CrossRef]
- Wang, Z.; Zhang, J.; Feng, J.; Chen, Z. Knowledge graph embedding by translating on hyperplanes. In Proceedings of the AAAI Conference on Artificial Intelligence, Vancouver, BC, Canada, 22 February–1 March 2014; Volume 28. [Google Scholar]
- Sun, Z.; Deng, Z.H.; Nie, J.Y.; Tang, J. RotatE: Knowledge Graph Embedding by Relational Rotation in Complex Space. In Proceedings of the International Conference on Learning Representations, New Orleans, LA, USA, 6–9 May 2019. [Google Scholar]
- Zhang, Z.; Cai, J.; Zhang, Y.; Wang, J. Learning hierarchy-aware knowledge graph embeddings for link prediction. In Proceedings of the AAAI Conference on Artificial Intelligence, New York, NY, USA, 7–12 February 2020; Volume 34, pp. 3065–3072. [Google Scholar]
- Vashishth, S.; Sanyal, S.; Nitin, V.; Agrawal, N.; Talukdar, P. Interacte: Improving convolution-based knowledge graph embeddings by increasing feature interactions. In Proceedings of the AAAI Conference on Artificial Intelligence, New York, NY, USA, 7–12 February 2020; Volume 34, pp. 3009–3016. [Google Scholar]
- Zhao, F.; Xu, T.; Jin, L.; Jin, H. Convolutional Network Embedding of Text-enhanced Representation for Knowledge Graph Completion. IEEE Internet Things J. 2020, 8, 16758–16769. [Google Scholar] [CrossRef]
- He, Q.; Wu, L.; Yin, Y.; Cai, H. Knowledge-graph augmented word representations for named entity recognition. In Proceedings of the AAAI Conference on Artificial Intelligence, New York, NY, USA, 7–12 February 2020; Volume 34, pp. 7919–7926. [Google Scholar]
- Dai, Y.; Wang, S.; Xiong, N.N.; Guo, W. A survey on knowledge graph embedding: Approaches, applications and benchmarks. Electronics 2020, 9, 750. [Google Scholar] [CrossRef]
- Ren, J.; Xia, F.; Chen, X.; Liu, J.; Hou, M.; Shehzad, A.; Sultanova, N.; Kong, X. Matching Algorithms: Fundamentals, Applications and Challenges. IEEE Trans. Emerg. Top. Comput. Intell. 2021, 5, 332–350. [Google Scholar] [CrossRef]
- Sun, K.; Wang, L.; Xu, B.; Zhao, W.; Teng, S.W.; Xia, F. Network representation learning: From traditional feature learning to deep learning. IEEE Access 2020, 8, 205600–205617. [Google Scholar] [CrossRef]
- Bordes, A.; Usunier, N.; Garcia-Duran, A.; Weston, J.; Yakhnenko, O. Translating embeddings for modeling multi-relational data. In Proceedings of the Neural Information Processing Systems, Lake Tahoe, NV, USA, 5–10 December 2013; pp. 1–9. [Google Scholar]
- Lin, Y.; Liu, Z.; Sun, M.; Liu, Y.; Zhu, X. Learning entity and relation embeddings for knowledge graph completion. In Proceedings of the 12th AAAI Conference on Artificial Intelligence, Seattle, WA, USA, 1–4 August 2015. [Google Scholar]
- Wang, W.; Liu, J.; Tang, T.; Tuarob, S.; Xia, F.; Gong, Z.; King, I. Attributed collaboration network embedding for academic relationship mining. ACM Trans. Web 2020, 15, 1–20. [Google Scholar] [CrossRef]
- Wang, W.; Xia, F.; Wu, J.; Gong, Z.; Tong, H.; Davison, B.D. Scholar2vec: Vector representation of scholars for lifetime collaborator prediction. ACM Trans. Knowl. Discov. Data 2021, 15, 1–19. [Google Scholar] [CrossRef]
- Wang, W.; Tang, T.; Xia, F.; Gong, Z.; Chen, Z.; Liu, H. Collaborative Filtering with Network Representation Learning for Citation Recommendation. IEEE Trans. Big Data 2020, 1. [Google Scholar] [CrossRef]
- Liu, J.; Xia, F.; Wang, L.; Xu, B.; Kong, X.; Tong, H.; King, I. Shifu2: A network representation learning based model for advisor-advisee relationship mining. IEEE Trans. Knowl. Data Eng. 2019, 33, 1763–1777. [Google Scholar] [CrossRef]
- Trouillon, T.; Welbl, J.; Riedel, S.; Gaussier, É.; Bouchard, G. Complex embeddings for simple link prediction. In Proceedings of the International Conference on Machine Learning, PMLR, New York, NY, USA, 19–24 June 2016; pp. 2071–2080. [Google Scholar]
- Gilmer, J.; Schoenholz, S.S.; Riley, P.F.; Vinyals, O.; Dahl, G.E. Neural message passing for quantum chemistry. In Proceedings of the 34th International Conference on Machine Learning, PMLR, Sydney, Australia, 6–11 August 2017; pp. 1263–1272. [Google Scholar]
- Mikolov, T.; Chen, K.; Corrado, G.; Dean, J. Efficient estimation of word representations in vector space. arXiv 2013, arXiv:1301.3781. [Google Scholar]
- Mikolov, T.; Sutskever, I.; Chen, K.; Corrado, G.S.; Dean, J. Distributed representations of words and phrases and their compositionality. In Proceedings of the 26th International Conference on Neural Information Processing Systems, Lake Tahoe, NV, USA, 5–10 December 2013; pp. 3111–3119. [Google Scholar]
- Ji, G.; He, S.; Xu, L.; Liu, K.; Zhao, J. Knowledge graph embedding via dynamic mapping matrix. In Proceedings of the 53rd annual Meeting of the Association for Computational Linguistics and the 7th International Joint Conference on Natural Language Processing, Beijing, China, 27–31 July 2015; Volume 1, pp. 687–696. [Google Scholar]
- Yang, B.; Yih, W.t.; He, X.; Gao, J.; Deng, L. Embedding entities and relations for learning and inference in knowledge bases. In Proceedings of the International Conference on Learning Representations, San Diego, CA, USA, 7–9 May 2015; pp. 1–2. [Google Scholar]
- Bordes, A.; Glorot, X.; Weston, J.; Bengio, Y. A semantic matching energy function for learning with multi-relational data. Mach. Learn. 2014, 94, 233–259. [Google Scholar]
- Liu, H.; Wu, Y.; Yang, Y. Analogical inference for multi-relational embeddings. In Proceedings of the 34th International Conference on Machine Learning, PMLR, Sydney, Australia, 6–11 August 2017; pp. 2168–2178. [Google Scholar]
- Lin, Q.; Yu, S.; Sun, K.; Zhao, W.; Alfarraj, O.; Tolba, A.; Xia, F. Robust Graph Neural Networks via Ensemble Learning. Mathematics 2022, 10, 1300. [Google Scholar] [CrossRef]
- Petrovska, B.; Zdravevski, E.; Lameski, P.; Corizzo, R.; Štajduhar, I.; Lerga, J. Deep learning for feature extraction in remote sensing: A case-study of aerial scene classification. Sensors 2020, 20, 3906. [Google Scholar] [CrossRef] [PubMed]
- Dettmers, T.; Minervini, P.; Stenetorp, P.; Riedel, S. Convolutional 2d knowledge graph embeddings. In Proceedings of the AAAI Conference on Artificial Intelligence, Hilton New Orleans Riverside, New Orleans, LA, USA, 2–7 February 2018; Volume 32. [Google Scholar]
- Schlichtkrull, M.; Kipf, T.N.; Bloem, P.; Van Den Berg, R.; Titov, I.; Welling, M. Modeling relational data with graph convolutional networks. In Proceedings of the European Semantic Web Conference; Springer: Berlin/Heidelberg, Germany, 2018; pp. 593–607. [Google Scholar]
- Kipf, T.N.; Welling, M. Semi-Supervised Classification with Graph Convolutional Networks. In Proceedings of the 5th International Conference on Learning Representations, Toulon, France, 24–26 April 2017. [Google Scholar]
- Chen, M.; Wei, Z.; Huang, Z.; Ding, B.; Li, Y. Simple and deep graph convolutional networks. In Proceedings of the 37th International Conference on Machine Learning, PMLR, Virtual Event, 13–18 July 2020; pp. 1725–1735. [Google Scholar]
- Hong, D.; Gao, L.; Yao, J.; Zhang, B.; Plaza, A.; Chanussot, J. Graph convolutional networks for hyperspectral image classification. IEEE Trans. Geosci. Remote Sens. 2020, 59, 5966–5978. [Google Scholar] [CrossRef]
- Shang, C.; Tang, Y.; Huang, J.; Bi, J.; He, X.; Zhou, B. End-to-end structure-aware convolutional networks for knowledge base completion. In Proceedings of the AAAI Conference on Artificial Intelligence, Honolulu, HI, USA, 27 January–1 February 2019; Volume 33, pp. 3060–3067. [Google Scholar]
- Zhang, N.; Deng, S.; Sun, Z.; Chen, J.; Zhang, W.; Chen, H. Relation adversarial network for low resource knowledge graph completion. In Proceedings of the Web Conference 2020, Taipei, Taiwan, 20–24 April 2020; pp. 1–12. [Google Scholar]
- Zhang, C.; Yao, H.; Huang, C.; Jiang, M.; Li, Z.; Chawla, N.V. Few-shot knowledge graph completion. In Proceedings of the AAAI Conference on Artificial Intelligence, New York, NY, USA, 7–12 February 2020; Volume 34, pp. 3041–3048. [Google Scholar]
Figure 1.
An illustration of complex relations in knowledge graphs. Different colours of solid arrows (r) between entities represent different relations. The dashed arrows represent the predictable relations.
Figure 1.
An illustration of complex relations in knowledge graphs. Different colours of solid arrows (r) between entities represent different relations. The dashed arrows represent the predictable relations.

Figure 2.
Score distributions of positive triplets.

Figure 3.
The framework of MARS.

Figure 4.
Visualisation of entity feature vectors. The two figures in the first and second quadrants are the visualisations of the vectors obtained by MARS. The two figures in the third and fourth quadrants are visualisations of the vectors obtained by RotatE. The heat maps are used to visualise embedding matrices, where the vertical axis represents nodes and the horizontal axis represents the values corresponding to different dimensions.


Table 1.
The ability to model relations.
| Model | Score Function | Symmetry | Antisymmetry | Inversion | Composition | O2M | M2O | M2M |
|---|---|---|---|---|---|---|---|---|
| TransE [18] | ✗ | ✓ | ✓ | ✓ | ✗ | ✗ | ✗ | |
| TransH [9] | ✗ | ✓ | ✓ | ✗ | ✓ | ✓ | ✓ | |
| TransR [19] | ✓ | ✗ | ✗ | ✗ | ✓ | ✓ | ✓ | |
| DISTMULT [29] | ✓ | ✗ | ✗ | ✗ | ✗ | ✗ | ✗ | |
| ComplEx [24] | ✓ | ✓ | ✓ | ✗ | ✗ | ✗ | ✗ | |
| RotatE [10] | ✓ | ✓ | ✓ | ✓ | ✗ | ✗ | ✗ | |
| MARS | ✓ | ✓ | ✓ | ✓ | ✓ | ✓ | ✓ |
Table 2.
Description of notations.
| Notations | Implications |
|---|---|
| The real part of vectors in complex space | |
| The imaginary part of vectors in complex space | |
| Vectors’ concatenating operation | |
| A triplet set | |
| r | Embedding of a relation |
| s | Embedding of a source entity |
| t | Embedding of a target entity |
| ∘ | Hadamard product operation |
| i | Index of a node (entity) |
| A complex embedding space |
Table 3.
Statistical information of the datasets.
| Dataset | WN18 | FB15K | FB15K-237 |
|---|---|---|---|
| Entities | 40,943 | 14,951 | 14,541 |
| Relations | 18 | 1345 | 237 |
| Edges | 151,442 | 592,213 | 310,116 |
| Train triplets | 141,442 | 483,142 | 272,115 |
| Val. triplets | 5000 | 50,000 | 17,535 |
| Test triplets | 5000 | 59,071 | 20,466 |
| O2O relation | 42 | 832 | 192 |
| O2M relation | 1847 | 5259 | 1293 |
| M2M relation | 1130 | 44,343 | 14,796 |
| M2O relation | 1981 | 8637 | 4185 |
Table 4.
Triple classification on the three benchmark datasets.
| Model | FB15K | WN18 | FB15K237 | |||||||||
|---|---|---|---|---|---|---|---|---|---|---|---|---|
| F1-Score | Acc | P | Recall | F1-Score | Acc | P | R | F1-Score | Acc | P | R | |
| TransE | 0.929 | 0.924 | 0.871 | 0.995 | 0.894 | 0.885 | 0.826 | 0.975 | 0.922 | 0.919 | 0.890 | 0.957 |
| TransH | 0.948 | 0.946 | 0.911 | 0.988 | 0.924 | 0.921 | 0.889 | 0.963 | 0.916 | 0.915 | 0.909 | 0.922 |
| TransR | 0.940 | 0.936 | 0.895 | 0.989 | 0.957 | 0.957 | 0.952 | 0.963 | 0.911 | 0.912 | 0.916 | 0.907 |
| DISTMULT | 0.967 | 0.967 | 0.957 | 0.977 | 0.978 | 0.978 | 0.989 | 0.967 | 0.927 | 0.926 | 0.910 | 0.945 |
| ComplEx | 0.963 | 0.962 | 0.941 | 0.986 | 0.968 | 0.968 | 0.964 | 0.973 | 0.949 | 0.949 | 0.942 | 0.957 |
| RotatE | 0.961 | 0.960 | 0.929 | 0.996 | 0.966 | 0.966 | 0.955 | 0.977 | 0.948 | 0.948 | 0.946 | 0.949 |
| MARS | 0.975 | 0.975 | 0.973 | 0.977 | 0.981 | 0.981 | 0.995 | 0.967 | 0.951 | 0.950 | 0.931 | 0.972 |
Table 5.
The link prediction results on the FB15K dataset.
| Model | FB15K | ||||
|---|---|---|---|---|---|
| MRR | Hits@ | ||||
| Raw | Filtered | 1 | 3 | 10 | |
| TransE | 0.270 | 0.502 | 0.366 | 0.595 | 0.730 |
| TransH | 0.253 | 0.492 | 0.336 | 0.604 | 0.744 |
| TransR | 0.257 | 0.568 | 0.415 | 0.687 | 0.797 |
| DISTMULT | 0.152 | 0.216 | 0.116 | 0.238 | 0.433 |
| ComplEx | 0.231 | 0.359 | 0.232 | 0.421 | 0.607 |
| RotatE | 0.269 | 0.604 | 0.485 | 0.685 | 0.805 |
| MARS | 0.305 | 0.631 | 0.512 | 0.713 | 0.831 |
Table 6.
The link prediction results on the WN18 dataset.
| Model | WN18 | ||||
|---|---|---|---|---|---|
| MRR | Hits@ | ||||
| Raw | Filtered | 1 | 3 | 10 | |
| TransE | 0.340 | 0.504 | 0.089 | 0.925 | 0.948 |
| TransH | 0.317 | 0.468 | 0.035 | 0.911 | 0.937 |
| TransR | 0.341 | 0.511 | 0.096 | 0.934 | 0.947 |
| DISTMULT | 0.399 | 0.452 | 0.316 | 0.518 | 0.737 |
| ComplEx | 0.544 | 0.727 | 0.626 | 0.807 | 0.896 |
| RotatE | 0.596 | 0.946 | 0.939 | 0.950 | 0.958 |
| MARS | 0.607 | 0.947 | 0.938 | 0.953 | 0.961 |
Table 7.
The link prediction results on FB15K-237.
| Model | FB15K-237 | ||||
|---|---|---|---|---|---|
| MRR | Hits@n | ||||
| Raw | Filtered | 1 | 3 | 10 | |
| TransE | 0.169 | 0.289 | 0.193 | 0.328 | 0.478 |
| TransH | 0.155 | 0.277 | 0.175 | 0.321 | 0.474 |
| TransR | 0.156 | 0.311 | 0.214 | 0.351 | 0.504 |
| DISTMULT | 0.126 | 0.179 | 0.094 | 0.203 | 0.350 |
| ComplEx | 0.230 | 0.351 | 0.222 | 0.412 | 0.602 |
| RotatE | 0.327 | 0.359 | 0.261 | 0.398 | 0.557 |
| MARS | 0.241 | 0.422 | 0.317 | 0.470 | 0.629 |
Table 8.
Models’ running efficiency on the FB15K dataset.
| Model | Epoch Time (s) | GPU Memory (MB) | CPU Memory (GB) |
|---|---|---|---|
| TransE | 3.32 | 1947 | 2.3 |
| TransH | 5.21 | 2429 | 2.2 |
| TransR | 45.56 | 10,207 | 2.7 |
| DISTMULT | 3.22 | 2139 | 2.3 |
| ComplEx | 5.78 | 3027 | 2.3 |
| RotatE | 3.84 | 3317 | 2.3 |
| MARS | 8.55 | 4037 | 2.3 |
Publisher’s Note: MDPI stays neutral with regard to jurisdictional claims in published maps and institutional affiliations. |
© 2022 by the authors. Licensee MDPI, Basel, Switzerland. This article is an open access article distributed under the terms and conditions of the Creative Commons Attribution (CC BY) license (https://creativecommons.org/licenses/by/4.0/).
Share and Cite
MDPI and ACS Style
Sun, K.; Yu, S.; Peng, C.; Wang, Y.; Alfarraj, O.; Tolba, A.; Xia, F. Relational Structure-Aware Knowledge Graph Representation in Complex Space. Mathematics 2022, 10, 1930. https://0-doi-org.brum.beds.ac.uk/10.3390/math10111930
AMA Style
Sun K, Yu S, Peng C, Wang Y, Alfarraj O, Tolba A, Xia F. Relational Structure-Aware Knowledge Graph Representation in Complex Space. Mathematics. 2022; 10(11):1930. https://0-doi-org.brum.beds.ac.uk/10.3390/math10111930
Chicago/Turabian StyleSun, Ke, Shuo Yu, Ciyuan Peng, Yueru Wang, Osama Alfarraj, Amr Tolba, and Feng Xia. 2022. "Relational Structure-Aware Knowledge Graph Representation in Complex Space" Mathematics 10, no. 11: 1930. https://0-doi-org.brum.beds.ac.uk/10.3390/math10111930
Note that from the first issue of 2016, this journal uses article numbers instead of page numbers. See further details here.