
An Effective Hybrid-Energy Framework for Grid Vulnerability Alleviation under Cyber-Stealthy Intrusions


Abstract
:1. Introduction
- Identification and mitigation of the vulnerable areas of the electrical grid by developing a microgrid structure based on a hybrid-energy framework that employs AC/DC renewable resources.
- Modeling and development of a cyber-attack of FDI type and adapted with a vulnerability analysis that aims to launch cascading faults and blackouts in a power system.
- Analysis of the proposed hybrid-energy framework in the uncertainty model using the unscented transform (UT) method to get the unerring vulnerability analysis.
2. The Model of the Proposed Vulnerability Analysis
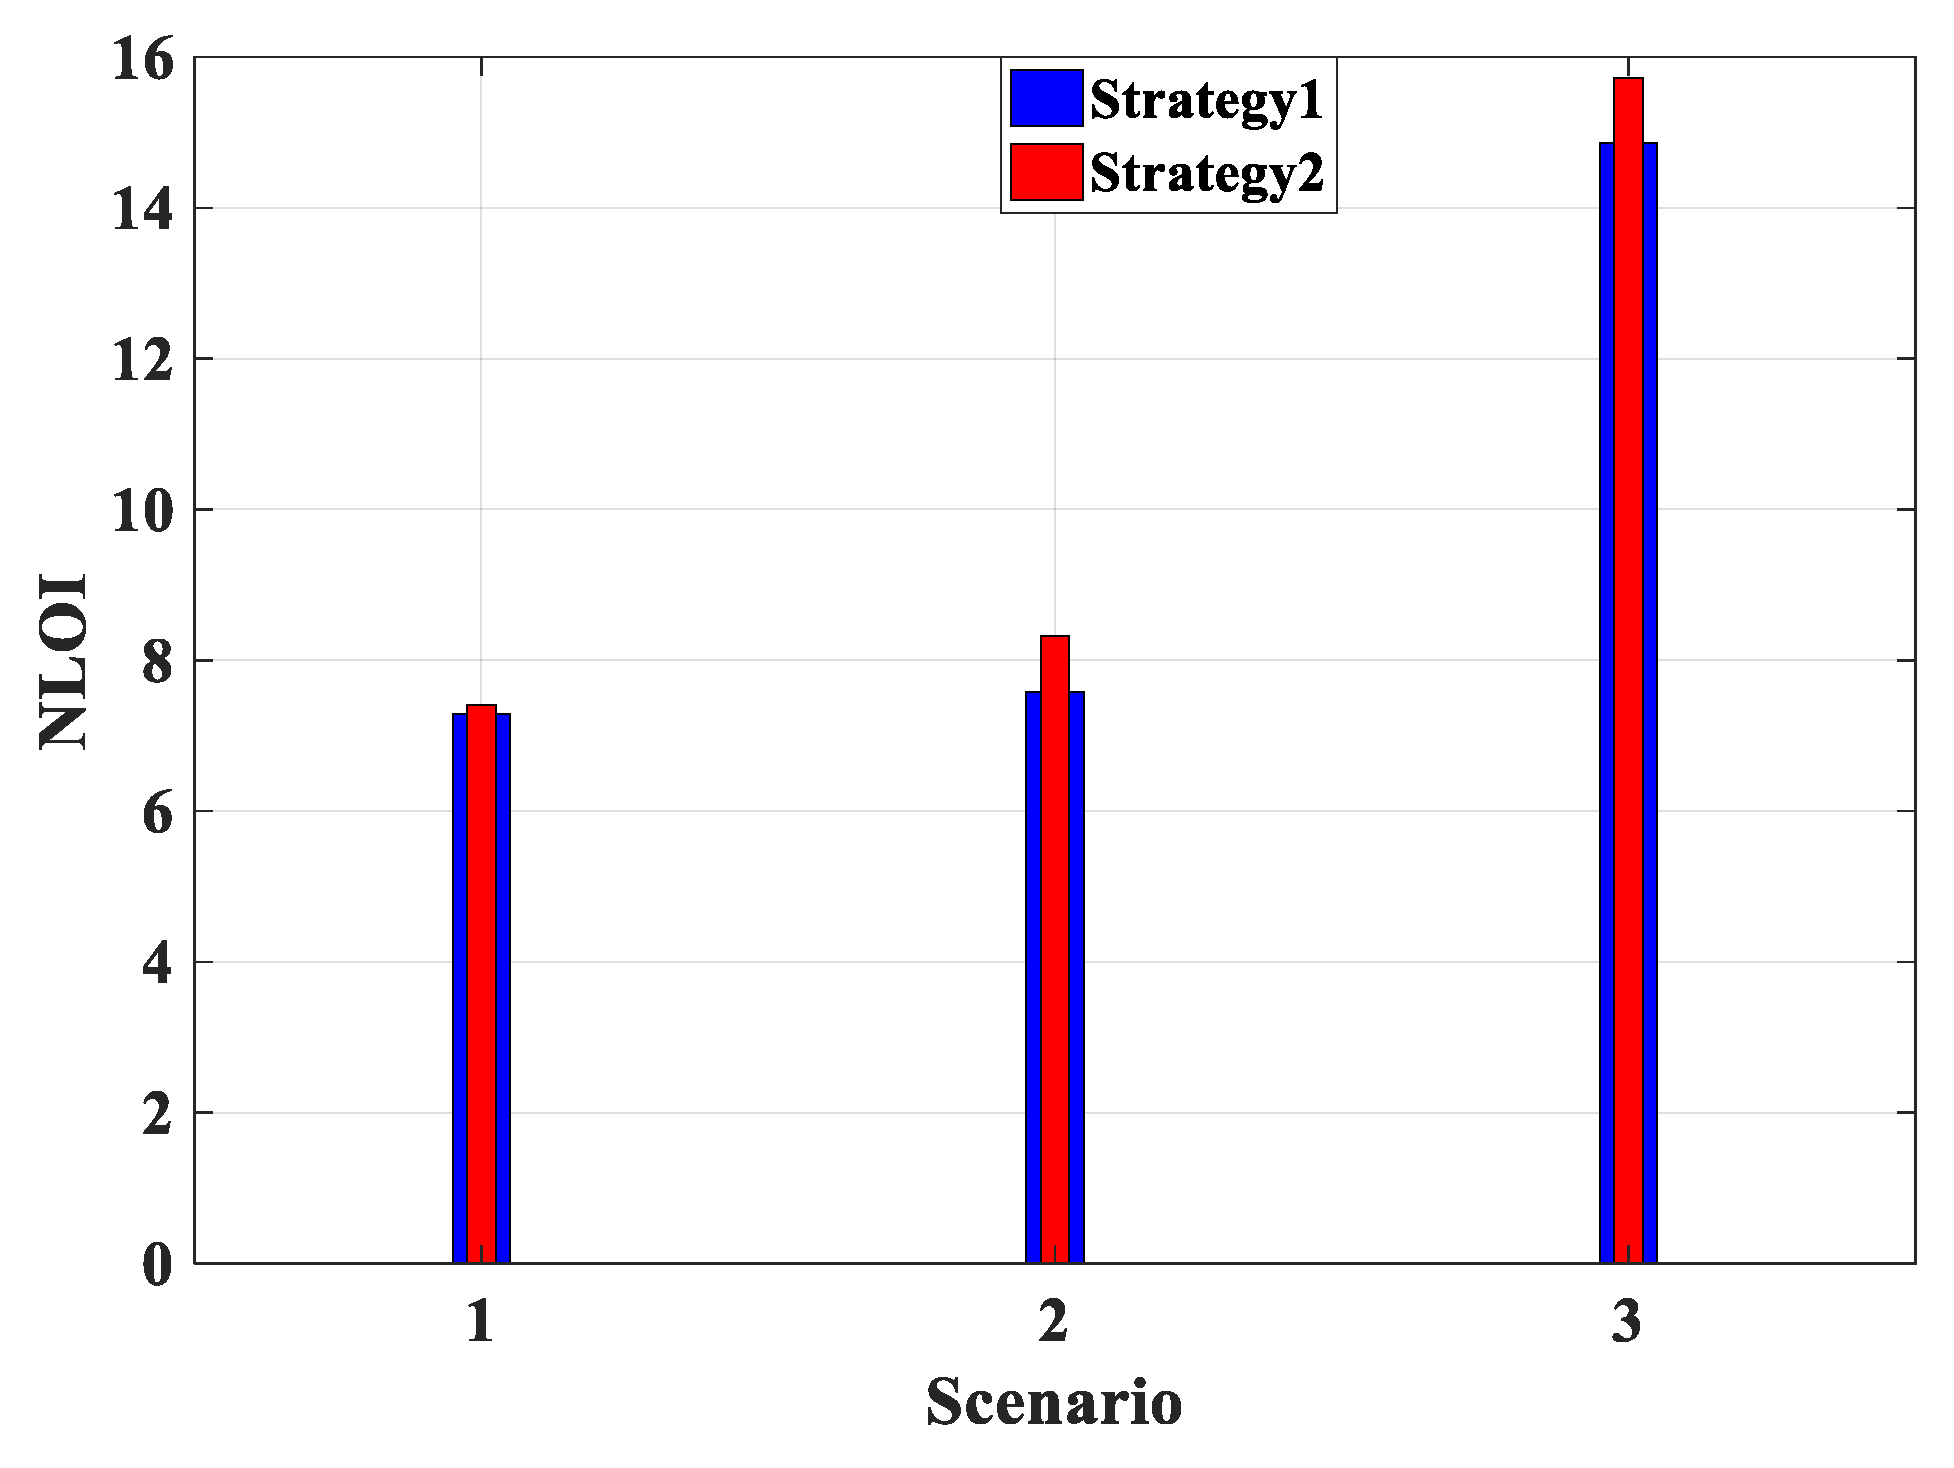
2.1. The Bus Vulnerability Indices
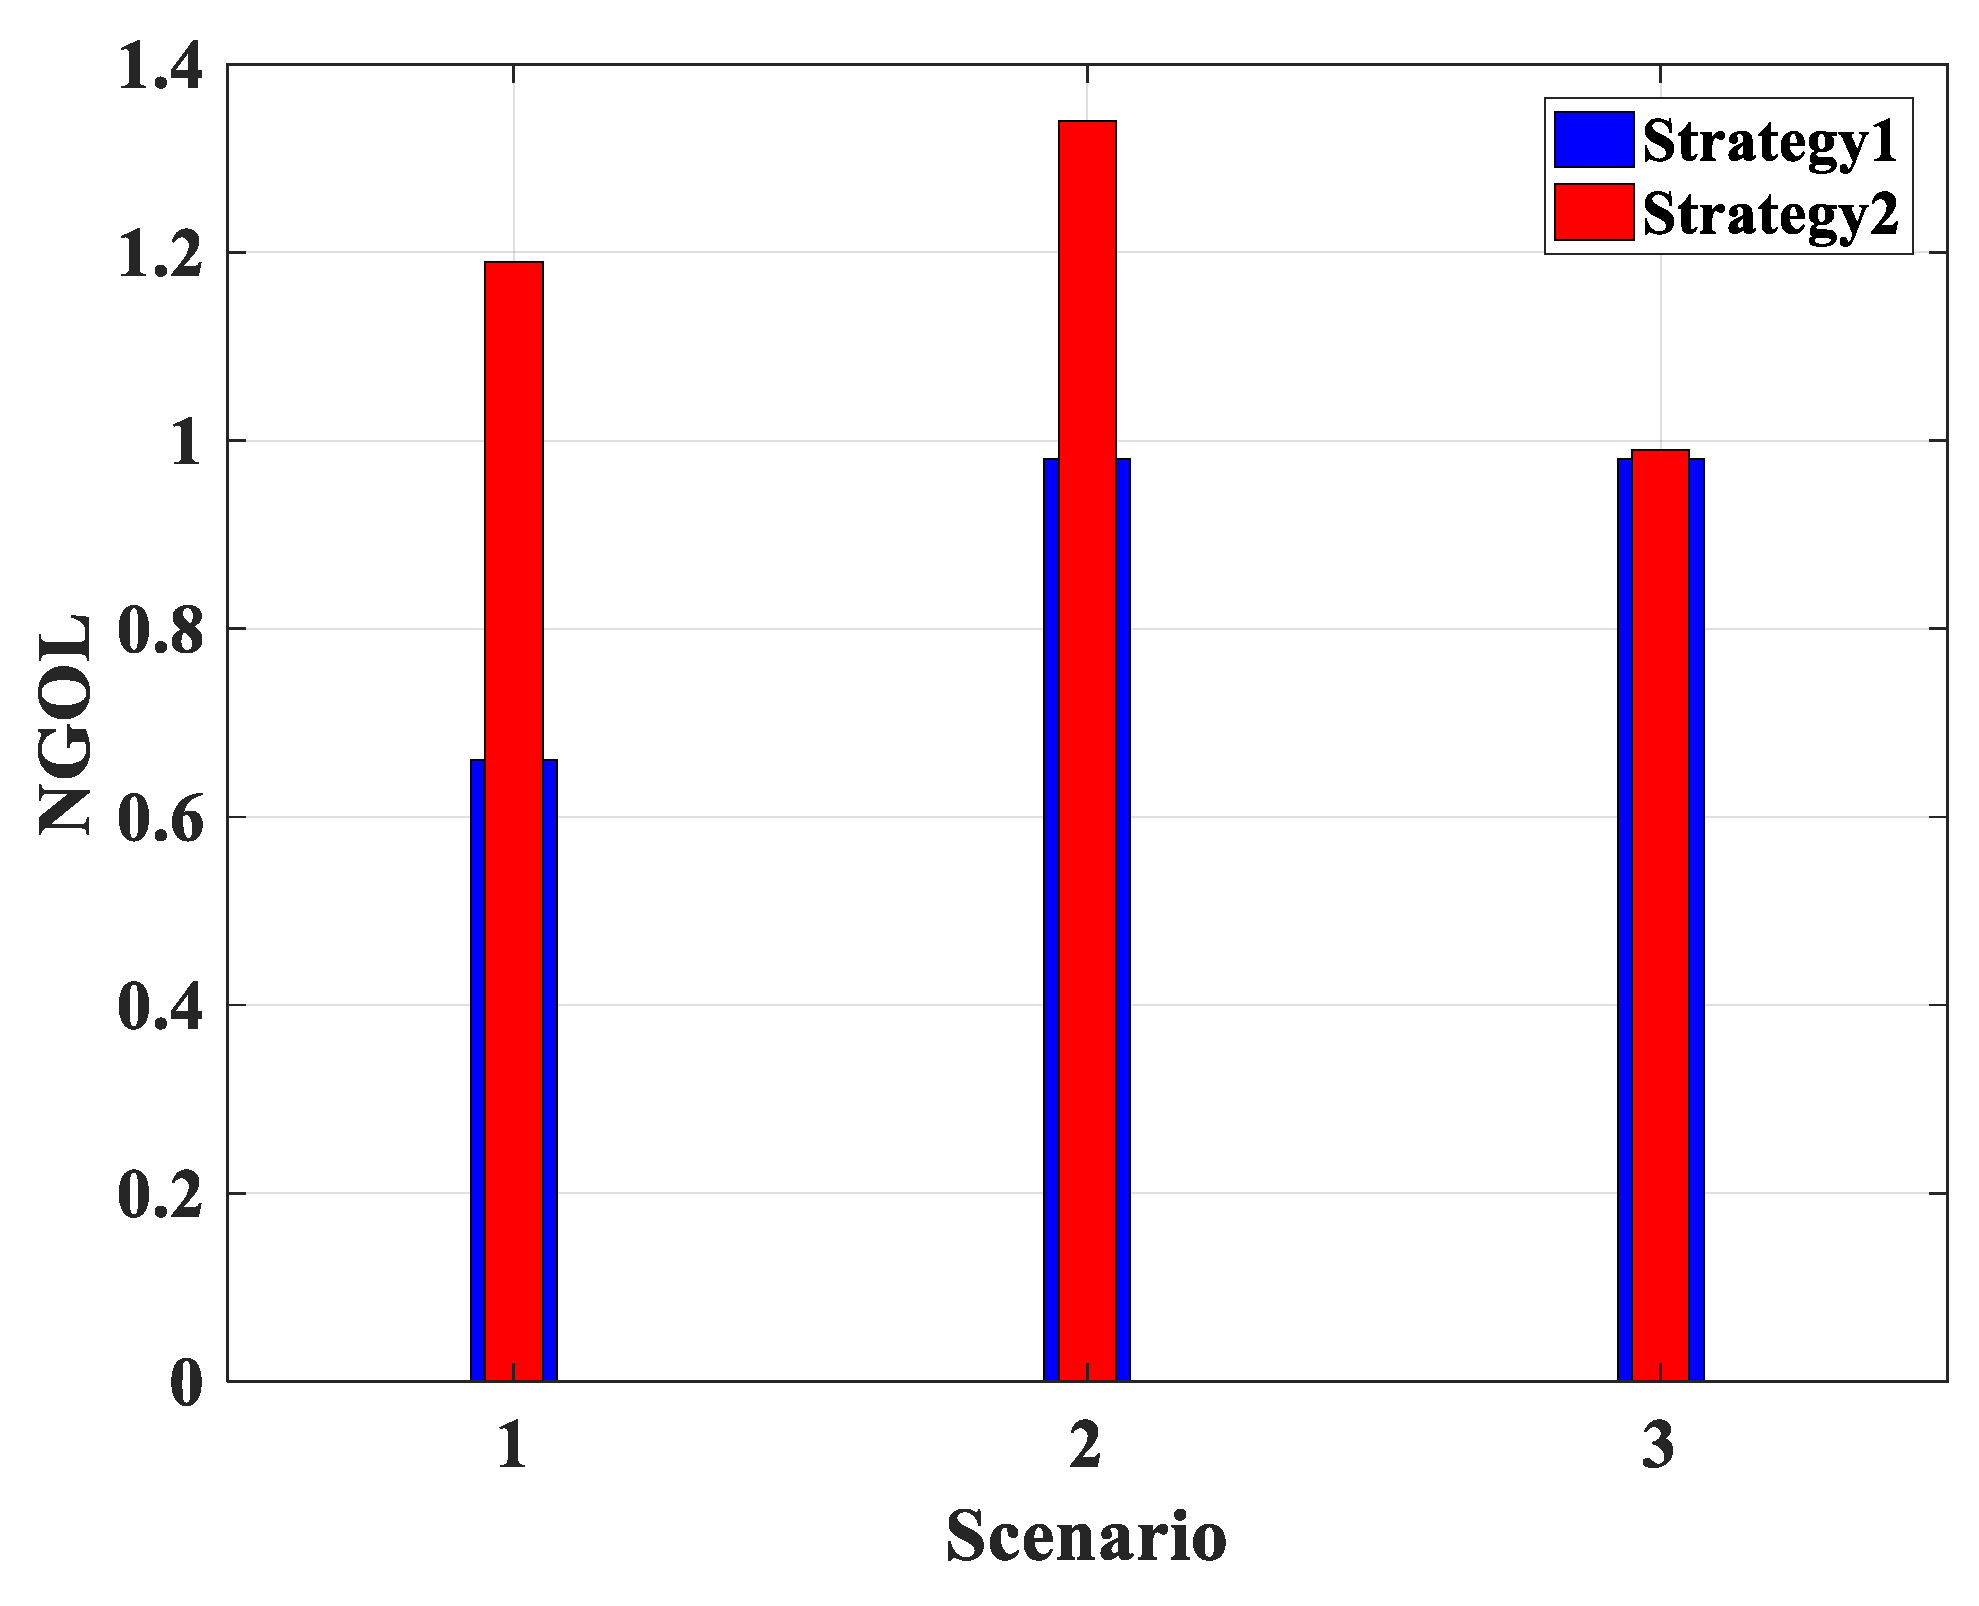
2.2. The Line Vulnerability Indices
2.3. The Generation Unit Vulnerability Indices
3. The Cyber-Attack Model of the FDI Type
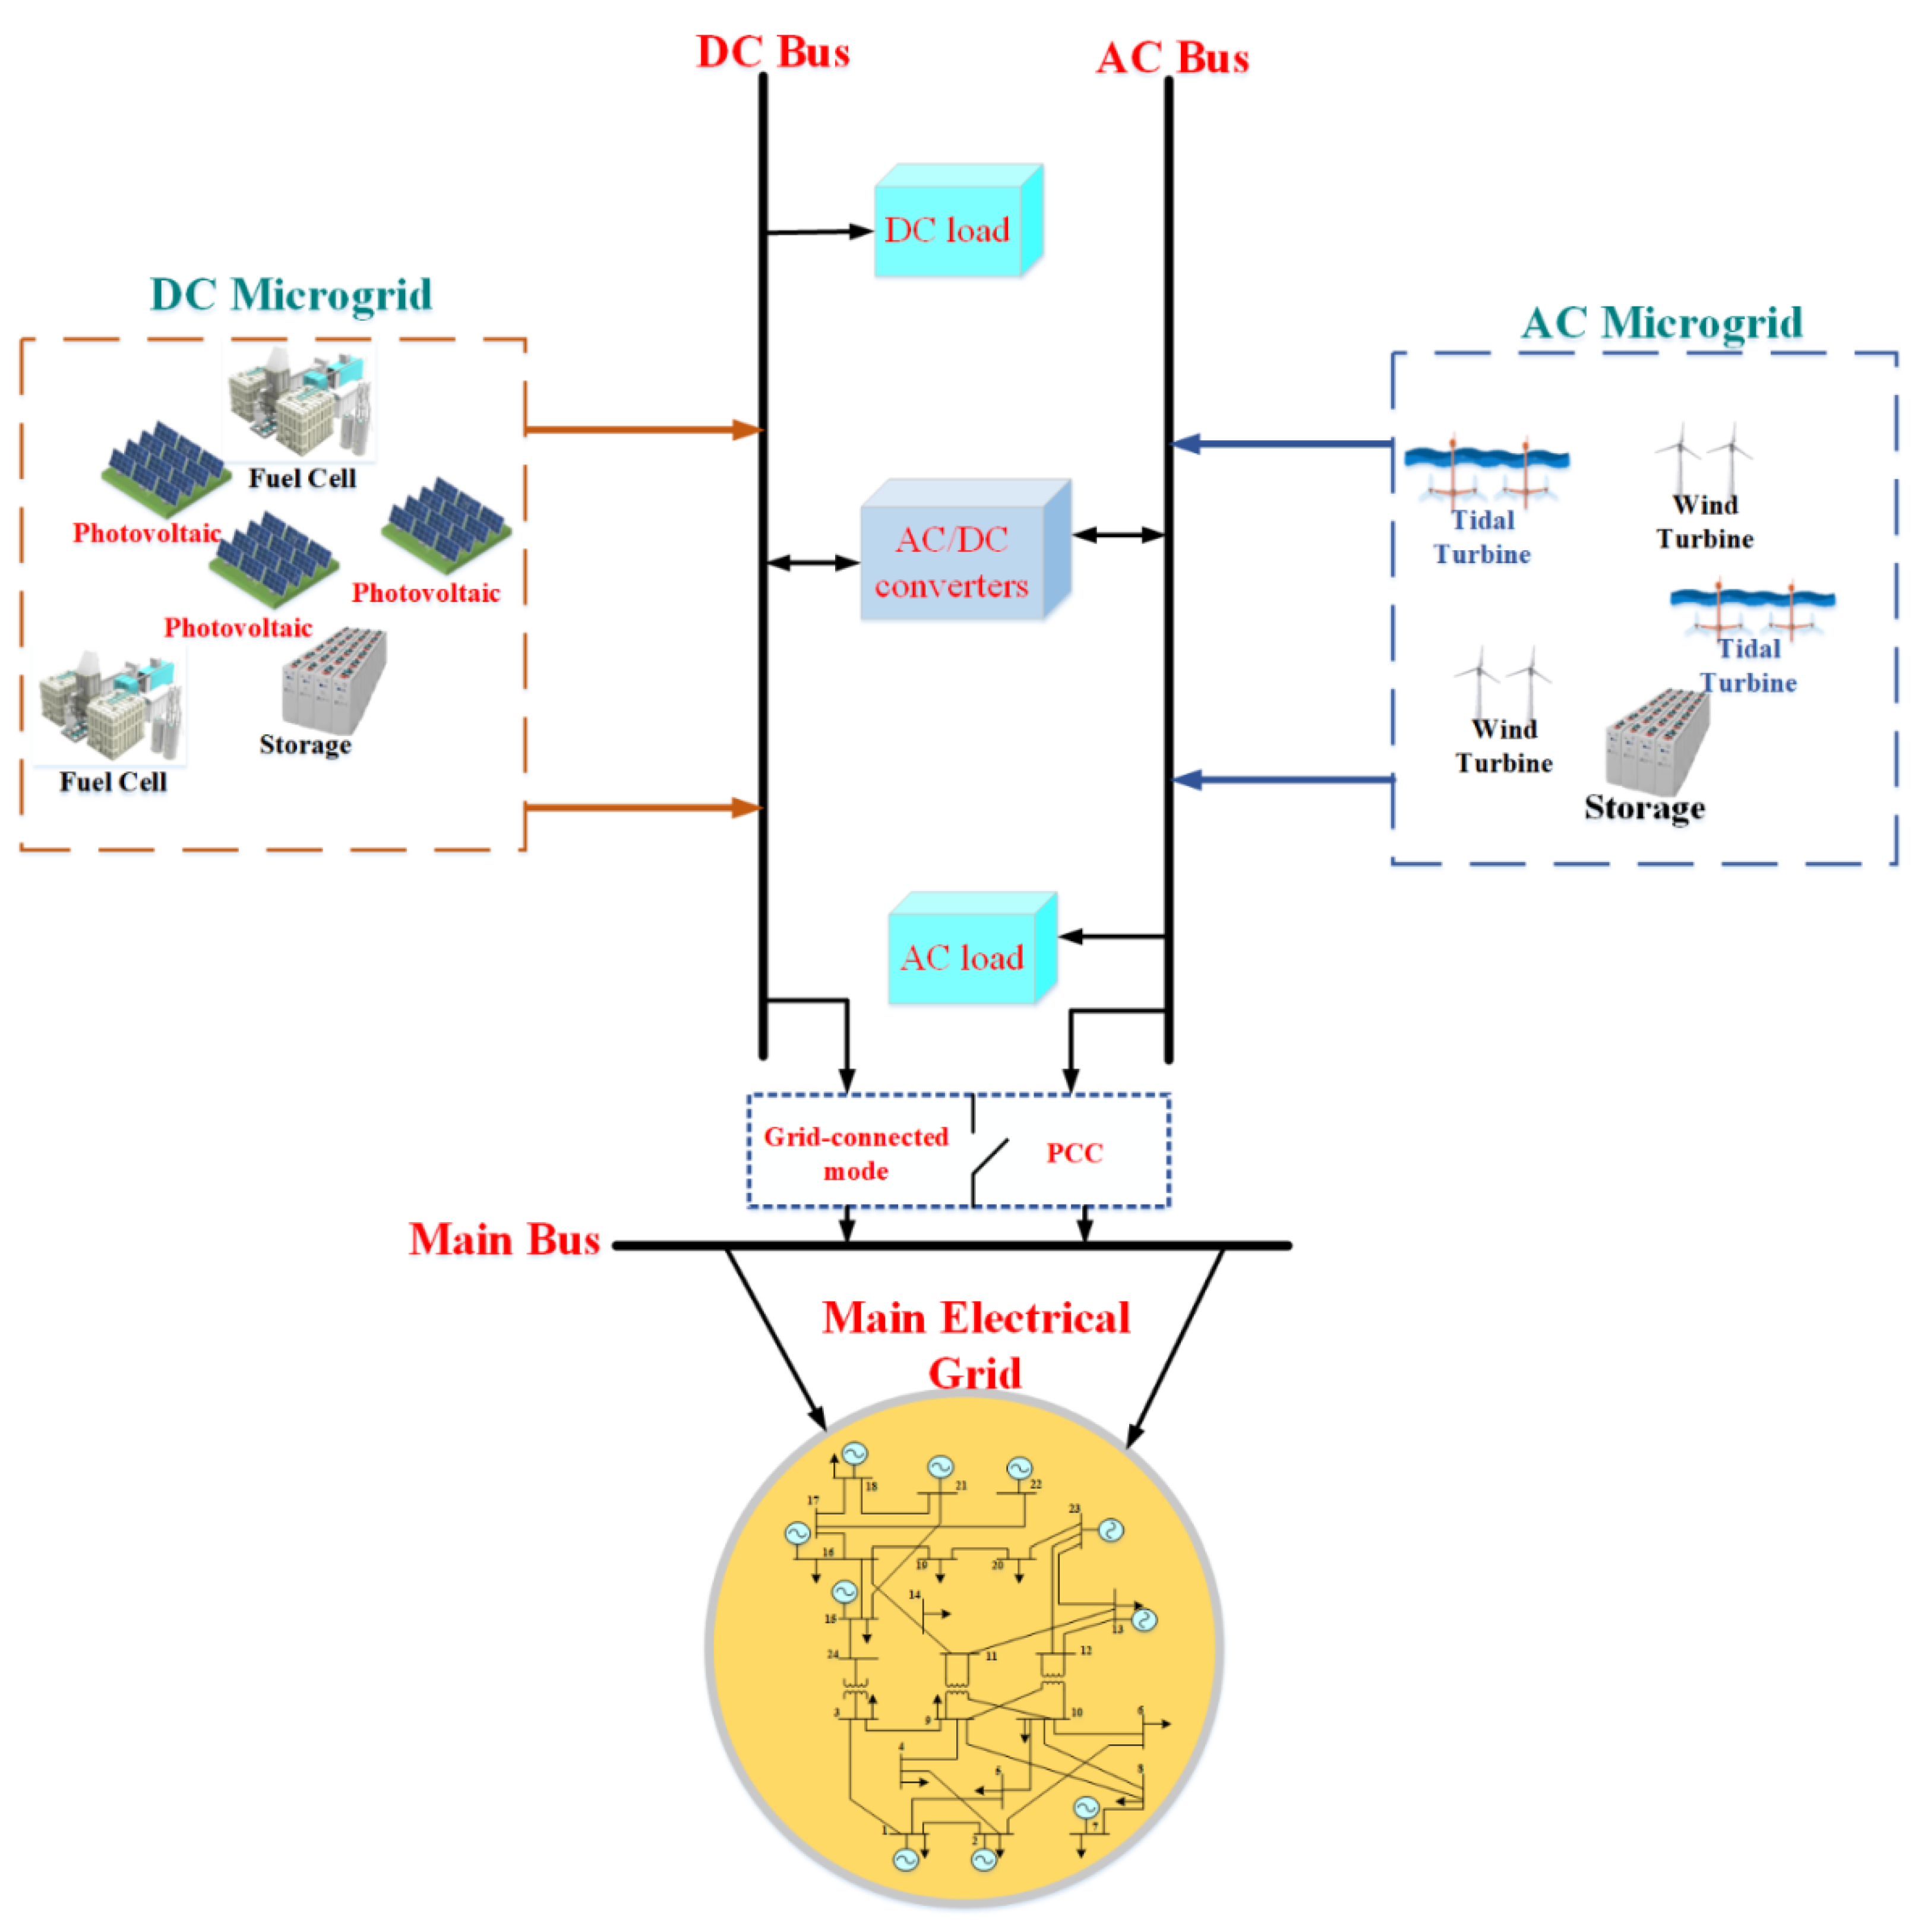
4. The Proposed Hybrid Energy Framework of Microgrid
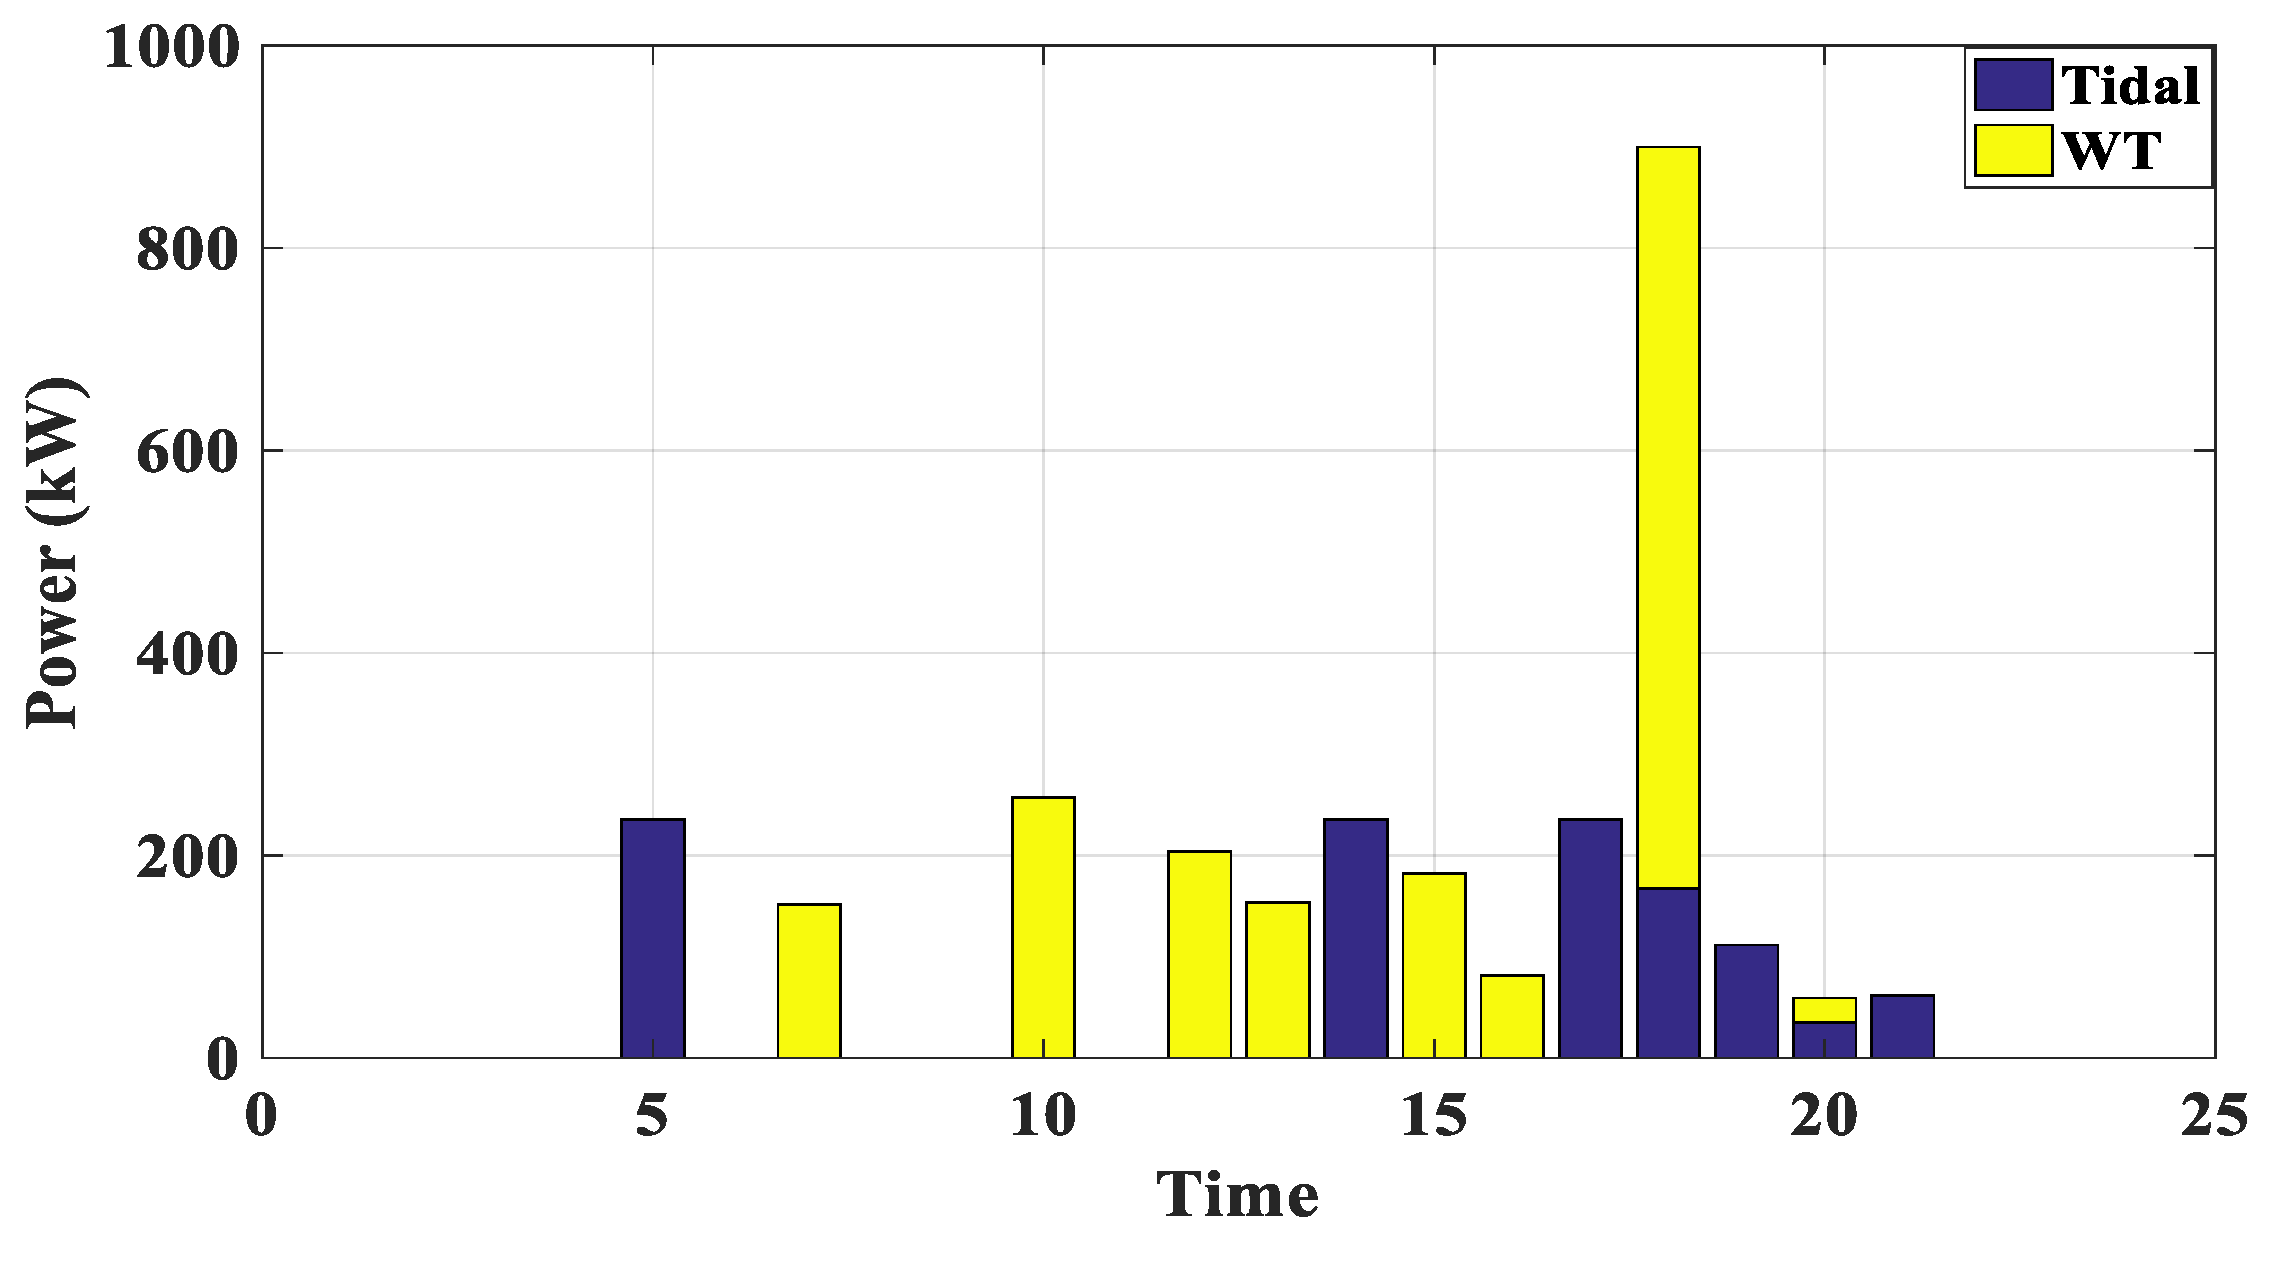
4.1. AC Microgrid
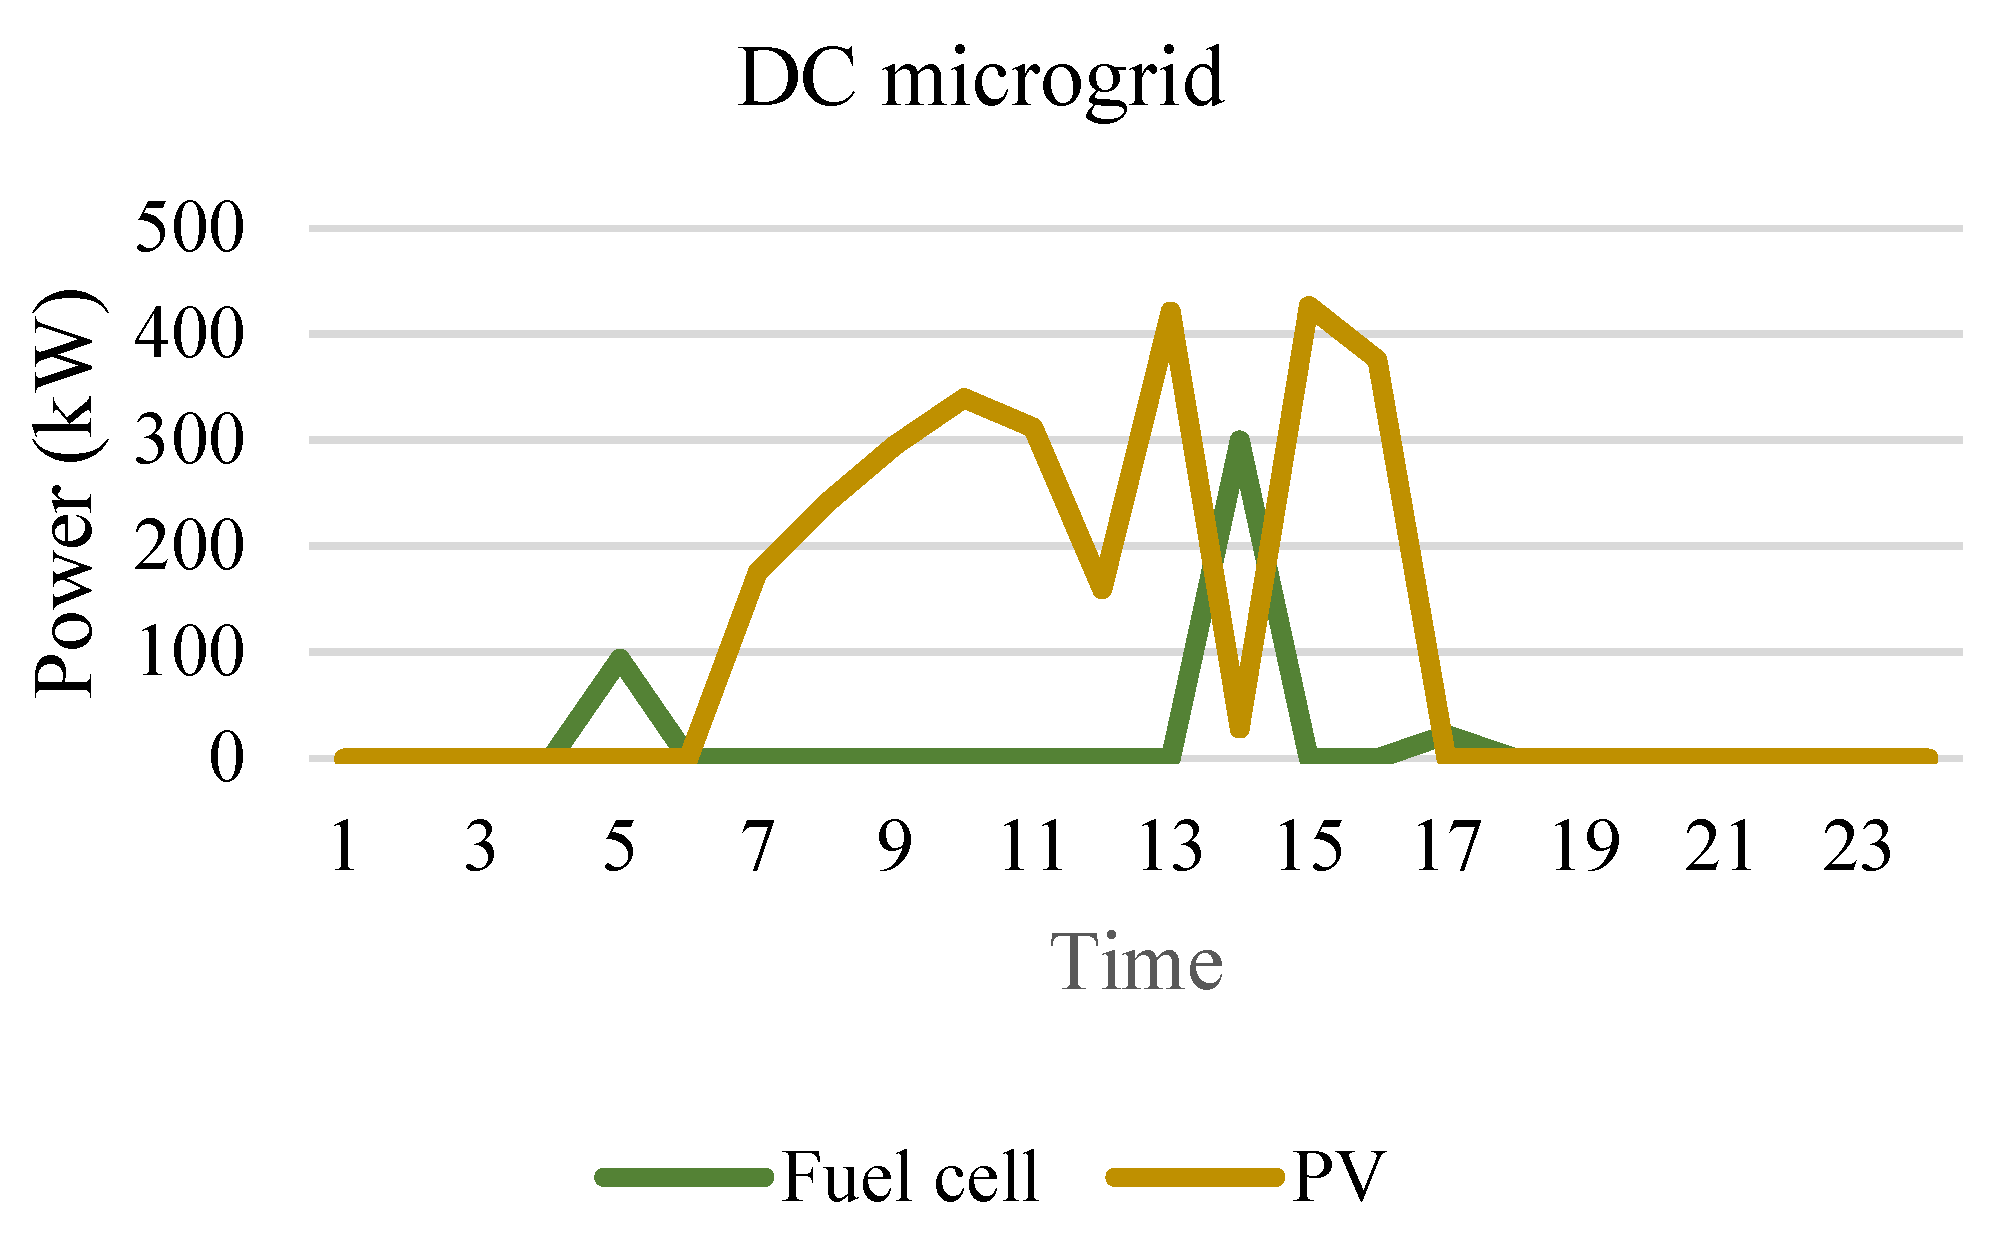
4.2. DC Microgrid
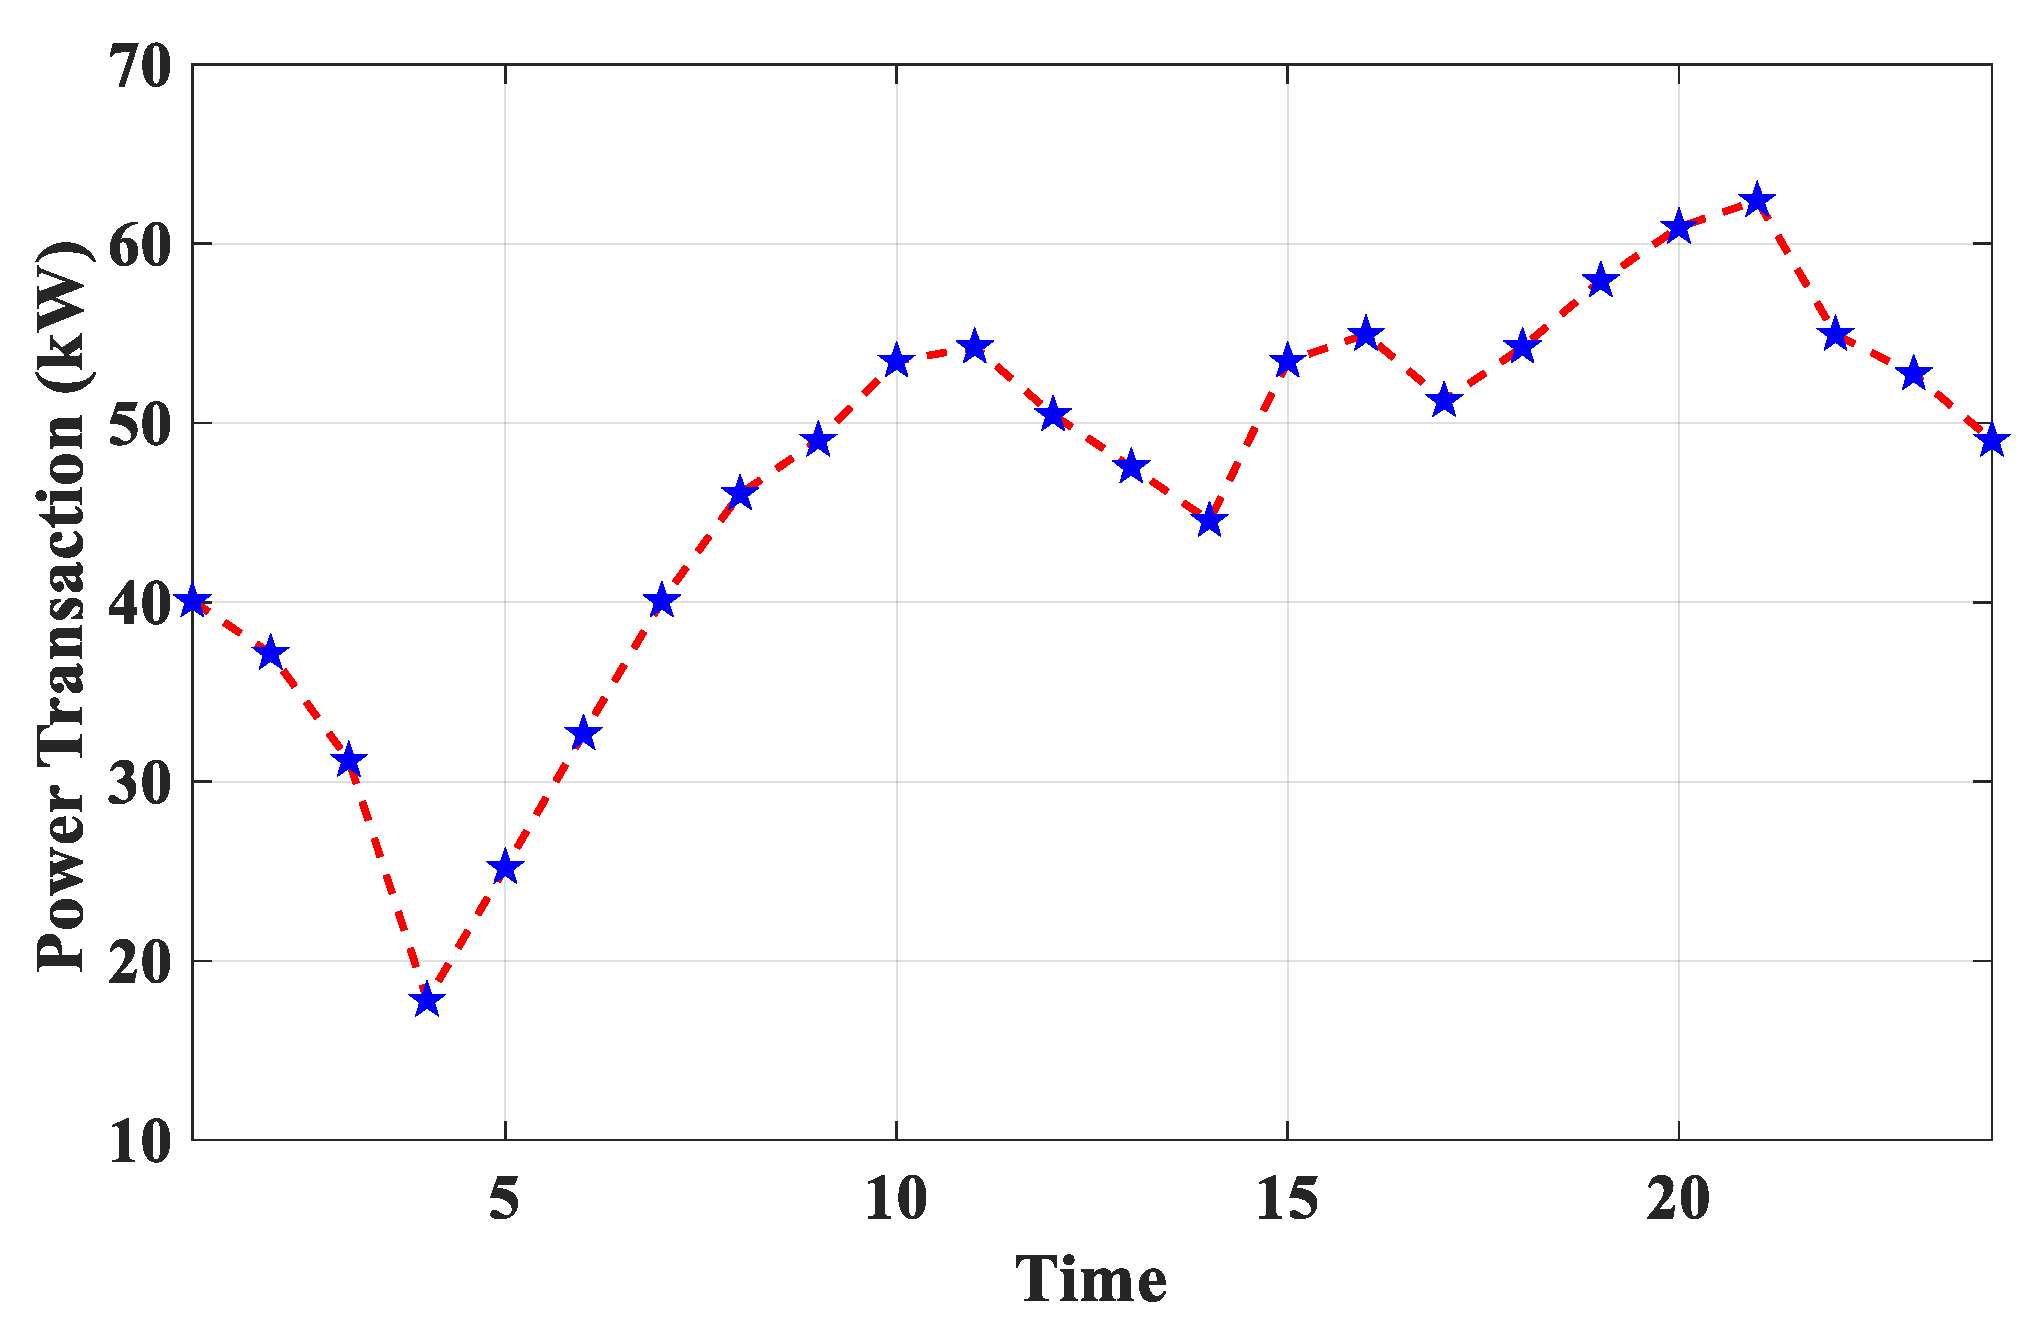
4.3. The Mathematical Formulation of the Main Grid
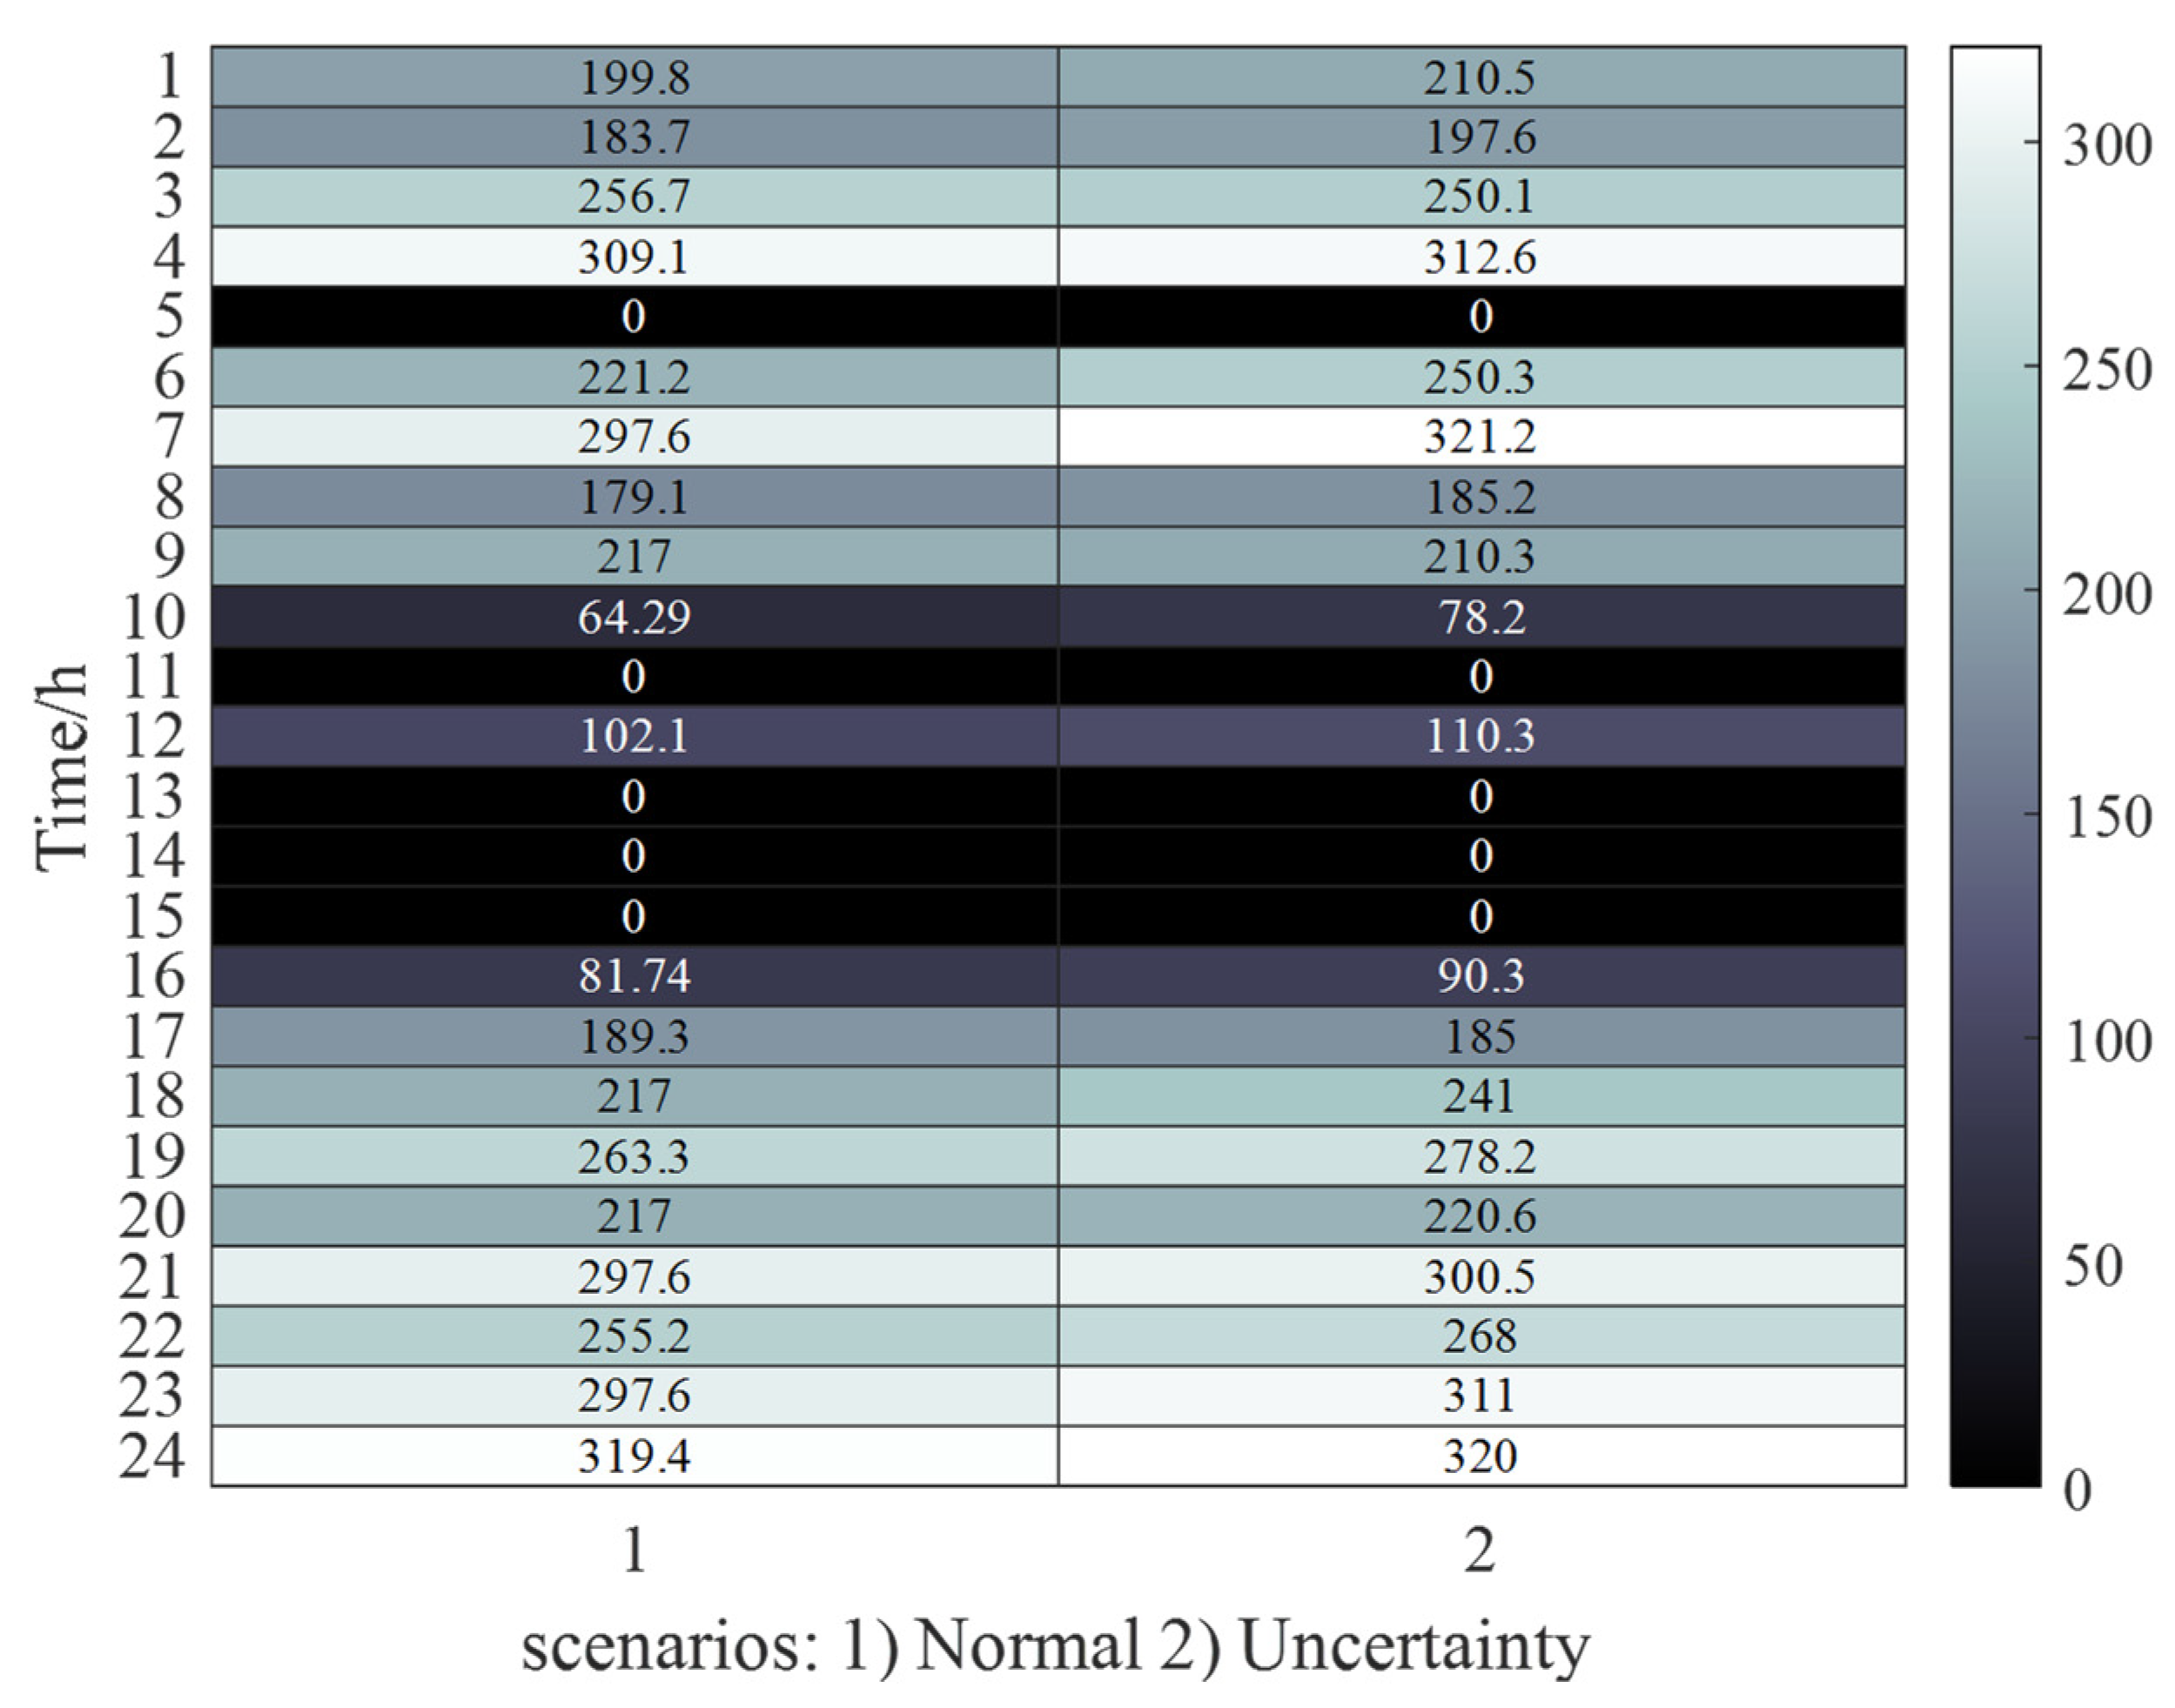
5. The Uncertainty Model
6. Simulation Results
6.1. Relieving Grid Vulnerability Based on the Proposed Strategy
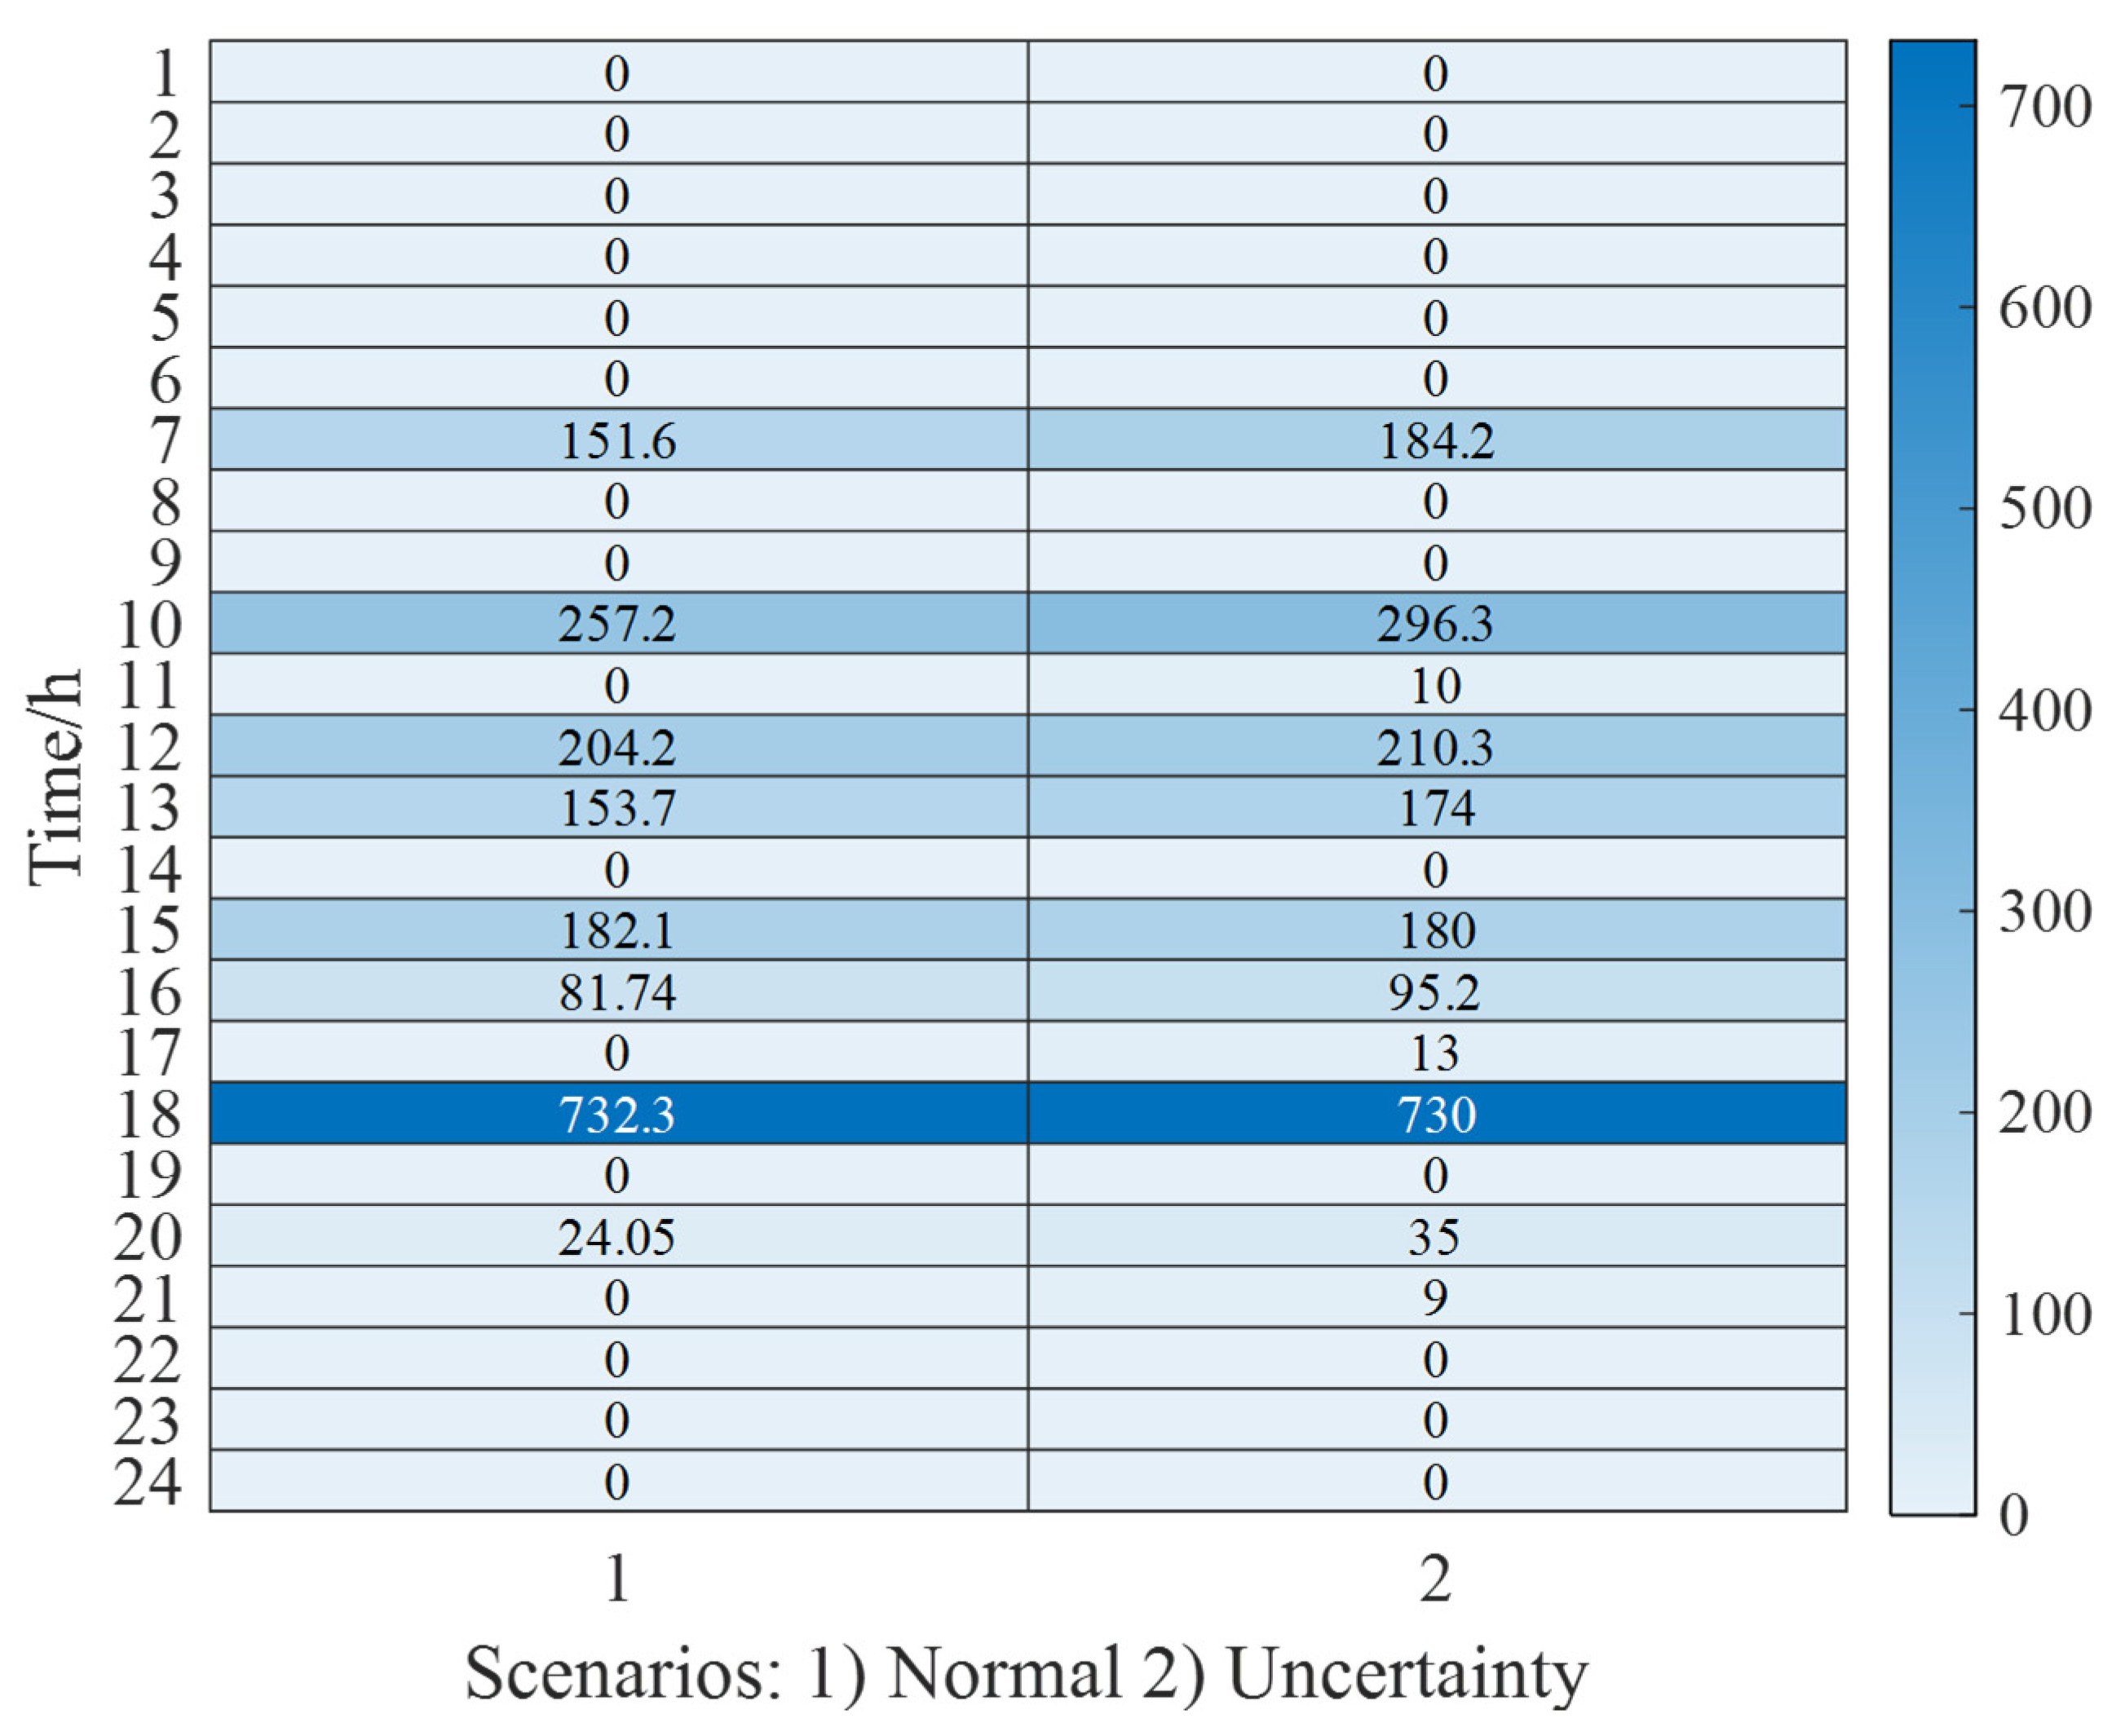
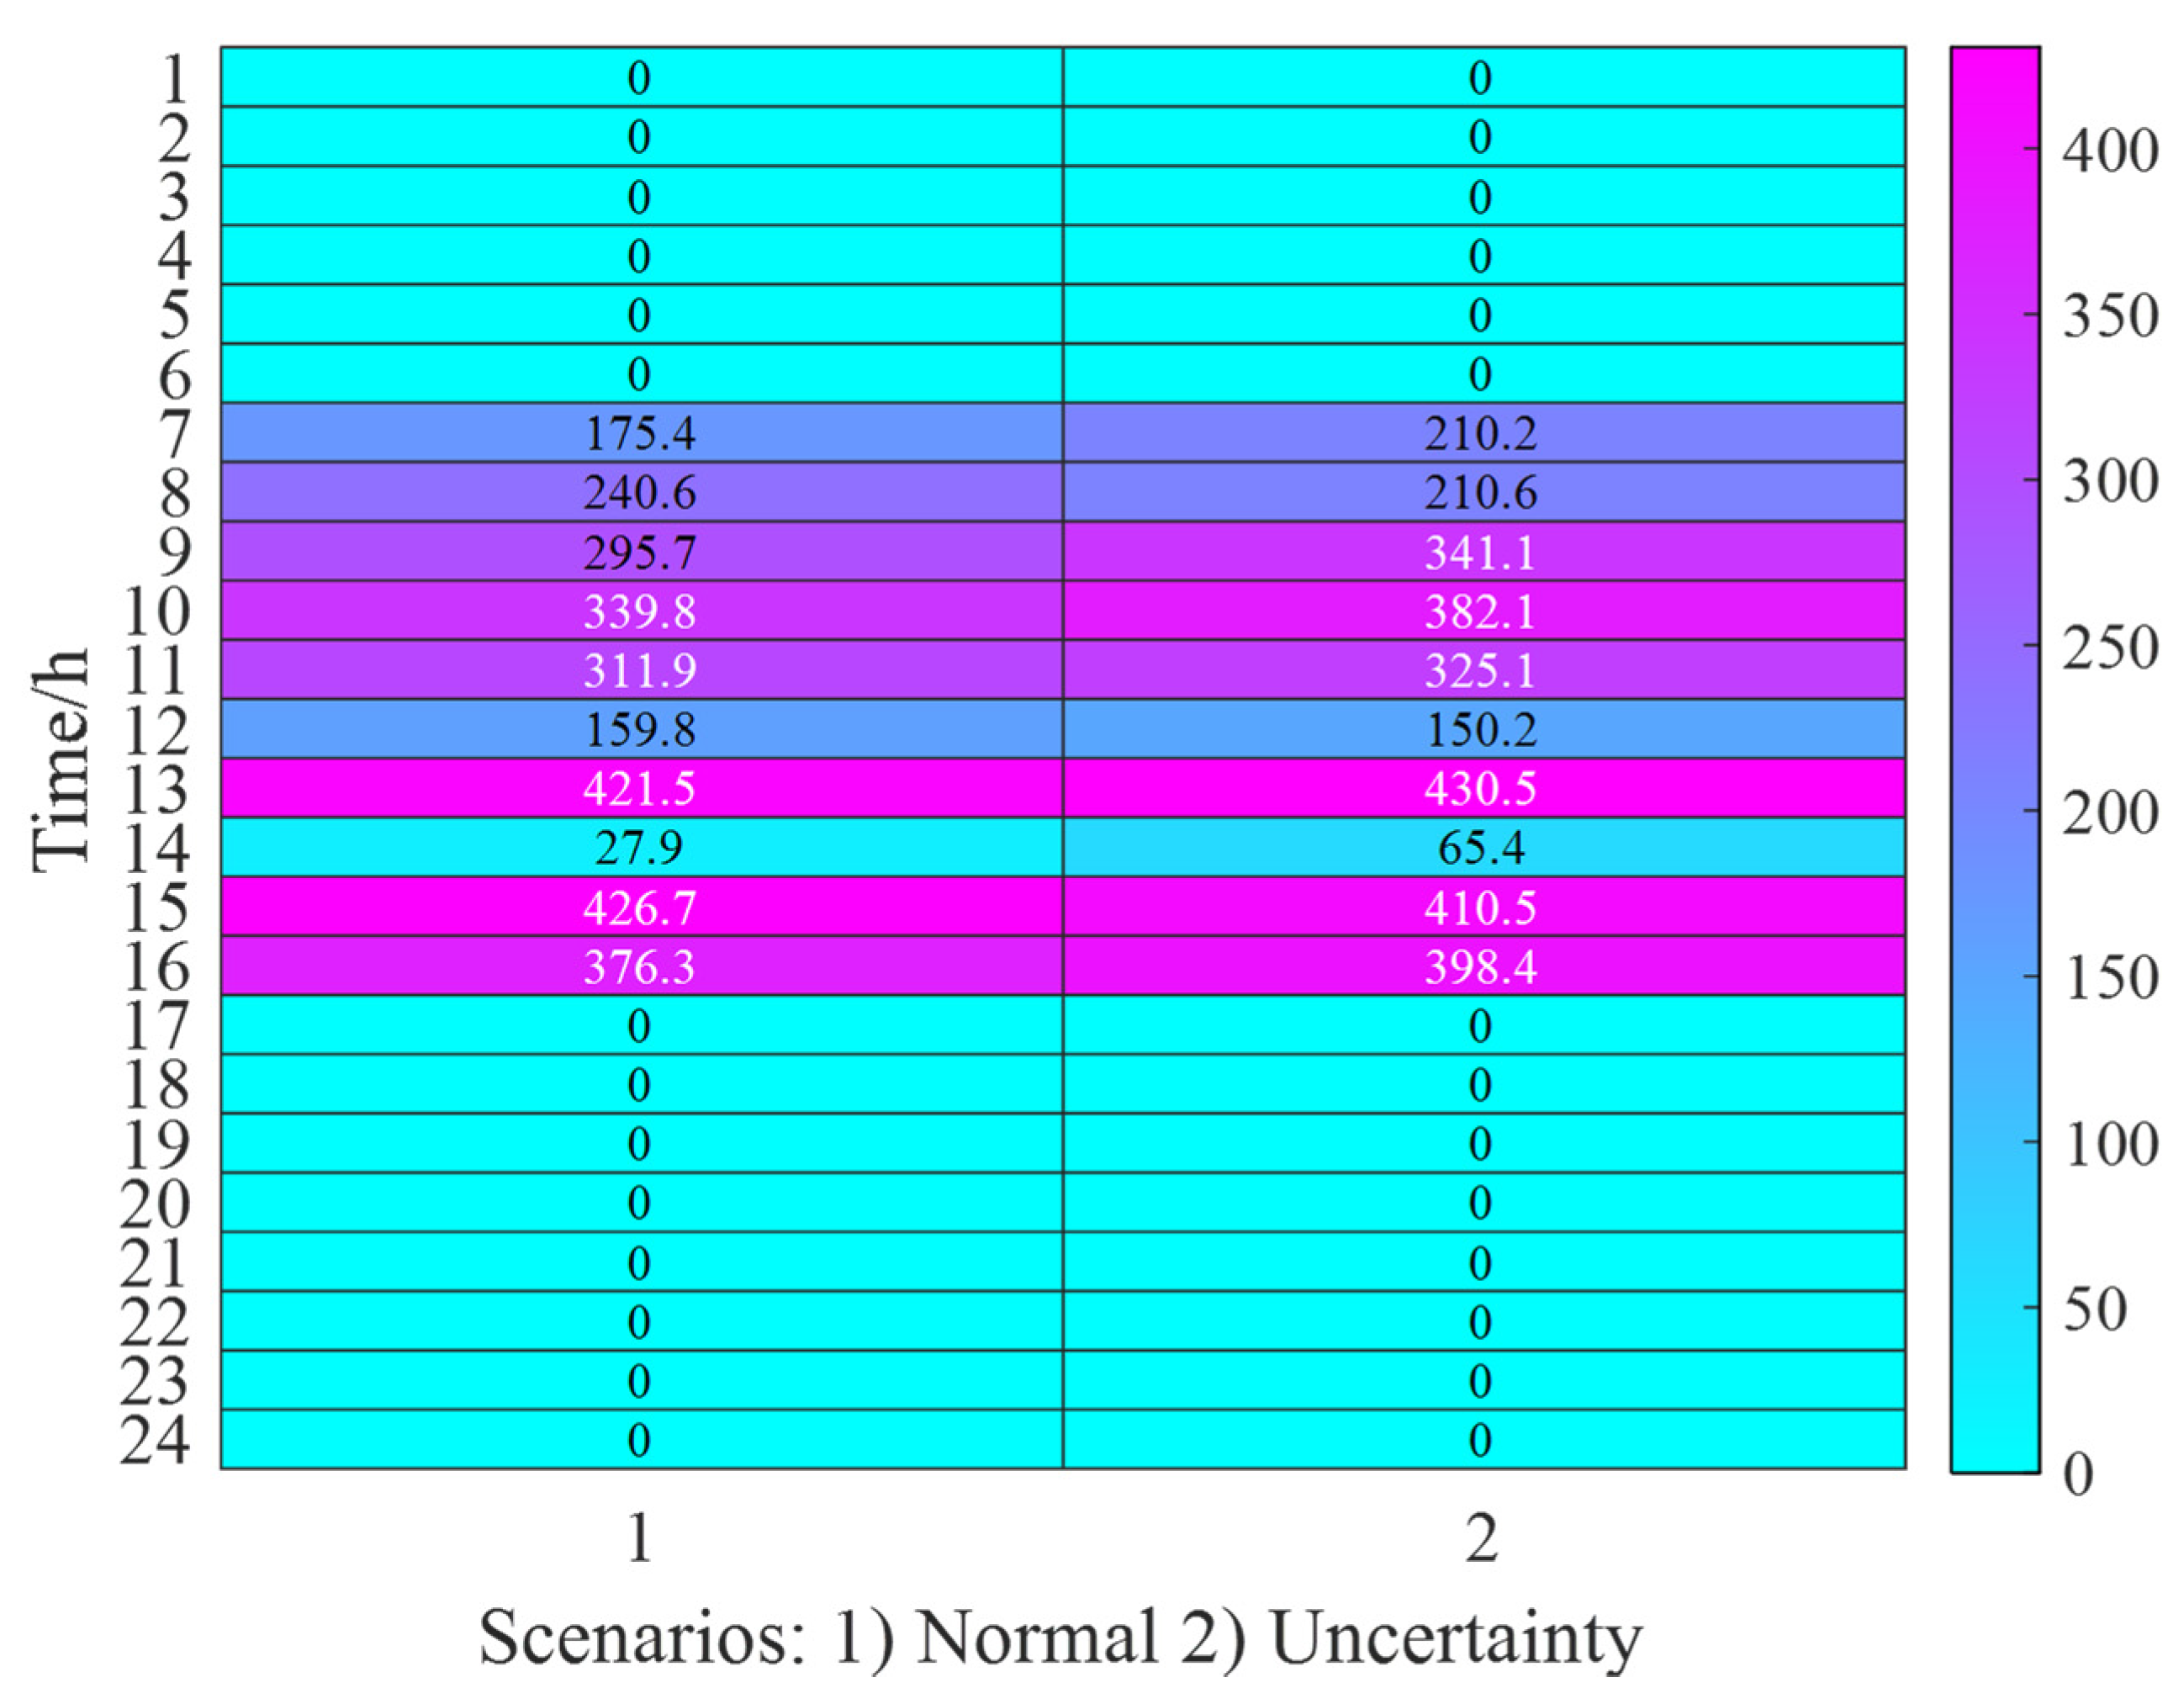
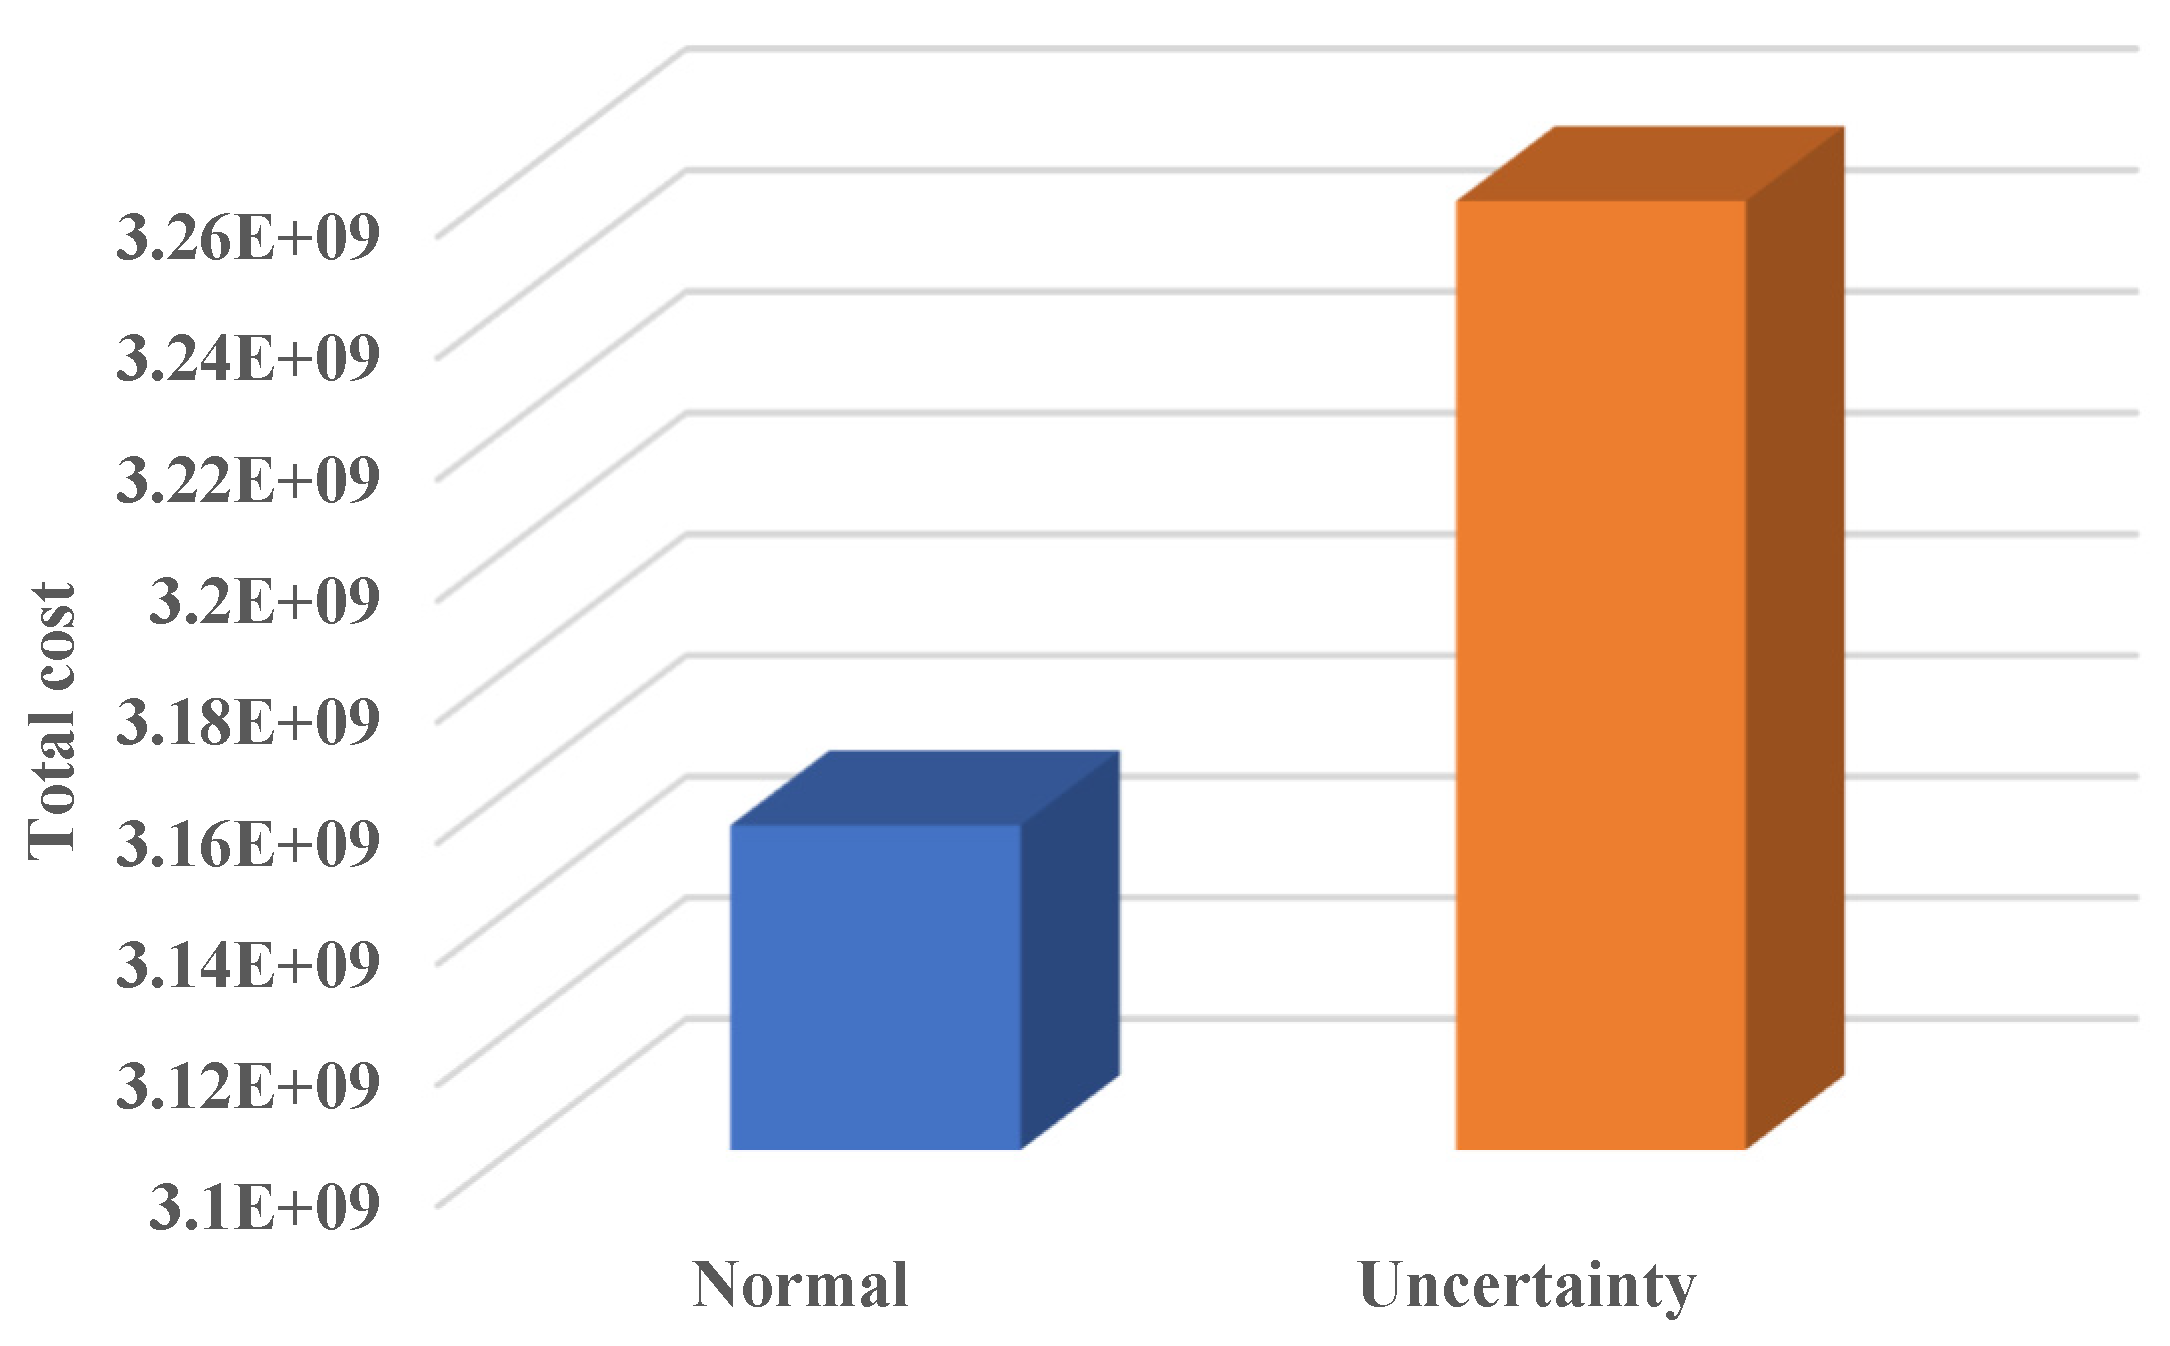
6.2. The Performance of the Uncertainty Model
7. Conclusions
Author Contributions
Funding
Institutional Review Board Statement
Informed Consent Statement
Data Availability Statement
Conflicts of Interest
Nomenclature
| Sets/Indices | |
| Set/index for feeder | |
| Set/index for power unit | |
| Set/index for hour | |
| Set/index of bus bar | |
| Limitations | |
| Solar energy | |
| PV losses | |
| Tidal current speed | |
| Tidal cut-in speed and rated speed | |
| Direct irradiation | |
| Seawater and wind densities | |
| Brushed area of the turbine blades | |
| Rotor blade area | |
| Technical characteristics of line | |
| Unit start-up, shut down | |
| , | Hydrogen mass, min/max limitations of fuel cell power. |
| PV Capacity | |
| , | Manipulated and normal data |
| Current speed of tidal | |
| Rated generation of tidal | |
| High/low limits for storage system | |
| Microgrid demands | |
| Active power limitations | |
| Line active power limitations | |
| Line reactive power limitations | |
| Reactive power limitations | |
| Up/down Limits of reserve | |
| Limits of voltage | |
| Limits of angle | |
| Smart grid active demand in each bus | |
| Smart grid reactive demand in each bus | |
| Generation price of the generator. | |
| Bidding offer for WT, tidal, PV, fuel cell and battery | |
| Mean and variance | |
| weight of the mean value | |
| covariance matrix | |
| vector of stochastic inputs | |
| Variables | |
| Generation amount of storage, WT, tidal, PV, and fuel cell units. | |
| Line outage index of bus n | |
| Bus index | |
| Line outage index of line l | |
| line index | |
| unit outage active index of line l | |
| unit index | |
| unit outage reactive index of line l | |
| unit index | |
| VUL | The objective function |
| Battery energy of PV | |
| Generator and feeder reactive power at time t. | |
| Generator and line active power at time t. | |
| Binary variables of the generator. | |
| Bus voltage or angle. | |
| Operation cost functions of smart grid and microgrid. | |
References
- Esfahani, M.M.; Mohammed, O. Real-time distribution of en-route electric vehicles for optimal operation of unbalanced hybrid AC/DC microgrids. eTransportation 2019, 1, 100007. [Google Scholar] [CrossRef]
- Xu, Q.; Xiao, J.; Wang, P.; Wen, C. A decentralized control strategy for economic operation of autonomous AC, DC, and hybrid AC/DC microgrids. IEEE Trans. Energy Convers. 2017, 32, 1345–1355. [Google Scholar] [CrossRef]
- Azeem, O.; Ali, M.; Abbas, G.; Uzair, M.; Qahmash, A.; Algarni, A.; Hussain, M. A Comprehensive Review on Integration Challenges, Optimization Techniques and Control Strategies of Hybrid AC/DC Microgrid. Appl. Sci. 2021, 11, 6242. [Google Scholar] [CrossRef]
- Ekneligoda, N.C.; Weaver, W.W. Game-theoretic cold-start transient optimization in DC microgrids. IEEE Trans. Ind. Electron. 2014, 61, 6681–6690. [Google Scholar] [CrossRef]
- Golsorkhi, M.S.; Savaghebi, M. A Decentralized Control Strategy Based on V-I Droop for Enhancing Dynamics of Autonomous Hybrid AC/DC Microgrids. IEEE Trans. Power Electron. 2021, 36, 9430–9440. [Google Scholar] [CrossRef]
- Li, P.; Zheng, M. Multi-objective optimal operation of hybrid AC/DC microgrid considering source-network-load coordination. J. Mod. Power Syst. Clean Energy 2019, 7, 1229–1240. [Google Scholar] [CrossRef] [Green Version]
- Bhowmik, C.; Bhowmik, S.; Ray, A. Optimal green energy source selection: An eclectic decision. Energy Environ. 2020, 31, 842–859. [Google Scholar] [CrossRef]
- Hussain, A.; Bui, V.-H.; Kim, H.-M. Robust Optimal Operation of AC/DC Hybrid Microgrids Under Market Price Uncertainties. IEEE Access 2017, 6, 2654–2667. [Google Scholar] [CrossRef]
- Papari, B.; Edrington, C.S.; Bhattacharya, I.; Radman, G. Effective Energy Management of Hybrid AC–DC Microgrids With Storage Devices. IEEE Trans. Smart Grid 2017, 10, 193–203. [Google Scholar] [CrossRef]
- Alnowibet, K.; Annuk, A.; Dampage, U.; Mohamed, M.A. Effective Energy Management via False Data Detection Scheme for the Interconnected Smart Energy Hub–Microgrid System under Stochastic Framework. Sustainability 2021, 13, 11836. [Google Scholar] [CrossRef]
- Acosta, M.R.C.; Ahmed, S.; Garcia, C.E.; Koo, I. Extremely randomized trees-based scheme for stealthy cyber-attack detection in smart grid networks. IEEE Access 2020, 8, 19921–19933. [Google Scholar] [CrossRef]
- Rahman, A.; Mohsenian-Rad, H. False data injection attacks with incomplete information against smart power grids. In Proceedings of the 2012 IEEE Global Communications Conference (GLOBECOM), Anaheim, CA, USA, 3–7 December 2012; pp. 3153–3158. [Google Scholar]
- Dehghani, M.; Niknam, T.; Ghiasi, M.; Siano, P.; Alhelou, H.H.; Al-Hinai, A. Fourier Singular Values-Based False Data Injection Attack Detection in AC Smart-Grids. Appl. Sci. 2021, 11, 5706. [Google Scholar] [CrossRef]
- Julier, S.J. The scaled unscented transformation. In Proceedings of the 2002 American Control Conference (IEEE Cat. No. CH37301), Anchorage, AK, USA, 8–10 May 2002; Volume 6, pp. 4555–4559. [Google Scholar]
- Abedi, A.; Hesamzadeh, M.R.; Romerio, F. An ACOPF-based bilevel optimization approach for vulnerability assessment of a power system. Int. J. Electr. Power Energy Syst. 2021, 125, 106455. [Google Scholar] [CrossRef]
- Chen, J.; Mohamed, M.A.; Dampage, U.; Rezaei, M.; Salmen, S.H.; Al Obaid, S.; Annuk, A. A Multi-Layer Security Scheme for Mitigating Smart Grid Vulnerability against Faults and Cyber-Attacks. Appl. Sci. 2021, 11, 9972. [Google Scholar] [CrossRef]
- Liu, Y.; Jin, T.; Mohamed, M.A.; Wang, Q. A Novel Three-Step Classification Approach Based on Time-Dependent Spectral Features for Complex Power Quality Disturbances. IEEE Trans. Instrum. Meas. 2021, 70, 1–14. [Google Scholar] [CrossRef]
- Zhang, Y.; Wang, L.; Xiang, Y.; Ten, C.-W. Inclusion of SCADA Cyber Vulnerability in Power System Reliability Assessment Considering Optimal Resources Allocation. IEEE Trans. Power Syst. 2016, 31, 4379–4394. [Google Scholar] [CrossRef]
- Doorman, G.; Uhlen, K.; Kjølle, G.; Huse, E. Vulnerability Analysis of the Nordic Power System. IEEE Trans. Power Syst. 2006, 21, 402–410. [Google Scholar] [CrossRef]
- Velloso, A.; Van Hentenryck, P. Combining Deep Learning and Optimization for Preventive Security-Constrained DC Optimal Power Flow. IEEE Trans. Power Syst. 2021, 36, 3618–3628. [Google Scholar] [CrossRef]
- Abedi, A.; Gaudard, L.; Romerio, F. Power flow-based approaches to assess vulnerability, reliability, and contingency of the power systems: The benefits and limitations. Reliab. Eng. Syst. Saf. 2020, 201, 106961. [Google Scholar] [CrossRef]
- Chen, J.; Alnowibet, K.; Annuk, A.; Mohamed, M.A. An effective distributed approach based machine learning for energy negotiation in networked microgrids. Energy Strat. Rev. 2021, 38, 100760. [Google Scholar] [CrossRef]
- Abianeh, A.J.; Wan, Y.; Ferdowsi, F.; Mijatovic, N.; Dragicevic, T. Vulnerability Identification and Remediation of FDI Attacks in Islanded DC Microgrids Using Multiagent Reinforcement Learning. IEEE Trans. Power Electron. 2021, 37, 6359–6370. [Google Scholar] [CrossRef]
- Mohamed, M.A.; Chen, T.; Su, W.; Jin, T. Proactive Resilience of Power Systems Against Natural Disasters: A Literature Review. IEEE Access 2019, 7, 163778–163795. [Google Scholar] [CrossRef]
- Li, Y.; Wang, B.; Wang, H.; Ma, F.; Zhang, J.; Ma, H.; Zhang, Y.; Mohamed, M.A. Importance Assessment of Communication Equipment in Cyber-Physical Coupled Distribution Networks Based on Dynamic Node Failure Mechanism. Front. Energy Res. 2022, 10, 654. [Google Scholar] [CrossRef]
- Ma, F.; Wang, B.; Zhou, J.; Jia, R.; Luo, P.; Wang, H.; Mohamed, M.A. An effective risk identification method for power fence operation based on neighborhood correlation network and vector calculation. Energy Rep. 2021, 7, 6995–7003. [Google Scholar] [CrossRef]
- Ma, H.; Liu, Z.; Li, M.; Wang, B.; Si, Y.; Yang, Y.; Mohamed, M.A. A two-stage optimal scheduling method for active distribution networks considering uncertainty risk. Energy Rep. 2021, 7, 4633–4641. [Google Scholar] [CrossRef]
- Mohamed, M.A.; Abdullah, H.M.; Al-Sumaiti, A.S.; El-Meligy, M.A.; Sharaf, M.; Soliman, A.T. Towards Energy Management Negotiation Between Distributed AC/DC Networks. IEEE Access 2020, 8, 215438–215456. [Google Scholar] [CrossRef]
- Chabok, H.; Aghaei, J.; Sheikh, M.; Roustaei, M.; Zare, M.; Niknam, T.; Lehtonen, M.; Shafi-Khah, M.; Catalão, J.P. Transmission-constrained optimal allocation of price-maker wind-storage units in electricity markets. Appl. Energy 2022, 310, 118542. [Google Scholar] [CrossRef]
- Liu, C.; Li, D.; Wang, L.; Li, L.; Wang, K. Strong robustness and high accuracy in predicting remaining useful life of supercapacitors. APL Mater. 2022, 10, 061106. [Google Scholar] [CrossRef]
- Roustaei, M.; Niknam, T.; Salari, S.; Chabok, H.; Sheikh, M.; Kavousi-Fard, A.; Aghaei, J. A scenario-based approach for the design of Smart Energy and Water Hub. Energy 2020, 195, 116931. [Google Scholar] [CrossRef]
- Zou, H.; Tao, J.; Elsayed, S.K.; Elattar, E.E.; Almalaq, A.; Mohamed, M.A. Stochastic multi-carrier energy management in the smart islands using reinforcement learning and unscented transform. Int. J. Electr. Power Energy Syst. 2021, 130, 106988. [Google Scholar] [CrossRef]
- Mohamed, M.A. A relaxed consensus plus innovation based effective negotiation approach for energy cooperation between smart grid and microgrid. Energy 2022, 252, 123996. [Google Scholar] [CrossRef]
- Roustaei, M.; Letafat, A.; Sheikh, M.; Chabok, A.; Sadoughi, R.; Ardeshiri, M. A cost-effective voltage security constrained congestion management approach for transmission system operation improvement. Electr. Power Syst. Res. 2022, 203, 107674. [Google Scholar] [CrossRef]
- Tan, H.; Yan, W.; Ren, Z.; Wang, Q.; Mohamed, M.A. Distributionally robust operation for integrated rural energy systems with broiler houses. Energy 2022, 254, 124398. [Google Scholar] [CrossRef]
- Tan, H.; Ren, Z.; Yan, W.; Wang, Q.; Mohamed, M.A. A Wind Power Accommodation Capability Assessment Method for Multi-Energy Microgrids. IEEE Trans. Sustain. Energy 2021, 12, 2482–2492. [Google Scholar] [CrossRef]


Publisher’s Note: MDPI stays neutral with regard to jurisdictional claims in published maps and institutional affiliations. |
© 2022 by the authors. Licensee MDPI, Basel, Switzerland. This article is an open access article distributed under the terms and conditions of the Creative Commons Attribution (CC BY) license (https://creativecommons.org/licenses/by/4.0/).
Share and Cite
Almalaq, A.; Albadran, S.; Alghadhban, A.; Jin, T.; Mohamed, M.A. An Effective Hybrid-Energy Framework for Grid Vulnerability Alleviation under Cyber-Stealthy Intrusions. Mathematics 2022, 10, 2510. https://0-doi-org.brum.beds.ac.uk/10.3390/math10142510
Almalaq A, Albadran S, Alghadhban A, Jin T, Mohamed MA. An Effective Hybrid-Energy Framework for Grid Vulnerability Alleviation under Cyber-Stealthy Intrusions. Mathematics. 2022; 10(14):2510. https://0-doi-org.brum.beds.ac.uk/10.3390/math10142510
Chicago/Turabian StyleAlmalaq, Abdulaziz, Saleh Albadran, Amer Alghadhban, Tao Jin, and Mohamed A. Mohamed. 2022. "An Effective Hybrid-Energy Framework for Grid Vulnerability Alleviation under Cyber-Stealthy Intrusions" Mathematics 10, no. 14: 2510. https://0-doi-org.brum.beds.ac.uk/10.3390/math10142510