Article

Assessing the Impact of Attendance Modality on the Learning Performance of a Course on Machines and Mechanisms Theory

by
David Valiente
1,*,†,
Héctor Campello-Vicente
2,*,†,
Emilio Velasco-Sánchez
2,†,
Fernando Rodríguez-Mas
1,† and
Nuria Campillo-Davo
2,†
1
Communications Engineering Department, Miguel Hernández University, Av. de la Universidad s/n. Ed, Innova, 03202 Elche, Spain
2
Mechanics and Energy Department, Miguel Hernández University, Av. de la Universidad s/n. Ed, Innova, 03202 Elche, Spain
*
Authors to whom correspondence should be addressed.
These authors contributed equally to this work.
Submission received: 18 February 2021 / Revised: 26 February 2021 / Accepted: 3 March 2021 / Published: 6 March 2021
(This article belongs to the Special Issue Recent Advances in STEM Education)

Abstract

:
University education approaches related to the field of science, technology, engineering and mathematics (STEM), have generally particularized on teaching activity and learning programs which are commonly understood as reoriented lessons that fuse theoretic concepts interweaved with practical activities. In this context, team work has been widely acknowledged as a means to conduct practical and hands-on lessons, and has been revealed to be successful in the achievement of exercise resolution and design tasks. Besides this, methodologies sustained by ICT resources such as online or blended approaches, have also reported numerous benefits for students’ active learning. However, such benefits have to be fully validated within the particular teaching context, which may facilitate student achievement to a greater or lesser extent. In this work, we analyze the impact of attendance modalities on the learning performance of a STEM-related course on “Machines and Mechanisms Theory”, in which practical lessons are tackled through a team work approach. The validity of the results is reinforced by group testing and statistical tests with a sample of 128 participants. Students were arranged in a test group (online attendance) and in a control group (face-to-face attendance) to proceed with team work during the practical lessons. Thus, the efficacy of distance and in situ methodologies is compared. Moreover, additional variables have also been compared according to the historical record of the course, in regards to previous academic years. Finally, students’ insights about the collaborative side of this program, self-knowledge and satisfaction with the proposal have also been reported by a custom questionnaire. The results demonstrate greater performance and satisfaction amongst participants in the face-to-face modality. Such a modality is prooven to be statistically significant for the final achievement of students in detriment to online attendance.

1. Introduction

Over the last decade, technical education in universities has experienced a reformulation brought by innovative methodologies, which in most cases are actually recognized as the present model for todays’ education. Focusing on areas related to science, technology, engineering and mathematics (STEM), and more particularly to engineering, the trend heads towards new communication strategies [1,2] sustained by a common framework of ICT resources. This fact fosters the integration of blended and fully online methodologies, which again, demonstrate promising results in a wide range of scenarios [3,4,5,6].
Notwithstanding the doubtless and general success of these methodologies, a more explicit discussion should be addressed in terms of their appropriateness to certain specific learning contexts. To that end, the main goal usually seeks to assess active and valid learning. However, this comes implicitly associated with a set of secondary objectives which are strongly connected to the need of overcoming generalized misconceptions and wrong pre-acquired understanding of basic theoretic concepts [7,8,9,10] (most of them are even experienced by teachers [11]).
Teachers’ efforts are concentrated on the guidance of the learning process [12,13]. Synthesis of information, redesign of materials and resources, and curriculum alignment [14] are examples of demanding tasks expected from teachers, which have to lead students to direct their own learning [15,16] and self-understanding of concepts involved in a subject. In this sense, planning teaching activities that add real value to the master class is crucial. Either the interaction is considered face-to-face or online, allowing students to assimilate transference between theoretic concepts, practical activities and real world cases is the crucial question to tackle.
Apart from the sort of attendance to lessons, either in person, virtually or by means of blended approaches, their success is also constrained by the arrangement of students, specially when it comes to practical and hands-on lessons. In many education scenarios within the engineering field, collaborative frameworks [17,18,19] may be more decisive than individual work [20]. However, there are many aspects to evaluate with respect to possible methods of arranging students and their efficacy. In addition, many authors have studied the particularities of the communication channel (i.e., sort of attendance) [21,22,23,24], contextualized on different frameworks. In this regard, the present work concentrates on the effect of face-to-face and online attendance during collaborative practical lessons, within the field of Mechanics engineering education. The previous aspect envisages the formulation of the main research question: Which attendance modality is more significant for the students within this context?
Despite the fact that the existence of an endless variety of approaches [25,26,27,28] confirms the success of ICT resources to reinforce the active learning amongst engineering students, the join between arrangement of groups and thoughtful design of activities within the whole teaching strategy, seems the essence to reach successful comprehension amongst students, rather than trusting success solely on the communication channel [29]. Therefore, and according to this postulate, in the field of Mechanics the influence of the communication channel might be relegated to a second place in favor of the sort of activities defining the approach: project-based [30,31], problem-based [32,33,34], game-based [35,36,37], simulation-based [38,39], virtual environments [40,41,42], etc.
According to these previous aspects, this work contributes with a renewed learning program, principally sustained by a collaborative practical framework in which students face problem-based and project-based activities in work teams. Moreover, the attendance modality is also under study. The group of students has been randomly divided into: (i) A test group that carries out the team activities by means of online tools, which are provided by the Google Suit for collaborative work and (ii) A control group that carries out the team activities face-to-face in the laboratories of the faculty. It is worth highlighting that face-to-face attendance has been selected as the control group, since it corresponds with the most traditional approach of lessons attendance. Besides, the random arrangement was intended to assure equal characteristics within groups for robust and reliable statistical tests. However, there are always possibilities that some bias may appear. Amongst others, the initial preference of students to be assigned in one group of another, might induce some bias. This aspect is expected to be diluted thanks to a extended comparison with previous academic years in which this program had not been implemented.
Thus this study concentrates on assessing the improvements in terms of students’ performance but also on the significance and impact of the communication channel (either face-to-face or online) when integrating this learning program in a general course of “Machines and Mechanisms Theory” in engineering degrees. That course is taught during an entire semester of the second year of two Bachelor’s degrees in engineering: Electrical Bachelor’s degree and Electronics and Automation Bachelor’s degree. Both are comprised by standard academic plans of the Miguel Hernandez University, within the official Spanish university system. Several indicators and statistical parameters have been obtained in order to produce robust and reliable comparisons, inferences and dependencies between variables. This study has been conducted during the academic year 2019–2020, however, some results have also been compared with the historic record of the subject.
The remainder of the paper is structured as follows: Section 2 presents an overview of the designed methodology; Section 3 focuses on the results, presenting the statistical analysis and the questionnaire data; Section 4 discusses the results. Finally, Section 5 comprises the conclusions and insights derived from this study.

2. Materials and Method

The course in which the present research is focused comprises the subject “Machines and Mechanisms Theory”, imparted in the second year of several degrees in engineering. The subject deals with a syllabus related to fundamentals of synthesis of mechanisms, kinematics and dynamics. The learning objectives essentially concentrate on providing students with the necessary knowledge and tools for tackling the design of machines and mechanisms. Together with analysis, synthesis of mechanisms is crucial in the preliminary design of wider mechanic systems that eventually accomplish with certain movement constraints, generally imposed by the operation of the system.
The learning program was conceived under the encouragement of a teaching innovation program within the framework of a local call in the Miguel Hernandez University (University Teaching Innovation Program [43]). The call regulations postulated the granting of funds to proposals which promoted and faced the objectives and challenges stated by the New Media Consortium (NMC) in the Educase Learning Initiative (ELI), both included by the recent Horizon report in higher education [44]. In that sense, such a call to seek the following purposes is endorsed:
  • Redesigning learning spaces.
  • Promoting blended learning designs.
  • Promoting collaborative learning.
With such purposes in mind, but also considering the syllabus of the subject and the expected competences to be acquired by students, the set of activities for the course had to be redesigned. Thus this implementation concentrated on developing practical activities in which students had to work collaboratively under problem-based and project-based methodologies.
Additionally, the use of specific collaborative ICT tools is integrated to deal with the main objective of this work: assessing the level of performance and achievement of students, depending on the communication channel by which practical activities are tackled. In order to conduct the study, the applications Google Hangouts (chat outlook) and Google Groups (forum outlook) have been chosen to arrange half of the students in a test group. By contrast, the other half was arranged in a control group that proceeded with the same practical activities face-to-face in the mechanics laboratory and in the computer classroom.

2.1. Student Groups

The present study considered a total of 128 participants, as the set of students enrolled in the subject during the academic year 2019–2020. The teaching activity of the course, learning program and lectures are common for all the participants, however, these students belong to two different engineering degrees: Electrical Bachelor’s degree (39) and Electronics and Automation Bachelor’s degree (99). The arrangement in which students were divided for group testing was randomly selected, so that equal groups were established, as listed below. It is worth noticing that these two sets were, in turn, subdivided into work teams of four students when practical lessons started.
(a)
Test group conformed by 64 students (16 subgroups of 4 students), who attended the practical lessons virtually through the collaborative apps Google Hangouts and Google Groups.
(b)
Control group with the other 64 students who attended the collaborative practical lessons face-to-face (16 subgroups of 4 students).
It is also worth mentioning that the students participating in this study gave their consent to process data associated with satisfaction and academic marks, without any other personal identifiable information. Their demographic characteristics are the following:
  • Gender: Male (103); Female (25).
  • Nationality: Spanish (122); Non-Spanish (6).

2.2. Course Description

The breakdown of the teaching activity is divided into three differentiated blocks, namely content units, throughout the semester:
  • Unit 1: Introduction to synthesis of mechanisms.
  • Unit 2: Kinematics and dynamics of machines.
  • Unit 3: Machines elements.
The fact that this is an essential subject in the area of Mechanics permits teaching it simultaneously in the mentioned degrees in engineering during the first semester of the academic year, within their second year of the degree. Regardless of the previous subjects passed by students, the structure and development of the subject starts at the same initial point, for which the only previous and expected knowledge is that related with the rigid body. From that point onwards, Figure 1 presents the schedule of the course, while Table 1 lists the entire syllabus and content of each lesson. These lessons concentrate on the three central units, being distributed along the 15 weeks of the semester (100 min per lesson). Generally, these theory lessons are scheduled on the basis of twice a week, while seven practical lessons are planned from week 3 to 9. These practical lessons are divided into simulation lessons at the computer classroom (4), and hands-on lessons at the mechanics laboratory (3).
As mentioned above, this learning program established in the course 2019–2020, reformulates these practical lessons to be conducted in a collaboratively approach of small work teams, in which activities and exercises are assigned. It is worth noticing that in the previous courses students simply attended the practical lessons and completed the practical activities (assigned and handed-in) without any particular approach of problem-based nor project-based. They just tended to, exceptionally, discuss activities in couples. In this sense, Figure 2 sketches the evolution of resources and sort of lessons devoted to the teaching activity during the past six courses.
The theory lessons also introduce resolution of exercises and numeric activities, in this case, these are solved by the lectures and alternated with the teaching of theoretic concepts. It should be noted that these theory lessons are also reinforced by specific individual assignments at the end of each unit. Figure 3 presents an example of exercise contained in one of these assignments. Figure 3a shows the exercise statement and Figure 3b its resolution. In this manner, students face the resolution of real world exercises (two per unit; six in total). This makes them work autonomously in order to complement the comprehension of the contents taught in class, but most importantly, it approaches them to the context of higher-order real problems, similar to those which they will cope with during the collaborative work in the practical lessons. Again, it is essential to highlight the renewal of the practical lessons in the course 2019–2020. In contrast to the previous ones, the current considers problem-based and project-based methodologies to tackle activities collaboratively during these lessons. Simulation and hands-on lessons maintain the essence; however, individual assignments and single work is no longer carried out. The lecturers take the guidance and promote the team work during the lessons.

2.3. Team Work and Activities

The previous subsections have already outlined the course in which this learning program has been implemented. The theory lessons and practical lessons schematize its global structure, as already detailed in Figure 1 and Table 1.
The main effort of the lecturers incises on the collaborative work devoted to the practical lessons, both in the mechanics laboratory and in the computer classroom, with three and four lessons, respectively. During these seven lessons, which are taught concurrently with the theory lessons, the team work arrangement with differentiated attendance (namely, communication channel) is implemented. Again, the principal goal is to assess the learning performance and achievement of students when working collaboratively in groups, depending on the communication channel: (a) Online attendance (test group: 64 students) and (b) Face-to-face attendance (control group: 64 students). These groups were subdivided into teams of four students during each lesson. Amongst the test group, two sub-divisions were established: some groups conducted the collaborative work with Google Groups; and others with Google Hangouts.
The practical activities consist in a set of practical exercises to be solved with project-oriented and problem-oriented approaches by those small teams of four students. On the one hand, activities in the mechanics laboratory seek the consolidation of theory concepts by its application to physical mockups. Recognizing movements and poses are the primary purposes of these hands-on sessions. Figure 4 presents the different mockups that are tested during these sessions. On the other hand, practical lessons at the computer classroom pursue the synthesis and simulation of mechanisms, being run by different simulation softwares (AutoCAD and Matlab). Figure 5 exemplifies one of these practical activities. In particular, Figure 5a presents the simulation of the mechanism, carried out during one of the applicable lessons conducted with computer, while Figure 5b presents the corresponding real mechanism in operation, tested by students in the mechanics laboratory. During these sessions students are capable of testing and verifying velocities, accelerations and poses of the studied mechanisms. Despite the fact that students are expected to work autonomously in teams, the lecturers handle the guidance of the sessions, by providing students with steps of procedure, concepts revision, and answers to common doubts that finally allow them to accomplish with the assigned activities. It must be noted that this role of guidance played by the lecturers is replicated both in the face-to-face practical lessons (control group) and in the virtual lessons (test group), since both take place live, according to the official schedule of the subject.

2.4. Satisfaction Questionnaire

Secondarily to the main goal of this work, the assessment of this learning program in terms of perception reported by participants is also emphasized. Apart from evident results in relation to performance and achievement of students, which may be typically represented by marks, there exists an essential relation between the participant implication and adhesion to a method with its influence on the final efficacy and success of the learning program [45]. That is why the intention is to obtain preliminary results about the insights of the participants towards the basis of this proposal. As indicated in Table 1, a custom questionnaire was passed to participants twice: at the beginning (week 2) and at the end (week 15) of the course. Only four questions were formulated, so as not to lose the thread with a lengthy questionnaire, but most importantly, to focus principally on the collaborative frameworks:
  • Q1: Communication between team mates while tackling activities resolution.
  • Q2: Understanding of explanations, reasoning and postulates of team mates.
  • Q3: Comprehension and reinforcement of theory concepts thanks to other team mates contributions.
  • Q4: Difficulties in following the technical resolution procedure collaboratively.

3. Results

3.1. Questionnaire Results

The first results are those related to the previous subsection, in which the satisfaction questionnaire has been presented. 
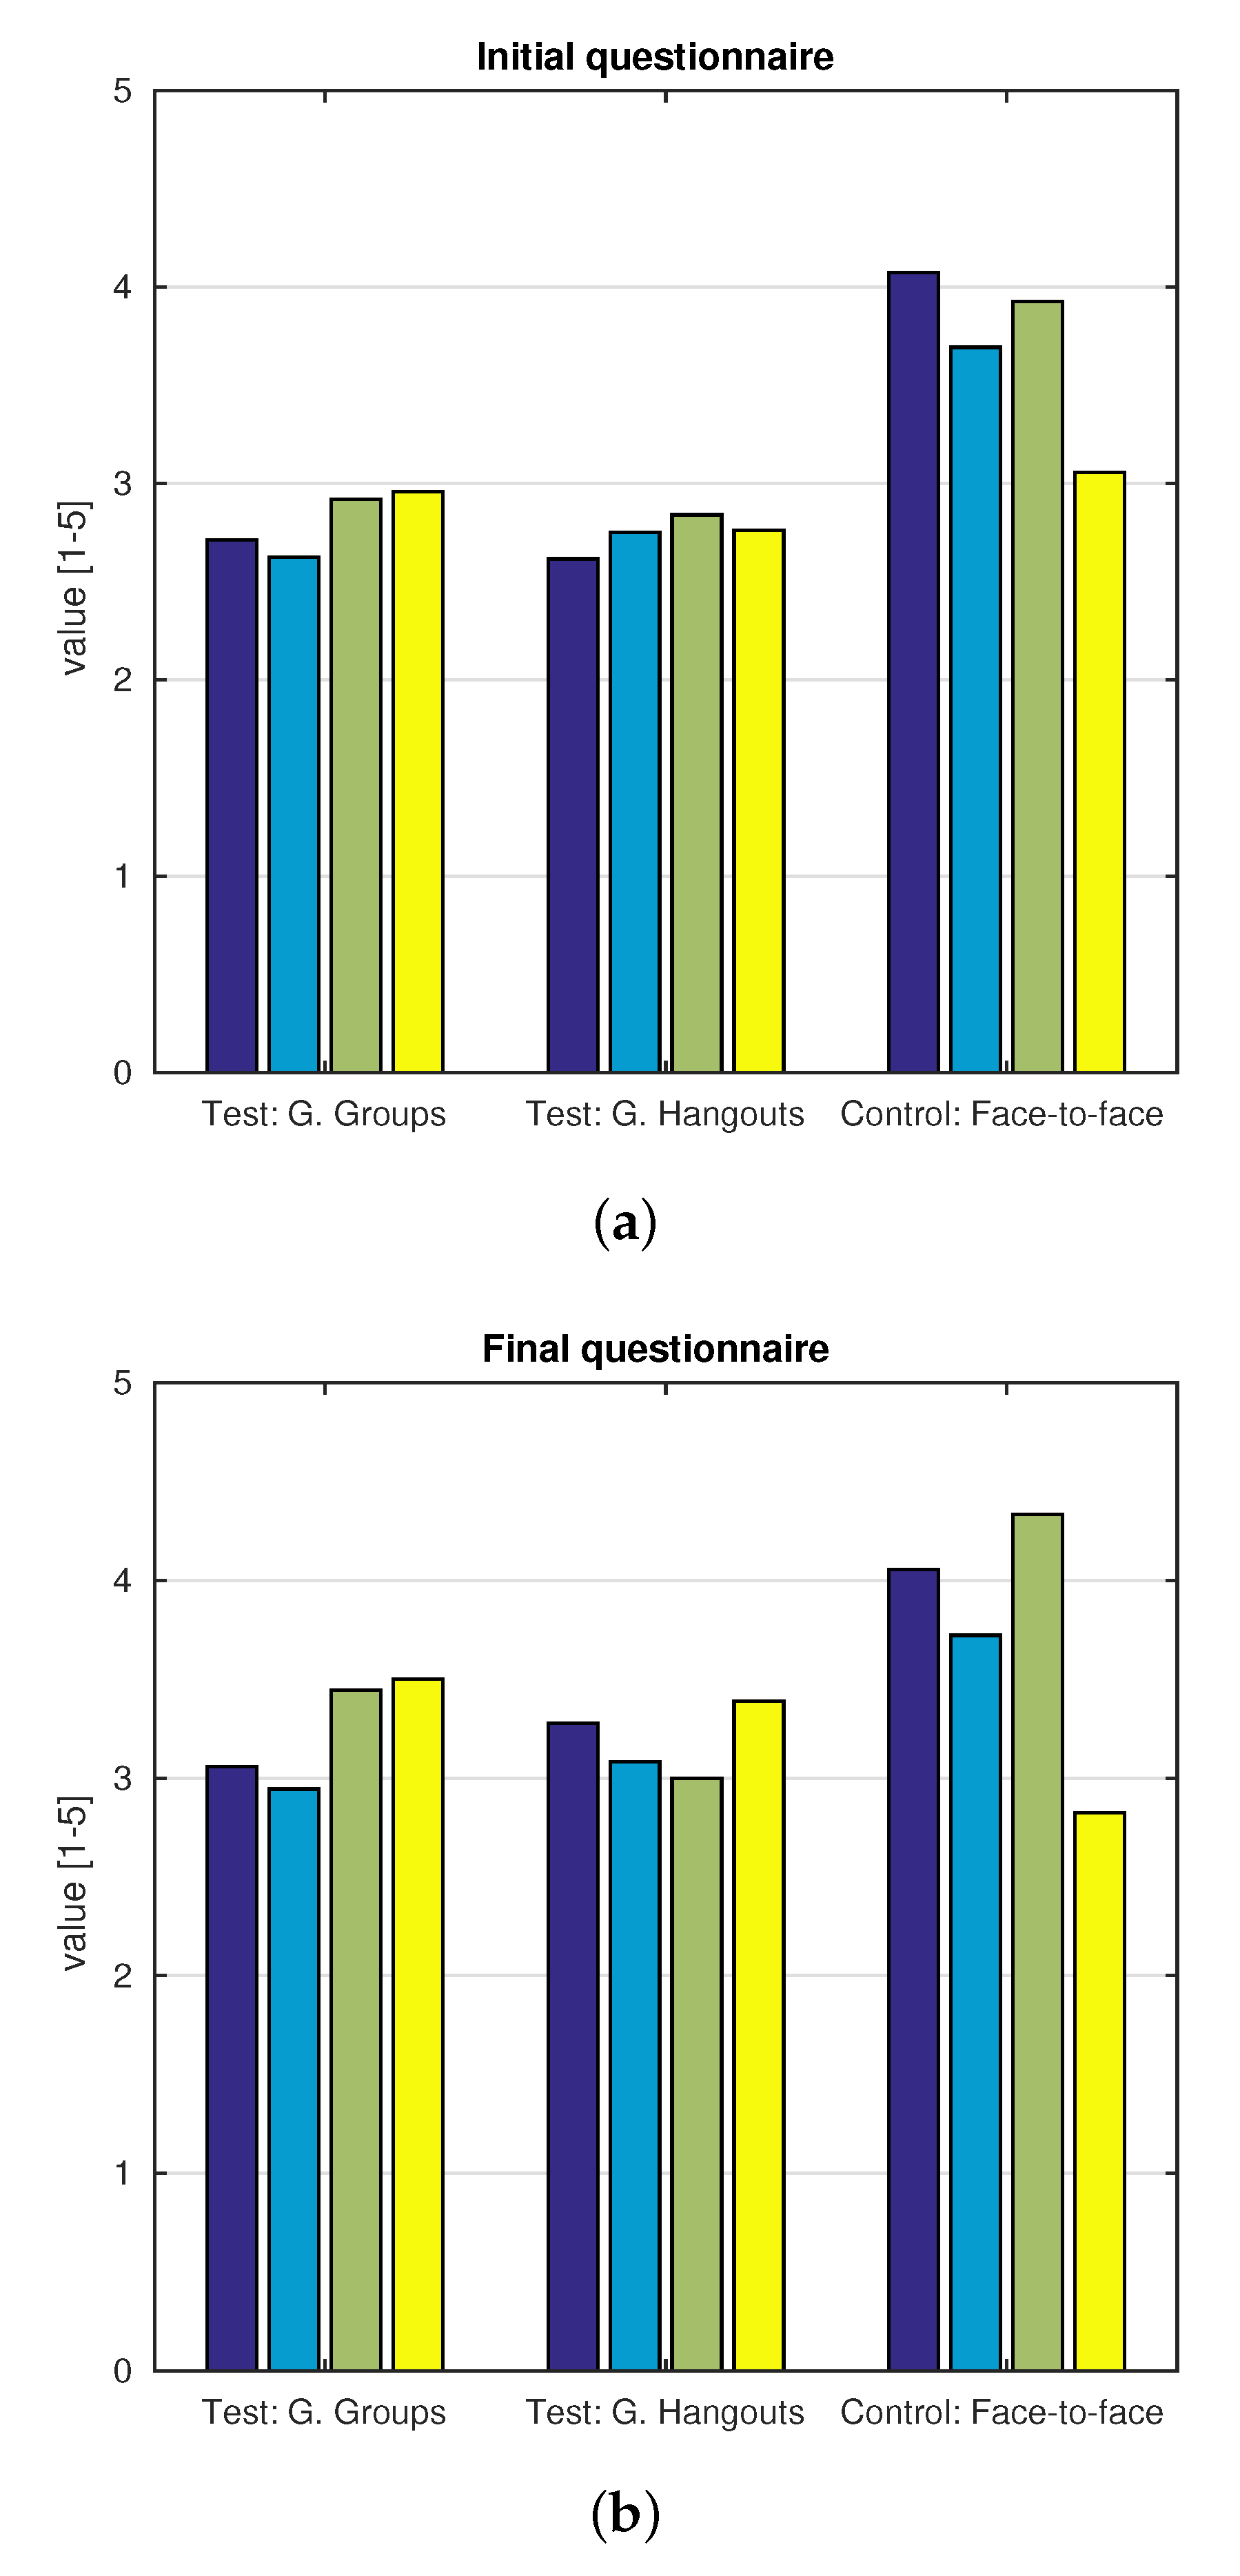
Figure 6 depicts the evolution in the responses to the questionnaire, from the initial pass (Figure 6a) to the final pass (Figure 6b), as measured in average terms. These questions were responded on a Likert scale from 1 to 5, going from total disagreement (1) to total agreement (5). Some preliminary comparisons can be extracted from these figures. A significant difference is observed between the test groups and the control group. In general terms, all the assessed aspects were more satisfactorily perceived by students who attended the practical lessons face-to-face than students who attended virtually. Despite the increasing tendency observed in the evolution between the initial and final pass, the satisfaction of virtual attendance do not improve sufficiently as long as the course advances in time. Similarly, face-to-face modality presents slight increments from the initial to the final pass. Nevertheless, the average responses demonstrate higher satisfaction. Notably, it reveals a promising result about how these lessons are perceived. Face-to-face attendance might represent an excellent complement to assimilate theory concepts for students, while practical activities are tackled through a collaborative approach. Additionally, 
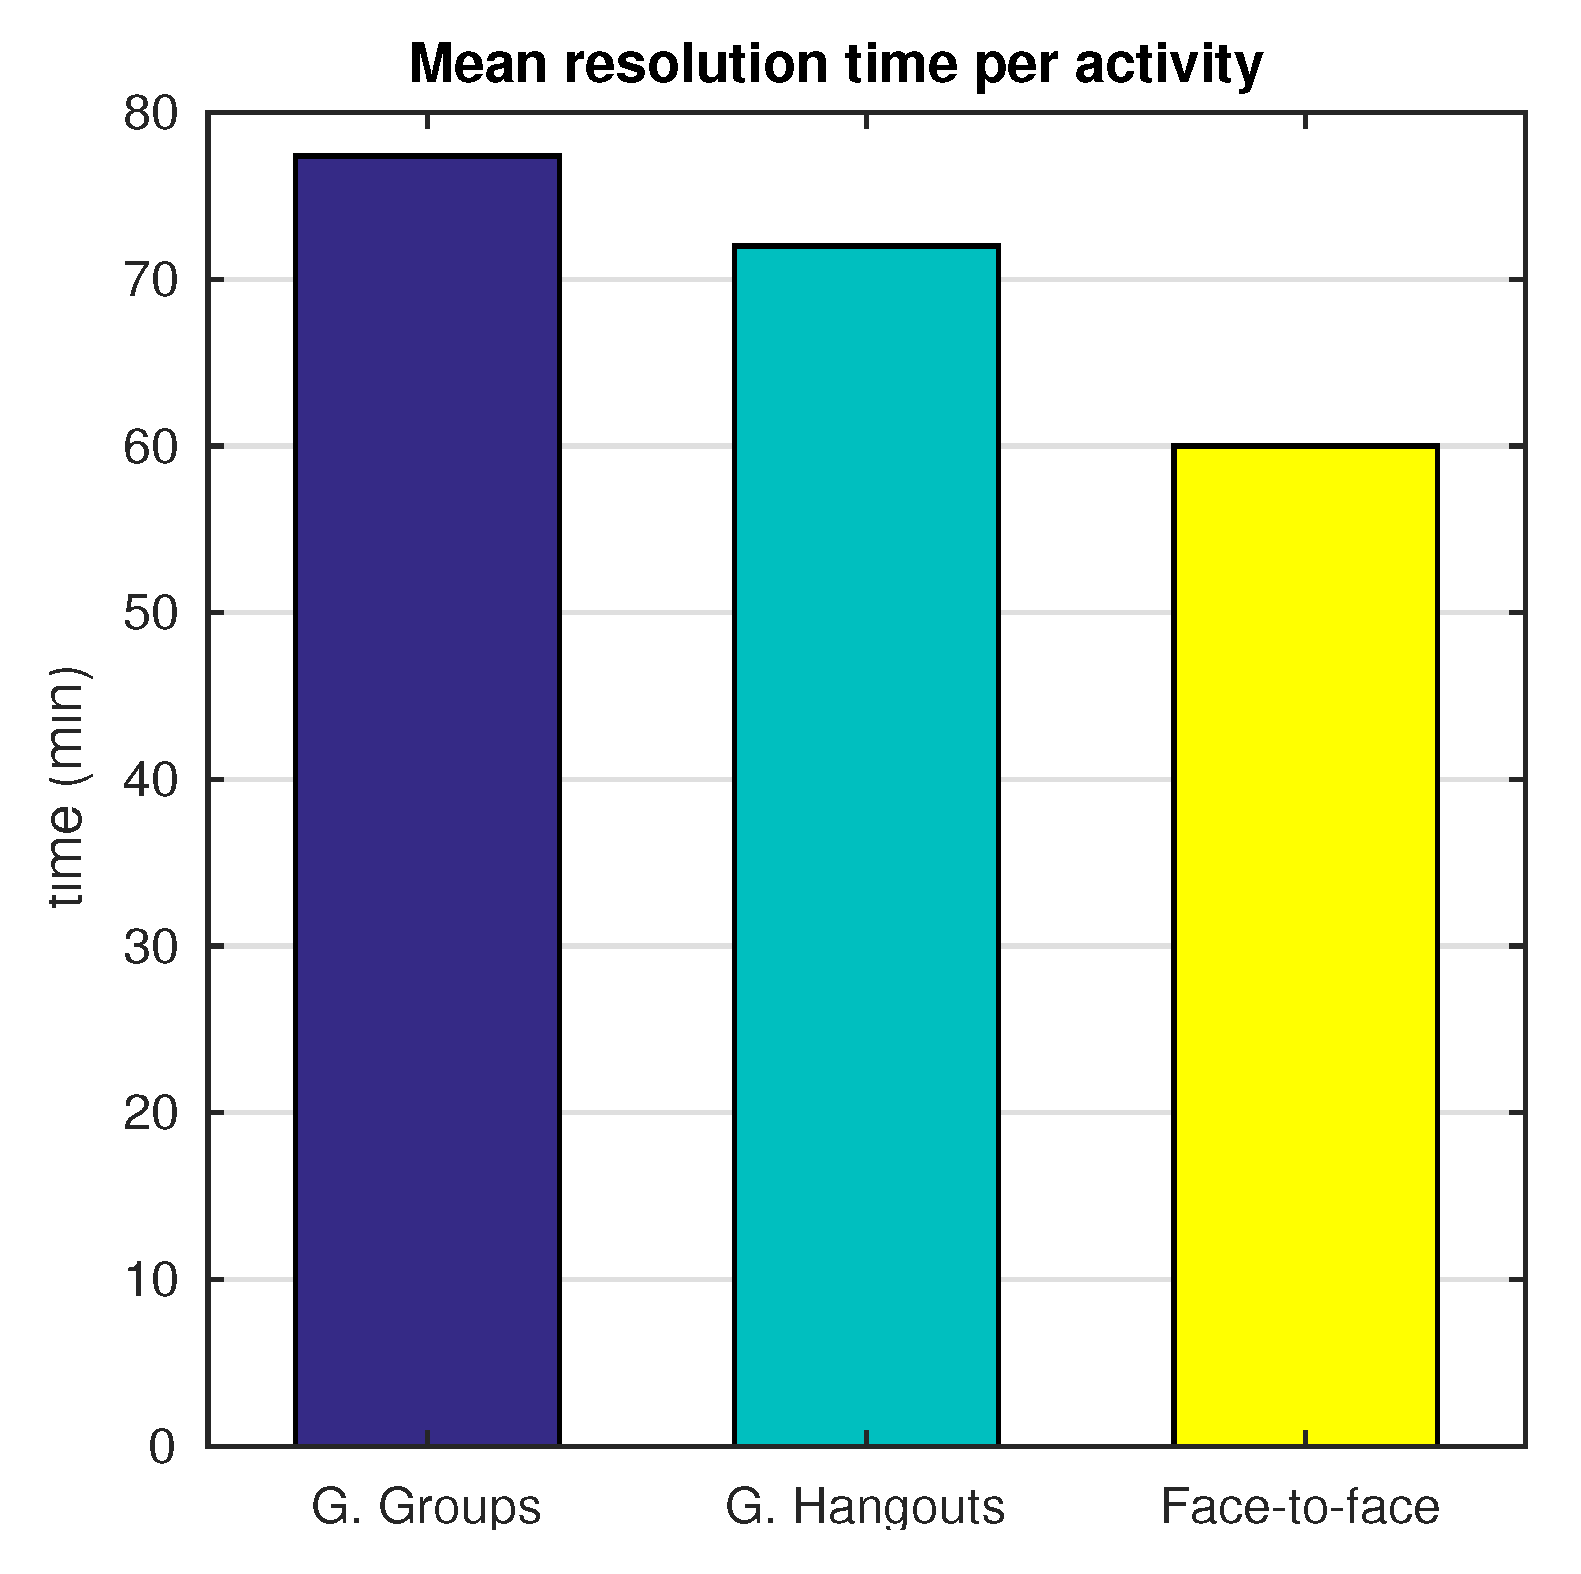
Figure 7 presents another comparative outlook, which involves students’ time to accomplish the activities proposed during these practical sessions. The previous perception of easiness in the work flow and procedure for the face-to-face attendance may be confirmed since the average time is nearly 20 min less than the times dedicated in the virtual modality.
After inspecting these results, a first outcome can be deduced. Students perceive better profit for their learning when practical activities are faced collaboratively employing face-to-face team work. Nonetheless, in the following section, other data acquired in the study are analyzed in-depth, such as achievement metrics and possible inferences and correlation between variables.

3.2. Academic Performance

Once the collaborative structure adopted for the practical lessons has been satisfactorily validated by the face-to-face attendance group in terms of satisfaction, this section delves into further study of data associated with both the test and the control groups. Apart from the students’ opinion and attitude to the different modalities of attendance, it is essential to appraise the real outcomes obtained in terms of learning performance and achievement.
Initially, an obvious indicator to state new comparisons between groups is the students’ success, denoted as their academic performance in the subject and represented in broad terms by their final marks. To broaden the comparison’s horizon, this has been extended with the inclusion of the historical records of marks of the subject (from the academic year 2014–2015). 
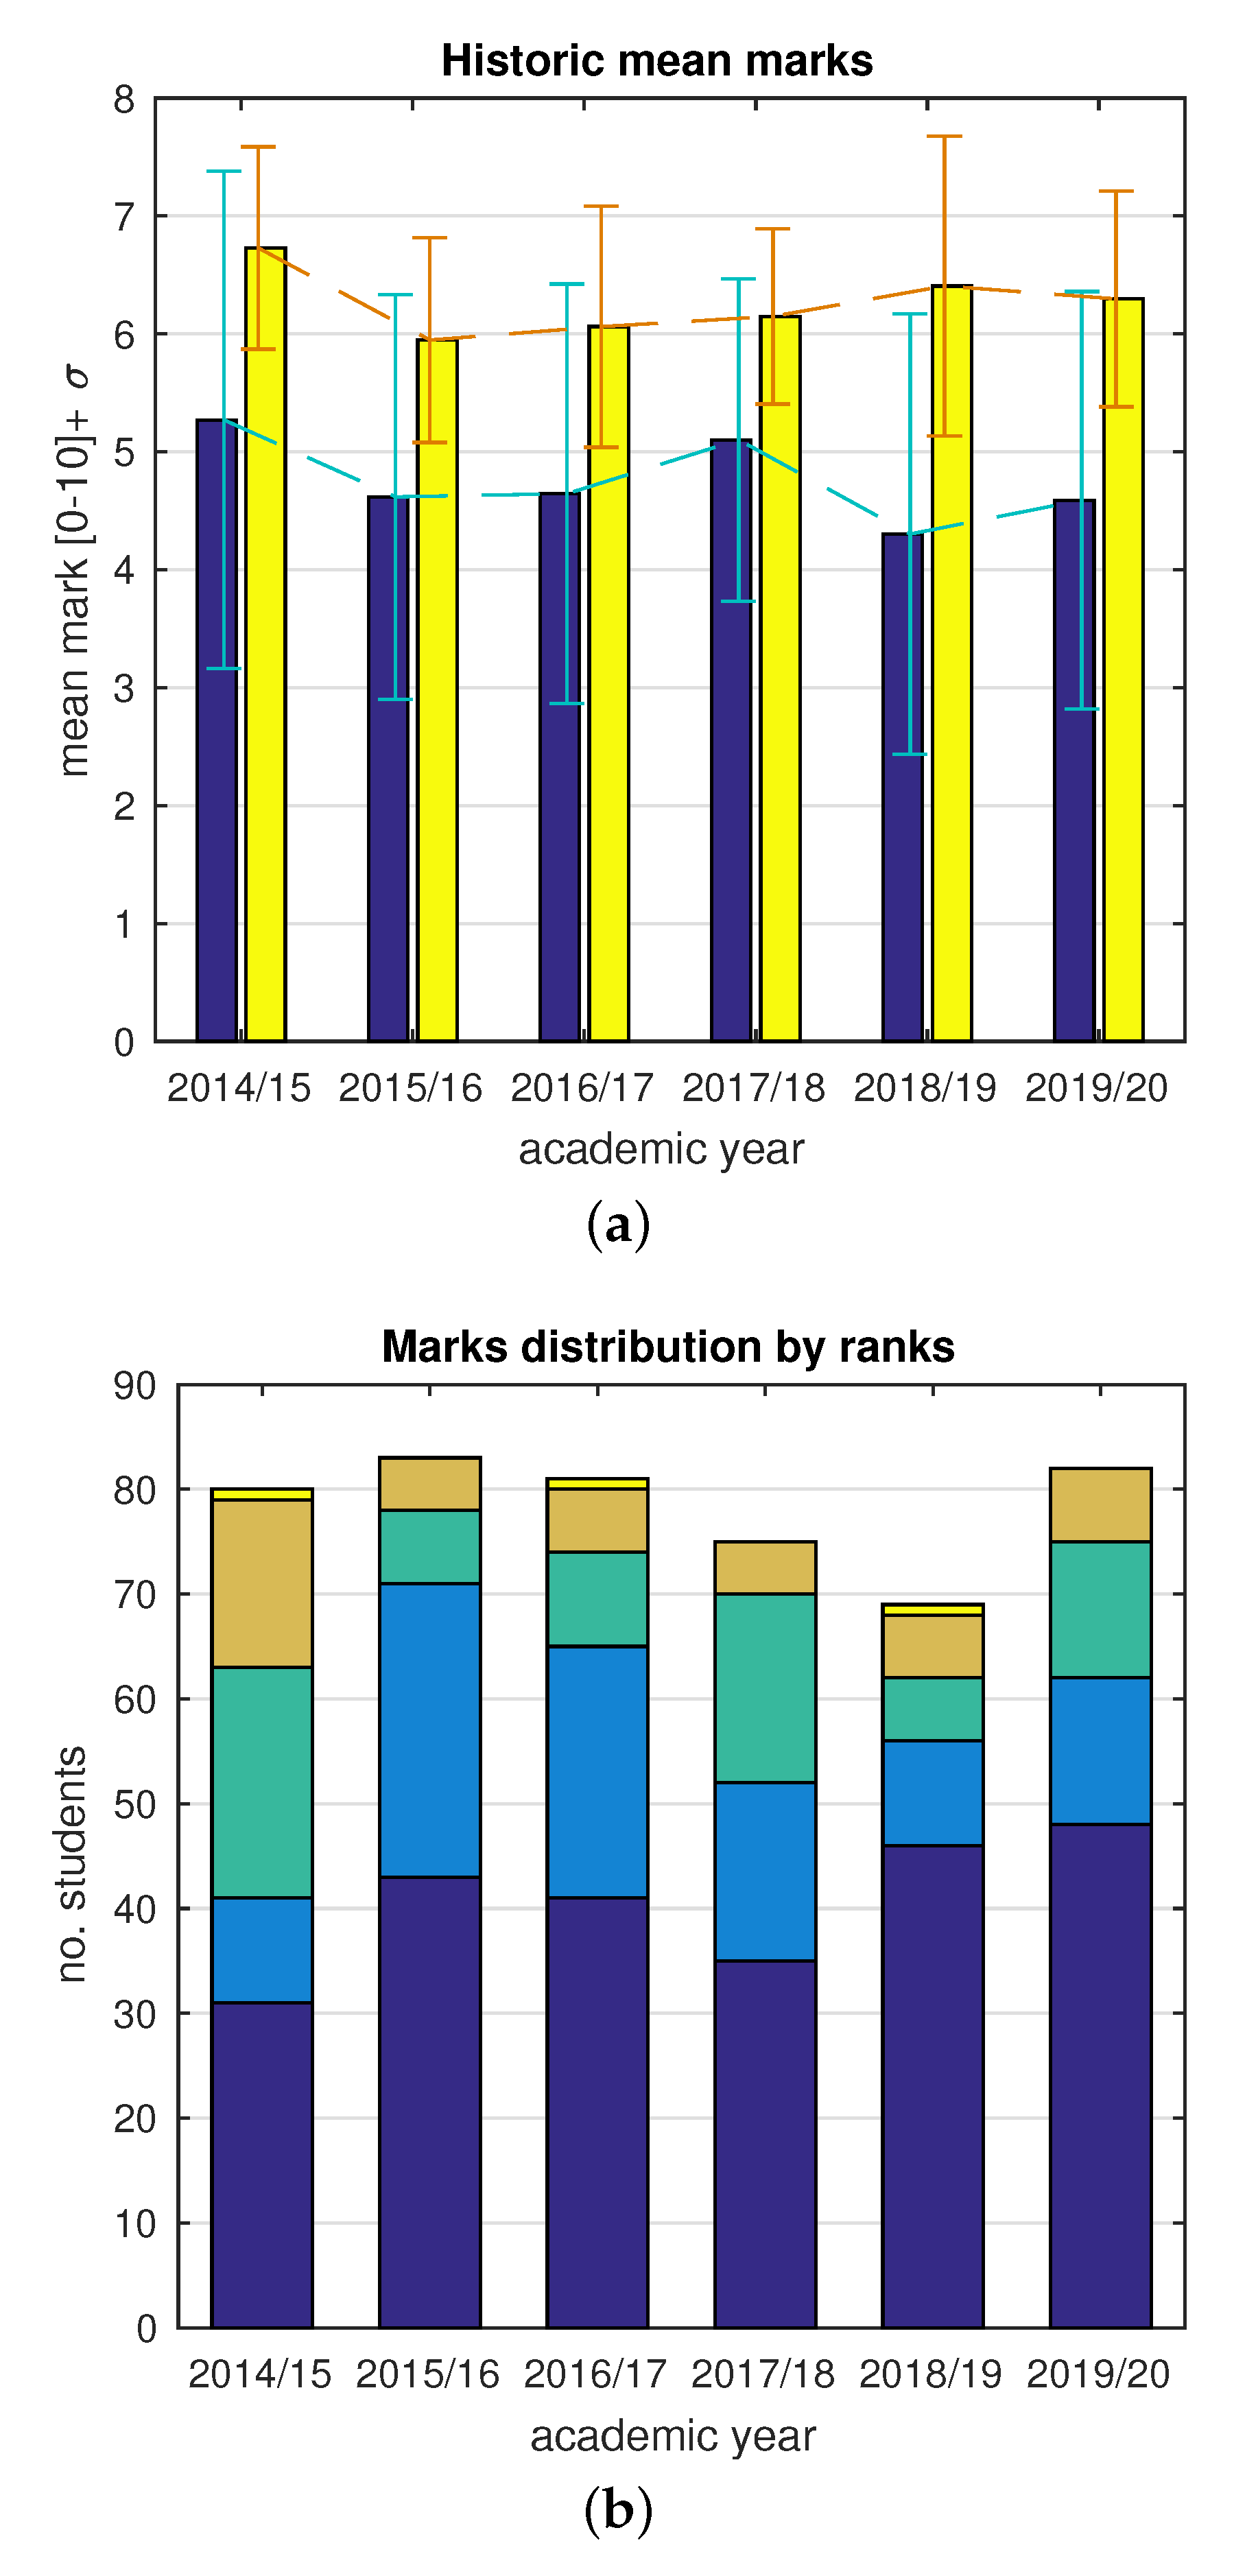
Figure 8 summarizes such comparisons. 
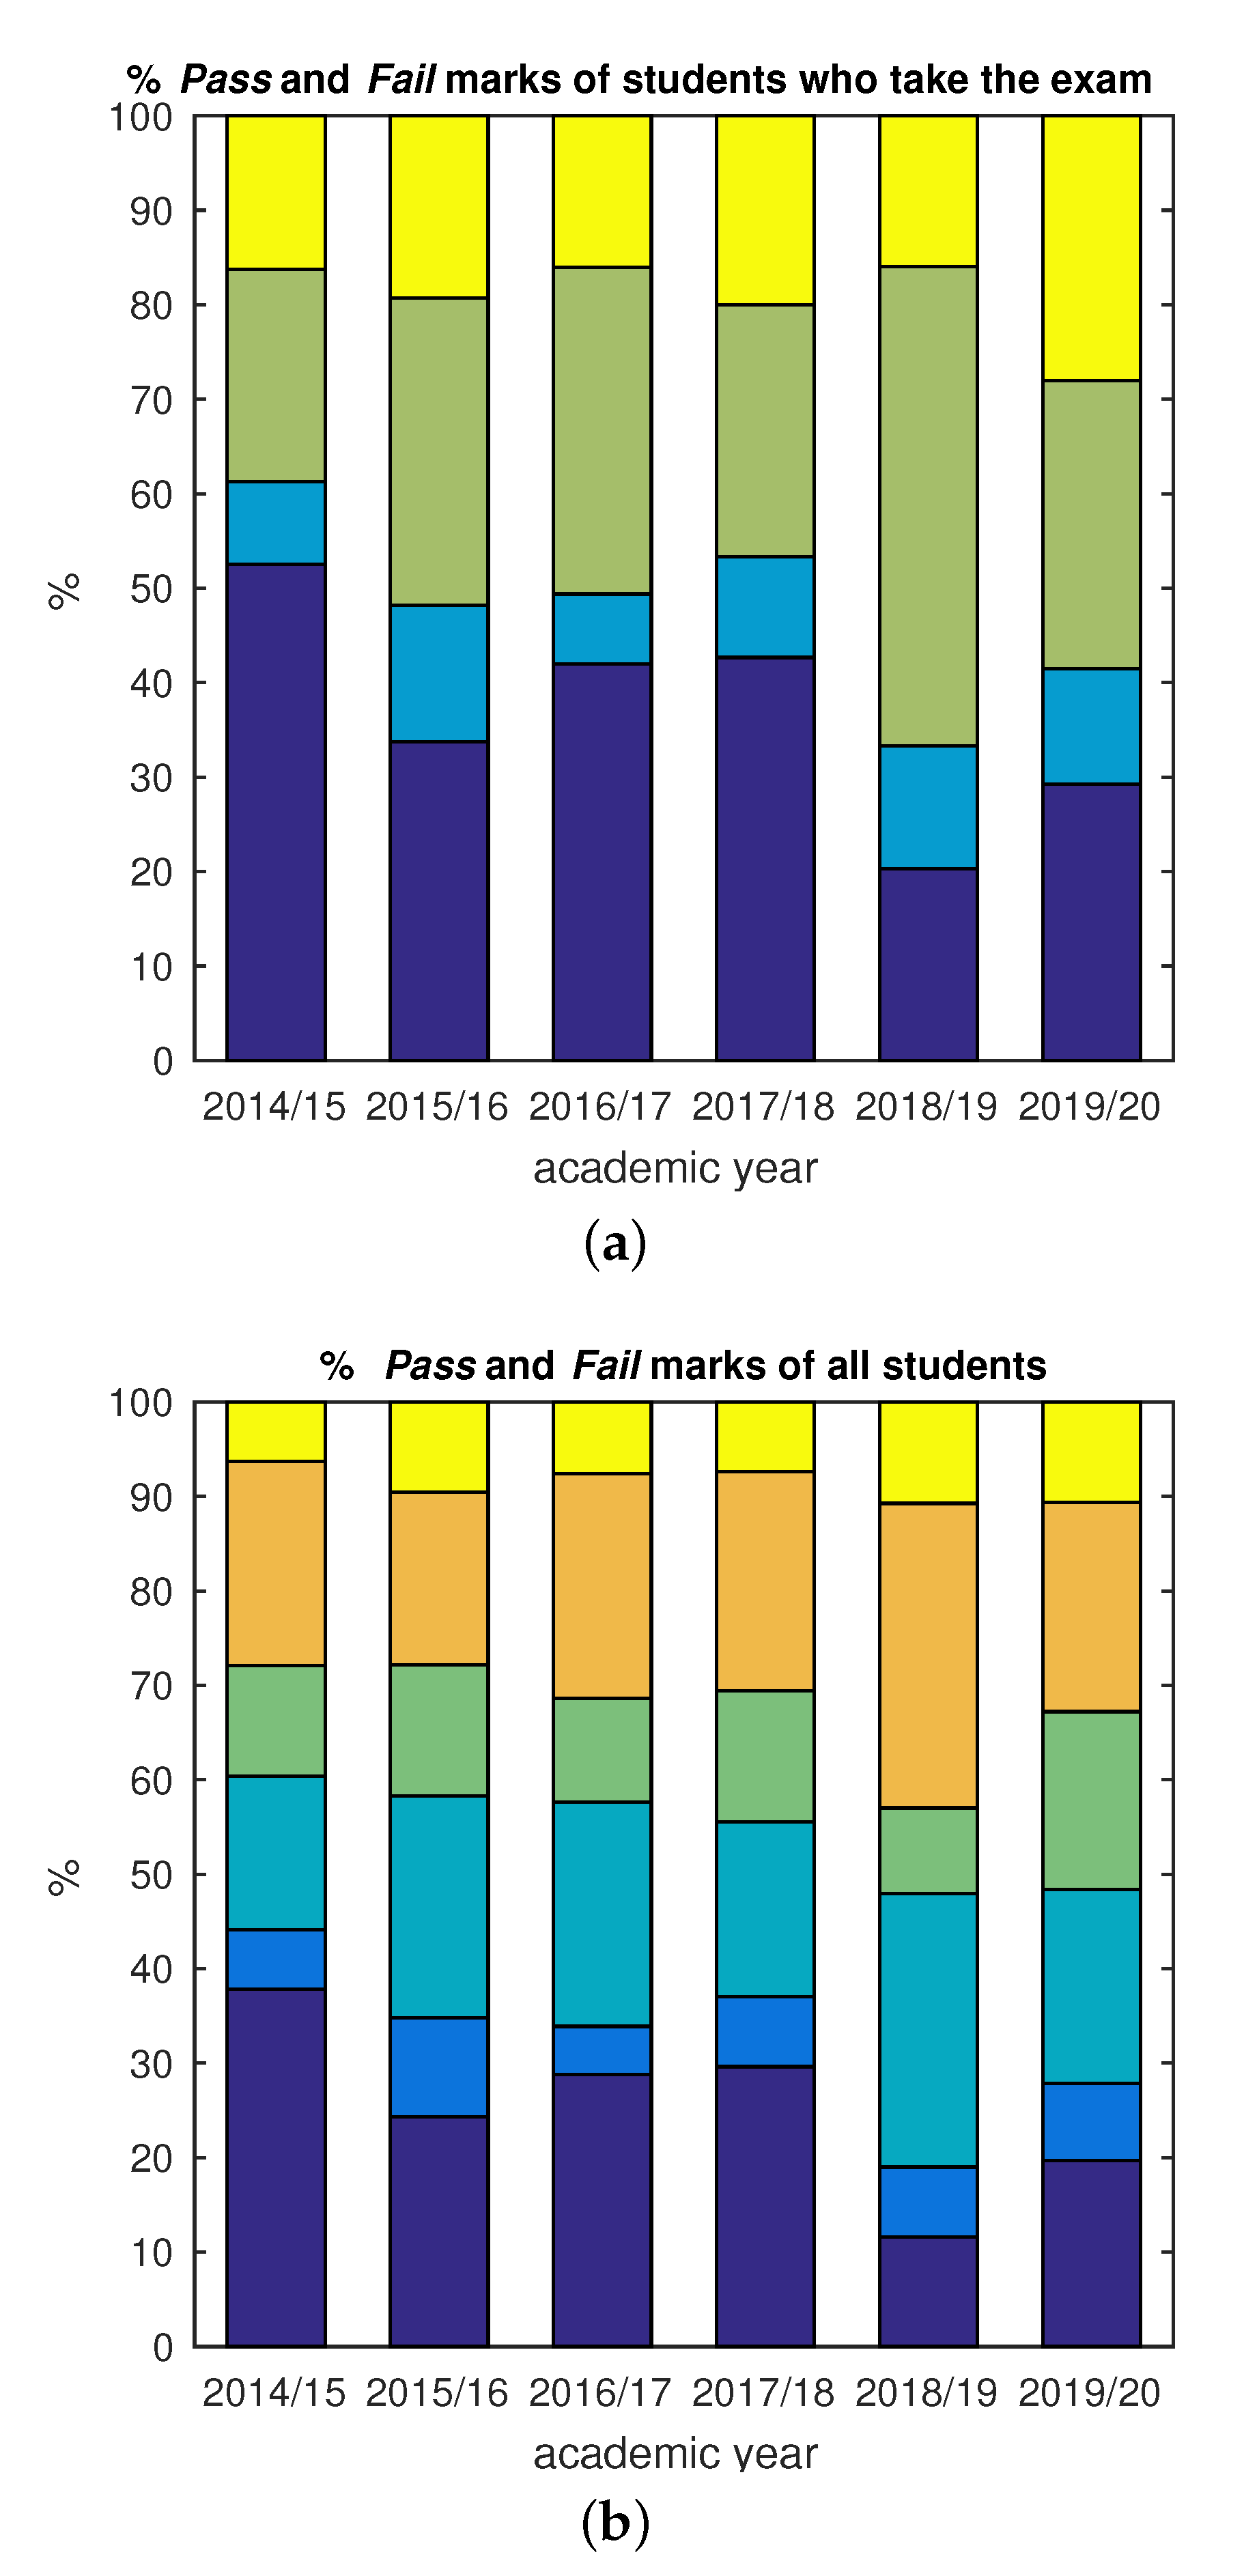
Figure 8a shows the progression of the mean marks along with the six past courses. These mean data have been obtained by considering the whole set of students who: took the final exam of the subject (blue bars), regardless they passed or failed; and exclusively the students who did pass the examen (yellow bars). It is evident that the tendency is not stable, and at first sight, not many inferences can be extracted. Apparently, in the current course 2019–2020, in which the present learning program has been implemented, there is a certain growth in both sets. However, the mean mark for the entire group is still under the level of 5 out of 10. Likewise, students who pass do not reveal any relevant difference concerning the previous years, in average terms. For these reasons, these data are complemented with a breakdown of marks in Figure 8b. Here, individual marks have been classified according to five ranks, as denoted in the legend. There is a noticeable increase in the current course, especially when compared with the two previous since the number of students who obtain pass marks is substantially higher.
Another addition to the comparison considers the success ratios and dropout ratios, respectively. It also differentiates between students who already took the examen in any of the previous courses (repeaters) and students who are enrolled in the subject for the first time (non-repeaters). Figure 9 represents such data, but processed in relative terms of percentage, as normalized by the number of students registered in the subject during each academic year. Figure 9a discerns between repeaters and non-repeaters and their mark as per pass or fail. In general, there is an evident tendency in the ratios of non-repeaters who tend to fail (green) more than repeaters (yellow). Notwithstanding, the current course presents a clear improvement concerning the previous, for both repeaters and non-repeaters. In turn, Figure 9b includes the dropout ratios. It may be observed that, though small, an almost constant ratio of repeaters dropout the subject (yellow), whereas it is confirmed that non-repeaters are more prone to dropout (brown). Again, the current implementation reveals a recovered percentage of non-repeaters who follow the subject until the final exam, concerning the previous course (the worst in the historical series). This may be possibly seen as an engagement value in this learning program.
Overall, a clear output is extracted from processing these data globally: nearly 70% of repeaters take the final exam in the next course. Only 40% of non-repeaters take the exam during the current course they are enrolled in. As per the final success, around 55% of repeaters manage to pass, in contrast to 35% of non-repeaters. This evidences that some students need to take the course at least twice. That was an insight that the lecturers perceived from their experience. Such fact also encouraged us to include improvements in this learning program during 2019–2020.
Even though these first results might not be highly insightful yet, nor widely differentiating, they permit envisaging further benefits of the implementation since it should be noted that group testing has not been evaluated, however. Hence the necessity to analyze the real outcomes of the adopted modalities of attendance during the collaborative, practical lessons of the subject. Thus, 
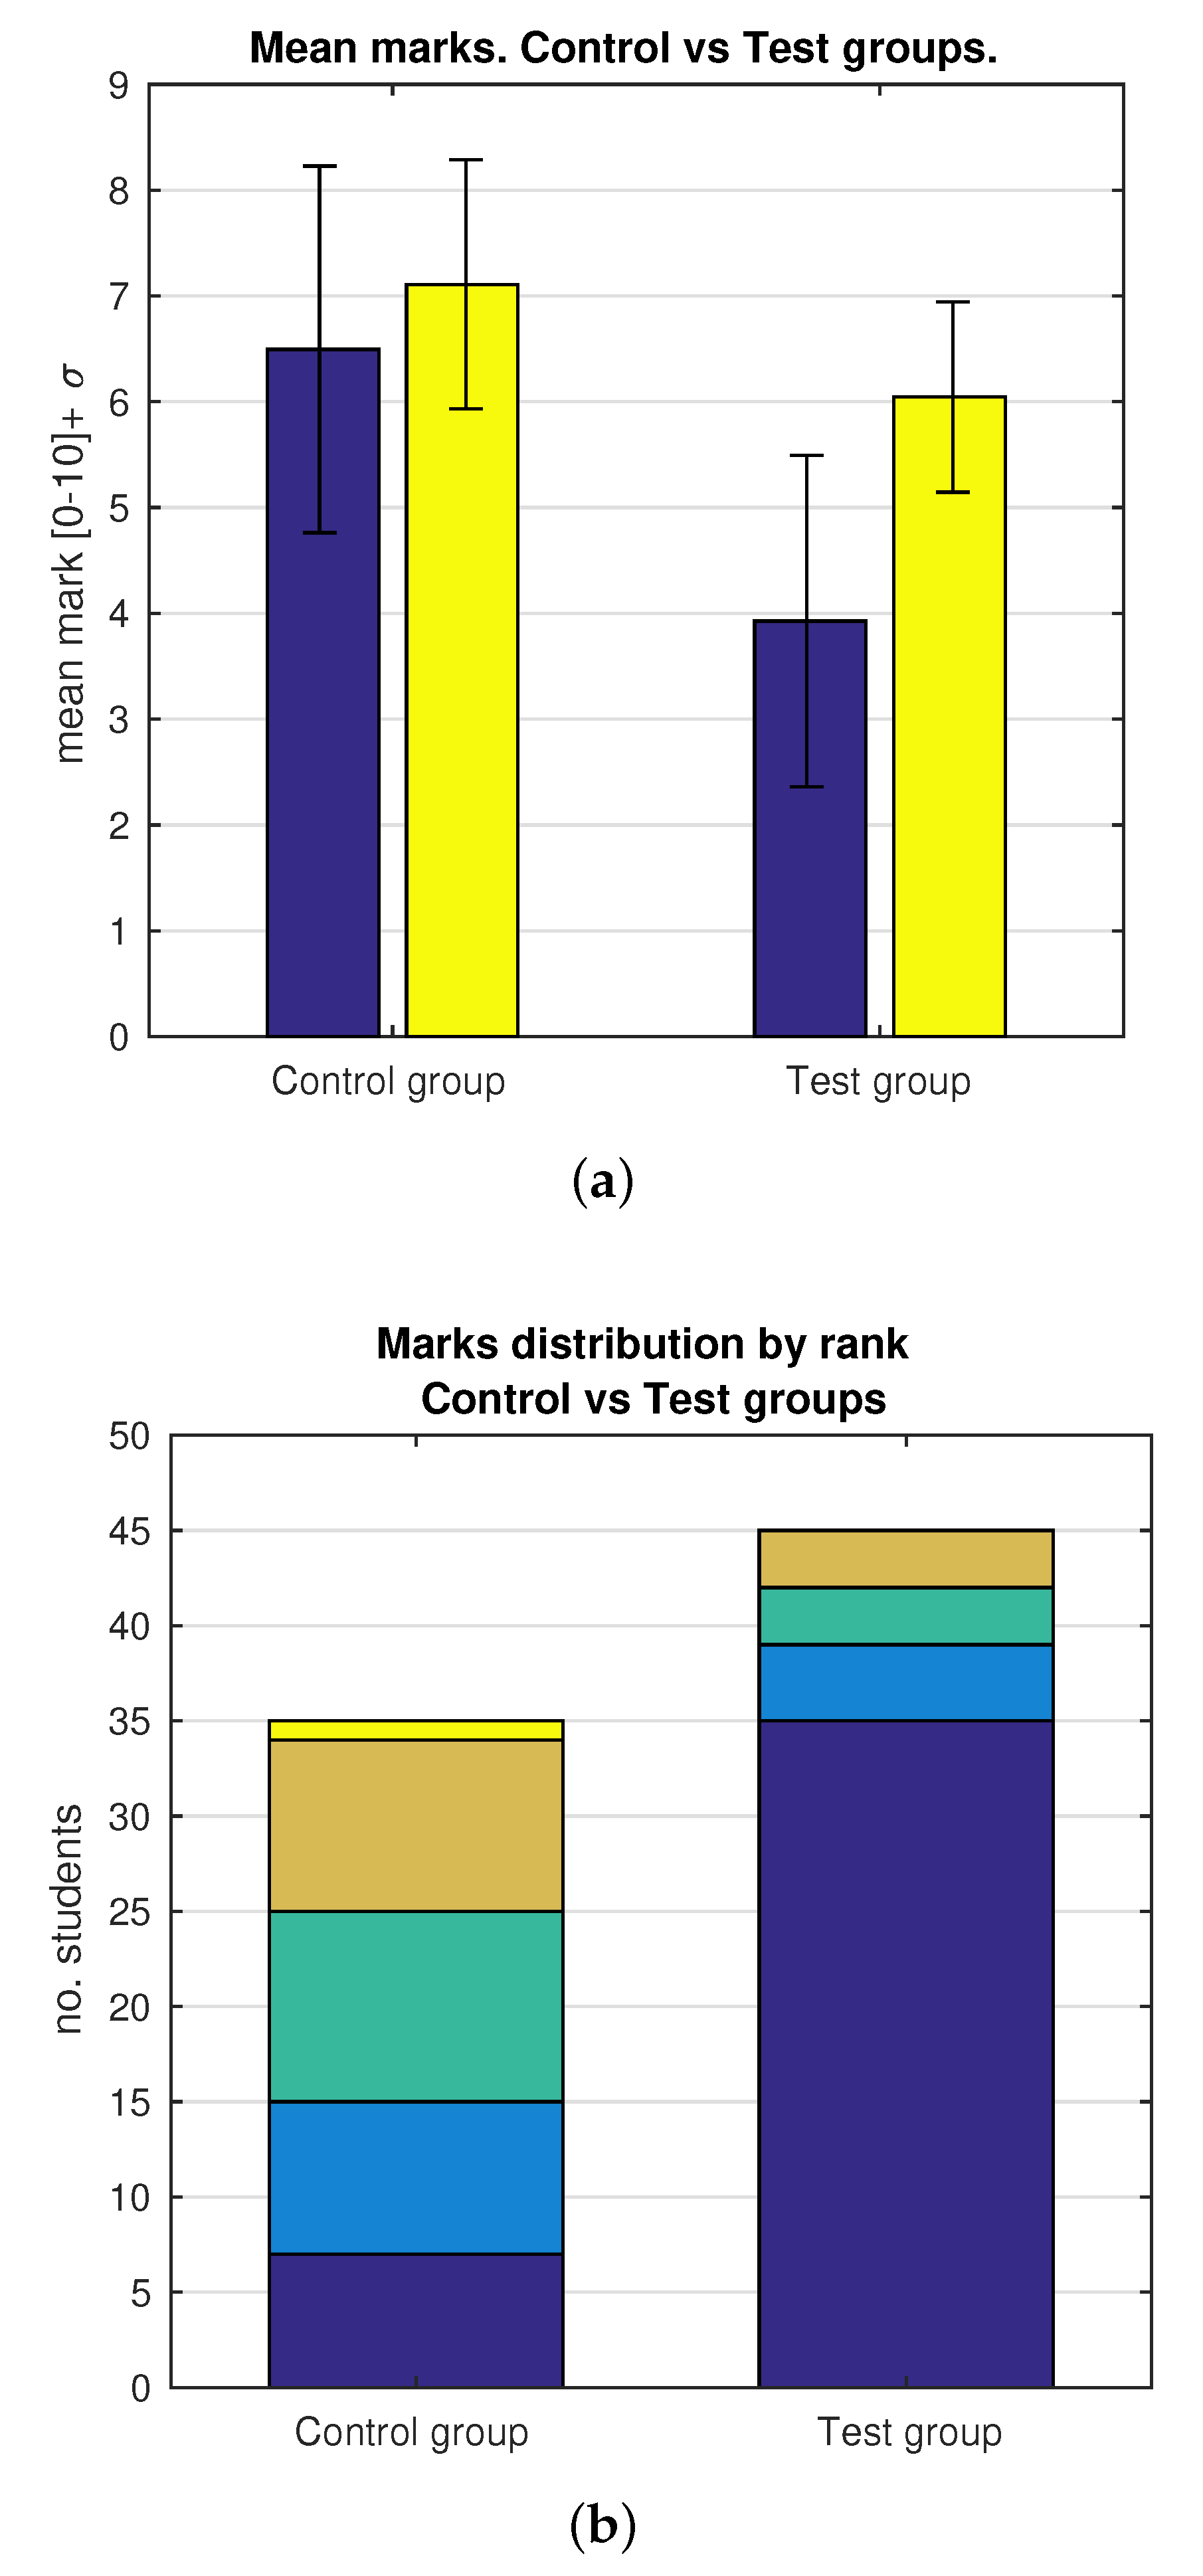
Figure 10 introduces the mark comparison between the test (online attendance) and the control group (face-to-face attendance). A relevant benefit may be noted in Figure 10a, where students in the control group demonstrate mean marks that outperform those in the test group. No matter the differentiation (mean marks computed only with students who pass, in yellow; or with the entire set of students in the group, in blue), since both mean marks in the control group are above 5 out of 10. This means that very few students attending face-to-face eventually fail. Inspecting the breakdown of qualifications in Figure 10b leads to confirm this fact. Again, it can be easily depicted that almost all participants in the control group managed to pass, most of them with high qualifications (more than 50%). Contrarily, the vast majority of students in the test group did not manage to pass (nearly 80%).
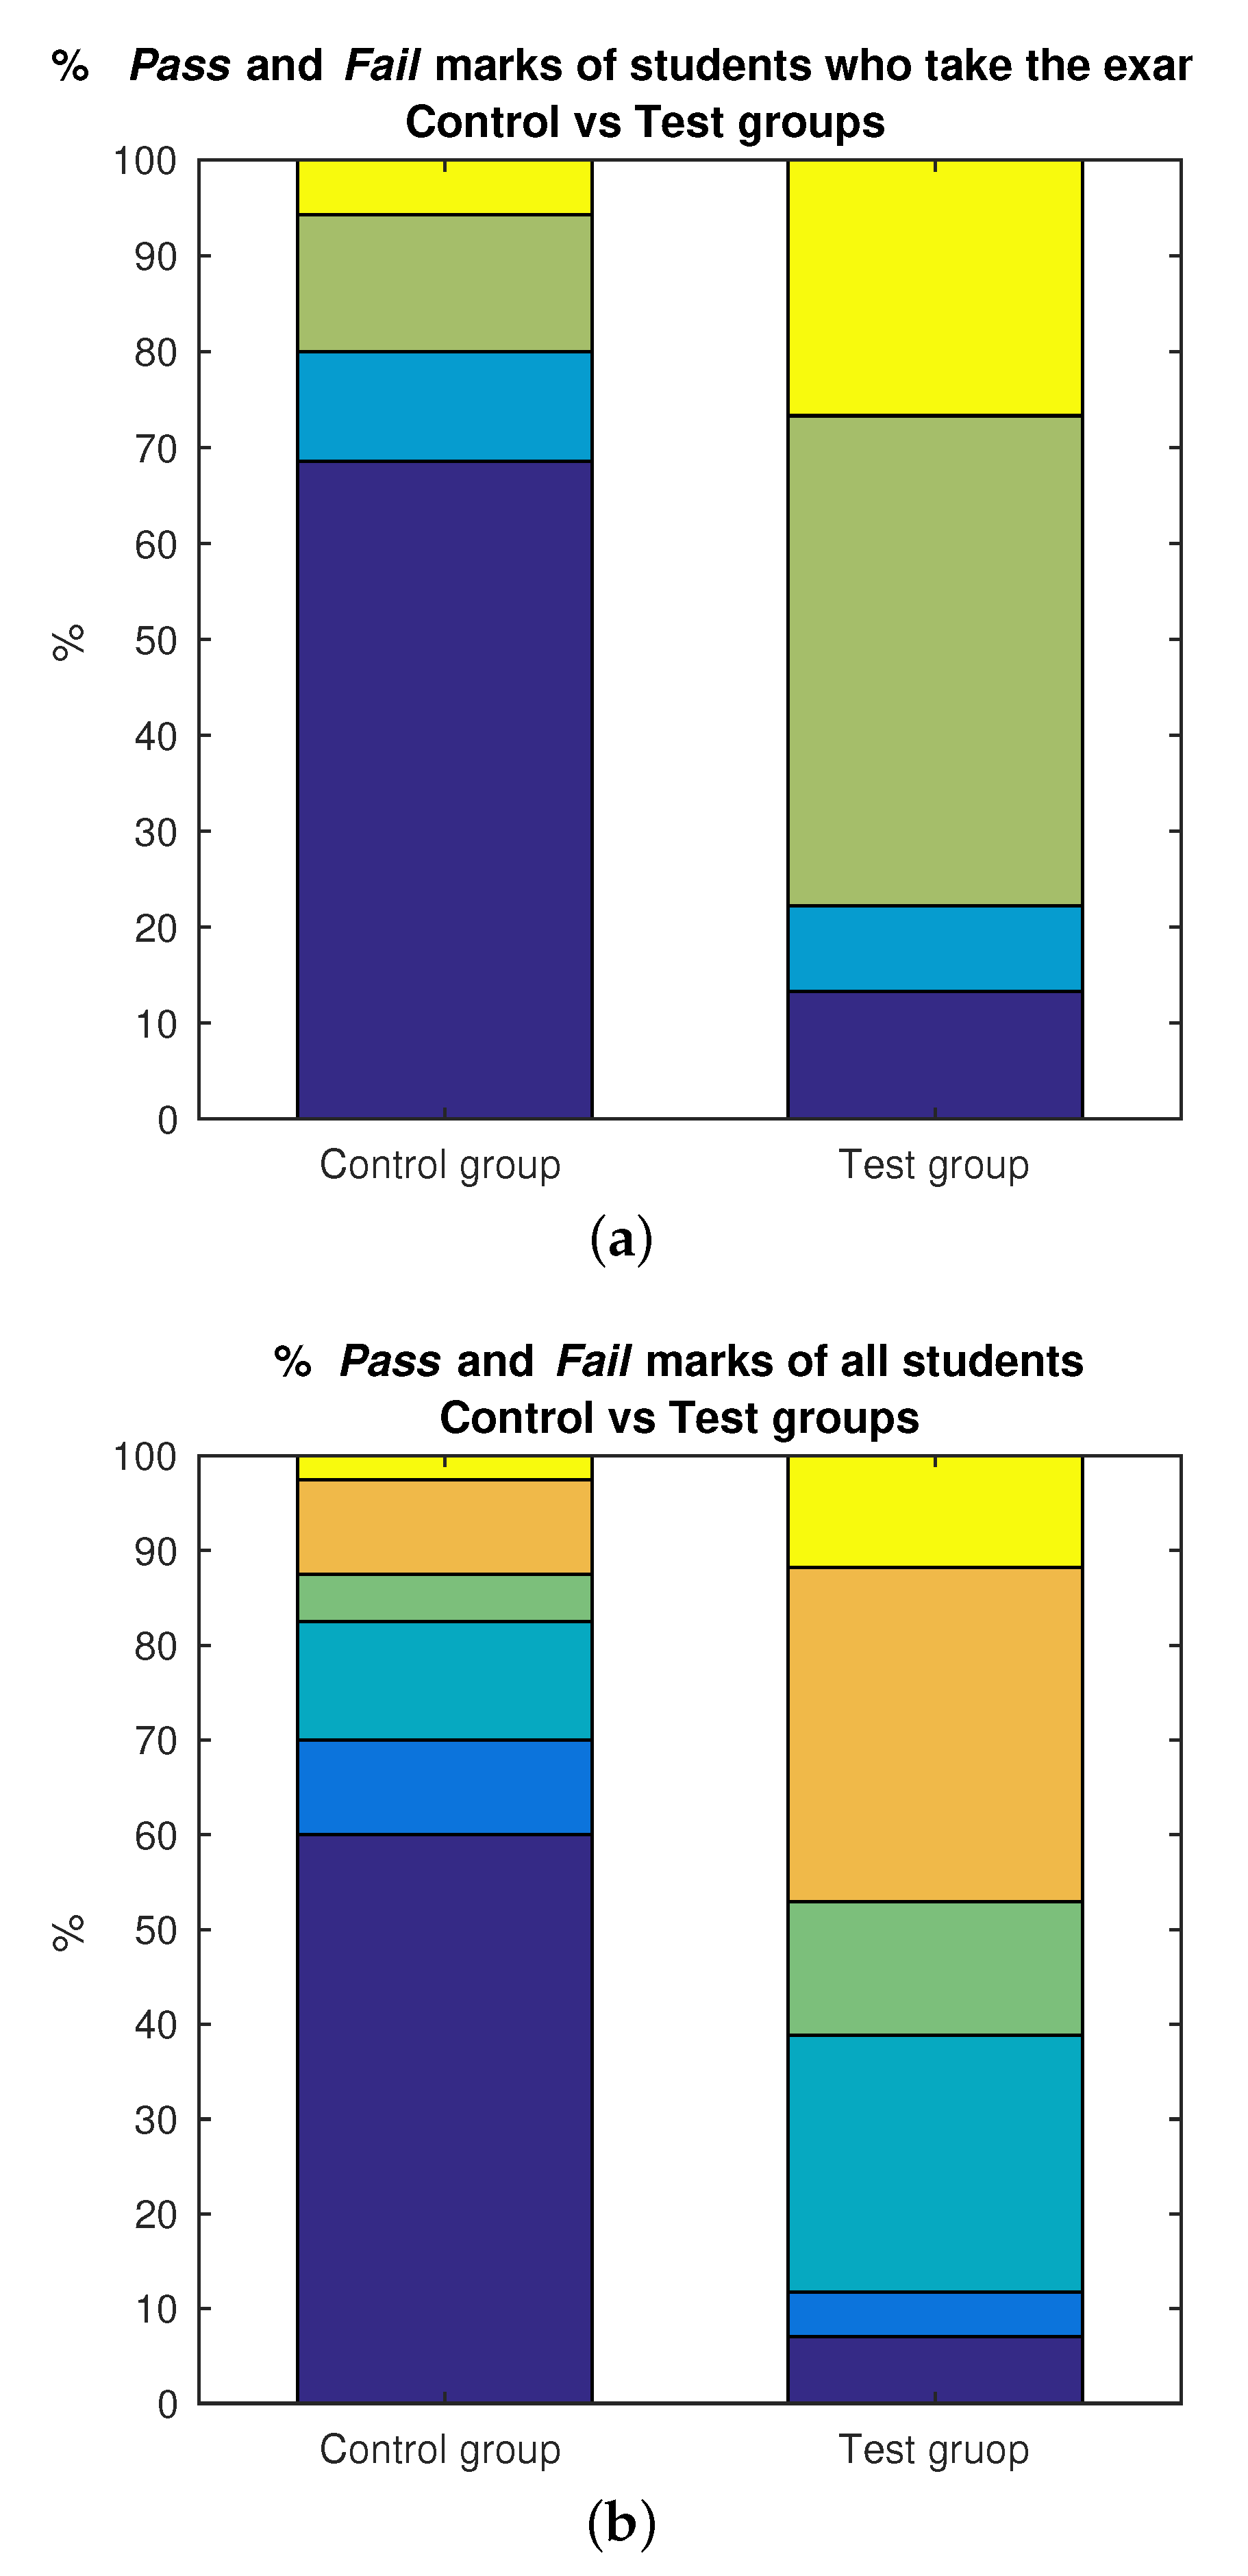
Although some relevant conclusions can already be deduced concerning the modality of attendance, the analysis still has to be completed in the same terms as in the previous results, that is to say, by including in Figure 11 the repeaters and dropout values. Consequently, Figure 11a confirms that, amongst students who take the final exam, more than 80% succeed in passing the subject, provided that they participated in the control group. In contrast, only 20% of the students in the test group achieve the same. It can be noted that fail values associated with repeaters and non-repeaters are similar to those within the general historical marks, previously presented in Figure 9. However, in this case a huge decrement in the number of fail marks is demonstrated. In the same manner, Figure 11b considers the dropout ratios. The difference between test and control groups is again clearly revealing: less than 10% of students attending face-to-face head to dropout the subject, whereas almost 50% attending virtually turn to lose the subject’s plot and finally dropout.
All in all, these results about the academic performance bring out and emphasize the significance of face-to-face attendance when collaborative work is conducted within an educational context of Mechanics, as initially hypothesized in this work. Nevertheless, further data processing has been carried out, aiming at providing reliable dependencies and hypothesis testing to produce formal and reliable comparisons and contrasts.

3.3. Global Statistical Tests

Given the previous results in terms of attitude towards this learning program but also in regards to the academic performance, and it can be anticipated the favorable comparison in favor of face-to-face attendance, to the detriment of online attendance, when considering collaborative, practical lessons. Nonetheless, statistical tests are necessary to reassert them. Furthermore, an investigation is needed to determine dependencies or inferences between variables associated with the teaching resources used in this learning proposal.
Firstly, it is worth mentioning that all the data in the historical record (available from the academic year 2014–2015 to 2018–2019) have been utilized to obtain these first contrast tests. We examine possible correlations in such a historic basis between the academic performance and the different resources used for teaching, as some of those presented in Figure 2. Specifically, we compute the Pearson ( r p e r ), Spearman ( r s p e ) and Kendall ( r k e n ) correlations [46], as observed in Table 2. Firstly, we obtain the Pearson correlation in order to determine possible linear dependence. Secondly, the Spearman correlation since it provides positive correlation whenever there exists monotony dependence (regardless such dependence may not be entirely linear). However, Spearman correlation is less sensitive than Pearson correlation to strong outliers present in the tails of a sample. And finally, we also tested Kendall correlation since it is more robust and slightly more efficient than Spearman [47].
The evaluated resources are those dependent on the students. That is to say, their performance in the individual assignments and in the practical activities handed-in after the practical lessons. As extracted from the values of these correlations, presumably, there might exist weak dependencies (r≥ 0.30) between the final mark obtained in the subject and the marks obtained in the individual and practical assignments.
To go beyond the previous correlations, a t s t u d e n t test [46] is performed, in which H 0 represents the null hypothesis that accounts for the independency between variables, at a significance level of α = 5% (95% confidence interval). The results are presented in Table 3, which reveals more explicit conclusions than the previous correlations. Here, both tests reject H 0 since t s t u d e n t > t t e s t ( α 2 ) and p-value < α . In the table, validation is indicated as H 0 = 0 and rejection as H 0 = 1. Such rejection means that independency cannot be assumed between the final marks obtained in the subject and the marks obtained in the individual assignments and in the practical activities conducted during the practical lessons. These data indicate that certain association might be present between these two teaching resources and the final academic success of the students, taking into account the historic data evaluated. Notwithstanding that, this fact could have been presumably forecasted before conducting this test, since the more work dedicated by students to assignments, the more probability of obtaining better marks.
Next, in Table 4 an Anova (Fisher) test [48] is performed to analyze the number of individual assignments that students handed-in (classified in subgroups, from zero to six assignments) and its influence on the final mark in the subject. Again, H 0 encodes the null hypothesis for independency of variables. It can be confirmed that H 0 
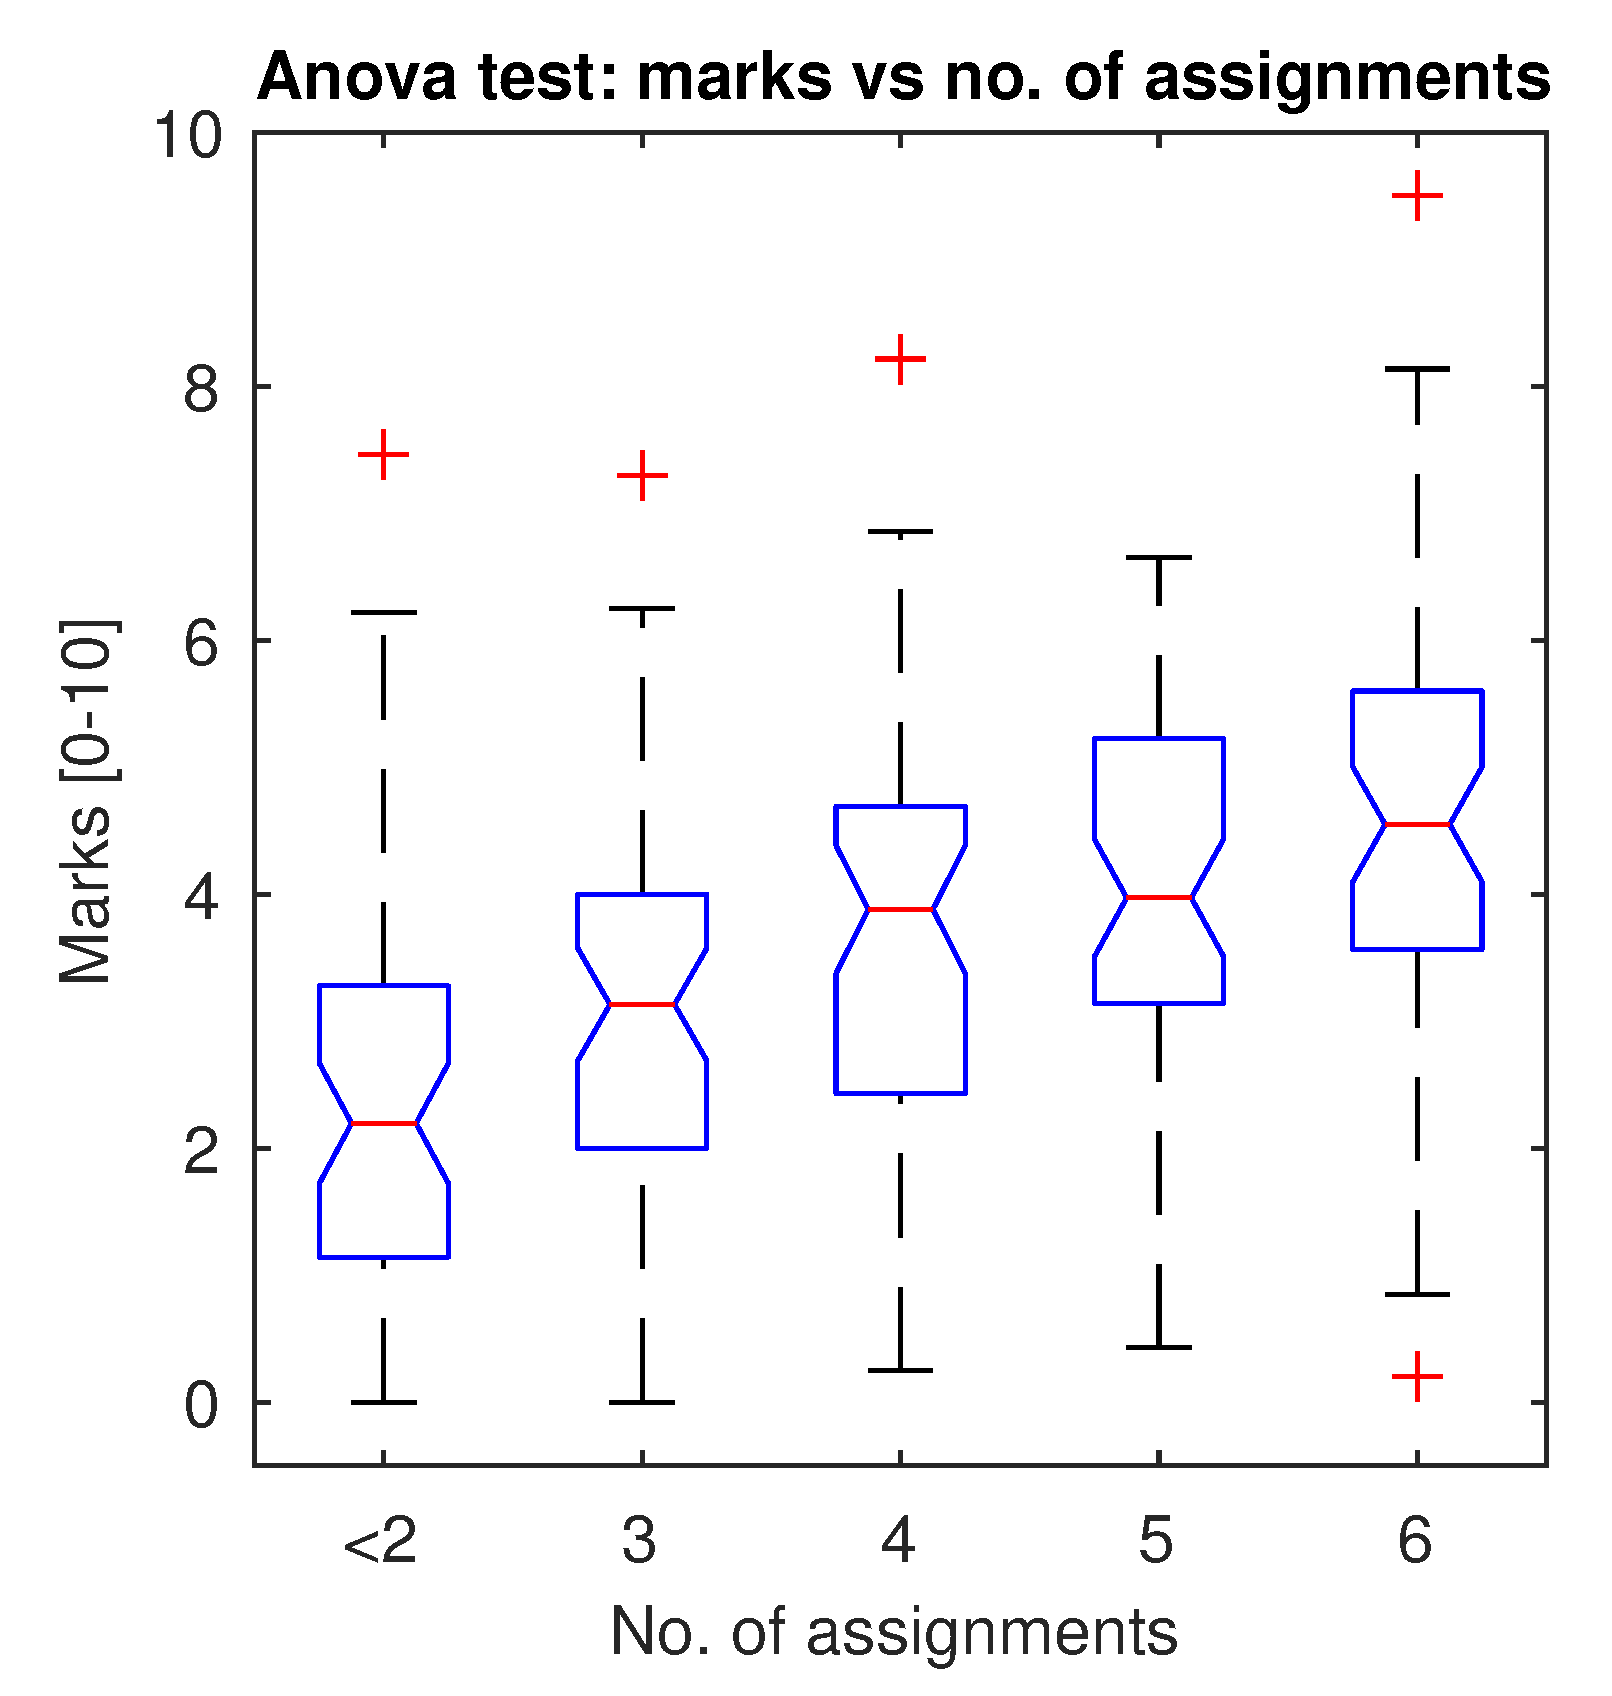
is also rejected, and therefore certain dependencies can be expected between the total number of assignments handed-in and the final mark in the subject. In this sense, Figure 12 presents the breakdown of these data, expressed in a boxplot that compares the different subgroups (blue boxplots), which include their median value (red line), standard deviation (dash-dotted line) and outliers (red crosses). Here, it can be confirmed that the more dependent subgroups are those who handed-in six assignments and less than two. Their final marks are closely constrained in this sense (more probability to obtain higher and lower marks, respectively).
Once the Anova test has been computed, and we decided to inspect these data in more detail, that is, by computing t s t u d e n t tests separately over each subgroup (from one to six assignments handed-in). Accordingly, Table 5 presents the results for such tests. As already perceived in Figure 12, a distinction can also be noticed between students who hand-in between three and five assignments since they validate H 0 . Therefore, they assert independence on the final mark. By contrast, students who hand-in less than two or the full assignments (six) cannot confirm H 0 , hence implying that there might present influence on their final marks. This can be better studied by inspecting Table 6, which comprises the probability to obtain a mark within a certain rank. We concentrate on the probability to pass the subject ( p p a s s ), as obtained in a contingency table that keeps a record of the number of assignments in categorical terms, that is to say, by classifying them again into different ranks. Here it is reasserted that success in the subject is more possible, as long as the maximum number of assignments are handed-in. However, in addition, failure is more probable when two, or less than two assignments are completed. It is also worth noting that a higher concentration of marks is ranked in the level of high qualification [7–10]. This postulates that, the maximum assignments handed-in, the higher marks obtained.
Another statistical test to infer dependencies for categorical variables is the c h i -squared test, χ 2 test [46]. In the same way as in the previous test, the data associated with marks and assignments is processed, but in this case, categorically arranged. Again, H 0 represents independence. As it may be observed in Table 7, this test validates a global independence between these variables ( χ 2 < χ t e s t ( α ) 2 and p-value > α ). Likewise, the contingency coefficient, C∈ [0–1], does not confirm significant levels of association, neither the Cramer’s coefficient V∈ [0–1]. This is the last confirmation that, in general, the number of assignments handed-in, should not influence the final mark, however, with certain exceptions as those commented above.

3.4. Group Testing Statistical Test

Once produced all the previous statistical tests for the entire set of historical data in the subject, evidence of associations and dependencies between resources and the final academic performance have responded to partially obvious forecasts. However, not many conclusive dependencies can be stated yet. So that, now we move forward to compute similar tests with the data belonging to the course in which this learning program took place. More particularly, the focus is put on the group testing that was carried out to evaluate the real efficacy of attending the collaborative practical lessons either face-to-face (control group) or virtually (test group) with tools provided by the Google Suit.
Similarly to the previous subsection, an initial correlation study is computed. Table 8 presents more substantial correlation results than those regarding the historical record, as previously presented in Table 2. Despite the fact that these correlations are still under 0.7, it can be appreciated that face-to-face (control group) presents a higher correlation with the final mark (and significantly better than those in the historical set, Table 2).
The following test complements the previous one by performing the t s t u d e n t test. Again, the aim is to assess whether there is an association between final marks and participating in the collaborative framework in one of the two modalities of attendance. Table 9 shows rejection to H 0 (independency) in both the test group and control group. As it might be expected from the correlation data, now there is more substantial evidence that taking part in the program might have associated a dependency with the final mark. However, the more relevant influence falls on the control group, with students who attended face-to-face presenting the highest t s t u d e n t value.
As per the categorical test represented by the χ 2 test, Table 10 demonstrates interesting outcomes. Here, categorical values of marks (pass or fail) have been considered. It can be confirmed that only the control group rejects the independence, whereas the two variations of the test group validate it. This fact implies that virtual attendance does not reveal significant relation with passing the subject, whereas face-to-face attendance rejects such a statement, meaning that influence on passing the subject is highly probable (please notice the high value of χ 2 ). Moreover, it is also worth mentioning that pass probability has also been computed from the contingency table. The last column of Table 10 reveals a highly satisfactory p p a s s = 0.789 amongst students who attended face-to-face, in clear detriment to students who attended virtually.
Finally, to assess other variables, such as engagement, Table 11 contains the same χ 2 test but considering the variables of participation in the control group (true) or the test group (false) and taking the final exam (that is, not dropping out). Again, H 0 is rejected, and thus dependency can be expected between attending face-to-face and taking the final exam. Particularly, during the course analyzed, 87.5% of students who participated in the control group finally took the exam, fact that enhances the proposal’s engaging value.

4. Discussion

This section aims to provide an insightful overview and summary of the main results obtained in the previous section. In addition, some insightful comments are included in terms of comparison with other research.
Initially, perception results have been gathered in Figure 6, which envisage better efficacy in the collaborative, practical lessons for the face-to-face attendance modality. Figure 7 reinforces this idea of easiness due to the lesser time dedication observed.
Secondly, the academic performance has been assessed in general terms, thanks to the subject’s historic record (Figure 8). These statistics prove that slight growth in marks appears during the course that this proposal was implemented. Similarly, Figure 9 evaluates the ratios associated with pass and fail marks, but also with dropout ratios, discerning between repeaters and non-repeaters. Notwithstanding that many students who first course the subject finally manage to pass, a considerable number of them need at least two attempts. The dropout ratio has been reduced to nearly 30% (in contrast to 40% of the previous academic year).
Thirdly, and most importantly, the same academic results have been studied during the course in which the implementation took place. Attendance modality has been analyzed thanks to the group arrangement for the practical lessons. In terms of marks, Figure 10 clearly evidences a considerable improvement for students who attend face-to-face: nearly 80% pass the subject, whereas only 20% pass the subject in the online group. Taking into account dropout ratios, Figure 11 also confirms better results for the face-to-face attendance, with only 10% of dropout, while the online attendance presents nearly 50%.
In addition to the previous results, formal statistical tests have been conducted in order to determine the interrelations and dependencies between variables. Table 2 and Table 3 state that a slight dependency on the final mark may exist with the marks obtained by students in the individual assignments and practical activities. Nonetheless, these outputs are partially expected. Similarly, Table 4 and Figure 12 delve into the previous results. In particular, they demonstrate that there is more dependence on the final mark for students who hand-in the maximum number of assignments (it means high marks) and students who hand-in 2 or less (it means low marks). Contrarily, a number of assignments between three and five refuses the previous implication since independence with the final marks is validated. Table 5 reasserts these outcomes by means of a more specific hypothesis test. One step forward in this matter leads us to present a breakdown of marks versus the number of assignments, expressed in probability terms (Table 6). Here, that fact is endorsed. Higher marks and pass probability are tied to the maximum number of assignments. Contrarily, a lower number of assignments behave otherwise to this inference. Therefore, the relation between assignments and the final mark is evident, however, it can be confirmed that it is only statistically confirmed for particular groups (in the extremes of the range). Finally, Table 7 analyses the marks by ranks, categorically sorted, in order to validate that the commented dependencies are not present as a whole set.
Ultimately, the same statistical tests have been computed over the data associated with the present course, in which group testing for the attendance modality has been established. Similarly, Table 8 and Table 9 show higher dependencies on the final mark and the students’ belonging to one of the groups. However, the most evident and significant values are unequivocally highlighting that face-to-face attendance reveals higher dependency on the final mark of the students. Again, the categorical test that analyzes the dependence on the bimodal mark, as pass or fail, disambiguates the previous support results (Table 10). Notably, it is demonstrated that the only group that rejects the null hypothesis for independence is the control group. This result evidences the real significance of face-to-face attendance for the final success in the subject, in detriment to online attendance. Besides this, another confirmation is noticed in the passing probability, which nearly reaches 80%. Finally, the same test appraises the relation between taking the final exam (dropout) and the attendance modality (Table 11). Again, face-to-face attendance demonstrates high dependency on taking the exam (not dropping out) with a probability 87.5%, in detriment to nearly 50% amongst online groups. This confirms the bright side of this proposal.
As a comparative reflection on other state-of-the art research, our results do not interfere with others that confirm the goodness of using ICT resources in engineering [2] or methodologies sustained by collaborative frameworks [17,18,19]. Indeed, this program relies on simulation tools for the practical lessons, which have also demonstrated positive outcomes as ICT support, together with collaborative work, as other studies enhanced [20]. Nonetheless, we have not concentrated on those secondary facts. The main focus for comparison falls on the answer to our research question, which confirms that face-to-face attendance provides more benefits to students than online attendance. In this sense, similar results have been presented in [3,21]. By contrast, the first one differs from our satisfaction results in terms of perception, since they do not reveal significant differences between modality, as all are positively perceived. In our study it can be deduced that the perception of online modality was not positive enough from the preliminary results. Besides, authors turn to confirm that communication between student and lecturers, and also between students, is better in the face-to-face modality [3,22], fact that coincides with our results. Similarly, a large study in [21] supports the same hypothesis that face-to-face modality produces better outcomes for the students. It is worth noticing that these comparisons confirm a general trend within this STEM context, particularized on the engineering field.

5. Conclusions

This work has studied the influence of the attendance modality in a STEM-related course on “Machines and Mechanisms Theory”, taught in the second year of two Bachelor’s degrees in engineering, under the academic plans of the Miguel Hernandez University.
The main goal was to evaluate the efficacy of each sort of attendance, either face-to-face or online, to the practical lessons of the subject, which in turn, were reformulated with respect to the previous courses. In particular, the renewal concentrated on a useful collaborative framework sustained by problem-based and project-based outlooks.
Despite the fact that ICT resources and new methodologies emerge as the future for the new decade of higher education, this work postulates that the join of traditional face-to-face attendance with a thoughtful design of practical activities is the key aspect to succeed in providing students with active learning. To validate this idea, several indicators have been analyzed and different strategies used for comparison. The main one has utilized group testing in the arrangement of students for the attendance modality. The entire set of students registered in the course has been divided into a control group for face-to-face attendance and a test group for online attendance (supported by the Google Suit).
A diverse list of results has been computed. First of all, the student’s satisfaction, besides their perceptions of efficacy of both attendance modalities, have been assessed by a custom questionnaire. This first output has evidenced positive attitude, perception, and satisfaction with the traditional face-to-face attendance. Moreover, and secondly, each group’s academic performance, denoted as well as success in terms of marks, has been assessed. The historical data has also been included for the comparison. Inspecting generally the landmark study, there is not any critical fact to highlight when comparing the academic year in which this program has been implemented, concerning the previous academic years. However, more relevant insights are depicted from the breakdown of marks, when the same comparison is focused on the sort of attendance and remarkably evaluated during the present proposal. Marks demonstrate better performance of face-to-face attendance at every studied aspect: mean marks, pass marks, higher mark ranks and dropout. It is worth highlighting the satisfactory ratios of students who pass within the face-to-face group (nearly 80% in contrast to 20%) and the reduction in the dropout ratio (almost 10% compared to almost 50%). This last aspect reasserts the positive engagement elicited amongst students.
Finally, this work also validates the previous results and its contribution to the practical learning of a Mechanics-related subject, with a detailed statistical analysis that comprises reliable hypothesis tests. In this way, several dependencies and inferences between variables associated with the teaching activity, and the final success in terms of marks, have been determined. Apart from partially predictable dependencies (e.g., with the number of assignments), these statistical contrasts have corroborated that the traditional face-to-face attendance represents the more influential and significant aspect for students to succeed in the active learning and satisfactory performance of marks. Other slight dependences on the final mark have been studied (such as teaching resources). However, they have been finally disambiguated in favor of the face-to-face modality. The statistical tests have also demonstrated that face-to-face attendance is a more influential approach than online attendance. Overall, the most relevant conclusion of such dependency is represented by the high probability of passing the subject when attending face-to-face (nearly 80%) on the valuable engagement and motivation to follow the thread of the course, with 87.5% of face-to-face attendees taking the final exam.
In summary, this work has demonstrated the validity of the contribution to the practical learning of Mechanics in a context of engineering education and validated the better efficacy of face-to-face attendance when team work activities are considered. The last consideration has to do with limitations of this study which will be tackled as future work in the following academic years. It has to be noted that certain considerations about population diversity might have been acquired by addressing specific questions that permit characterizing participants with more detail. This would lead to finding more outcomes and possible dependencies, in particular those that might imply certain bias. Moreover, the size of the sample will be increased in the following academic years through the extension of the program to other degrees in engineering within our technical school in the Miguel Hernandez University. Integrating this program as a standard learning model, without any group testing, would help to avoid possible bias associated with the participation in one group of another.

Author Contributions

Conceptualization, H.C.-V., E.V.-S. and D.V.; methodology, H.C.-V. and E.V.-S.; software, D.V.; validation, D.V. and F.R.-M.; formal analysis, D.V. and F.R.-M.; investigation, H.C.-V. and D.V.; resources, H.C.-V., E.V.-S. and N.C.-D.; data curation, D.V., H.C.-V. and F.R.-M.; writing, D.V.; supervision, N.C.-D. and E.V.-S.; funding acquisition, H.C.-V. and E.V.-S. All authors have read and agreed to the published version of the manuscript.

Funding

This research was partially funded by the Miguel Hernandez University through: the project PIEU2018/05 and the Mechanics and Energy Dept.

Informed Consent Statement

Informed consent was obtained from all subjects involved in the study.

Conflicts of Interest

The authors declare no conflict of interest. The funders had no role in the design of the study; in the collection, analyses, or interpretation of data; in the writing of the manuscript, or in the decision to publish the results.

Abbreviations

The following abbreviations are used in this manuscript:
ELIEducase Learning Initiative
ICTInformation Communication and Technology
NMCNew Media Consortium

References

  1. Zylka, J.; Christoph, G.; Kroehne, U.; Hartig, J.; Goldhammer, F. Moving beyond cognitive elements of ICT literacy: First evidence on the structure of ICT engagement. Comput. Hum. Behav. 2015, 53, 149–160. [Google Scholar] [CrossRef] [Green Version]
  2. Olmedo-Torre, N.; Vidal, O.F.; Castillo, J.L.; RodrIguez, F.B. The Influence of ICT on Learning in Graphic Engineering. Procedia Soc. Behav. Sci. 2017, 237, 737–744. [Google Scholar] [CrossRef] [Green Version]
  3. Arrosagaray, M.; Gonzalez-Peiteado, M.; Pino-Juste, M.; Rodriguez-Lopez, B. A comparative study of Spanish adult students attitudes to ICT in classroom, blended and distance language learning modes. Comput. Educ. 2019, 134, 31–40. [Google Scholar] [CrossRef]
  4. Nikolic, V.; Petkovic, D.; Denic, N.; Milovancevic, M.; Gavrilovic, S. Appraisal and review of e-learning and ICT systems in teaching process. Telemat. Inform. 2019, 513, 456–464. [Google Scholar] [CrossRef]
  5. Ramirez, G.M.; Collazos, C.A.; Moreira, F. All-Learning: The state of the art of the models and the methodologies educational with ICT. Telemat. Inform. 2018, 35, 944–953. [Google Scholar] [CrossRef] [Green Version]
  6. Ahmadi, S.; Keshavarzi, A.; Foroutan, M. The Application of Information and Communication Technologies (ICT) and its Relationship with Improvement in Teaching and Learning. Procedia Soc. Behav. Sci. 2011, 28, 475–480. [Google Scholar] [CrossRef] [Green Version]
  7. Kubricht, J.R.; Holyoak, K.J.; Lu, H. Intuitive Physics: Current Research and Controversies. Trends Cogn. Sci. 2017, 21, 749–759. [Google Scholar] [CrossRef]
  8. Vigotsky, A.D.; Zelik, K.E.; Lake, J.; Hinrichs, R.N. Mechanical misconceptions: Have we lost the mechanics in sports biomechanics? J. Biomech. 2019, 93, 1–5. [Google Scholar] [CrossRef] [PubMed] [Green Version]
  9. Anaya, M.; Cavallaro, M.I.; Dominguez, M.C. 7.3-Modelling: Difficulties for Novice Engineering Students. In Mathematical Modelling; Haines, C., Galbraith, P., Blum, W., Khan, S., Eds.; Woodhead Publishing: Cambridge, UK, 2007; pp. 424–432. [Google Scholar]
  10. Fernandez Gutierrez, M.J.; Sanchez Lasheras, F.; Trevejo Alonso, J.A. An Intervention Based on Identifying Topics That Students Have Difficulties with. Mathematics 2020, 8, 2220. [Google Scholar] [CrossRef]
  11. Kekana, M.; Gaigher, E. Understanding Science Teachers. Classroom Practice after Completing a Professional-development Programme: A Case Study. Eurasia J. Math. Sci. Technol. Educ. 2018, 14, em1561. [Google Scholar]
  12. Derboven, J.; Geerts, D.; Grooff, D.D. Appropriating virtual learning environments: A study of teacher tactics. J. Vis. Lang. Comput. 2017, 40, 20–35. [Google Scholar] [CrossRef] [Green Version]
  13. Rodriguez, M.; Diaz, I.; Gonzalez, E.J.; Gonzalez-Miquel, M. Reprint of: Motivational active learning: An integrated approach to teaching and learning process control. Educ. Chem. Eng. 2019, 26, 8–13. [Google Scholar] [CrossRef]
  14. Olivares, D.; Lupiaez, J.L.; Segovia, I. Roles and characteristics of problem solving in the mathematics curriculum: A review. Int. J. Math. Educ. Sci. Technol. 2020, 1–18. [Google Scholar] [CrossRef]
  15. Marce-Nogue, J.; Salan, N.; Aragoneses, A.; Bernat, E.; Escrig, C.; Otero, B.; Ruperez, E.; Illescas, S. Teaching Engineering with Autonomous Learning Tools: Good Practices in GRAPAU-RIMA. Procedia Soc. Behav. Sci. 2012, 46, 629–634. [Google Scholar] [CrossRef]
  16. Hong, W. Development and Implementation of Engineering Materials and Thermal Processing Network Course Based on Autonomous learning. Procedia Eng. 2011, 15, 127–131. [Google Scholar] [CrossRef] [Green Version]
  17. Mora, H.; Signes-Pont, M.T.; Fuster-Guillo, A.; Pertegal-Felices, M.L. A collaborative working model for enhancing the learning process of science and engineering students. Comput. Hum. Behav. 2020, 103, 140–150. [Google Scholar] [CrossRef]
  18. Schaf, F.; Muller, D.; Bruns, F.; Pereira, C.; Erbe, H.H. Collaborative learning and engineering workspaces. Annu. Rev. Control 2009, 33, 246–252. [Google Scholar] [CrossRef]
  19. Brahimi, N.; Dweiri, F.; Al-Syouf, I.; Khan, S.A. Cooperative Education in an Industrial Engineering Program. Procedia Soc. Behav. Sci. 2013, 102, 446–453. [Google Scholar] [CrossRef] [Green Version]
  20. Chandu, R.S.; Chandu, S.G.S. Understanding And Extrapolation Of Disruption For Engineering Education-Principles and Problems. Procedia Comput. Sci. 2020, 172, 1066–1076. [Google Scholar] [CrossRef]
  21. Fischer, C.; Xu, D.; Rodriguez, F.; Denaro, K.; Warschauer, M. Effects of course modality in summer session: Enrollment patterns and student performance in face-to-face and online classes. Internet High. Educ. 2020, 45, 100710. [Google Scholar] [CrossRef]
  22. Shu, H.; Gu, X. Determining the differences between online and face-to-face student group interactions in a blended learning course. Internet High. Educ. 2018, 39, 13–21. [Google Scholar] [CrossRef]
  23. Usher, M.; Barak, M. Team diversity as a predictor of innovation in team projects of face-to-face and online learners. Comput. Educ. 2020, 144, 103702. [Google Scholar] [CrossRef]
  24. Sangrar, R.; Docherty-Skippen, S.M.; Beattie, K. Blended face-to-face and online/computer-based education approaches in chronic disease self-management: A critical interpretive synthesis. Patient Educ. Couns. 2019, 102, 1822–1832. [Google Scholar] [CrossRef] [PubMed]
  25. Fang, N. Using Computer Simulation and Animation to Improve Student Learning of Engineering Dynamics. Procedia Soc. Behav. Sci. 2012, 56, 504–512. [Google Scholar] [CrossRef] [Green Version]
  26. Flores, M.; Payá, L.; Valiente, D.; Gallego, J.; Reinoso, O. Deployment of a Software to Simulate Control Systems in the State-Space. Electronics 2019, 8, 1205. [Google Scholar] [CrossRef] [Green Version]
  27. Valiente, D.; Payá, L.; de Ávila, S.F.; Ferrer, J.; Cebollada, S.; Reinoso, O. Active learning program supported by online simulation applet in engineering education. In Proceedings of the 9th International Conference on Simulation and Modeling Methodologies, Technologies and Applications, Prague, Czech Republic, 29–31 July 2019; Volume 1, pp. 121–128. [Google Scholar]
  28. Diwakar, A.; Poojary, S.; Noronha, S.B. Virtual labs in engineering education: Implementation using free and open source resources. In Proceedings of the 2012 IEEE International Conference on Technology Enhanced Education (ICTEE), Amritapuri, India, 3–5 January 2012; pp. 1–4. [Google Scholar]
  29. Gamez-Garcia, M.; Hossein-Mohand, H.; Trujillo-Torres, J.M.; Hossein-Mohand, H.; Aznar-Diaz, I. Technological Factors That Influence the Mathematics Performance of Secondary School Students. Mathematics 2020, 8, 1935. [Google Scholar] [CrossRef]
  30. Cifrian, E.; Andrés, A.; Galan, B.; Viguri, J.R. Integration of different assessment approaches: Application to a project-based learning engineering course. Educ. Chem. Eng. 2020, 31, 62–75. [Google Scholar] [CrossRef]
  31. García, C. Project-based Learning in Virtual Groups—Collaboration and Learning Outcomes in a Virtual Training Course for Teachers. Procedia Soc. Behav. Sci. 2016, 228, 100–105. [Google Scholar] [CrossRef] [Green Version]
  32. Andersen, A.L.; Brunoe, T.D.; Nielsen, K. Engineering Education in Changeable and Reconfigurable Manufacturing: Using Problem-Based Learning in a Learning Factory Environment. Procedia CIRP 2019, 81, 7–12. [Google Scholar] [CrossRef]
  33. Hsieh, C.; Knight, L. Problem-Based Learning for Engineering Students: An Evidence-Based Comparative Study. J. Acad. Librariansh. 2008, 34, 25–30. [Google Scholar] [CrossRef]
  34. Balan, L.; Yuen, T.; Mehrtash, M. Problem-Based Learning Strategy for CAD Software Using Free-Choice and Open-Ended Group Projects. Procedia Manuf. 2019, 32, 339–347. [Google Scholar] [CrossRef]
  35. Nadolny, L.; Valai, A.; Cherrez, N.J.; Elrick, D.; Lovett, A.; Nowatzke, M. Examining the characteristics of game-based learning: A content analysis and design framework. Comput. Educ. 2020, 156, 103936. [Google Scholar] [CrossRef]
  36. William, R.; Wolff, K.E.; Goosen, N.J. Using an informal competitive practical to stimulate links between the theoretical and practical in fluid mechanics: A case study in non-assessment driven learning approaches. Educ. Chem. Eng. 2017, 21, 1–10. [Google Scholar]
  37. Barbosa, M.W.; de Avila Rodrigues, C. Project Portfolio Management teaching: Contributions of a gamified approach. Int. J. Manag. Educ. 2020, 18, 100388. [Google Scholar] [CrossRef]
  38. Chowdhury, H.; Alam, F.; Mustary, I. Development of an innovative technique for teaching and learning of laboratory experiments for engineering courses. Energy Procedia 2019, 160, 806–811. [Google Scholar] [CrossRef]
  39. Driscoll, H.; Hart, J.; Allen, T. Use of Image Based Sports Case Studies for Teaching Mechanics. Procedia Eng. 2016, 147, 884–889. [Google Scholar] [CrossRef] [Green Version]
  40. Fidan, M.; Tuncel, M. Integrating augmented reality into problem based learning: The effects on learning achievement and attitude in physics education. Comput. Educ. 2019, 142, 103635. [Google Scholar] [CrossRef]
  41. Chan, Y.C.; Chen, Y.H.; Kang, S.C.; Lee, T.H. Development of Virtual Equipment for a Hydraulic Mechanics Experiment. Tsinghua Sci. Technol. 2008, 13, 261–265. [Google Scholar] [CrossRef]
  42. Wang, Z. Interactive virtual prototyping of a mechanical system considering the environment effect. Part 1: Modeling dynamics. Comptes Rendus Mec. 2011, 339, 591–604. [Google Scholar] [CrossRef]
  43. Miguel, Hernandez University. ARVC: Automation, Robotics and Computer Vision Research Group. Miguel University Teaching Innovation Program. Available online: https://innovacion-docente.umh.es/convocatorias-anteriores/ (accessed on 25 January 2021).
  44. New Media Consortium. New Media Consortium Horizon Report. Available online: http://www.nmc.org/publication-type/horizon-report/ (accessed on 20 January 2019).
  45. Wang, C.; Hsu, H.C.K.; Bonem, E.M.; Moss, J.D.; Yu, S.; Nelson, D.B.; Levesque-Bristol, C. Need satisfaction and need dissatisfaction: A comparative study of online and face-to-face learning contexts. Comput. Hum. Behav. 2019, 95, 114–125. [Google Scholar] [CrossRef]
  46. Lehmann, E.L. Testing Statistical Hypotheses: The Story of a Book. Stat. Sci. 1997, 12, 48–52. [Google Scholar] [CrossRef]
  47. Croux, C.; Dehon, C. Influence functions of the Spearman and Kendall correlation measures. Stat. Methods Appl. 2010, 19, 497–515. [Google Scholar] [CrossRef] [Green Version]
  48. Stanley, J.C.; Porter, A.C. ANOVA analysis of unweighted and weighted fisher z’s. Soc. Sci. Res. 1972, 1, 237–241. [Google Scholar] [CrossRef]
Figure 1. Schedule of the course along the semester (15 weeks). It comprises theory lessons and practical lessons (laboratory hands-on lessons and simulation lessons) throughout 3 units of content.
Mathematics 09 00558 g001
Figure 2. Resources devoted to the teaching of the subject during the last six academic years.
Mathematics 09 00558 g002
Figure 3. Example of practical activity. (a) Exercise statement. (b) Exercise resolution.
Mathematics 09 00558 g003
Figure 4. Schemes of the mockups tested during the hands-on sessions in the laboratory. (a) Four bars mechanism. (b) Cam-crank mechanism. (c) Double-sliding mechanism.
Mathematics 09 00558 g004
Figure 5. Example of practical activity. (a) Simulation of a mechanism obtained with Matlab. (b) Entire operation of the mechanism in the mechanic’s laboratory.
Mathematics 09 00558 g005
Figure 6. Participants responses to the questionnaire (average values, [1–5]). (a) Initial pass in week 3. (b) Final pass in week 15. Legend: Q1; Q2; Q3; Q4.
Mathematics 09 00558 g006
Figure 7. Time dedicated (min) by students to finish the practical activities. Legend: Google Groups (test group); Google Hangouts (test group); Face-to-face (control group).
Mathematics 09 00558 g007
Figure 8. (a) Historic mean marks [0–10]+σ. Legend: the whole set of students (pass and fail marks); only students who pass. (b) Historic marks distributed by ranks. Legend: [0–5]; [5–6]; [6–7]; [7–9]; [9–10].
Mathematics 09 00558 g008
Figure 9. (a) P a s s and F a i l percentages of only students who take the exam. Legend: P a s s -non-repeaters; P a s s -repeaters; F a i l -non-repeaters; F a i l -repeaters. (b) P a s s and F a i l percentages of all students (including dropout). Legend: P a s s -non-repeaters; P a s s -repeaters; F a i l -non-repeaters; F a i l -repeaters; D r o p o u t -non-repeaters; D r o p o u t -repeaters.
Mathematics 09 00558 g009
Figure 10. (a) Comparison of mean marks [0–10]+ σ between test group (online attendance) and control group (face-to-face attendance). Legend: the whole set of students (pass and fail marks); only students who pass. (b) Comparison of marks distribution by rank between test group and control group: Legend: [0–5]; [5–6]; [6–7]; [7–9]; [9–10].
Mathematics 09 00558 g010
Figure 11. (a) P a s s and F a i l percentage comparison between test group (online attendance) and control group (face-to-face attendance) with only students who take the exam. Legend: P a s s -non-repeaters; P a s s -repeaters; F a i l -non-repeaters; F a i l -repeaters. (b) P a s s and F a i l percentage comparison of all students (including dropout) in the test and control groups: Legend: P a s s -non-repeaters; P a s s -repeaters; F a i l -non-repeaters; F a i l -repeaters; : D r o p o u t -non-repeaters; D r o p o u t -repeaters.
Mathematics 09 00558 g011
Figure 12. Anova test results between final marks and number of Individual Assignments. Legend: boxplot for each group; median value; Mathematics 09 00558 i001 standard deviation; + outliers.
Mathematics 09 00558 g012
Table 1. Course syllabus, unit content and lessons.
Theory Lessons
UnitContentLessonsAssignments
1Introduction to mechanismsBasic mechanisms; Degree of Freedom DOF (Gruber-Kutzbach criterion).-
4R mechanisms. Grashof’s criterion.Unit 1
2Statics2.1 Freudenstein equation.-
2.2 Chebyshev’s equation.-
2.3 Kinematics of 2D mechanisms (part 1).-
2.4 Analytical methods (velocity).-
2.5 Velocity examples.-
2.6 Kinematics of 2D mechanisms (part 2).-
2.7 Analytical methods (acceleration).-
2.8 Acceleration examples.-
2.9 Dynamic force analysis. Newtonian solution method.-
2.10 Dynamic force analysis. Principle of virtual work cyclic machines.Unit 2
3Transmission3.1 Mechanical transmission mechanisms.-
3.2 Gear trains.-
3.3 Cams.Unit 3
Practical Lessons: Team work
1Laboratory Hands-on1.1 Mockup 1: 4 bars mechanism.-
1.2 Mockup 2: Cam-crank mechanism.-
1.3 Mockup 3: Double-sliding mechanism.Initial questionnaire
Simulation1.4 Synthesis and simulation of mechanisms: introduction.-
2Simulation2.1 Synthesis and simulation of mechanisms: 3 poses movement generation.-
2.2 Synthesis and simulation of mechanisms: 3 poses trajectory generation.-
2.3 Synthesis and simulation of mechanisms: Function generation.Final questionnaire.
Table 2. Correlation results between final marks and resources for teaching: Individual Assignments and Practical Activities, respectively. Correlation parameters: Pearson ( r p e r ), Spearman ( r s p e ), and Kendall ( r k e n ).
CorrelationsIndividual AssignmentsPractical Activities
r p e r 0.41790.1425
r s p e 0.42240.0203
r k e n 0.30400.0072
Table 3. t s t u d e n t test between final marks and resources for teaching: Individual Assignment and Practical Activities, respectively.
Resource t stu p-Value t test ( α 2 ) dof H 0
Individual Assignments13.96373.9 × 10 25 1.9842991
Practical Activities15.56242.3 × 10 28 1.9842991
Table 4. Anova test between final marks and Individual Assignment (categorically from zero to six assignments).
Anova TestFp-Value F test ( α ) H 0
no. of assignments13.793.7 × 10 10 2.40851
Table 5. Individual t s t u d e n t tests between final marks and the number of Individual Assignments.
No. of Assignments t stu p-Value t test ( α 2 ) dof H 0
12.73770.01692.1604131
23.00100.00462.1788121
31.66350.10182.0032340
41.37410.17251.9842990
51.12110.26481.98261060
63.26970.00141.98201091
Table 6. Marks probability (∈[0–1]) classified per ranks and number of Individual Assignments.
No. of Assignments<5[5–6][6–7][7–10] p Pass
<20.120.030.030.020.013
30.090.110.050.060.038
40.120.230.180.080.089
50.210.330.290.290.151
60.460.300.450.550.198
Table 7. χ 2 test between the final marks and the number of Individual Assignments. Qualitative comparison, computed categorically.
chi-Squared Test χ 2 p-Value χ test ( α ) 2 dof C = χ 2 / ( χ 2 + n ) Cramer’s V H 0
no. of assignments12.52830.054416.919090.2180.2230
Table 8. Correlation results between the final marks and the attendance modality: Control group (face-to-face) and test group (online). Correlation parameters: Pearson ( r p e r ), Spearman ( r s p e ), and Kendall ( r k e n ).
CorrelationsControl GroupTest Group
r p e r 0.60490.3144
r s p e 0.52460.2455
r k e n 0.44550.1736
Table 9. t s t u d e n t test between the final marks and the attendance modality: Control group (face-to-face), test group (G. Groups), and test group (G. Hangouts).
Resource t student p-Value t test ( α 2 ) dof H 0
Control group (face-to-face)18.37652.0 × 10 16 2.0227401
Test group (G. Groups)9.02821.7 × 10 9 2.0227401
Test group (G. Hangouts)8.95601.9 × 10 9 2.0227401
Table 10. χ 2 test between the final marks (pass or fail) and the attendance modality. Qualitative comparison. Control group (face-to-face), test group (G. Groups), and test group (G. Hangouts).
chi-Squared Test χ 2 p-Value χ test ( α ) 2 dof C = χ 2 / ( χ 2 + n ) H 0 p pass
Control group (face-to-face)39.74141.4 × 10 10 3.841510.59510.789
Test group (G. Groups)0.4970.48253.841510.10500.078
Test group (G. Hangouts)0.07140.72033.841510.03900.157
Table 11. χ 2 test between the probability of taking the final exam (not dropping out) and the attendance modality. Qualitative comparison.
chi-Squared Test χ 2 p-Value χ test ( α ) 2 C = χ 2 / ( χ 2 + n ) Cramer’s V H 0 p exam
Control group24.36914.1 × 10 7 3.84150.5970.77410.875
Publisher’s Note: MDPI stays neutral with regard to jurisdictional claims in published maps and institutional affiliations.

