Article

Comparing Surface Plasmon-Optical and Electronic Immuno-Sensing of Affinity Interactions—A Case Study

1
AIT Austrian Institute of Technology, Biosensor Technologies, 3430 Tulln, Austria
2
Center for Electrochemical Surface Technology, 2700 Wiener Neustadt, Austria
3
Polariton Life Technologies Ltd., Soochow, Suzhou 215123, China
4
Institute of Materials Research and Engineering, Singapore
5
Flinders Centre for Nanoscale Science and Technology, School of Chemical & Physical Sciences, Flinders University, Adelaide, SA 5001, Australia
*
Author to whom correspondence should be addressed.
Submission received: 23 November 2020 / Revised: 23 December 2020 / Accepted: 31 December 2020 / Published: 5 January 2021
(This article belongs to the Special Issue Organic-Inorganic Hybrid Chemo- and Bio-Sensors)

Abstract

:
In this case study, we provide a few examples for affinity-sensors based on optical detection concepts and compare them with electronic read-out schemes. We concentrate and briefly summarize two of the most advanced versions in each category: one is a surface-plasmon field-enhanced fluorescence spectroscopic approach, while in the electronic sensing domain we concentrate on graphene-based field-effect transistors as the read-out platform. Both transduction principles are surface-sensitive and-selective, however, with penetration lengths into the analyte solution (e.g., into a flow cell attached) that are very different and that depend on totally different physical principles: while for surface-plasmons the evanescent character of the plasmon mode, propagating along the noble metal-solution interface with a penetration length in the order of 100 nm (for Au/water and a laser wavelength of = 632.8 nm), the “penetration depth” in electronic transistor-based sensing is governed by the Debye length which, for a physiological salt environment, amounts to less than 1 nm. Taking these differences into account, one can optimize the sensor read-out by the appropriate interfacial architecture used to functionalize the transducers by immobilizing one of the affinity interaction partners. We will discuss this for both concepts by giving a few examples of the achievable limit of detection for both methods. The examples discussed include a classical system, i.e., the binding of human chorionic gonadotropin (hCG) to its surface-immobilized antibodies or Fab fragments, the detection of lipopolysaccharides in a tethered bimolecular lipid membrane, and, as an example for small analyte detection by antibodies, the monitoring of aflatoxin B1, a member of the food toxin family of mycotoxins.

1. Introduction

If one looks at the 2020 Glossary of the National Agricultural Library of the United States Department of Agriculture for the definition of “immunosensors”, one finds the following: “Analytical devices that use antibodies as the specific sensing element and detect concentration dependent signals” [1]. This reference describes perfectly what we will cover in this report with a particular focus: firstly, we will describe and compare two of the many different transduction principles, i.e., an optical device, based on surface plasmon fluorescence spectroscopy (SPFS), and then an electronic one, using graphene-based field-effect transistors (gFETs). We aim at comparing results obtained in a number of case studies using these top-of-the-line techniques in their respective categories. And, as we will show, both can be applied very well to monitor and quantify in situ and in real time the association (binding) and dissociation—and hence the “sensing”—of analytes from solution to surface immobilized antibodies used as receptors. Both techniques deliver concentration dependent signals; yet, are based on completely different physical transduction principles. For both techniques, we will present for these case studies the sensitivity of the detection of bio-analytes and will compare the relative advantages/disadvantages of the two transduction concepts and their respective limits of detection.

2. Surface Plasmon Optical Detection

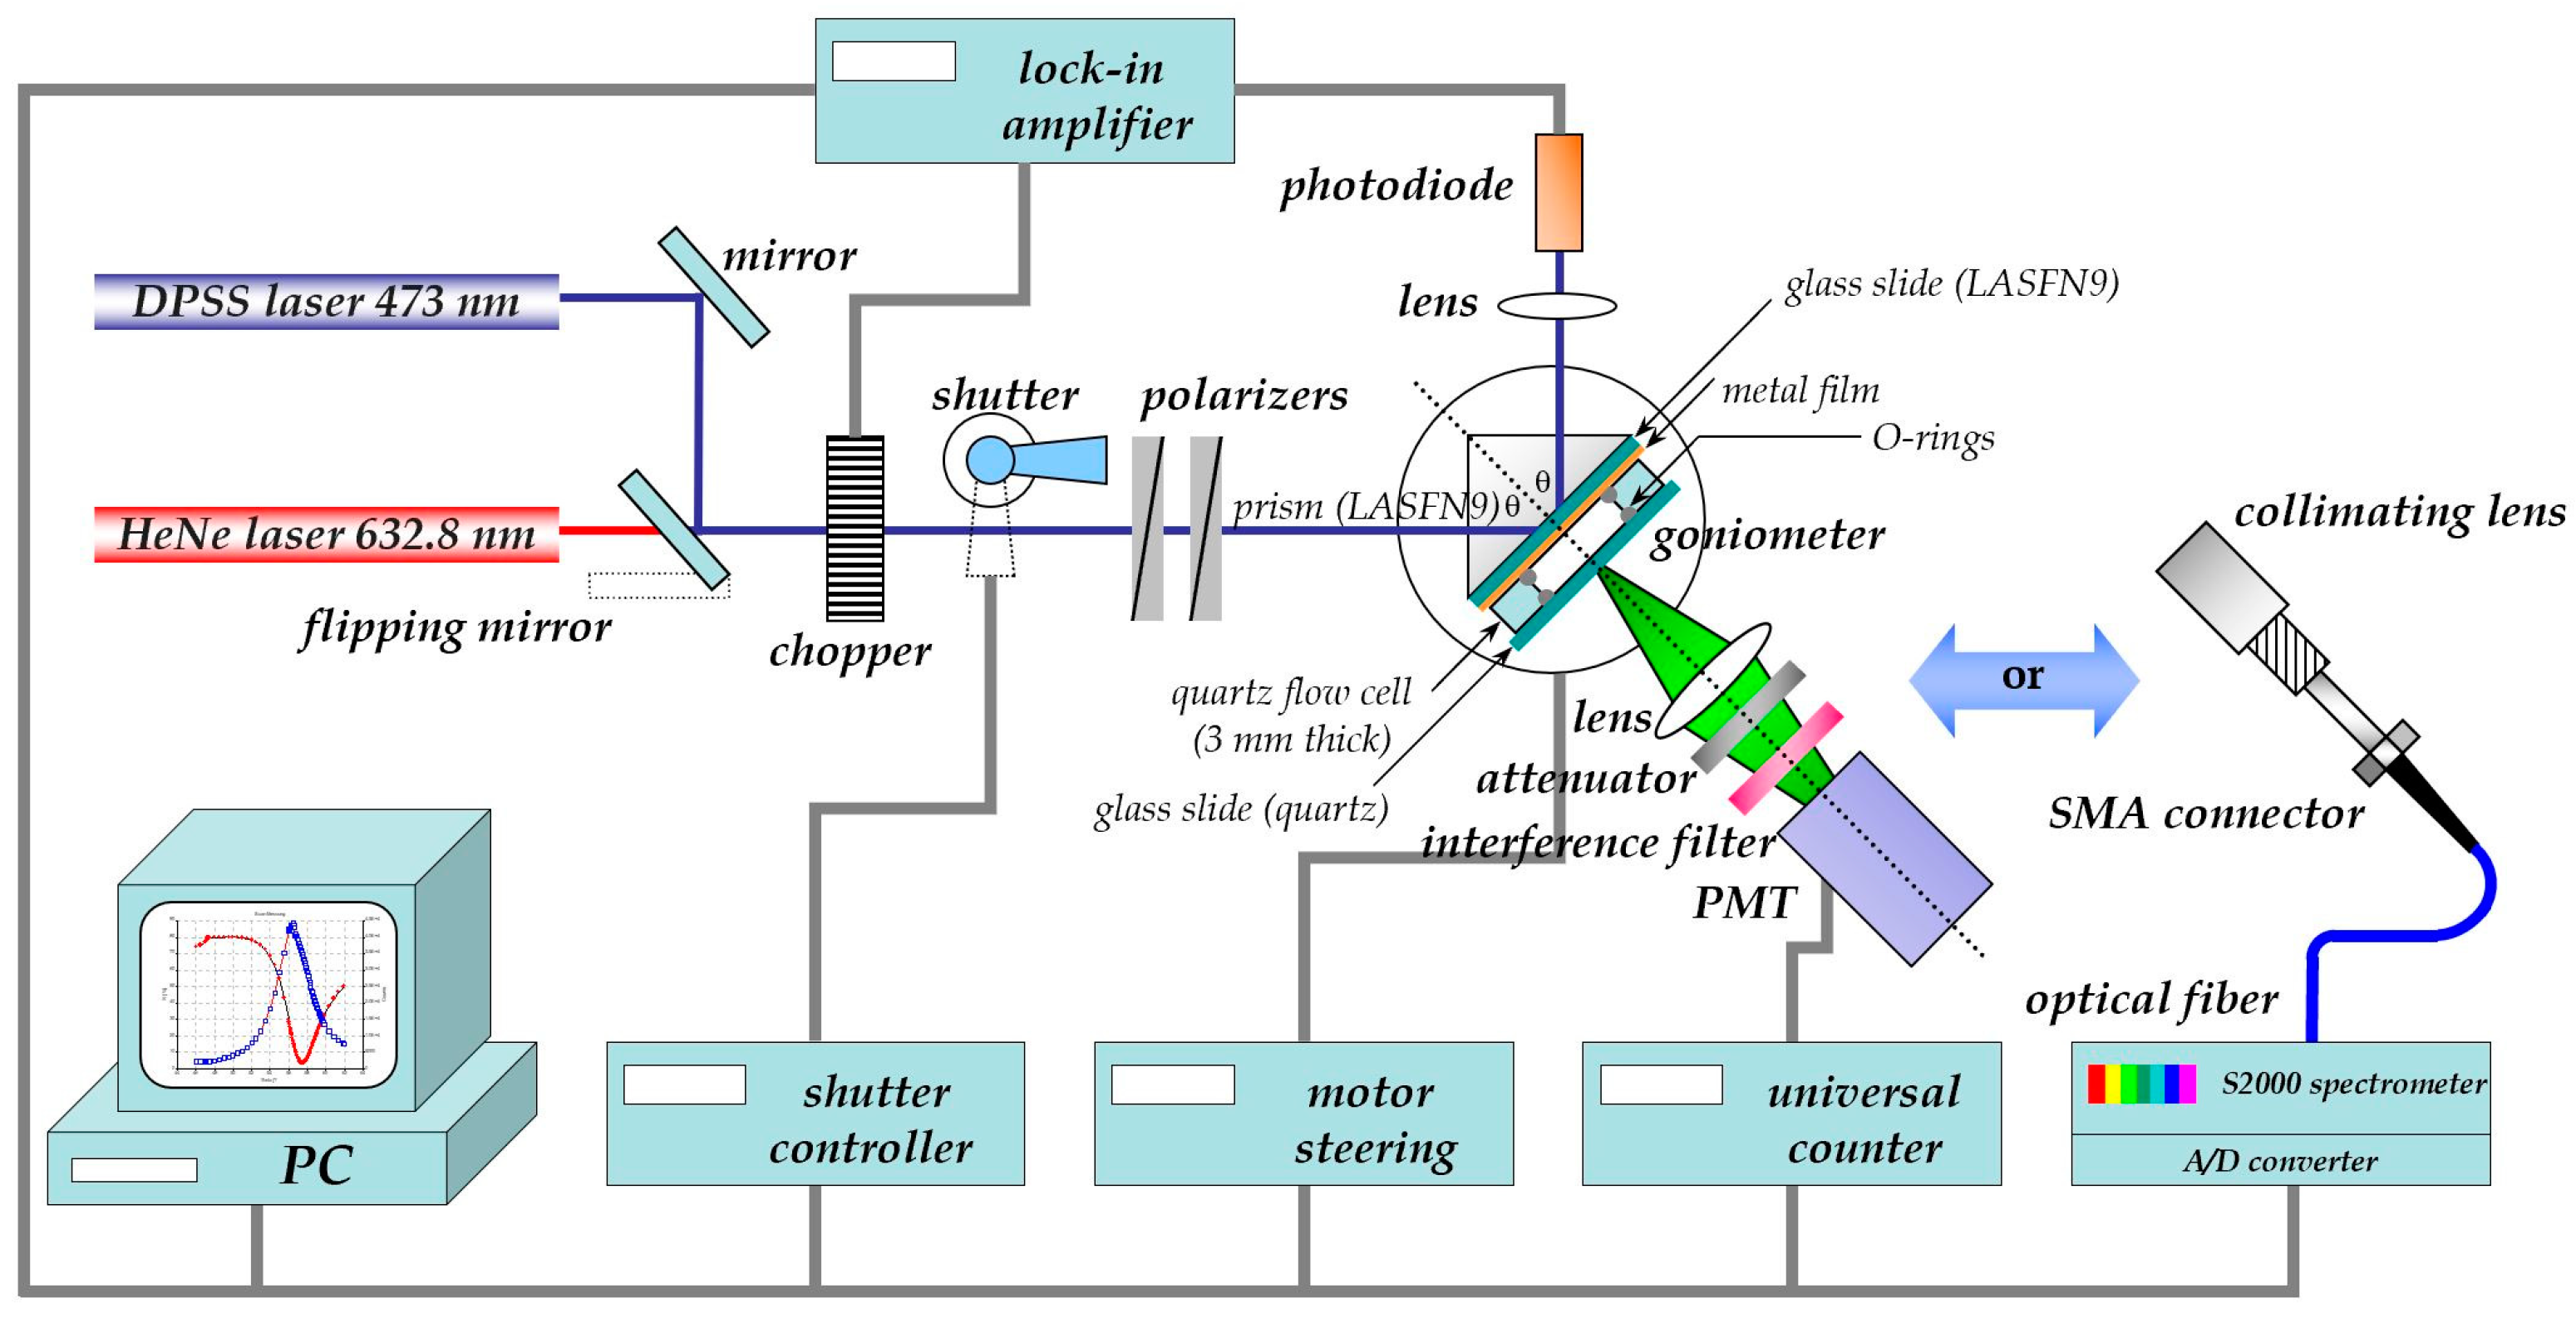
2.1. The Basics of Surface Plasmon Fluorescence Spectroscopy

The schematics of the set-up used for the surface-plasmon (fluorescence) optical recording of bio-analyte association/binding and dissociation reactions between surface-attached antibodies as receptors and analytes from solution is shown in Figure 1. A classical surface plasmon resonance (SPR) spectrometer in the Kretschmann configuration [2] is modified by a module consisting of a collection lens, a spectral filter to differentiate the emitted fluorescence light from elastically scattered surface plasmon modes, (an attenuator if needed to avoid running the photomultiplier near saturation,) and a monitoring unit, typically a photomultiplier, operated in the photon counting mode for intensity measurements. For the spectral analysis of the fluorescence the emitted light is coupled via an optical fiber to a spectrometer. Both attachments allow for the application of fluorescence detection principles to be implemented as surface plasmon field enhanced fluorescence spectroscopy (SPFS) for the recording of the kinetics of receptor-ligand binding reactions, as well as for the determination of the corresponding affinity constants by titration experiments [3].
One of the guiding criteria in the design and construction of sensor platforms for surface-specific detection concepts in immuno-sensing is the correlation of the supramolecular architecture of the interfacial binding matrix and the spatial extent (the penetration depth) of the probing field from the transducer surface into the analyte solution. For the quartz crystal microbalance, this is the shear field that extends from the oscillating quartz surface into the analyte solution and amounts to c. 250 nm (@ 5 MHz frequency) [4]; in surface-plasmon optics with modes propagating at the Au/water interface with a wavelength of =632.8 nm, the evanescent field shows a 1/e decay into the analyte solution of about 100 nm [5]; while in electronic sensing the relevant length scale is given by the Debye length which, for physiological buffer solutions, amounts to less than 1 nm (cf. below). No matter how short the decay length of the probing field may be, in any of these sensing formats, the analyte, binding from solution to the surface-immobilized receptor, should do so as close as possible to the transducer-solution interface where the mechanical, optical, or electrical field, probing this binding reaction, is maximal.
However, additional considerations may have to be taken into account: e.g., as it is shown in Figure 2 the fluorescence yield of a chromophore near a metal surface that acts as a broadband acceptor system would be efficiently quenched for any labeled analyte molecule that comes closer to the metal surface than about two Förster radii which amount to some 10–15 nm (cf. the dashed curve in Figure 2) [6]. A surface architecture of receptor sites that keeps the binding analyte sufficiently away from the quenching surface will thus lead to an enhanced fluorescence intensity as the sensing signal. This concept is realized in the following sandwich assay designed for the quantitative detection of a pregnancy hormone marker, i.e., human chorionic gonadotropin (hCG) [7].

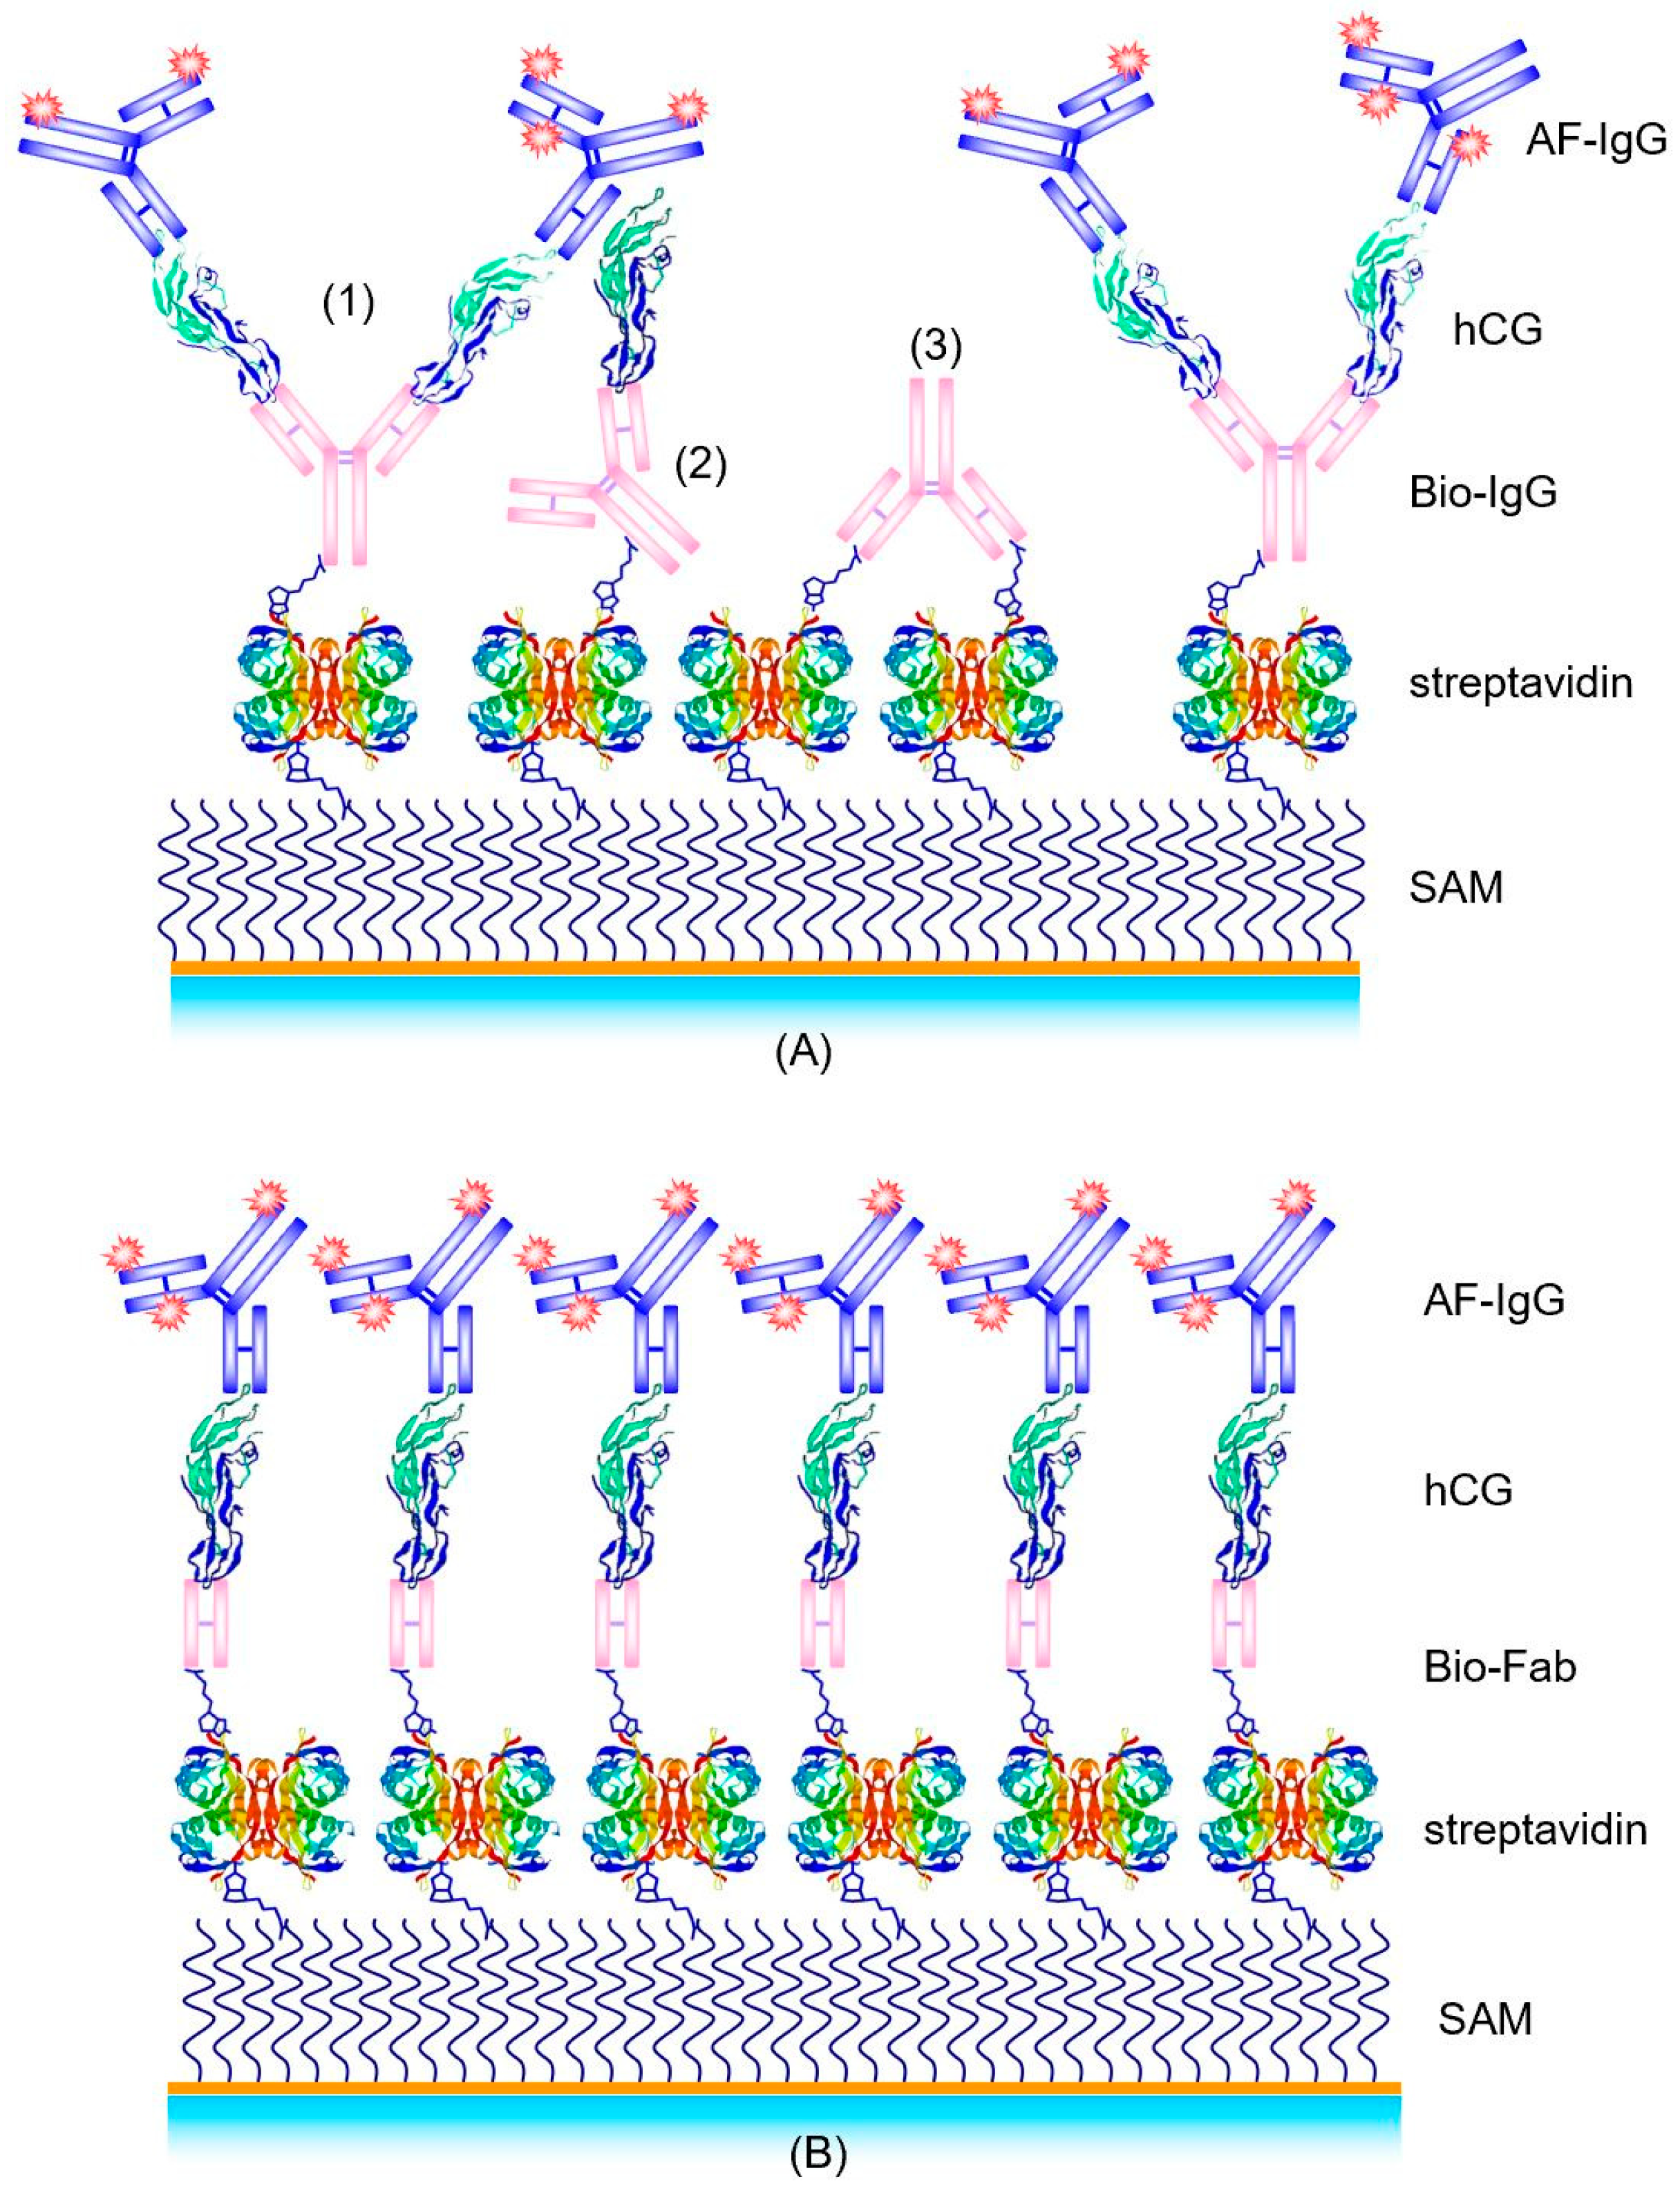
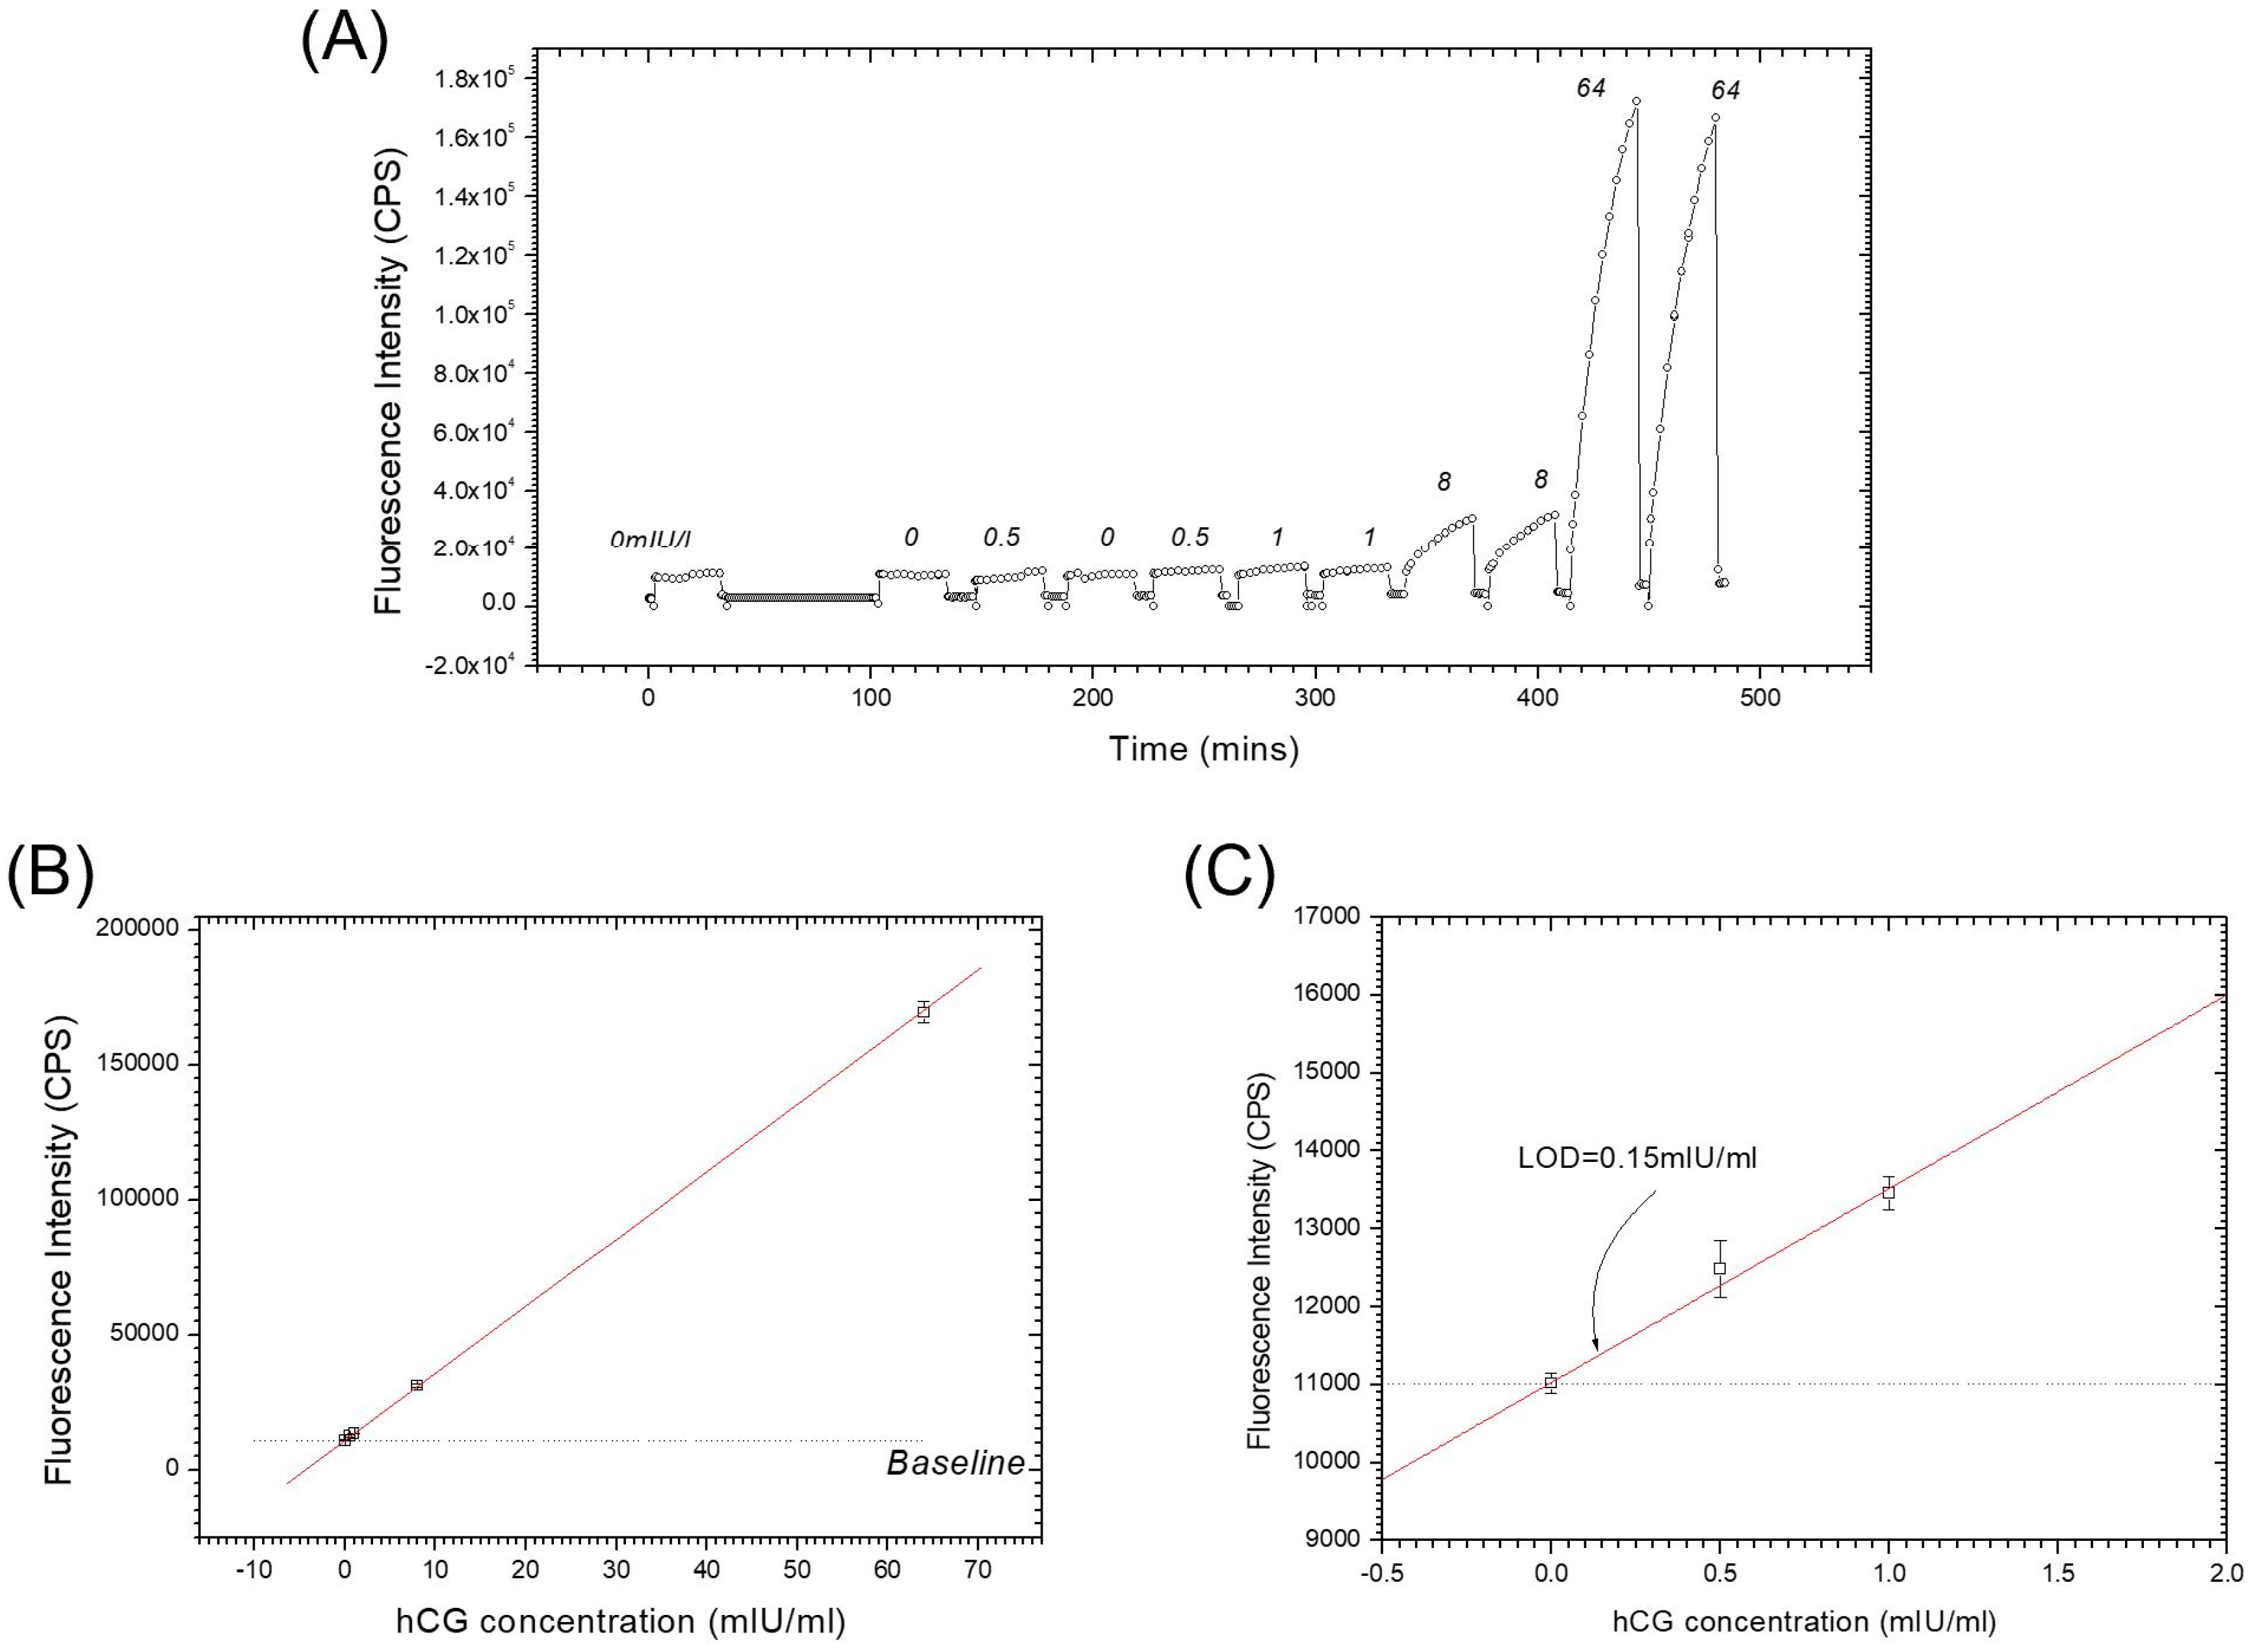
2.2. Sandwich Fluorescence Assays for Human Chorionic Gonadotropin Monitoring

Human chorionic gonadotropin (hCG) is a glycoprotein hormone secreted by the trophoblastic cells of the placenta during pregnancy. It is a member of the glycoprotein hormone family, which includes luteinizing hormone (LH), follicle-stimulating hormone (FSH), and thyroid-stimulating hormone (TSH). Its function is to maintain the corpus luteum and stimulate steroid secretion from the ovary in the early stages of gestation. Apart from its physiological action, hCG is found in pathological cases such as choriocarcinoma or testicular cancer [8].
Quantitative determinations of hCG and hCG-derivatives in serum or urine are important in the diagnosis and in monitoring pregnancies, hCG-secreting malignancies, and in testing for Down’s syndrome. hCG is usually detectable in serum about 7–9 days after conception when implantation occurs (cf. Table 1). This defines high requirements to the specificity and the sensitivity of the detection methods.
Today, the clinically available hCG detection methods are mainly based on immunoassays. The selectivity of the ligand-binding of antibodies allows these biomolecules to be employed in analytical methods that are highly specific even in complex biological matrices, such as blood, plasma, or urine. By combining the selectivity of antibody–analyte interactions with the vast array of antibodies preformed during the immunization processes of host animals and the availability of numerous readily detectable labels, immunoassays can be designed for a wide variety of analytes, with extraordinarily low detection limits as well as relatively low cost. In general, immunoassays are categorized based on the types of detection principles and labels that are employed and are divided into: radioimmunoassays, enzyme immunoassays, chemiluminescence immunoassays, fluorescence immunoassays, and a few others.
Among the various optical immunosensor systems, SPR is the most popular one [10]. In earlier work, we used SPR as the method to characterize the assembly of the supramolecular structure of the binding matrix, composed of a biotinylated self-assembled monolayer (SAM), a layer of streptavidin, a layer of biotinylated antibody fragments, Fab, the analyte hCG, and a monoclonal Alexa Fluor-labeled detection antibody (AF-IgG). The corresponding multilayer is schematically shown in Figure 3A. As the detection limit we obtained approximately LOD = 10 nM [11], corresponding to about 5000 mIU/mL.
SPFS offers the ability to simultaneously monitor the interfacial refractive index changes, n, as well as the fluorescence signals, both in real time. The surface enhanced fluorescence signal greatly increases the possibility for the detection of even trace amounts of analyte substances in solution [12]. In this chapter, we will present some results of hCG immuno-sensing, based on the SPFS technology, including the effect of an optimized surface antibody orientation, affinity constant determination of different antibody-antigen systems, LOD measurements, etc.
The streptavidin-biotin (or avidin-biotin) complex represents the highest noncovalent affinity interaction in nature. The reported affinity constant of 2.5 × 10¹³ M−1 between streptavidin and biotin [13], and the fact that biotin can be linked to almost any biomolecule make streptavidin and biotin a universal coupling system in biotechnology. On the other hand, the formation of ordered SAMs is usually the primary choice for surface modification and bio-functionalization of gold or silver surfaces, which are required for the resonant excitation of surface-plasmon modes. Therefore, the combination of the streptavidin-biotin interaction scheme and the concept of a SAM structure should be one of the simplest and most robust fabrication strategies for immune-sensors based on surface-plasmon optics.
This approach for the optimization of surface functionalization for molecular recognition process has been reported by Spinke et al. [14] with the conclusion that the best choice of the biotin-containing molecules for the SAM formation contain a spacer segment between biotin and the thiol unit. A second aspect of this strategy is the dilution of this molecule within the monolayer by hydroxyl-thiols, with a molar ratio of biotin-thiol of χ = 0.1 in the mixed thiols solution. This allows for the optimization of the binding properties of the monolayer, i.e., to maximize the specific binding, while simultaneously minimizing the nonspecific interactions between streptavidin and the surface to below the detection limit.
In the subsequent work of Spinke et al. [11], an even better supramolecular structure for a hCG immunoassay was reported. Instead of using the whole antibody, a biotinylated Fab fragment of an anti-hCG IgG was employed. This Fab fragment is mono-biotinylated in the hinge region to ensure proper orientation of the fragment on the surface with the binding site facing to the analyte solution, away from the surface. Furthermore, the size of the Fab fragment is only 5 nm × 7 nm × 4 nm [15], comparable with one streptavidin molecule; thus allowing for a higher receptor/binding site density on the transducer surface. This optimized biomolecular interaction structure is schematically shown in Figure 3B.
One of the disadvantages of the “two-steps” sandwich immunoassay is that the hCG and the fluorophore-labeled detection antibody binding protocols need to be completed separately, which increases the consumed time of each individual cycle.
Combining these two separate coupling steps leads to the “one-step” sandwich immunoassay [16]. Figure 4A shows the kinetic fluorescence working curve of this “one step” method based on the antibody combination Bio-Fab/hCG/AF-β-IgG. After surface activation, a series of 1 mL mixed samples prepared in PBS buffer with the hCG concentration of 0 mIU/mL (negative sample), 0.5 mIU/mL, 1 mIU/mL, 8 mIU/mL and 64 mIU/mL, respectively, together with a fixed concentration of 5 nM AF-β-IgG were injected into the flow cell and circulated for 30 min in the loop. The Bio-Fab surface was regenerated in intervals with glycine buffer pulses (10 mM glycine-HCl, pH 1.75). The fluorescence response signal at the end of 30 min was recorded for the dose-response plot (cf. Figure 4B and the zoom-in given in Figure 4C), in which the straight fit line illustrates the excellent linearity within this regime of extreme low surface coverage. Extrapolating the linear fit curve to the baseline level resulted in a detection limit of LOD = 0.15 mIU/mL, equivalent to 0.28 pM, at the same order of magnitude as with the “two steps” SPFS sandwich assay. The benefits of the proper orientation of the Fab fragment as well as their higher surface density were obvious and the simplified action even saved 10 min of time for each cycle in the assay.

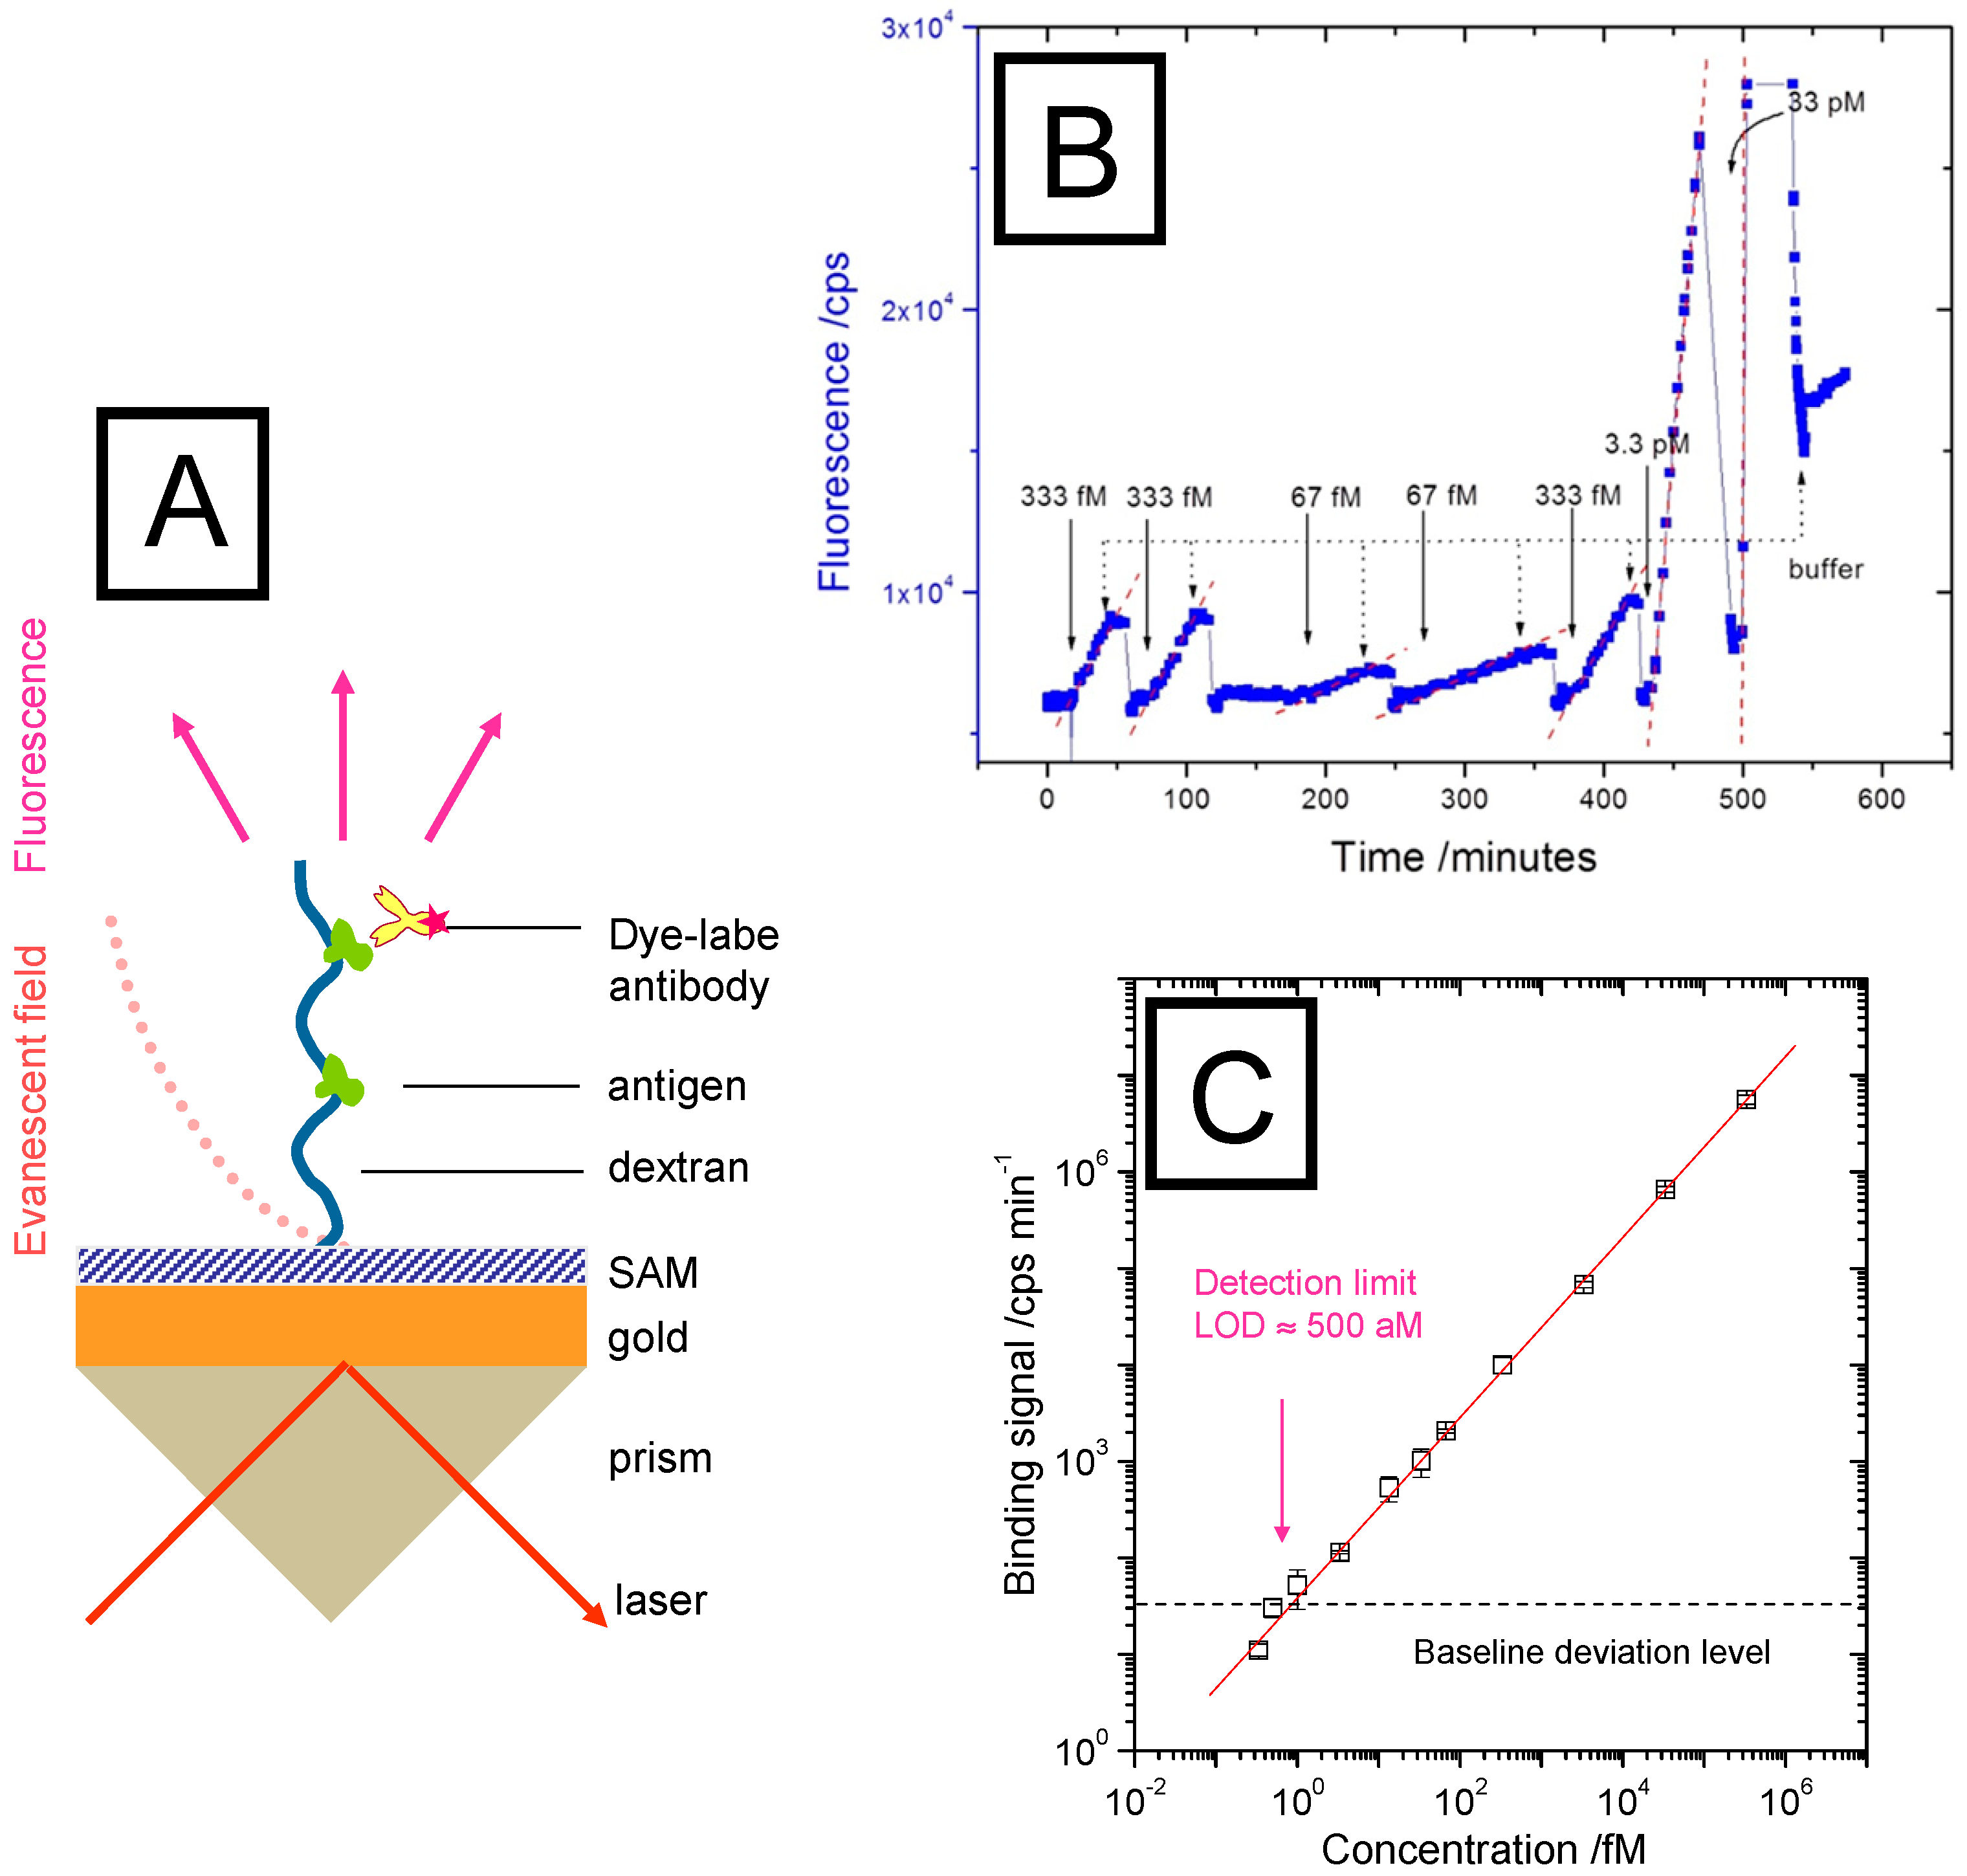
2.3. Extending the Sensitivity by A Polymer Brush Architecture as Binding Matrix

As it was shown in Figure 2, the evanescent field of the surface plasmon modes that excite the chromophores as labels in the SPFS detection scheme extends some 100 nm into the analyte solution. Consequently, binding matrices that offer receptor sites only in a 2D arrangement at the sensor surface do not guarantee the best possible overlap between the probing optical field and the location of the affinity interactions. Hence, wherever possible, the use of an extended binding matrix, e.g., a polymer brush or a hydrogel layer, with immobilized receptor proteins allows for a better match of the optically probed “slice” of the analyte solution with the bound species of interest (cf. Figure 5A) and the evanescent optical field employed to monitor affinity binding events. This has been realized in the CM5 chip from Biacore [17], where a carboxymethylated dextran polymer brush used to immobilizes any receptor molecules of interest extends in the swollen state some 100–150 nm out into the buffer medium.
For SPFS, this extended interfacial architecture also offers a considerable sensitivity advantage as the corresponding optical field also in this case allows for the excitation of a significantly higher number of labelled analyte molecules than in a strictly 2D functionalization architecture. This is schematically depicted in Figure 5A, showing a polymer brush, which is immobilized on the sensor Au substrate surface with its multiple functionalization by covalently attached antigens. Any dye-labeled analyte molecule diffusing into the brush form solution will then be bound by its immuno-receptor within the evanescent optical field, will be optically excited and will consequently emit a fluorescence signal that is proportional to the analyte concentration. The recorded fluorescence intensity can then be analyzed quantitatively in terms of kinetic and the affinity constants.
Such a series of binding events is summarized in Figure 5B for extremely low bulk concentrations for which the time dependent fluorescence increase measured in a flow-cell by SPFS reflects the mere mass-transfer limited diffusion of the (chromophore-labeled) analyte molecules form the bulk solution across the unstirred layer to the sensor surface. For each intensity trace, firstly the baseline fluorescence is recorded, then the analyte solution injected. According to Fick’s law that governs this diffusive process one observes a linear increase of the fluorescence intensity until the analyte solution is replaced against pure buffer, which leads to an immediate stop of the fluorescence increase. After regenerating the sensor brush by a glycine pulse, the next injection of an analyte solution results in another linear increase of the fluorescence intensity.
Plotting the slopes of the linear fluorescence intensity increase as a function of the corresponding bulk analyte concentration for which it was recorded then leads to a calibration curve that is linear over 6 orders of magnitude (Figure 5C) and allows for the determination of the bulk analyte concentration from the recording of the slope of the time-depending binding curve. The intersection of this calibration curve with the three baseline deviation level measured separately (as the fluorescence stability limit and background of the set-up) gives the limit-of-detection for this sensing platform as LOD = 500 aM (5.10−16 M).

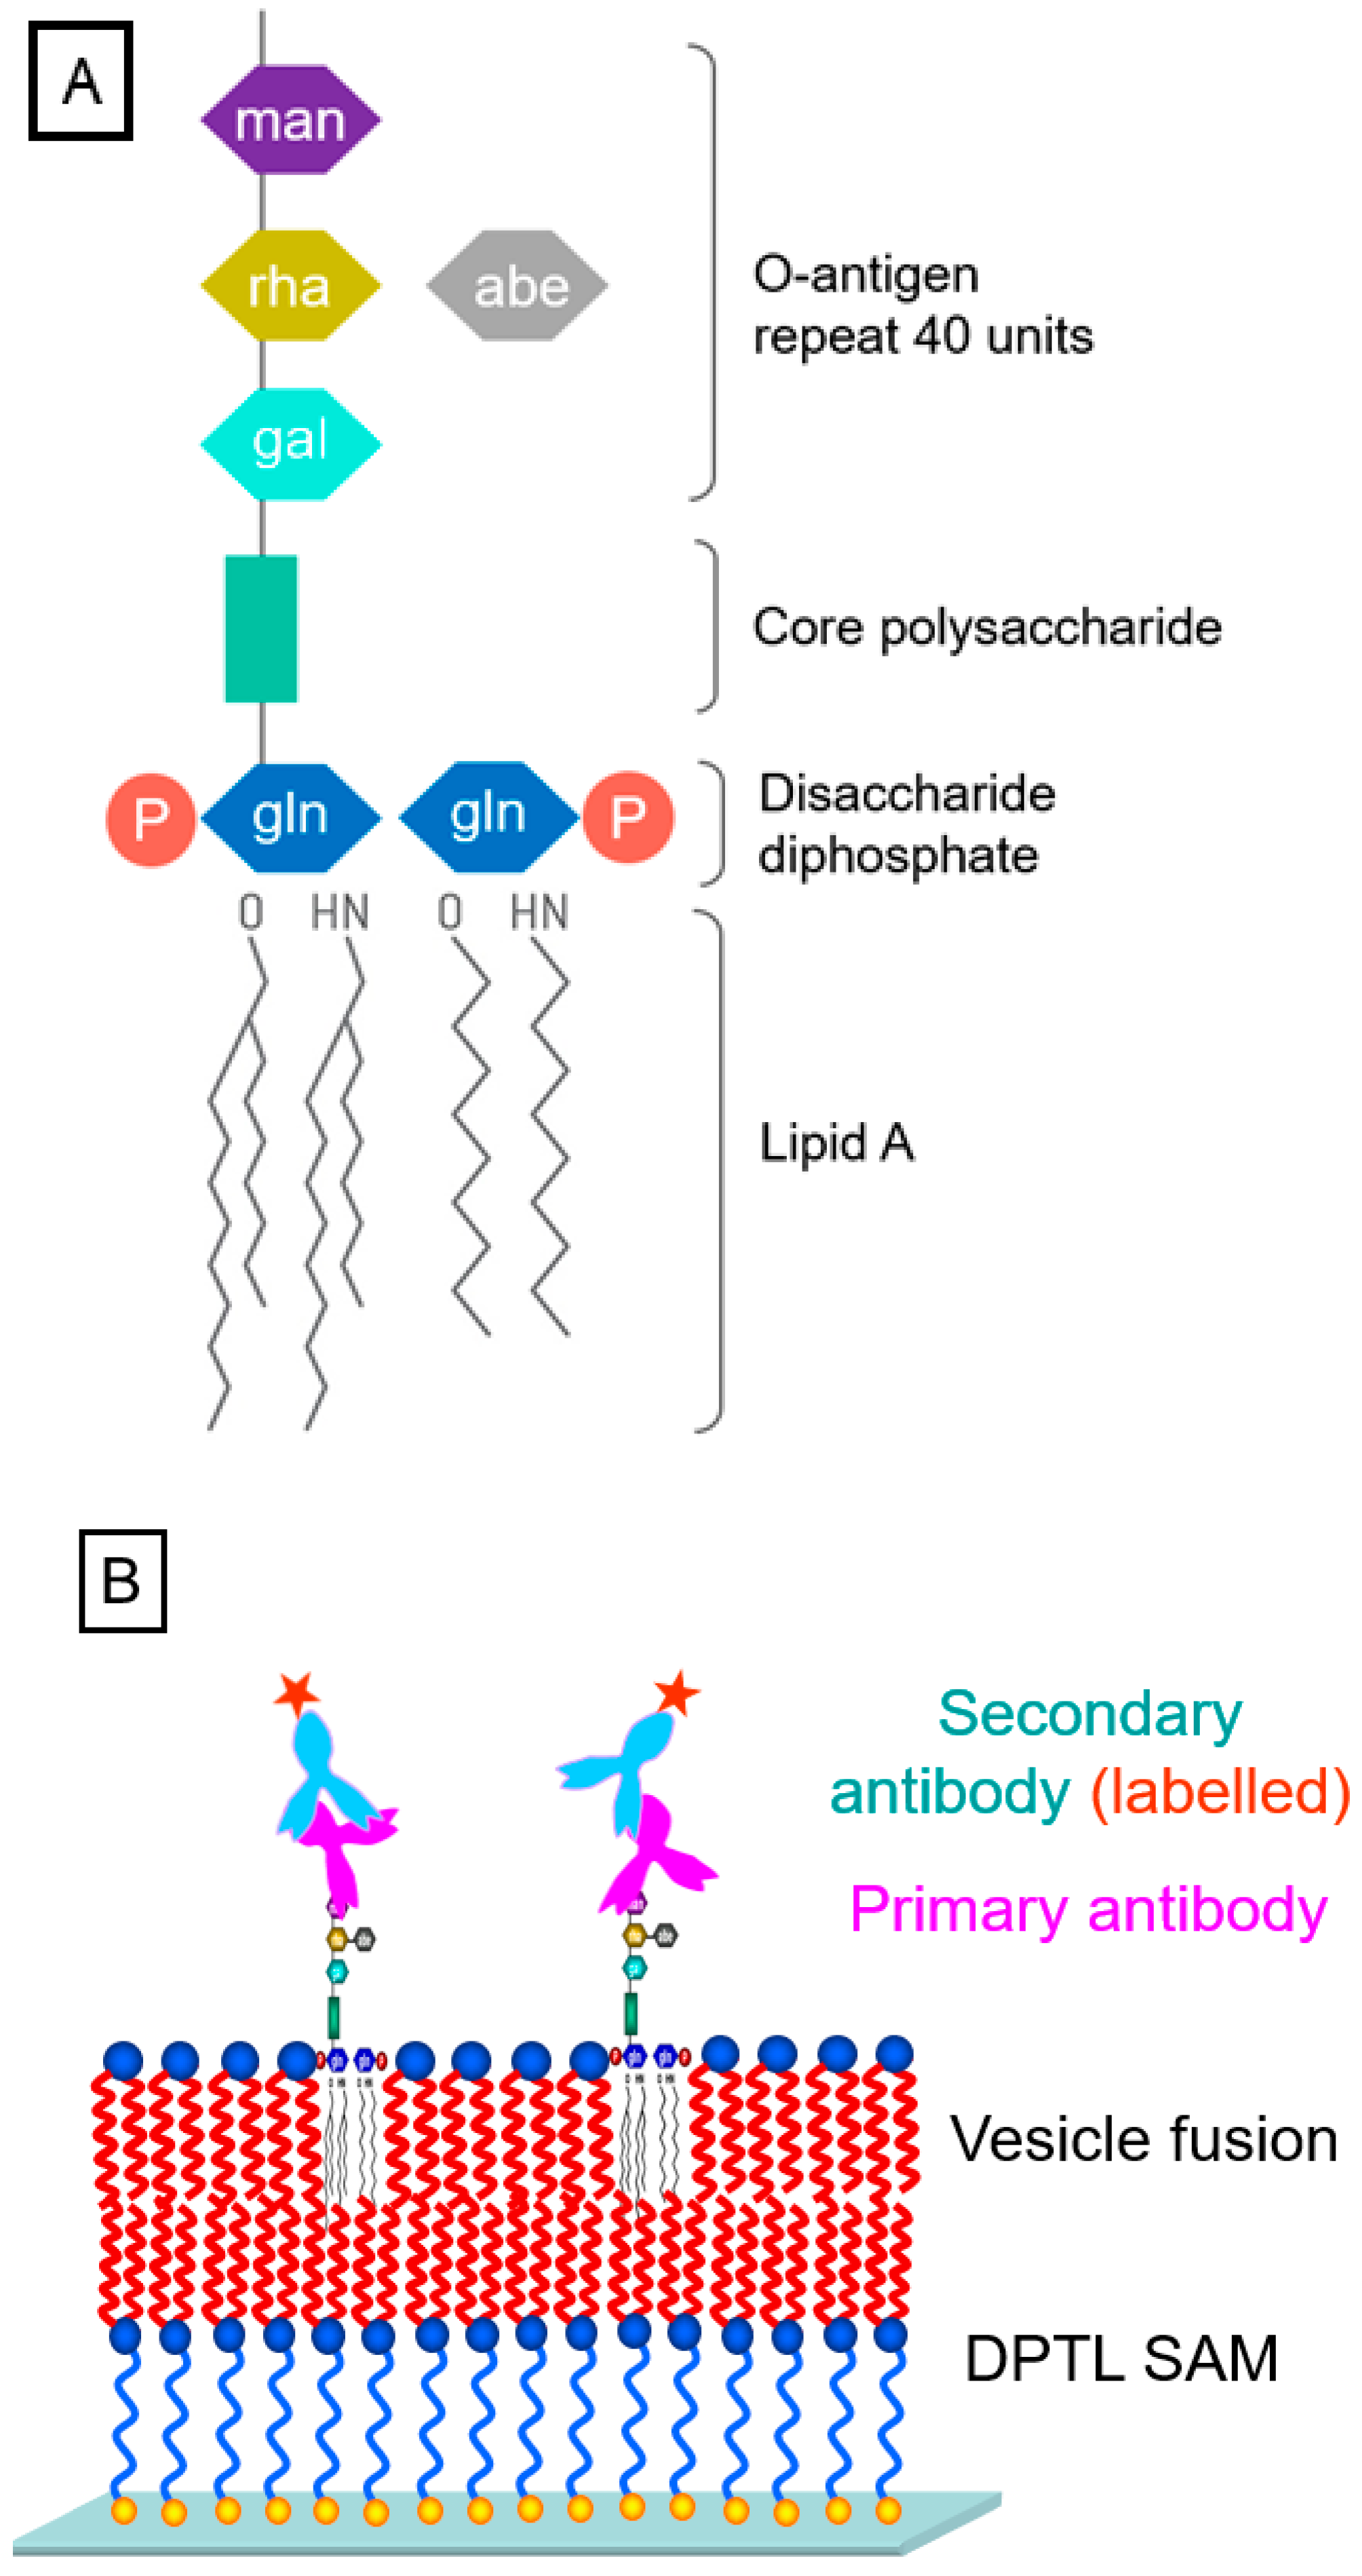
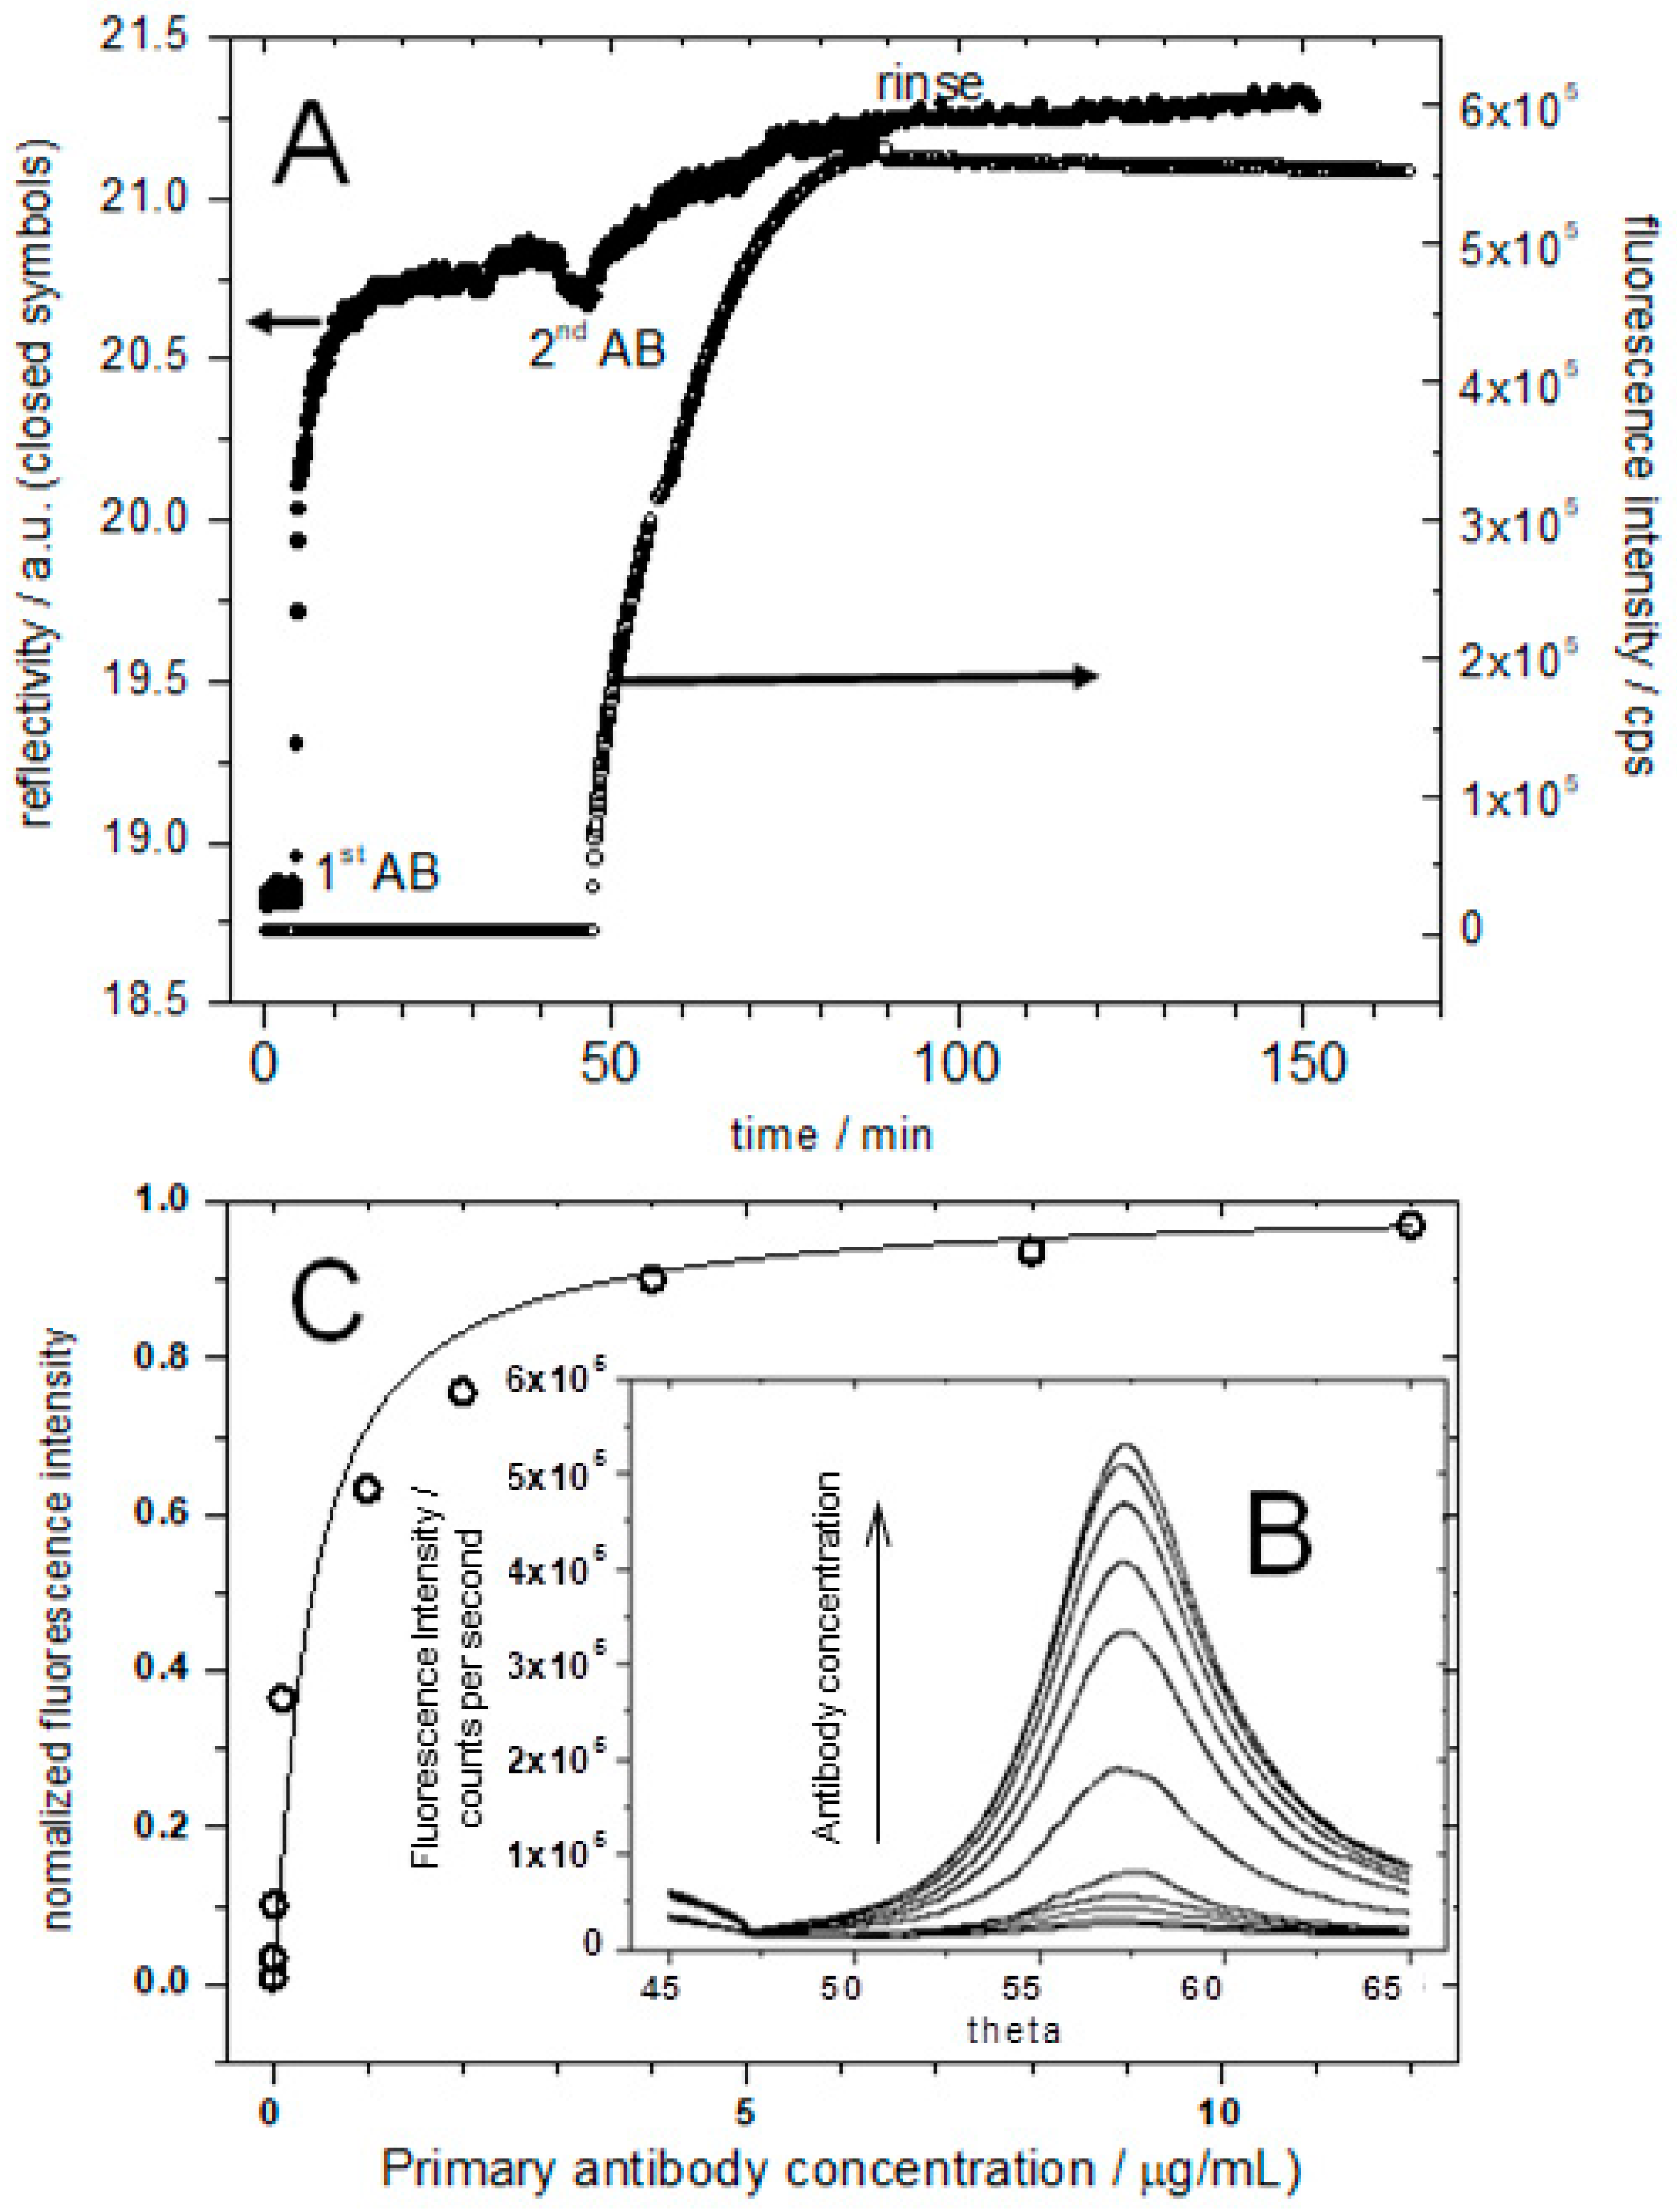
2.4. Immuno-Detection of Lipopolysaccharides in A Tethered Bimolecular Lipid Membrane

The final example for the quantitative, SPFS-based recording of the concentration-dependent binding of antibodies to their antigens concerns lipopolysaccharides (LPS, structure given in Figure 6A) located in a bimolecular artificial lipid membrane [18,19]. By preparing on the surface of the optical transducer a so-called tethered bimolecular lipid membrane (tBLM) [20], doped with LPS mixed into the distal leaflet of the membrane, the O-antigen part of the polysaccharide is exposed to the buffer solution (Figure 6B). The thickness of the resulting membrane was obtained by analyzing the angular scans of SPR measurements using a layer model [21], resulting in a final thickness of the distal layer of 3.5 ± 0.1 nm, slightly higher than that of a pure DPhyPC layer (~3.3 nm), which accounts for the presence of LPS.
Next, SPR and SPFS were used to monitor the specific binding of primary and fluorescently labeled secondary antibodies to the O-antigen fraction of LPS-containing tBLM interface. Due to the rather diluted LPS in the membrane, the addition of primary antibodies leads to only a small shift in the SPR signal (shown in Figure 7A, left scale). Similarly, the SPR signal hardly changes upon the addition of the secondary antibody (also shown in Figure 7A). The SPR response is proportional to the amount of bound material on the surface, which in the present case is rather limited.
However, the fluorescence signal, originating from the chromophore-labeled secondary antibody, shows a significant increase upon binding to the primary antibodies and is stable upon rinsing (Figure 7A, right ordinate). The control experiment with the addition of the antibodies to a pure DPhyPC membrane showed only little non-specific binding (data not shown).
Next, a series of angular SPFS measurements with various antibody concentrations ranging from 1 × 10⁻¹³ M to 8 × 10⁻⁸ M have been performed after the signal reached a stable intensity level (Figure 7B). The specific adsorption of the 130 kDa secondary antibodies can be detected easily down to concentrations of 500 pM. The fluorescence intensity increases with increasing antibody concentration until it reaches a saturation level. In order to obtain a quantitative analysis of the binding, the SPFS signals were normalized between the background level and the saturated intensity, corresponding to full binding site coverage. Plotting these normalized intensities as a function of bulk primary antibody concentration, the binding of the antibodies could be analyzed using a Langmuir isotherm. A Langmuir adsorption coefficient of KA = 3 × 10⁸ M−1 could thus be obtained (Figure 7C).

3. Electronic Bio-Sensing

Among the biosensors that use the quantitative recording of electrical charges, current, or voltage as the transduction concept, the various versions of electrochemical sensors have certainly found the most wide-spread applications [22,23]. However, more recently, electronic detection principles, based on the use of transistor devices, offer an attractive alternative. Demonstration of the sensing capabilities can be found in a wide range of examples in literature [24,25]; and also, our group has demonstrated this for organic field effect transistors (OFETs) used for the sensitive detection of antibodies by surface-immobilized antigens [26].
A drawback of the OFET detection of bio-affinity reactions, measured in real-time in a flow cell, is the requirement of a suitable passivation strategy, shielding the organic transducer against ion diffusion from the buffer [27]. The electronic signal of the transistor (source-drain current) is modulated by these gate (bulk and/or surface) electric potentials that depend on the surface charges, which, without a protective layer, are altered by faradaic interaction with the surface. As a result, an unprotected sensor in physiological buffer solution will drift forever.
This challenge can be addressed using graphene as the semiconducting material of the transistor [28]: the assembly and use of electronic sensors based on reduced graphene oxide (rGO) as the gate material are by far easier [29,30]. These devices can operate in aqueous buffer solutions even without any protective coating because the intrinsic high conductivity of graphene guarantees that most of the current from the source to the drain electrode flows through the graphene layer (and is there modified by any analyte binding as the transduction mechanism) even if the conductive buffer solution at physiological ionic strength generates a short-cut to some extent between the source and drain electrodes [29]. This will reduce the fabrication costs of the transistors for commercial use significantly! The (eventually) cheap fabrication of graphene transistors and their ease of operation, including the potential for multiplexing and high integration into arrays, together with the simple data handling by the read-out electronics promises to offer a very versatile label-free detection scheme for all kinds of analytes inducing potential changes at the surface of the transducer.

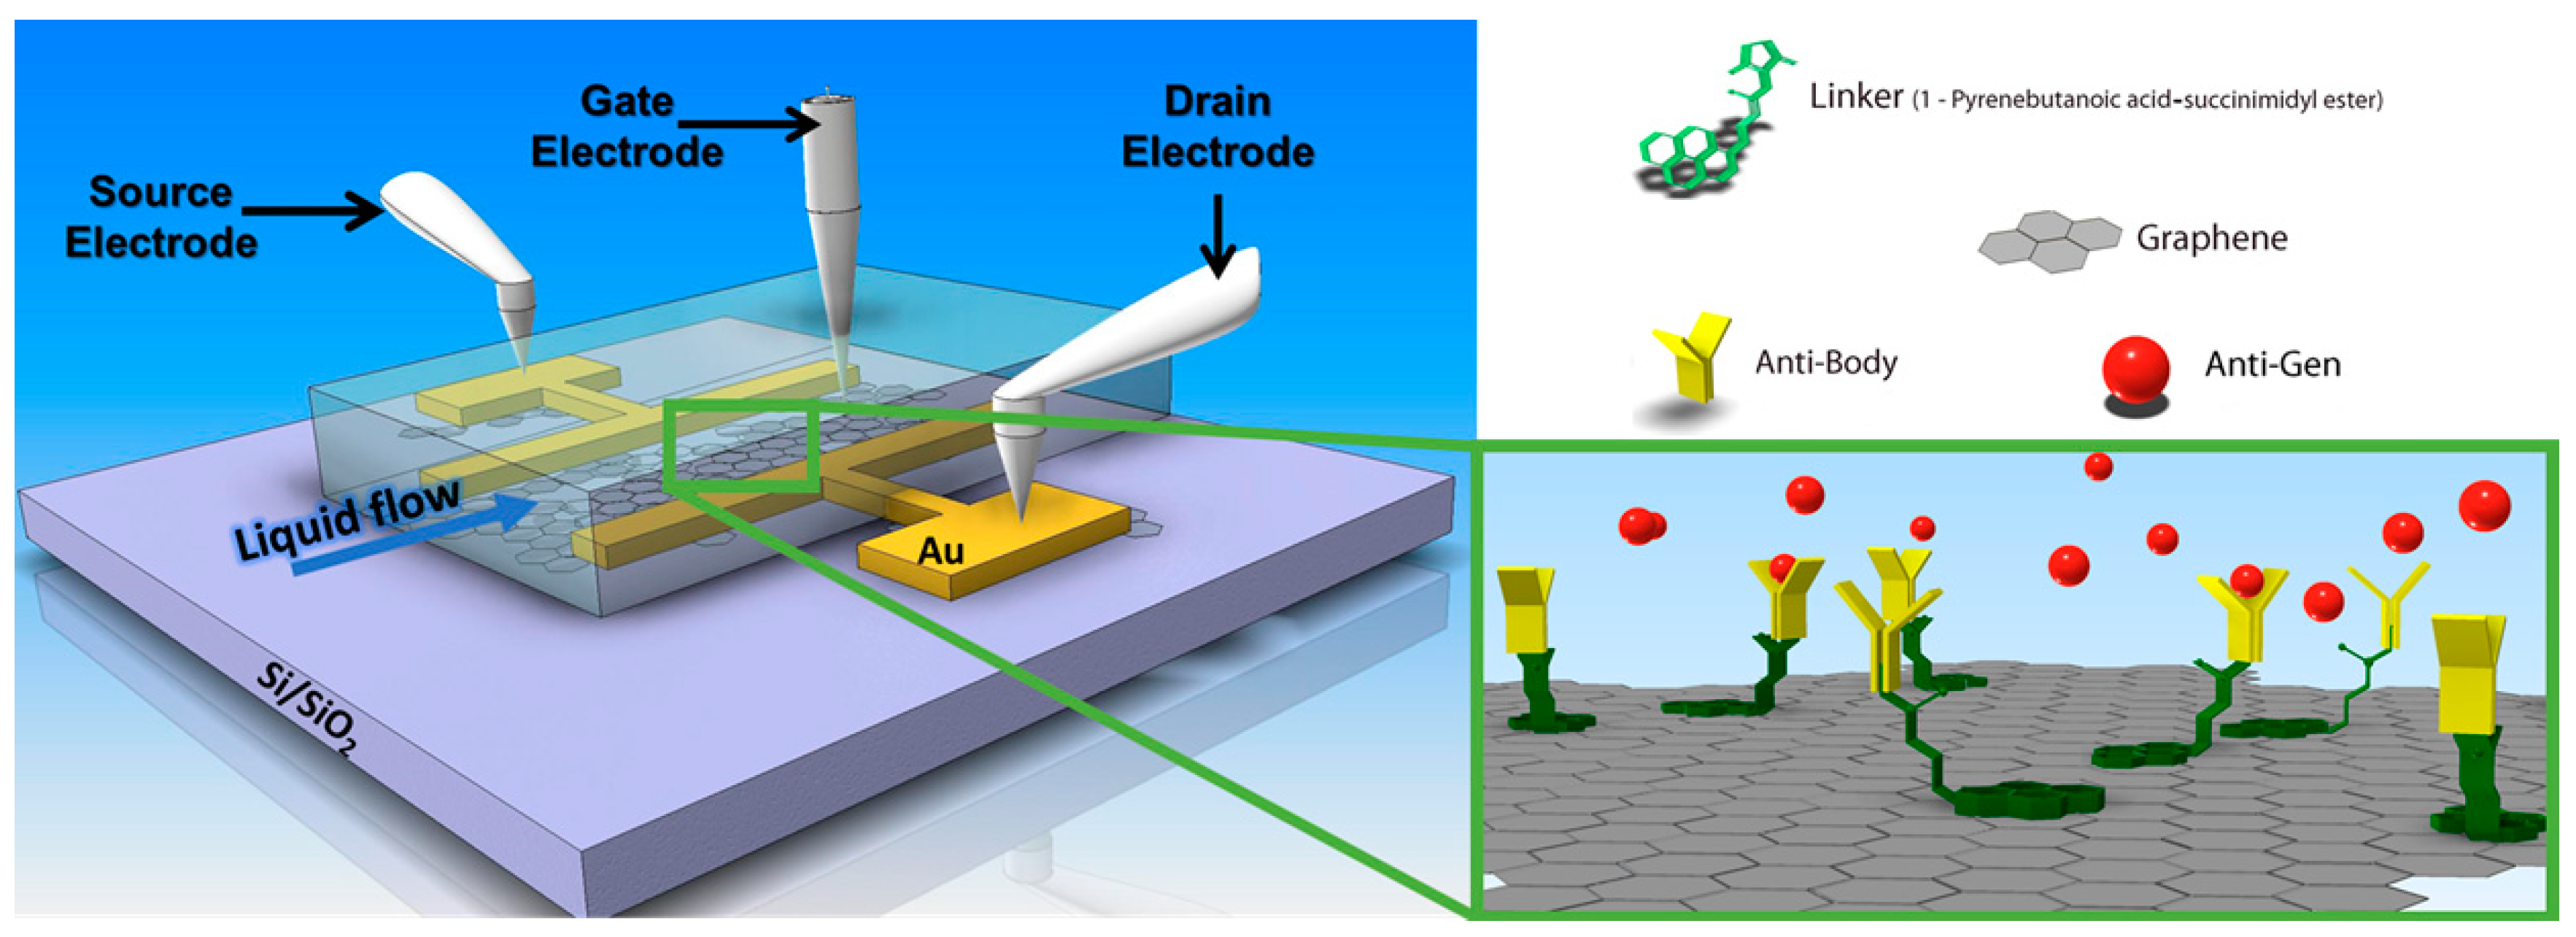
3.1. rGO Based Field Effect Transistors

Reduced graphene oxide field-effect transistors (rGOFET) fabrication was performed using previously demonstrated protocols [31], very schematically shown in Figure 8. The transistors are typically operated in the liquid-gate mode. Graphene oxide flakes were assembled and reduced on the gate substrate, followed by the surface functionalization by a linker monolayer, 1-pyrenebutanoic acid succinimidyl ester (PBSE), which is widely used for functionalization of carbon-based nanomaterials [32,33].
The operation mode of these field-effect transistor devices starts with the recording of the source-drain-current response to sweeps of the gate voltage, ISD versus VG scans, at variable conditions of the bulk solution, mostly in buffered electrolyte solutions with varying ligand concentrations. This results in a shift or a slightly modified slope of the cathodic branch of the ISD-VG curve [31]. This is attributed to a slight modification of the surface potential by different charge densities at the device-solution interface, or of the interfacial dipole layer, e.g., by slight reorientations of-helical structures in the receptor molecule resulting from ligand binding to available binding sites. By selecting a suitable gate voltage, the sensor signal is then typically the change of the channel current, ISD, in dependence of the analyte concentration for titration experiments, or as a function of time after injecting a sample with a different analyte concentration for kinetic data.

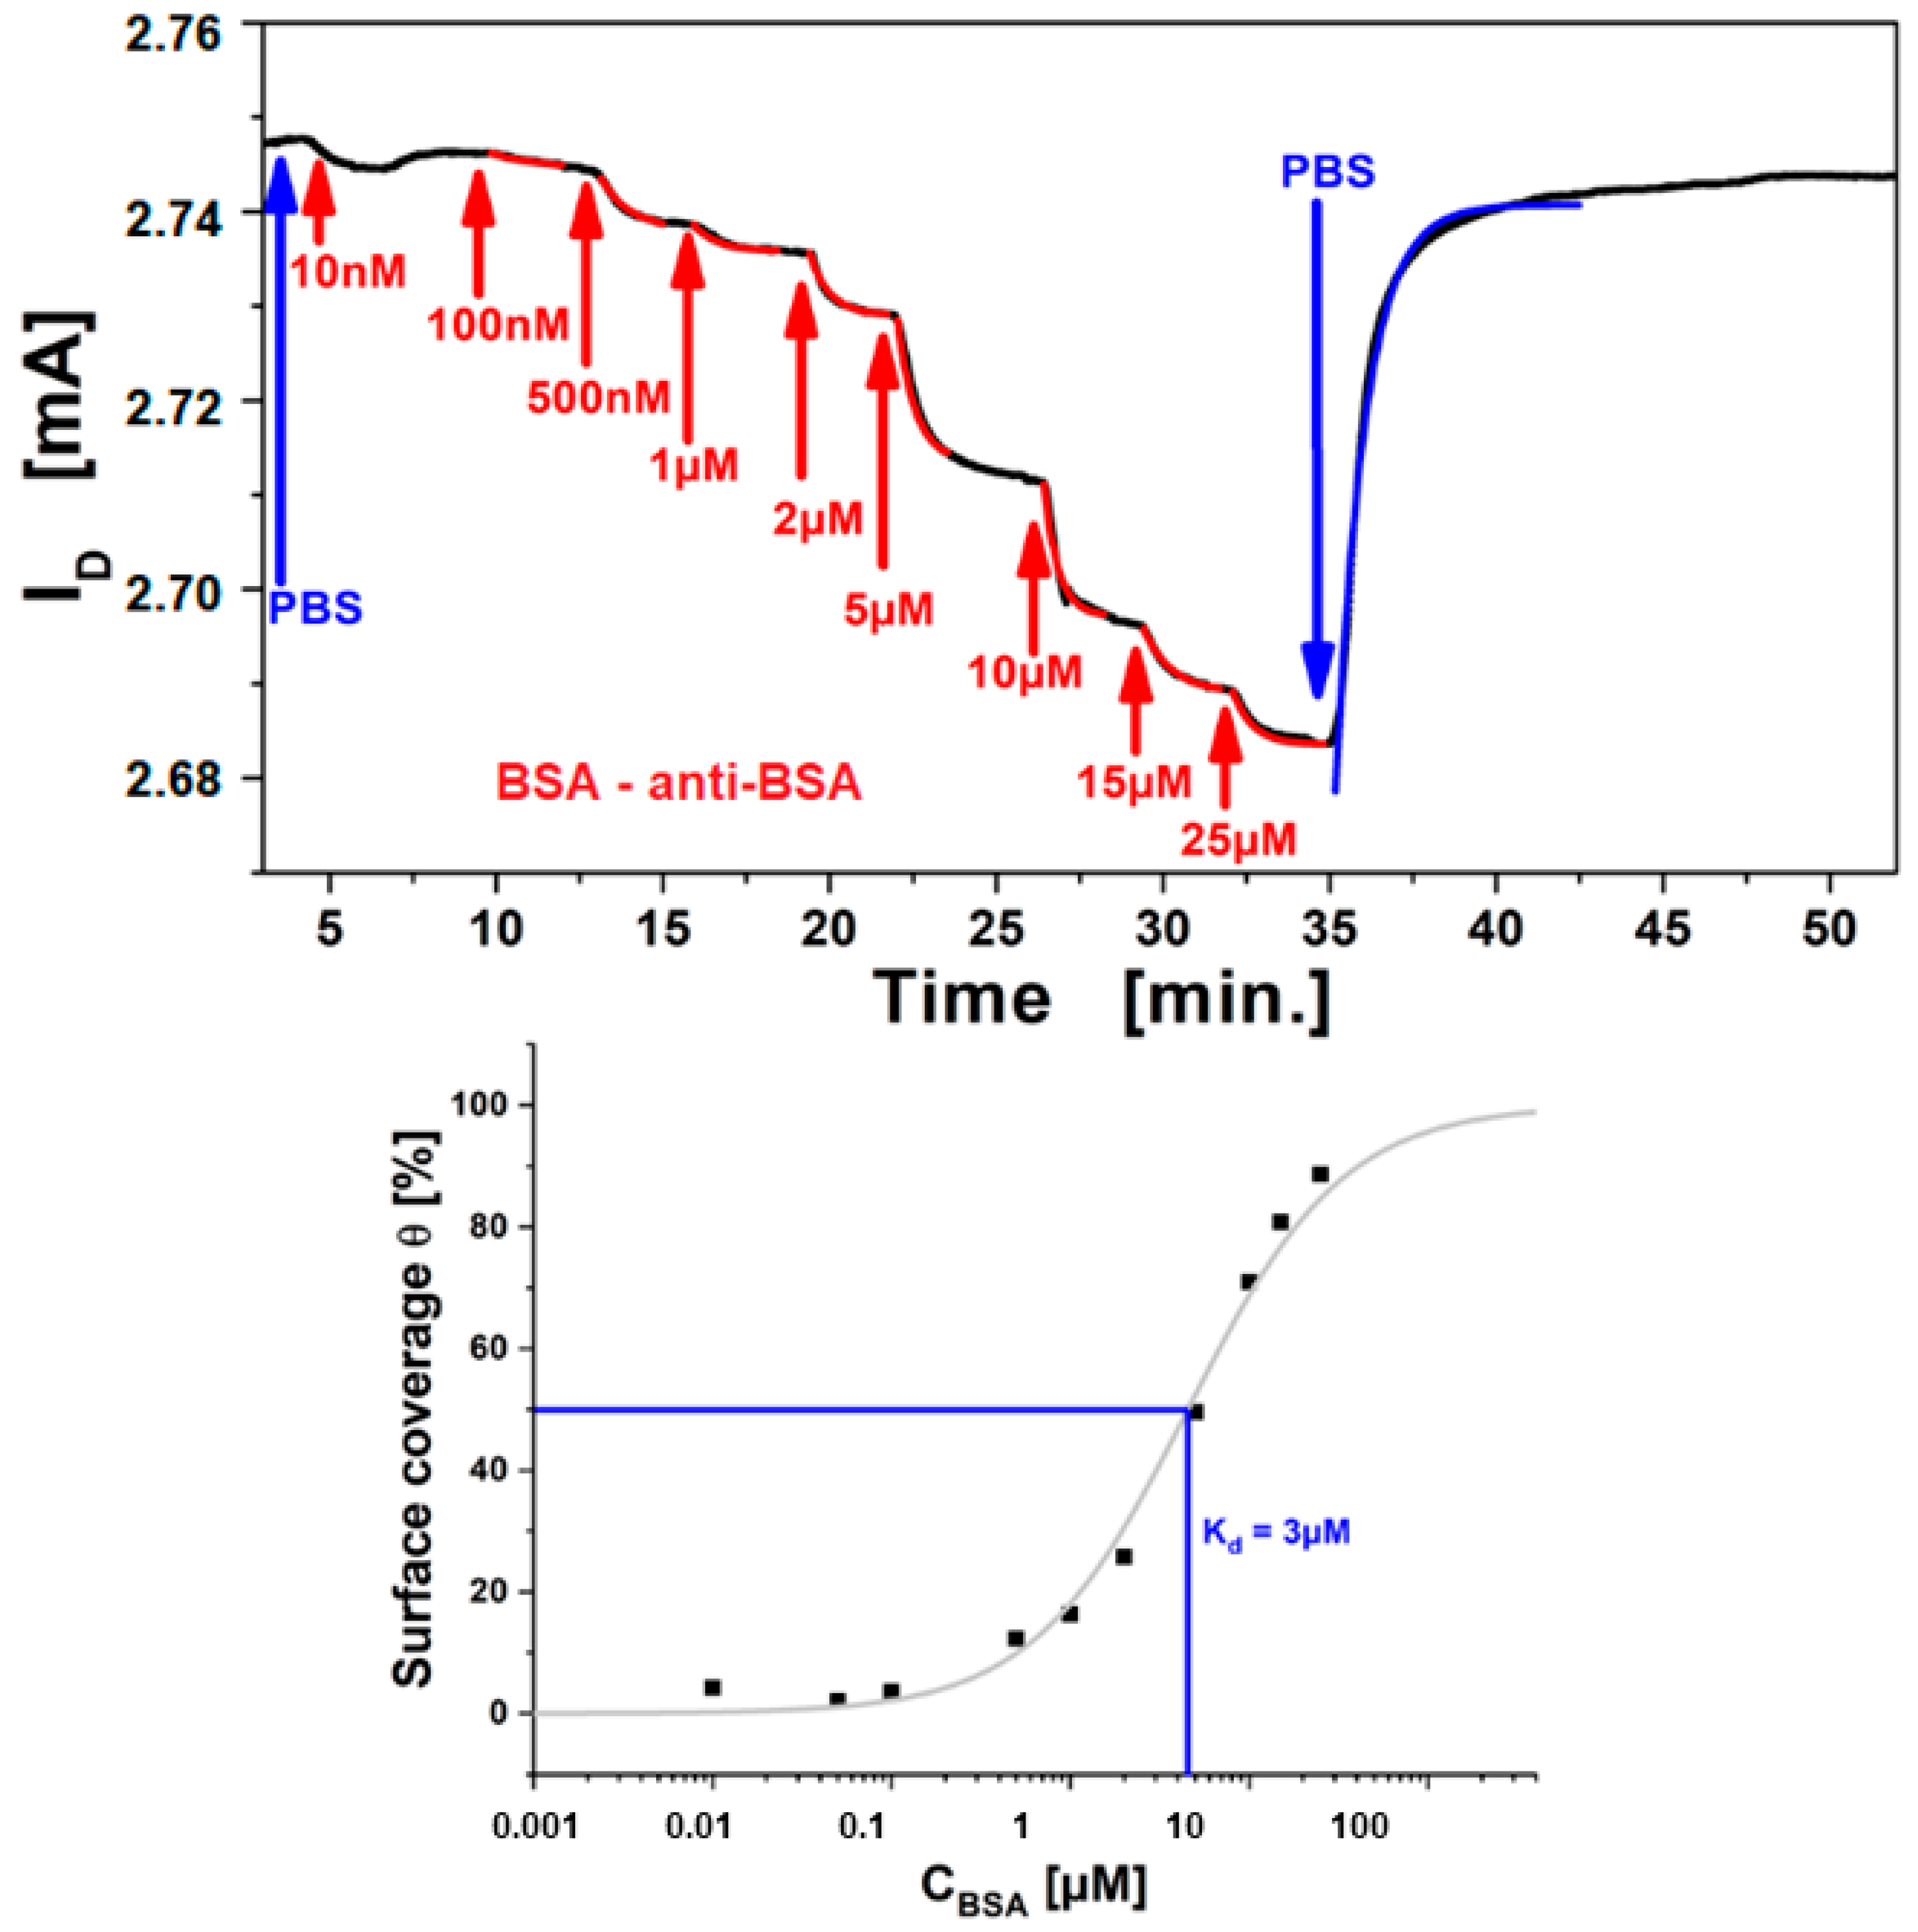
3.2. Immuno-Sensing of Antigens by rGO FETs

As an example, the operation of these rGO-FETs as biosensors is demonstrated testing a well benchmarked system, i.e., protein binding of bovine serum albumin (BSA) to its antibody, immobilized on the graphene channel [34]. A titration of the analyte (BSA), by stepwise increase of the analyte concentration and measurement of ΔISD in real-time is shown in Figure 9 top. For each increase in analyte concentration from c0 = 100 nM up to c0 = 25 µM the measured ISD decreases until saturation is reached gradually for the highest concentration. The kinetics of each concentration step were fitted with single exponential functions (cf. red curves shown Figure 9 top) and yielded the time constant, k, for each titration step. The time constant increases with higher bulk concentration. The obtained results are in accordance to the Langmuir model for a two-component interaction of analyte in the bulk (antigen) with the receptor (antibody) on the surface. Finally, the system was rinsed with pure buffer, and the sensor signal returns to the level before measurement, again with single exponential kinetics (cf. the blue fit curve) implying good reversibility of binding (which is necessary for the Langmuir model). The obtained exponent from this dissociation yields the dissociation rate constant, koff. According to the Langmuir model the relation from these binding constants is k = kon*c0 +koff, therefor a linear fit of the time constants against the titration concentration yields the association rate constant, kon as the slope, which is used to calculate the affinity constant, KA. The approach has been demonstrated and reported, measuring the affinity constant for BSA binding to its antibody of KA = 1.6 × 10⁵ M−1 [31], which is the equivalent to a dissociation constant value of Kd = 6.2 µM.
To test the consistency of the approach, a second evaluation using the current responses corresponding to the surface coverage towards the saturation concentration was performed and the resulting Langmuir isotherm plotted is shown by Figure 9 bottom. The signals were normalized to the saturation concentration and each intermediate titration step was assigned as the according equilibrium surface coverage fraction (i.e., ISD for each concentration after equilibrium is reached). These were plotted against the bulk analyte concentration, obtaining the Langmuir isotherm. The affinity constant should be the concentration at which 50% surface coverage is achieved or from plotting the surface coverage Θ for a given concentration, the affinity constant KA is obtained:
Θ = ISD (c0)/ISD (c) = KA c0/(1 + KA c0)
The surface coverage is plotted in Figure 9 bottom as a logarithmic function of the bulk analyte concentration, and the expected Langmuir isotherm shape is obtained. Data fitting (full red curve) with the Langmuir model yields an affinity constant KA = 3.3 × 10⁵ M−1, which can be expressed as the dissociation constant, or half saturation, Kd = 3 µM. Comparison of the result with the data from kinetic evaluation (Kd = 6.2 µM), shows good confirmation that the Langmuir model is suitable for quantitative description of the binding behavior of BSA to the antibody immobilized on the graphene channel. Moreover, this shows that electronic read-out of FET based sensors is a quantitative, label-free method for general biosensing purposes.

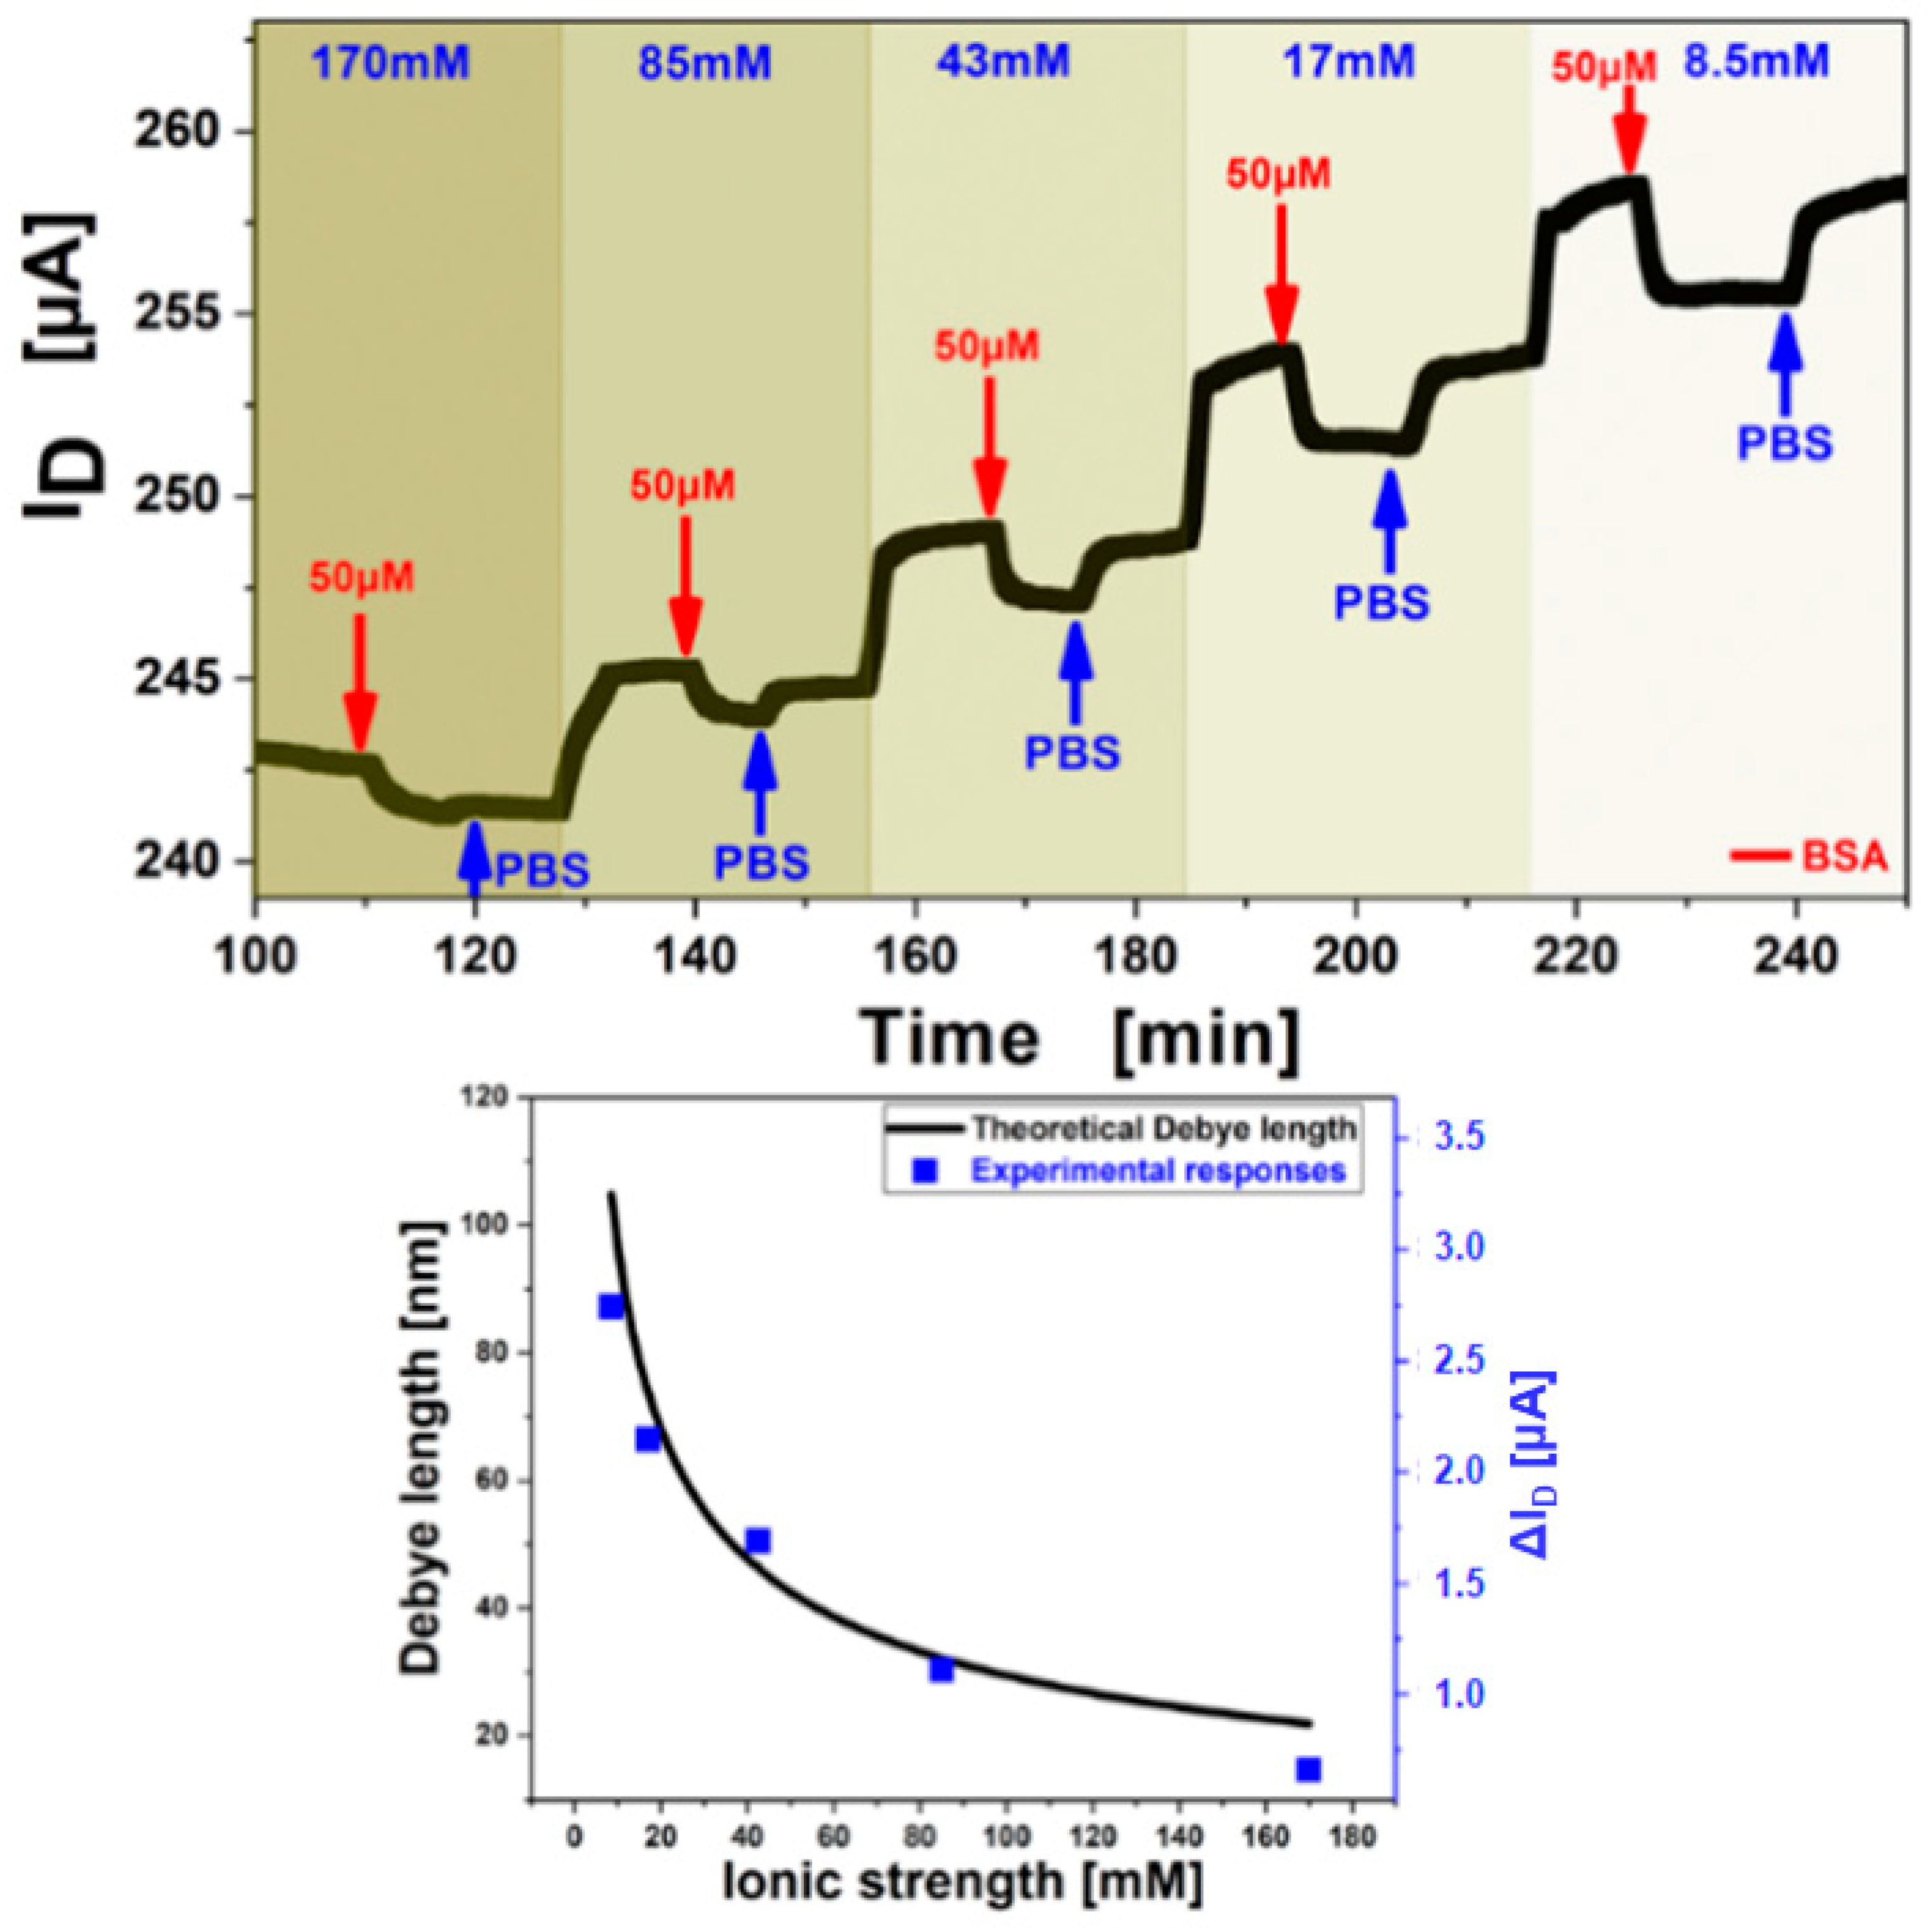
3.3. Debye Length Dependence

The detection of proteins by electronic biosensors is influenced by transduction-specific parameters, like Debye length change or the change of charge carrier mobility from coulombic or faradaic interaction with the electrolyte with dependence on its ionic strength [31].
The Debye length increases for lower ion concentrations of the electrolyte [34], on the other hand, the electron mobility of the semiconductor and the double layer capacitance increase at the same time, thus a stronger response signal of the FET is obtained when detecting BSA at low electrolyte ion concentrations (cf. Figure 10 top). Demonstration of this influence on the detection signal was performed by adjusting the buffer pH to 7.4, sufficiently above the isoelectric point of BSA (pH 5.4) to ensure positive charge of the analyte molecules which should lead to a negative response signal of the FET channel current. A quantitative evaluation of the Debye length influence on the sensing sensitivity was shown experimentally. The experiment was conducted by variation of the PBS buffer ionic strength at constant pH, establishing a baseline for each ionic strength concentration, followed by injection of a 50 µM BSA in the same buffer and rinsing with the pure buffer before switching to the next ionic strength. As the double layer capacitance of the graphene-liquid interface and the charge carrier density of the graphene change with decreasing ionic strength an increase of the Source-Drain current was observed with lower ion concentrations (Figure 10 top). The charge carrier mobility decreased with lower ionic strength but an increase in the gate insulator capacitance had a bigger influence resulting in a higher measured current when gate voltages close to the Dirac Point (minimum in ISD-VG, Vi) were applied. However, the effect of charge mobility increases when higher gate voltages (bigger difference to Vi) are applied and then outweighs the effect from changing capacitance leading to a total current increase with increasing electrolyte ion strength. The obtained responses from Figure 10 top were superimposed with theoretical data, calculated directly from the Debye-length theory and are shown in Figure 10 bottom. The Debye length was calculated in dependency on the ionic strength and a variable capacitance. Good agreement was found for this theoretical model with experimental results of 50 µM BSA injections and the dependence was found to be correlated by a factor of 28.6 m/A [31].

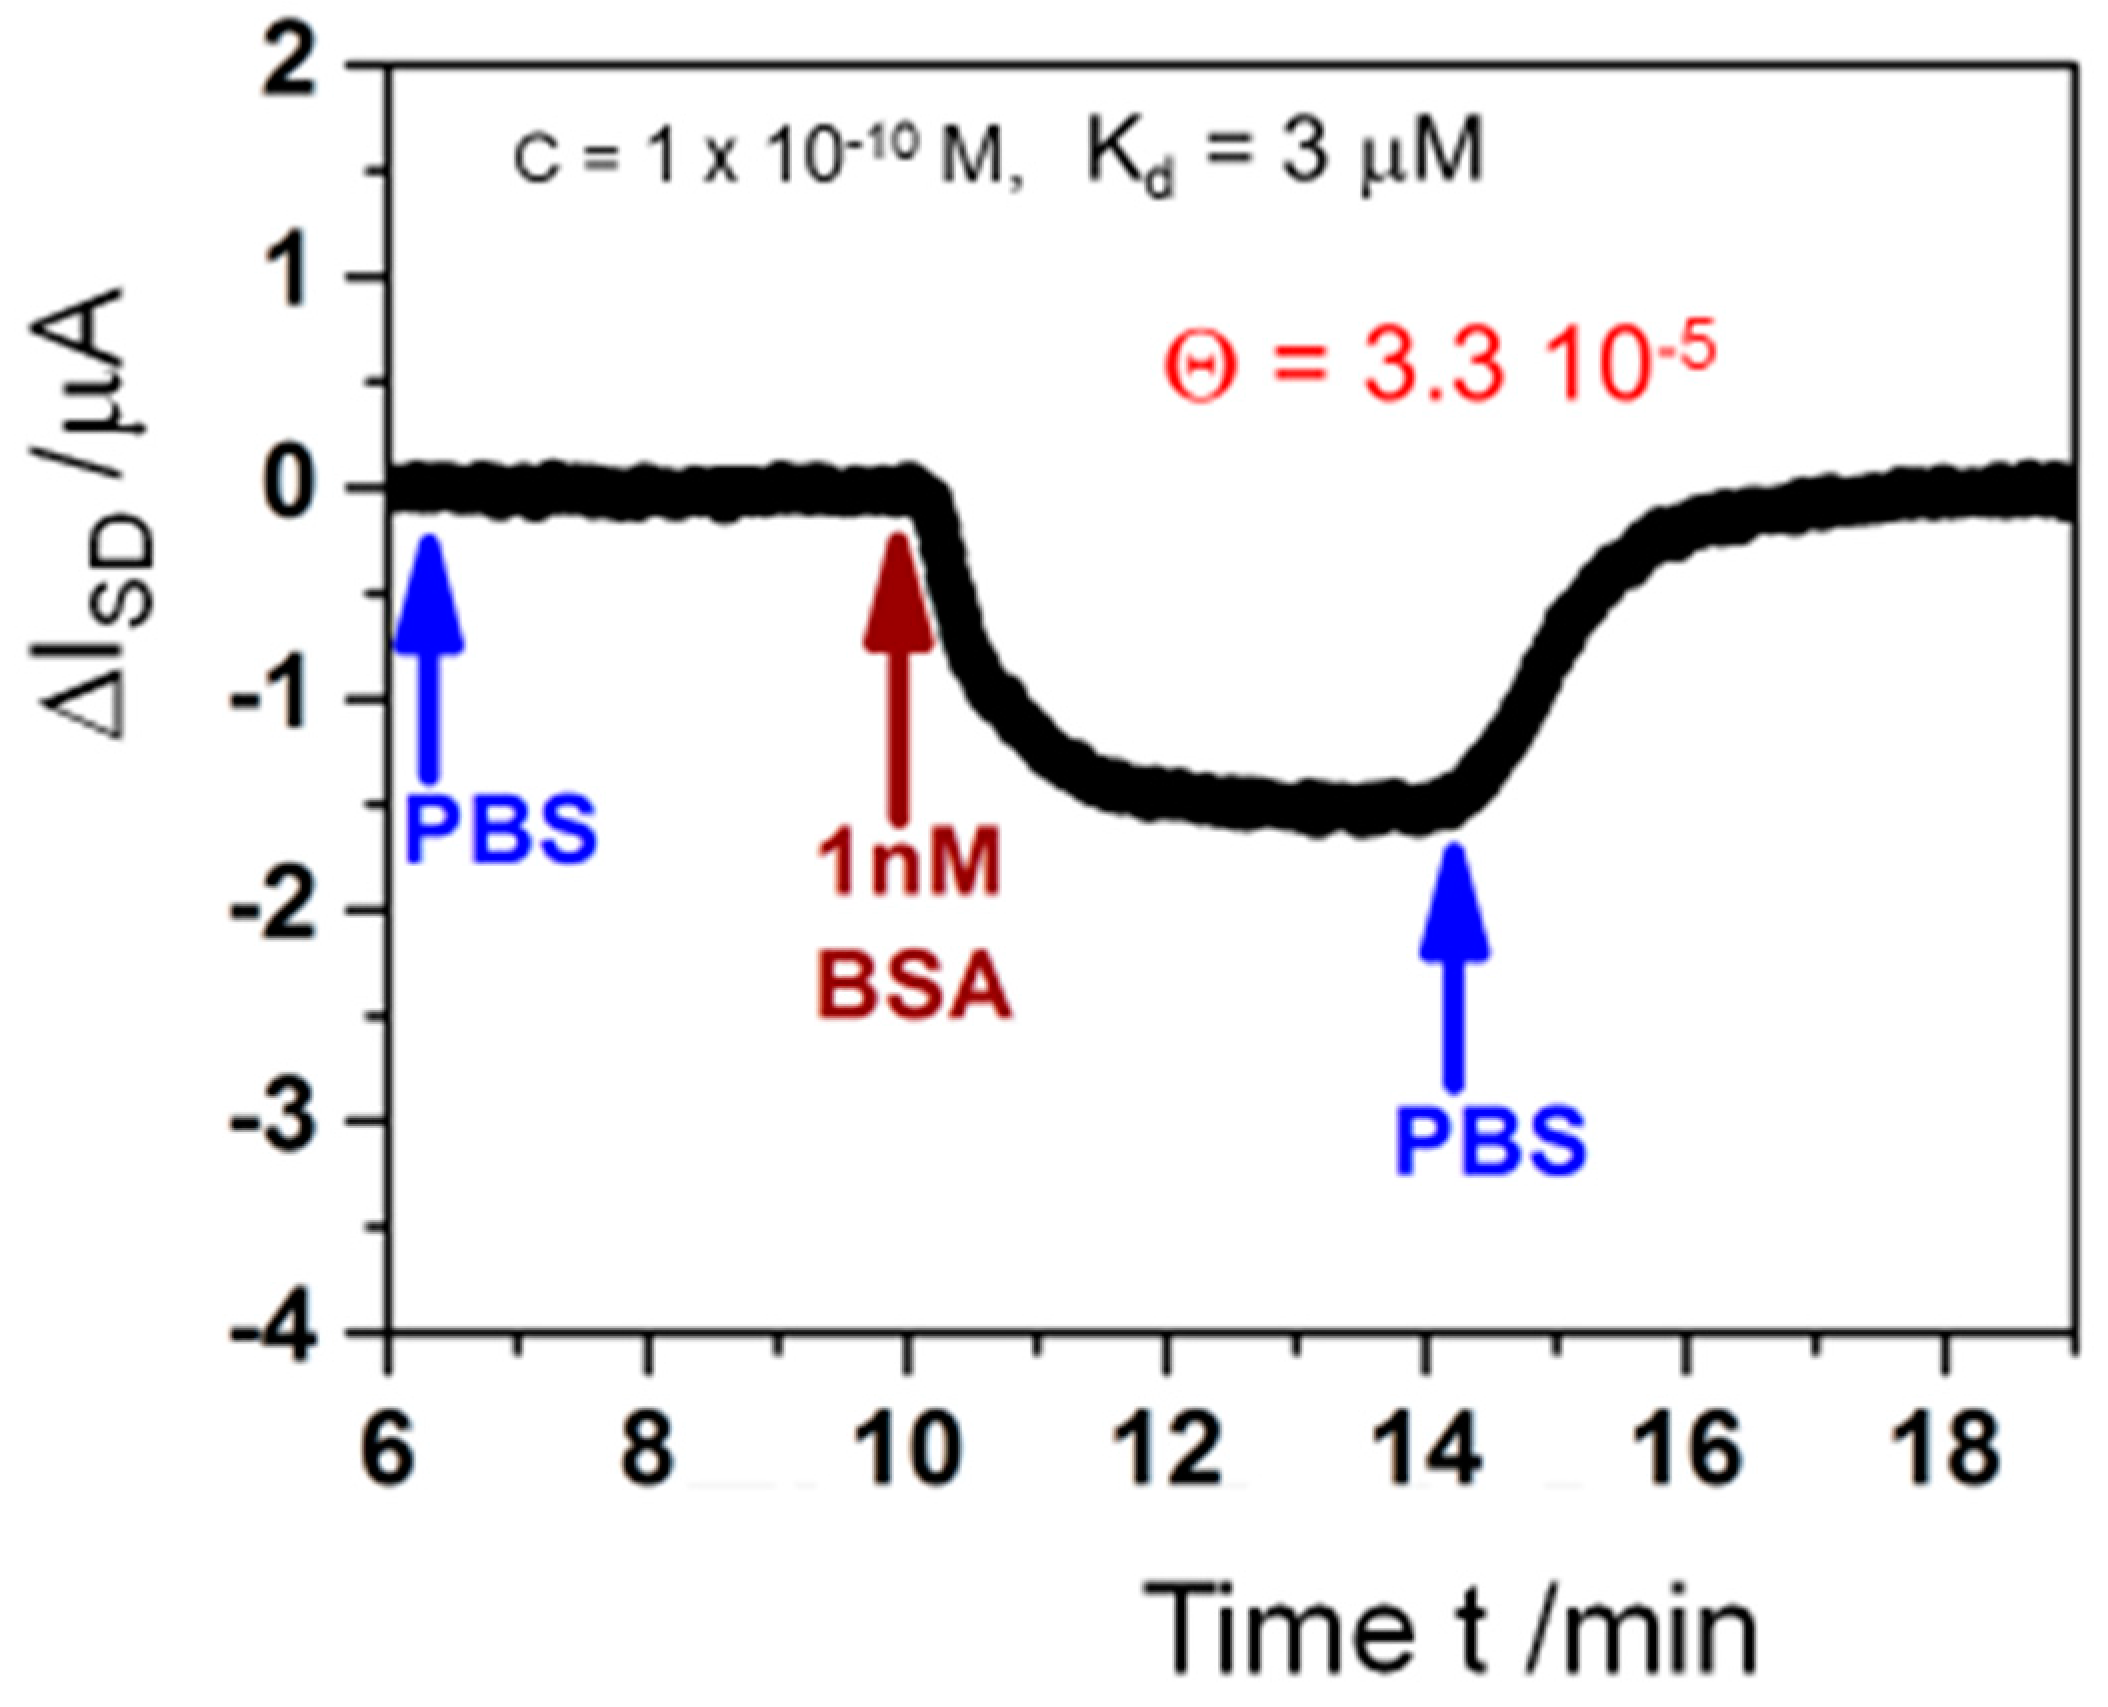
3.4. Limit of Detection in Electronic Bio-Sensing

Naturally, the limit of detection for antigen-antibody interactions that can be achieved with this electronic biosensor is of interest. Accordingly, we measured the real-time current change resulting from 1 nM BSA injection in PBS buffer after a baseline was established with pure PBS buffer and rinse with the same buffer solution after BSA binding reached saturation level (Figure 11). Also, for such low concentrations, the signal to-noise-ratio is superb and ΔISD can be monitored smoothly. Estimating from this measurement via regression, the LOD for the analyte should be in the 100 pM concentration range. Applying the Langmuir model [35] from Equation (1) to this finding, with c0 << 1/KA, at such low concentration the surface coverage can be calculated by:
Θ = KA c0
using the obtained results from above for KA = 3.3 × 10⁵ M−1, and c0 = 100 pM, resulting in a surface coverage of bound analyte Θ = 3.3 × 10⁻⁵. This means that the interfacial surface potential change resulting from one molecule of analyte binding to only 1 out of 30,000 antibodies immobilized on the graphene is sufficient to result in a measurable and quantifiable current read-out signal change.

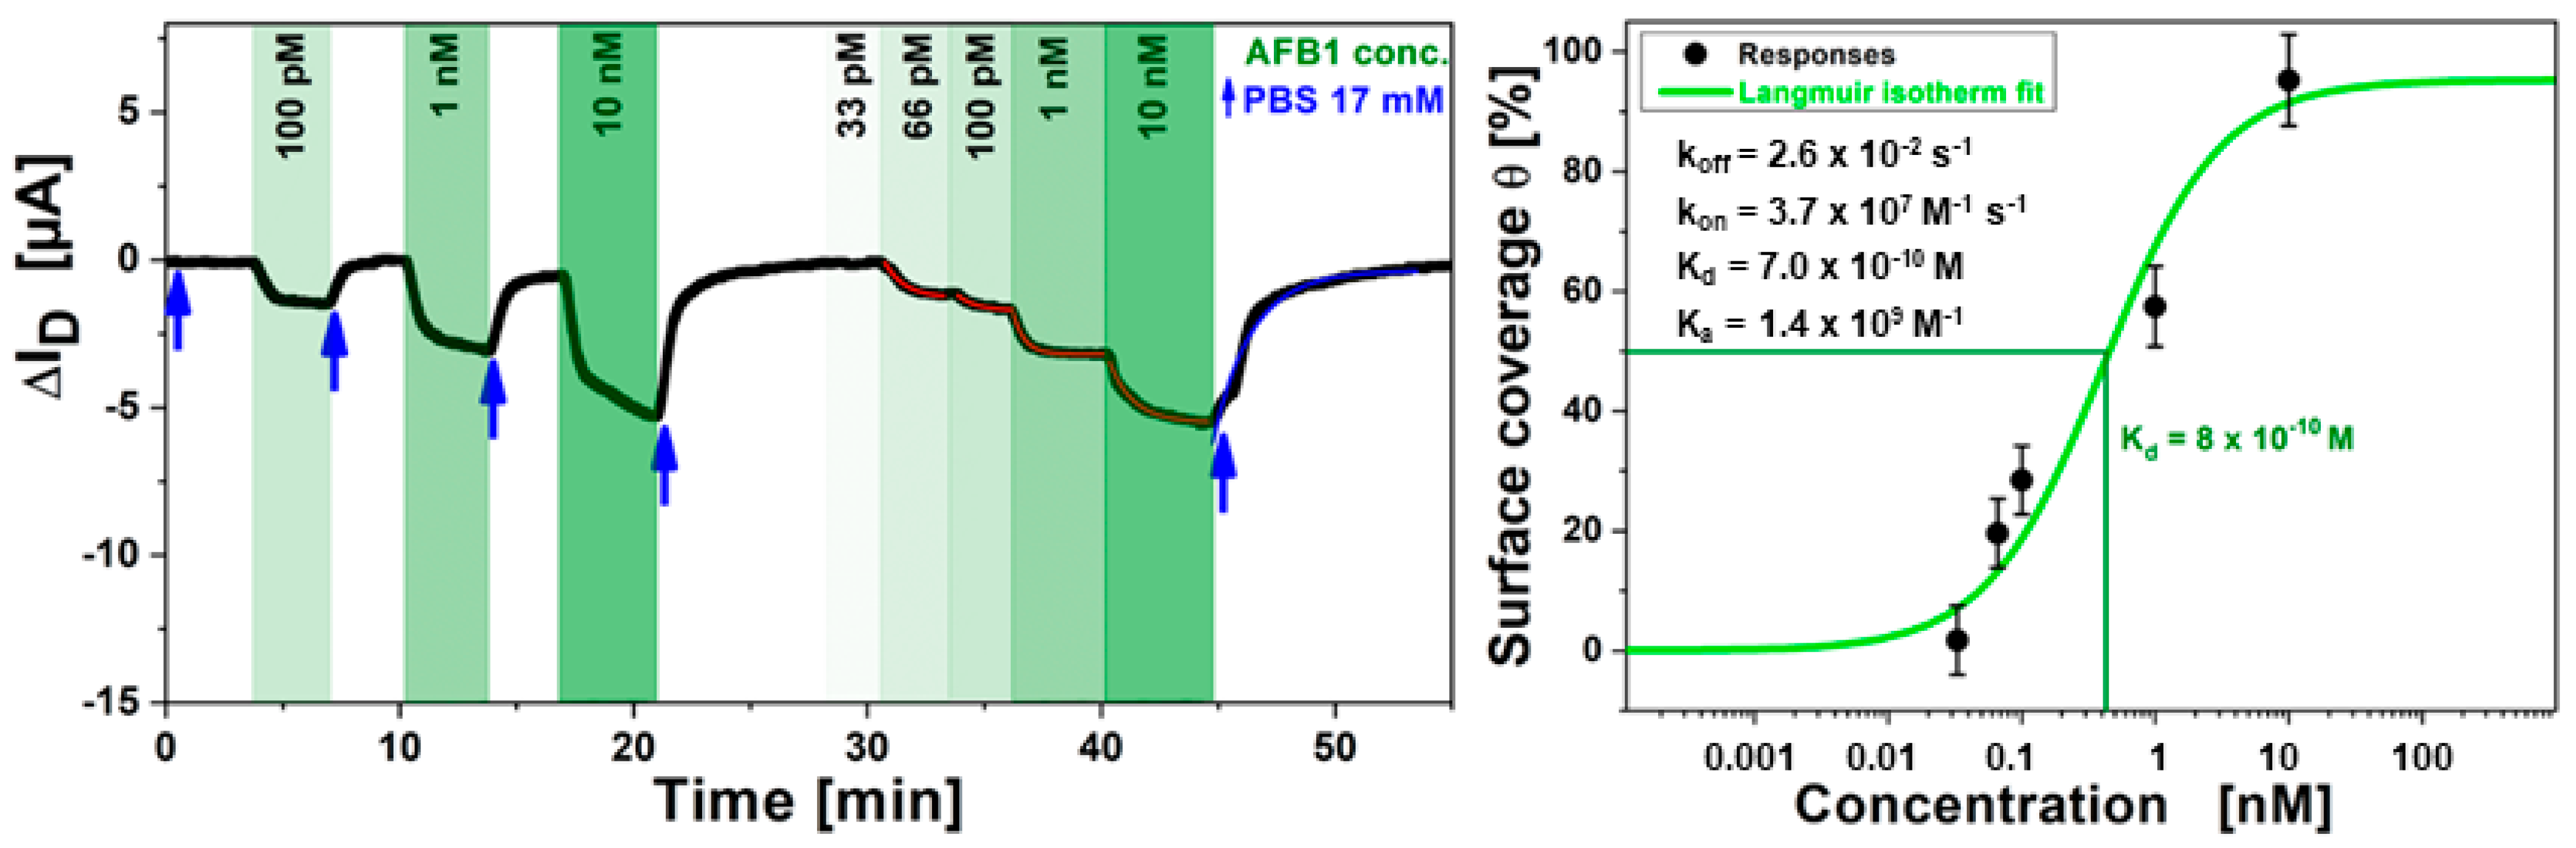
3.5. Small Analyte Detection by Antibodies

Finally, we want to discuss the detection of food pathogens, particularly aflatoxins, by their respective antibodies. This group of mycotoxins is produced predominantly by Aspergillus parasiticus and Aspergillus flavus which materialize in a wide range of agricultural products. The hydroxylated metabolite of aflatoxin B1 (AFB1) is called aflatoxin M1 (AFM1) and is found in milk, organs, blood and urine of animals which have ingested feed contaminated with AFB1 [36]. These toxins are hepatotoxic and carcinogenic [37] with high resistance against thermal treatments like pasteurization, therefore control measurements for food safety are established. As an example, the European Commission has established 50 pg·mL−1 as the maximum allowable level of AFM1 in milk [38].
Comparing the electronic read-out method presented to an optical displacement assay [39] several advantages can be found: (i) real-time binding of the analyte is possible and only limited by diffusion which makes the method faster in comparison; (ii) kinetic information of the binding is obtained directly enabling measurement of the association and dissociation constants; (iii) less processing steps, since no secondary antibodies are used; (iv) no bulky detection instrumentation is needed for electronic read-out and the used devices are based on “plastic electronics” and are cheaper and disposable.
As a first step we measured the non-specific binding of aflatoxin to bare rGO and found that non-specific binding was totally suppressed for rGO surfaces which were funtionalized with an antibody that is specific for a totally different analyte (BSA in this case). For such surfaces, rinsing of even high concentrations of AFB1 through the flow cell did not result in any response in the source-drain current, ΔISD.
Judging from Figure 12 left, the issue of sensitivity and specific binding of AFB1 to the antibody can be evaluated. For the shown measurement, the AFB1 monoclonal antibody was immobilized directly on the rGO gate of the transistor. Different concentrations of AFB1 analyte were injected in the flow cell (as indicated by the green arrows in Figure 12 left) and were alternated with injections of only PBS buffer (blue arrows). This caused a direct sensor response (source-drain current change, ΔISD) of the FET. The sensor responses of ISD change were obtained in a good signal-to-noise ratio, also for very low analyte concentrations in the picomolar range. Similar sensitivity resolution is achieved by the much more demanding optical approach of surface-plasmonics reported earlier [39].
By plotting the ISD values from A against the toxin concentration in solution and fitting the data to a Langmuir model one obtains for the half saturation concentration of the immune sensing system c1/2 = Kd = 800 pM.

4. Conclusions

The race in biomedical diagnostics between optical detection principles (UV/Vis absorption, fluorescence, surface plasmon spectroscopy, etc.) and electrical/electro-chemical/electronic concepts is not decided yet. Both approaches continue to offer solutions for fast, multiplexed, simple and cheap detection of oligonucleotides, PCR amplicons, genomic DNA (fragments), proteins, peptides, exosomes, organelles, etc.
If it comes to the detection of small (low mass) analytes and/or if the achievable analyte binding density at the transducer surface is low, label-free optical detection schemes have a problem because the change in the optical interfacial architecture induced by the mere binding of the analyte may be simply too minute to be detected—a classical challenge even in commercial instruments like the Biacore SPR setups [16]. In some cases the use of labelling techniques employing fluorescent chromophores [3], quantum dots [40], Au Nanoparticles [41], or magnetic beads [42] may help; however, in many cases the labelling of the analyte is not an option or undesirable, or the (small) size of the analyte molecule simply prevents the attachment of a suitable label, e.g., for hormones, odorants [43], or food pathogens like mycotoxins.
Here, the use of electrochemical and electronic detection principles, based, e.g., on the use of transistor devices offer an attractive alternative, in particular, if the analyte is charged as it the case for DNA oligonucleotides no matter how short they are, or for peptides and proteins. This has been demonstrated convincingly in many examples reported in the literature [44]. With the introduction of graphene as the semiconducting material used for the fabrication of the gate of a transistor [33] the electronic read-out concept became even more attractive.
This will be complemented by the development of artificial receptors, e.g., aptamers [45], affimers [46] or seligos [47]. Affinity-diagnostics with graphene FETs functionalized by these synthetic immuno-receptors for proteins but also for the detection of small analytes are just at the beginning of a very dynamic development in biosensing. All these electronic biosensing platforms are highly sensitive, label-free, disposable and cheap, with signals that are easy to analyze and interpret, suitable for multiplexed operation and for remote control, compatible with NFC technology, etc., in many cases a clear and promising alternative to optical sensors.
A completely new route for affinity sensing was recently opened by demonstrating the combination mode of surface-plasmon optical and electronic read-out schemes: the planar Au substrate used for the SPR monitoring of the changes of the interfacial multilayer architecture build by the layer-by-layer protocol for polyelectrolytes, at the same time was used as the gate electrode in an EGO-FET set-up (cf. Figure 13). This allowed for the parallel monitoring of surface reactions in real-time by combined SPR and FET interrogation [48]. With the current interest in developing a better understanding of the basic physical mechanisms operation for the various versions of optical and electronic bio-sensing it is hoped that this dual-sensing will lead to deeper insights into the fundamentals of the involved bio-affinity reactions but will also lead to even better performance of the resulting practical immuno-sensing devices.

Author Contributions

Conceptualization, W.K., J.L., F.Y., L.N., C.R.-R. and I.K.; methodology, W.K., F.Y., I.K.; validation, W.K., J.L., F.Y., L.N., C.R.-R. and I.K.; formal analysis, J.L., F.Y., L.N., C.R.-R. and I.K.; investigation, J.L., F.Y., L.N. and C.R.-R.; resources, W.K.; writing—original draft preparation, W.K., J.L., F.Y., L.N., C.R.-R. and I.K.; writing—review and editing, W.K., J.L., F.Y., L.N., C.R.-R. and I.K.; visualization, J.L., F.Y., L.N. and C.R.-R.; supervision, W.K. and I.K.; project administration, W.K.; funding acquisition, W.K. All authors have read and agreed to the published version of the manuscript.

Funding

Partial support for this work was provided by the European Science Foundation (ESF), Grant Number 10-EuroBioSAS-FP-005, the Austrian Science Fund (FWF) (I681-N24), the Comet Program from the governments of Lower and Upper Austria, the Austrian Federal Ministry for Transportation, Innovation and Technology (GZBMVIT-612.166/0001-III/I1/2010).

Institutional Review Board Statement

Not applicable.

Informed Consent Statement

Not applicable.

Data Availability Statement

Data available on request from the authors.

Acknowledgments

We are grateful for helpful discussions with Jakub Dostalek, Fang Yu, Johannes Bintinger, Patrik Aspermair, and Ulrich Ramach.

Conflicts of Interest

The authors declare no conflict of interest.

References

  1. Glossary, National Agricultural Library. Available online: https://agclass.nal.usda.gov/mtwdk.exe?k=glossary&l=60&w=7776&s=5&t=2 (accessed on 1 November 2020).
  2. Knoll, W. Interfaces and Thin Films as Seen by Bound Electromagnetic Waves. Ann. Rev. Phys. Chem. 1998, 49, 569–638. [Google Scholar] [CrossRef] [PubMed] [Green Version]
  3. Liebermann, T.; Knoll, W. Surface-Plasmon Field-Enhanced Fluorescence Spectroscopy. Colloids Surf. A 2000, 171, 115–130. [Google Scholar] [CrossRef]
  4. Zong, Y.; Xu, F.; Su, X.D.; Knoll, W. Quartz crystal microbalance with integrated surface plasmon grating coupler. Anal. Chem. 2008, 80, 5246–5250. [Google Scholar] [CrossRef] [PubMed]
  5. Jain, P.K.; Huang, W.; El-sayed, M.A. On the Universal Scaling Behavior of the Distance Decay of Plasmon Coupling in Metal Nanoparticle Pairs: A Plasmon Ruler Equation. Nano Lett. 2007, 7, 2080–2088. [Google Scholar] [CrossRef]
  6. Kuhn, H. Classical Aspects of Energy Transfer in Molecular Systems. J. Chem. Phys. 1970, 53, 101–108. [Google Scholar] [CrossRef]
  7. Berger, P.; Sturgeon, C.; Bidart, J.M.; Paus, E.; Gerth, R.; Niang, M.; Bristow, A.; Birken, S.; Stenman, U.H. The ISOBM TD-7 workshop on hCG and related molecules—Towards user-oriented standardization of pregnancy and tumor diagnosis: Assignment of epitopes to the three-dimensional structure of diagnostically and commercially relevant monoclonal antibodies directed against human chorionic gonadotropin and derivatives. Tumor Biol. 2002, 23, 1–38. [Google Scholar]
  8. Fotinou, C.; Beauchamp, J.; Emsley, P.; de Haan, A.; Schielen, W.J.; Bos, E.; Isaacs, N.W. Structure of an Fab fragment against a C-terminal peptide of hCG at 2.0 Angstrom resolution. J. Biol. Chem. 1998, 273, 22515–22518. [Google Scholar] [CrossRef] [PubMed] [Green Version]
  9. Ko, J.K.Y.; Cheung, V.Y.T. Time to Revisit the Human Chorionic Gonadotropin Discriminatory Level in the Management of Pregnancy of Unknown Location. J. Ultrasound Med. 2014, 33, 465–471. [Google Scholar] [CrossRef]
  10. Jena, S.C.; Shrivastava, S.; Saxena, S.; Kumar, N.; Maiti, S.K.; Mishra, B.P.; Singh, R.K. Surface plasmon resonance immunosensor for label-free detection of BIRC5 biomarker in spontaneously occurring canine mammary tumours. Sci. Rep. 2019, 9, 13485. [Google Scholar] [CrossRef] [Green Version]
  11. Spinke, J.; Liley, M.; Guder, H.J.; Angermaier, L.; Knoll, W. Molecular Recognition at Self—Assembled Monolayers—The Construction of Multicomponent Multilayers. Langmuir 1993, 9, 1821–1825. [Google Scholar] [CrossRef]
  12. Yu, F.; Persson, B.; Lofas, S.; Knoll, W. Attomolar sensitivity in bioassays based on surface plasmon fluorescence spectroscopy. J. Am. Chem. Soc. 2004, 126, 8902–8903. [Google Scholar] [CrossRef] [PubMed]
  13. Wilchek, M.; Bayer, E.A. Foreword and introduction to the book (strept)avidin-biotin system. Biomol. Eng. 1999, 16, 1–4. [Google Scholar] [PubMed]
  14. Spinke, J.; Liley, M.; Schmitt, F.-J.; Guder, H.-J.; Angermaier, L.; Knoll, W. Molecular Recognition at Self-Assembled Monolayers—Optimization of Surface Functionalization. J. Chem. Phys. 1993, 99, 7012–7019. [Google Scholar] [CrossRef]
  15. Grabbe, E.S. Total Internal-Reflection Fluorescence with Energy-Transfer—A Method for Analyzing IgG Adsorption on Nylon Thin-Films. Langmuir 1993, 9, 1574–1581. [Google Scholar] [CrossRef]
  16. Liu, J. Systematic Studies of Protein Immobilization by Surface Plasmon Field-Enhanced Fluorescence Spectroscopy. Ph.D. Thesis, University of Mainz, Mainz, Germany, 2005. [Google Scholar]
  17. Available online: https://www.biacore.com/lifesciences/index.html (accessed on 1 November 2020).
  18. Robertson, J.L. The lipid bilayer membrane and its protein constituents. J. Gen. Physiol. 2018, 150, 1472–1483. [Google Scholar] [CrossRef] [PubMed] [Green Version]
  19. Andersson, J.; Knoll, W. Tethered Lipid Membranes as Platforms for Biophysical Studies and Advanced Biosensors. In Biomimetic Lipid Membranes: Fundamentals, Applications, and Commercialization; Springer: Cham, Germany, 2019; pp. 183–191. [Google Scholar]
  20. Jackman, J.A.; Knoll, W.; Cho, N.J. Biotechnology applications of tethered lipid bilayer membranes. Materials 2012, 5, 2637–2657. [Google Scholar] [CrossRef] [Green Version]
  21. Niu, L.; Wohland, T.; Knoll, W.; Köper, I. Interaction of a synthetic antimicrobial peptide with a model bilayer platform mimicking bacterial membranes. Biointerphases 2017, 12, 04E404. [Google Scholar] [CrossRef]
  22. Felix, F.S.; Angnes, L. Electrochemical immunosensors—A powerful tool for analytical applications. Biosens. Bioelectron. 2018, 102, 470–478. [Google Scholar] [CrossRef]
  23. Wei, S.; Xiao, H.; Cao, L.; Chen, Z. A Label-Free Immunosensor Based on Graphene Oxide/Fe3O4/Prussian Blue Nanocomposites for the Electrochemical Determination of HBsAg. Biosensors 2020, 10, 24. [Google Scholar] [CrossRef] [Green Version]
  24. De Moraes, A.C.M.; Kubota, L.T. Recent Trends in Field-Effect Transistors-Based Immunosensors. Chemosensors 2016, 4, 20. [Google Scholar] [CrossRef] [Green Version]
  25. MAgliolo, M.; De Tullio, D.; Vikholm-Lundin, I.; Albers, W.M.; Munter, T.; Manoli, K.; Palazzo, G.; Torsi, L. Label-free C-reactive protein electronic detection with an electrolyte-gated organic field-effect transistor-based immunosensor. Anal. Bioanal. Chem. 2016, 408, 3943–3952. [Google Scholar] [CrossRef]
  26. Khan, H.U.; Jang, J.; Kim, J.-J.; Knoll, W. In Situ Antibody Detection and Charge Discrimination Using Aqueous Stable Pentacene Transistor Biosensors. J. Am. Chem. Soc. 2011, 133, 2170–2176. [Google Scholar] [CrossRef]
  27. Roberts, M.E.; Mannsfeld, S.C.B.; Queralto, N.; Reese, C.; Locklin, C.; Knoll, W.; Bao, Z.N. Water-stable organic transistors and their application in chemical and biological sensors. Proc. Natl. Acad. Sci. USA 2008, 105, 12134–12139. [Google Scholar] [CrossRef] [PubMed] [Green Version]
  28. Wan, X.; Huang, Y.; Chen, Y. Focussing on Energy and Optoelectronic Applications: A Journey for Graphene and Graphene Oxide at Large Scale. Acc. Chem. Res. 2012, 45, 598–607. [Google Scholar] [CrossRef] [PubMed]
  29. Zhan, B.; Li, C.; Yang, J.; Jenkins, G.; Huang, W.; Dong, X. Graphene Field-Effect Transistor and its Application for Electronic Sensing. Small 2014, 10, 4042–40065. [Google Scholar] [CrossRef] [PubMed]
  30. Larisika, M.; Huang, J.F.; Tok, A.; Knoll, W.; Nowak, C. An improved synthesis route to graphene for molecular sensor applications. Mater. Chem. Phys. 2012, 136, 304–308. [Google Scholar] [CrossRef]
  31. Rozman, C.; Larisika, M.; Nowak, C.; Knoll, W. Graphene-Based Liquid-Gated Field Effect Transistor for Biosensing: Theory and Experiments. Biosens. Bioelectron. 2015, 70, 21–27. [Google Scholar] [CrossRef] [Green Version]
  32. Kodali, V.K.; Scrimgeour, J.; Kim, S.; Hankinson, J.H.; Carroll, K.M.; de Heer, W.A.; Berger, C.; Curtis, J.E. Nonperturbative chemical modification of graphene for protein micropatterning. Langmuir 2011, 27, 863–865. [Google Scholar] [CrossRef] [Green Version]
  33. Larisika, M.; Kotlowski, C.; Steininger, C.; Mastrogiacomo, R.; Pelosi, P.; Schütz, S.; Peteu, S.F.; Kleber, C.; Reiner-Rozman, C.; Nowak, C.; et al. Electronic olfactory sensor based on A. mellifera odorant-binding protein 14 on a reduced graphene oxide field-effect transistor. Angew. Chem. Int. Ed. 2015, 54, 13245–13248. [Google Scholar] [CrossRef]
  34. Reiner-Rozman, C.; Kotlowski, C.; Knoll, W. Electronic Biosensing with Functionalized rGO FETs. Biosensors 2016, 6, 17. [Google Scholar] [CrossRef] [Green Version]
  35. Langmuir, I. The Constitution and Fundamental Properties of Solids and Liquids. II. Liq. J. Am. Chem. Soc. 1917, 39, 1848–1906. [Google Scholar] [CrossRef] [Green Version]
  36. Shreeve, B.J.; Patterson, D.S.P.; Roberts, B.A. Mycotoxins and Their Metabolites in Humans and Animals. Food Cosmet. Toxicol. 1979, 17, 151–152. [Google Scholar] [CrossRef]
  37. Paniel, N.; Radoi, A.; Marty, J.L. Development of an electrochemical biosensor for the detection of aflatoxin M1 in milk. Sensors 2010, 10, 9439–9448. [Google Scholar] [CrossRef] [Green Version]
  38. Commission Regulation (EC) No. 466/2001. Available online: http://ec.europa.eu/food/fs/sfp/fcr/fcr02_en.pdf (accessed on 12 April 2016).
  39. Wang, Y.; Dostalek, J.; Knoll, W. Long Range Surface Plasmon-enhanced Fluorescence Spectroscopy for the Detection of Aflatoxin M-1 in milk. Biosens. Bioelectron. 2009, 24, 2264–2267. [Google Scholar] [CrossRef]
  40. Feng, C.L.; Zhong, X.; Steinhart, M.; Majoral, J.P.; Knoll, W. Functional Quantum-Dot/Dendrimer Nanotubes for Sensitive Detection of DNA Hybridization. Small 2008, 4, 566–571. [Google Scholar] [CrossRef] [PubMed]
  41. Zhou, X.D.; Virasamy, S.; Knoll, W.; Liu, K.Y.; Tse, M.S.; Yen, L.W. Fabrication of Gold Nanocrescents by Angle Deposition with Nanosphere Lithography for Localized Surface Plasmon Resonance Applications. J. Nanosci. Nanotechnol. 2008, 8, 3369–3378. [Google Scholar] [CrossRef]
  42. Wang, Y.; Dostalek, J.; Knoll, W. Magnetic Nanoparticle-Enhanced Biosensor Based on Grating-Coupled Surface Plasmon Resonance. Anal. Chem. 2011, 83, 6202–6207. [Google Scholar] [CrossRef]
  43. Kotlowski, C.; Larisika, M.; Guerin, P.M.; Kleber, C.; Kröber, T.; Mastrogiacomo, R.; Nowak, C.; Pelosi, P.; Schütz, S.; Schwaighofer, A.; et al. Fine discrimination of volatile compounds by graphene-immobilized odorant-binding proteins. Sens. Act. B Chem. 2018, 256, 564–572. [Google Scholar] [CrossRef]
  44. Khan, H.U.; Roberts, M.E.; Johnson, O.; Förch, R.; Knoll, W.; Bao, Z. In Situ, Label-Free DNA Detection Using Organic Transistor Sensors. Adv. Mater. 2010, 22, 4452–4456. [Google Scholar] [CrossRef]
  45. Bruno, J.G. Predicting the Uncertain Future of Aptamer-Based Diagnostics and Therapeutics. Molecules 2015, 20, 6866–6887. [Google Scholar] [CrossRef]
  46. Tiede, C. Affimer proteins are versatile and renewable affinity reagents. eLife 2017, 6, e24903. [Google Scholar] [CrossRef] [PubMed]
  47. Available online: https://www.aptabiosciences.com/ (accessed on 1 November 2020).
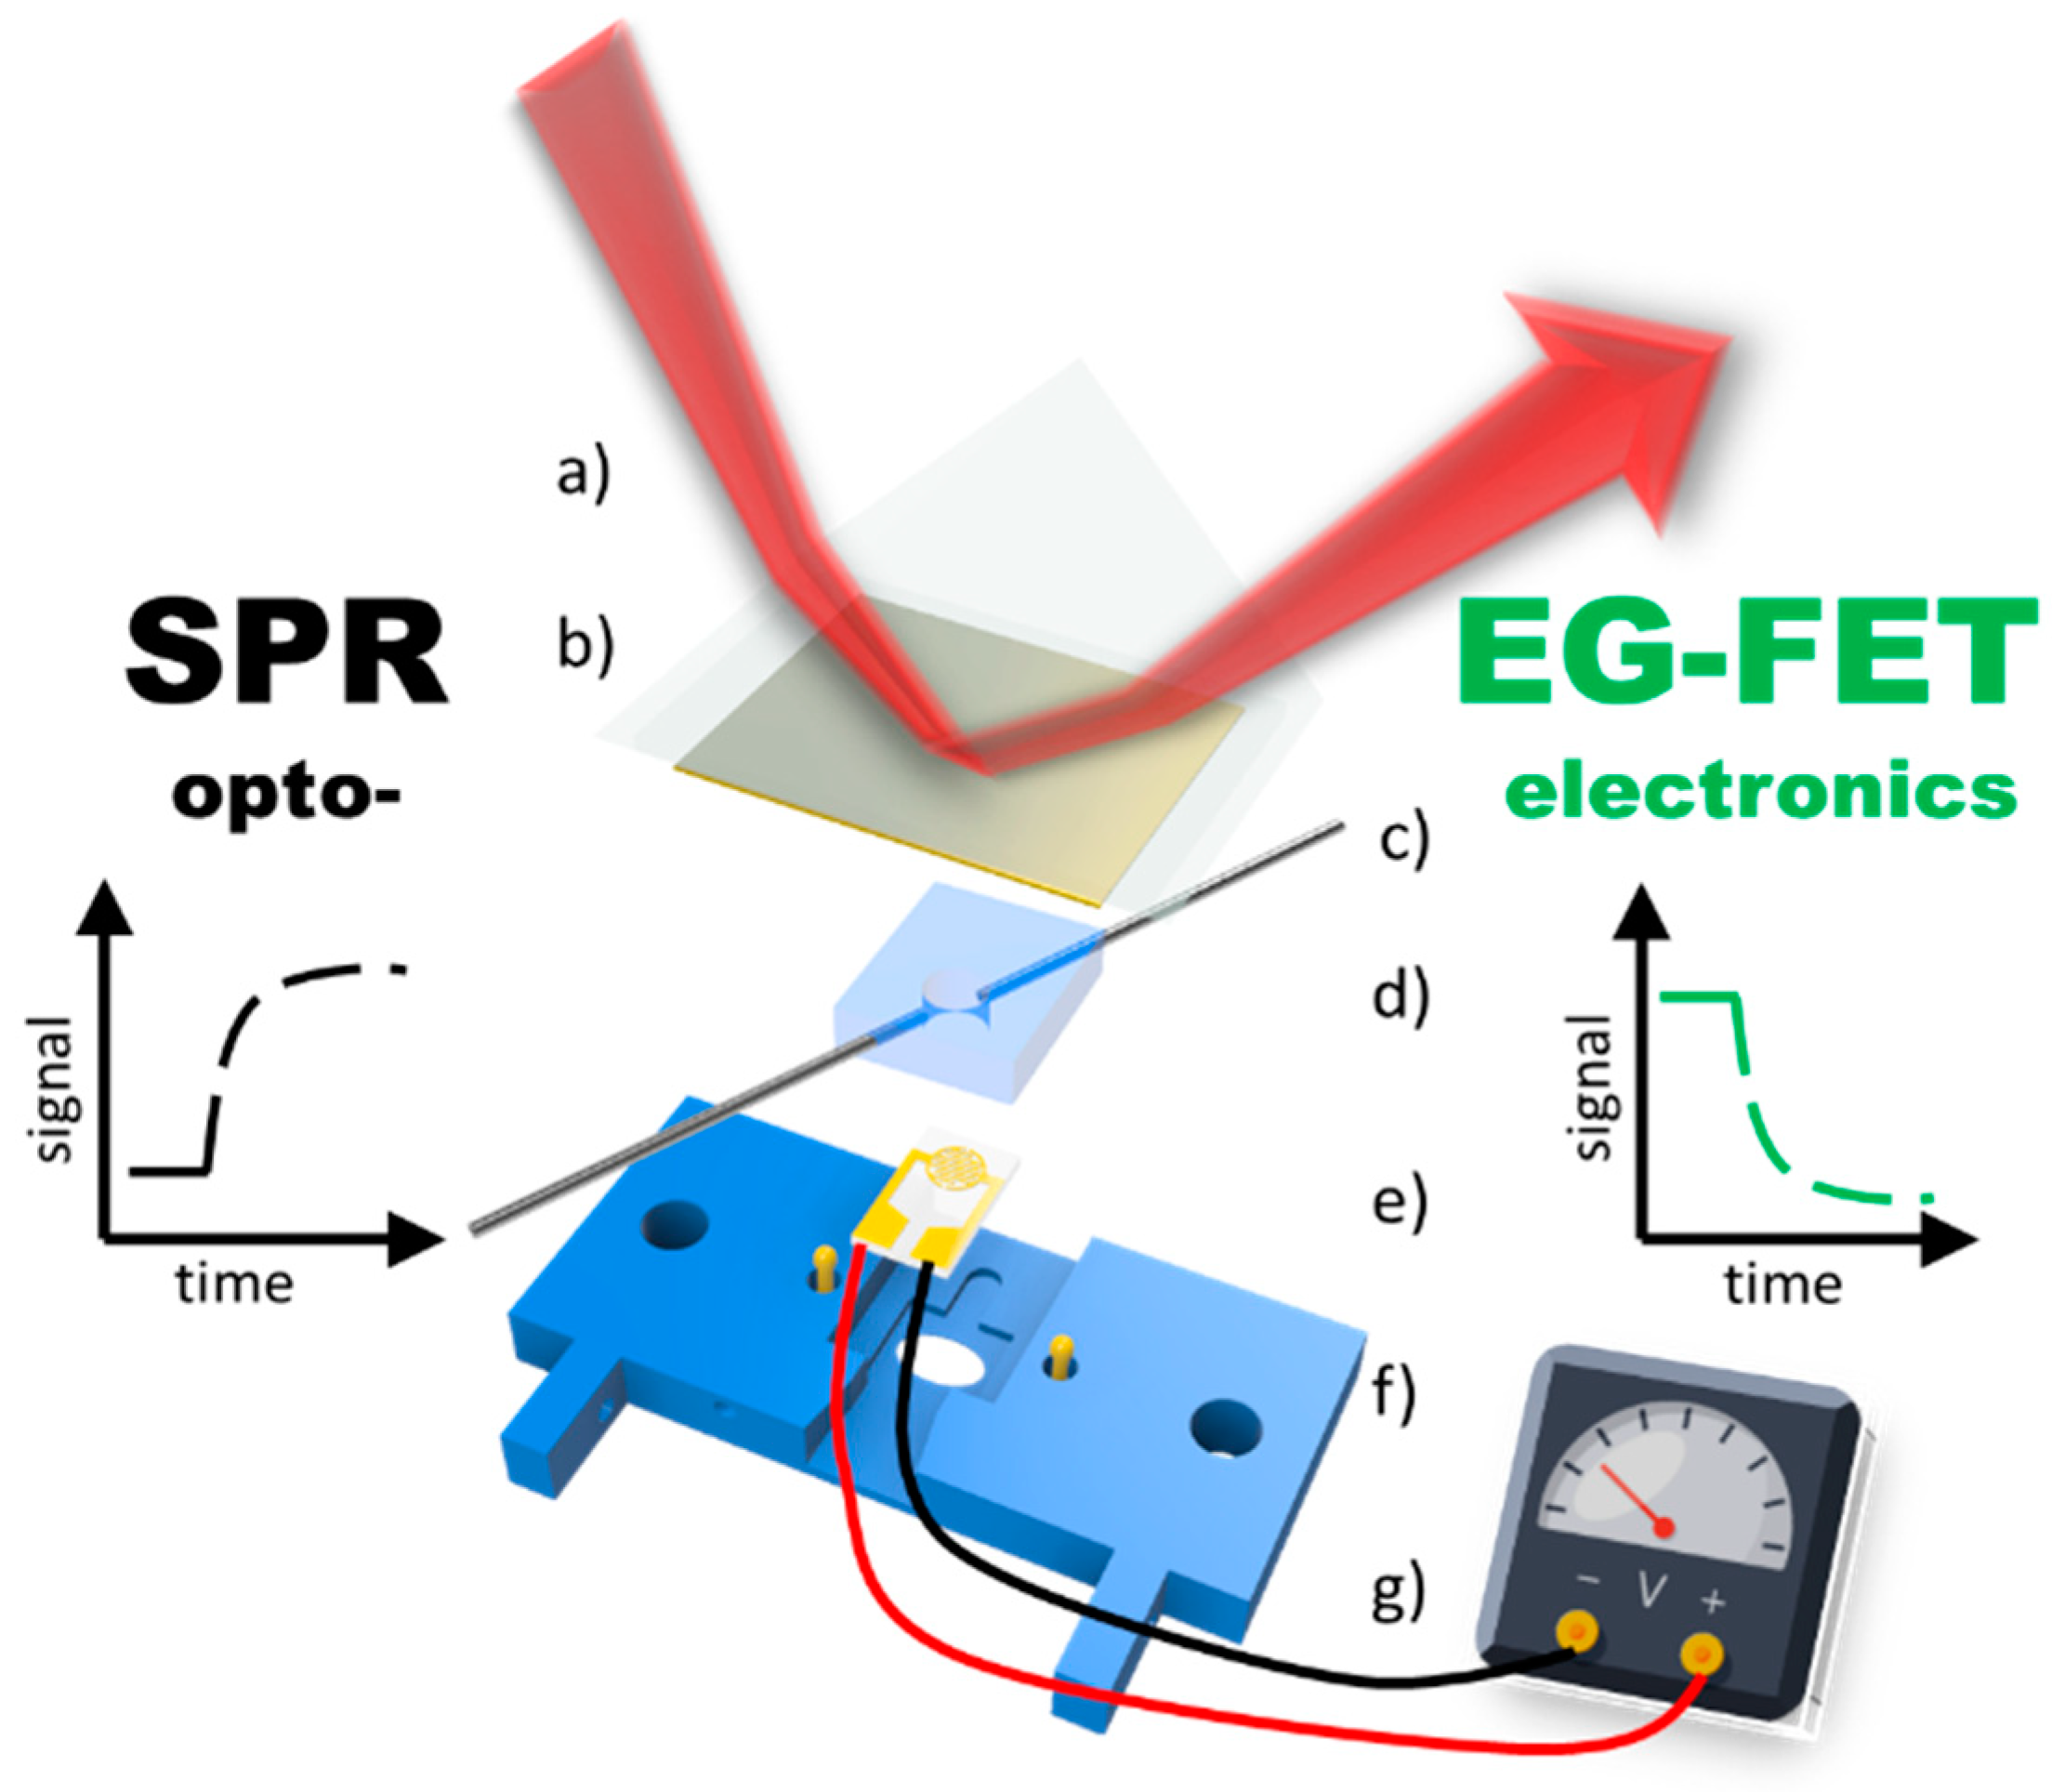
  48. Aspermair, C.; Ramach, U.; Reiner-Rozman, C.; Fossati, S.; Lechner, B.; Moya, S.E.; Azzaroni, O.; Dostalek, J.; Szunerits, S.; Knoll, W.; et al. Dual Monitoring of Surface Reactions in Real Time by Combined Surface-Plasmon Resonance and Field-Effect Transistor Interrogation. J. Am. Chem. Soc. 2020, 142, 11709–11716. [Google Scholar] [CrossRef] [PubMed]
Figure 1. Schematics of the extension of a classical surface plasmon spectrometer in the Kretschmann configuration by a fluorescence detection unit, consisting of a collecting lens, an attenuator (if needed), a set of filters for the separation of fluorescence emission from scattered light, and different modules for the detection of fluorescence: either a PMT to measure the absolute intensity values of the emitted light or a fiber-optic coupled spectrometer for the detection of the spectral properties of the emitted fluorescence light.
Chemosensors 09 00011 g001
Figure 2. Comparison of the distance dependence of the optical field enhancement of a surface plasmon evanescent wave mode excited at a prism/Au/water interface (solid curve), and the Förster energy transfer, expressed as the relative fluorescence intensity (dashed curve) from a chromophore placed at a certain distance above the metal/water interface. Simulation were performed, assuming a laser wavelength of =632.8 nm and an Au refractive index n = 0.125 + 3.56 i.
Chemosensors 09 00011 g002
Figure 3. Schemes of different supramolecular structures for hCG detection in a sandwich assay with biotin/streptavidin as the universal immobilization system: (A) Streptavidin/biotinylated antibody (bio-IgG)/hCG/Alexa Fluor-labeled antibody (AF-IgG); (B) Biotinylated Fab/hCG/AF-labeled antibody structure.
Chemosensors 09 00011 g003
Figure 4. “One step” sandwich immunoassay: (A) kinetic fluorescence working curve; the numbers indicate the analyte concentration in mIU/mL; (B) dose-response curve; (C) zoom-in to the low concentration part in (B).
Chemosensors 09 00011 g004
Figure 5. (A), SPR setup in the Kretschmann configuration with an interfacial brush architecture with immobilized antibodies, extending the spatial range of analyte binding events that can be probed by the evanescent optical field of a surface plasmon mode (dotted red curve); (B), binding assay in the very low analyte concentration regime (orders of magnitude below the half-saturation concentration c1/2 = Kd). The linear increase of the fluorescence intensity indicates the diffusion-limited mass transfer of the analyte molecules (fluorescently labeled AF-RaM antibodies) to the surface-immobilized receptors, mouse IgG. Note the strong dependence of the slope on the bulk concentration. Upon rinsing with pure buffer, the increase stops immediately; the sensor surface can be regenerated by glycine pulses that bring the fluorescence intensity back to the baseline level; (C) demonstration of the extreme sensitive of a bio-sensors based on surface plasmon fluorescence spectroscopy: shown is a plot of the slopes obtained from the binding kinetics (cf. Figure 5B) as a function of the corresponding bulk concentration. The intersection of the fit to this calibration curve (red line) with the baseline (background fluorescence level, black dashed line) results in a LOD of 500 aM.
Chemosensors 09 00011 g005
Figure 6. Detection of LPS (structure given schematically in (A)), using antibody labeling; (B), schematics of the sensor surface architecture: a DPTL self-assembled monolayer is completed by vesicle fusion to a bilayer containing LPS. The O-antigen part of the incorporated LPS is exposed to the buffer solution for (primary and chromophore-labeled secondary) antibody binding.
Chemosensors 09 00011 g006
Figure 7. (A), SPR (left ordinate) and SPFS (right ordinate) kinetics data taken at a fixed angle of observation during the sequential additions of primary and labeled secondary antibodies; (B) shows the angular scans indicating the angle-dependent fluorescence emission from fluorescently labeled secondary antibodies following the surface plasmon excitation; (C) plot of the normalized fluorescence intensity versus primary antibody concentration; the fluorescence increases until it reaches saturation. The solid line is a fit to a Langmuir adsorption isotherm with KA = 3 × 10⁸ M−1.
Chemosensors 09 00011 g007
Figure 8. Schematics of a graphene (or reduced graphene oxide, rGO)-based field effect transistor with source and drain electrodes and a liquid gate, integrated into a flow cell for in situ bio-analyte detection. Surface functionalization is achieved by pyrene derivatives as the linkers that allow for the stable immobilization of antibodies as receptors for recognition and reversible analyte binding, an antigen, from the sample solution pumped through the flow channel attached.
Chemosensors 09 00011 g008
Figure 9. (top), Measurement curve of BSA binding from the bulk to surface-immobilized anti-BSA antibody; BSA concentrations from 100 nM to 25μM (near saturation, red labels) were rinsed over the sensor surface. The instability/drift in the first minutes originates from charging of the graphene, and is stabilizing after a few minutes. (bottom), Langmuir adsorption isotherm from the plot of ISD, normalized to the saturation response, obtained for each titration step after equilibrium. The isotherm (red curve) is obtained from fitting with the Langmuir model, showing a dissociation constant (at half saturation) Kd = 3 M.
Chemosensors 09 00011 g009
Figure 10. (top) Measurement of the association (binding) and dissociation signal of 50 µM BSA, while step-wise decrease of the ionic strength (shown by the different shades of blue) from 170 mM to 8.5 mM at a constant VG= −0.2 V. Washing steps with the same buffer solution as used as BSA matrix are indicated by the blue arrows. (bottom) The black curve shows the calculated dependence of Debye length to ionic strength from theory and the red dots show of responses from A overlapping with theory.
Chemosensors 09 00011 g010
Figure 11. Measurement of the source-drain current ISD for a single kinetic response to a 1 nM BSA concentration (red arrow), after a baseline in pure PBS buffer was established and followed by rinsing with the same buffer again (blue arrows) for monitoring of the association and dissociation rate constants [34].
Chemosensors 09 00011 g011
Figure 12. (left), Kinetic data of ISD in real-time for the detection of food pathogen AFB1 for solutions of different concentrations (green arrows), alternating with rinsing steps of pure buffer in between (blue arrows) measured in the sample cell; (right) Langmuir fit to the data from A. The orange S-shaped curve was fitted, resulting in a half-saturation concentration c1/2 = Kd = 800 pM.
Chemosensors 09 00011 g012
Figure 13. Schematic drawing of the experimental combination setup consisting of the optical SPR part: (a) prism (b) 50 nm gold slide which also acts as the gate electrode for the electronic—EG-FET part: (c) in- and outlet (d) PDMS flow cell (e) interdigitated electrode chip (f) contact pins for gate electrode (g) 3D printed holder.
Chemosensors 09 00011 g013
Table 1. Expected values for hCG levels (World Health Organization Third International Standard 75/537) during normal pregnancy (in mIU/mL) [9].
1st week10–30
2nd week30–100
3rd week100–1000
4th week1000–10,000
2nd & 3rd month30,000–100,000
Publisher’s Note: MDPI stays neutral with regard to jurisdictional claims in published maps and institutional affiliations.

