Distribution of Pediatric Vital Signs in the Emergency Department: A Nationwide Study


1
Department of Pediatrics, College of Medicine, The Catholic University of Korea, Seoul 06591, Korea
2
Department of Emergency Medicine, Seoul National University Hospital, Seoul 03080, Korea
3
Department of Biomedical Engineering, Seoul National University College of Medicine, Seoul 03080, Korea
*
Author to whom correspondence should be addressed.
†
These authors contributed equally to this work.
Children 2020, 7(8), 89; https://0-doi-org.brum.beds.ac.uk/10.3390/children7080089
Submission received: 14 July 2020
/
Revised: 1 August 2020
/
Accepted: 3 August 2020
/
Published: 5 August 2020
Abstract
:To effectively use vital signs as indicators in children, the magnitude of deviation from expected vital sign distribution should be determined. The purpose of this study is to derive age-specific centile charts for the heart rate and respiratory rate of the children who visited the emergency department. This study used the Korea’s National Emergency Department Information System dataset. Patients aged <16 years visiting the emergency department between 1 January 2016 and 31 December 2017 were included. Heart rate and respiratory rate centile charts were derived from the population with normal body temperature (36 to <38 °C). Of 1,901,816 data points retrieved from the database, 1,454,372 sets of heart rates and 1,458,791 sets of respiratory rates were used to derive centile charts. Age-specific centile charts and curves of heart rates and respiratory rates showed a decline in heart rate and respiratory rate from birth to early adolescence. There were substantial discrepancies in the reference ranges of Advanced Paediatric Life Support and Pediatric Advanced Life Support guidelines. Age-based heart rate and respiratory rate centile charts at normal body temperature, derived from children visiting emergency departments, serve as new evidence-based data and can be used in follow-up studies to improve clinical care for children.
1. Introduction
Vital signs reflect a patient’s fundamental physical status. They are used to detect and evaluate individuals who are in need of resuscitation, and to identify patients whose conditions are worsening, in the form of an early warning system [1,2,3]. To effectively utilize vital signs as indicators in children, it may be useful to identify the magnitude of deviation from the expected vital sign distribution and consider the child’s age and location of care (e.g., ED or general wards) rather than only to determine whether the vital sign values are abnormal.
In the emergency department (ED), vital signs are used to assess the patient’s state, to triage the category of the patient, and to determine the disposition of patients and required resources [4]. All or most children who visit EDs have acute illnesses and various situations at EDs, such as unfamiliar people and place or an unpleasant experience with an injection, could easily influence a child’s vital signs. Typically, however, existing reference ranges for heart rate (HR) and respiratory rate (RR) in children were determined from children in outpatient clinics, healthy children in schools, or sleeping children in hospitals [5]. We believe that there are substantial differences in the HR and RR ranges of children who visit EDs.
There are a few studies that derived the reference range for HR and RR in children who visited EDs [6,7]. However, they have limitations because they were conducted in a single center or had the possibility to be confounded by the body temperature (BT) of the patients. We therefore conducted an investigation to derive age-based centile curves of HR and RR from the pediatric population visiting EDs in Korea and to compare these centiles with other reference ranges.
2. Materials and Methods
2.1. Data Source
The data used in this study were provided by Korea’s National Emergency Department Information System (NEDIS), operated by the National Emergency Medical Center. Data were collected from 408 EDs (31 district emergency medical centers, 120 regional emergency medical centers, and 257 regional emergency medical departments) in 2016 and from 413 EDs (36 district emergency medical centers, 118 regional emergency medical centers, and 259 regional emergency medical departments) in 2017.
2.2. Inclusion and Exclusion Criteria
We included patients under 16 years of age who visited EDs with normal BT between 1 January 2016 and 31 December 2017. The patients who died at the EDs were excluded. In this study, the normal BT range was defined as 36 to <38 °C.
2.3. Data Collection and Pre-Processing
In the data abstraction process; age, HR, RR, and BT were collected for analysis. The following non-physiological values were removed to eliminate outliers that were thought to suggest errors in the data input process: HR > 300 beats/min, HR < 30 beats/min, RR > 120 breaths/min, and RR < 5 breaths/min.
2.4. Outcomes
The primary outcome was to derive age-based centile curves for HR and RR measured at normal BT in the children who visited EDs. The secondary outcome was the comparison of our data with the thresholds of Advanced Paediatric Life Support (APLS) [2] and Pediatric Advanced Life Support (PALS) [1] guidelines and with centile charts reported in previous studies [5,6,8].
2.5. Data Analysis
Box-Cox power exponential distribution and Lambda-Mu-Sigma methods were used to construct age-based centile charts for HR and RR, and the penalized B-spline method was used for smoothing. These processes were performed using the generalized additive model for location, scale, and shape package of R software [9,10,11,12,13]. Because a representative value of age is needed to display a dot in the graph, the graph uses the median value of the corresponding age range as the representative value. For example, those who were 3 to <4 years old were categorized as 3.5 years old. All data processing was performed using R version 3.6.1 (R Foundation for Statistical Computing, Vienna, Austria).
2.6. Ethics Statement
This study protocol was reviewed by the Institutional Review Board of Seoul National University Hospital and was exempted from deliberation because of the use of deidentified datasets from the NEDIS (E-1909-097-1065).
3. Results
3.1. Baseline Characteristics
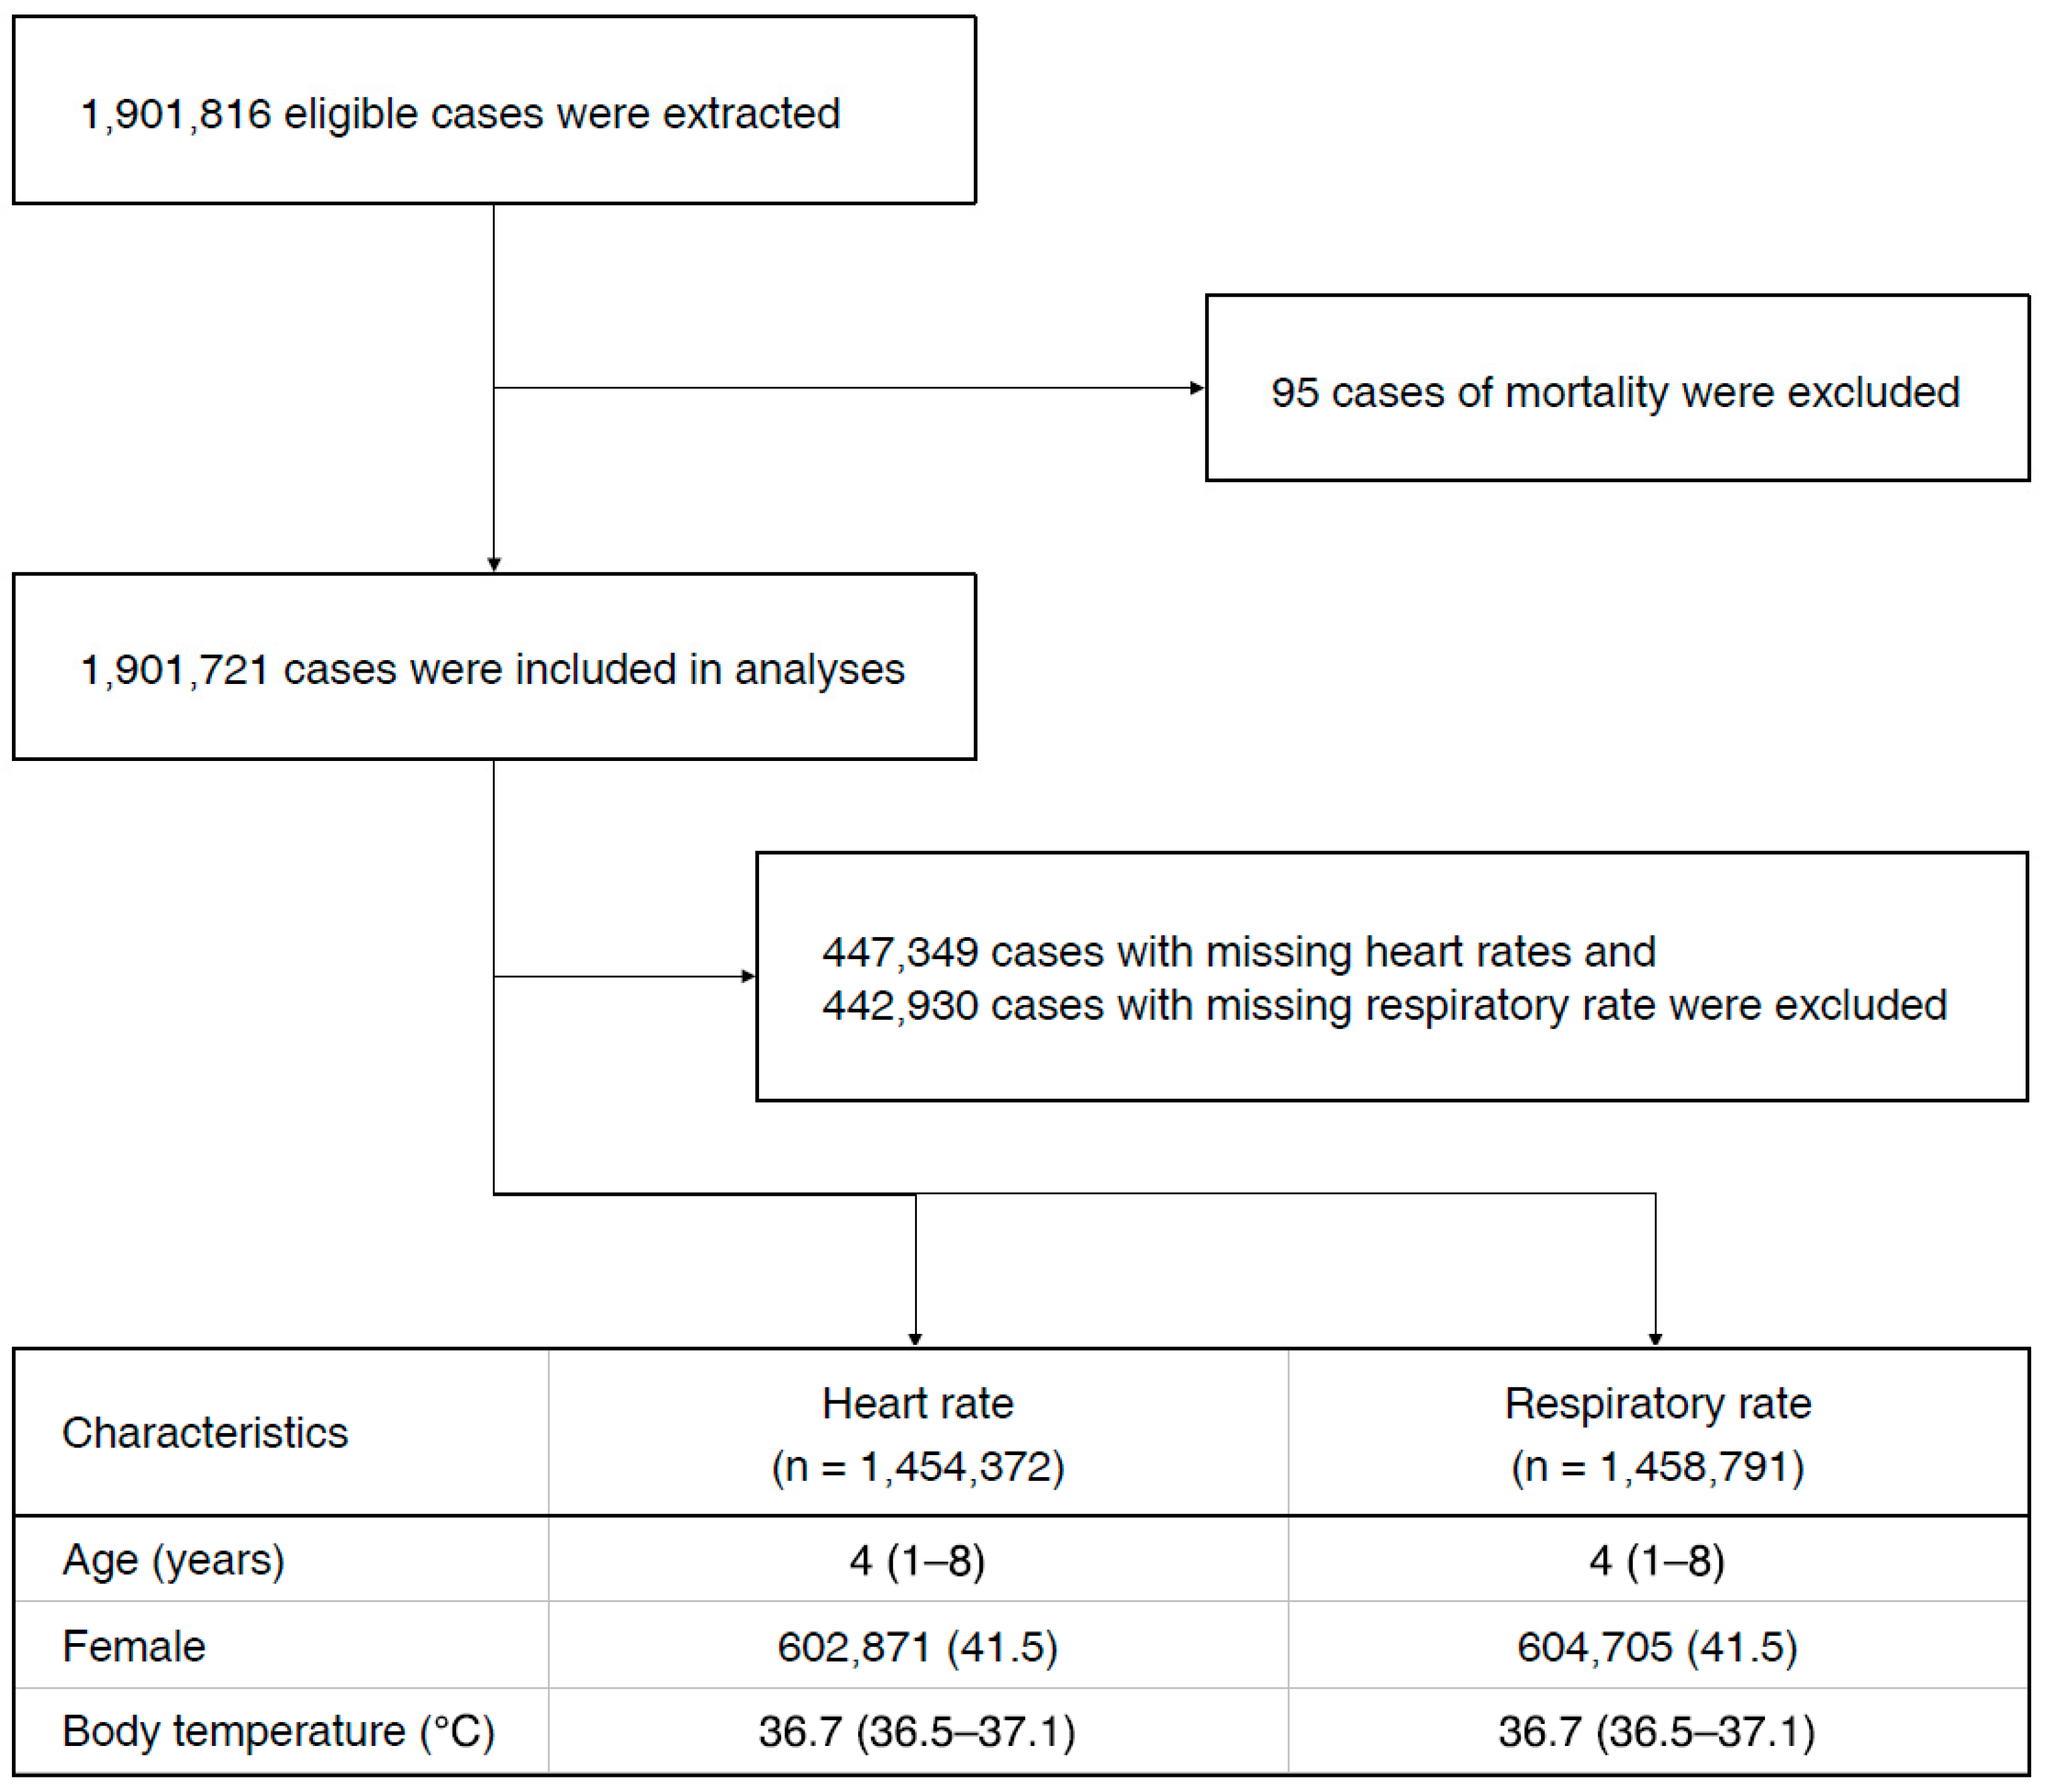
After applying inclusion criteria and exclusion criteria, 1,901,721 cases were included in the analyses. Among them, 1,454,372 HR and 1,458,791 RR, excluding missing values, were used to derive centile charts. The flowchart and demographic characteristics of the patients are shown in Figure 1.
3.2. Primary Outcome
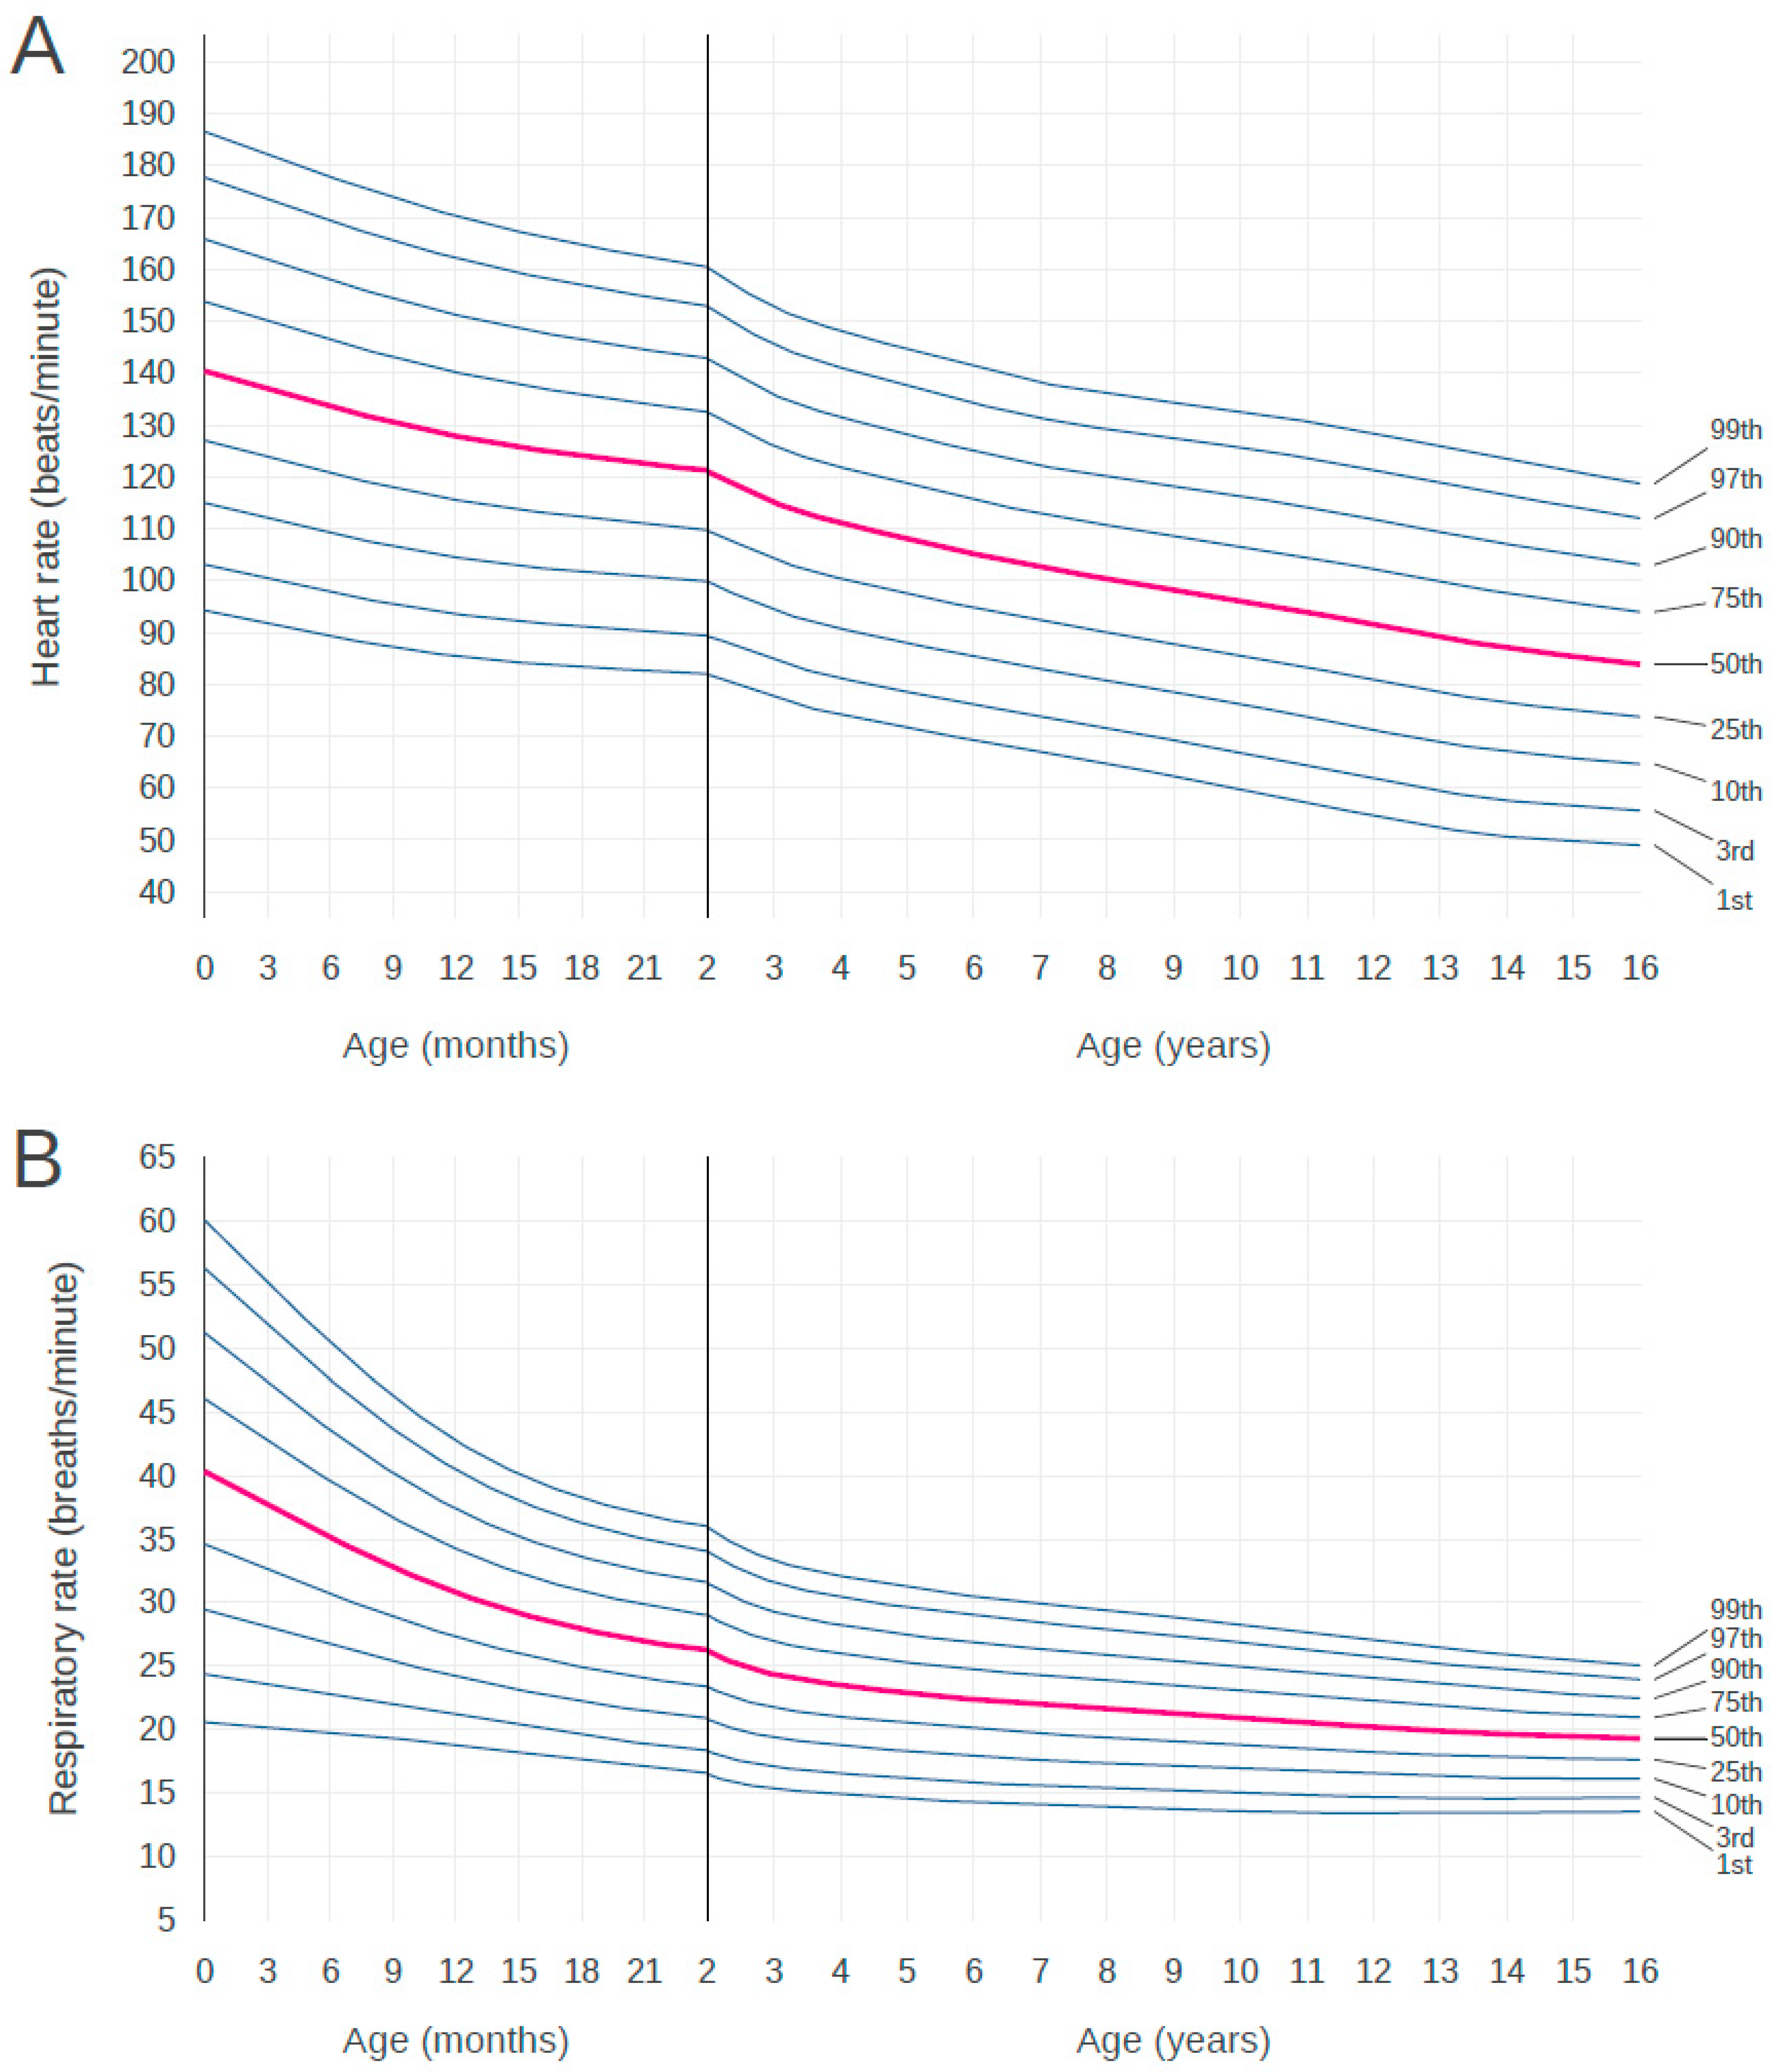
Figure 2 shows the 1st to 99th centiles of HR and RR at normal BT in our cohort of birth to 16-year-old children visiting EDs during the 2-year sample period. These centiles show a decline in HR and RR from birth to early adolescence. In RR, the steepest decline is apparent in infants during the first 2 years of life. The centile charts of HR and RR by age are shown in Table 1 and Table 2, respectively. Age was divided into 3-month increments up to 24 months and continued in 1-year increments thereafter.
3.3. Secondary Outcomes
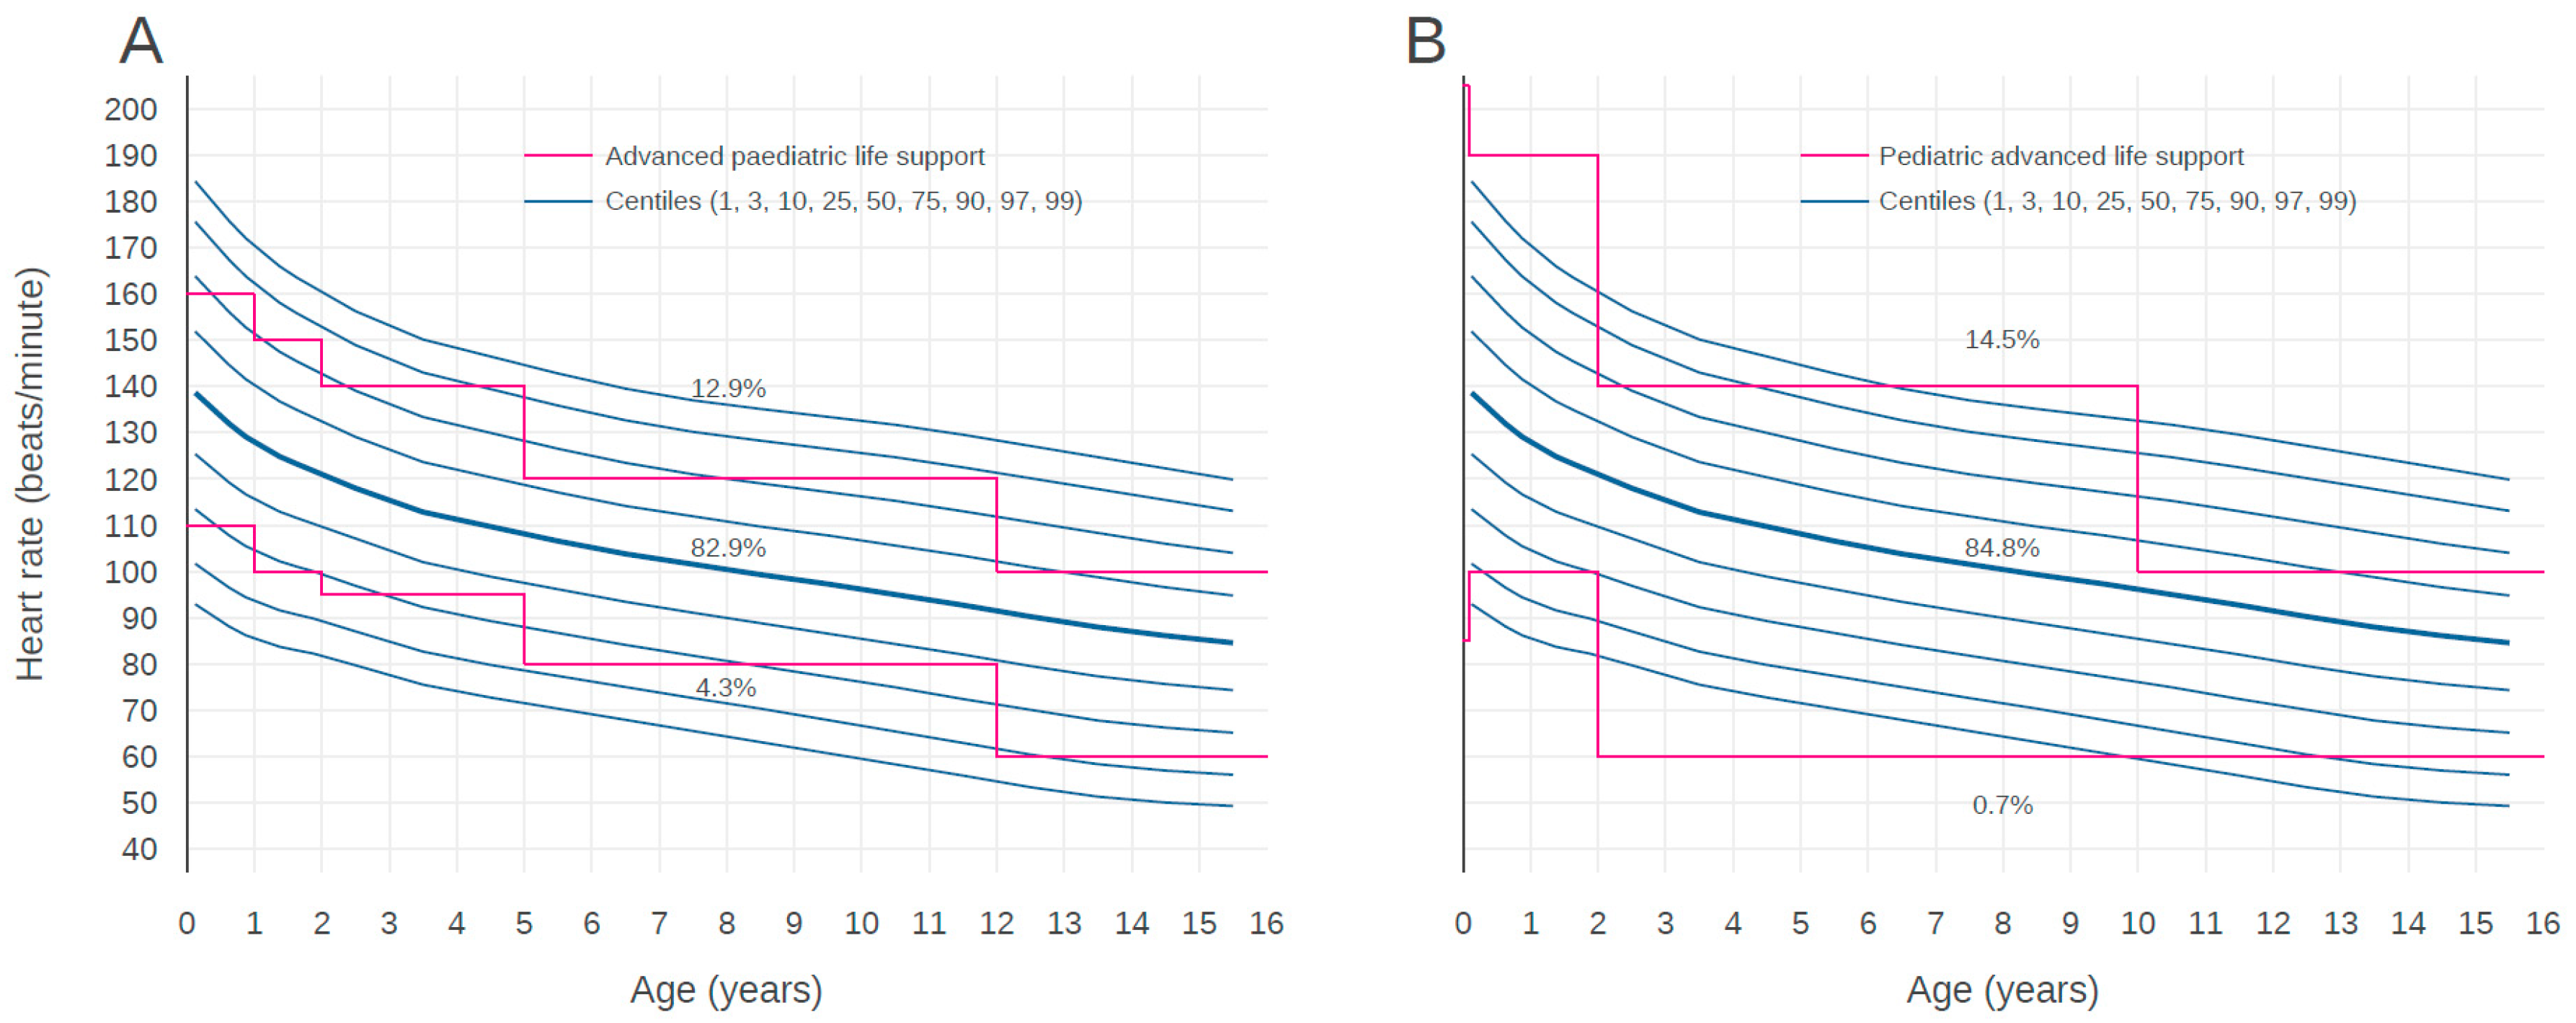
Figure 3 shows a comparison of the reference ranges from the APLS and PALS guidelines with our centiles of HR. The HRs of 12.9% children who visited EDs were higher than the APLS upper limit and the HRs of 4.3% children were lower than the APLS lower limit. The HRs of 82.9% children existed within reference ranges of the APLS guideline. In the case of the PALS guideline, the HR of 14.5% children who visited EDs were higher than the PALS upper limit and the HRs of 0.7% children were lower than the PALS lower limit. The HRs of 84.8% children existed within the reference ranges of the PALS guideline. While the APLS upper and lower limits existed between the 1st and 99th centile curves across all age groups, the PALS upper limit was located outside of the 99th centile curves of children for ages up to 2 years and 6 to 10 years. The PALS lower limit was located outside of the 1st curves of children for ages 2 to 10 years.
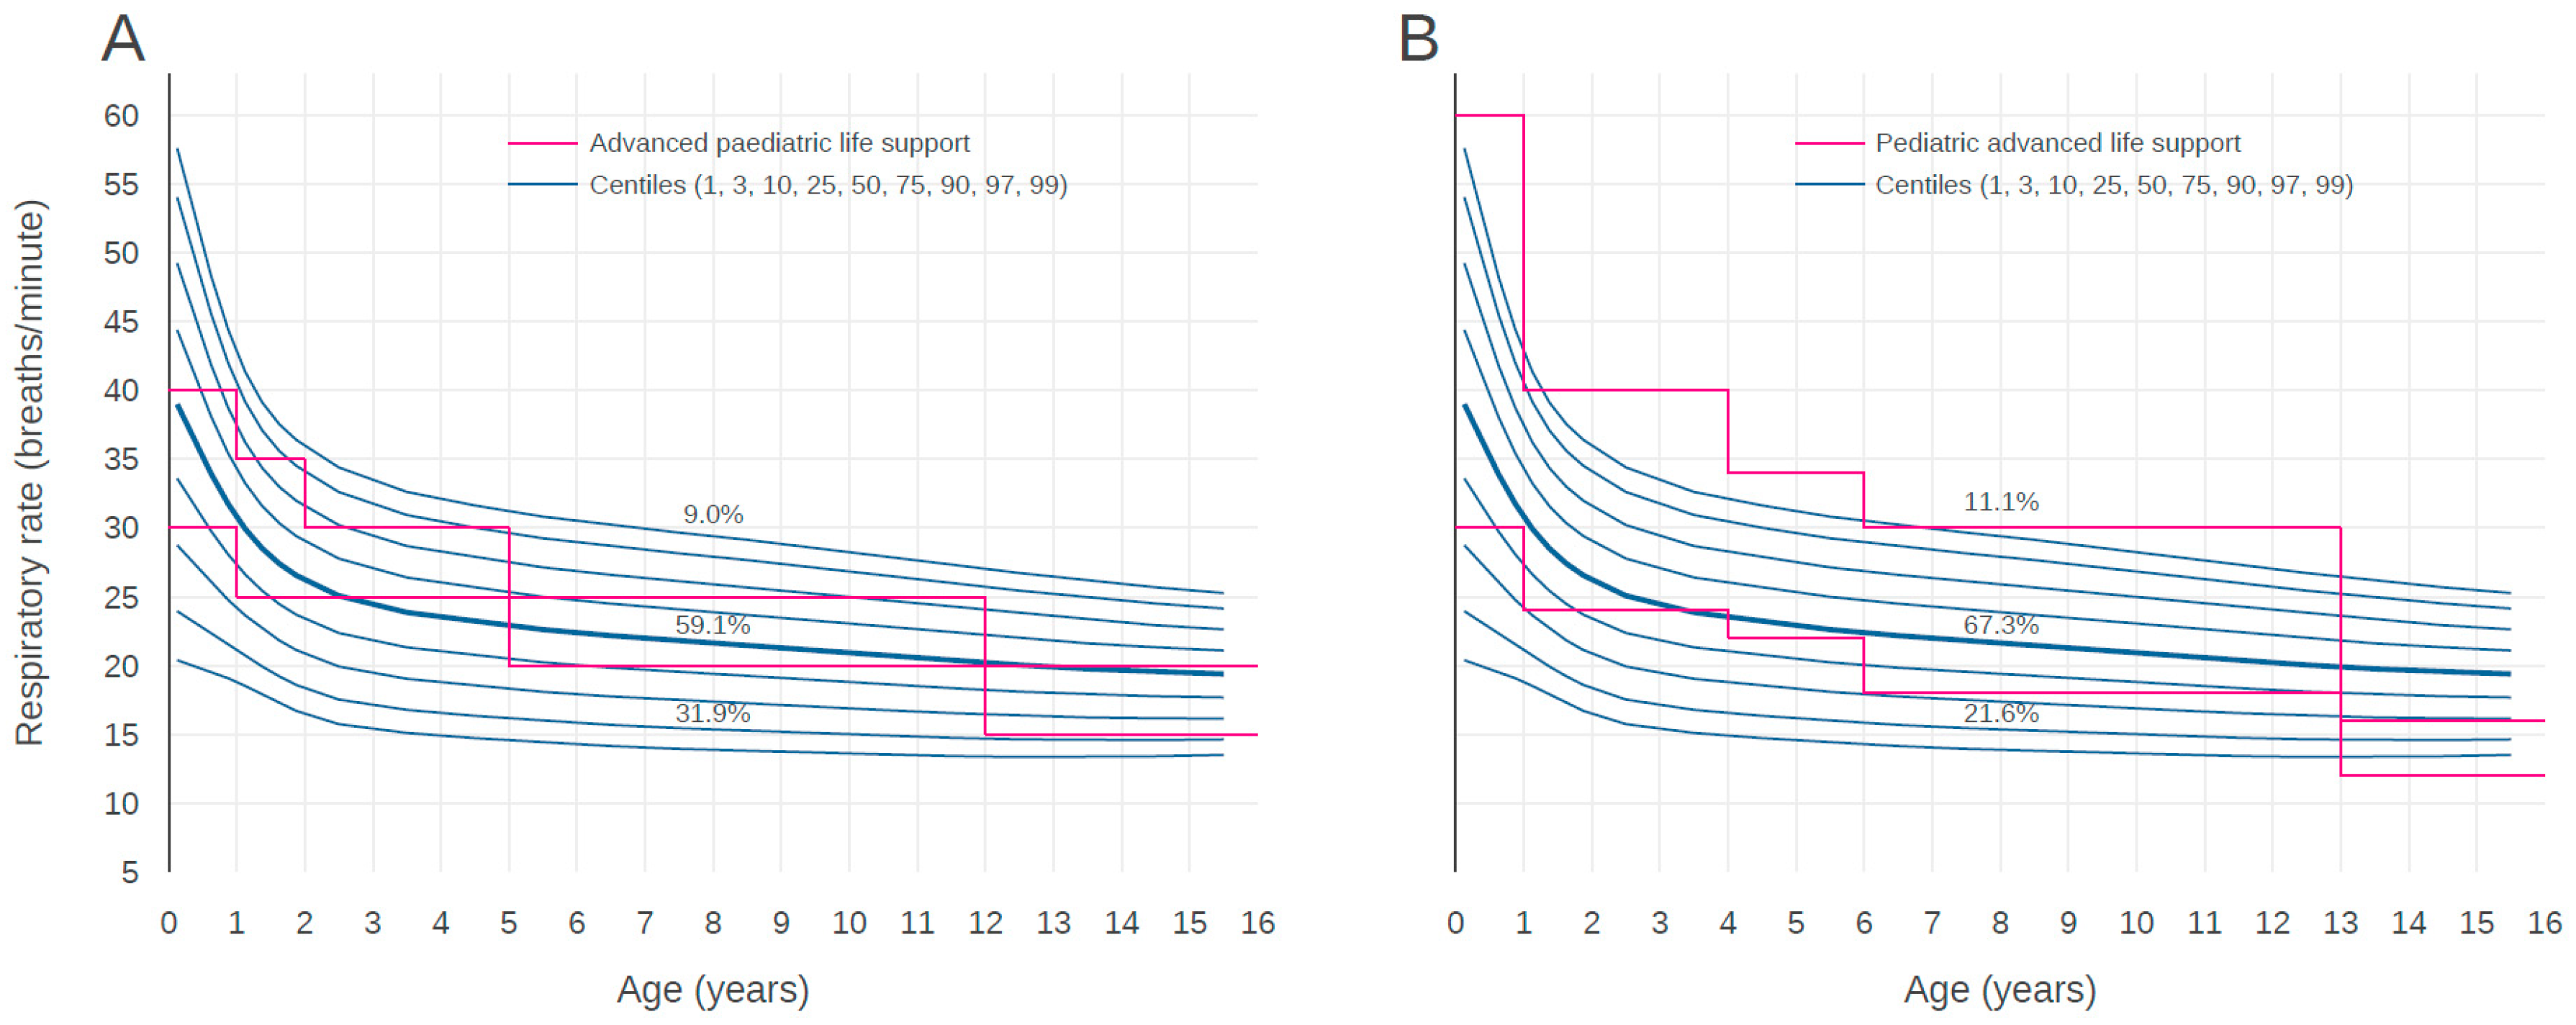
Figure 4 shows the centile curves of RR according to age compared with the thresholds of both pediatric resuscitation guidelines. The RRs of 9.0% children who visited EDs were higher than the APLS upper limit and the RR of 31.9% children were lower than the APLS lower limit. The RRs of 59.1% children existed within the reference ranges of the APLS guideline. The RRs of 11.1% children was higher than PALS upper limit and the RRs of 21.6% children was lower than PALS lower limit. The RRs of 67.3% children existed within the reference ranges of the PALS guideline. While the APLS upper and lower limits existed between the 1st and 99th centile curves across all age groups, the PALS upper limit was located outside of the 99th centile curves of children for age up to 13 years. The PALS lower limit was located outside of 1st curves of children for age above 13 years.
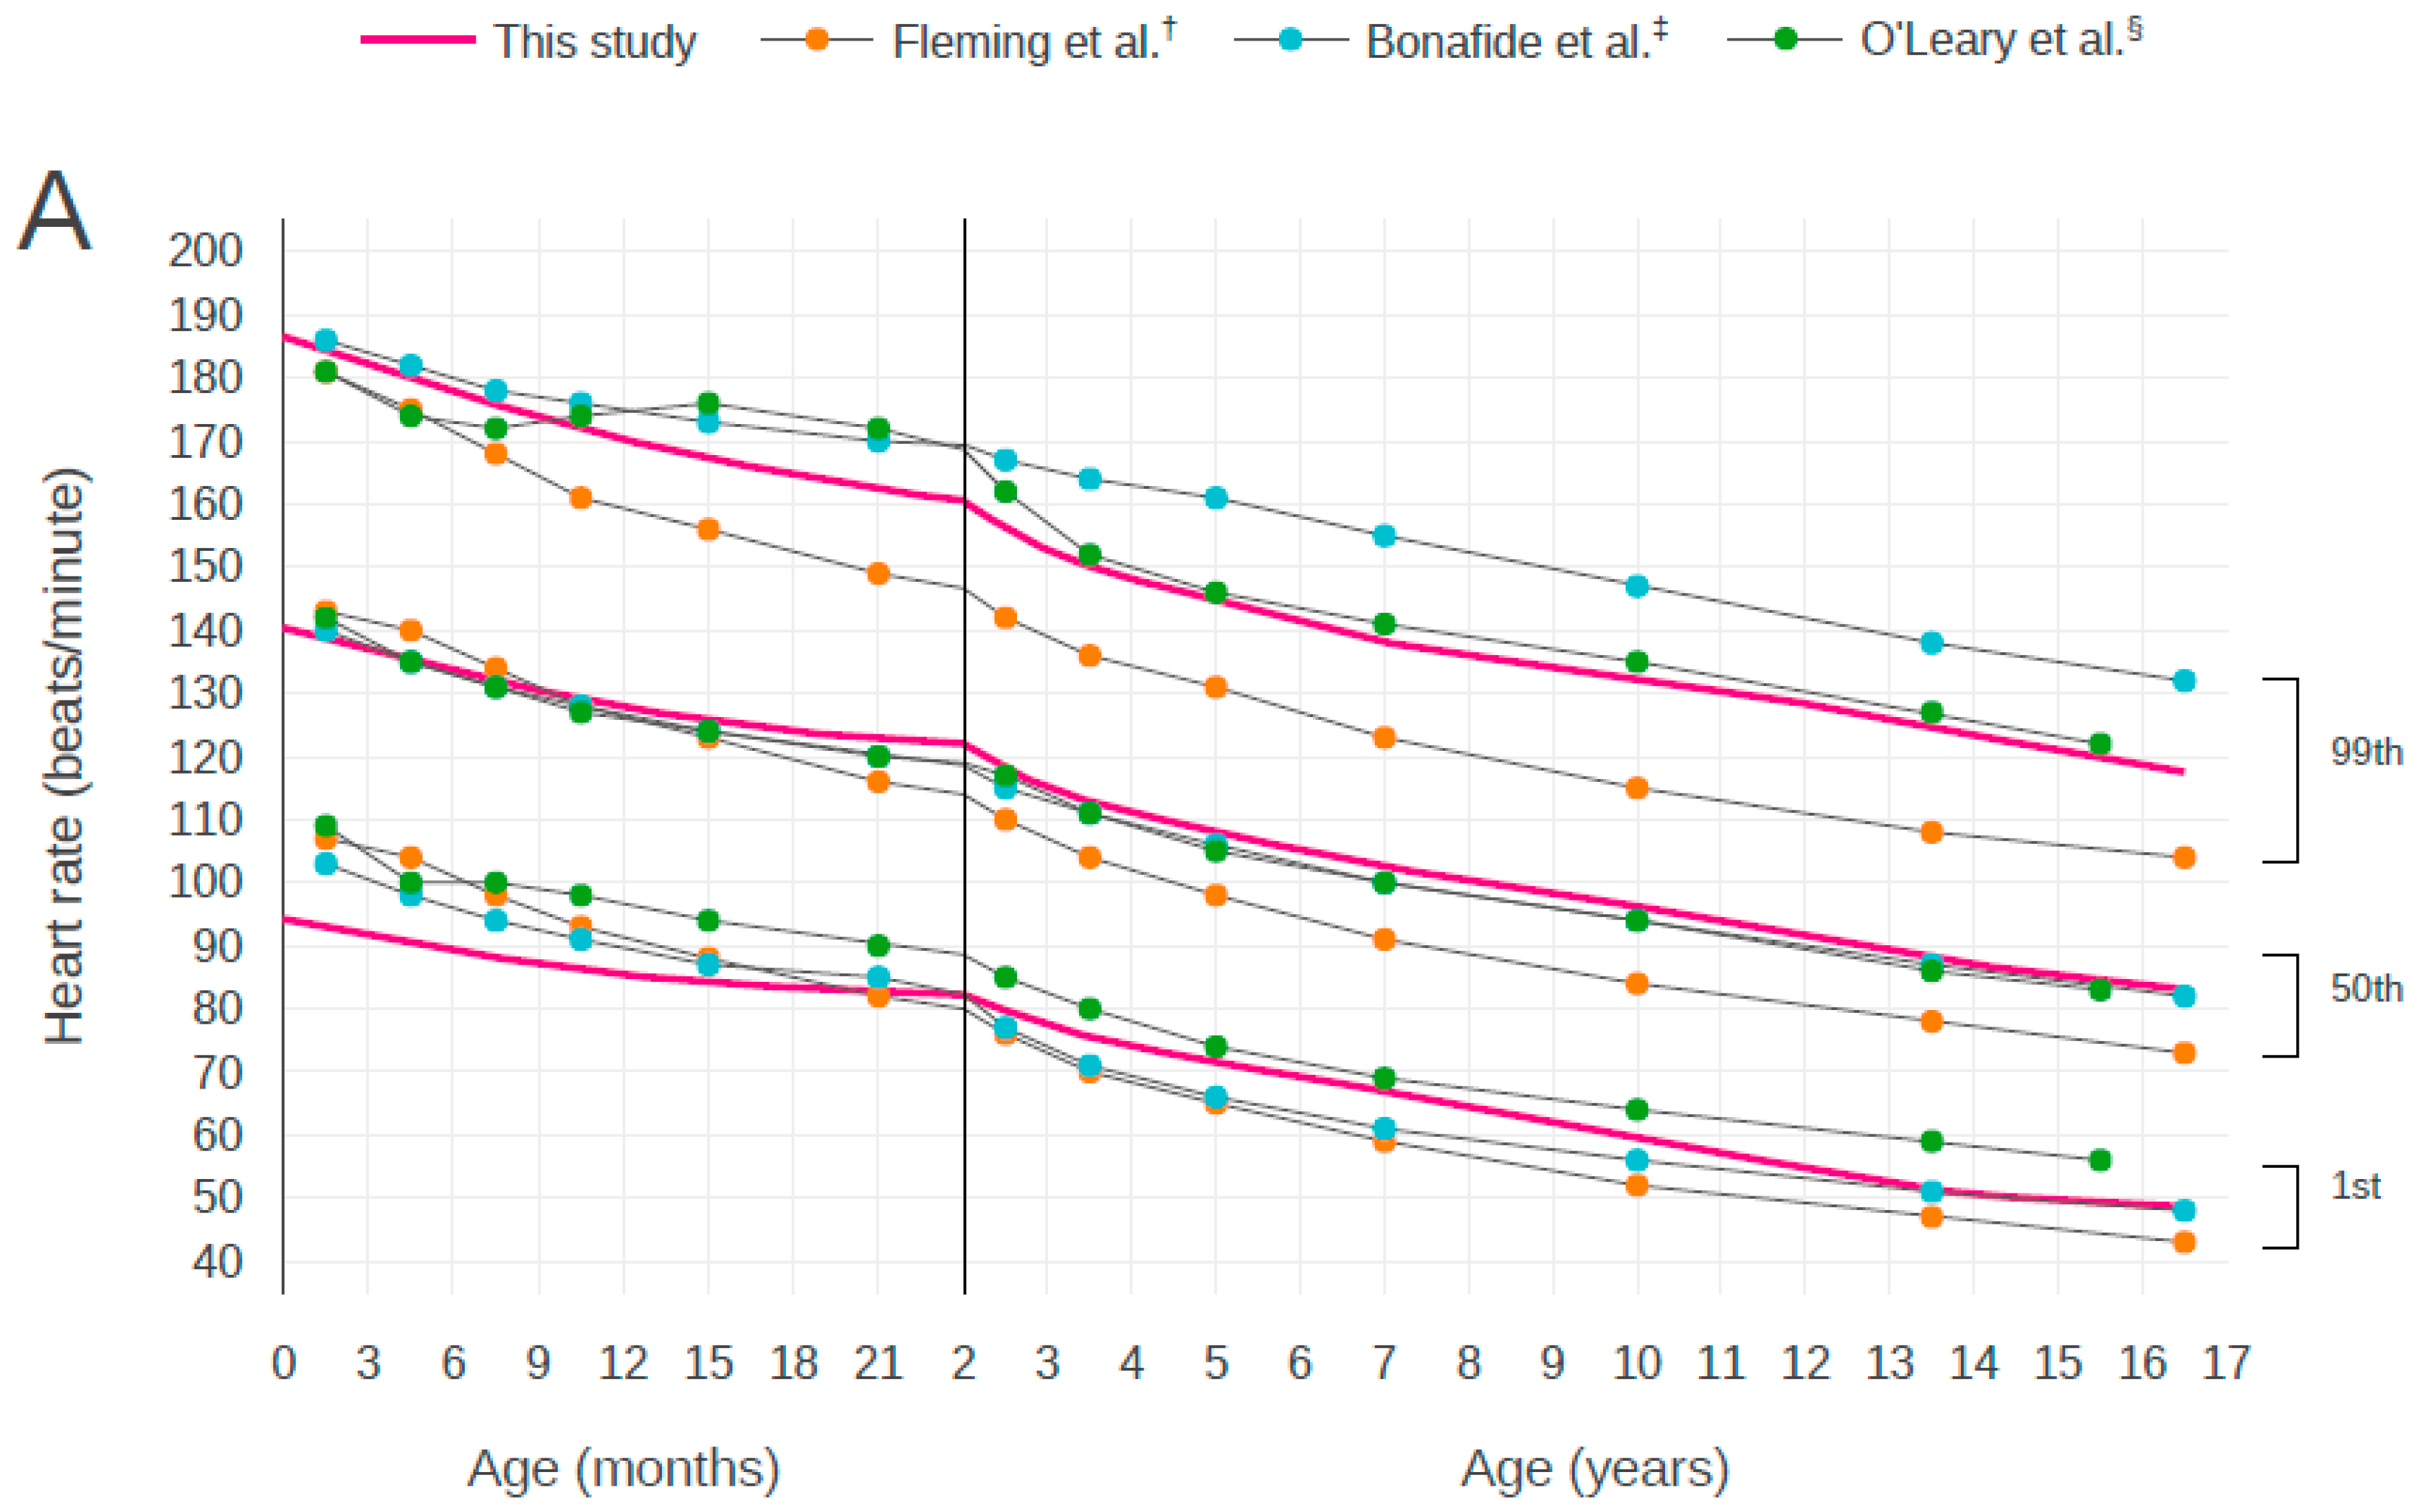
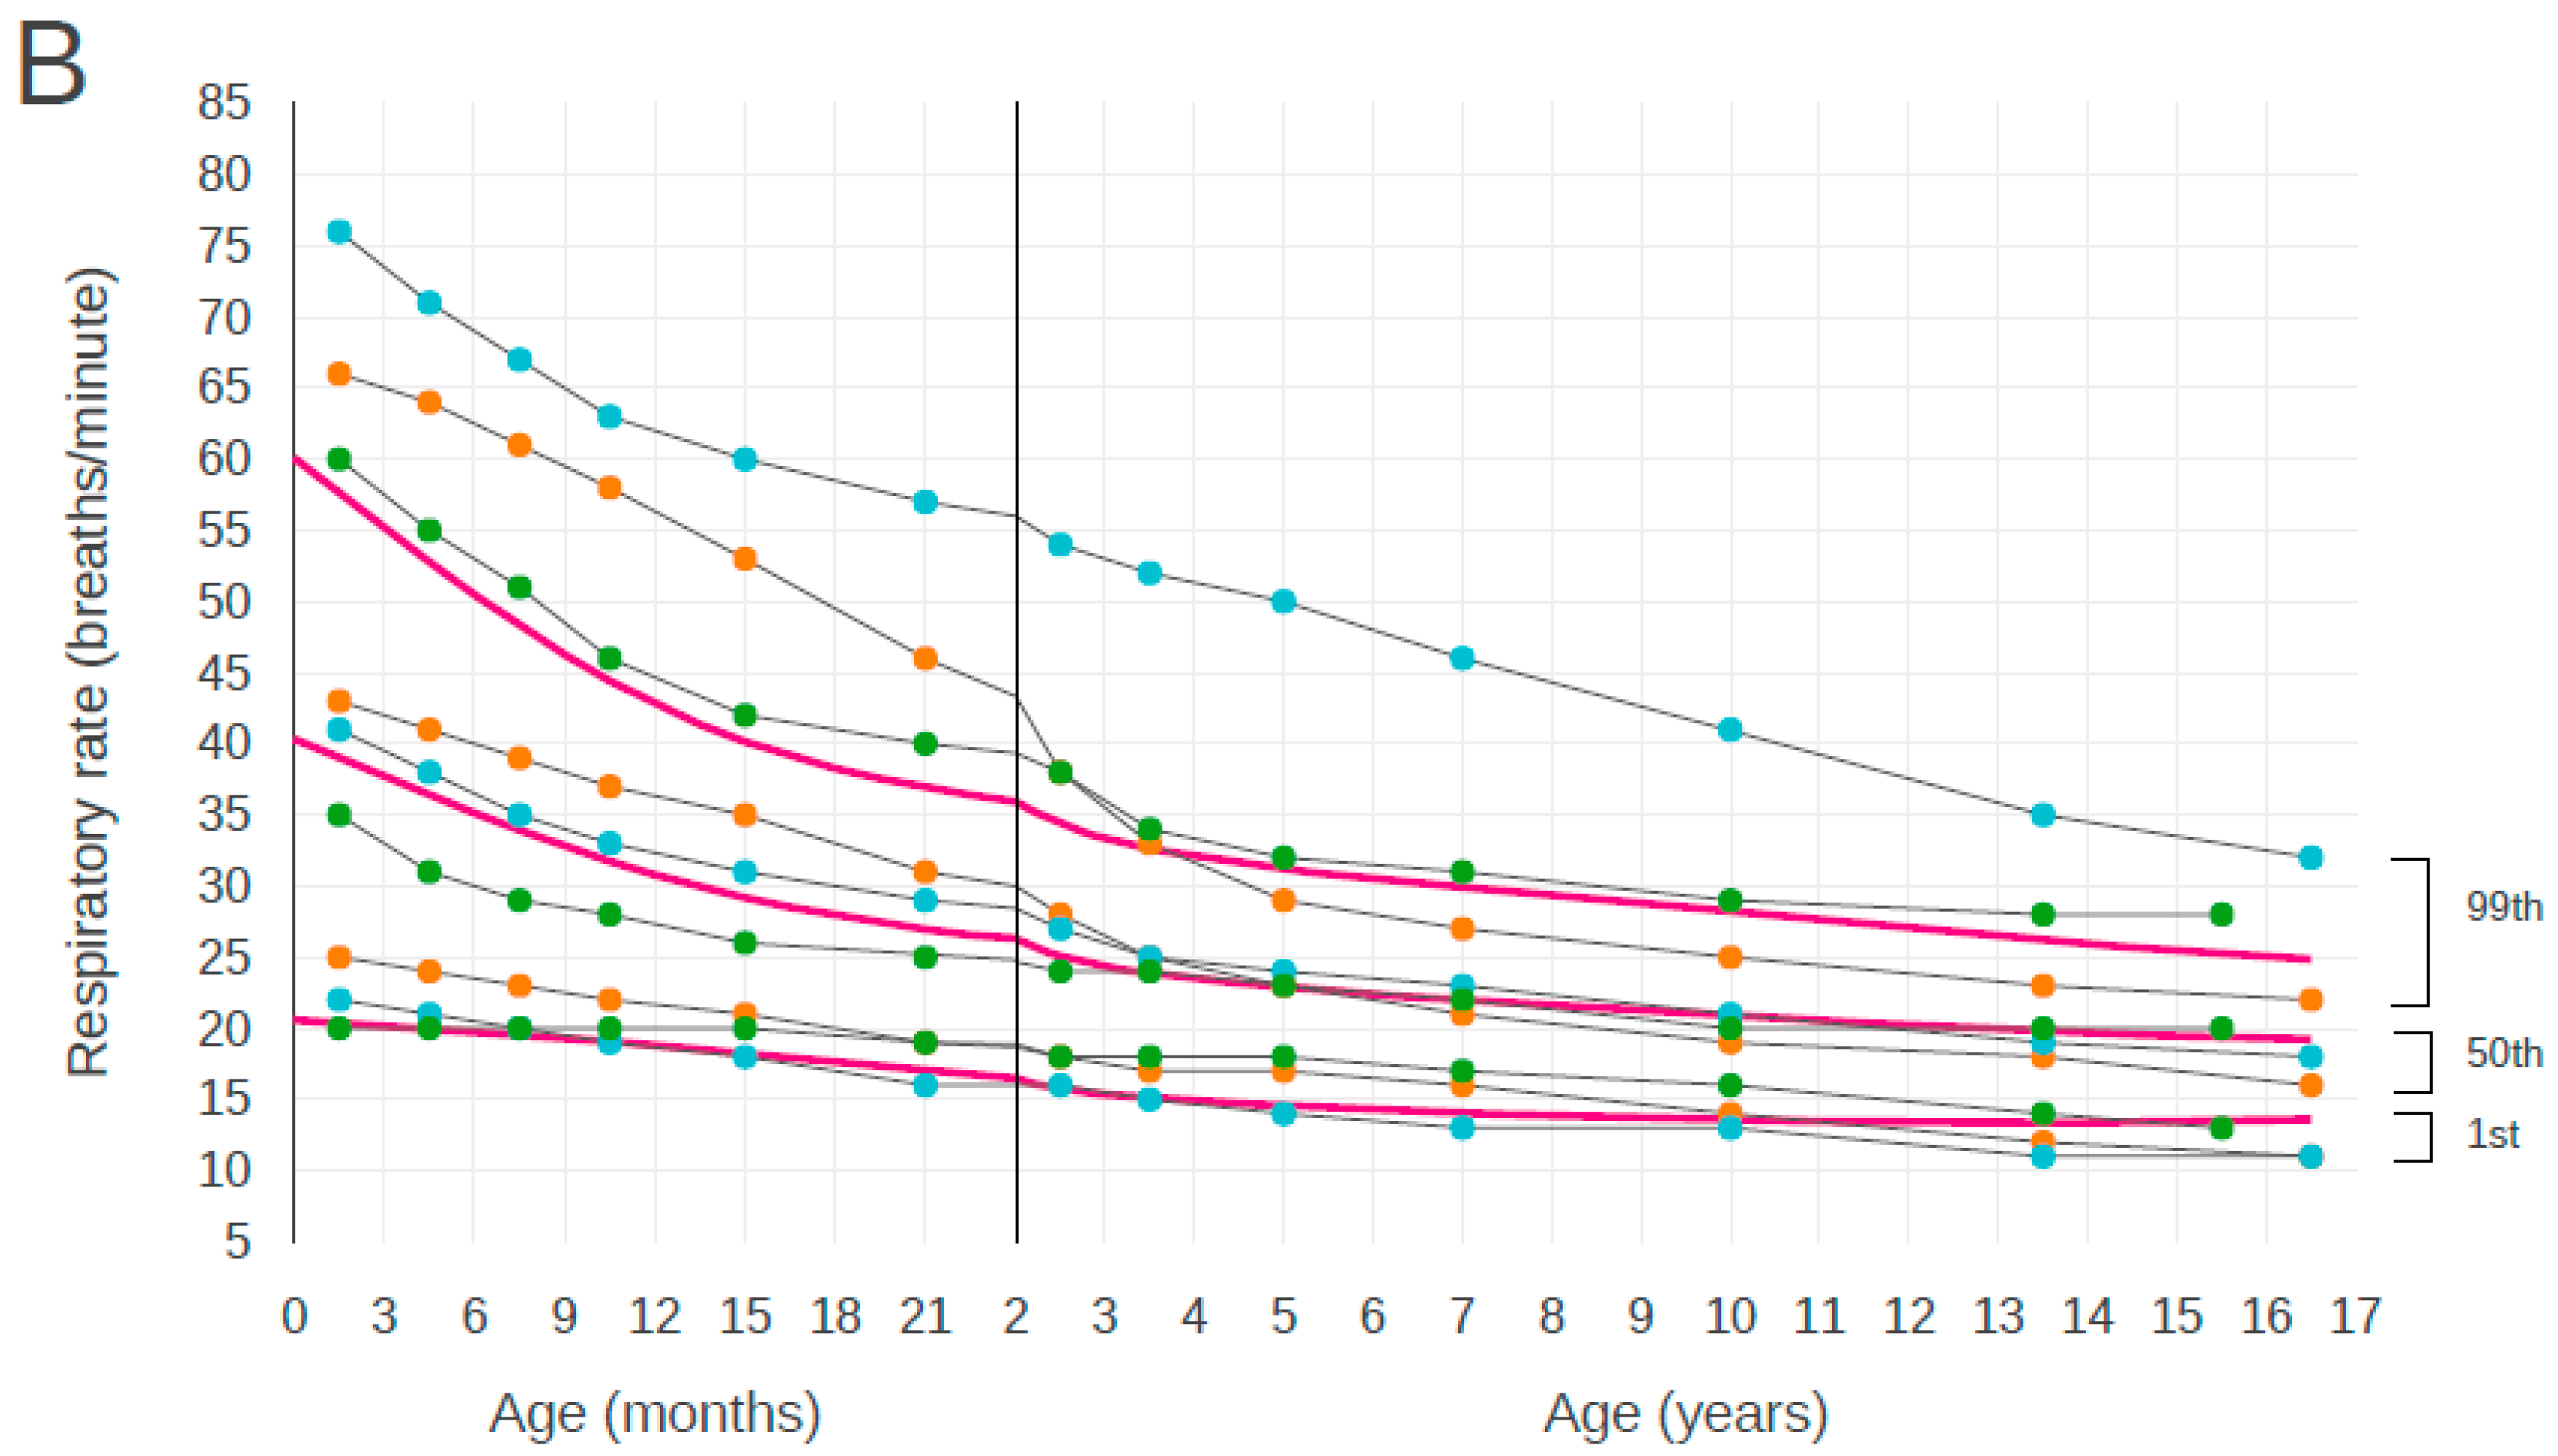
We compared our results with the centile curves reported in previous studies [5,6,8]. There were some differences between the centile curves, but there was general agreement that the centiles show a decline in HR and RR from birth to early adolescence. In curves for both HR and RR, the ranges indicated by Bonafide et al. (from the 1st centile to the 99th centile) were the widest for almost all ages (Figure 5).
The HRs of 12.9% children were higher than the APLS upper limit and the HRs of 4.3% of children were lower than the APLS lower limit. The HRs of 82.9% children existed within the reference ranges of APLS. The HRs of 14.5% children were higher than the PALS upper limit and the HRs of 0.7% children were lower than the PALS lower limit. The HRs of 84.8% children existed within the reference ranges of PALS.
The RRs of 9.0% children were higher than the APLS upper limit and the RRs of 31.9% children were lower than the APLS lower limit. The RRs of 59.1% children existed within the reference ranges of the APLS guidelines. The RRs of 11.1% children higher than the APLS upper limit and the RRs of 21.6% children were lower than the PALS lower limit. The RRs of 67.3% children existed within the reference ranges of the PALS guidelines.
4. Discussion
In this study, we derived distributions of HR and RR at normal BT and stratified by age in children who visited EDs in Korea, using data from a nationwide dataset, NEDIS. The ascertainment of reference ranges for vital signs in children remains challenging. To the best of our knowledge, this is the first study to derive specific distributions of HR and RR at normal BT in children in hospital ED settings throughout the country.
There have been prior attempts to derive age-based centile charts for children. Fleming et al. presented age-specific centiles developed for HR and RR by systematically reviewing 69 studies [5]. However, all referred studies were conducted among healthy or sleeping children. We know that sleeping children have lower HR and RR. We believe that there are substantial discrepancies in the ranges of HR and RR, because most children who visit EDs are awake at the EDs.
We derived distributions of HR and RR at normal BT in children who visited EDs. It is well known that HR and RR vary depending on BT [14,15,16,17]. HR and RR tended to increase with increasing BT at the time of measurement in our study. Therefore, the distribution of HR and RR should consider the BT of the population from which the distribution was derived. However, previous studies did not consider the effects of BT on HR and RR in children [5,8]. The reference range reported from a tertiary referral pediatric hospital in Australia excluded patients with BT above 38 °C [6]. This minimized the effects of high BT on other vital signs in their pediatric ED cohort. Nevertheless, the possibility of hypothermia remained.
APLS and PALS are widely used resources for the acute care of children. As shown in Figure 3 and Figure 4, the utility of thresholds recommended by APLS and PALS may be limited in our population. Graphical comparison suggests that the thresholds of both guidelines could lead to substantial under- or over-identification of at-risk children. We believe that the thresholds for HR and RR for pediatric resuscitation have substantial discrepancies with ranges obtained for pediatric populations in a real-world setting. This may be a natural consequence because the APLS and PALS guidelines have simplified thresholds in accordance with age for applying at the moment impending resuscitation. Further studies which compare the outcomes of assessed patients based on real-world data and simplified thresholds of resuscitation guidelines are needed to determine vital sign thresholds and to validate for setting alarm limits or risk-stratifying children.
This study has several limitations. First, this was a retrospective study which extracted the data from the registry. Since the data of this study were provided anonymously, the possibility that the HR or RR of the same patient being included more than once cannot be excluded. In addition, we could not control for all other factors, excluding fever, which could potentially affect the vital signs of children at Eds, such as pain, anxiety, and method of measurement. Second, to remove possible conditions that could affect HR or RR, we removed data of patients with cardiovascular disease, respiratory disease, and those who were admitted to the ICU. However, it was not possible to completely exclude more specific personal characteristics beyond those collected by the NEDIS. These are inherent limitations of de-identified public datasets and these are not specific to this study. Finally, there were some missing values of vital signs. However, this may explain the characteristics of pediatric patients who have difficulty in measuring vital signs compared to adults.
5. Conclusions
We derived pediatric centile curves for HR and RR by age under normal BT using a nationwide dataset from emergency medical institutions in Korea. We believe that our data provide a reliable representation of HR and RR distributions in children who visited EDs. These data could be used to establish alarm limits and risk-stratifying children in EDs. In addition, we believe our data can be used as baseline data for the comparing differences in HR and RR distribution in the pediatric population visiting EDs. Well-designed large prospective studies are needed to overcome the limitations of our study and to validate vital sign reference ranges in pediatric EDs.
Author Contributions
Conceptualization, B.L.; Methodology, B.L., K.K., and W.B.; Data Analysis, W.B., K.K., and B.L.; Writing-Original draft, W.B.; Writing-Revision, K.K. All authors have read and approved the final manuscript.
Funding
This research received no external funding.
Conflicts of Interest
The authors declare no conflict of interest.
References
- Kleinman, M.E.; Chameides, L.; Schexnayder, S.M.; Samson, R.A.; Hazinski, M.F.; Atkins, D.L.; Berg, M.D.; de Caen, A.R.; Fink, E.L.; Freid, E.B.; et al. Part 14: Pediatric advanced life support: 2010 American Heart Association Guidelines for Cardiopulmonary Resuscitation and Emergency Cardiovascular Care. Circulation 2010, 122, S876–S908. [Google Scholar] [CrossRef] [PubMed] [Green Version]
- Samuels, M.; Wieteska, S. Advanced Paediatric Life Support: The Practical Approach, 5th ed.; Wiley-Blackwell: Hoboken, NJ, USA, 2012. [Google Scholar]
- Duncan, H.; Hutchison, J.; Parshuram, C.S. The Pediatric Early Warning System score: A severity of illness score to predict urgent medical need in hospitalized children. J. Crit. Care 2006, 21, 271–278. [Google Scholar] [CrossRef] [PubMed]
- Lee, B.; Kim, D.K.; Park, J.D.; Kwak, Y.H. Clinical Considerations When Applying Vital Signs in Pediatric Korean Triage and Acuity Scale. J. Korean Med. Sci. 2017, 32, 1702–1707. [Google Scholar] [CrossRef] [PubMed] [Green Version]
- Fleming, S.; Thompson, M.; Stevens, R.; Heneghan, C.; Pluddemann, A.; Maconochie, I.; Tarassenko, L.; Mant, D. Normal ranges of heart rate and respiratory rate in children from birth to 18 years of age: A systematic review of observational studies. Lancet 2011, 377, 1011–1018. [Google Scholar] [CrossRef] [Green Version]
- O’Leary, F.; Hayen, A.; Lockie, F.; Peat, J. Defining normal ranges and centiles for heart and respiratory rates in infants and children: A cross-sectional study of patients attending an Australian tertiary hospital paediatric emergency department. Arch. Dis. Child. 2015, 100, 733–737. [Google Scholar] [CrossRef] [PubMed] [Green Version]
- Sepanski, R.J.; Godambe, S.A.; Zaritsky, A.L. Pediatric vital sign distribution derived from a multi-centered emergency department database. Front. Pediatr. 2018, 6, 66. [Google Scholar] [CrossRef] [PubMed]
- Bonafide, C.P.; Brady, P.W.; Keren, R.; Conway, P.H.; Marsolo, K.; Daymont, C. Development of heart and respiratory rate percentile curves for hospitalized children. Pediatrics 2013, 131, e1150–e1157. [Google Scholar] [CrossRef] [PubMed] [Green Version]
- Rigby, R.A.; Stasinopoulos, D.M. Smooth centile curves for skew and kurtotic data modelled using the Box-Cox power exponential distribution. Stat. Med. 2004, 23, 3053–3076. [Google Scholar] [CrossRef] [PubMed]
- Rigby, R.A.; Stasinopoulos, D.M. Automatic smoothing parameter selection in GAMLSS with an application to centile estimation. Stat. Methods Med. Res. 2014, 23, 318–332. [Google Scholar] [CrossRef] [PubMed]
- Indrayan, A. Demystifying LMS and BCPE methods of centile estimation for growth and other health parameters. Indian Pediatr. 2014, 51, 37–43. [Google Scholar] [CrossRef] [PubMed]
- Cole, T.J.; Green, P.J. Smoothing reference centile curves: The LMS method and penalized likelihood. Stat. Med. 1992, 11, 1305–1319. [Google Scholar] [CrossRef] [PubMed]
- Cole, T.J. The LMS method for constructing normalized growth standards. Eur. J. Clin. Nutr. 1990, 44, 45–60. [Google Scholar] [PubMed]
- Davies, P.; Maconochie, I. The relationship between body temperature, heart rate and respiratory rate in children. Emerg. Med. J. 2009, 26, 641–643. [Google Scholar] [CrossRef] [PubMed]
- Daymont, C.; Bonafide, C.P.; Brady, P.W. Heart rates in hospitalized children by age and body temperature. Pediatrics 2015, 135, e1173–e1181. [Google Scholar] [CrossRef] [PubMed] [Green Version]
- Nijman, R.G.; Thompson, M.; van Veen, M.; Perera, R.; Moll, H.A.; Oostenbrink, R. Derivation and validation of age and temperature specific reference values and centile charts to predict lower respiratory tract infection in children with fever: Prospective observational study. Br. Med. J. 2012, 345, e4224. [Google Scholar] [CrossRef] [PubMed] [Green Version]
- Thompson, M.; Harnden, A.; Perera, R.; Mayon-White, R.; Smith, L.; McLeod, D.; Mant, D. Deriving temperature and age appropriate heart rate centiles for children with acute infections. Arch. Dis. Child. 2009, 94, 361–365. [Google Scholar] [CrossRef] [PubMed]
Figure 1.
Flowchart of the screening process and the demographic data. Data are presented as median (interquartile range) or number (percentage) of participants.
Figure 1.
Flowchart of the screening process and the demographic data. Data are presented as median (interquartile range) or number (percentage) of participants.

Figure 2.
Centile curves for heart rate and respiratory rate by age. Centile curves for (A) heart rate and (B) respiratory rate by age in children with normal body temperature. The solid vertical line at 2 year of age represents a change in the scale of the x-axis.
Figure 2.
Centile curves for heart rate and respiratory rate by age. Centile curves for (A) heart rate and (B) respiratory rate by age in children with normal body temperature. The solid vertical line at 2 year of age represents a change in the scale of the x-axis.

Figure 3.
Centile curves for heart rate by age. Centile curves of heart rate by age with visual comparison against the centile curves from advanced pediatric life support (A) and pediatric advanced life support (B) guidelines.
Figure 3.
Centile curves for heart rate by age. Centile curves of heart rate by age with visual comparison against the centile curves from advanced pediatric life support (A) and pediatric advanced life support (B) guidelines.

Figure 4.
Centile curves for respiratory rate by age. Centile curves of respiratory rate by age with visual comparison against the centile curves from advanced pediatric life support (A) and pediatric advanced life support (B) guidelines.
Figure 4.
Centile curves for respiratory rate by age. Centile curves of respiratory rate by age with visual comparison against the centile curves from advanced pediatric life support (A) and pediatric advanced life support (B) guidelines.

Figure 5.
Comparison of the centile curves for heart rate and respiratory rate by age with the curves from previous studies. Centile curves of (A) heart rate and (B) respiratory rate by age with visual comparison against the centile curves from previous studies. The solid vertical line at 2 years of age represents a change in the scale of the x-axis. † Data from Fleming et al. [5]. ‡ Data from Bonafide et al. [8]. § Data from O’Leary et al. [6].


Table 1.
Centile chart of heart rate per minute by age group.
| Age | Centile | ||||||||||||
|---|---|---|---|---|---|---|---|---|---|---|---|---|---|
| 1st | 3rd | 5th | 10th | 15th | 25th | 50th | 75th | 85th | 90th | 95th | 97th | 99th | |
| 0–<3 months | 93 | 102 | 106 | 113 | 118 | 125 | 139 | 152 | 159 | 164 | 171 | 176 | 184 |
| 3–<6 months | 90 | 99 | 104 | 111 | 115 | 122 | 135 | 148 | 155 | 160 | 167 | 171 | 180 |
| 6–<9 months | 88 | 97 | 101 | 108 | 112 | 119 | 132 | 145 | 151 | 156 | 163 | 167 | 176 |
| 9–<12 months | 86 | 94 | 99 | 105 | 110 | 117 | 129 | 142 | 148 | 153 | 159 | 164 | 172 |
| 12–<15 months | 85 | 93 | 97 | 104 | 108 | 115 | 127 | 139 | 145 | 150 | 156 | 161 | 169 |
| 15–<18 months | 84 | 92 | 96 | 102 | 107 | 113 | 125 | 137 | 143 | 147 | 154 | 158 | 166 |
| 18–<21 months | 83 | 91 | 95 | 101 | 105 | 112 | 123 | 135 | 141 | 145 | 152 | 156 | 164 |
| 21–<24 months | 82 | 90 | 94 | 100 | 104 | 110 | 122 | 133 | 139 | 144 | 150 | 154 | 161 |
| 2–<3 years | 80 | 87 | 91 | 97 | 101 | 107 | 118 | 129 | 135 | 139 | 145 | 149 | 156 |
| 3–<4 years | 76 | 83 | 86 | 92 | 96 | 102 | 113 | 124 | 129 | 133 | 139 | 143 | 150 |
| 4–<5 years | 73 | 80 | 84 | 89 | 93 | 99 | 110 | 120 | 126 | 130 | 136 | 139 | 146 |
| 5–<6 years | 70 | 77 | 81 | 87 | 90 | 96 | 107 | 117 | 123 | 127 | 132 | 136 | 143 |
| 6–<7 years | 68 | 75 | 79 | 84 | 88 | 93 | 104 | 114 | 120 | 123 | 129 | 133 | 140 |
| 7–<8 years | 66 | 73 | 76 | 82 | 86 | 91 | 101 | 112 | 117 | 121 | 127 | 130 | 137 |
| 8–<9 years | 64 | 70 | 74 | 80 | 83 | 89 | 99 | 110 | 115 | 119 | 125 | 128 | 135 |
| 9–<10 years | 61 | 68 | 72 | 77 | 81 | 87 | 97 | 108 | 113 | 117 | 123 | 127 | 133 |
| 10–<11 years | 59 | 66 | 69 | 75 | 79 | 85 | 95 | 106 | 111 | 115 | 121 | 125 | 132 |
| 11–<12 years | 56 | 63 | 67 | 72 | 76 | 82 | 93 | 103 | 109 | 113 | 119 | 122 | 130 |
| 12–<13 years | 53 | 60 | 64 | 70 | 74 | 80 | 90 | 101 | 107 | 111 | 116 | 120 | 127 |
| 13–<14 years | 51 | 58 | 62 | 68 | 72 | 77 | 88 | 99 | 104 | 108 | 114 | 118 | 125 |
| 14–<15 years | 50 | 57 | 61 | 66 | 70 | 76 | 86 | 97 | 102 | 106 | 112 | 115 | 122 |
| 15–<16 years | 49 | 56 | 60 | 65 | 69 | 74 | 85 | 95 | 100 | 104 | 110 | 113 | 120 |
Table 2.
Centile chart of respiratory rate per minute by age group.
| Age | Centile | ||||||||||||
|---|---|---|---|---|---|---|---|---|---|---|---|---|---|
| 1st | 3rd | 5th | 10th | 15th | 25th | 50th | 75th | 85th | 90th | 95th | 97th | 99th | |
| 0–<3 months | 20 | 24 | 26 | 29 | 31 | 34 | 39 | 44 | 47 | 49 | 52 | 54 | 58 |
| 3–<6 months | 20 | 23 | 25 | 27 | 29 | 32 | 36 | 41 | 44 | 45 | 48 | 50 | 53 |
| 6–<9 months | 20 | 22 | 24 | 26 | 28 | 30 | 34 | 38 | 40 | 42 | 44 | 46 | 48 |
| 9–<12 months | 19 | 21 | 23 | 25 | 26 | 28 | 32 | 35 | 37 | 39 | 41 | 42 | 44 |
| 12–<15 months | 19 | 21 | 22 | 24 | 25 | 27 | 30 | 33 | 35 | 36 | 38 | 39 | 41 |
| 15–<18 months | 18 | 20 | 21 | 23 | 24 | 25 | 29 | 32 | 33 | 34 | 36 | 37 | 39 |
| 18–<21 months | 17 | 19 | 20 | 22 | 23 | 24 | 27 | 30 | 32 | 33 | 35 | 36 | 38 |
| 21–<24 months | 17 | 19 | 20 | 21 | 22 | 24 | 27 | 29 | 31 | 32 | 34 | 35 | 36 |
| 2–<3 years | 16 | 18 | 18 | 20 | 21 | 22 | 25 | 28 | 29 | 30 | 32 | 33 | 34 |
| 3–<4 years | 15 | 17 | 18 | 19 | 20 | 21 | 24 | 26 | 28 | 29 | 30 | 31 | 33 |
| 4–<5 years | 15 | 16 | 17 | 19 | 19 | 21 | 23 | 26 | 27 | 28 | 29 | 30 | 32 |
| 5–<6 years | 14 | 16 | 17 | 18 | 19 | 20 | 23 | 25 | 26 | 27 | 28 | 29 | 31 |
| 6–<7 years | 14 | 16 | 16 | 18 | 19 | 20 | 22 | 24 | 26 | 27 | 28 | 29 | 30 |
| 7–<8 years | 14 | 15 | 16 | 17 | 18 | 20 | 22 | 24 | 25 | 26 | 27 | 28 | 30 |
| 8–<9 years | 14 | 15 | 16 | 17 | 18 | 19 | 21 | 24 | 25 | 26 | 27 | 28 | 29 |
| 9–<10 years | 14 | 15 | 16 | 17 | 18 | 19 | 21 | 23 | 24 | 25 | 26 | 27 | 29 |
| 10–<11 years | 14 | 15 | 16 | 17 | 18 | 19 | 21 | 23 | 24 | 25 | 26 | 27 | 28 |
| 11–<12 years | 13 | 15 | 15 | 17 | 17 | 18 | 20 | 22 | 23 | 24 | 25 | 26 | 27 |
| 12–<13 years | 13 | 15 | 15 | 16 | 17 | 18 | 20 | 22 | 23 | 24 | 25 | 25 | 27 |
| 13–<14 years | 13 | 15 | 15 | 16 | 17 | 18 | 20 | 22 | 23 | 23 | 24 | 25 | 26 |
| 14–<15 years | 13 | 15 | 15 | 16 | 17 | 18 | 20 | 21 | 22 | 23 | 24 | 25 | 26 |
| 15–<16 years | 13 | 15 | 15 | 16 | 17 | 18 | 19 | 21 | 22 | 23 | 24 | 24 | 25 |
© 2020 by the authors. Licensee MDPI, Basel, Switzerland. This article is an open access article distributed under the terms and conditions of the Creative Commons Attribution (CC BY) license (http://creativecommons.org/licenses/by/4.0/).
Share and Cite
MDPI and ACS Style
Bae, W.; Kim, K.; Lee, B. Distribution of Pediatric Vital Signs in the Emergency Department: A Nationwide Study. Children 2020, 7, 89. https://0-doi-org.brum.beds.ac.uk/10.3390/children7080089
AMA Style
Bae W, Kim K, Lee B. Distribution of Pediatric Vital Signs in the Emergency Department: A Nationwide Study. Children. 2020; 7(8):89. https://0-doi-org.brum.beds.ac.uk/10.3390/children7080089
Chicago/Turabian StyleBae, Woori, Kyunghoon Kim, and Bongjin Lee. 2020. "Distribution of Pediatric Vital Signs in the Emergency Department: A Nationwide Study" Children 7, no. 8: 89. https://0-doi-org.brum.beds.ac.uk/10.3390/children7080089
Note that from the first issue of 2016, this journal uses article numbers instead of page numbers. See further details here.