1. Introduction
Alternative means for the replacement of fossil fuels for electricity generation have been commonly accepted since severe climate change has induced enormous environmental impacts and caused dramatic disasters around the world. The most popular substitutes for fossil fuels that are being considered are reproducible natural resources such as solar energy, wind energy, ocean energy, or other forms of non-fossil combustion energy. Ocean energy is a massive source of power and has been studied for a long time in many ways, such as through the applications for tidal waves, power generated from ocean currents, and the utilization of temperature differences and salinity differences in oceans. Among all kinds of ocean energy, wave energy is the one being studied most thoroughly because it is well distributed in oceans around the world and the energy is abundantly available for exploration. According to a study, the potential of wave energy can reach as high as 32,000 TWh a year, which would meet the energy requirements of the whole world in 2010 [
1]. However, this estimation is based on data from a global wind–wave model calibrated against satellite altimeter data and buoy data, and a more advanced method to accurately estimate the potential of wave energy region by region is still needed.
The exploration of wave energy has been extensively studied, among which an oscillating water column (OWC) wave energy converting system is the one with relatively higher efficiency. As mentioned in the previous study [
2], researches on the OWC-type wave energy converting system still have a very active status, as exemplified by the efforts for energy harvest improvement by changing the shape of a traditional OWC system into a U-OWC [
3,
4]; as well, some used a backward-bent duct buoy (BBDB-OWC) [
5]. The others who aimed to improve the energy harvest ability applied a double-chamber in deep water [
6]. Some studied its influence on energy conversion by bending the front wall of the chamber [
7]. The efficiency of turbine performance was also studied [
8,
9]. Investigations on the wave-height and power taking-off damping effect was carried out experimentally and numerically [
10]. Performance of the air-chamber, focusing on the air compressibility, has been studied experimentally. This study concluded that a model scaled down to 1/50 may result in an overestimation of up to 15% for the air pressure in the OWC chamber [
11]. The study points out that attention must be paid to the experimental test for a scaled-down model in a laboratory.
When the OWC wave energy converting systems are located by the shoreline, where incident waves will propagate right into the air-chamber of the OWC wave energy converter and react inside the chamber, the wave energy is easier to be captured and derives a larger converting efficiency. However, when an OWC wave energy converter is installed in the open sea, the wave will most likely pass by the structure, and usually the energy captured from the incident waves will be much less than for a system situated at the shoreline. Given the difficulties previously mentioned, only a few researches have studied an OWC wave energy converter situated in an open sea environment. Lately [
12], an OWC wave energy converting system integrated with the column of a jacket platform was studied. The study found that the integrated device might have certain effectiveness and feasibility. The other study was for the application of an OWC wave energy converting system used in buoys for sensors [
13]. The analysis revealed that these self-powered sensor buoys are able to provide the required power output for the considered wave conditions. However, in the case of an OWC installed on a buoy [
13]—similar to some of the applications on a floating structure [
14,
15]—the behavior will not be able to be applied to the OWC installed on a fixed offshore structure. However, some new studies on so called “Hybrid Wind–Wave Energy Converters” (or HWWEC) that were applied to jacket structures are the of innovations that integrated the wind turbine offshore template infrastructure with an OWC wave energy converter [
16,
17]. Those researches are pioneers in the study of an OWC wave every converter situated in the open sea.
By generally following the associated study [
2], this part of the research of an OWC wave energy converting system integrated with an offshore jacket platform was studied experimentally. The purposes of this study will focus on the effectiveness of the OWC system in the open sea, as the one in the study is built on an offshore template structure, and, furthermore, to examine the possibility for improving the effectiveness of the traditional wave converting system. Since this has already been verified for the OWC system located at the shoreline [
18], and the stress exerting on the structure could be enormous and may cause severe damage to the structure, the current stage of research of the complicated types of OWC systems that may induce larger wave forces are not considered.
It’s already been introduced in the analytical study [
2] that the OWC wave energy converting system was built right in the space among the legs of an offshore jacket structure so that the air-chamber can be adjusted to allow for an optimum ratio between the outlet orifice and the water surface contained in the chamber. In this study, a scaled down structural model was built basically following the prototype of the previous study, wherein an offshore template structure was meant to be the foundation for a wind turbine system but was installed with an additional OWC wave converting system to extend the utilization of the structure. The scale factor for the model is set as 1/36 due to the limitation of the testing facility, such as the size of the water-tank and the wave flume’s capacity. Usually for an experimental test, a larger scale of testing model may have better simulation results, otherwise difficulties may occur, such as the one mentioned in reference [
11] that was induced from a small-scale model with 1/50 scale factor.
As presented in a recent study [
2,
19,
20], the parameters examined in this experimental study include the dimensions of the OWC chamber, such as the orifice of the air chamber that allows airflow in/output, the size of the opening gate for incident waves, and the submerged depth of the air chamber. All of these parameters are presented in dimensionless form, while wave height and period of waves are considered in a range of variations. Similar to the analytical study, the parameters to be examined in this experimental test of the performing efficiency of the OWC wave converter integrated in the offshore template structure will include variations in the orifice, the size of the air chamber in terms of its height, and the openings of the gate facing the incident waves. All of these parameters are presented in dimensionless form. Besides the influence on the converting efficiency from these parameters, some other effects observed from the experimental results of the scaled-down model test will also be investigated and discussed.
Corresponding to the parameters as mentioned, the analysis on the experimental testing data of the scaled-down model in this study will focus on the airflow velocity from the air chamber, the pneumatic power, and the converting efficiency in terms of a ratio between the pneumatic power and the energy of incident waves. During the test, the wave height and period of waves are varied based on the scaled-down applied waves, within the limitations of the testing facilities of the water–tank, and the corresponding effects to the converting efficiency are also discussed.
2. Experimental Model and Testing Procedure
2.1. Design of Scaled-Down Model for the Experimental Test
In this study, as introduced in the related study [
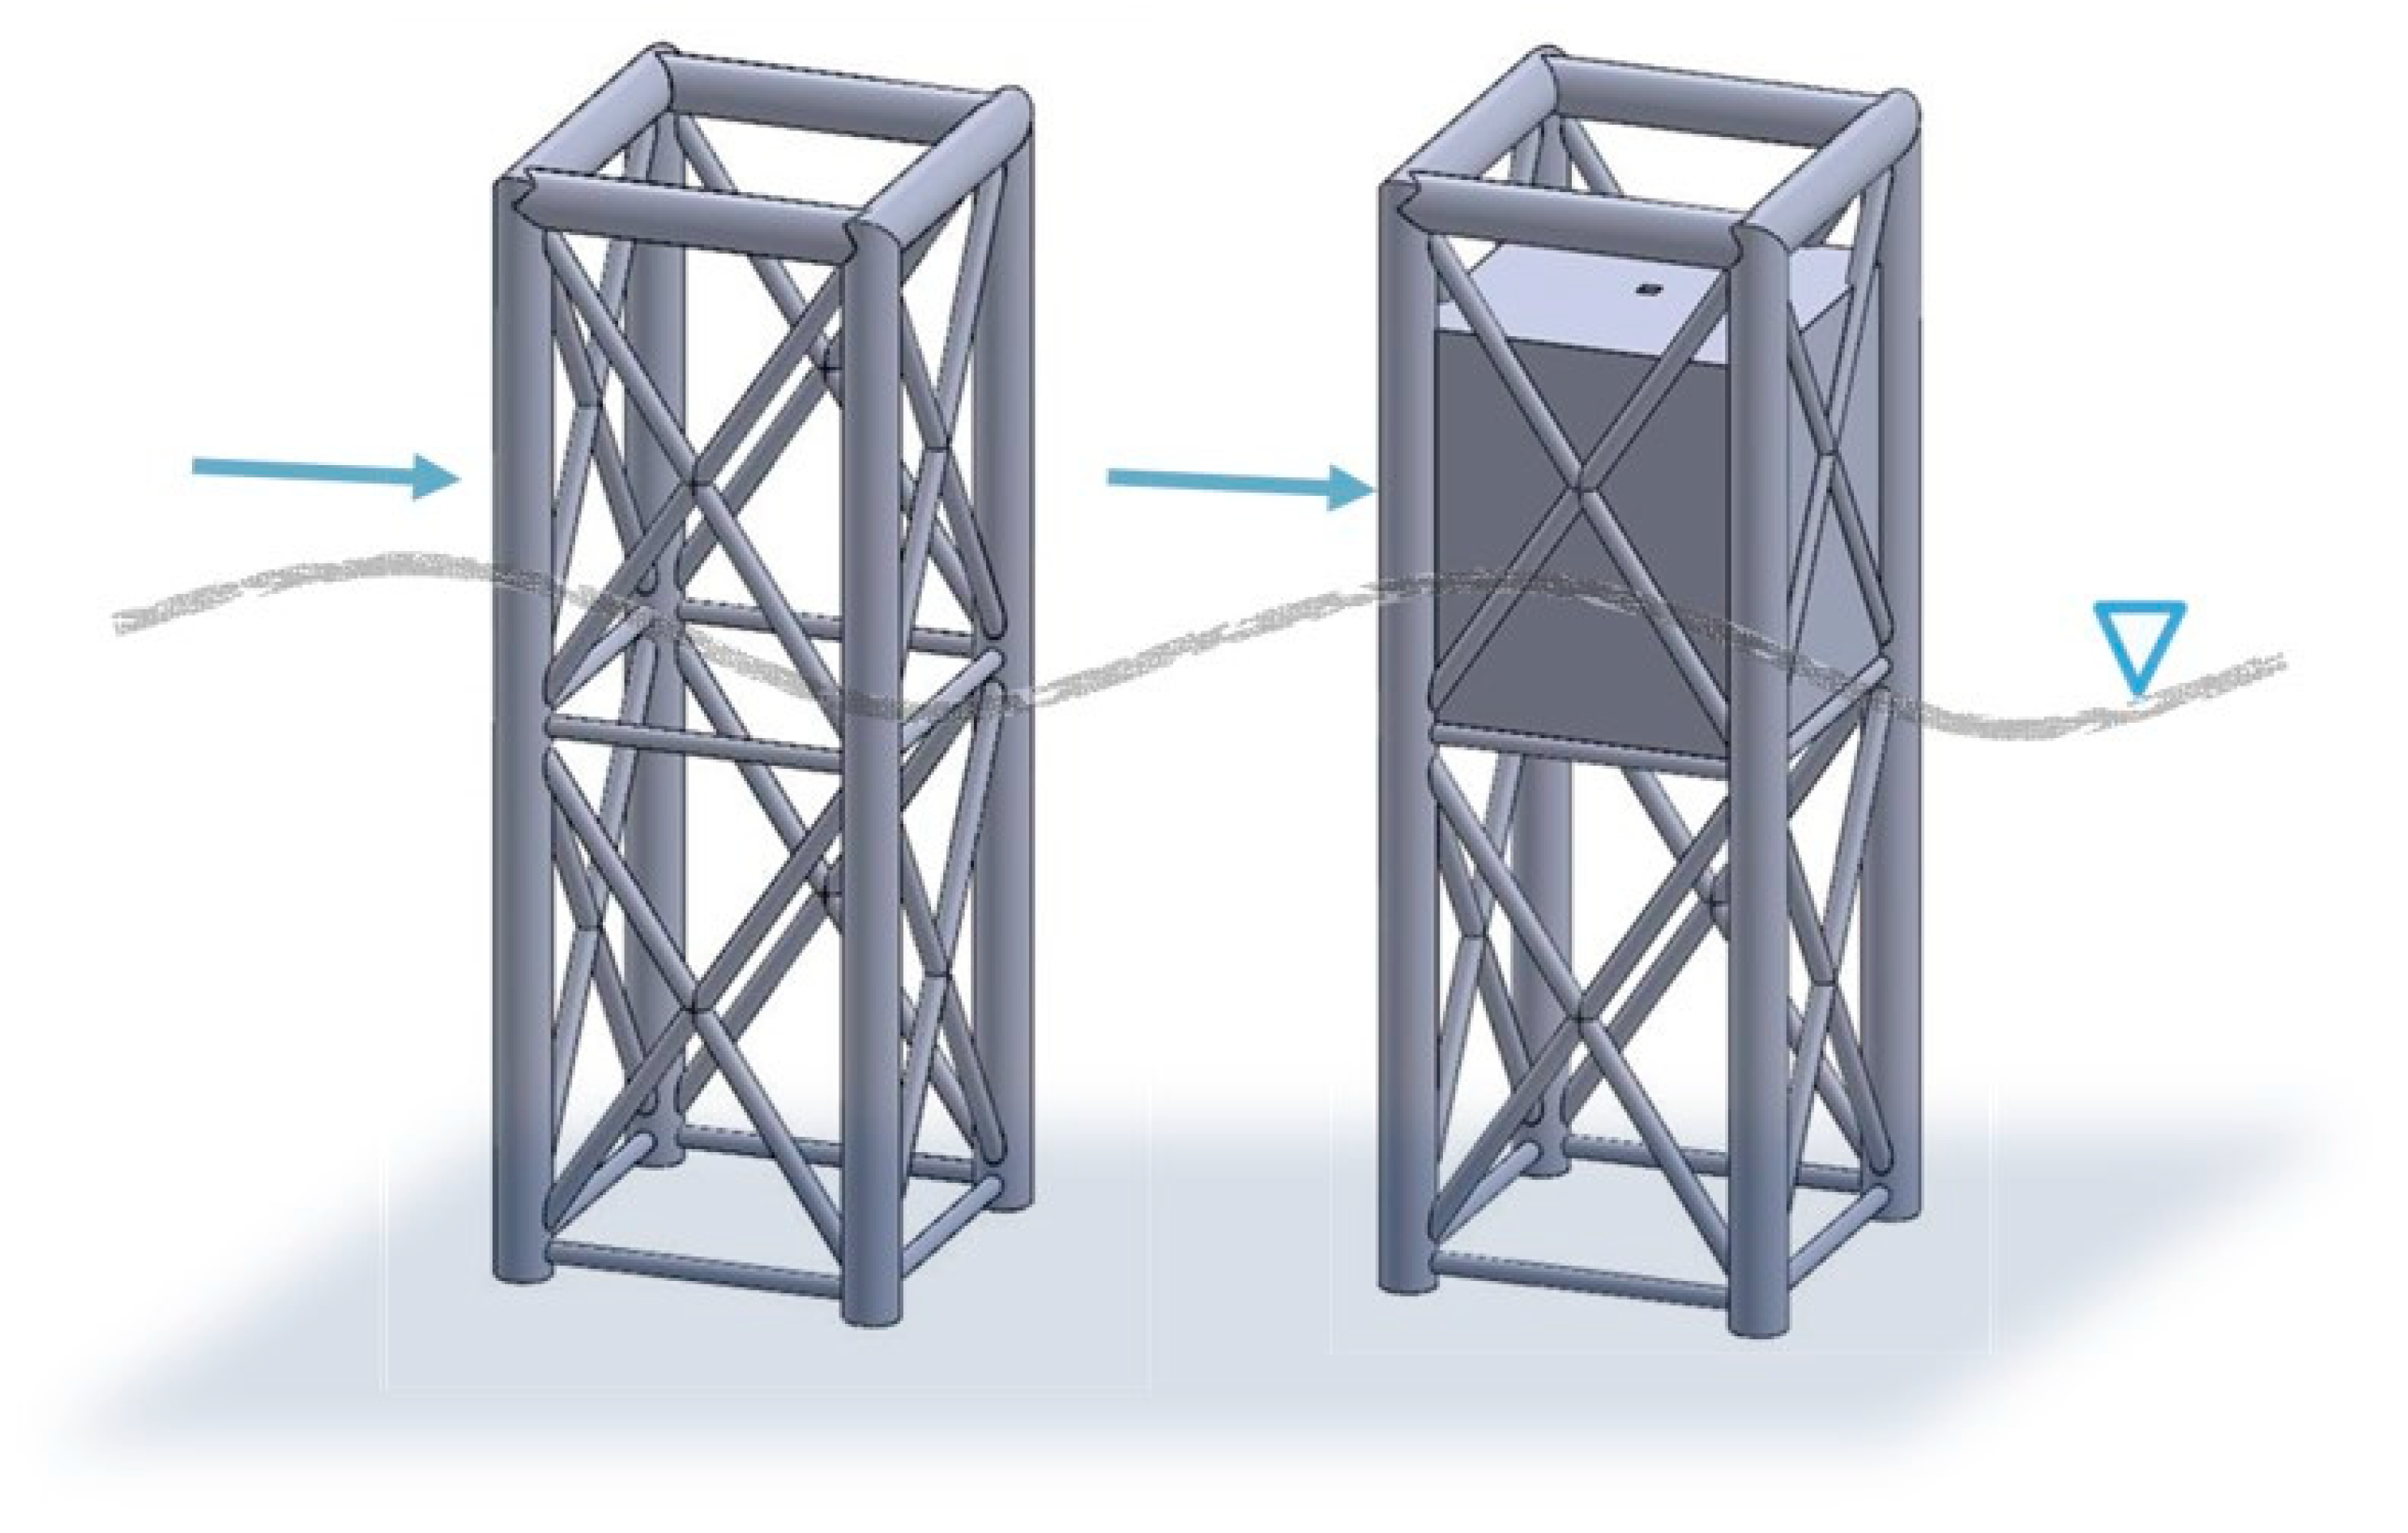
2], a typical template or jacket-type structure for the offshore wind turbine foundation located in water deeper than 30.0 m was designed with the installation of an accommodated OWC system. As shown in
Figure 1 [
2], it is a schematic 3-D view of the jacket-type structure associated with an OWC wave energy converting system, where the front side of the air chamber will allow for a square gate if necessary. This offshore jacket-type infrastructure for the wind power station was adapted from a preliminary design for Taipower from Taiwan, which is designed to locate a wind turbine with a 4–6 MW electricity power capacity for the annual average wind-speed, while the structure is based on a designed wave condition for a storm of 50 years with a return period at the proposed location.
The dimension of the prototype OWC chamber will basically follow the internal space of the frame of the template structure, where the side walls of the chamber are 12 m wide while the height of the wall is variable. Mainly, the position of the top ceiling of the OWC chamber was decided first and is 7 m above the water. The height of the wall varies between 15 m to 21 m (8–14 m submerged depth) and has a ratio of 0.5 to 0.7 to the water’s depth.
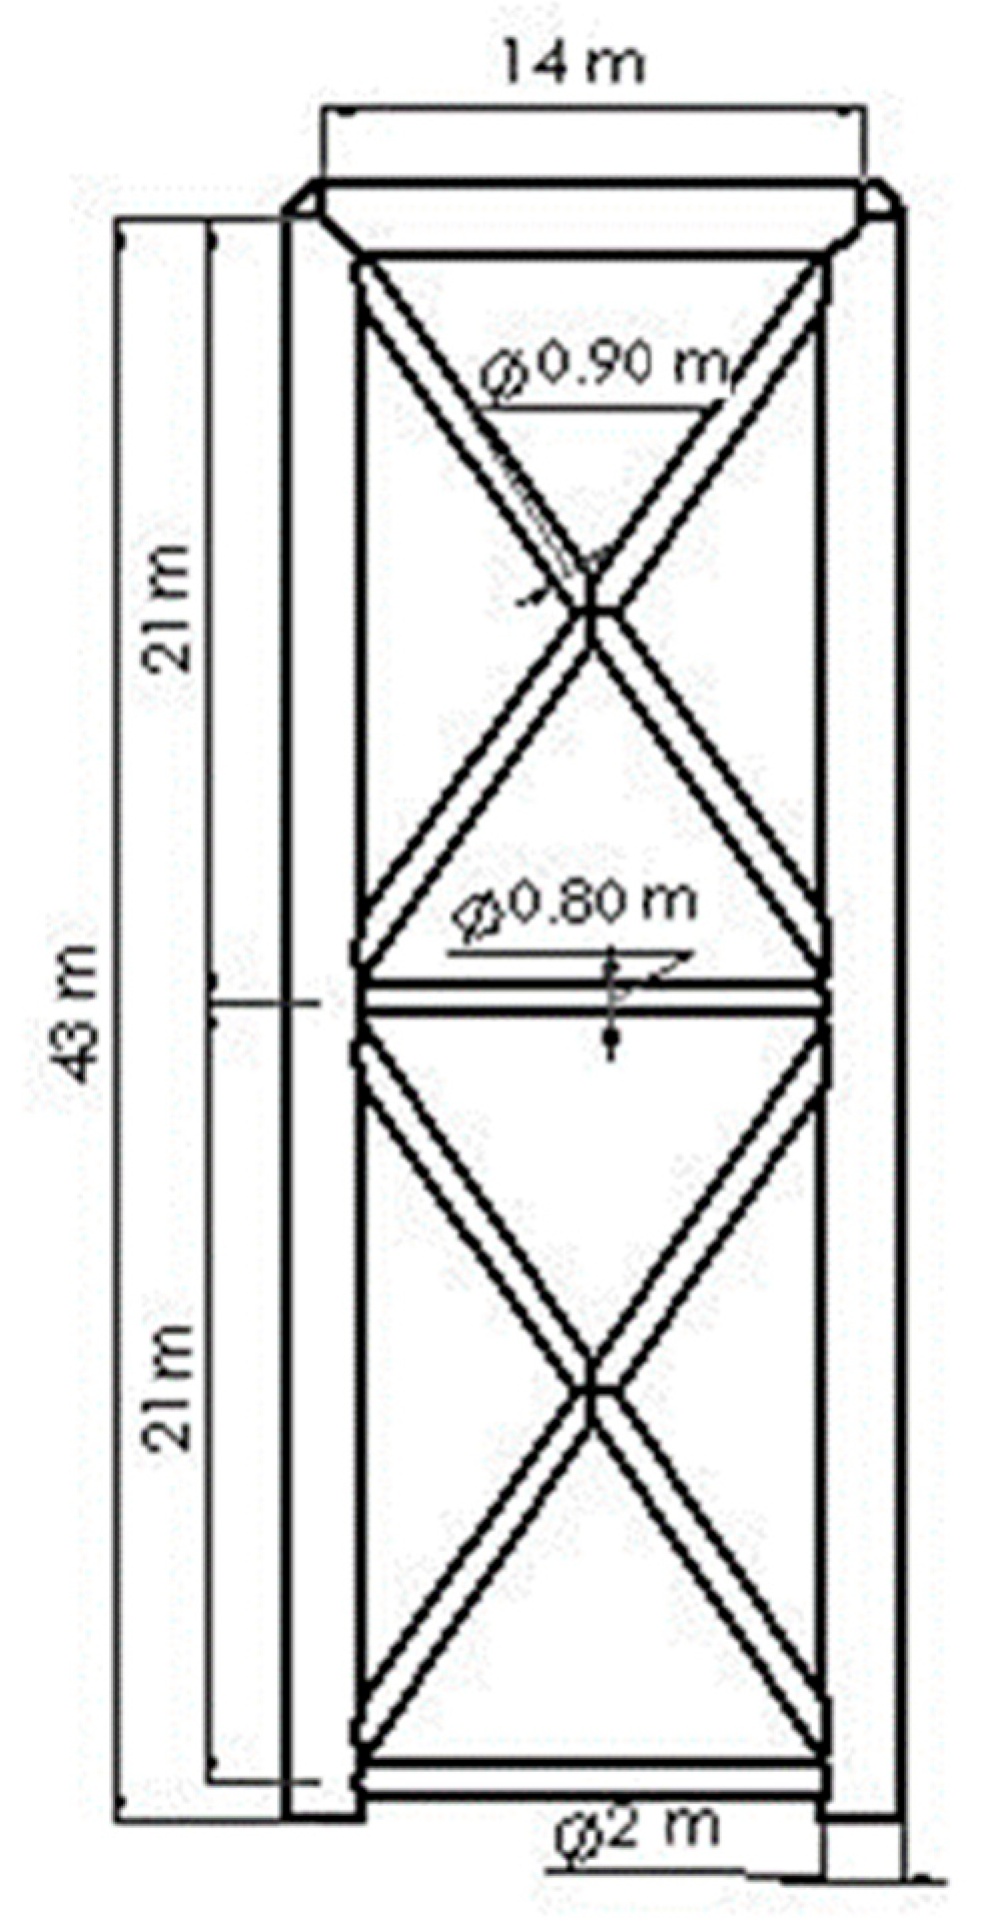
Figure 2 [
2] shows the side view of the jacket-type structure. The dimensions for the structure and the size of the structural members are also shown in the figure, where the height of the offshore template infrastructure is 43 m above the seabed and the width of the square platform is 14 m. The diameters of the cylinder members are: 2 m for the vertical members and the top frames, 0.9 m for the inclined members, and 0.8 m for the horizontal members.
For the physical experimental study, a scaled-down model was designed and built, of which the scale ratio is 1/36. Based on the theorem for the similarity between the scaled-down model and the prototype of the structure, including the geometric similarity, kinematic similarity, and the dynamic similarity of both structures subjected to exerting loadings, the Froude similarity was used as the major parameter for the design of the model. It is presented as,
where
V is the flow velocity,
g is the acceleration of gravity, and
L is the length. Then, the relationship between the model and the prototype structure can be presented as,
where the subscript “
m” represents the model, while “
p” represents the prototype structure. Considering the largest space of the water tank where the model structure can be located along with the measuring equipment, a scale ratio
λ as the length ratio between the model and prototype structure is shown as,
Then, the scaled-down relationships for parameters such as area, period, wave height, mass, and wave forces between the model and prototype structure can be obtained and presented as a function in terms of the scale ratio
λ as follows,
It is noted that in the presentations, is the scale ratio of the density, which is assumed to be one because of the similarity of the density between the water used in the test of the water tank and real sea water. Since the gravity for the model and prototype structure is the same, .
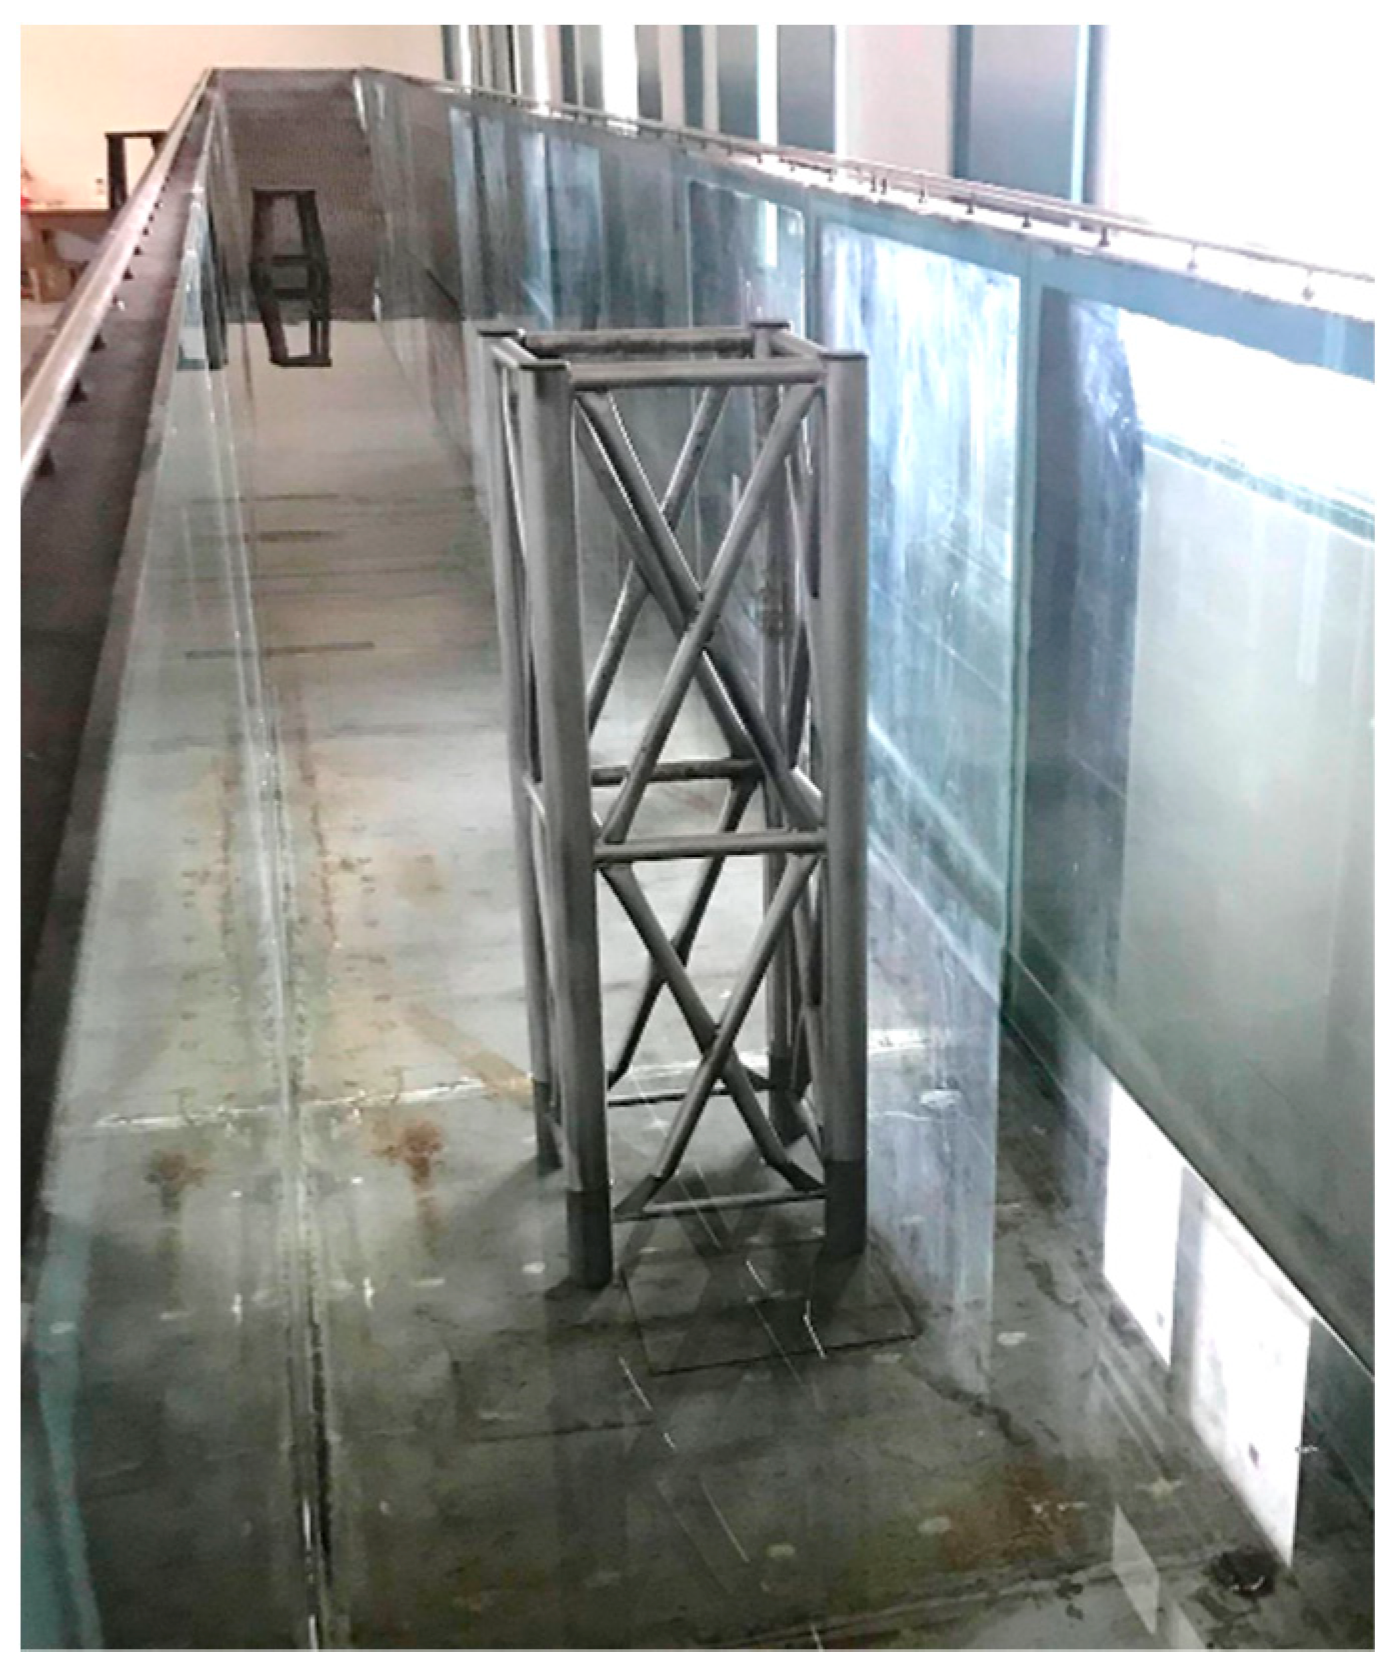
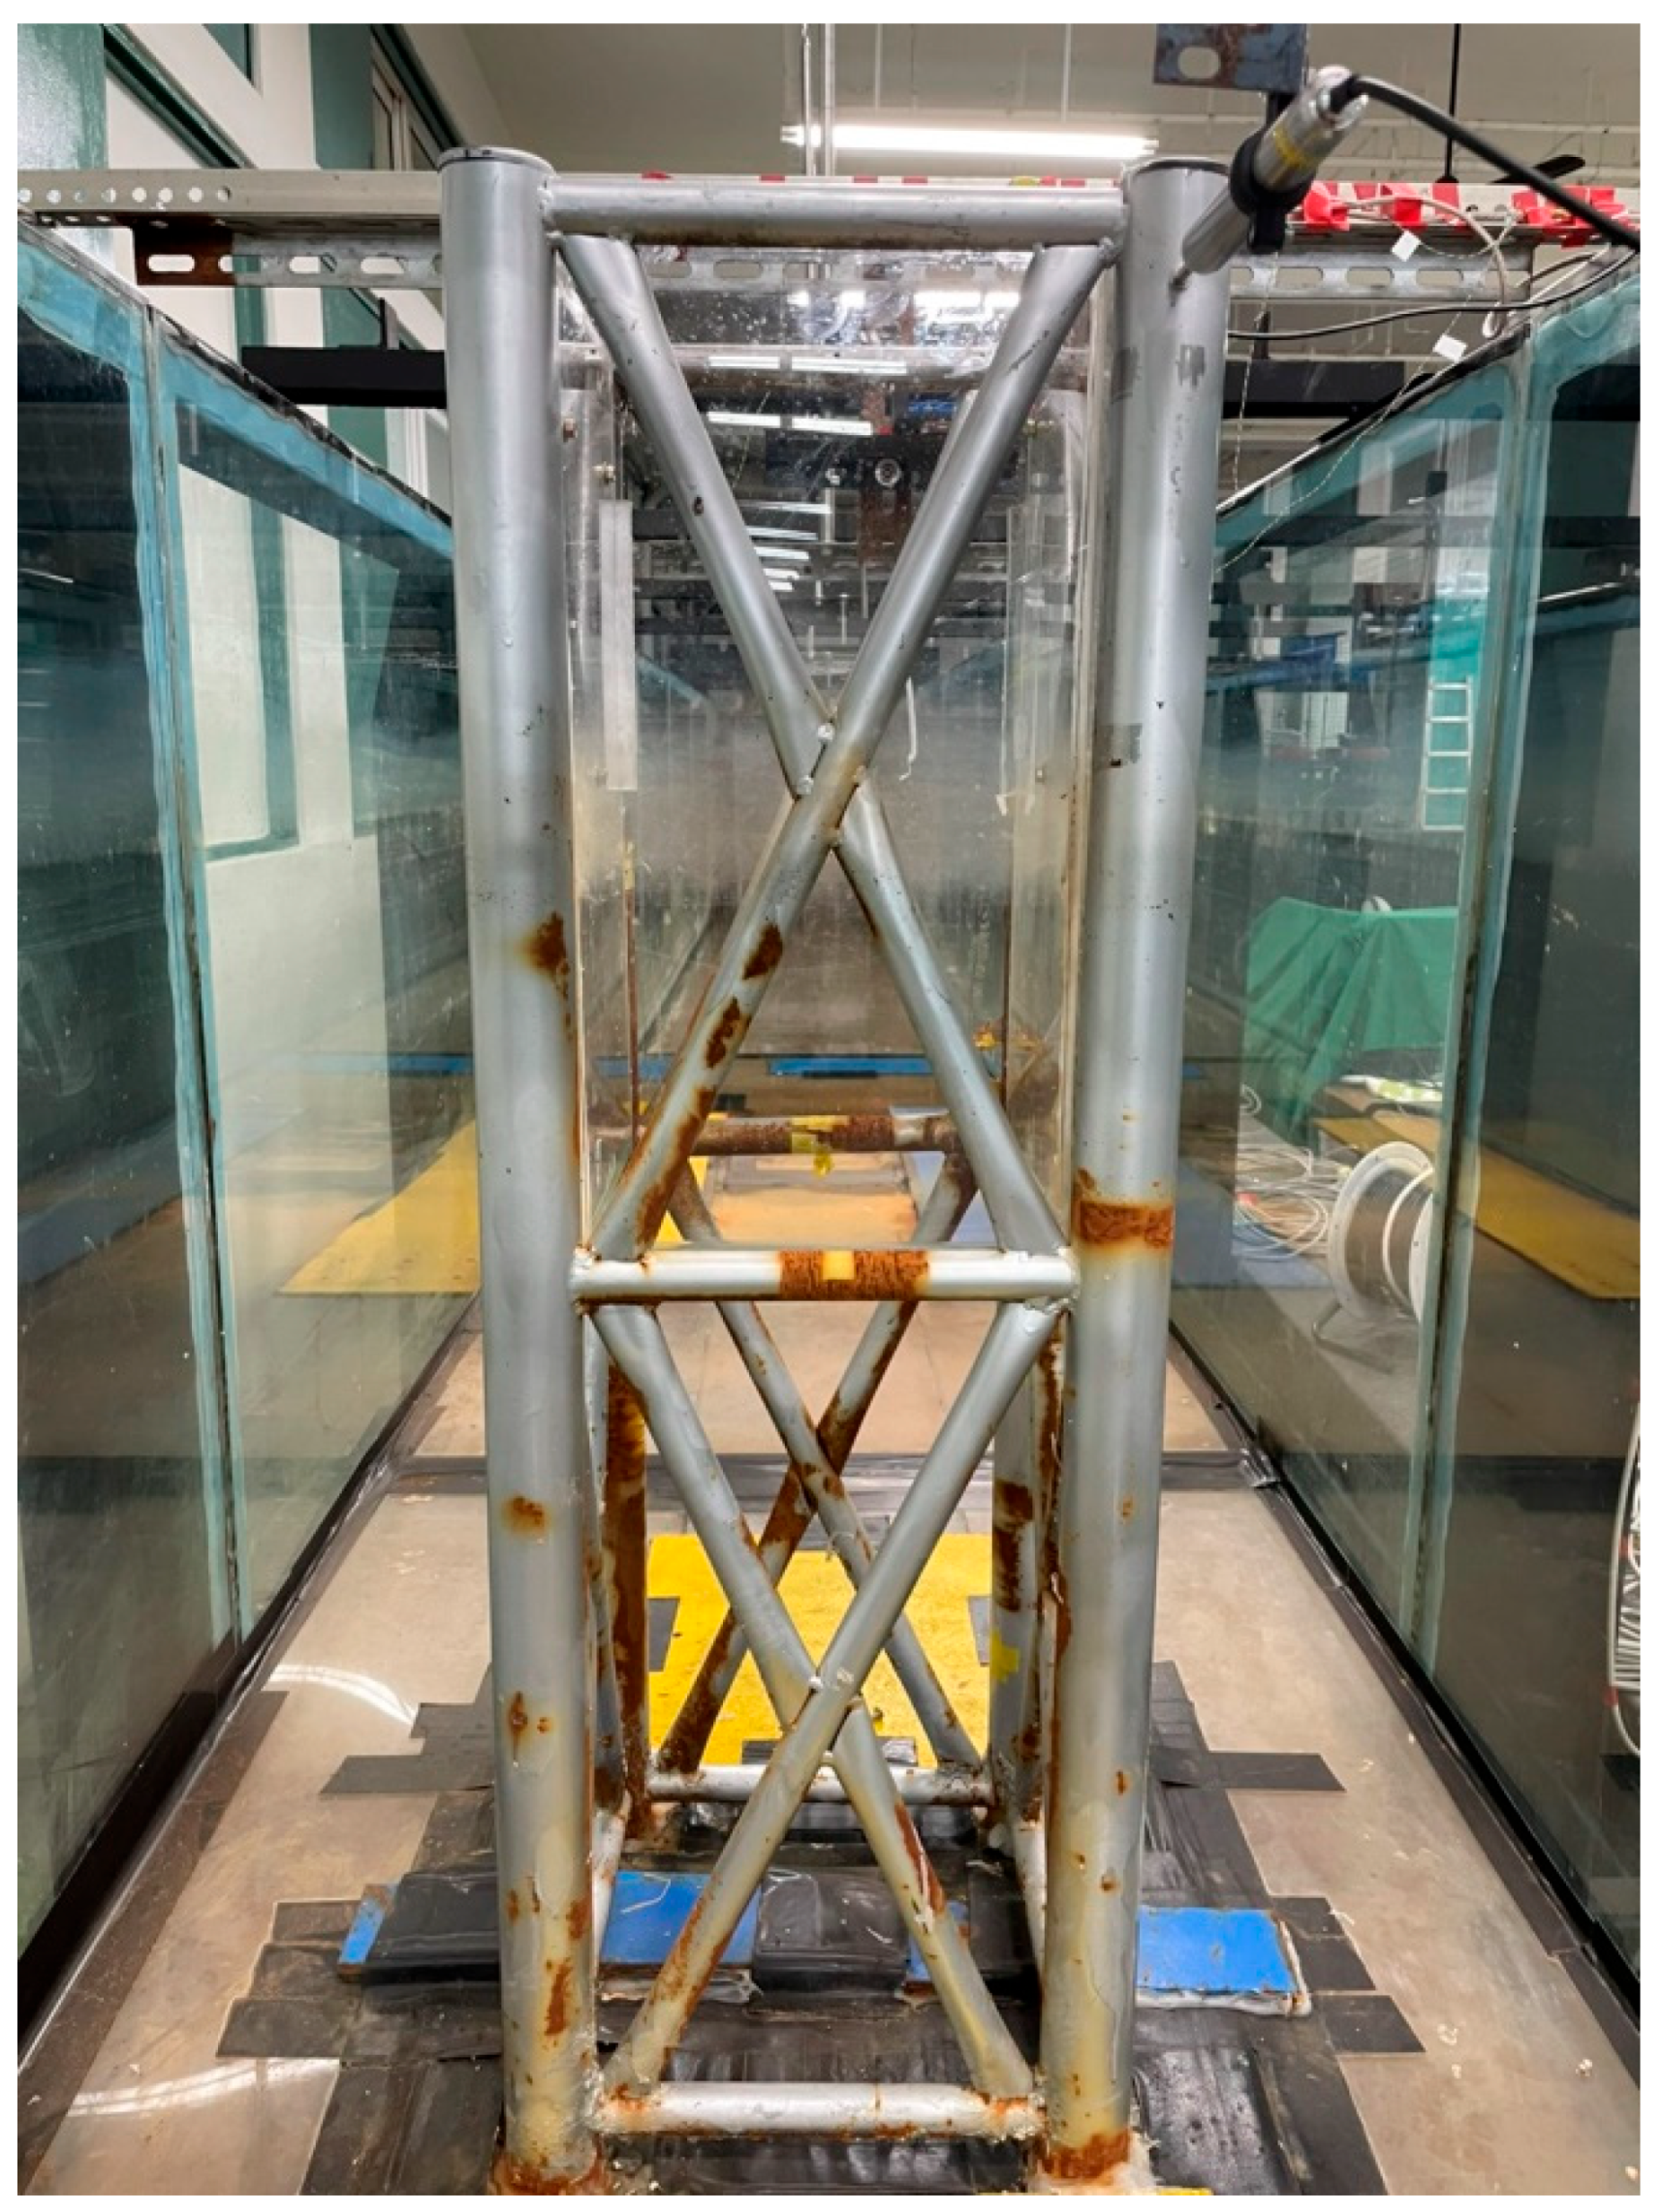
After consideration for the largest model that can be tested in the water tank—which is 35 m long, 1 m wide, and 1.2 m height—the testing condition of the water is set between 0.5 m to 0.8 m. Given that the water depth for the location of the prototype structure is assumed to be 15 m, the water depth for the testing model is about 0.6 m and, therefore, a model with a scale ratio of 1/36 is proposed and built. Accordingly, all the dimensions of the model structure are built with the same scale ratio. The complete scaled-down model for the experimental test located in the water tank from various angles of observation is shown in
Figure 3.
2.2. Measuring and Data Acquisition System for the Model Test
For the experimental test of the scaled-down offshore template structure installed with an OWC wave converting system, the main purpose was to find the converting efficiency of the system and, therefore, we needed to find the velocity of the airflow, the variation of waves with various periods, and the height and dynamic responses of the structure. With all of these data, the estimation of the converting efficiency and the influence from the parameters that were varied during the test would be possible.
The measuring equipment includes the following items:
- (a)
Water tank and the wave maker
The cross-section-type water tank located in the National Sun Yet-sen University is 35 m long, 1 m wide, and 1.5 m high. The wave maker is a piston-type with an AC server mortar, and the control board is an AD/DA-type that can create waves of various heights and periods.
- (b)
The electricity capacity-type wave-height meters
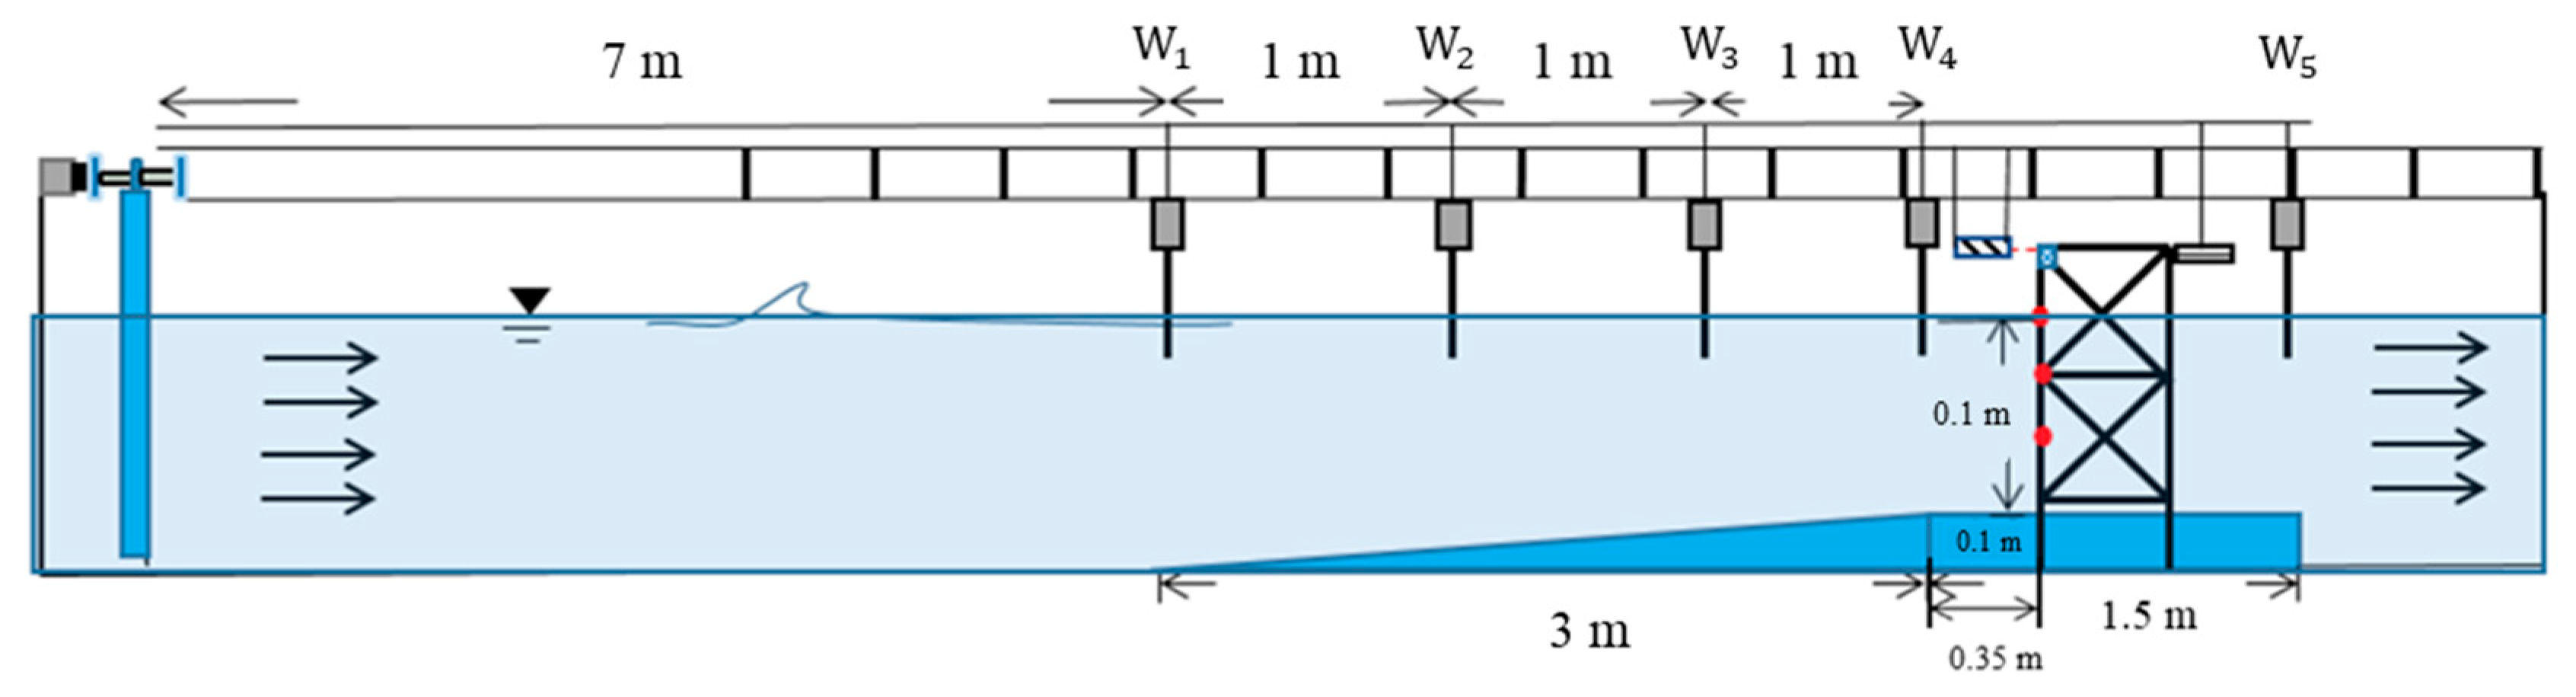
In total, five wave-height meters were applied in this experimental test. The first one was located 8 m away from the piston-board of the wave maker; three of them were located at the front side of the structure and the other two were located at the middle (or near the middle) and the back of the structure. The purpose of this set-up was to measure the incident wave, the reflection wave, and the wave height near the structure.
- (c)
Signal amplifier
The six-channel amplifier has an electric pressure range of 0–5 V.
- (d)
Data acquisition system
An AD/DA data acquisition system with 16 analog input and 2 analog output channels was utilized for the experiment to obtain the acquired data.
- (e)
Measurement of airflow speed
The speed of the airflow that flows through the orifice on the top panel of the OWC is measured through a meter utilizing an ultra-red sensor.
2.3. Experimental Testing Set-Up and Procedure
The set-up of the experimental facilities and measuring system are shown in
Figure 4, where the observed five meters (w
1–w
5) for the wave height were installed along the designed spacing. It is noted that in the schematic drawing the OWC converting chamber is not installed and, once the OWC is set up, the speed meter will be put in the outlet opening of the chamber.
Figure 5 shows the photograph of the testing model installed with the measuring system.
The scaled parameters corresponding to the scale ratio of the model structure under the test are also presented in
Table 1. They include the water depth and wave heights corresponding to the variation in the in-situ conditions and also the corresponding periods calculated based on the similarity theorem. The wave conditions for the prototype structure, as mentioned in the analytical study [
2], are based on the local annual average wave statistics—where the offshore template structure is located 10 km away from the coast of Changhua, Taiwan.
During the experimental test, the scaled parameters for the wave height and period were performed for the exerting waves and the response data of the OWC converter was recorded and analyzed alternately. It is also noticed that due to the limit of the water depth and the relative size of the structure, the wave height is also limited within a range for the simulated waves applied to the experiment.
2.4. Dimensional Parameters to Be Examined and Verification
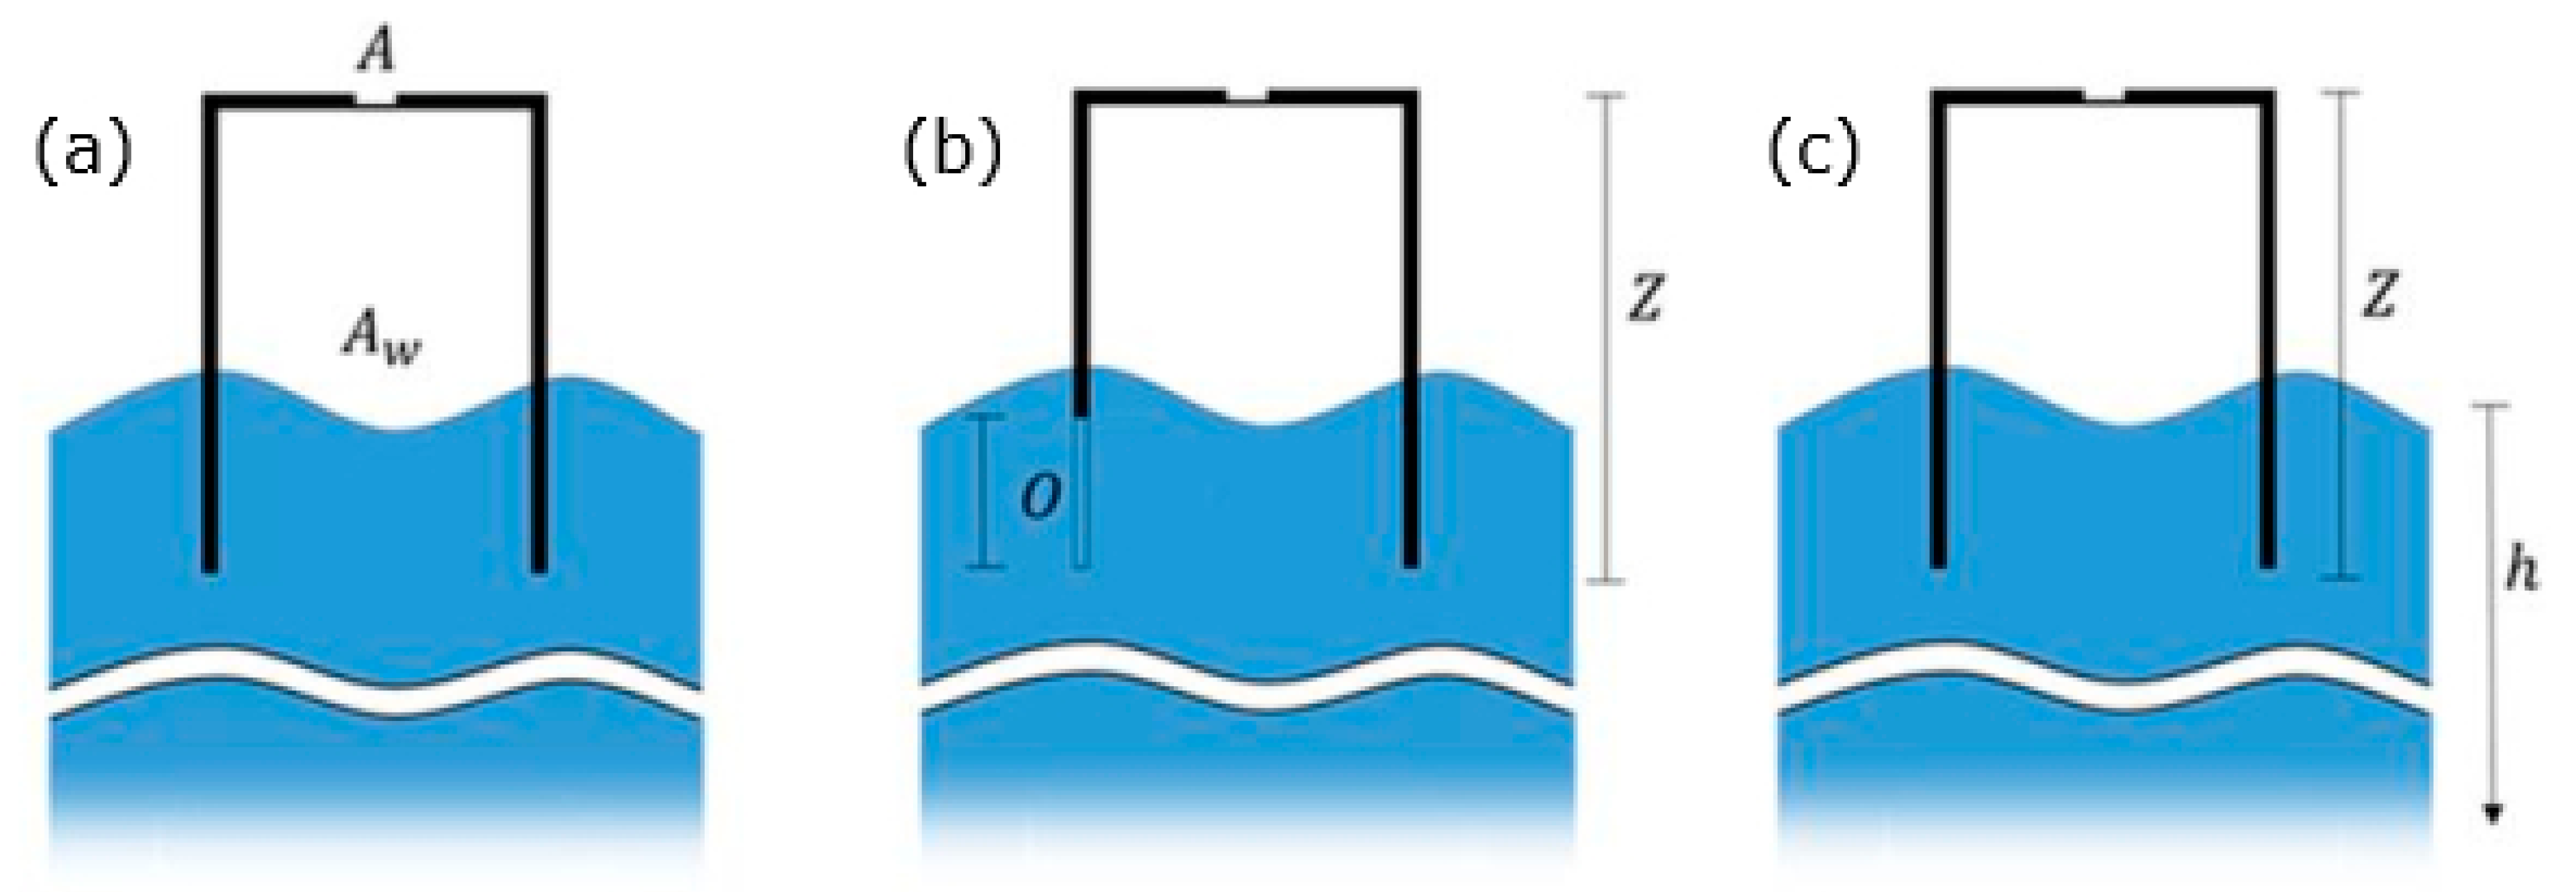
As introduced in the analytical results in Lee et al. 2021, the parameters chosen in the analysis are basically related to the dimensions of the air chamber for the OWC converter that was situated on an offshore template structure. The parameters considered include the area ratio between the opening of orifice A and the water surface Aw in the chamber, presented as RA = A/Aw; the ratio of the open-gate O in the front side facing the incident wave to the chamber height Z, presented as RO = O/Z; and the ratio of the chamber height of the OWC converter to the water depth h, presented as RZ = Z/h ;under the condition that during operation, even in a low water level, the whole device must be submerged in the water.
The schematic drawings for the side view of the OWC converter installed in an offshore template structure are shown in
Figure 6a–c, where parameters such as the ratio of orifice area
RA, the ratio of chamber height
RZ, and the ratio of the front gate opening
RO are correspondingly presented.
3. Experimental Results
By following the analytical study, in the experimental test of the OWC system for the converting efficiency the responses to be discussed include the velocity of the airflow through the orifice, the power produced by the airflow, and the converting efficiency in terms of the ratio of the pneumatic power and power of incident waves. Comparisons of these responses, corresponding to the given wave conditions, are presented and discussed in the following sections in terms of the parameters of the area ratio of orifice opening
RA, the opening ratio of the OWC gate to the height of the chamber
RO, and the ratio of the height of the air chamber compared to water depth
RZ.
Table 2 shows the variables for the related dimensionless ratios of the air chamber of the OWC system to be tested for the scaled-down model.
3.1. Experimental Responses Corresponding to Area Ratio RA of Orifice
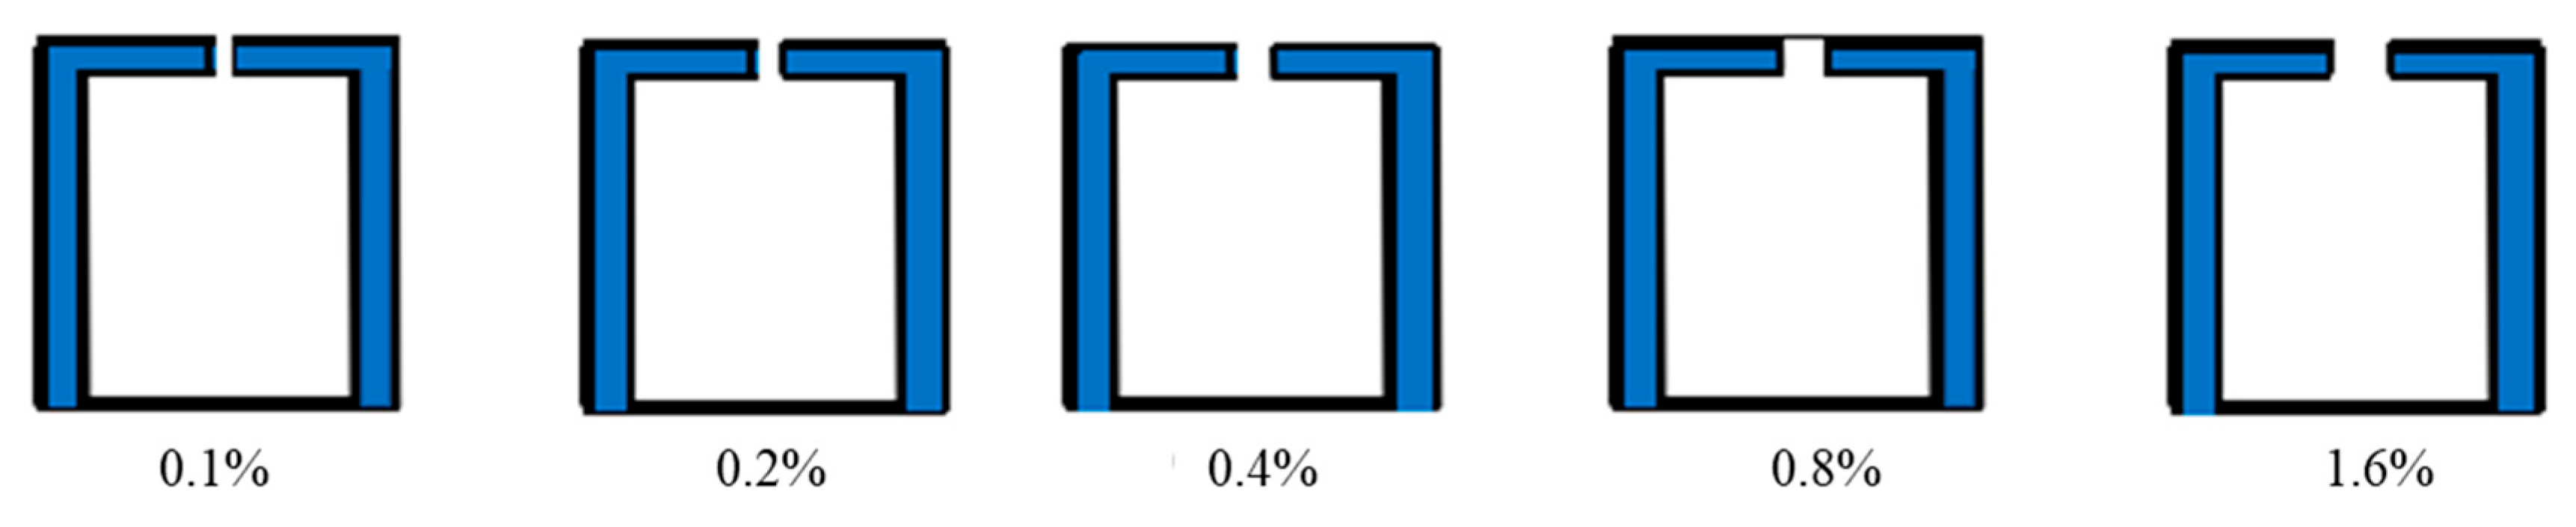
As mentioned in the relevant paper containing the analytical study’s analysis, the area ratio of the orifice cross-section of the OWC will have an influence on the performance of an OWC converting system. In order to compare the experimental data with the results of the numerical analysis, a set of the same dimensionless ratios of area between the OWC orifice cross-section and the area of the water surface were also installed in the chamber of the model structure, as was indicated by
RA and listed in
Table 2. Similarly, the ratio
RA is ranged from 0.1% to 1.6%, as was shown in
Figure 7.
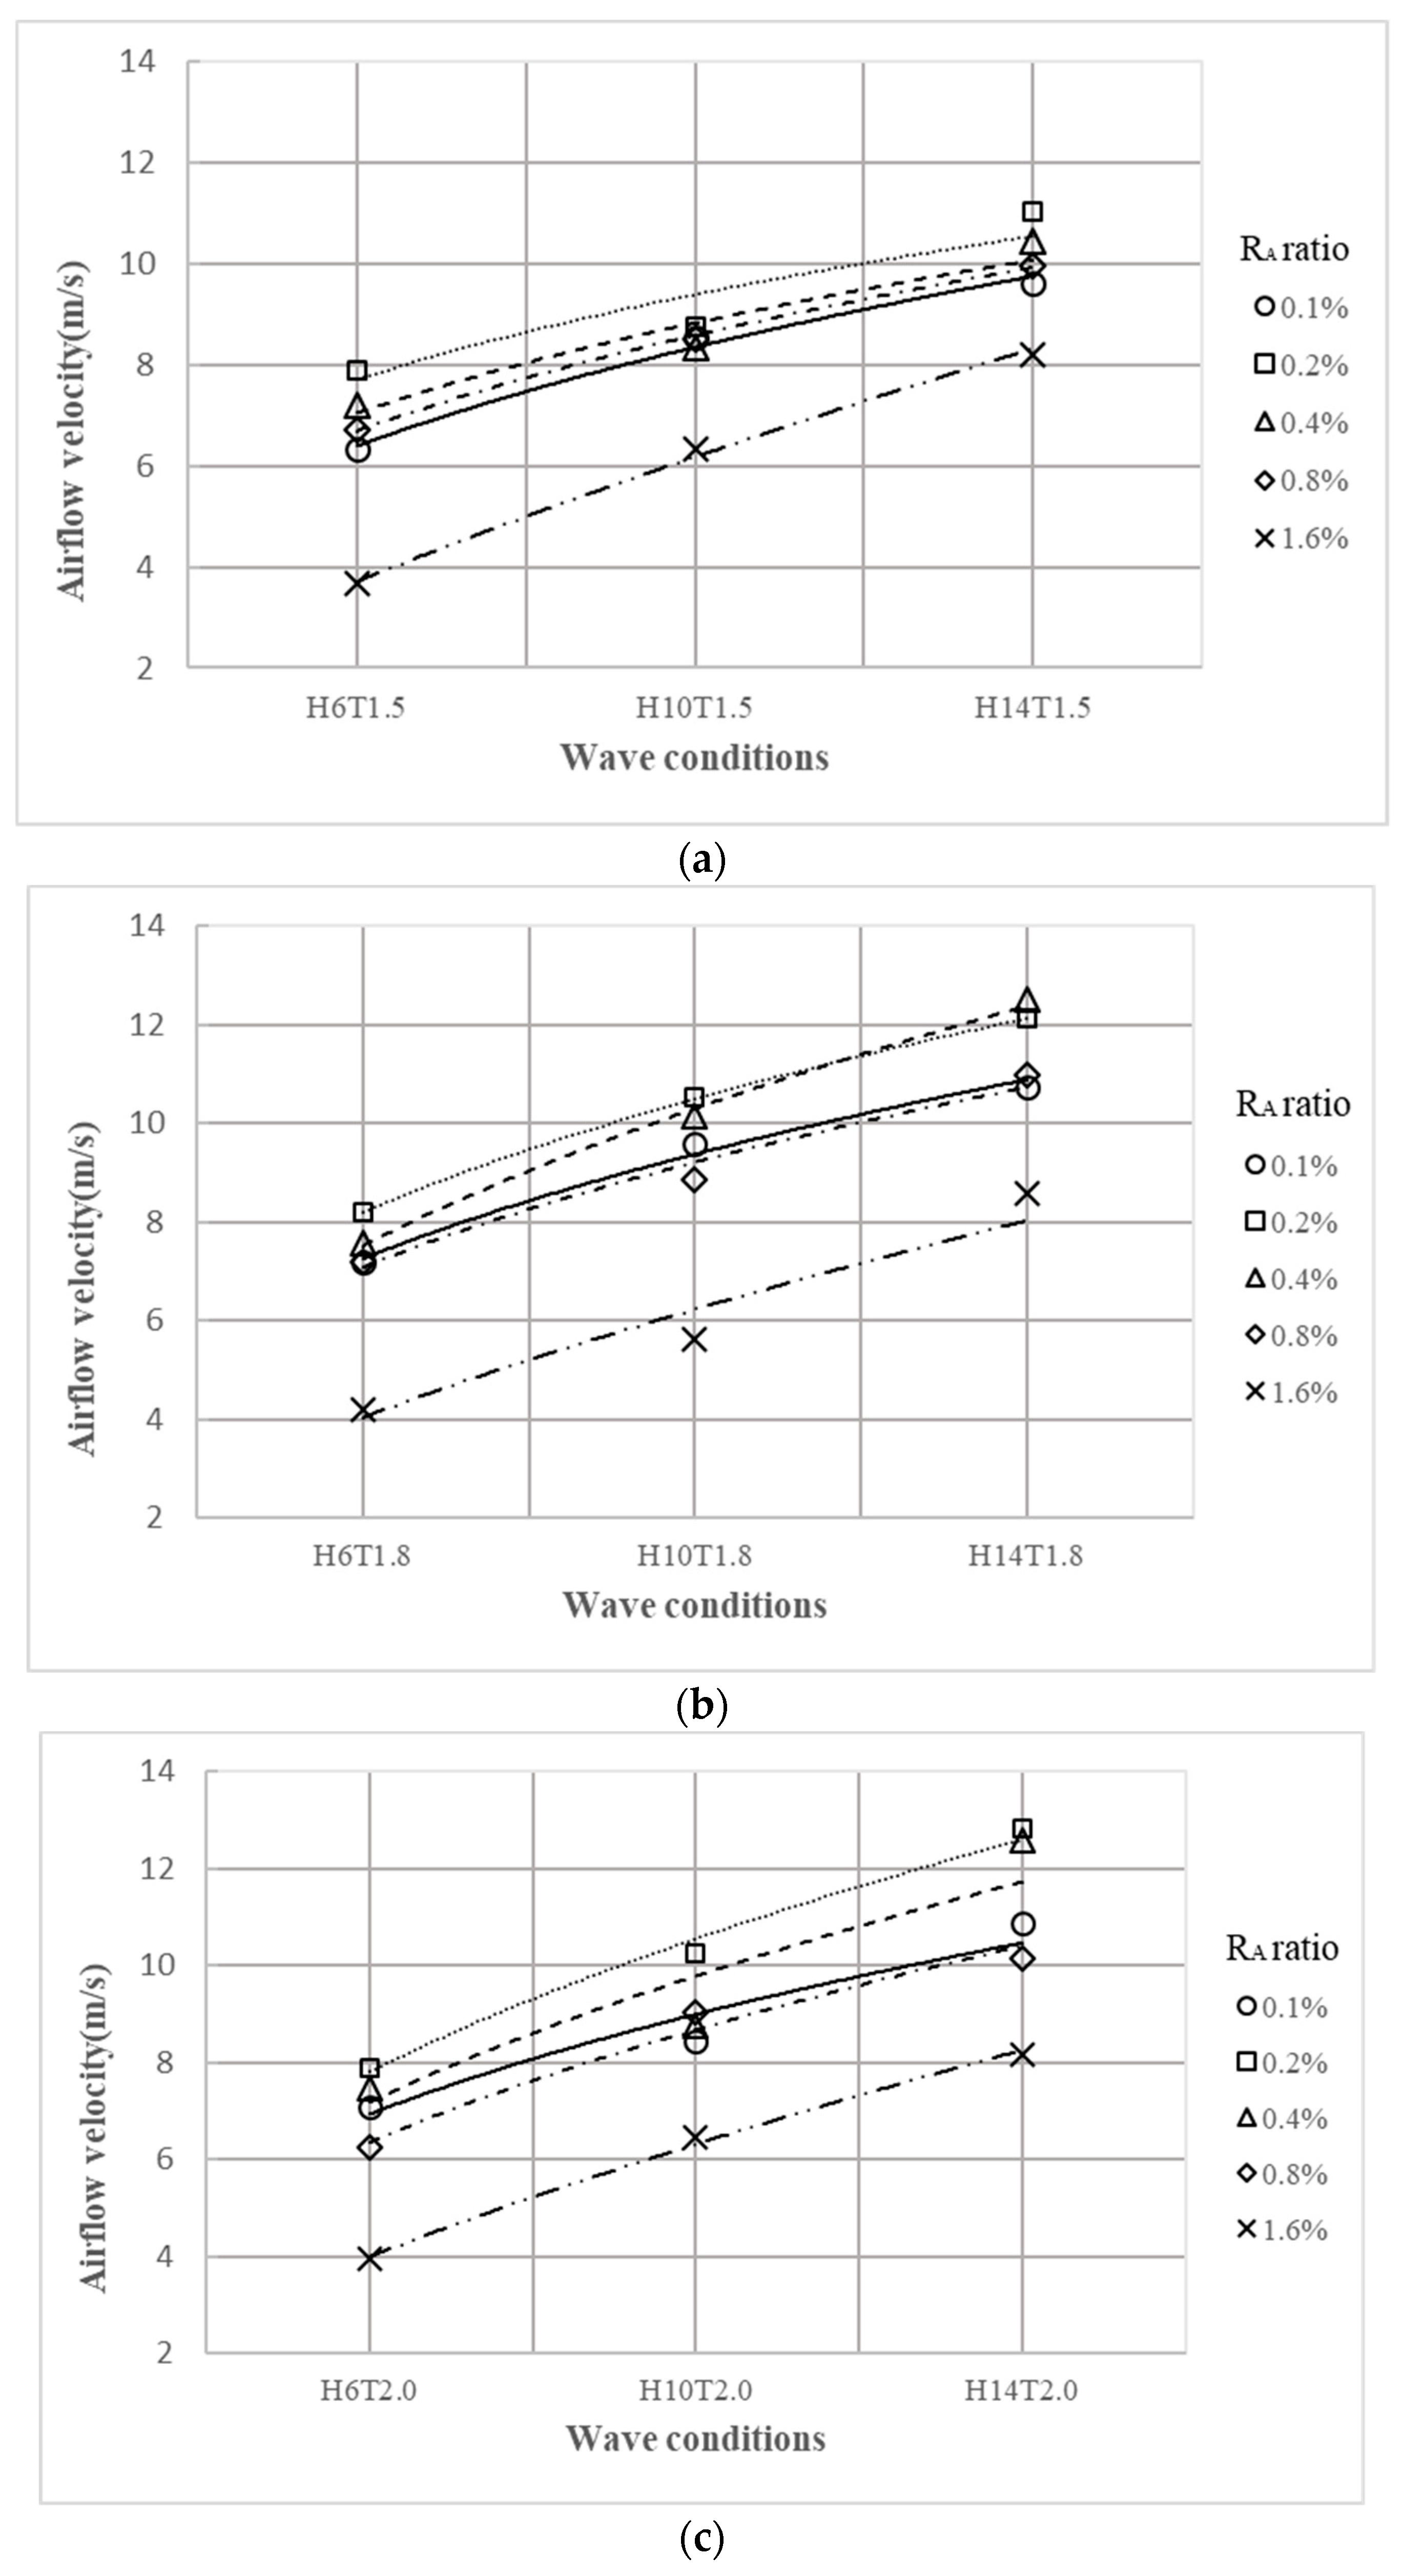
For three periods of waves, the velocity of the air flow corresponding to the various wave heights, namely 0.06 m, 0.10 m, and 0.14 m, are presented as H6T1.5, H10T1.5, and H14T1.5 for the period T = 1.5 s, as shown in
Figure 8a. With respect to period T = 1.8 s and 2.0 s, the velocities are shown in
Figure 8b,c, where the variation in the wave heights is also a variable shown on the
x-axis. As observed from
Figure 8a, the velocity of the airflow increases, corresponding to the decrease in the opening of the OWC until the value of
RA is approaching 0.8%. It is also found that when the wave is higher, the velocity of the air flow is also larger, and the trend is almost in linear. However, the difference in the velocities due to the size variation of the outlet opening is not very significant when the period of the applied wave is 1.5 s, except for the case when the
RA ratio is 1.6%. The airflow velocity drops significantly for the various wave heights in the experiment compared to the other
RA ratios.
As observed in
Figure 8b, the variation in the air flow velocity is more significant when the period of the applied wave is 1.8 s. It is also found that the cases for
RA = 0.2 and 0.4 are better performed than the cases for
RA = 0.1 and 0.8. Similarly, a significant drop in the velocity was also found for the case
RA = 1.6% when the wave period is 1.8 s.
Figure 8c shows the air flow velocity when the applied wave has the largest period, 2.0 s. A larger difference in velocity for the chambers of the OWC with various opening ratios was found. The chambers with opening ratio
RA = 0.2 and 0.4 also have a better performance compared to the cases
RA = 0.1 and 0.8.
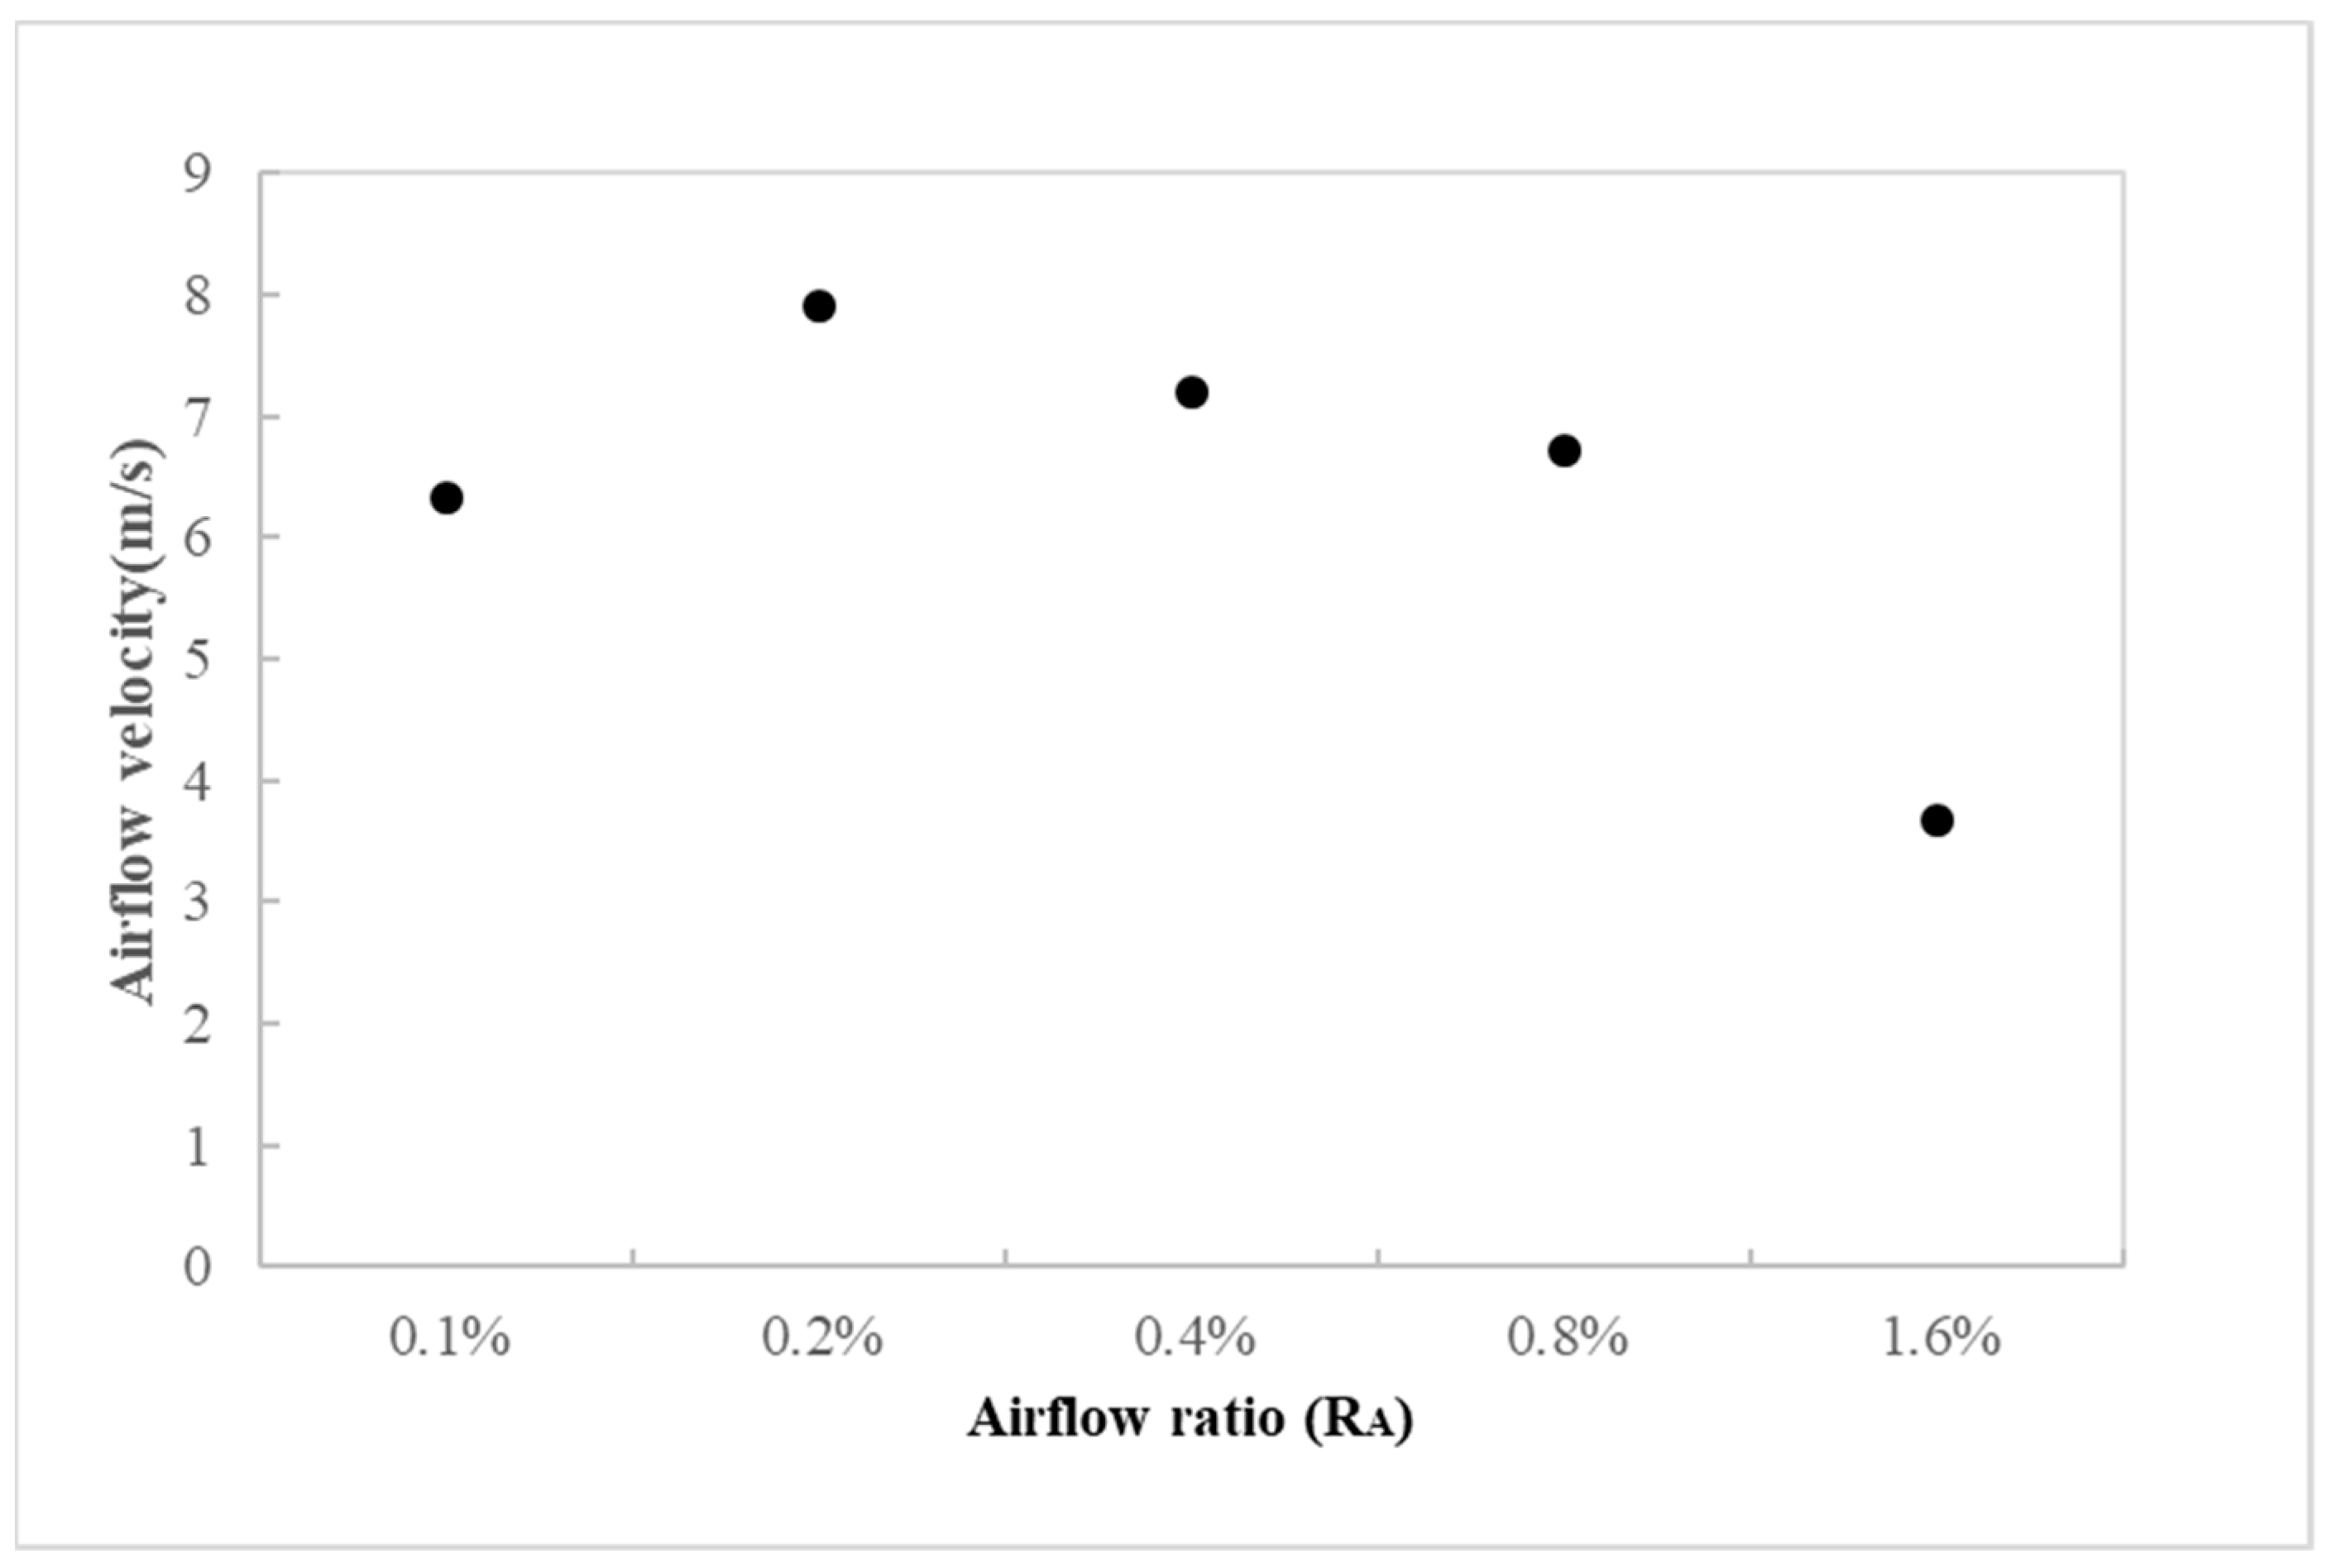
The velocity presented in
Figure 9 is the average velocity of the experimental data corresponding to the area ratio of orifice cross-section
RA when the other parameters remain constant, such as
RZ = 0.5 and
RO = 0%, and wave conditions with a 6 cm height and 1.5 s period are used for the test.
It is observed that, in correspondence with an increase in the opening ratio RA, the air flow velocity decreases non-linearly when it reaches the maximum velocity for the case RA = 0.2%. As indicated in the previous section, when the RA ratio reaches 1.6%, the velocity would drop significantly while, for the other opening ratios, the velocities may remain at rather high levels—between 6.3 m/s to 8.0 m/s.
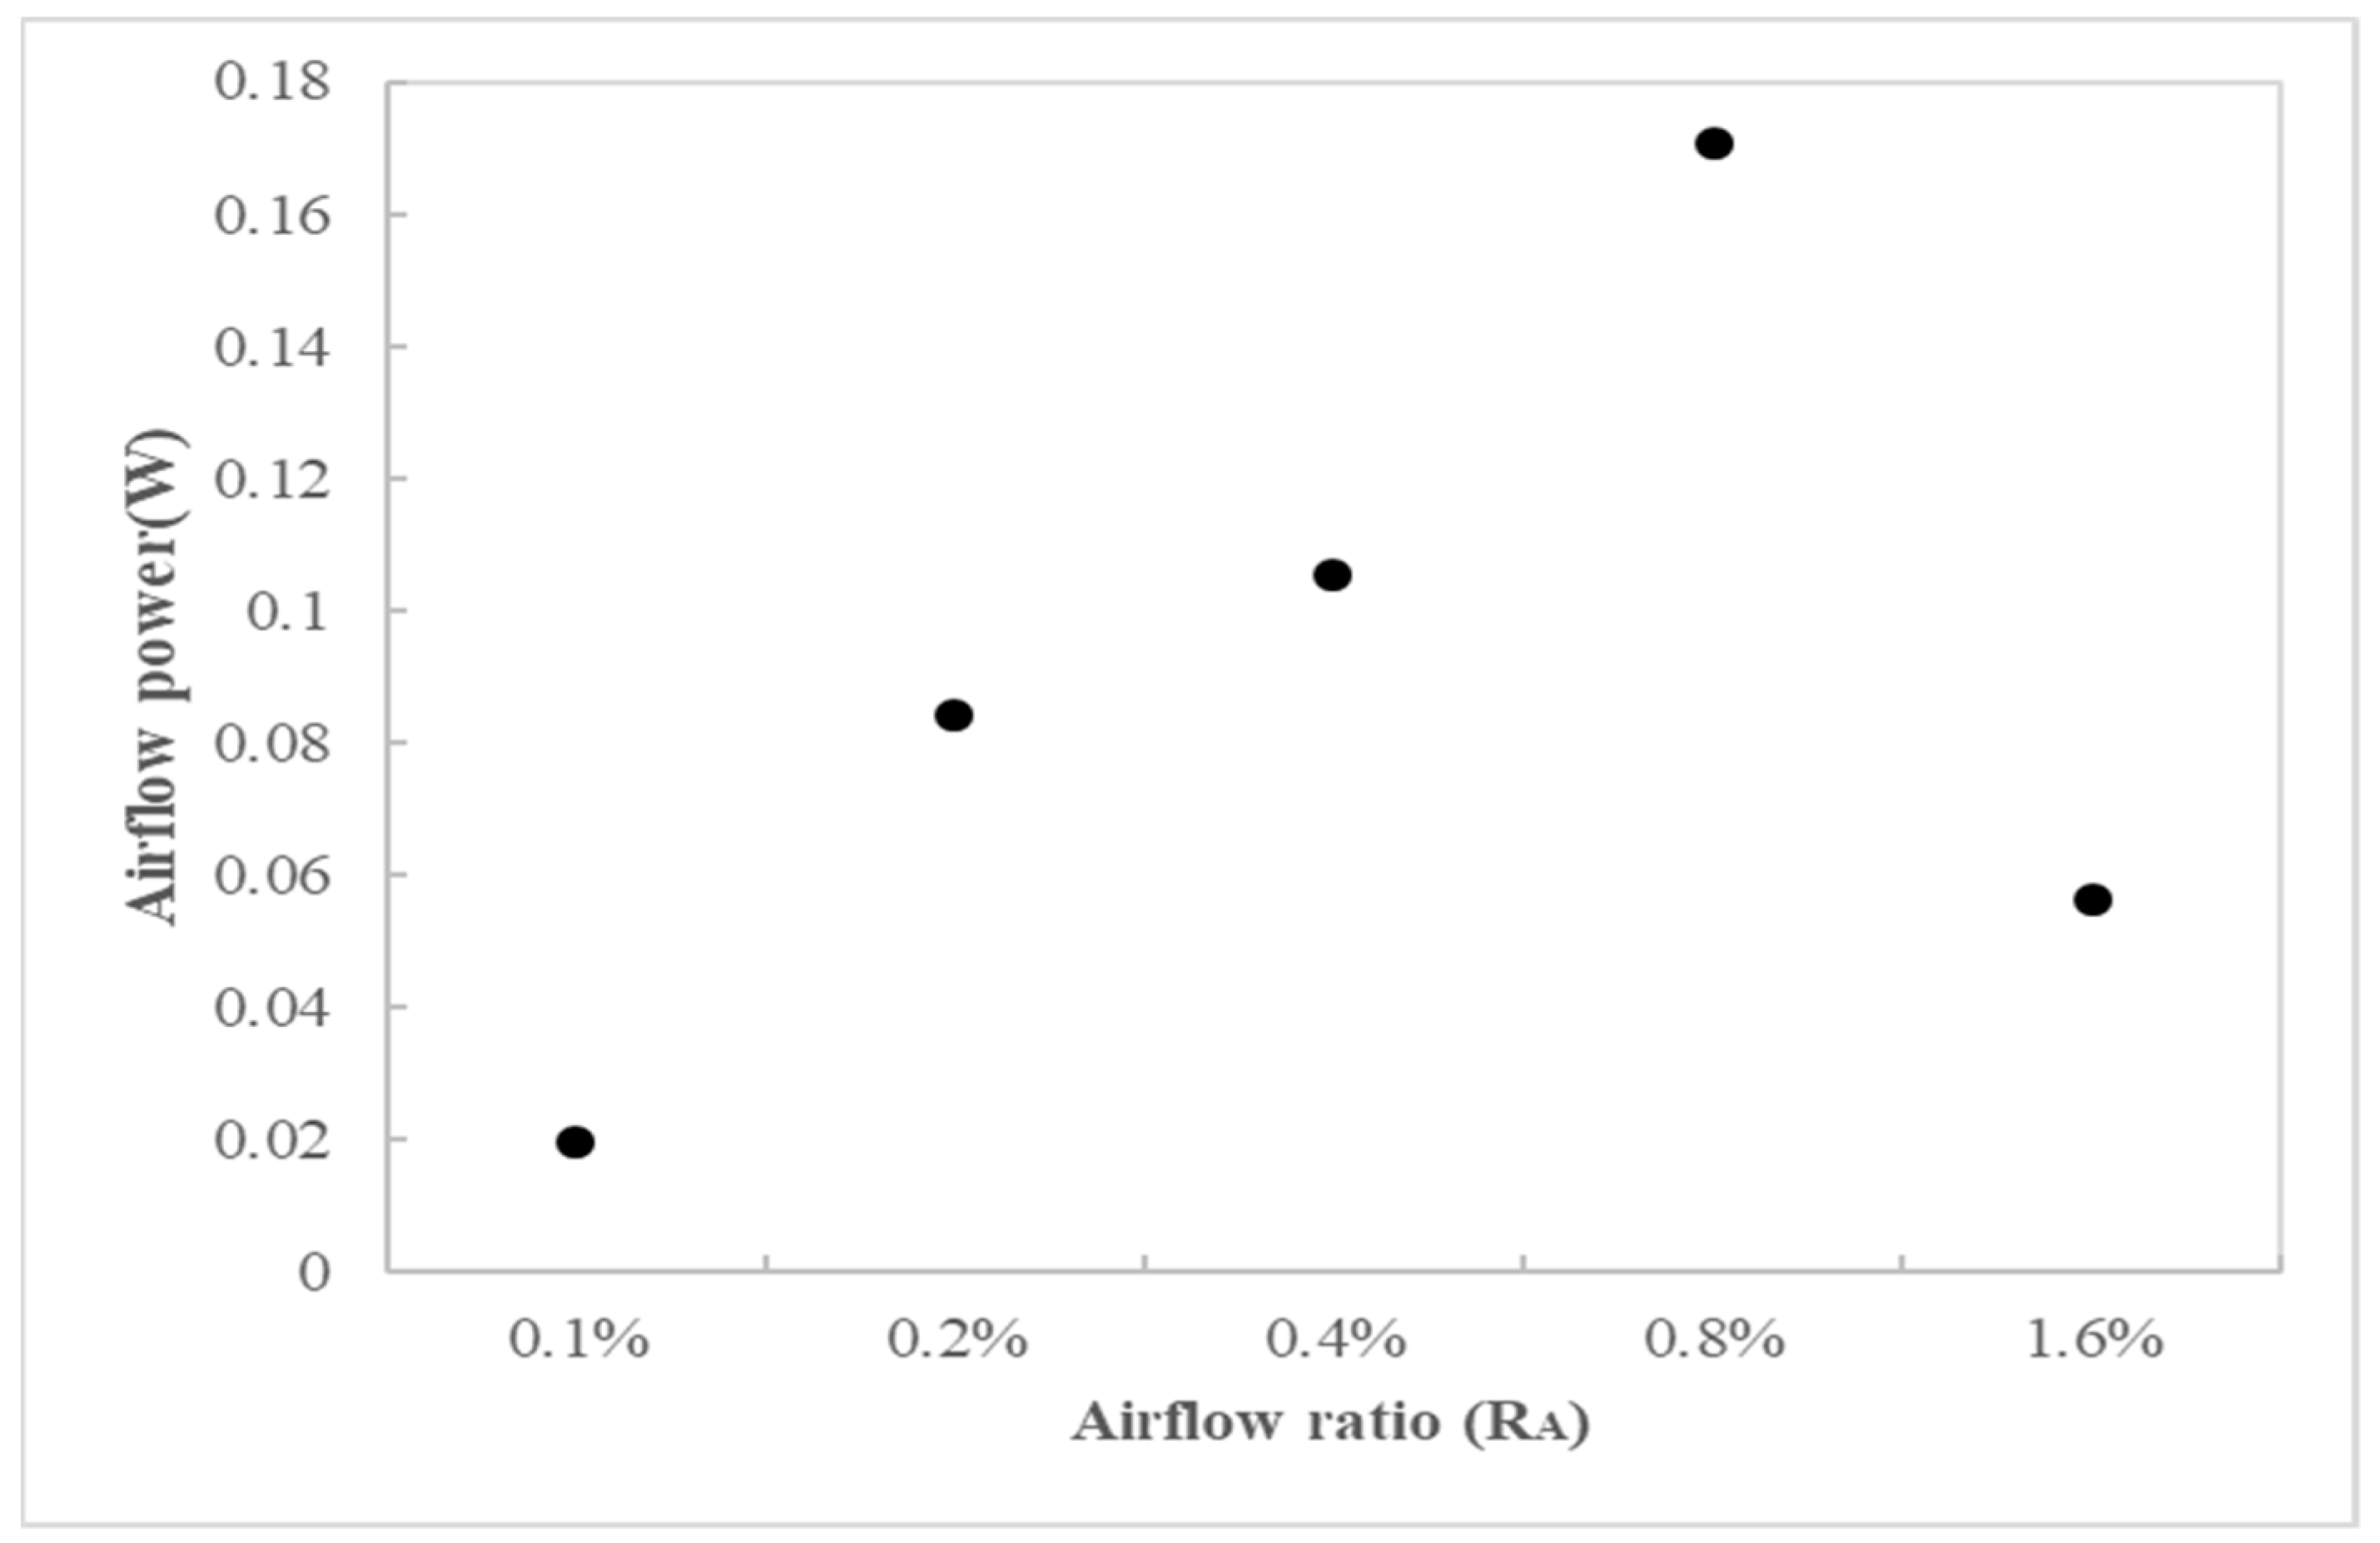
Presented in
Figure 10 is the average of the pneumatic power corresponding to the various area ratios for the orifice of the OWC converter. It is observed that, in correspondence with an increase in the ratio of the orifice opening, the pneumatic power will increase until it reaches a peak value, where the
RA = 0.8% and the pneumatic power is 0.17 W. It is also noticed that, even though the velocity of the case
RA = 0.8% is not the largest, it has a larger cross-section for the orifice, which makes it have a larger volume of air flow that generates a larger amount of power.
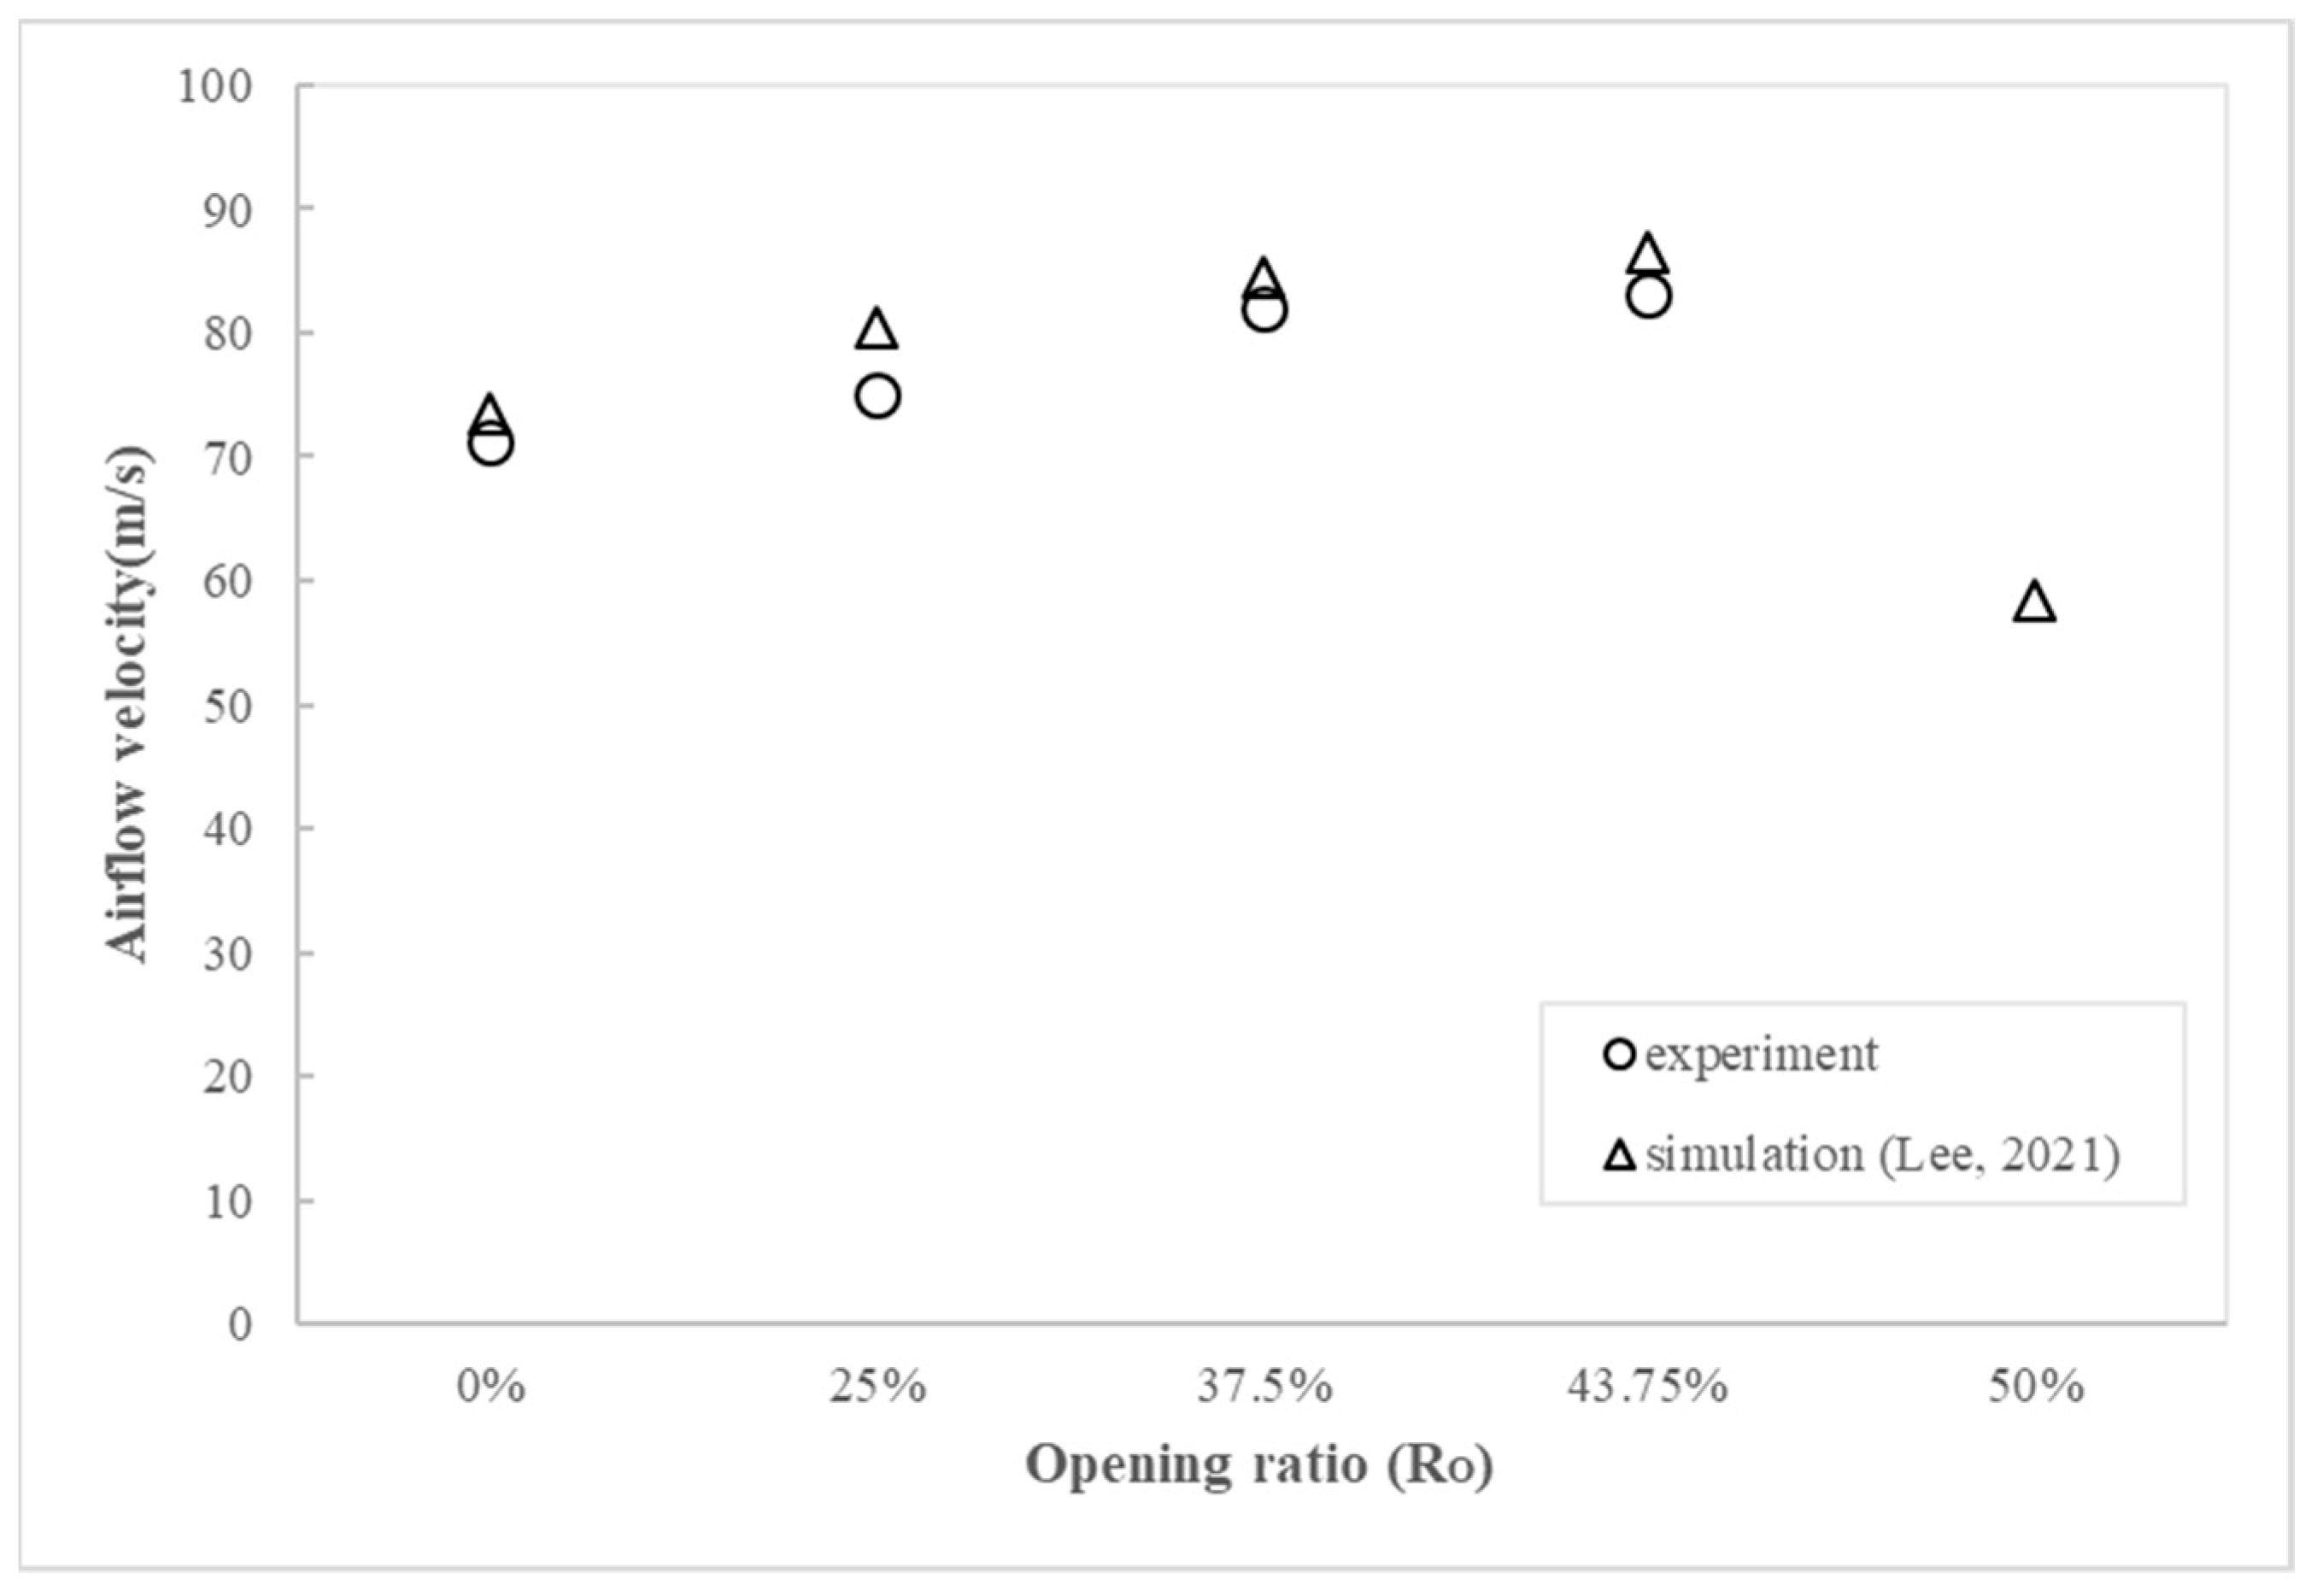
3.2. Experimental Results Corresponding to the Opening Ratio of OWC Gate RO
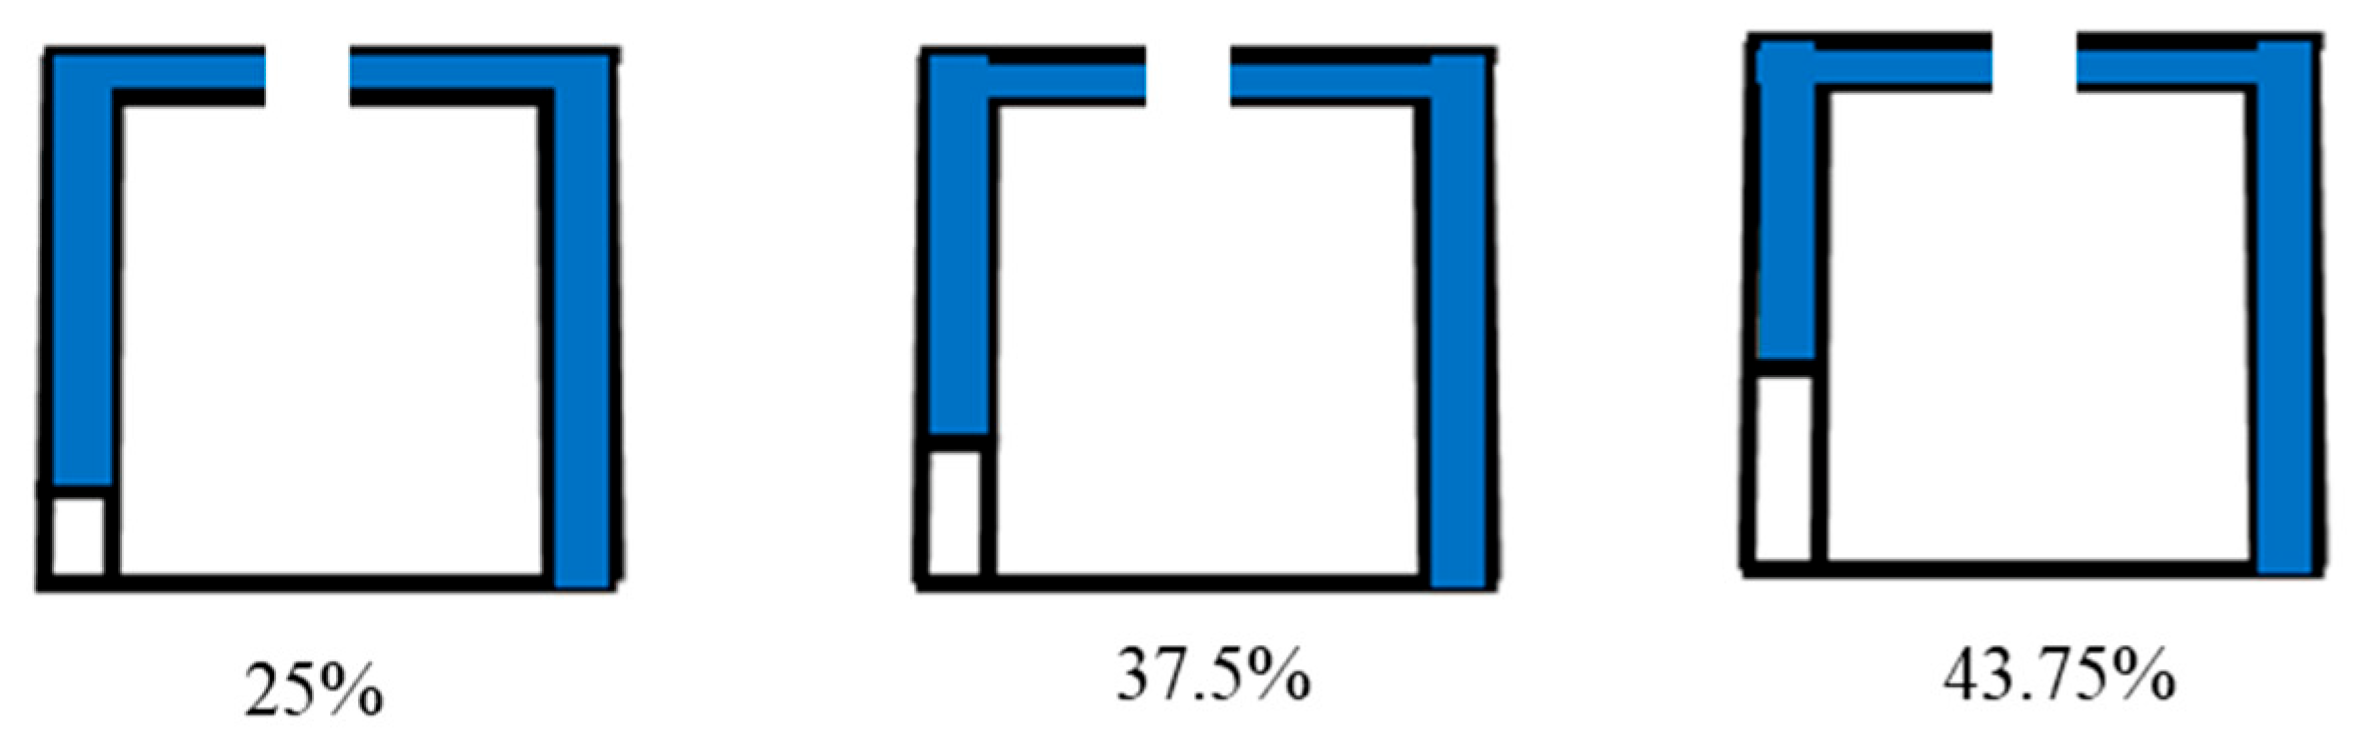
In order to capture more energy from the incident waves, according to the prevailing direction of waves, a gate in front of the chamber is added and expected to upgrade its energy conversion efficiency. However, if the wave direction changes and is not aligned with the opening gate, the converting efficiency is also studied for the case in which the
RO ratio is 0. The opening of the OWC gate is set as a ratio of the gate-opening to the height of the chamber for the OWC converter, as indicated as
O/Z = RO in
Figure 6. The height of the chamber of the OWC converter is set at a constant 15 m, while the opening ratio of the gate is variable, as presented in
Figure 11, and ranged between 25% to 43.75% for comparison.
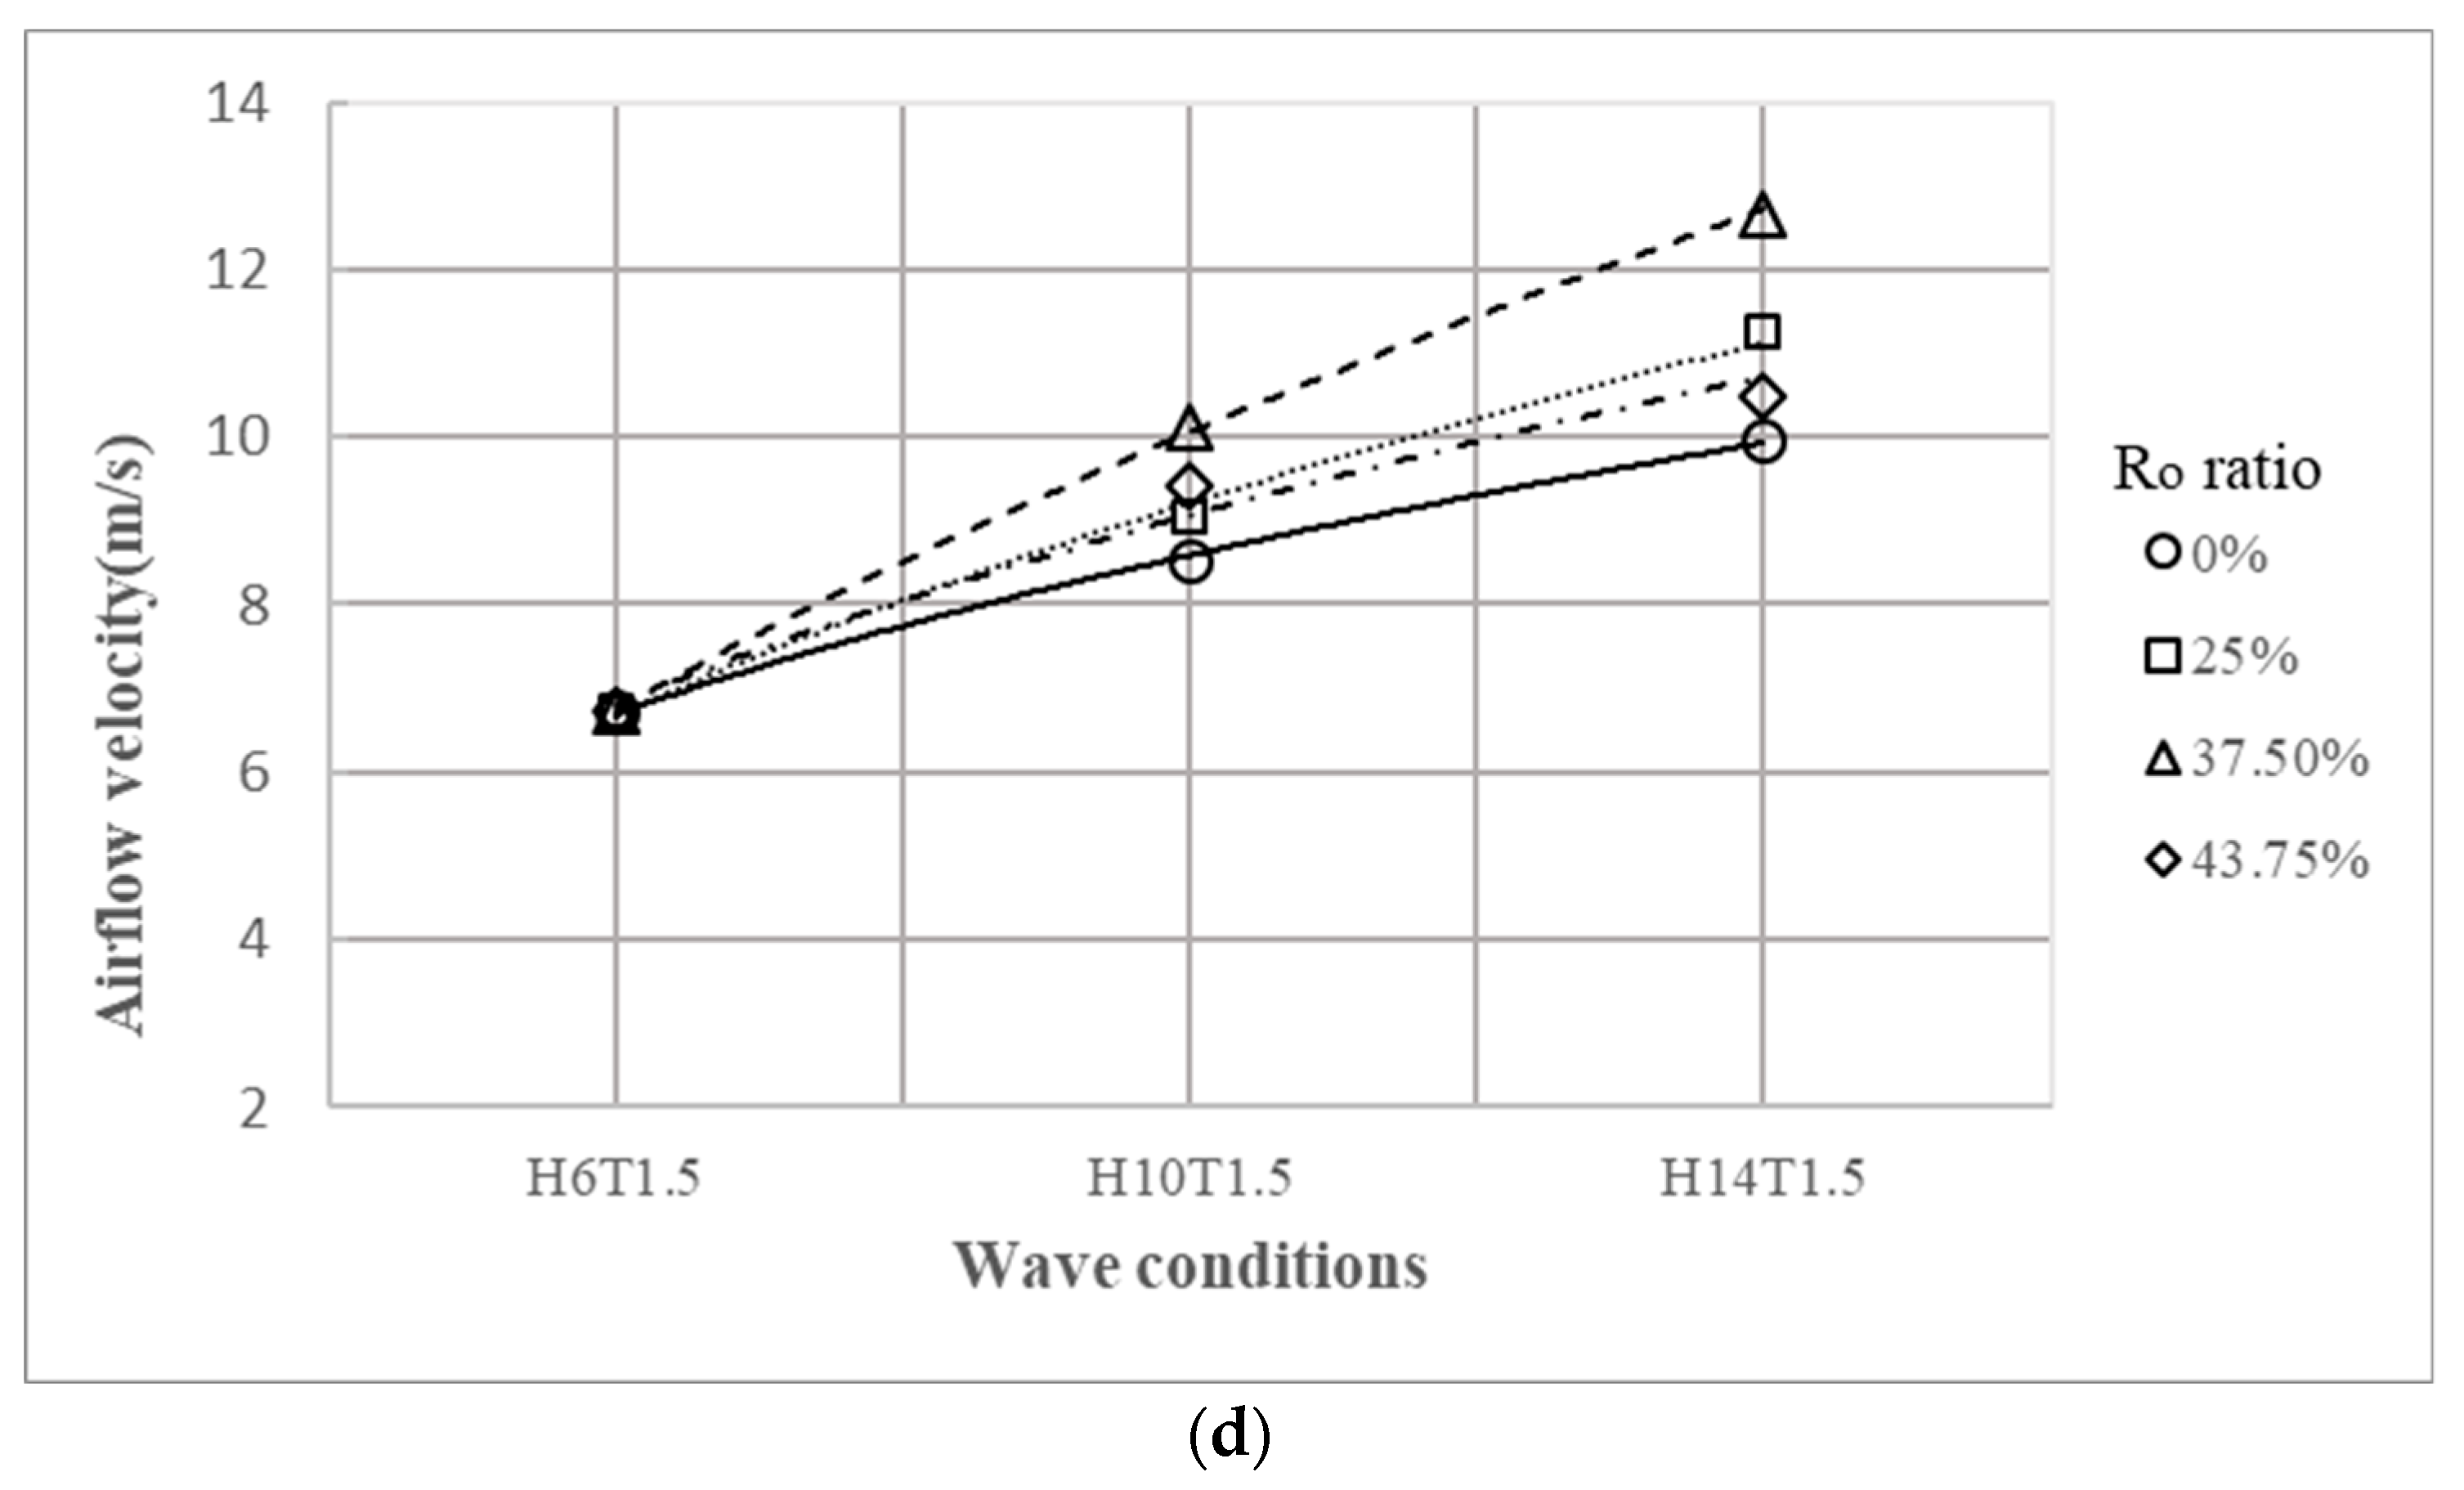
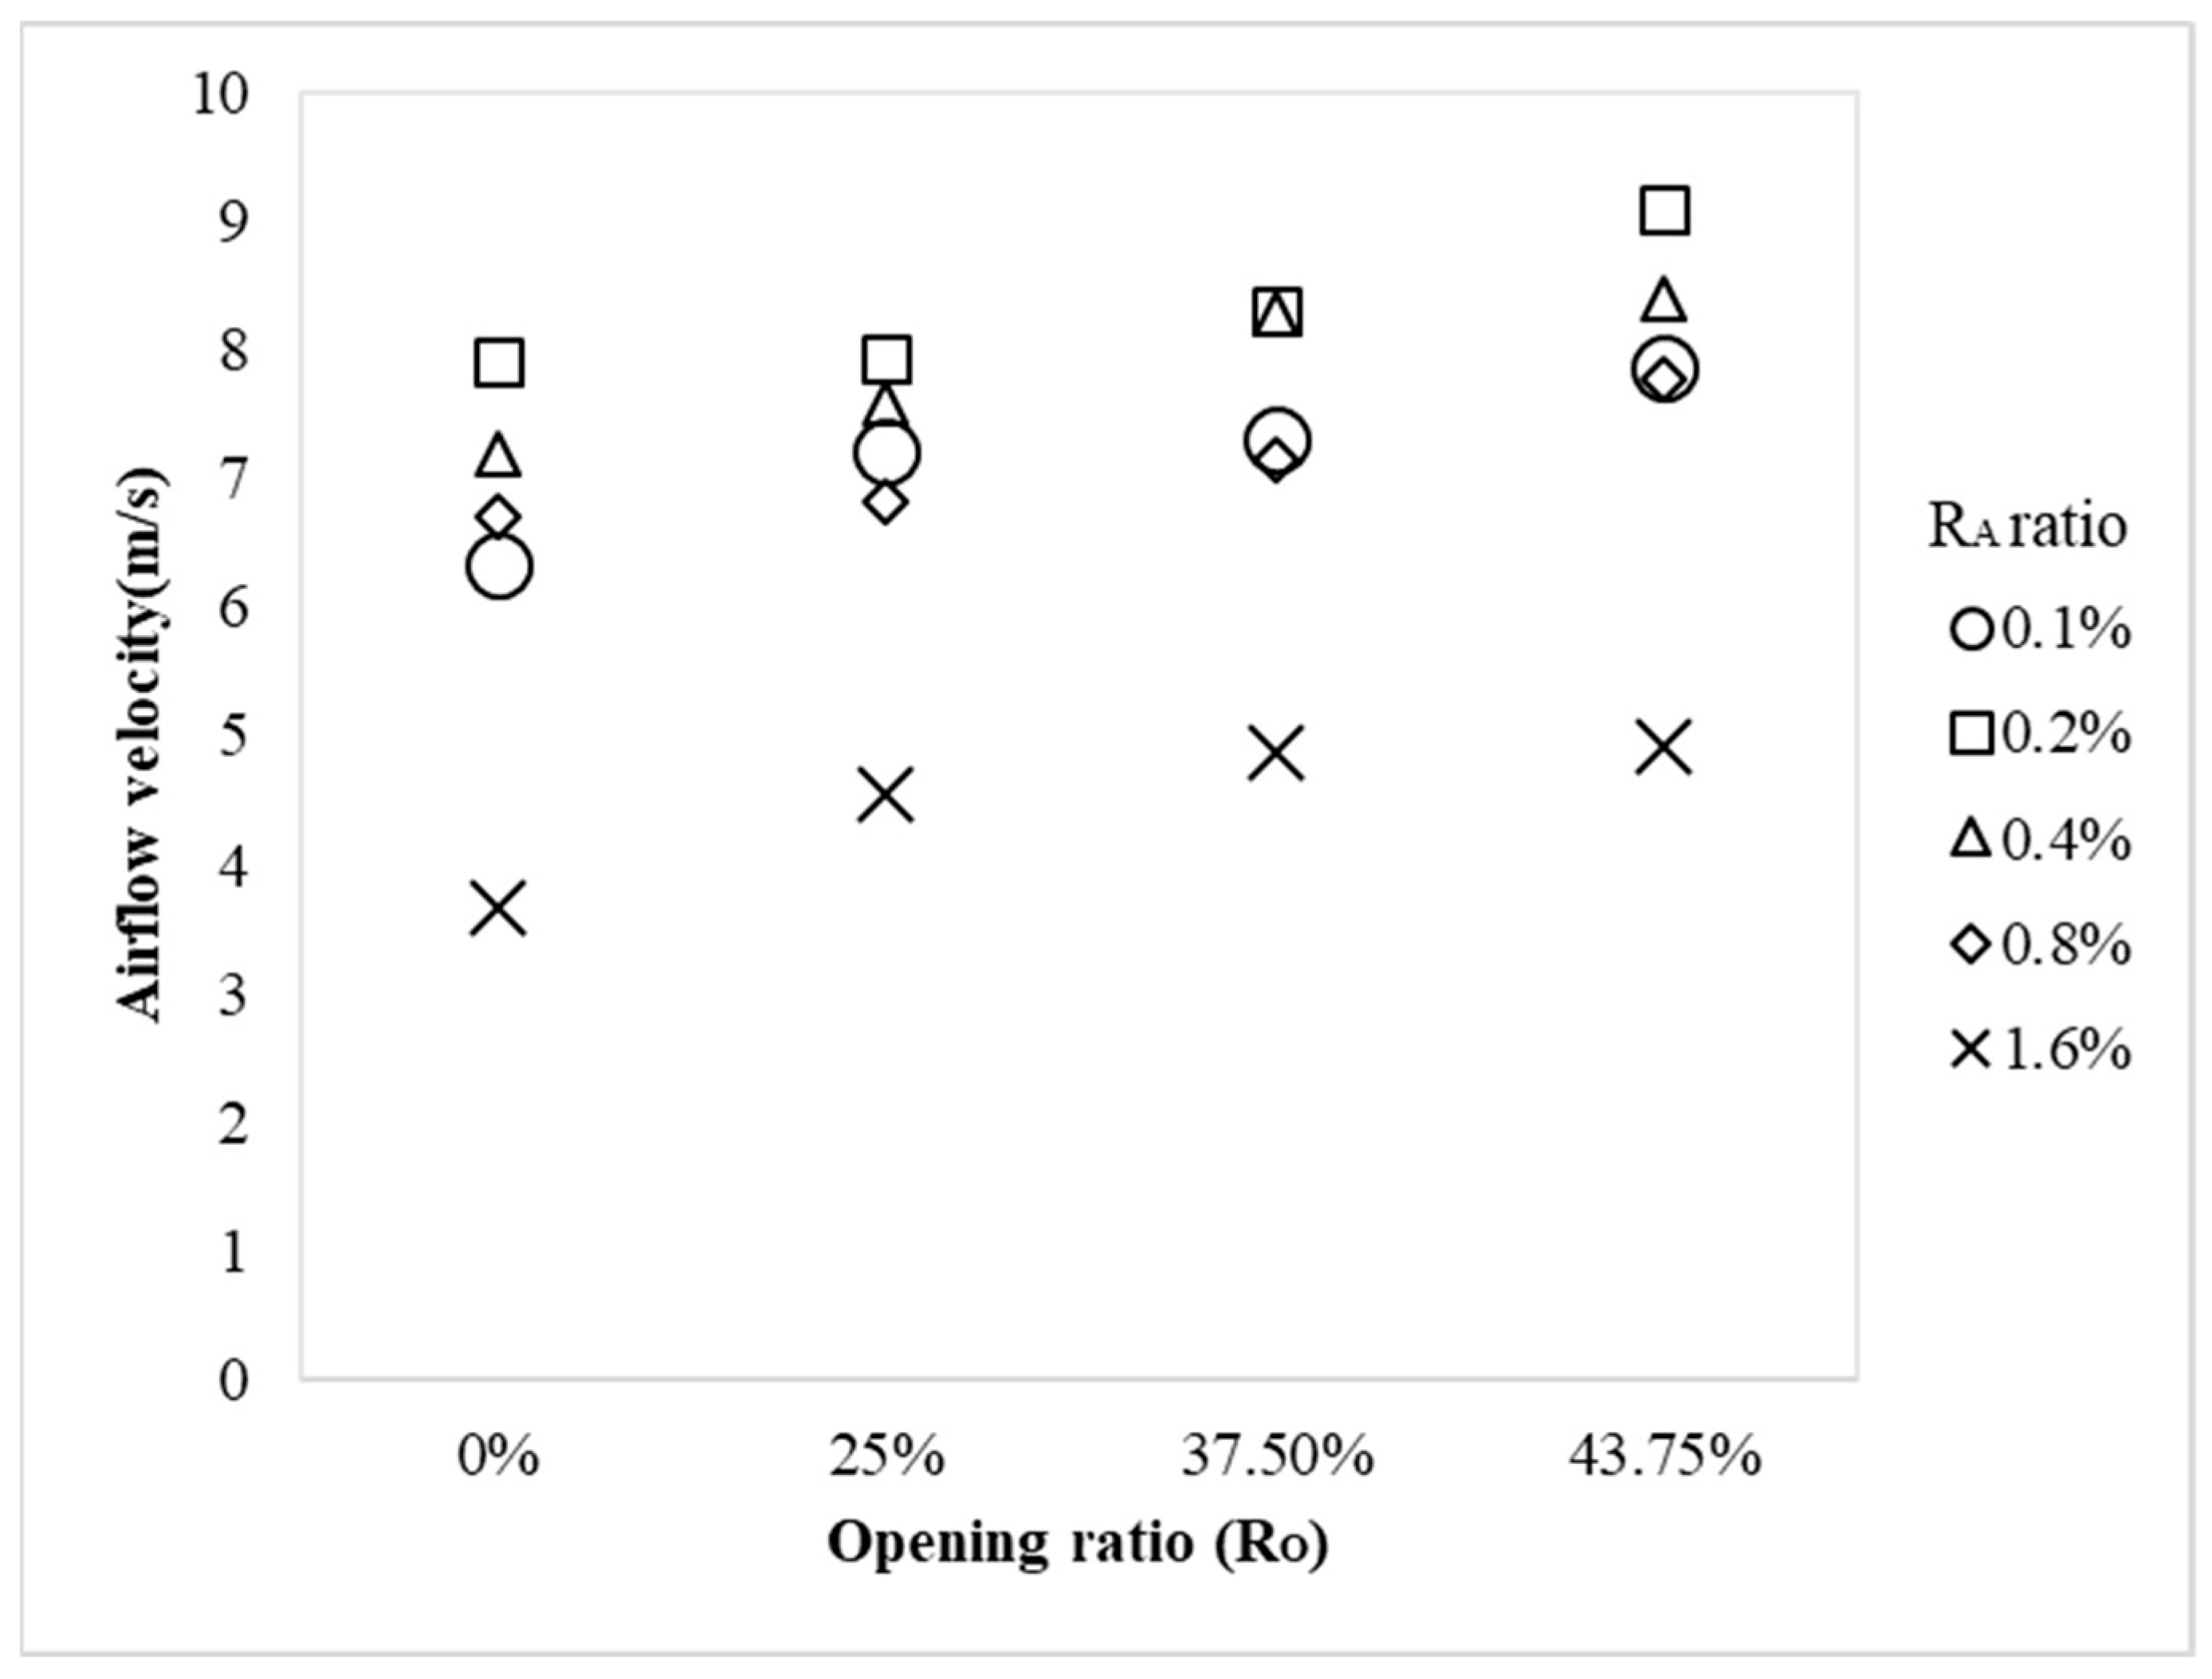
Presented in
Figure 12a–d is the average of velocity of the air flow for various ratios of orifice
RA, which varies from 0.1% to 0.8%, while the ratios of the gate opening of the OWC converter to chamber height
RO are also varied. It is observed from
Figure 12a–d that an increase in the wave height corresponds to increases in the air flow velocity, no matter what the orifice opening ratios are. Regarding the variation in the opening ratio
RO of the air chamber gate, the air flow velocity seems to not be influenced much when the outlet orifice of the chamber is as small as
RA = 0.1%, as shown in
Figure 12a. However, for the other opening ratios of outlet orifice
RA, as observed from
Figure 12b–c, a clear separation in the velocity performance is found for the chambers with various opening ratios of the air chamber gate
RO. The OWC with the larger opening ratios for the air chamber gate
RO, such as
RO = 37.5 % and 43.75%, have higher velocities in the cases where the
RA ratio is 0.2% and 0.4%, as shown in
Figure 12b,c. When the OWC chamber has a larger orifice for the outlet air, such as the ones with
RA = 0.4% and 0.8%, a high velocity of air flow occurs for the case in which
RO = 37.5%, as shown in
Figure 12c,d.
Presented in
Figure 13 is the average velocity of the experimental data for the various ratios for the gate opening of the OWC converter to the height of the air chamber of the OWC—wherein the data are also presented along with the variation in the
RA ratio. It is observed that an increase in the opening ratio of the air chamber gate
RO corresponds with an increase in the velocity of the air flow until it reaches a steady value. As is observed from the figure, when the gate opening
RO ratio reaches 37.5%, the velocity stays at a higher level, especially for OWC with smaller orifice openings, such as
RA = 0.2% and 0.4%. This shows that, based on the experimental data, a front opening gate of the chamber in the OWC may produce a stronger velocity for the air flow.
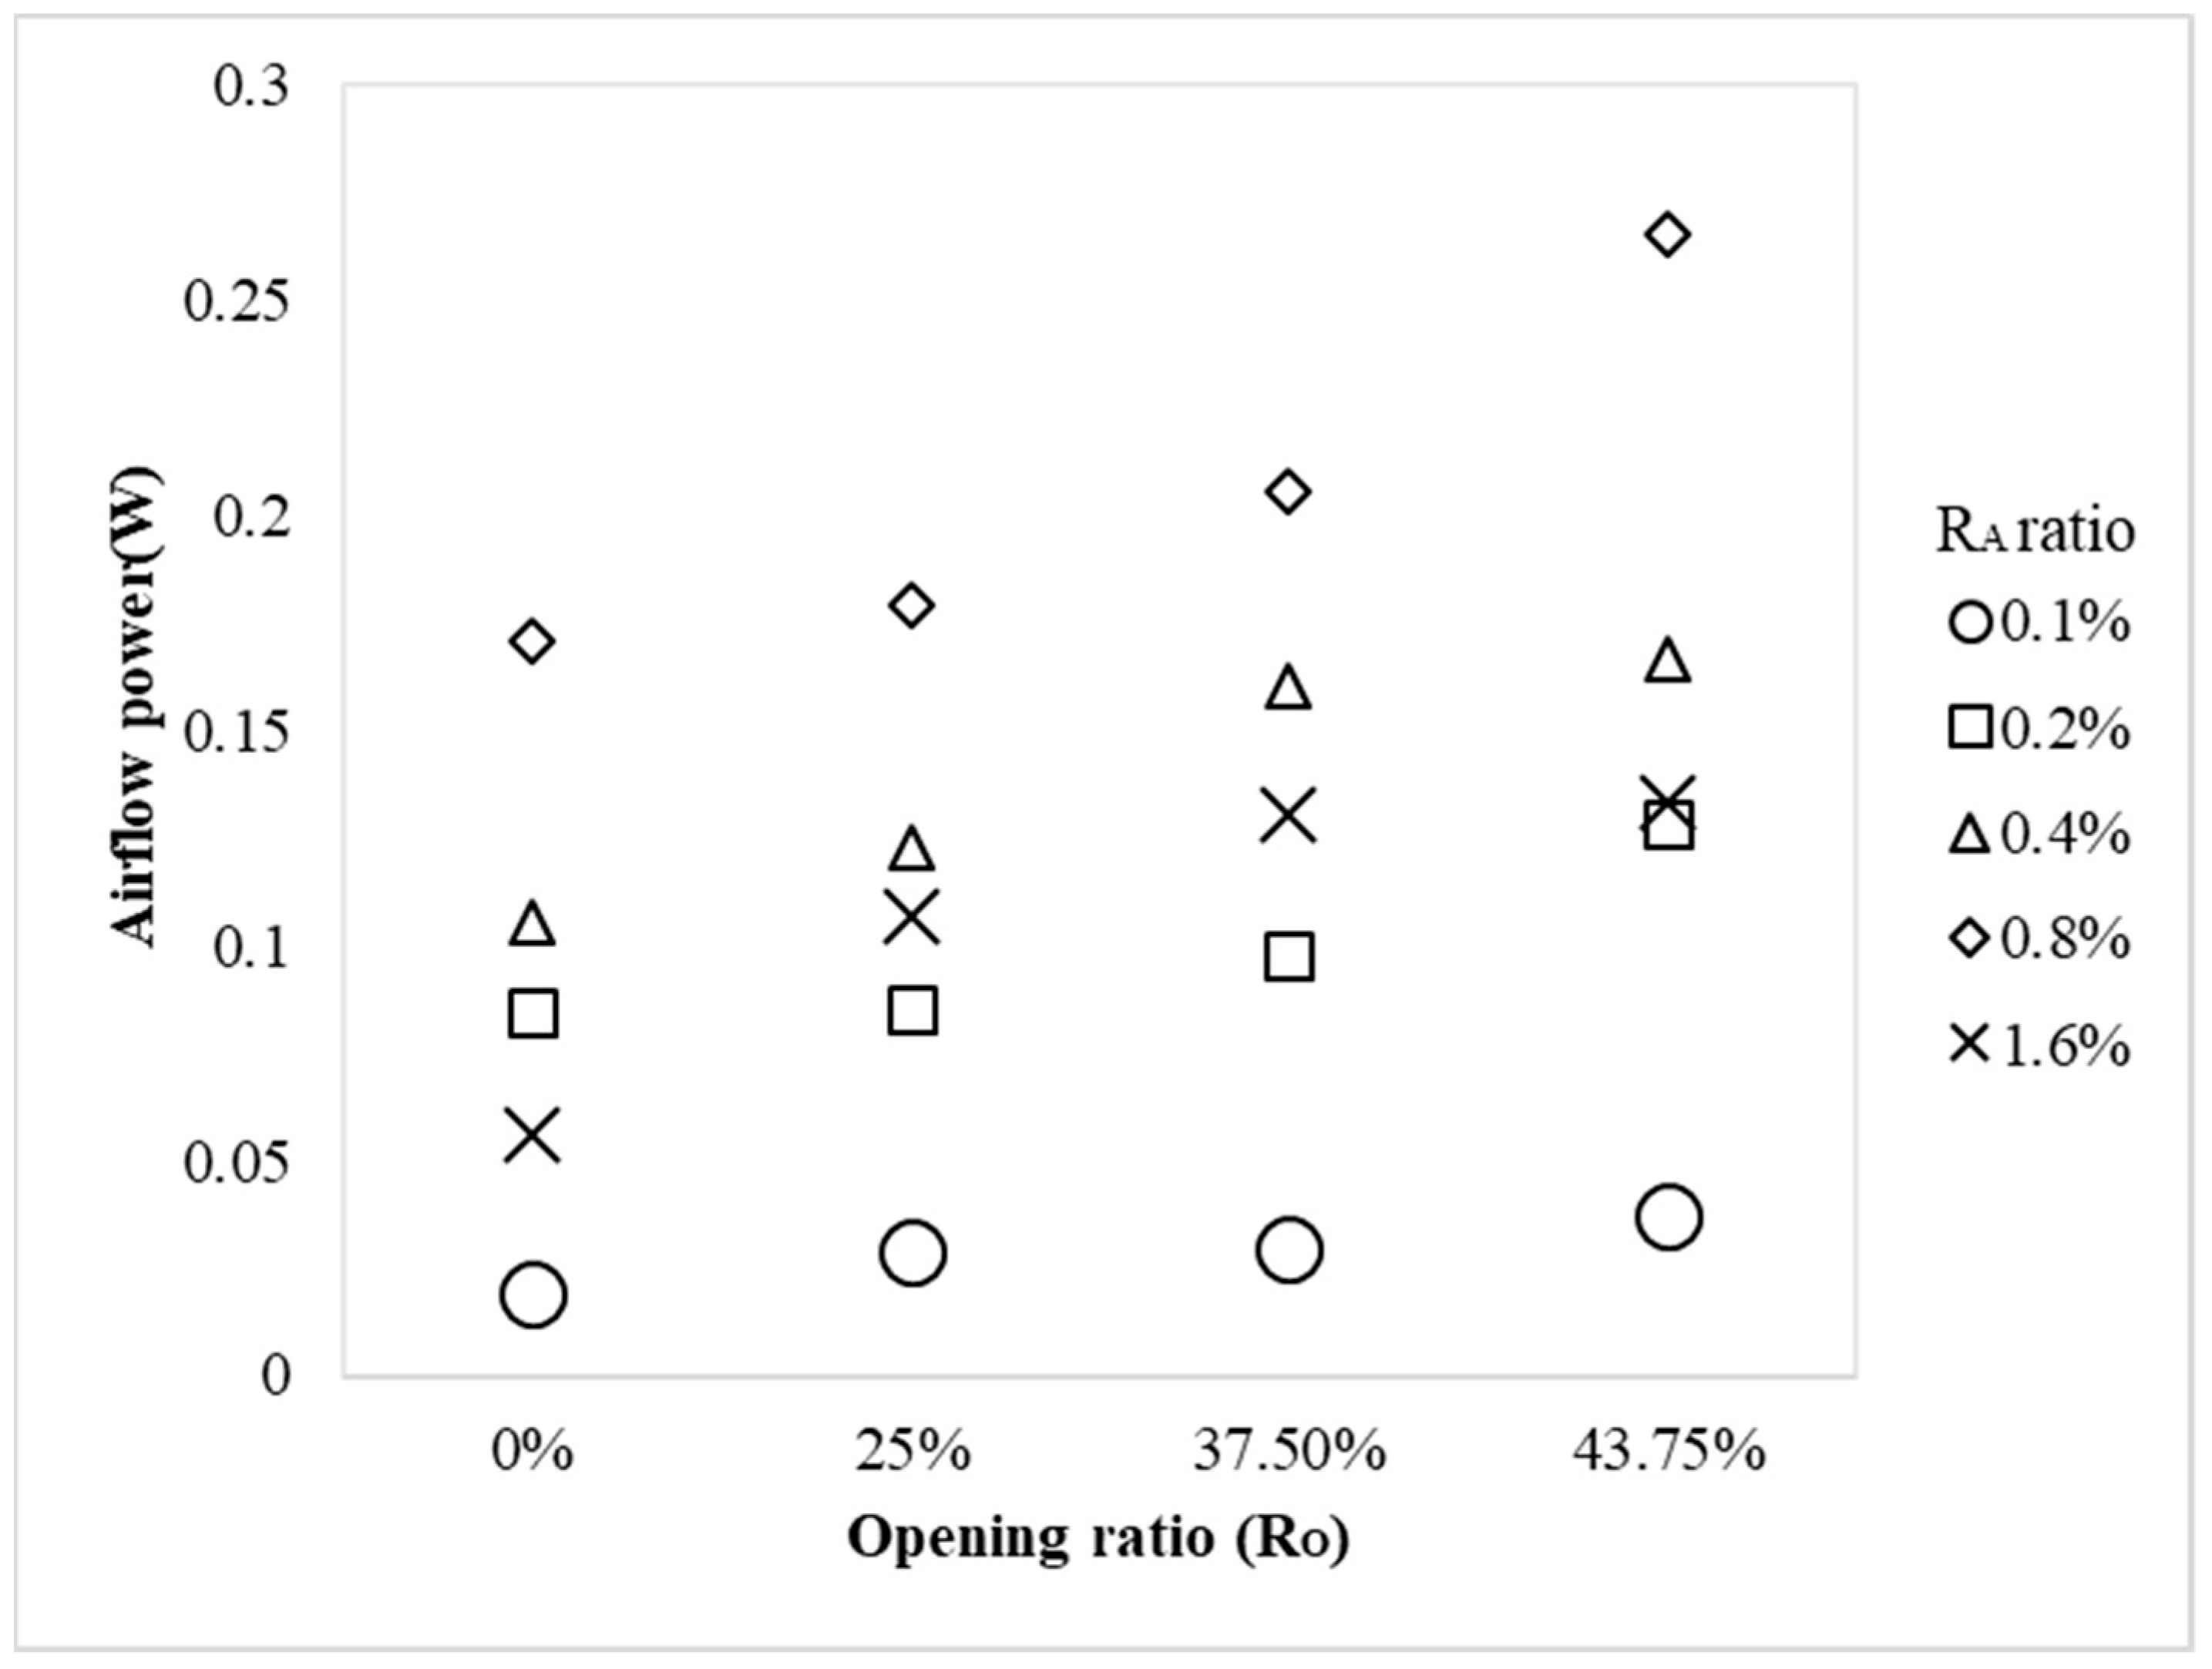
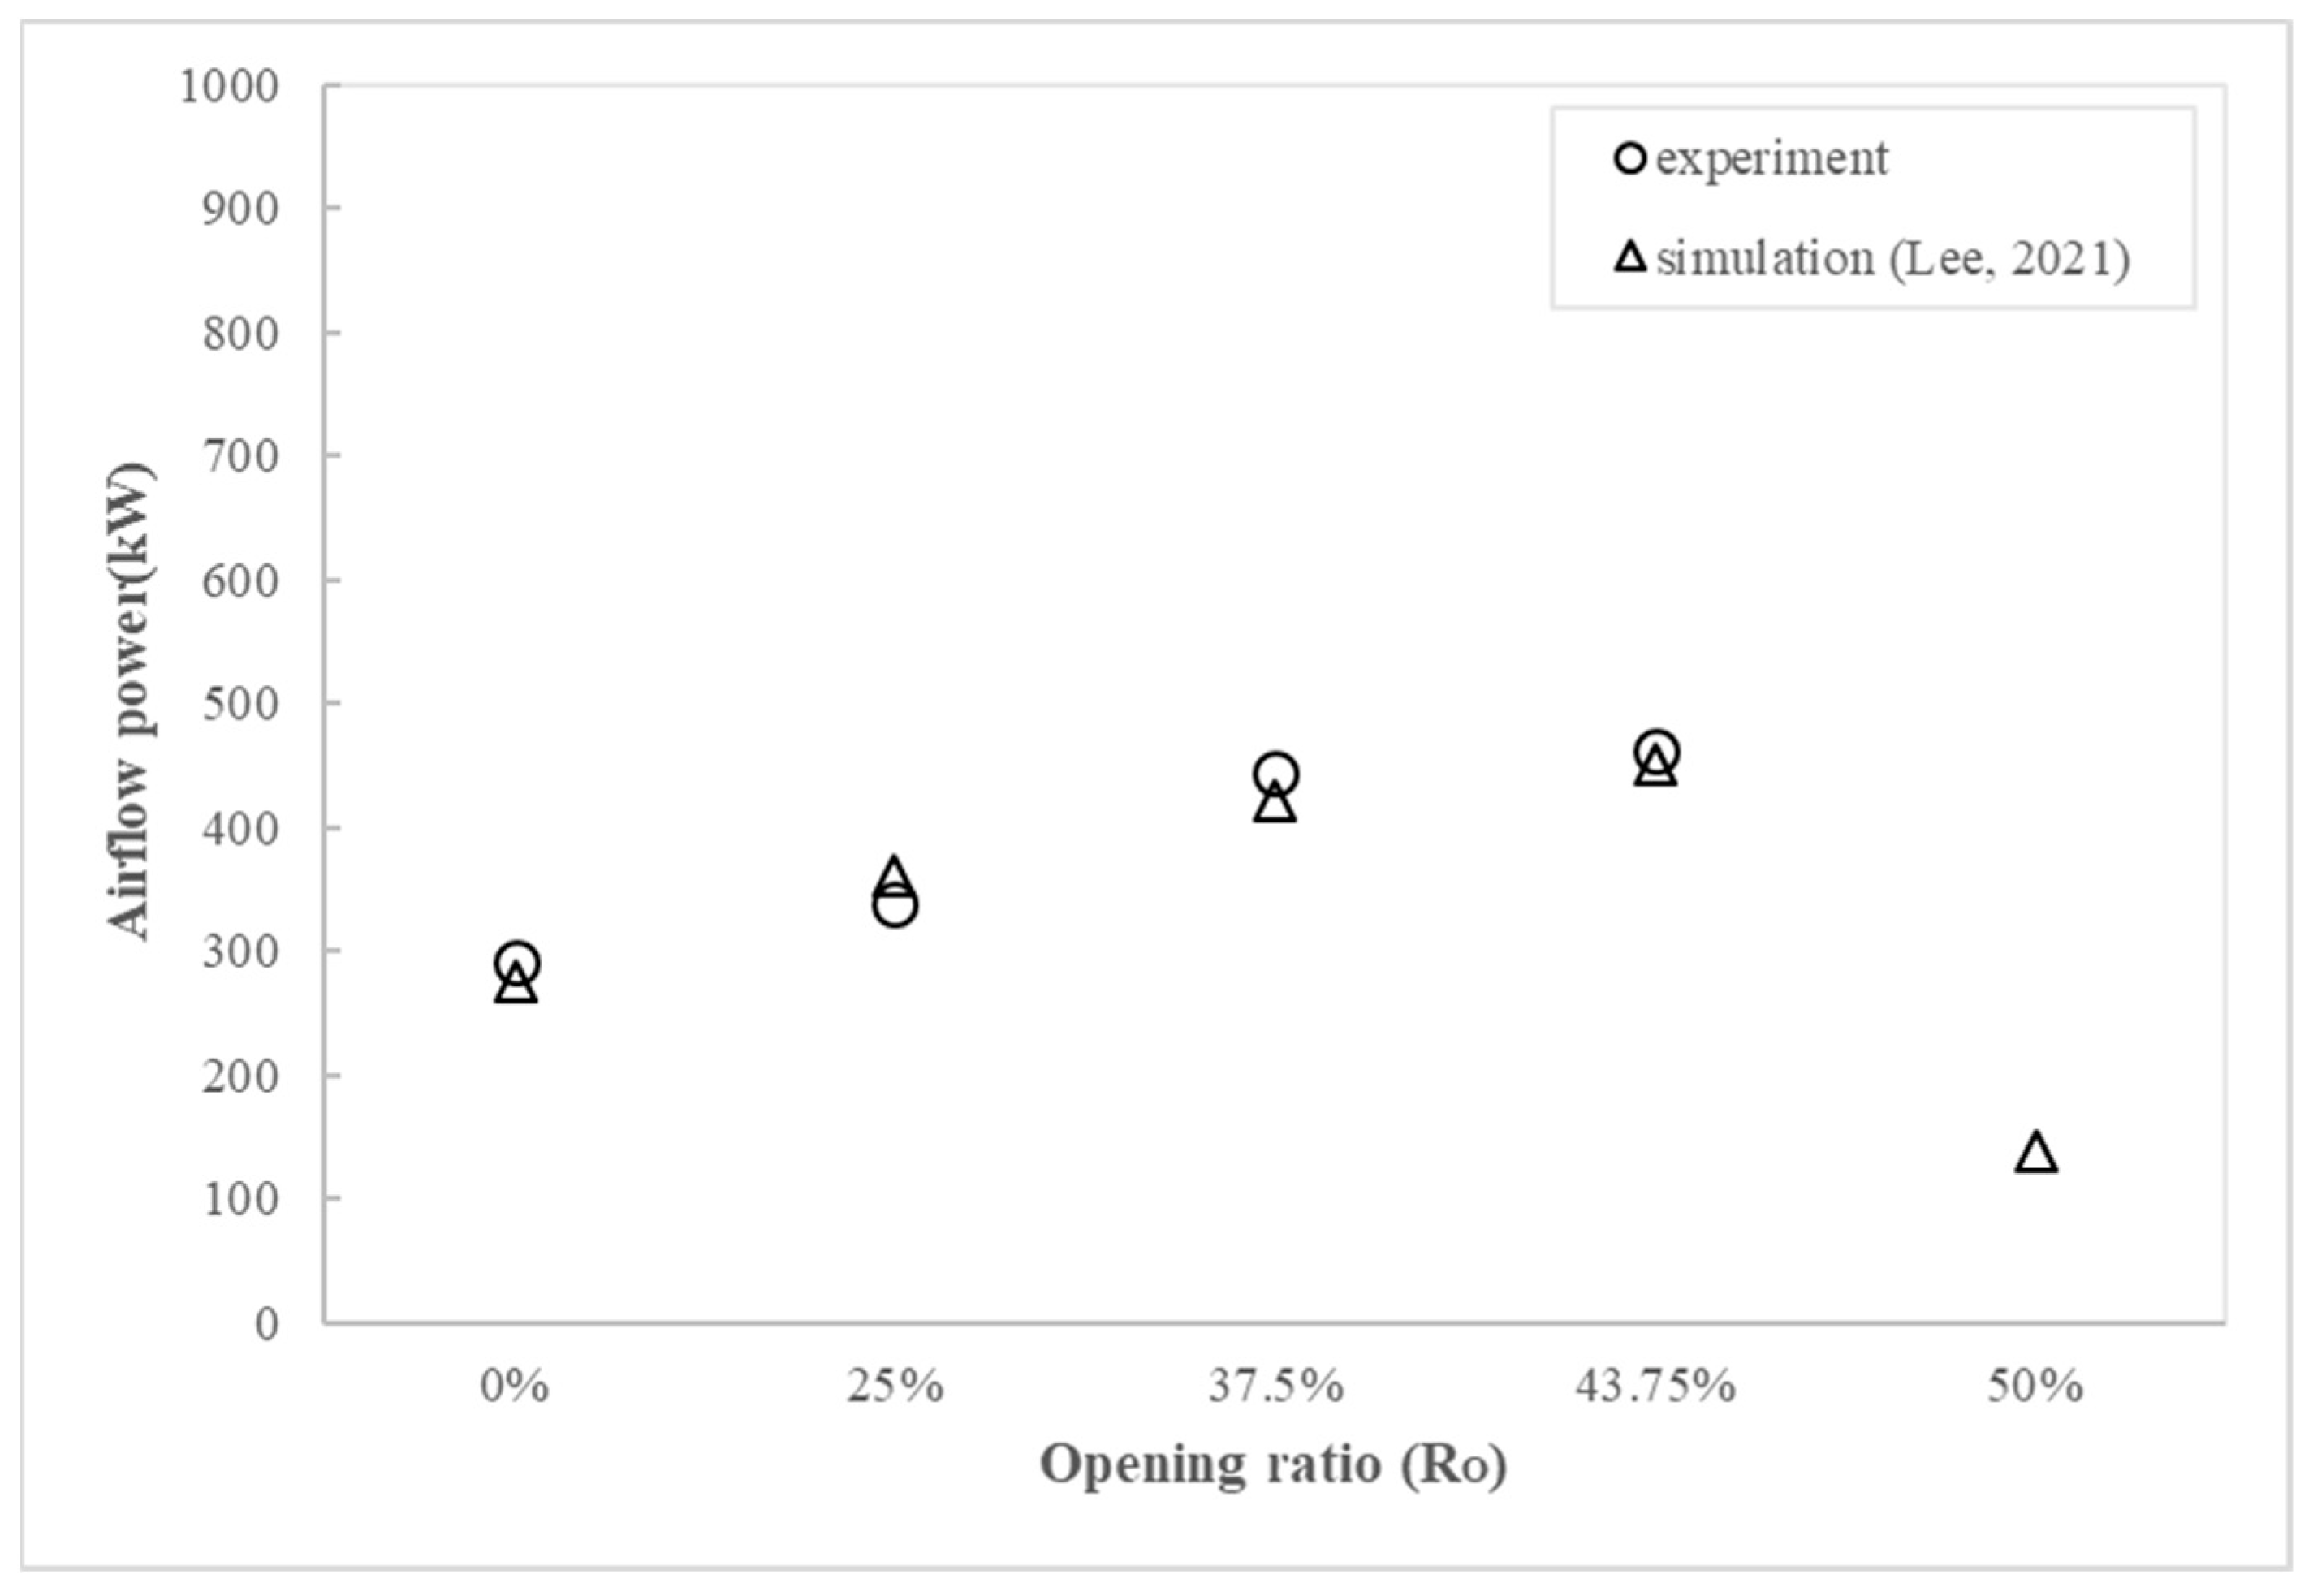
Presented in
Figure 14 is the experimental data of the average power of air flow for the various opening ratios of the OWC gate to the height of the chamber in the OWC. Similarly, the effect, due to the variation in the
RA ratio, is also correspondingly presented.
It is observed that an increase in the opening ratios of the OWC gate corresponds with an increase in the pneumatic power until the ultimate peak value. The increment of the pneumatic power is in a non-linear but stiffer slope compared to the velocity-increment trend. The maximum power obtained that corresponds to the gate opening in this case is 0.265 W when the gate opening ratio is 43.75% to the height of the air chamber in the OWC.
3.3. Experimental Results Corresponding to the Ratio of Chamber-Height RZ
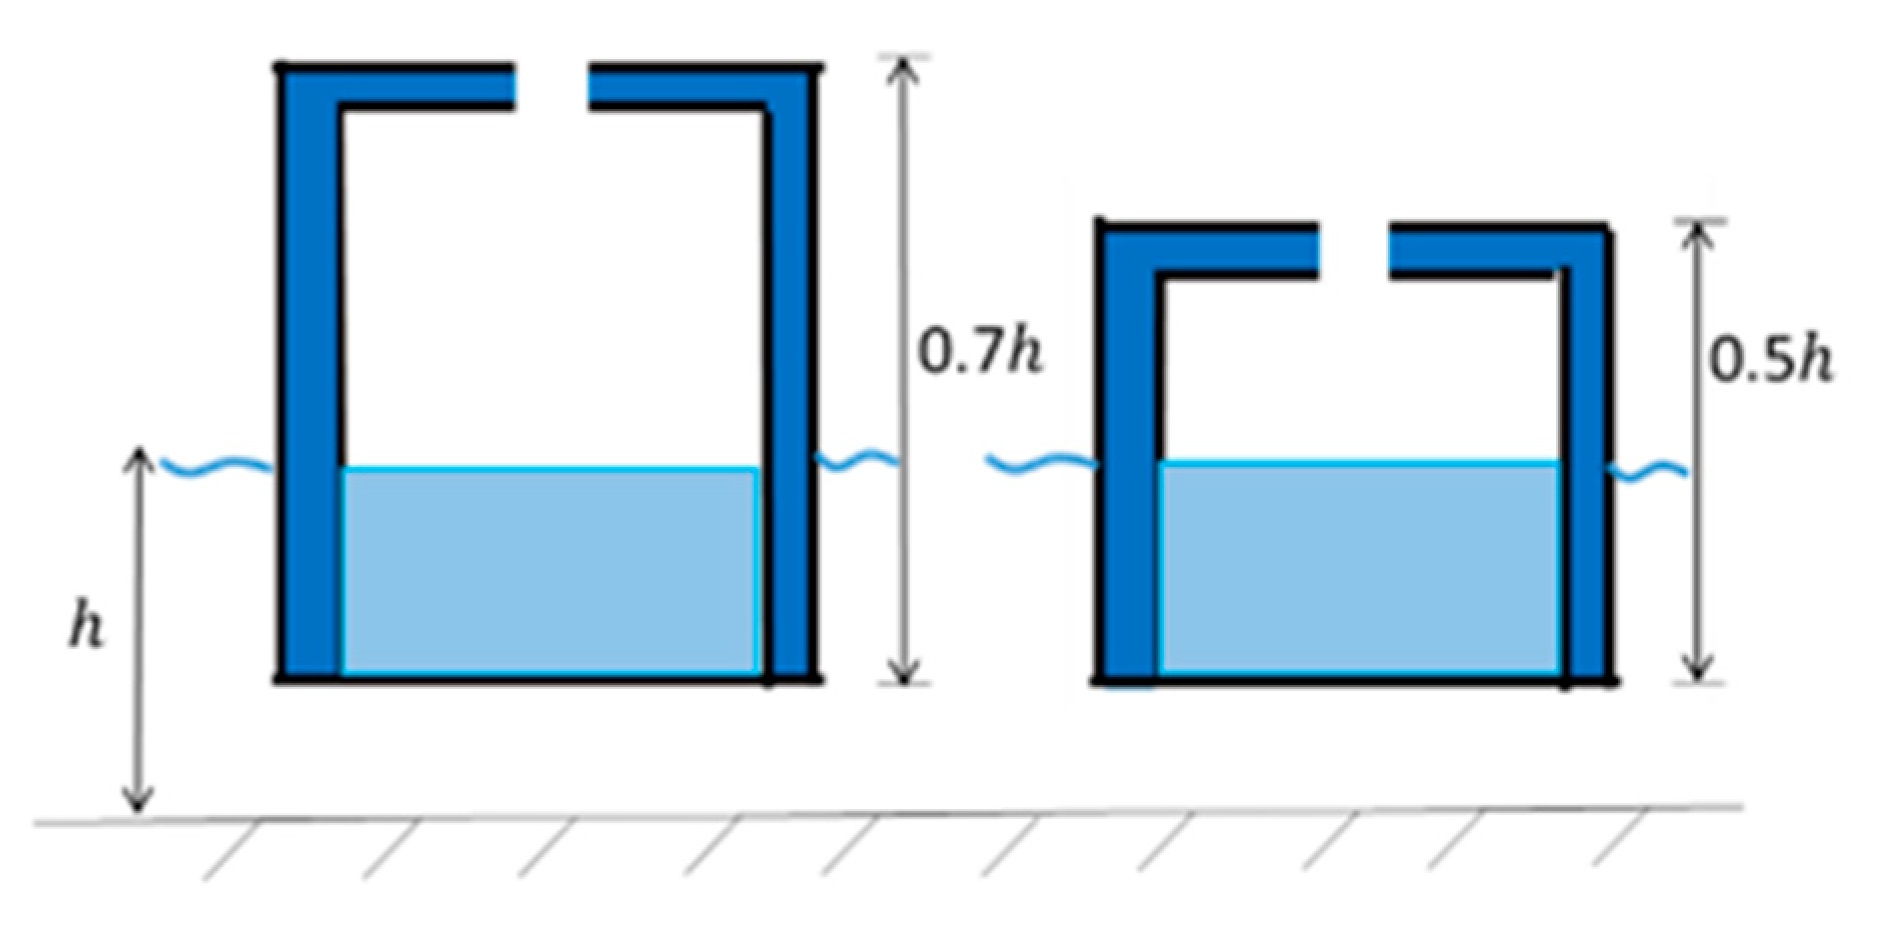
The submerged depth of the OWC may have an influence on the performance of an OWC converting system. Therefore, in this section a dimensionless ratio for the chamber height of the OWC converter compared to the water depth is taken into consideration, as indicated in
Figure 6 and
Figure 15. Two variations of the chamber height for the air chamber were determined. The dimensionless ratio for the chamber height of the OWC converter compared to the water depth is set as
RZ = 70% and 50% when the water depth of the chamber is 70 cm.
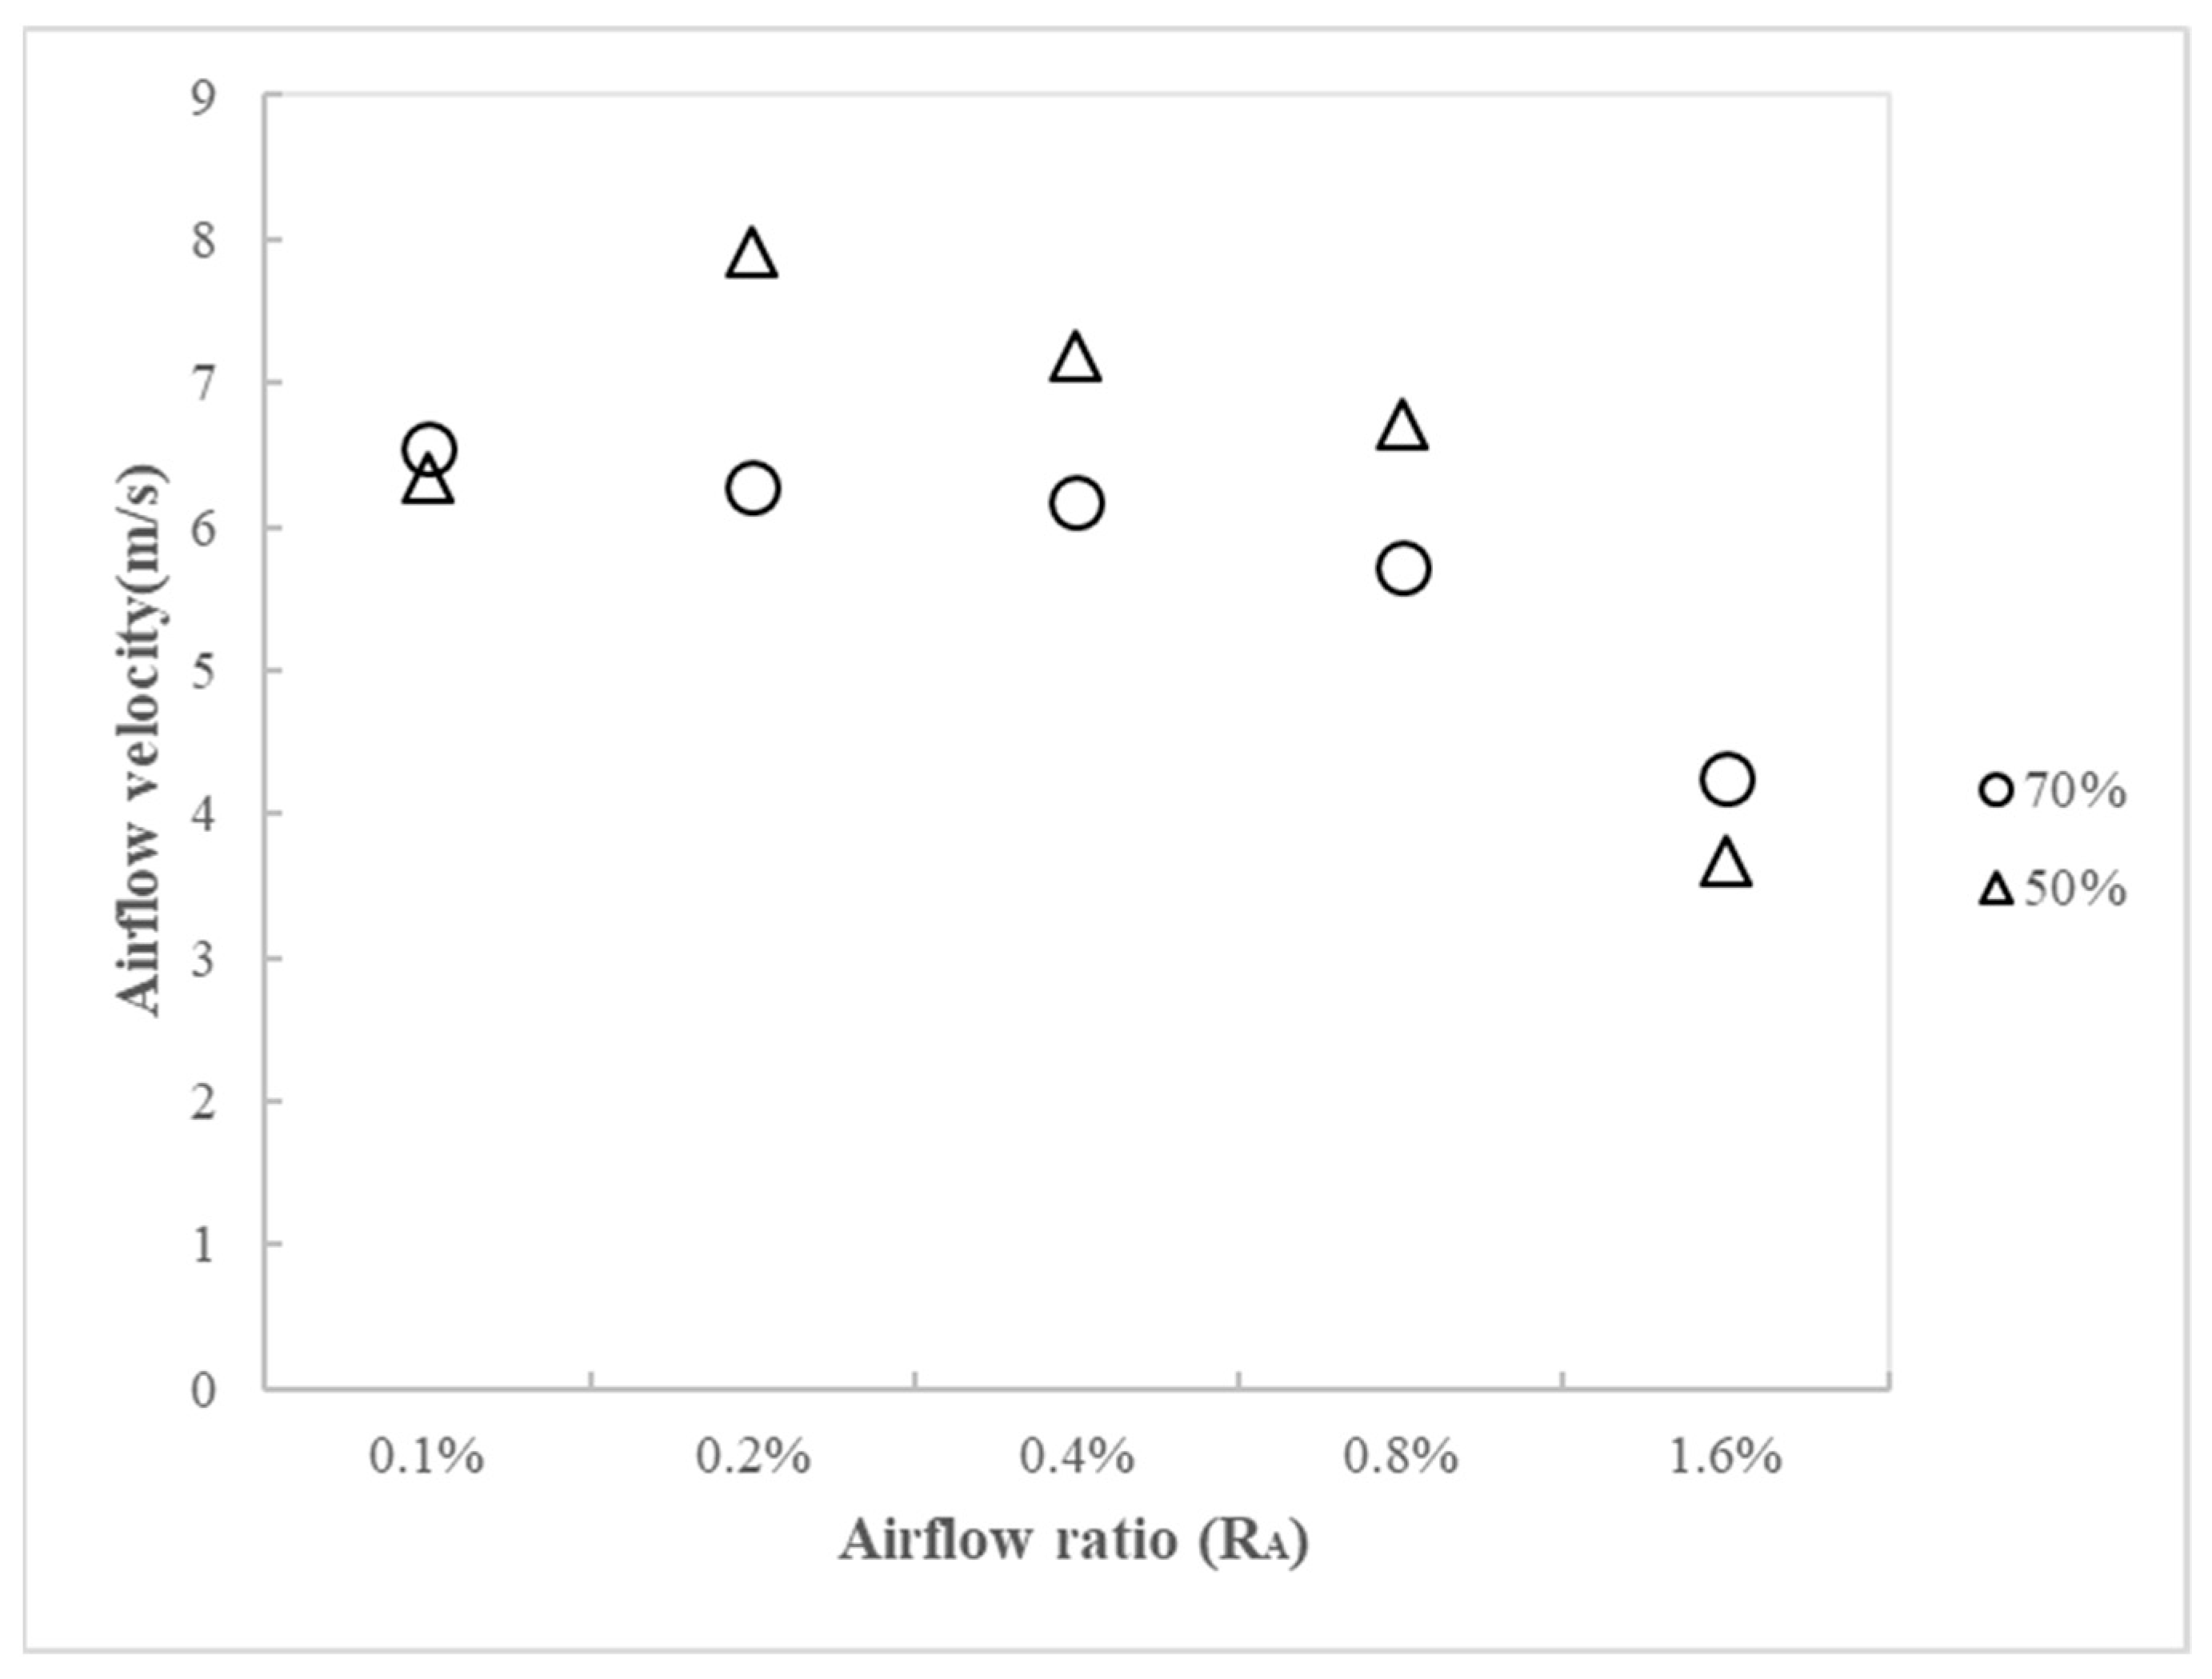
Presented in
Figure 16 is the average of the experimental data for the velocity of the air flow for two ratios
RZ of the chamber height of the OWC converter to the water depth. Along with the parameter
RZ, the variation of the opening ratio of orifice
RA is also presented.
It is found that when the ratio of the chamber height of the OWC converter RZ = 50%, the airflow velocity is larger than the case where RZ = 70% generally. However, there are some exceptions when the opening ratio of orifice RA is the smallest or the largest value, such as RA = 0.1% or 1.6%, in which the velocity of the air flow in an OWC with RZ = 50% becomes smaller than the velocity of the case with RZ = 70%. The largest average velocity obtained in the experimental data is 7.9 m/s for the case in which RZ = 50%, and corresponds to RA = 0.2%.
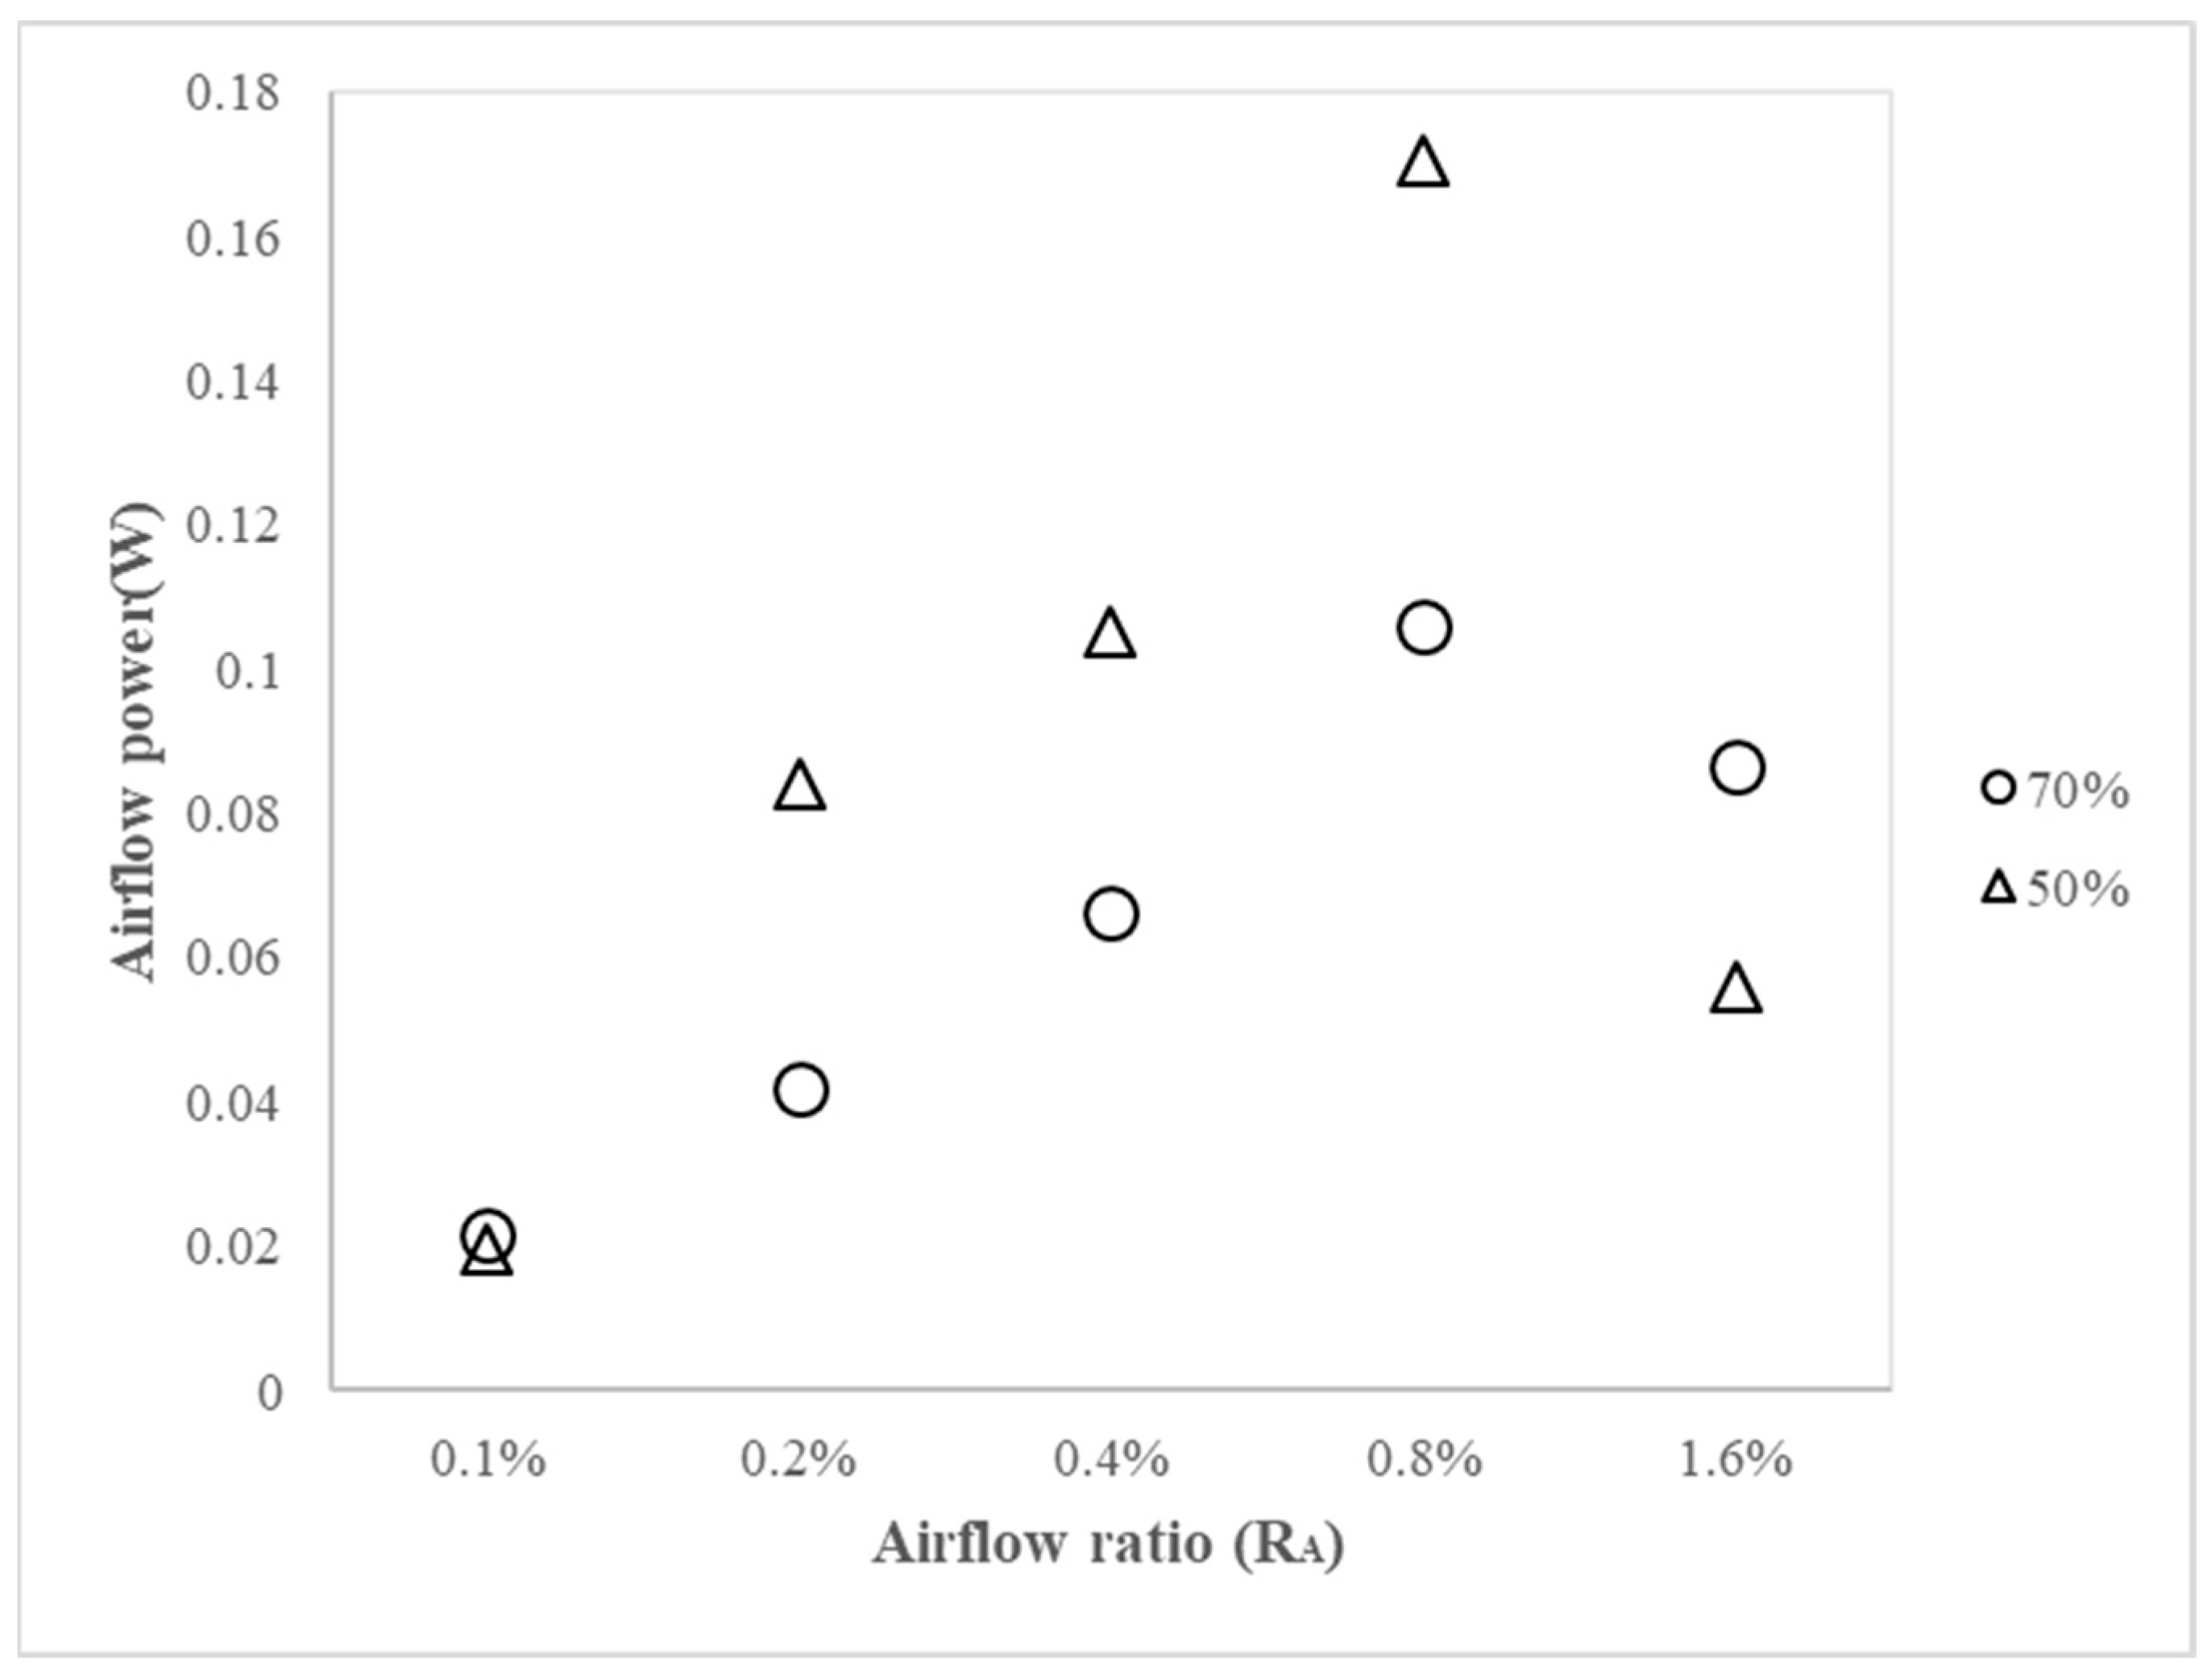
Figure 17 is the pneumatic power that corresponds to two ratios for the OWC chamber height compared to the water depth, namely
RZ = 50% and 70%. When comparing the pneumatic power induced from the OWC with two varied ratios for chamber height to water depth, the one with a
RZ = 50% height ratio has higher pneumatic power than the one with
RZ = 70%. The difference in the variation of velocity is that the largest pneumatic power occurs when the orifice ratio is
RA = 0.8% instead of
RA = 0.2% for the largest velocity. The average pneumatic power obtained in the experimental data is 0.17 W for the case where
RZ = 50%, which corresponds to
RA = 0.8%.
5. Conclusions
By following a related analytical study where an OWC wave energy converting system was installed and combined with an offshore template structure for the wind turbine system as a subsystem for power generation, this study used a scaled-down model including the offshore template structure and the OWC system was built and tested in the water tank. During the experimental test, the data for the wave height and velocity of the air flow from the air chamber of the OWC system were both recorded through a data acquisition system. The parameters related to the dimension of the air chamber were also analyzed and compared to the analytical results. Overall, the experimental data have a very good agreement to the analytical results when the data from the scaled-down model were converted to the responses of the prototype according to the theorem of simulation. Some of the substantial conclusions from the experimental results are as follows:
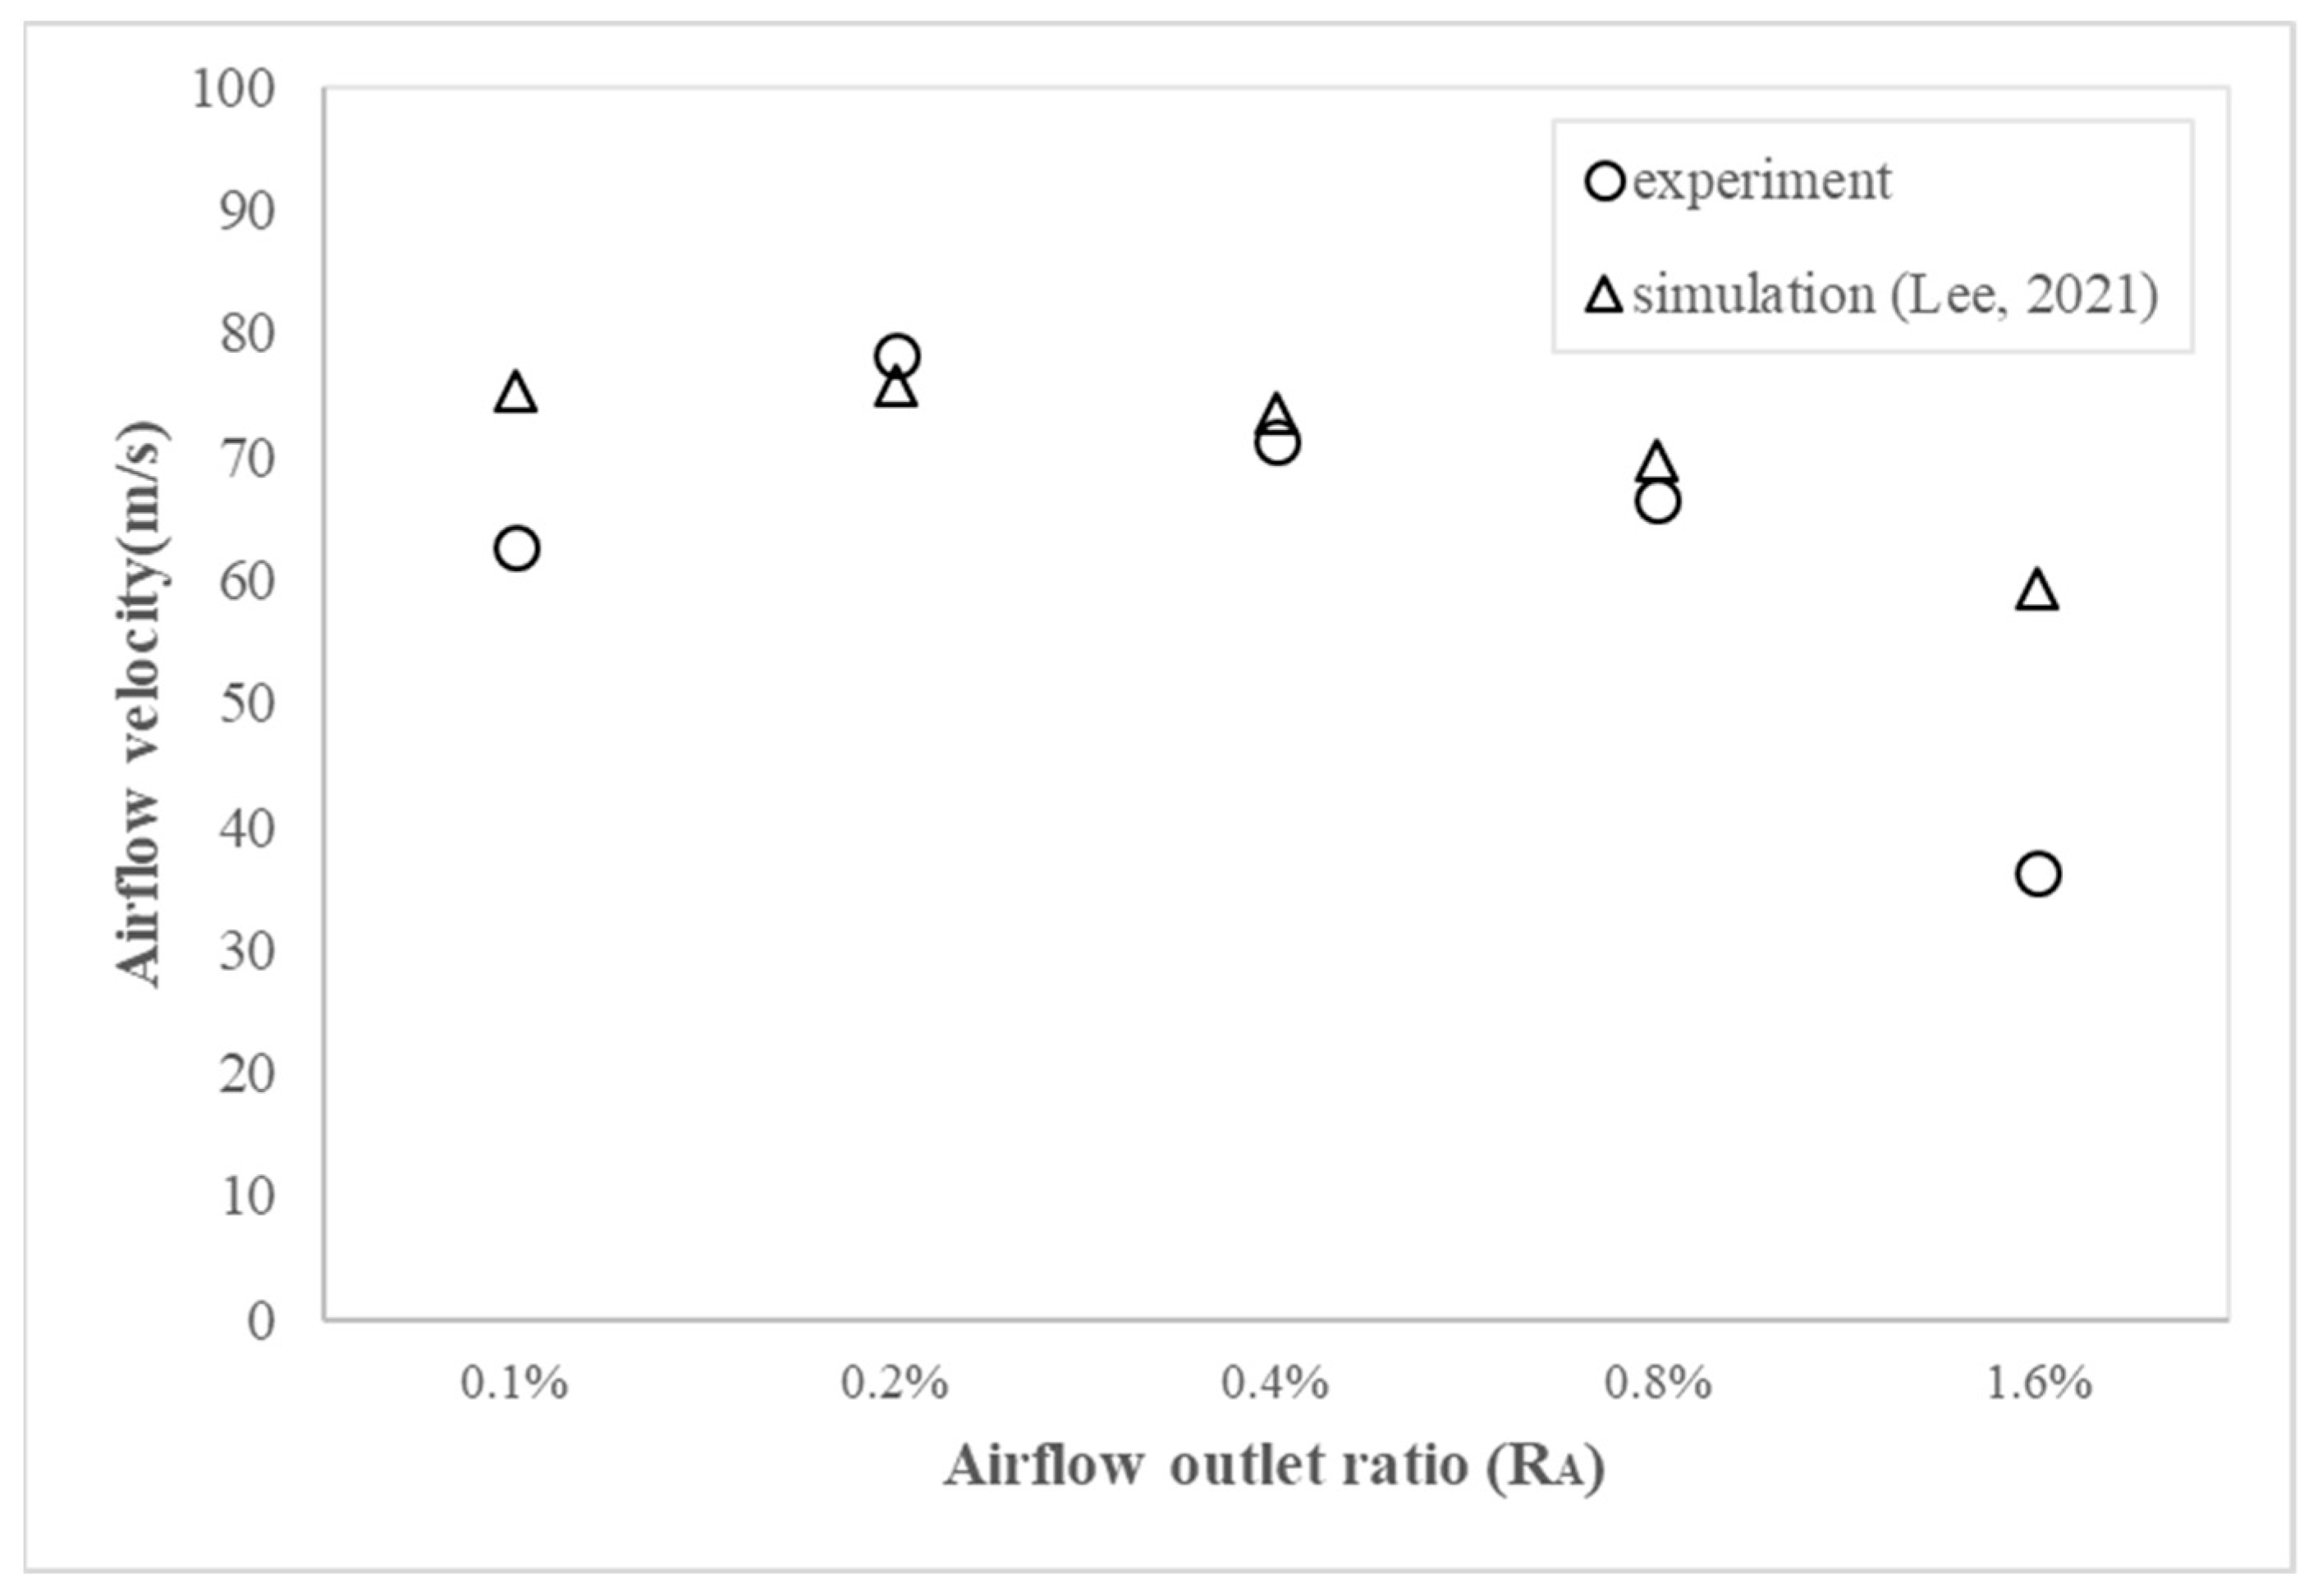
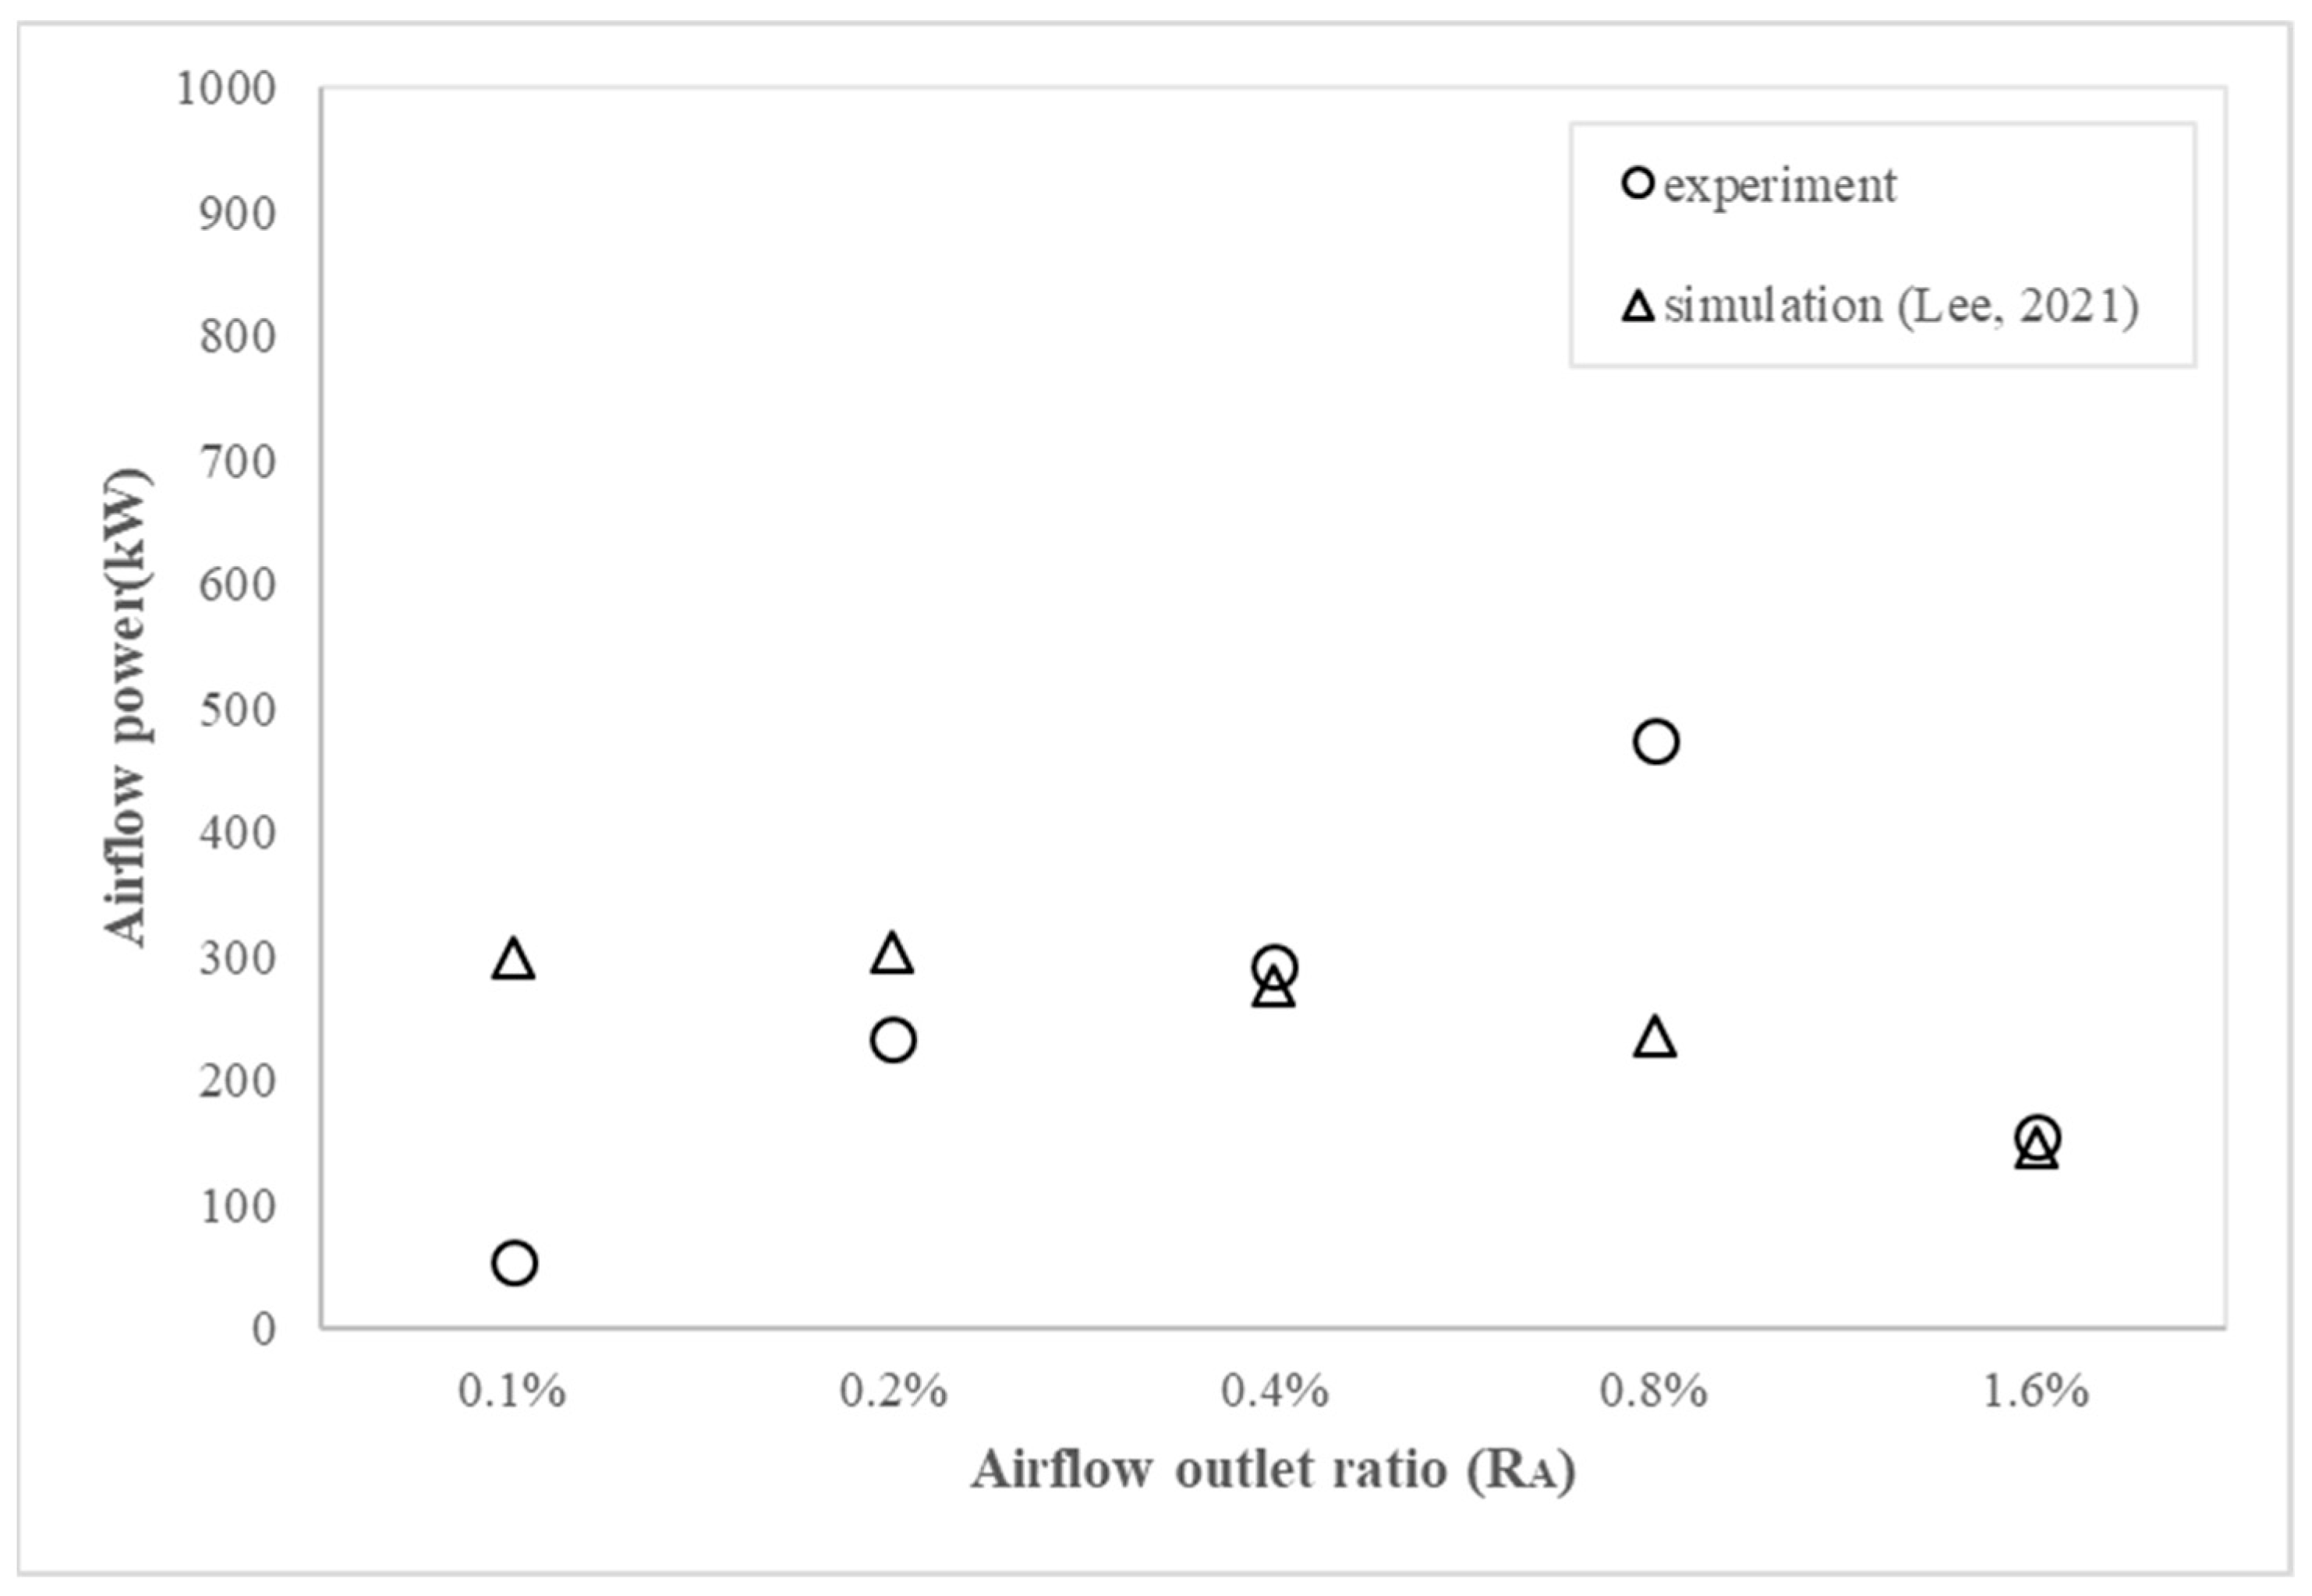
It is verified through the experimental results that an increase in the area ratio RA of the orifice –opening corresponds with a decrease in the converting efficiency decreases. However, for the largest and the smallest orifice opening ratio of the chamber, namely RA = 0.1% and 1.6%, the experimental data show that the velocity will be smaller than the analytical results. This phenomenon also reflects the converting efficiency of the OWC system.
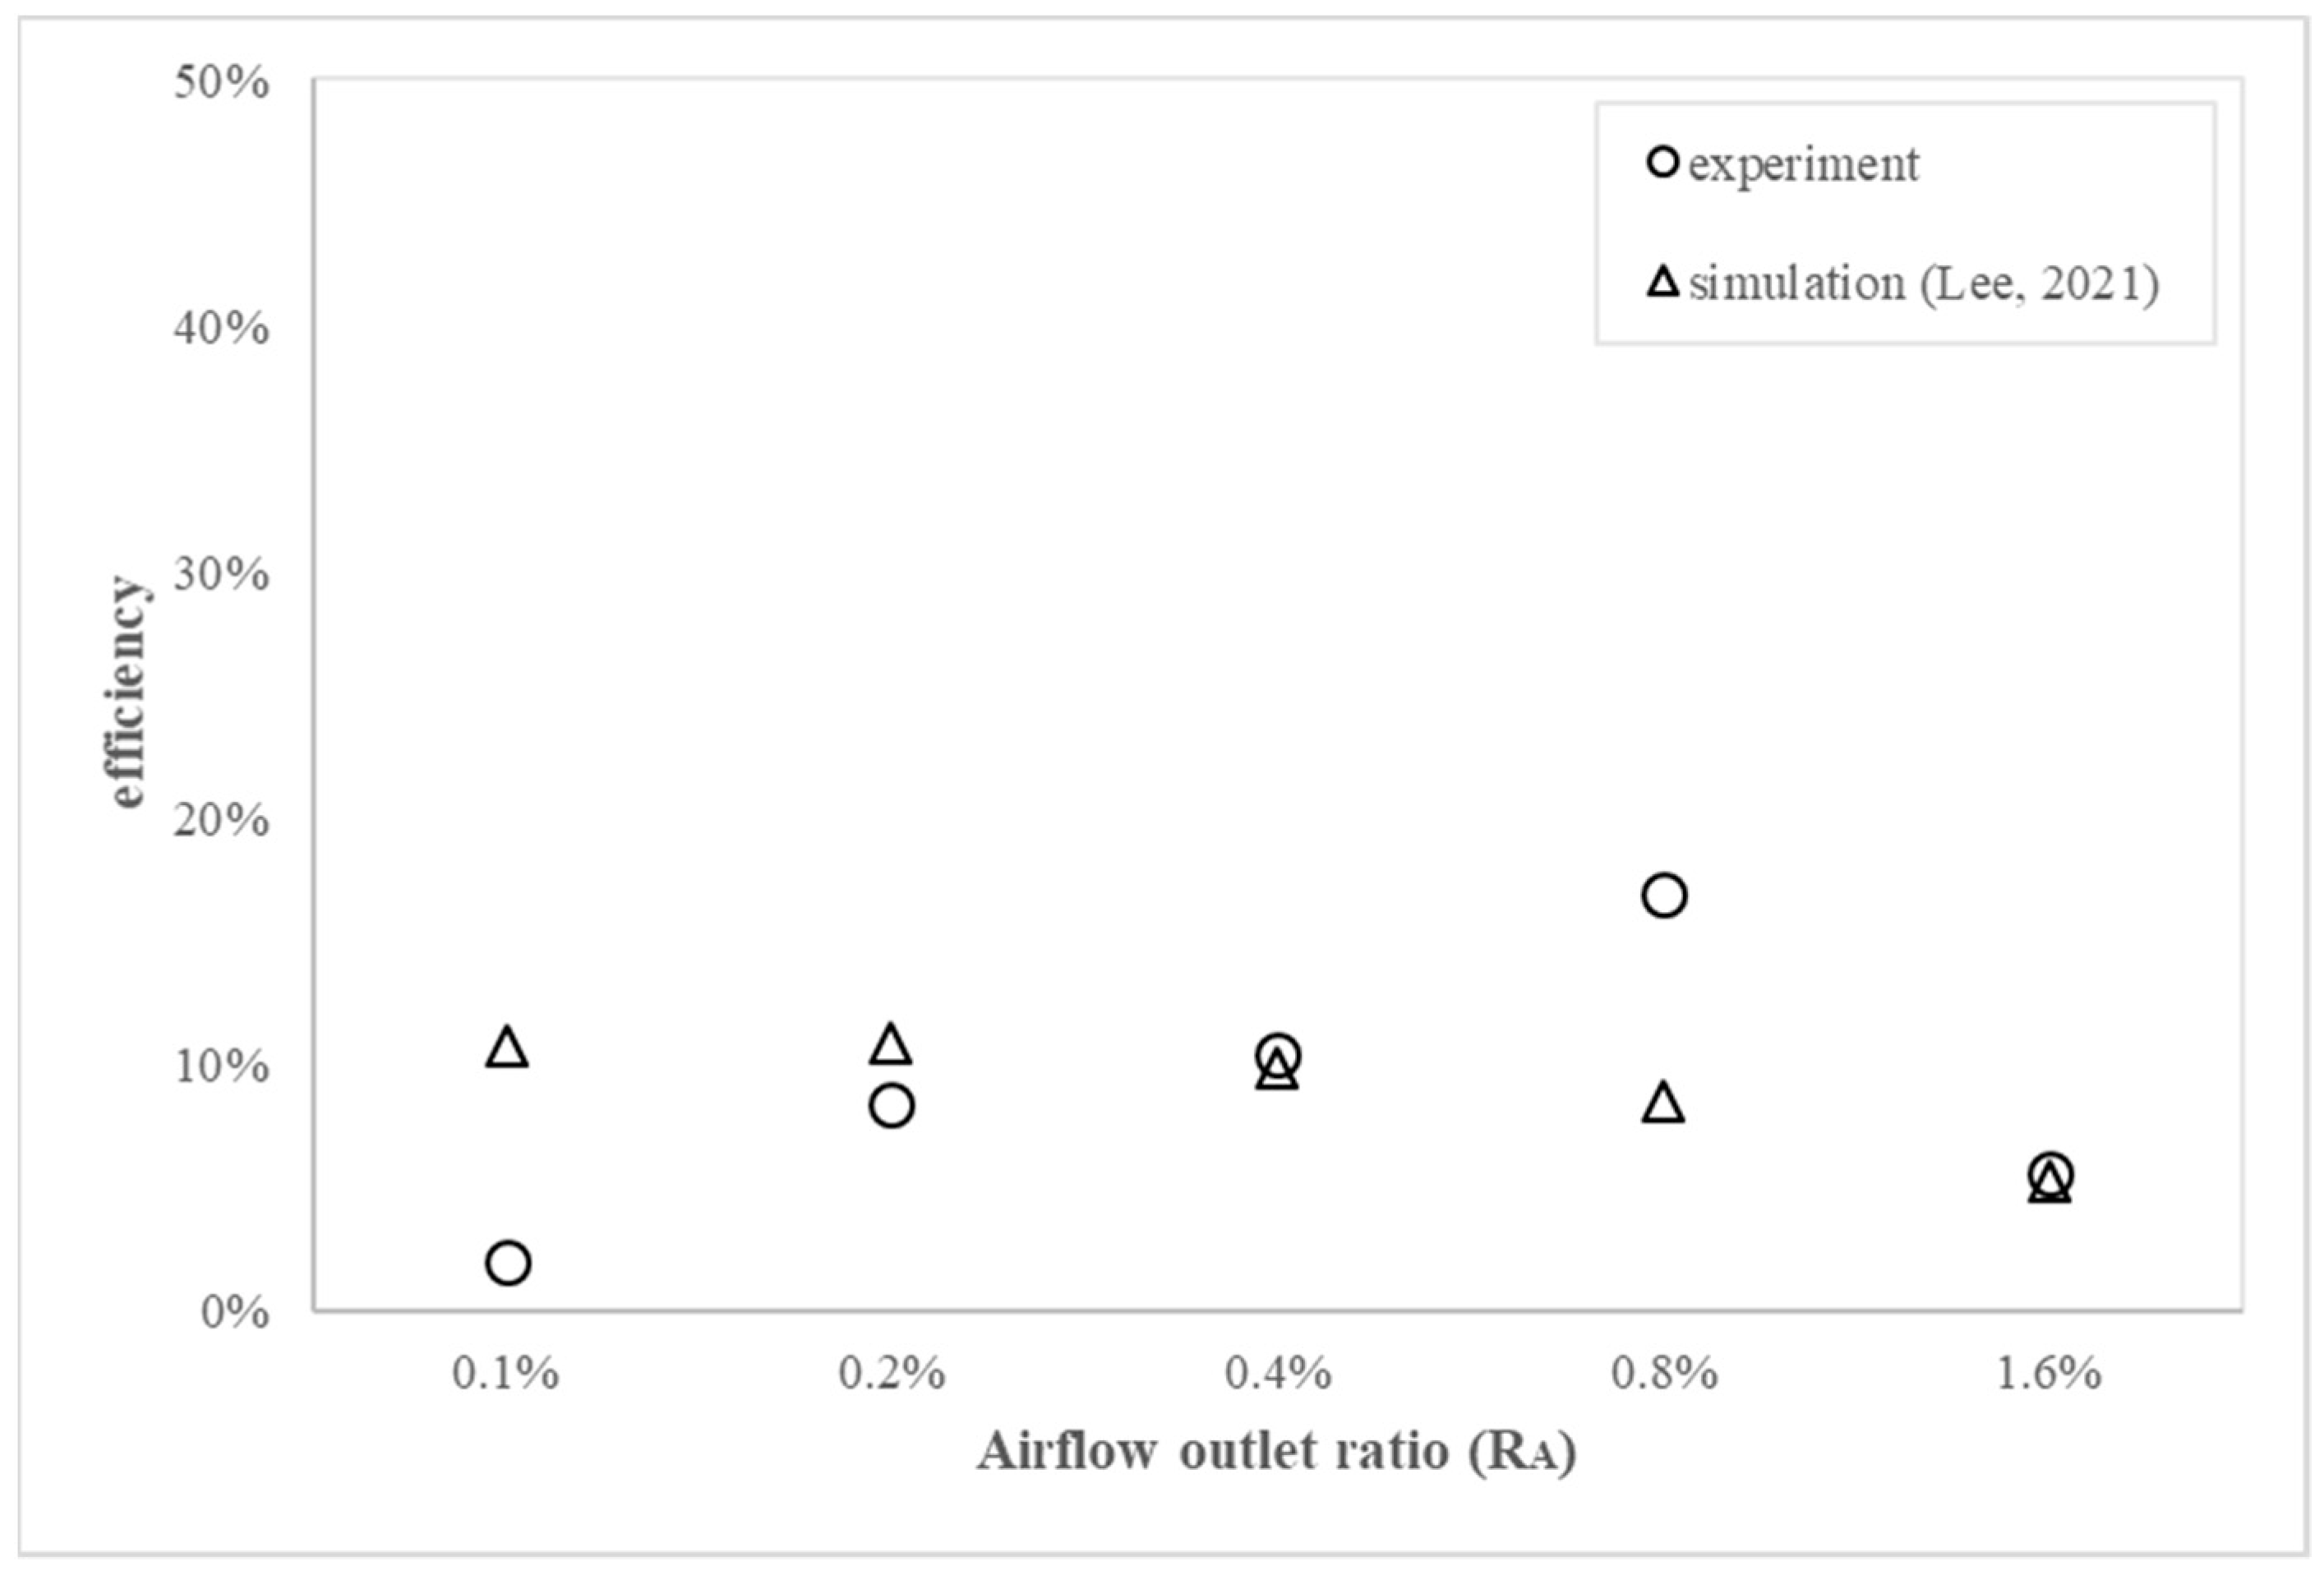
For the converting efficiency from the OWC system installed in an offshore template structure, the orifice opening ratio and the converting efficiency performed similar to each other when RA varied from 0.2% to 0.4%, but, when the RA = 0.8%, it has the best performance, and the efficiency reaches more than 10%. It is also noted that when the front gate opening is not allowed when RO = 0%, the converting efficiency of the OWC will be limited.
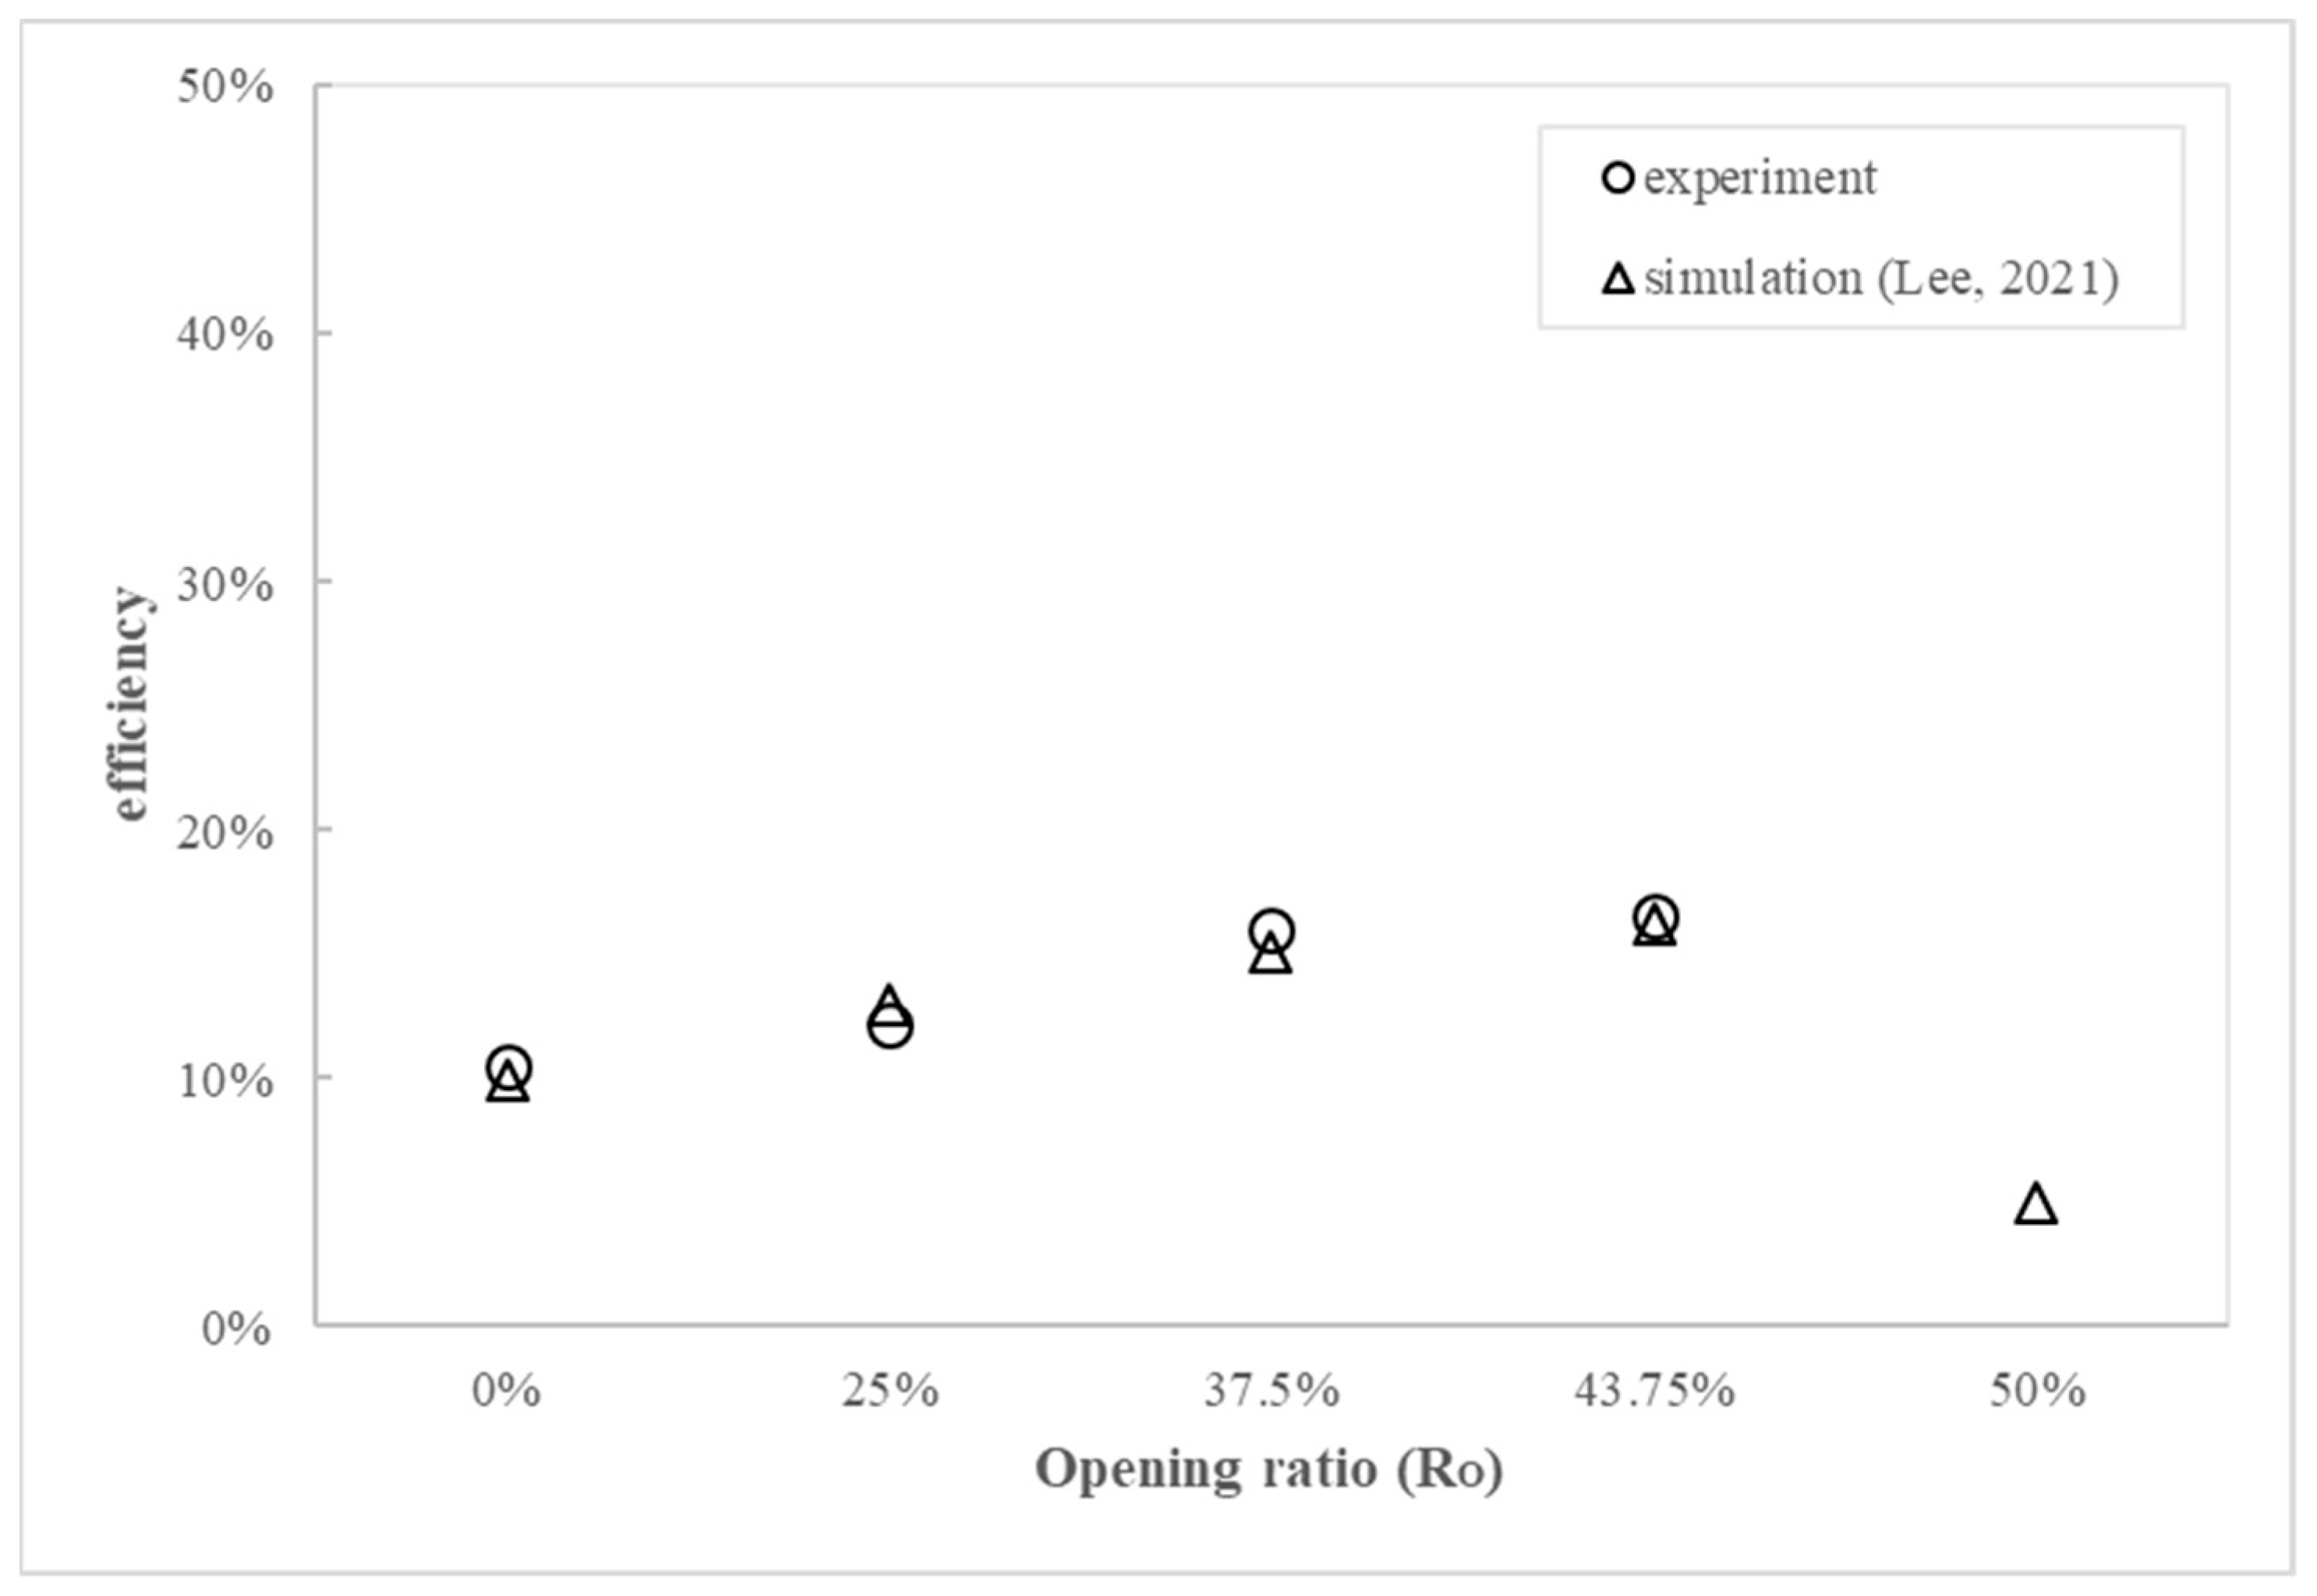
As indicated in the paper [
2] when the gate-opening is allowed in the direction of the incident wave, the converting efficiency can be greatly upgraded, which is also found in this experimental study. It is noted that for the case where the gate-opening ratio is 43.75% to the height of the chamber during the experimental test, the conversion efficiency can be as high as 16.6%, which is raised by 67% compared to the chamber without an opening in the front wall. The results show that the opening gate can effectively increase the efficiency of wave conversion.
For the ratio of chamber height RZ, only two ratios were tested, namely RZ = 50% and RZ = 70%. The experimental results show that an increase in the depth will directly reduce the outlet air flow velocity and power generation. As was recommended in the analytical study, the air chamber height ratio compared to the water depth should remain between 40–50%.
The comparison between the experimental and analytical results is based on a very conservative design, such as RA = 0.4%, RO = 0%, and RZ = 50%, and the applied wave conditions are also moderate, but, according to the results when the OWC is subjected to a wave with a longer period and larger wave height, the performance of the converting efficiency is much better. As was shown in the cases where the RA = 0.4%, RO = 43.75%, and RZ = 50%, the performance of the converting efficiency can be increased by as much as 53%.
Again, it is verified from the experimental results that the installation of an additional OWC wave converter on the existing offshore wind turbine template structure is workable. However, uncertainty is always a risk for an experimental study. This could result from the workmanship, the maintenance of the facility, and the scaled-down effect for the model, even though tremendous time, money, and labor have been put in.


