Article

GC–MS-Based Metabolites Profiling, In Vitro Antioxidant, Anticancer, and Antimicrobial Properties of Different Solvent Extracts from the Botanical Parts of Micromeria fruticosa (Lamiaceae)

1
Department of Chemistry, An-Najah National University, P.O. Box. 7, Nablus 415, Palestine
2
School of Science and the Environment, Grenfell Campus, Memorial University of Newfoundland, Corner Brook, NL A2H 5G4, Canada
3
The Functional Foods Sensory Laboratory, Grenfell Campus, Memorial University of Newfoundland, Corner Brook, NL A2H 5G4, Canada
4
Department of Biology and Biotechnology, An-Najah National University, P.O. Box. 7, Nablus 415, Palestine
5
Faculty of Pharmacy, Arab American University, Jenin P.O. Box 249, Zababdeh 13, Palestine
*
Authors to whom correspondence should be addressed.
These authors contributed equally to this work.
Submission received: 4 April 2022 / Revised: 6 May 2022 / Accepted: 16 May 2022 / Published: 19 May 2022

Abstract

:
The present study assessed the metabolites and bioactivities of Micromeria fruticosa plant parts extracted with various solvents (ethanol, n-hexane, and water) through the steeping extraction method. Thereafter, the extracts were analyzed using GC-MS. Moreover, the extracts were tested for their antioxidant, antimicrobial, and antitumor activities. The quali-quantitative analysis of Micromeria fruticosa crude extracts revealed the occurrence of 27 secondary metabolites. Some major bioactives identified were menthone, oleamide, pulegone, and menthol. Numerous antioxidant minerals, viz., Fe, Zn, and Mn, were present. The water extract of leaves exhibited the highest DPPH scavenging activity (89.73%), followed by the water extract of flowers (80.07%) at 100 μg/mL. The stems’ water extract demonstrated greater antimicrobial activity against all the bacteria species tested. The ethanolic leaf and aqueous stem extracts exhibited strong activity against C. albicans and E. coli. Flowers’ aqueous extract demonstrated the highest cytostatic effect on the colon cell line by reducing viability, followed by the leaves’ ethanol extract. The extraction solvents influenced the recovery of phytocompounds, and the highest pharmacological activities of the different extracts could be correlated to the presence of additional bioactives. Our results suggest that the Micromeria fruticosa plant is a favorable source of natural products with promising properties for potential nutraceutical and functional food applications.

1. Introduction

Herbs and plant products have been used in folk medicine to treat a wide range of ailments and diseases for a long time. Folk therapies can be found in various forms including poultices, ointments, powders, baths, decoctions, infusions, and teas [1]. There is an increasing interest in studying the biological properties of traditional medicinal plants or isolating their bioactive components for the treatment of a wide range of illnesses all over the world. Just recently, comprehensive screening programs for these plants have been established [2]. Currently, a large number of various medicinal plant products are available on the market including in the form of cosmetics and pharmaceuticals, which contain biologically active substances [1]. Recently, some plant-originated products have shown biological activity without side effects. Such results have drawn the attention of many scientists and encouraged them to screen vast numbers of plants to test their biological properties [3].
Previously, it was challenging, time consuming, and took invaluable effort to build a library of natural products without applying improved technologies for the separation, isolation, and identification of such natural products [4].
Herbal parts of the Micromeria plant are fragrant with a lemon–mint flavor and are used mainly for making tea which provides the sensation of coolness in hot summers and are also used in seasonings of soups and foods. Micromeria is also known as white micromeria or thyme-leaved savory, and the plants’ aerial parts (leaves, flowerstalk, and roots) are used in traditional medicine [5]. Micromeria fruticosa is a perennial plant habitant in rocky areas that has a height of 20–80 cm. Extracts of Micromeria fruticosa have also been used for the alleviation of respiratory system diseases, fever, chest infections, asthma, skin infections, eye inflammation, wounds, gastrointestinal ailments, heart disorders, urinary diseases, headaches, exhaustion, inflammation, and diabetes. Micromeria also possesses insecticide, anticonvulsant, hepatoprotective, analgesic, and sedating effects [6,7].
Leaf infusions are used as tea for colds and to relieve stomach pain as well as for weariness and exhaustion. In addition, infusions of stalks and leaves in folk medicine are used in the treatment of headaches, diabetes, coughs, and urinary diseases. The extracts of leaves have also been used for respiratory system infections and inflammation [8].
Unlike conventional sole drugs, plant extracts have a variety of metabolites and bioactives that may have synergistic effects which allow for multitarget effects in the therapeutic mechanism of diseases [9]. Herbal medicine and their traditional use are thought to be one of the major approaches in developing new drugs based on natural products. Secondary metabolites include alkaloids, phenols, saponins, tannins, and terpenoids, among others [10]. Those components are of paramount importance in healing diseases and may have a principal role in the therapeutic effect of plants. Previous works focused on studying essential oils in the Micromeria species [6]. No previous works have reported a comparison of extraction solvents and Micromeria plant parts to uncover the active extracts and composition of this important medicinal and functional plant. Therefore, in this work, we investigated the phytochemical composition and the biological activities of different parts of Micromeria fruticosa plants (leaves, roots, stems, and flowers) extracted by using different solvents, viz. ethanol, water, and hexane, to identify the best extraction system and the plant part most enriched with functional ingredients in an attempt to explain the role of Micromeria in the traditional use of Micromeria fruticosa as food and medicine.

2. Materials and Methods

2.1. Plant Sample

The leaves, stems, flowers, and roots of Micromeria plants were collected in April 2017 from Tulkarm district (West Bank) in Palestine. The plant sample was botanically identified and deposited at An-Najah National University (NNU) with the voucher specimen code: (Pharm-PCT-1575). The plant parts were shade-dried at room temperature. A portion of each plant part was soaked for 5 days in n-hexane, ethanol, and water; afterwards, the supernatants were collected and filtered using suction filtration.

2.2. Extraction of Crude Extracts

The leaves, stems, flowers, and roots of Micromeria plants were extracted by soaking them sequentially and separately in hexane, ethanol, water for 5 days for each solvent and plant part sample. About 100 g of the samples (leaves, stems, flowers, and roots) was put in a one-liter rounded-bottom flask, about 300 mL of hexane, ethanol, water, separately and in a raw form, were added, and each time, the flask was placed in the dark at room temperature. This process was repeated three times for each solvent and each plant part. The resulting supernatants of each solvent were collected into separate clean and well-closed glass bottles and stored in a freezer at −20 °C until use.

2.3. DPPH Radical Scavenging Activity

The electron donation or hydrogen atom capabilities of the corresponding extracts were measured from the bleaching of the purple-colored methanolic solution of DPPH (1, 1- Diphenyl -2-picryl-hydrazyl). The stable radical DPPH was used as a reagent in this assay.
The DPPH radical scavenging activity of the plant extracts was established using the method described by Amessis-Ouchemoukh et al. (2014) [11] with some modifications. A stock solution of 1mg/mL concentration in methanol was initially prepared for the plant extracts. Stock solutions were used to prepare working solutions with the following concentrations: 2, 5, 10, 30, 50, 80, 100 μg/mL by using serial dilution in methanol. The DPPH solution was freshly prepared at a concentration of 0.002% w/v. Then, it was mixed with methanol along with each of the working concentrations (1:1:1). Methanol was used as a blank to zero the spectrophotometer. The solutions were kept in the dark at room temperature for 30 min. After that, their absorbances were measured by using the spectrophotometer at a wavelength of 517 nm.
The percentages of antioxidant activity of the plant extracts were calculated according to the following formula:
DPPH inhibition activity (I %) = (Ablank − Asample)/Ablank × 100%

2.4. Antibacterial and Antifungal Activity Tests

2.4.1. Preparation of Extracts

The organic plant extracts (ethanol and hexane) were dissolved in sterile 10% Dimethyl sulfoxide (DMSO) to obtain a concentration of 100 mg/mL, while aqueous extracts were mixed with sterile distilled water to obtain a concentration of 100 mg/mL. Finally, the dissolved extracts were stored at 4 °C for further assays.

2.4.2. Test Microorganisms

The microorganisms (MOs) utilized in this work represent several pathogenic species that are commonly associated with infections. The MOs were stored in the Microbiology research laboratory, An-Najah National University, Nablus-Palestine. These MOs consisted of two Gram-positive strains of Staphylococcus aureus (ATCC 25923), a clinical isolate of methicillin-resistant staphylococcus aureus, two Gram-negative strains, Shigella sonnie (ATCC 25931)a and multidrug clinical Escherichia coli isolate, and one yeast strain of Candida albicans (ATCC 90028). All the bacterial strains used in this study were subcultured on Mueller–Hinton agar, while C. albicans was subcultured on Sabouraud Dextrose Agar.

2.4.3. Determination of the Minimum Inhibitory Concentration (MIC) against Bacteria

The MIC of the organic extracts (ethanol and hexane) and the aqueous plant extracts was determined by using the broth microdilution method in sterile, 96-well microtiter plates according to the standard method previously described elsewhere [12]. The organic and aqueous extracts were dissolved in sterile 10% DMSO and sterile distilled water, respectively, to a final concentration of 100 mg/mL. Both organic and water extracts and 10% DMSO (negative control) were two-fold-serially diluted in nutrient broth at a final volume of 100 μL. After that, 105 CFU/mL of the bacterial inoculum was added to each well. Other negative control wells that contained either 100 μL of nutrient broth alone or organic or aqueous extracts and nutrient broths (without bacteria) were included in these experiments. The microtiter plates were then covered and incubated at 37 °C for 24 h. The MIC was considered as the lowest concentration of the plant extract that inhibited the bacterial growth. In these experiments, each plant extract was run in duplicate.

2.4.4. Determination of MIC against Yeast

The MIC of organic plant extracts (ethanol and hexane extracts) and aqueous extracts was determined using the broth microdilution method in sterile, 96-well microtiter plates according to standard method described elsewhere [13]. The organic and aqueous extracts were dissolved in sterile 10% DMSO and sterile distilled water, respectively, to a final concentration of 100 mg/mL. Both extracts organic and water and 10% DMSO (negative control) were two-fold-serially diluted in Mueller–Hinton broth in the wells of the plates in a final volume of 100 μL. After that, 0.5 × 10⁵ to 2.5 × 10⁵ CFU/mL of C. albicans inoculum was added to each well. Other negative control wells that contained either 100 μL of Mueller–Hinton broth alone or organic or aqueous extracts and Mueller–Hinton broth (without bacteria) were included in these experiments. Each plant extract was run in duplicate. The microtiter plates were then covered and incubated at 37 °C for 48 h. The MIC was considered as the lowest concentration of the plant extract that inhibited the yeast growth.

2.5. Antitumor Activity Test

2.5.1. Plant Extracts’ Preparation

For the working concentrations, 10 mg of the plant extract was dissolved in up to 1 mL of fresh prepared medium for the aqueous extract to have a stock solution with a final concentration of 10 mg/mL in 2 mL Eppendorf tubes. Then, the stock plant extracts were filtrated through a 0.25 µm membrane filter. Serial dilutions of the aqueous stock solutions (10 mg/mL) were prepared in fresh culture medium (5, 2.5, and 1.25 mg/mL). From those prepared working plant extracts solutions, different concentrations obtained final treatment concentrations under study equal to 1000, 500, 250, and 125 µg/mL. All those preparations were carried out under aseptic conditions in a sterilizer biosafety cabinet.

2.5.2. Cell Line and Culture Medium

The colon (human colon cancer) cell lines used in this study were obtained from ATCC (American Type Culture Collection). Then, cells were cultured in liquid Roswell Park Memorial Institute (RPMI 1640) medium in a T25 cell culture flask. This medium was freshly augmented with 10% heat-inactivated fetal bovine serum (FBS), 1% v/v of penicillin–streptomycin (antibacterial effect), 1% v/v of amphotericin (antifungal effect), and 1% v/v of L-glutamine (amino acid as an energy source). Cells were incubated in a CO2 incubator at 37 °C, 95% humidity, and 5% CO2 in the dark. The cultured cells were monitored routinely under an inverted microscope to check the attachment to the media substratum inside the culture flask, ensuring their confluence and checking whether any contamination occurred. Every three days, fresh culture medium was replaced until cell confluence reached 90%.

2.5.3. Inverted Microscopy Visualization Screening

For testing, the old medium was removed, and the cells were washed up with 5 mL of phosphate-buffered saline (PBS). Then, cells were detached from the T25 flask via Trypsinization using 1 mL of Trypsin-EDTA. After that, cells were incubated for 10 to 15 min in a CO2 incubator to increase the efficiency of detachment. Then, cells were washed again with 5 mL of phosphate-buffered saline (PBS). After that period, the cells were harvested and centrifuged at 3000 rpm for 3 min. Later, the obtained cell pellet was dissolved in 1 mL of fresh medium, which was counted with Trypan blue exclusion in a hematocytometer to calculate the density of viable cells (living cells). Cells were then plated in 12-well plates at a concentration of 20,000 cells per well in a total volume of 1000 µL. They were treated with 100 µL of each of the different plant species aqueous extract concentrations under study separately (2.5, 5, and 10 mg/mL) to obtain final treatment concentrations equal to 250, 500, and 1000 µg/mL, respectively. Cells cultured in RPMI medium alone were employed as normal controls. Each treatment was carried out in duplicate. All plates were placed in the incubator at 5% CO2 and 37 °C for 24 h. Cell viability, confluence, and attachment were detected under the inverted microscope. Microscopic photographs were taken at the center of the wells at 10×.

2.5.4. MTT Assay

MTT is a viability and colorimetric assay which uses the conversion or reduction of yellow tetrazolium salt (3-(4,5-dimethylthiazol-2-yl)-2,5-diphenyltetrazolium bromide) via NAD(P)H-dependent oxido-reductase enzymes in viable cells that reduces the MTT reagent to a deep-purple-colored, insoluble crystalline formazan. Formazan crystals are then dissolved using a solubilizing solution (MTT solution), and absorbance is measured at 500–600 nanometers using the plate-reader (ELISA). The higher the absorbance recorded, the higher the formazan concentration, which implies higher cell viability and metabolic activity.

2.5.5. MTT Procedure

Cells were isolated and counted as previously mentioned; afterwards, cells were inoculated in 96-well microtiter plates at a density of 20,000 cells/100 µL total volume/well (cytotoxic test). Meanwhile, in the cytostatic test, the density was 5000 cells/100 µL total volume/well. Cells were treated with 10 µL of the different concentrations of water extracts under study equal to 1.25–10 mg/mL to obtain a final concentration in each well equal to 125–1000 µg/mL, respectively. Cells cultured in RPMI medium alone were used as normal controls. Each type of treatment in each well was carried out in duplicate. Later, cultured plates were incubated in a CO2 incubator at 5% CO2 and 37 °C for 24 h and 72 h for the cytotoxic test and cytostatic test, respectively. After the incubation (24 or 72 h), the medium was removed from each well with successive washing with PBS. Then, the cultured cells were re-cultured in 100 µL of serum-free RPMI medium, to which, 10 µL of MTT solution (0.5 mg/mL) was added the wells and incubated, thereafter, for 4 h in the CO2 incubator. Then, the medium was removed and washed, and the cells were incubated for 15 min with 100 µL of acidic isopropanol (0.08N HCL) to dissolve the formazan crystals. An ELISA reader was used to test the absorbance of MTT formazan at 570 nm. Cell viability was calculated as % of absorbance of treated cells to absorbance of control (untreated cells).

2.5.6. The GC–MS Analysis

The chemical composition of the extracts of Micromeria fruticosa was identified by using a Gas Chromatograph coupled with a mass spectrometer (Perkin Elmer Clarus 500 & 560D, Beaconsfield, UK). The GC-MS system was equipped with an Elite-5 MS fused silica column (0.25µm thickness, 30m length) and interfaced with a detector of the variant ion trap. The method used was described by Šamec and Zeljkovic (2020) [14] with some modifications. The temperature transfer line was set at 290 °C and 280 °C, respectively. The temperature of the injector was 260 °C with an initial temperature of 60 °C, initial hold of 5 min, and ramp of 5.0 °C/min to 280 °C. The transfer line and injector temperatures were set at 290 and 280 °C, respectively. The carrier gas flow rate (helium) was kept at 1mL/min with a linear velocity of 31.0 cm/s. The split ratio was 1/60, electron ionization energy was 70 eV, scan time was 1s, and the mass range was from 50 to 400 m/z. Aliquots of 20 µL diluted samples (10 mg/mL) of the organic extracts (ethanol and hexane) of the plant parts were injected in the GC-MS system. The mass spectrometry data center of the national institute of standards and technology (NIST) was used as a reference to identify the chemical components of the extracts by comparing their MS spectra with data of NIST. The quantitative data were obtained from integrated peaks and based on area percentages without the use of a correction factor.

2.6. ICP-MS Analysis

ICP-MS was used for quali-quantitative measurements of a total of 19 elements in the Micromeria fruticosa water extracts. Samples were decomposed to neutral elements in high-temperature argon plasma and analyzed based on their m/z masses to charge ratios using a mass spectrometer system. Elements could be analyzed at the parts-per-million (PPM) to parts-per-trillion (PPT) concentration levels. ICP-MS is also capable of monitoring isotopic specifications for the ions of choice.

3. Results and Discussion

According to the World Health Organization (WHO), traditional and herbal medicines are considered as a chief source of primary health care for residents in developing countries. Moreover, they form a major resource of medicinal preparations discovered primarily from traditionally prepared herbal extracts containing a high quality and quantity of active components.

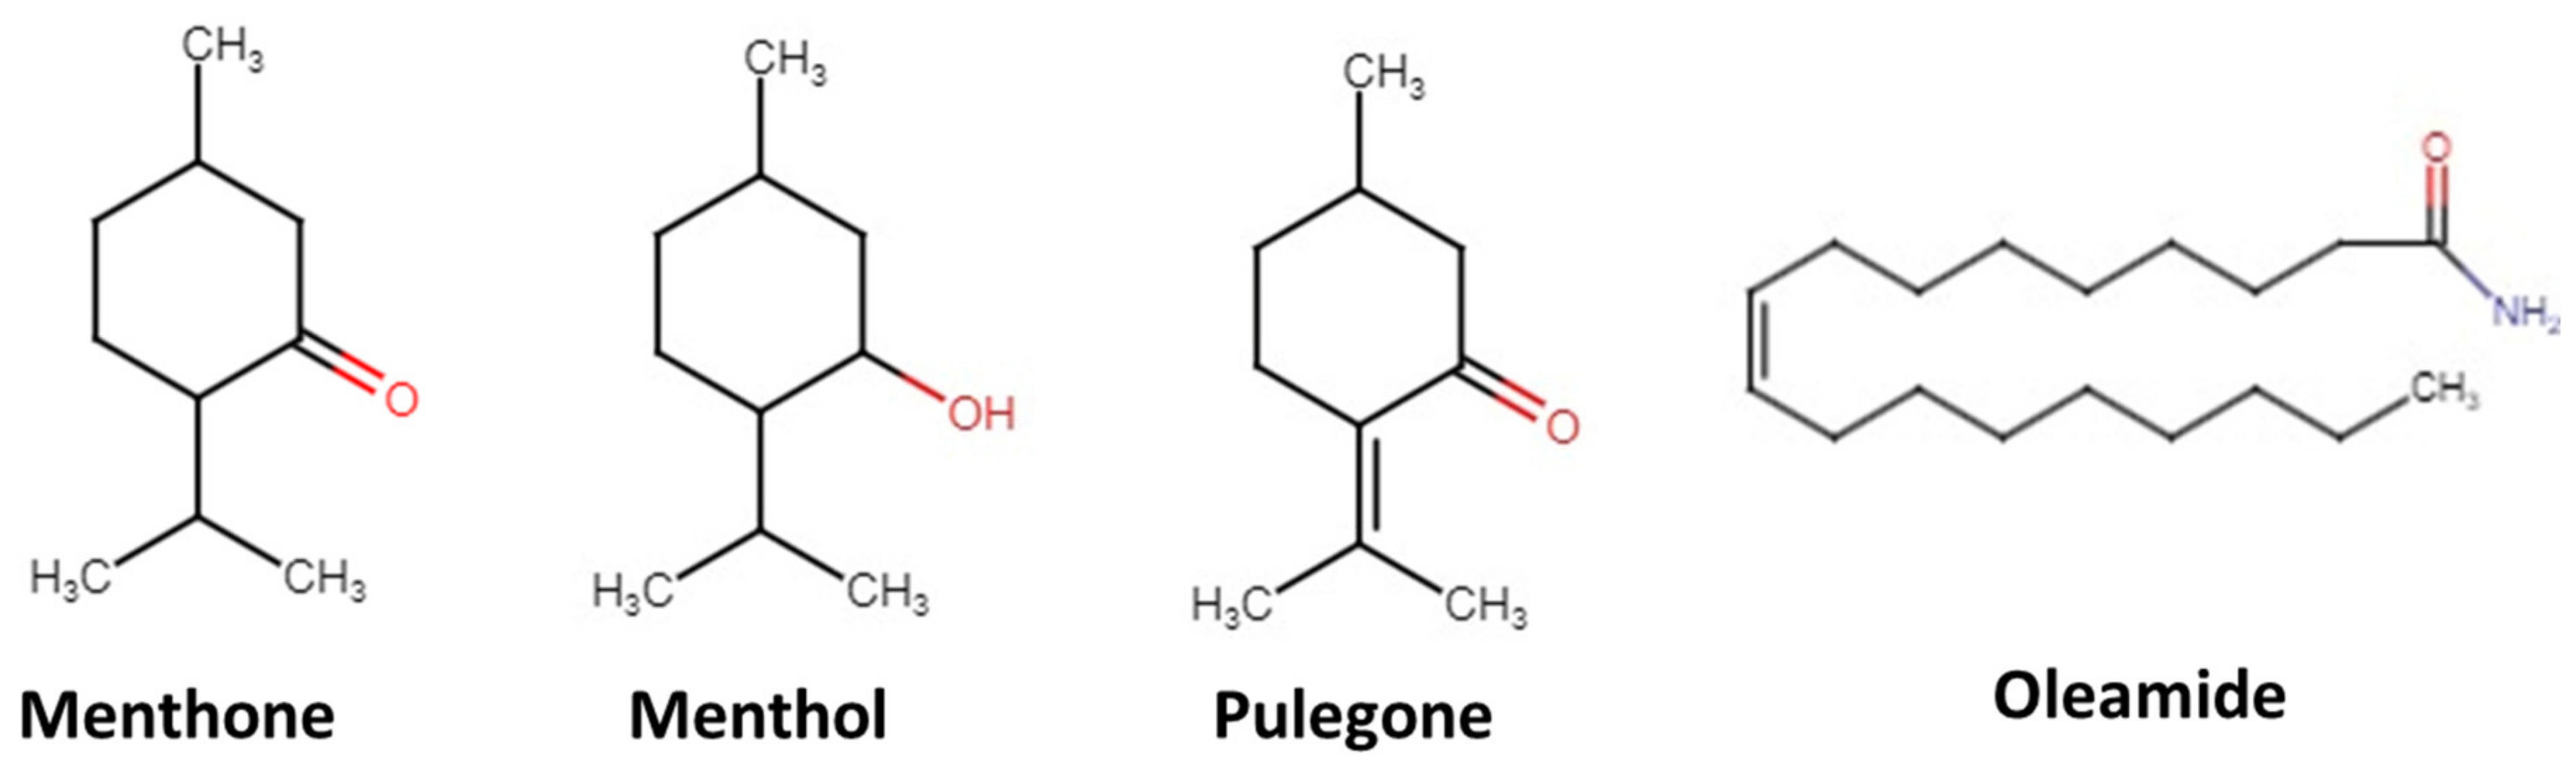
3.1. GC-MS Analysis of the Phytochemical Compenents

The GC–MS system was utilized to characterize the qualitative and quantitative nature of the ethanol, hexane, and water extracts of Micromeria fruticosa leaves, stems, roots, and flowers. Table S1 shows the data of the quali-quantitative analysis of the M. fruticosa extracts/parts. A total of 27 compounds were identified in different extracts/parts. These components were classified mainly into terpenes, sesquiterpenes, and fatty acids identified in all three extracts and botanical parts under study. Detailed results of the components, % area, retention time and index, molecular mass, and formula are presented in Table S1. The most abundant compounds in all samples and extracts were menthone, menthol, oleamide, and pulegone. Figure 1 shows the chemical structure of the main bioactive compounds identified in Micromeria fruticosa extracts/parts. These components were already reported to be present in Micromeria fruticosa essential oils [15] with various percentages which agree with the obtained results in our present work.
The flower/hexane extract was found to have a total of 11 components, including menthol (46.40%) and Ethyl 13-methyl-tetradecanoate (24.10%) as the major compounds. In the leaves/hexane extract, a total of 10 compounds were detected, including oleamide (32.19%), and menthol (17.82%) in the highest amounts. Meanwhile, pulegone (31.79%), menthone (30.05%), and menthol (21.22%) were found as the major phytocompounds in the flower/ethanol extract, which gave rise to nine bioactive compounds. The leaf/ethanol, stem/hexane, and stem/ethanol extracts were found to have a total of six, three, and one bioactives, respectively. These detected components were mainly classified into terpenes, sesquiterpenes, and fatty acids in all three extracts and botanical parts (Table S1). The three major compounds found abundantly in all the samples and extracts were menthone, menthol, and pulegone. Terpinolene is a monoterpene and was solely found in the hexane extract of Micromeria leaves (2.56%). This compound has antioxidant and antibacterial activities [16]. Terpinolene was described to be present in essential oils of Micromeria fruticosa but in smaller amounts [17].
The ethanolic extract of Micromeria flower was found to have bioactive compounds, namely pulegone (31.8%), menthone (30%), and menthol (21.2%). Meanwhile, the hexane extract of Micromeria flower had no pulegone, but menthone (5.4%), Ethyl 13-methyl tetradecanoate (24%), and Menthol (46.4%) were found in the highest percentages (46.4%).
The ethanolic extract of Micromeria leaves showed that pulegone (64.1%), menthone (14.6%), and cryophyllene (12%) were the major compounds. Meanwhile, the hexane extract of leaves possessed menthol (17.8%), pulegone (10.7%), and menthone (9.1%). The ethanolic extract of Micromeria stems were shown to extract the maximum amount of menthol (100%). However, the hexane extract showed 66.61% of menthol. β-caryophyllene is a sesquiterpene compound that was barely detected in the ethanolic extract of flowers of Micromeria fruticosa (4.14%). These compounds were described previously in Micromeria fruticosa [17] but not in the solvent extracts from different botanical parts.
Another sesquiterpene (β-Cubebene) was identified in the ethanolic extract of both the leaves and flowers of Micromeria fruticosa with percentages of 3.96 and 1.44%, respectively. This compound was reported to have antibacterial activity [18].
The monoterpene, menthol, was found to be in higher percentages in Micromeria fruticosa, especially in the ethanolic extract of the stem parts, which showed a 100% percentage of the total ion chromatogram. Hexane extract, on the other hand, showed a percentage of 66.61% for the stem part. Hexane and ethanol extracts of the flower parts showed 46.40 and 21.22% percentages, respectively. It is worth mentioning that this compound was reported to have several bioactivities such as antioxidant, antibacterial, antifungal, antipruritic, and anticancer properties [19]. Oleamide, a fatty amide, was detected and reported here for the first time in Micromeria species with the following percentage areas: 32.19% (leaf/hexane extract), 29% (stem/hexane extract), 9.20% (flower/ethanol extract), and 3.39% (flower/hexane extract). Oleamide was reported to have various bioactivities including anti-inflammatory, antibacterial, and antioxidant properties [20].
A stilbene compound, (2,3-diphenylcyclopropyl)methyl phenyl sulfoxide, was detected in the ethanolic extract of Micromeria flowers in a tiny percentage (0.74%). Interestingly, this compound was described to have anticandidal and antioxidant activities [21].

3.2. ICP-MS Analysis

The analysis of elements using ICP-MS in the different extracts and parts of Micromeria fruticosa is illustrated in Table 1. They were present at higher concentrations in leaves’ aqueous extract in comparison to other Micromeria plant parts. These elements were Fe, Zn, Mn, and Sr (346, 85.8, 81.7, and 67.7 ppb), respectively. Fe, Zn, Cu, and Mn are considered as important antioxidant minerals. Zn may act as an antioxidant, either on its own or by contributing to antioxidant proteins such as metalliothionin and superoxide dismutase. On the other hand, Fe and Mn, which have two valency states in nature, can participate in redox reactions which may have antioxidant effects [22].
Thus, the aqueous extract of Micromeria fruticosa leaves was found to have the highest concentrations of Fe (346.75 ppb), Mn (81.70 ppb), Ni (10.80 ppb), and Zn (85.88 ppb). The aqueous extract of flowers was found to have high amounts of the antioxidant mineral Cu. Nevertheless, Al (65.20 ppb) was found in the highest concentration in the root aqueous extract of Micromeria fruticosa. Iron was reported to be the major element with the highest amounts in other Micromeria species (Micromeria pseudocroatica) [23]. The results obtained in this work seem to be less significant than those of other plants from the same botanical family (Lamiaceae) such as oregano, thyme, and rosemary [24], yet, this may be due to the difference in the extraction protocol used. In this work, we used the steeping method, while the extraction was carried out using dried and powdered plant material.
It is worth mentioning that here, the elemental analysis of Micromeria fruticosa extracts from different botanical parts is reported in our work for the first time.

3.3. DPPH Antioxidant Activity

The percent of inhibition values of the Micromeria fruticosa plant extracts/samples are presented in Figure 2. All the graphs show linear regression lines. In water and hexane extracts, leaves showed a high inhibition percentage at a low concentration, while root extracts exhibited a minimum percent of inhibition. Yet, the ethanol extract of roots showed the highest percentage of inhibition at a low concentration (Figure 2). At an ethanol extract concentration of100 µg/mL, our results showed the same range of inhibition (48–65%), which is in agreement with the previously cited bibliography [25].
In aqueous and hexane extracts, the leaf displayed functional inhibition at a low concentration of 2 µg/mL. Similarly, the ethanolic root extract showed a high inhibition percentage (44.56%) at the same concentration. The ethanol flower extract was found to have the highest inhibition percent in comparison to other extracts, especially at concentrations ≥50 µg/mL.

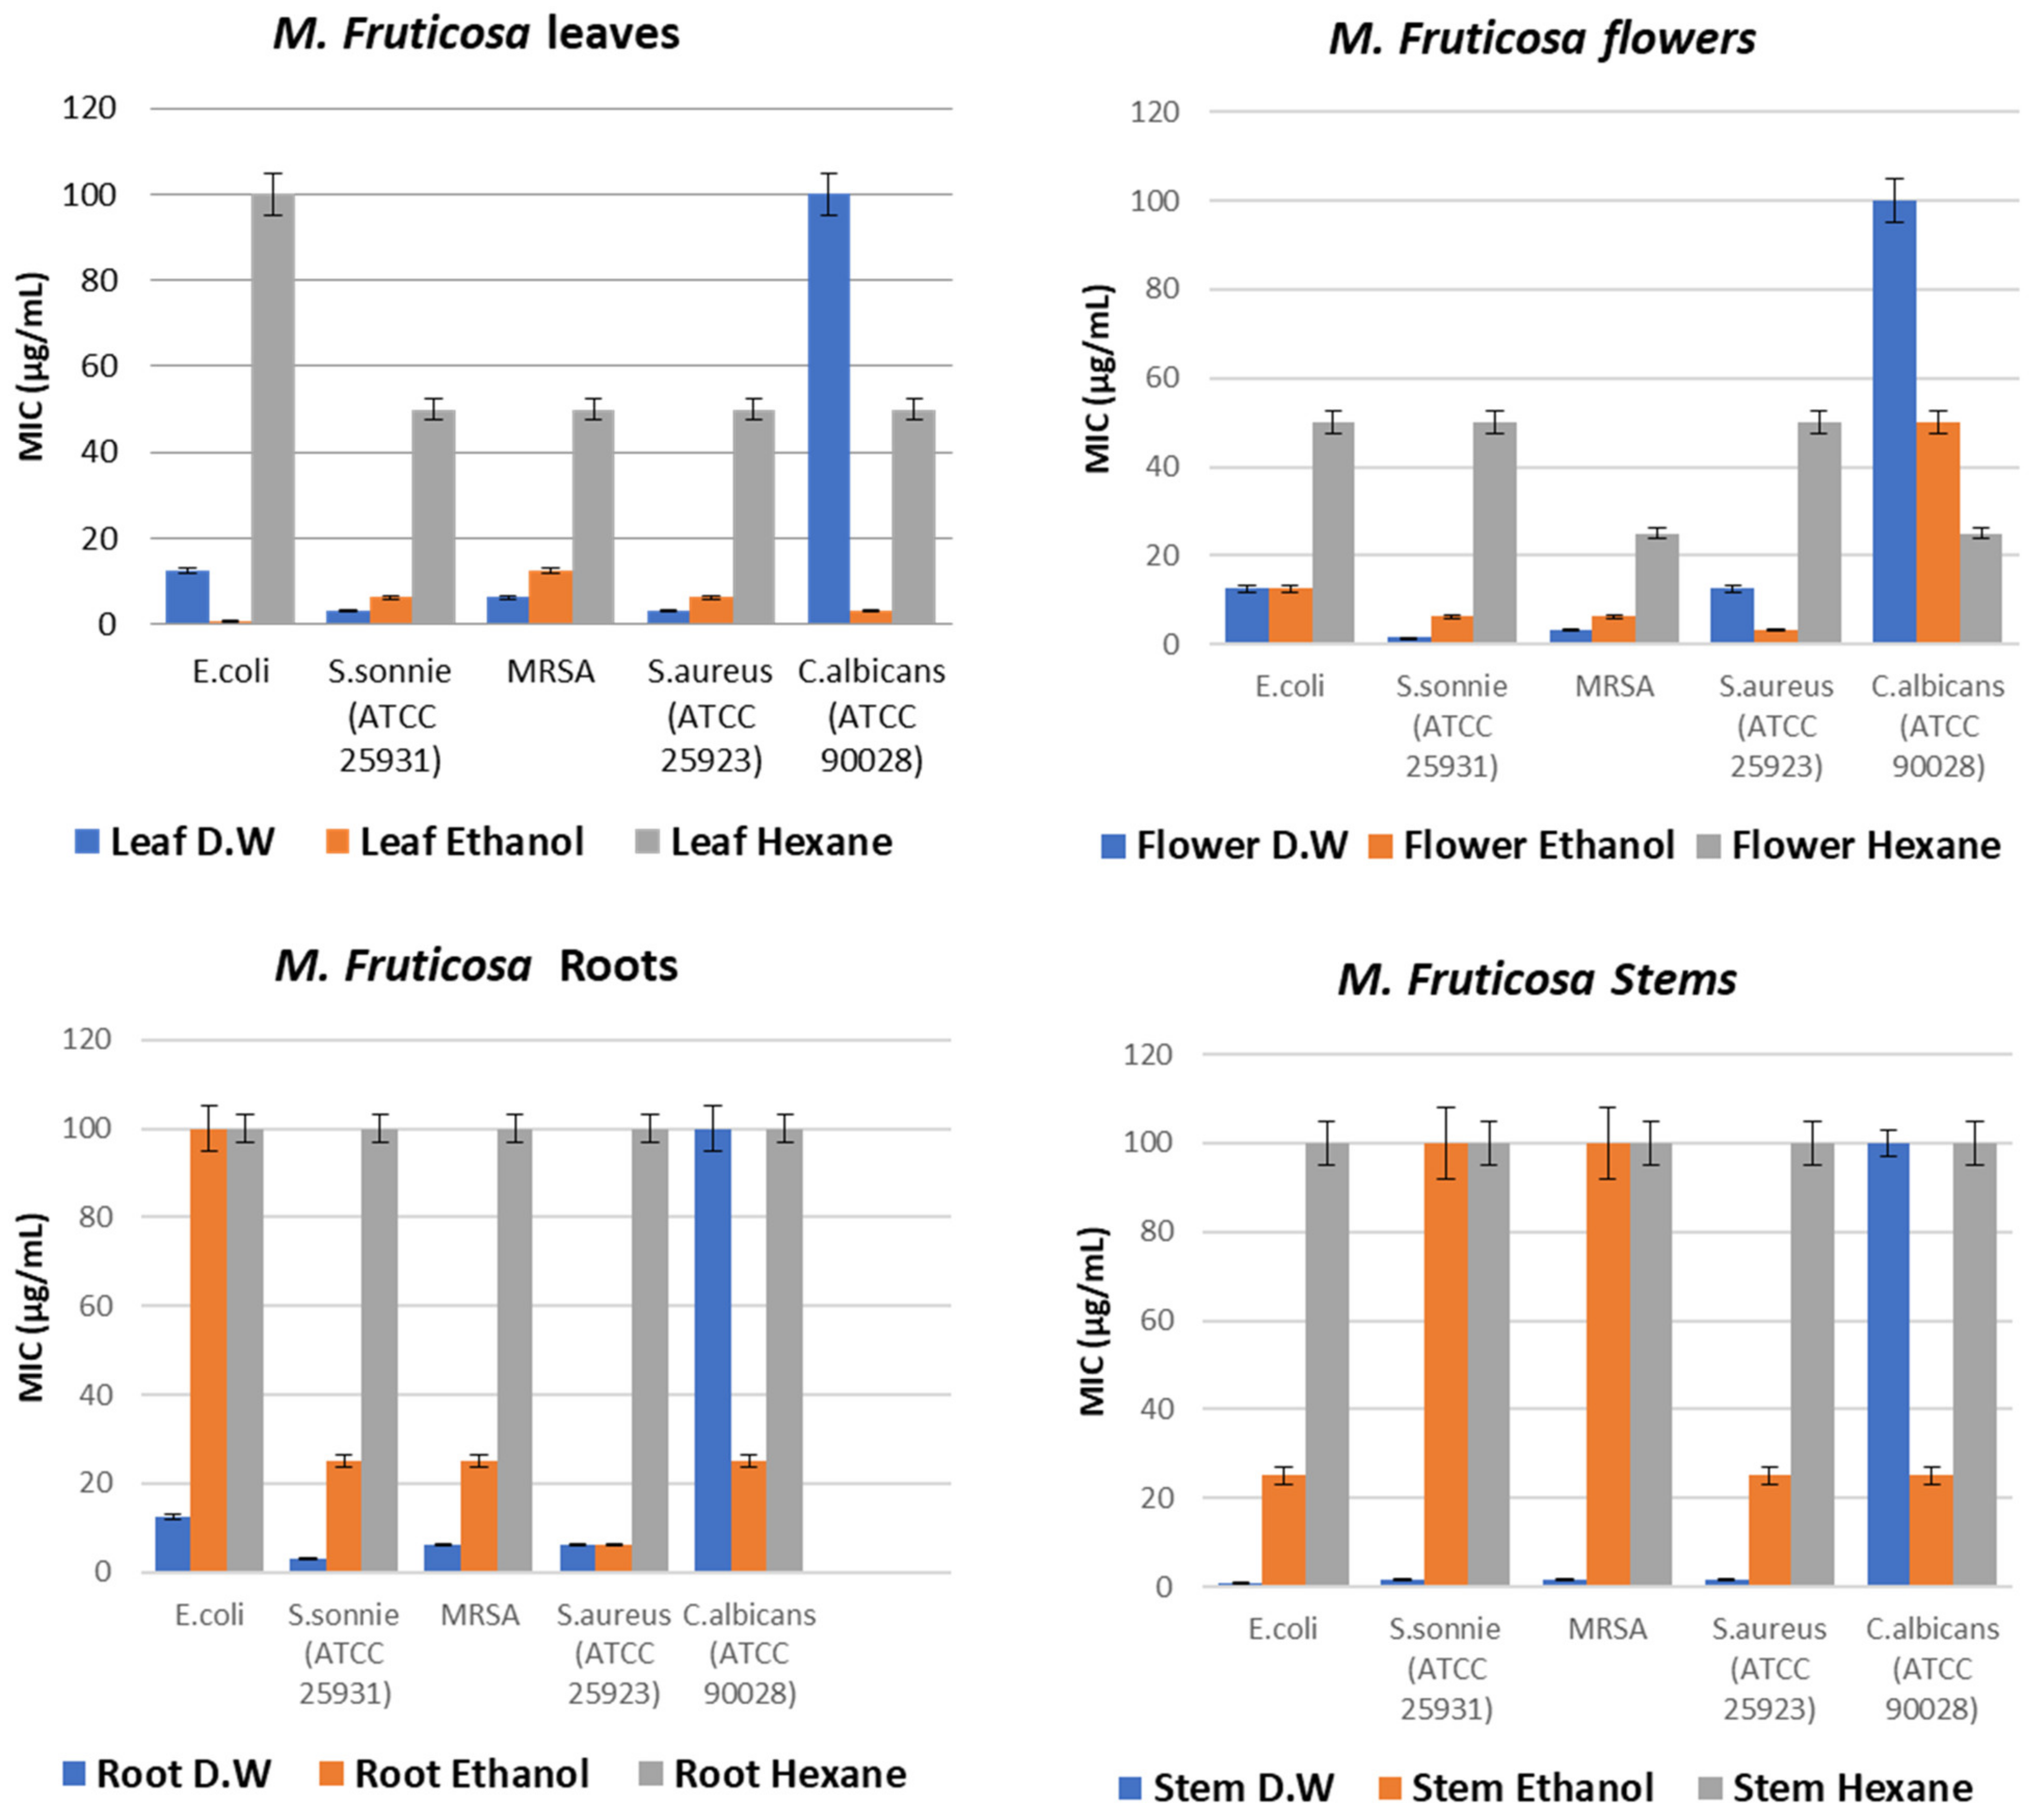
3.4. Antimicrobial Effects

The antimicrobial activities of Micromeria fruticosa extracts/plant parts determined using the broth microdilution method and against different pathogens are presented in Figure 3.
The results of the present work revealed that aqueous leaf extract had the highest antimicrobial activity against S. sonnie ATCC 25931 and S. aureus ATCC 25923 at the concentration of 3.12 µg/mL, while the ethanol leaf extract had the highest antimicrobial and antifungal activities against E. coli (0.78 µg/mL) and C. albicans ATCC 90028 (3.12 µg/mL). The water flower extract showed the highest antimicrobial activity against S. sonnie ATCC 25931 (1.56 µg/mL) and MRSA (3.12 µg/mL), while the ethanol flower extract had the highest antimicrobial activity against S. aureus ATCC 25923 (3.12 µg/mL). The hexane flower extract exhibited the most action against C. albicans ATCC 90028 compared with the aqueous and ethanol flower extracts.
The aqueous stem extract had the highest antimicrobial activity against both Gram-positive (S. aureus ATCC 25923 and MRSA) and Gram-negative (S. sonnie ATCC 25931 and E. coli) bacteria. The hexane stem extract was found to have the highest activity against C. albicans ATCC 90028 in comparison with the aqueous and the ethanol stem extracts. The aqueous root extract showed the highest antibacterial activity against both Gram-positive (S. aureus ATCC 25923 and MRSA) and Gram-negative (S. sonnie ATCC 25931) bacteria. The ethanol root extract was shown to have the highest activity against C. albicans ATCC 90028 in comparison with aqueous and hexane root extracts. The MICs of different plant parts and extracts against different pathogens are illustrated in Figure 3.

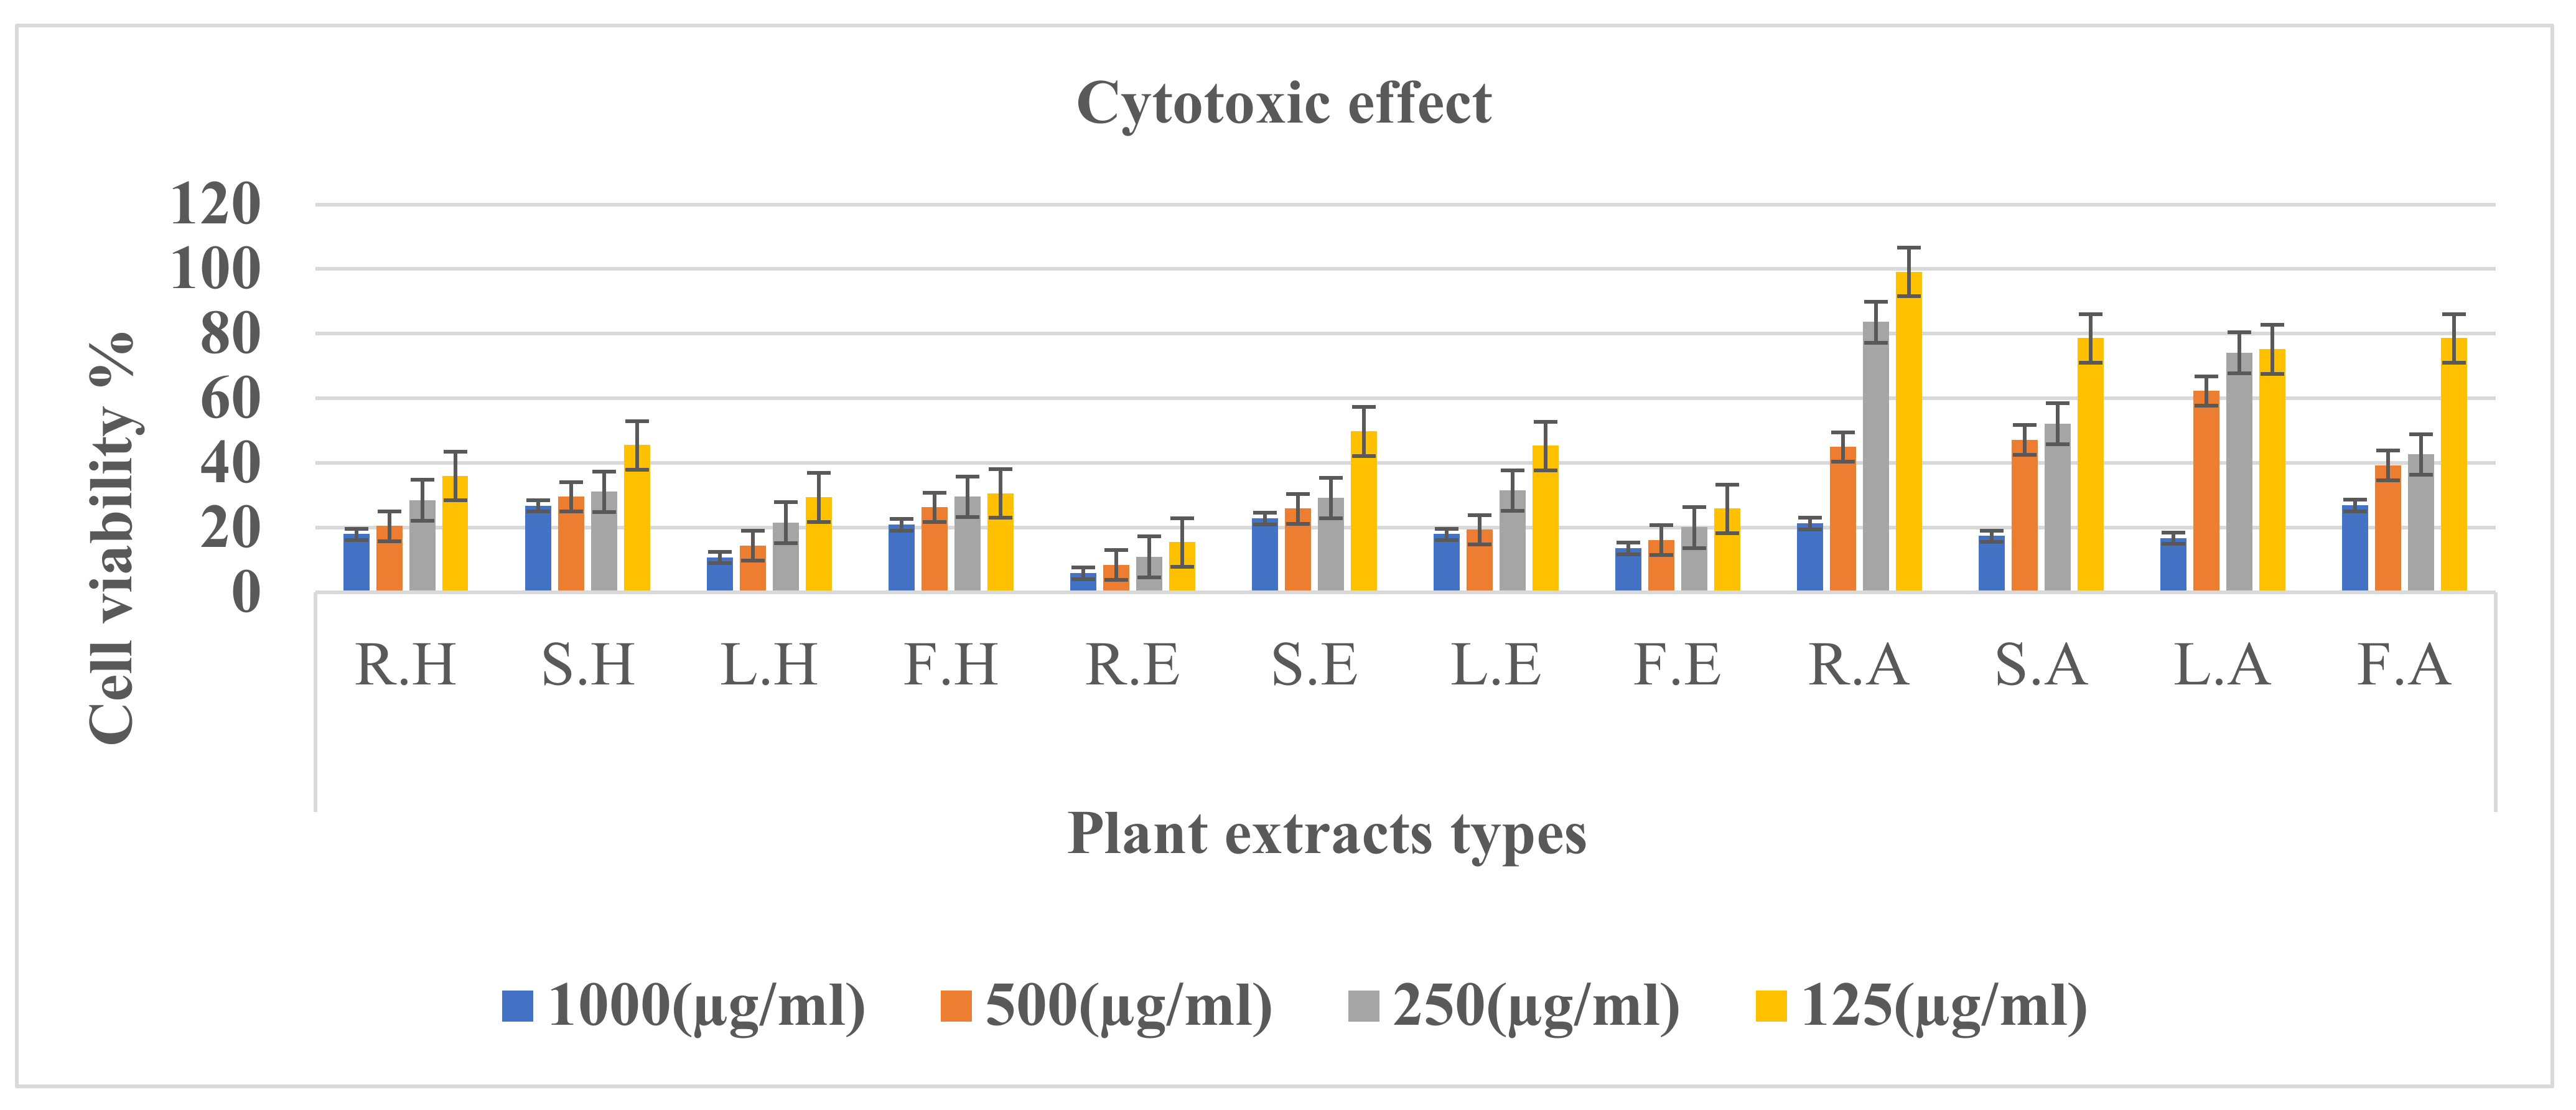
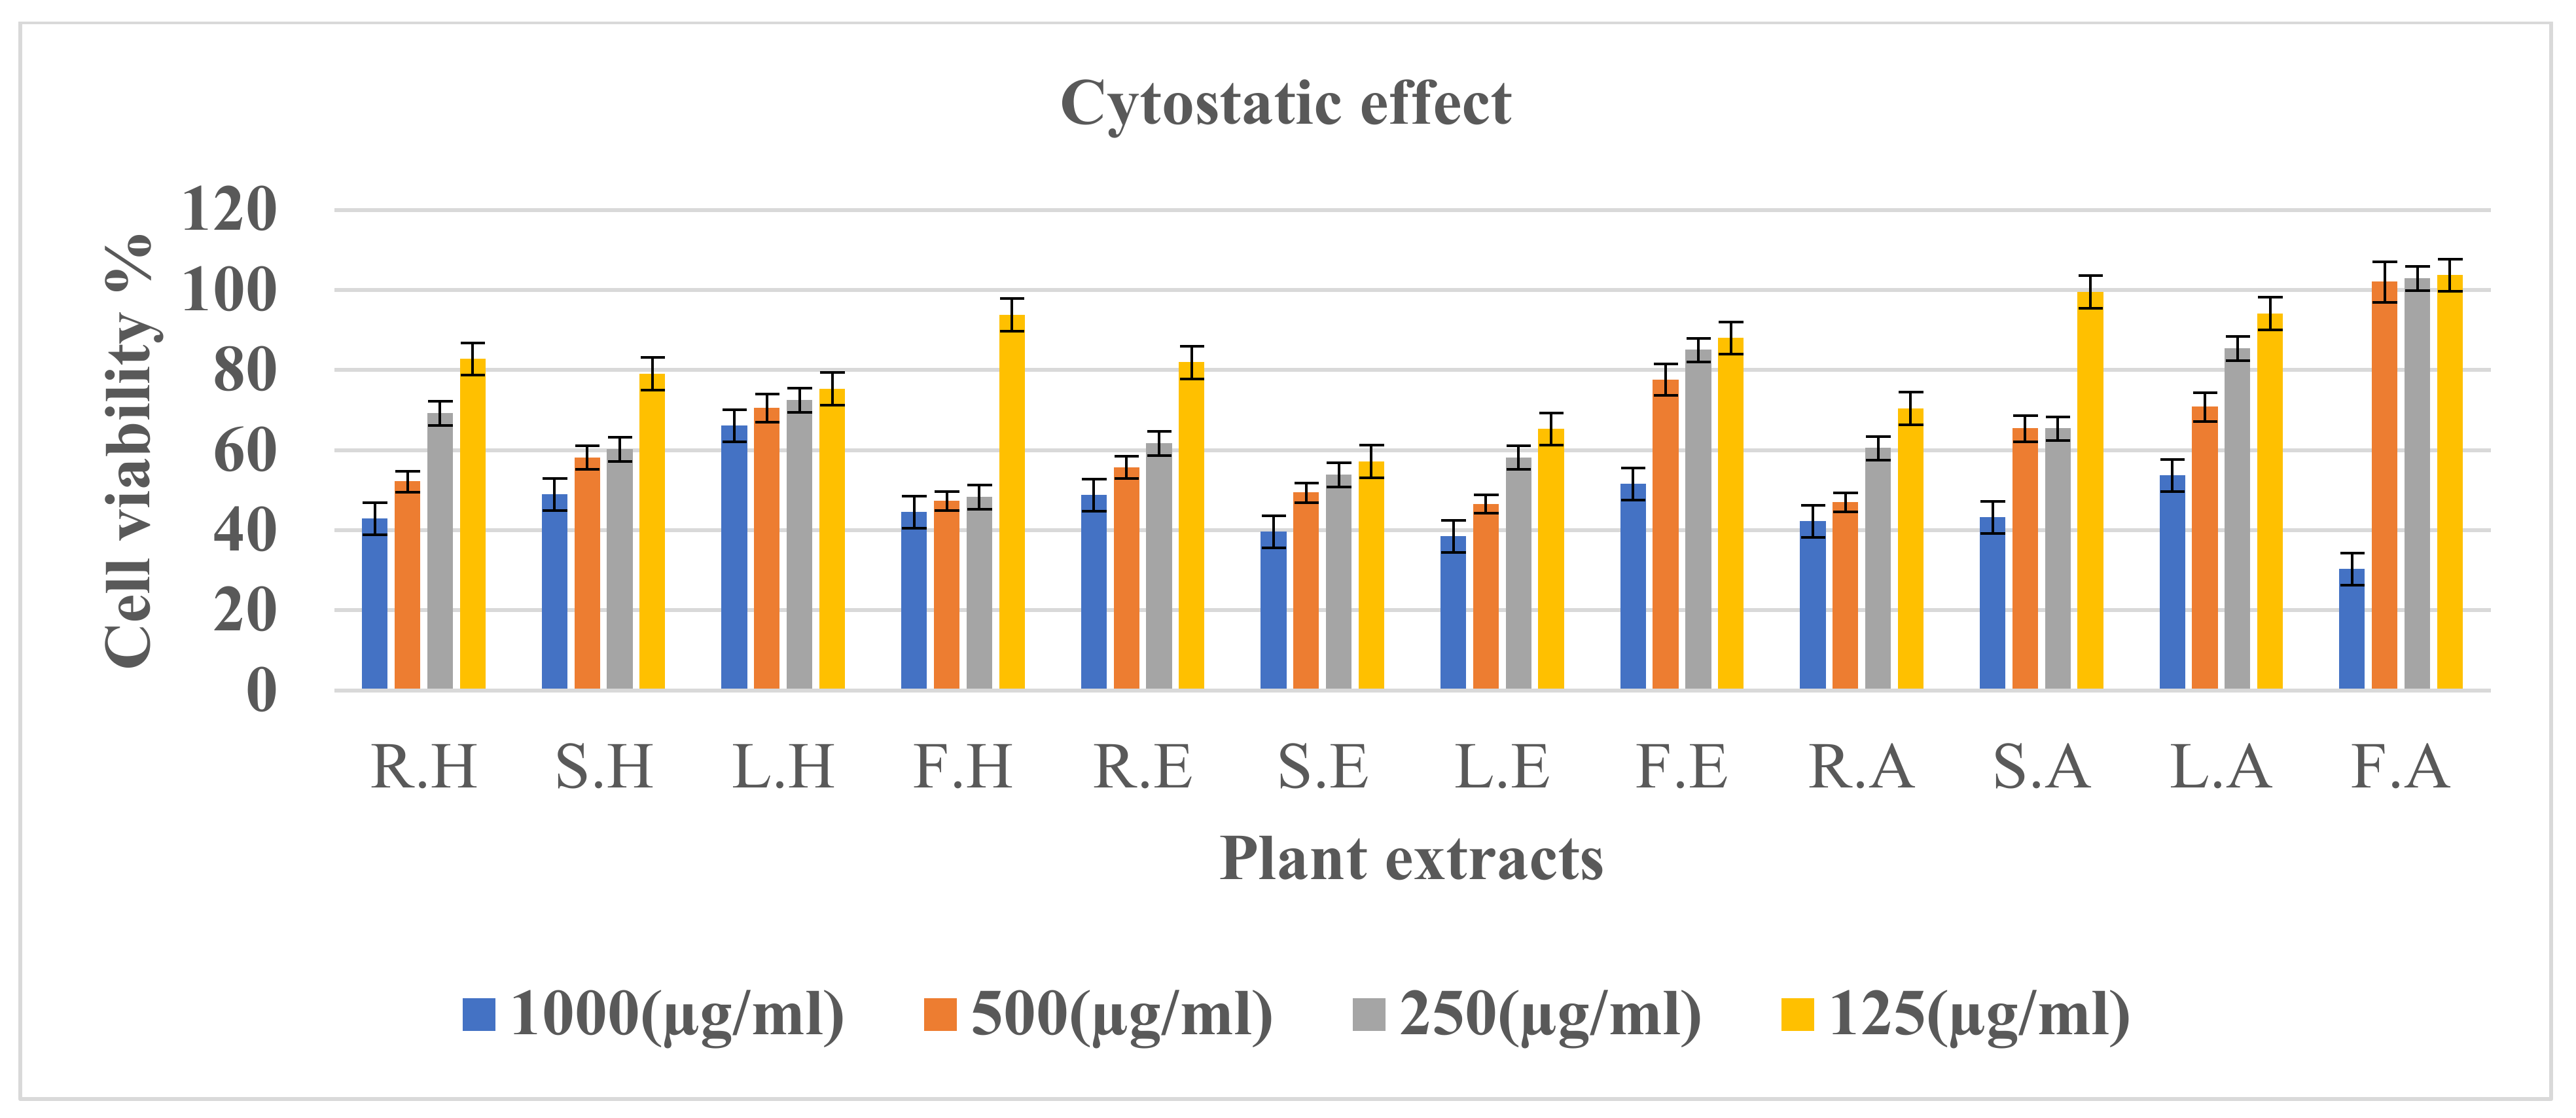
3.5. Antitumor Activity

Plant-based antitumor agents are considered as effective inhibitors of tumor cell lines [26], as they cause apoptosis and low growth in cancerous cells without having cytotoxic effects on healthy cells [27].
The anticancer bioactivity effects of Micromeria fruticosa aqueous, ethanol, and hexane extracts were tested on colon cell lines. This effect was investigated via the exposure of the colon cell lines to different extracts at their variable concentrations (1000, 500, 250, and 125 µg/mL) under study for 24 h. Inverted microscopy examination of the cells under treatment revealed a morphological alteration in which cancerous cells became detached in comparison to the normal cells, which caused a decrease in the cells attached. These observed bio-alterations could be an indication of cell growth inhibition.
Colon cell line viability % after 24 h demonstrated that the highest colon anticancer cytotoxic effect was found for the root ethanol extract of Micromeria fruticose, as it reduced the cell viability up to 5.9 and 8.5% at 1000 and 500 µg/mL, respectively. However, another cytotoxic effect was seen in the leaf hexane extract, as it reduced the cell viability up to 10.8% at 1000 µg/mL. Nevertheless, at the lowest studied concentration (125 µg/mL), all the examined plant extracts displayed a decrease in the colon cell line viability, in which the highest decrease was found for the root ethanol extract (15.5%), and the lowest was for the root aqueous extract (99.1%) (Figure 4).
The recorded data revealed that the different extracts of the studied plant parts exhibited a cytotoxic effect rather than a cytostatic effect on the colon cell line. For example, the colon cell line viability was reduced up to 5.9% and 48.8 %, respectively, with the root ethanol extract at 1000 µg/mL. This cytotoxic effect rather than cytostatic effect was recognized in all the different Micromeria fruticosa extracts under the screened concentrations. Therefore, they showed a killing effect on the cancer line under study rather than a growth-arresting effect. These observations coincide with the morphological inverted microscopy examination. In addition, all used tests agreed with each other, proving that the different plant extracts effects were in concentration-dependent manners.
However, in the cytostatic effect MTT assay for the aqueous flower extract, after 72 h at low concentrations (250 and 125 µg/mL), an increase in the cell viability % up to around 102.9 and 103.7%, respectively, was observed, which could be due to the MTT assay conflicts. Yet, the cellular mechanism of MTT reduction into formazan is not well known, but it likely to involve to a reaction with NADH or other similar reducing molecules that can transfer electrons to MTT. Then, again, the pH of the solubilizing solution can be changed to provide a maximum absorbance in case sensitivity is deemed as an issue. Additionally, the signal generated can be dependent on numerous factors, namely the length of the incubation time, the concentration of MTT, the number of viable cells, and their metabolic activity. All of these previously noted factors should be considered in the optimization process of the assay conditions in order to produce an adequate amount of product that is detectable and above the background/noise. Interestingly, we found that the transformation of MTT to formazan via cells in culture was time dependent.
Furthermore, the culturing conditions that modify the metabolism of the cells might likely influence the rate of MTT reduction into formazan. For instance, when the culture-adherent cells approach, the confluence and growth become contact-inhibited, metabolism may slow down, and the amount MTT reduction per cell will be lowered. This condition might lead to a loss of linearity between the cell number absorbance and absorbance itself. Other unfavorable culture conditions such as altered pH or the depletion of essential nutrients, e.g., glucose, may lead to a shift in the ability of cells to reduce the MTT. Otherwise, MTT assays and related assays (i.e., MTS) are dependent on a mitochondrial reductase to convert tetrazole to formazan. When it comes to the use of a colorimetric assay (i.e., MTT, SRB, XTT, etc.), they are actually not fully reflective nor indicative of “cytotoxicity” by only showing “growth inhibitory effects” because a concentration that reduces the growth of the cell population of interest by 50% with the examined compounds of interest does not necessarily mean that 50% of the cells were killed. The possibility remains that indeed, 50% of the cells were killed (cytotoxic effects), but also that 50% of the cells faced growth arrest (during the time of the test; cytostatic effects) or that 50% of the cells detached from the bottom of the flask (antiadhesive and antimetastatic effects), or a mix of these three biological processes occurred [28].
As a consequence, a colorimetric assay should be combined with simple observations with phase-contrast microscopy which can more or less easily provide more clarification about cytotoxic versus cytostatic effects. In addition, performing a Trypan blue exclusion assay can be a good idea to complete the observations attained. In addition, a more direct viability assay (LDH assay) could obtain much more exact images regarding the actual antitumor effect of the examined plant species.
On the other hand, the cytostatic effect screening of Micromeria extracts under the examined concentrations indicated that the flower water extract had the highest cytostatic effect on the cell lines by reducing the viability up to 30.4% at 1000µg/mL, followed by the leaf ethanolic extract which caused up to 38.6% reduction in the cell viability at the same concentration. In addition, it is obvious that at the lowest concentration (125µg/mL) of all examined plant extract types, the stem ethanol extract had the strongest cytostatic anticancer effect (57.2% cell viability) (Figure 5).

4. Conclusions

In this work, a GC-MS-based characterization of the chemical composition of different crude extracts from Micromeria fruticosa plants and different botanical parts (leaves, stems, roots, and flowers), along with testing of the antioxidant, antimicrobial, and antitumor activities of the different plant parts and extracts, was carried out.
A total of 27 phytochemicals were characterized and quantified in the different parts and extracts of the Micromeria fruticosa plant under study. Micromeria fruticosa extracts attained with solvents of different polarities showed variable antioxidant, antitumor, and antimicrobial activities that varied depending on the phytochemical composition of each extract. Interestingly, oleamide, pulegone, and menthol were the main the functional ingredients detected with higher percentages in almost all of the samples analyzed.
The aqueous extract of M. fruticose showed morphological alteration and detachment in comparison to the normal cells. In addition, MTT cell viability decreased in most examined aqueous plant species in a dose-dependent manner. Meanwhile, the water extract of leaves showed a maximum percent of inhibition (90%) at a concentration of 100 µg/mL. The different Micromeria fruticosa extracts under study had both cytotoxic and cytostatic effects on colon cell lines, in which cell growth was inhibited at all examined concentrations in a dose-dependent manner. One of the key steps in natural product processing is the selection of extraction solvent, as was proved from the results of the variation in biological activities among the different investigated extracts or/and botanical parts. Further in vivo studies are in need to confirm the potential biological activities and to evaluate the toxicity and safety of plant extracts. In addition, additional efforts are still required to isolate the individual components responsible for potential and specific pharmacological activities.

Supplementary Materials

The following supporting information can be downloaded at: https://0-www-mdpi-com.brum.beds.ac.uk/article/10.3390/pr10051016/s1, Table S1: Phytochemical compounds identified in the extracts and plant parts of Micromeria fruticose.

Author Contributions

I.M.A.-R. and M.A.-N.: conceptualization, obtaining research funding, and editing; I.M.A.-R., A.A.A. and M.A.-N.: software, data analysis, and writing—original draft preparation; I.M.A.-R. and M.A.-N.: conceptualization and writing—review and editing; I.M.A.-R., A.A.A., G.A., G.O., I.W. and M.A.-N.: investigation and validation; I.M.A.-R., G.O. and M.A.-N.: conceptualization and writing—review and editing. All authors have read and agreed to the published version of the manuscript.

Funding

This research was funded by TWAS-UNICEF, grant no.:17-529RG/CHE/AF/AC_G.

Institutional Review Board Statement

Not applicable.

Informed Consent Statement

Not applicable.

Conflicts of Interest

The authors declare no conflict of interest.

References

  1. Metwaly, A.; Ghoneim, M.; Eissa, I.; Elsehemy, I.; Mostafa, A.; Hegazy, M.; Afifi, W.M.; Dou, D. Traditional ancient Egyptian medicine: A review. Saudi J. Biol. Sci. 2021, 28, 5823–5832. [Google Scholar] [CrossRef] [PubMed]
  2. Howes, M.J.R.; Quave, C.L.; Collemare, J.; Tatsis, E.C.; Twilley, D.; Lulekal, E.; Farlow, A.; Li, L.; Cazar, M.E.; Leaman, D.J.; et al. Molecules from nature: Reconciling biodiversity conservation and global healthcare imperatives for sustainable use of medicinal plants and fungi. Plants People Planet. 2020, 2, 463–481. [Google Scholar] [CrossRef]
  3. Chassagne, F.; Samarakoon, T.; Porras, G.; Lyles, J.; Dettweiler, M.; Marquez, L.; Salam, A.M.; Shabih, S.; Farrokhi, D.R.; Quave, C.L. A Systematic Review of Plants With Antibacterial Activities: A Taxonomic and Phylogenetic Perspective. Front. Pharmacol. 2021, 11. [Google Scholar] [CrossRef] [PubMed]
  4. Atanasov, A.G.; Waltenberger, B.; Pferschy-Wenzig, E.M.; Linder, T.; Wawrosch, C.; Uhrin, P.; Temml, V.; Wang, L.; Schwaiger, S.; Heiss, E.H.; et al. Discovery and resupply of pharmacologically active plant-derived natural products: A review. Biotechnol. Adv. 2015, 33, 1582–1614. [Google Scholar] [CrossRef] [Green Version]
  5. Shehab, N.; Abu-Gharbieh, E. Constituents and biological activity of the essential oil and the aqueous extract of Micromeria fruticosa (L.) Druce subsp. serpyllifolia. Pak. J. Pharm. Sci. 2012, 25, 687–692. [Google Scholar]
  6. Vladimir-Knežević, S.; Cvijanović, O.; Blažeković, B.; Kindl, M.; Štefan, M.; Domitrović, R. Hepatoprotective effects of Micromeria croatica ethanolic extract against CCl4–induced liver injury in mice. BMC Complement. Altern Med. 2015, 15. [Google Scholar] [CrossRef] [Green Version]
  7. Abu-Reidah, I.; Arráez-Román, D.; Al-Nuri, M.; Warad, I.; Segura-Carretero, A. Untargeted metabolite profiling and phytochemical analysis of Micromeria fruticosa L. (Lamiaceae) leaves. Food Chem. 2019, 279, 128–143. [Google Scholar] [CrossRef]
  8. Sarikurkcu, C.; Ceylan, O.; Zeljković, S.Ć. Micromeria myrtifolia: Essential Oil Composition and Biological Activity. Nat. Prod. Commun. 2019, 14, 1934578X19851687. [Google Scholar] [CrossRef] [Green Version]
  9. Pezzani, R.; Salehi, B.; Vitalini, S.; Iriti, M.; Zuñiga, F.; Sharifi-Rad, J.; Martorell, M.; Martins, N. Synergistic Effects of Plant Derivatives and Conventional Chemotherapeutic Agents: An Update on the Cancer Perspective. Medicina 2019, 55, 110. [Google Scholar] [CrossRef] [Green Version]
  10. Agidew, M. Phytochemical analysis of some selected traditional medicinal plants in Ethiopia. Bull. Natl. Res. Cent. 2022, 46. [Google Scholar] [CrossRef]
  11. Amessis-Ouchemoukh, N.; Abu-Reidah, I.; Quirantes-Piné, R.; Madani, K.; Segura-Carretero, A. Phytochemical profiling, in vitro evaluation of total phenolic contents and antioxidant properties of Marrubium vulgare (horehound) leaves of plants growing in Algeria. Ind. Crops Prod. 2014, 61, 120–129. [Google Scholar] [CrossRef]
  12. Set the Standard for Quality in Your Laboratory With CLSI. Available online: https://clsi.org/media/1795/catalog2017_web.pdf (accessed on 30 March 2022).
  13. CLSI (Clinical Laboratory Standards Institute). Performance Standards for Antimicrobial Susceptibility Testing, 27th ed.; CLSI Supplement 100, Catalog 2017/2018; Clinical Laboratory Standards Institute: Wayne, PA, USA, 2017. [Google Scholar]
  14. Šamec, D.; Zeljkovic, S.C. Analytical methods focused on studying phytonutrients in food. In Phytonutrients in Food; Elsevier: Amsterdam, The Netherlands, 2020; pp. 237–244. [Google Scholar]
  15. Baser, K.H.C.; Kirimer, N.; Tümen, G. Pulegone-Rich Essential Oils of Turkey. J. Essent. Oil Res. 1998, 10, 1–8. [Google Scholar] [CrossRef]
  16. Singh, M.; Smith, J.; Bailey, M. Using natural antimicrobials to enhance the safety and quality of poultry. In Handbook of Natural Antimicrobials for Food Safety and Quality; Woodhead Publishing: Sawston, UK, 2015; pp. 375–401. [Google Scholar]
  17. Rigano, D.; Formisano, C.; Senatore, F.; Bellone, G.; Bruno, M.; Rosselli, S. Chemical composition of the essential oil from aerial parts of Micromeria fruticulosa (Bertol.) Grande (Lamiaceae) growing wild in Southern Italy. Planta Med. 2006, 72, P_228. [Google Scholar] [CrossRef]
  18. Karau, G.M.; Njagi, E.N.; Machocho, A.K.; Wangai, L.N.; Nthinga, M.J. Chemical composition and in vitro antioxidant activities of Ocimum americanum. Adv. Anal. Chem. Instrum. 2015, 5, 42–49. [Google Scholar]
  19. Kamatou, G.; Vermaak, I.; Viljoen, A.; Lawrence, B. Menthol: A simple monoterpene with remarkable biological properties. Phytochemistry 2013, 96, 15–25. [Google Scholar] [CrossRef]
  20. Velmurugan, G.V.; Anand, S.P. GC-MS Analysis of Bioactive Compounds on Ethanolic Leaf Extract of Phyllodium pulchellum L. Desv. Int. J. Pharmacogn. Phytochem. Res. 2017, 9, 114–118. [Google Scholar]
  21. Gothai, S.; Vijayarathna, S.; Chen, Y.; Kanwar, J.R.; Wahab, H.A.; Sasidharan, S. In vitro-scientific evaluation on anti-Candida albicans activity, antioxidant properties, and phytochemical constituents with the identification of antifungal active fraction from traditional medicinal plant Couroupita guianensis Aubl. Flower. J. Complement. Med. Res. 2018, 8, 5–101. [Google Scholar] [CrossRef]
  22. Cho, Y.E.; Byun, Y.M.; Kwak, E.H.; Yoon, J.S.; Oh, H.M.; Kim, J.W.; Shin, H.S.; Kwon, C.S. Potential Antioxidant Trace Mineral (Zn, Mn, Cu and Fe) Concentrations Measured by Biochemical Indices in South Koreans. Food Sci. Nutr. 2004, 9, 374–382. [Google Scholar] [CrossRef]
  23. Kremer, D.; Müller, I.D.; Stabentheiner, E.; Vitali, D.; Kopričanec, M.; Ruščić, M.; Kosalec, I.; Bezić, N.; Dunkić, V. Phytochemical and Micromorphological Traits of Endemic Micromeria pseudocroatica (Lamiaceae). Nat. Prod. Commun. 2012, 7, 1934578X1200701231. [Google Scholar] [CrossRef] [Green Version]
  24. García-Galdeano, J.M.; Villalón-Mir, M.; Medina-Martínez, J.; Vázquez-Foronda, L.M.; Zamora-Bustillos, J.G.; Agil, A.; Moor-Davie, S.M.F.; Navarro-Alarcón, M. Zn, Cu, and Fe Concentrations in Dehydrated Herbs (Thyme, Rosemary, Cloves, Oregano, and Basil) and the Correlation with the Microbial Counts of Listeria monocytogenes and Other Foodborne Pathogens. Foods 2020, 9, 1658. [Google Scholar] [CrossRef]
  25. Al-Yousef, H.; Fantoukh, O.; El-Sayed, M.; Amina, M.; Adel, R.; Hassan, W.; Abdelaziz, S. Metabolic profiling and biological activities of the aerial parts of Micromeria imbricata Forssk. growing in Saudi Arabia. Saudi J. Biol. Sci. 2021, 28, 5609–5616. [Google Scholar] [CrossRef]
  26. Sivaraj, R.; Rahman, P.K.S.M.; Rajiv, P.; Vanathi, P.; Venckatesh, R. Biosynthesis and characterization of Acalyphaindica mediated copper oxide nanoparticles and evaluation of its antimicrobial and anticancer activity. Spectrochim. Acta A Mol. Biomol. Spectrosc. Spectrochim. Acta A 2014, 129, 255–258. [Google Scholar] [CrossRef]
  27. Shahneh, F.Z.; Baradaran, B.; Majidi, J.; Babaloo, Z. Echinophoraplatyloba DC (Apiaceae) crude extract induces apoptosis in human prostate adenocarcinoma cells (PC-3). Biomed. J. 2014, 37, 298–304. [Google Scholar]
  28. Riss, T.L.; Moravec, R.A.; Niles, A.L.; Duellman, S.; Benink, H.A.; Worzella, T.J.; Minor, L. Cell Viability Assays. Assay Guidance Manual 2016. Available online: https://0-www-ncbi-nlm-nih-gov.brum.beds.ac.uk/books/NBK144065/?report=reader (accessed on 11 March 2022).
Figure 1. Chemical structure of the main bioactives in Micromeria fruticosa extracts.
Processes 10 01016 g001
Figure 2. Antioxidant % inhibition vs. concentration (µg/mL) of water extracts (A), hexane extracts (B), and ethanol extracts (C) of the M. fruticosa botanical parts (leaf, root, stem, and flower).
Processes 10 01016 g002
Figure 3. Minimum inhibitory concentration (MIC) (µg/mL) of botanical parts (leaves, flowers, stems, and roots) of M. fruticosa extracted with water, ethanol, and hexane against different pathogens. The bars represent means of two replicates ± standard errors.
Processes 10 01016 g003
Figure 4. Cytotoxic effect of Micromeria fruticosa extract on colon cell line viability at different concentrations after 24 h. R: root, S: stem, L: leaf, F: flower, H: hexane, E: ethanol, and A: aqueous. The bars correspond to means of two replicates ± standard errors.
Processes 10 01016 g004
Figure 5. Cytostatic effect of Micromeria fruticose extract effect on colon cell line viability at different studied concentrations after 72 h. Cell viability was calculated as % of absorbance of treated cells to absorbance of control (untreated cells). R: root, S: stem, L: leaf, F: flower, H: hexane, E: ethanol, and A: aqueous. The bars represent means of two replicates ± standard errors.
Processes 10 01016 g005
Table 1. Concentration of various elements from aqueous extract of different parts of Micromeria fruticosa plant using ICP-MS spectrometer.
ElementConcentration (µg. Kg−1 or ppb)
Leaf WE *Stem WEFlower WERoot WE
Ag0.2860.0430.1450.204
Al33.51417.99127.26465.201
Ba−121.49414.66315.64019.218
Cd0.0670.2570.0860.136
Cr7.7834.9775.8916.972
Co0.3440.1940.4411.643
Cs0.0200.0410.0620.024
Cu8.9696.88218.71611.910
Fe346.751165.348238.593228.406
Ga0.1740.1150.1230.174
Li1.3051.0060.8590.496
Mn81.70023.31143.49448.519
Mo1.2450.6070.3051.102
Ni10.7843.4929.3206.977
Pb1.0661.4941.2102.270
Rb13.94914.3840.90812.532
Sr67.70423.01838.96525.692
V0.1810.0950.0911.170
Zn85.88177.14458.11625.926
* WE stands for water extract.
Publisher’s Note: MDPI stays neutral with regard to jurisdictional claims in published maps and institutional affiliations.

