
Identification of Microbial Flora in Dry Aged Beef to Evaluate the Rancidity during Dry Aging
by
 , ,
, ,
Sejeong Kim
1 ,
,
Jong-Chan Kim
2,
Sunhyun Park
2,
Jinkwi Kim
2,3,
Yohan Yoon
1,4 and
Heeyoung Lee
2,* 1
Risk Analysis Research Center, Sookmyung Women’s University, Seoul 04310, Korea
2
Food Standard Research Center, Korea Food Research Institute, Wanju 55365, Korea
3
Department of Food Science and Technology, Chung-Ang University, Anseong 17546, Korea
4
Department of Food and Nutrition, Sookmyung Women’s University, Seoul 04310, Korea
*
Author to whom correspondence should be addressed.
Processes 2021, 9(11), 2049; https://0-doi-org.brum.beds.ac.uk/10.3390/pr9112049
Submission received: 7 October 2021
/
Revised: 13 November 2021
/
Accepted: 14 November 2021
/
Published: 16 November 2021
(This article belongs to the Special Issue Study of Microbiological Safety in the Food Chain)
Abstract
:Dry aging creates a unique taste and flavor in beef; however, the process also causes rancidity, which is harmful to humans. During dry aging, the microbial flora in beef changes continuously; thus, this change can be used as an indicator of rancidity. The objective of this study was to analyze the correlation between microbial flora in beef and rancidity during dry aging. The round of beef (2.5–3 kg) was dry aged under 1.5 ± 1 °C and 82 ± 5% moisture for 17 weeks. The microflora in the dry aged beef was analyzed by pyrosequencing. The volatile basic nitrogen (VBN) and thiobarbituric acid reactive substance (TBARS) values were also measured. Primers were designed to detect and quantify bacteria using real-time polymerase chain reaction (RT-PCR). The VBN and TBARS values in the dry aged beef depreciated from week 11 of aging. The levels of Streptococcus spp., Pantoea spp., and Pseudomonas spp. significantly changed at around week 11. Quantitative RT-PCR showed that the levels of Pantoea spp. and Streptococcus spp. could be used to identify rancidity during dry aging. Thus, among the microbial flora in dry aged beef, Pantoea spp. and Streptococcus spp. can be used to determine the rancidity of dry aged beef.
1. Introduction
Dry aging, a process that involves the long-term storage of meat at low temperatures and relative humidity, can improve meat quality, which is represented by the development of tenderness and a unique flavor. These quality factors are considerably affected by aging conditions, such as temperature, air velocity, and humidity [1]. With the increasing interest of consumers in its unique flavor, the dry aged beef market in the United States was expected to reach $11,176 million in 2020 [2]. Dry aged beef is consumed globally, including in Germany, Asia, the Middle East, Europe, and the United States, and the consumption of dry aged beef accounts for <10% of overall beef consumption [3].
In dry aging, during the long-time storage, a tremendous number of microbes are colonized on the surface of the meat (forming “crust”), and the composition of the microbial community keeps changing continuously [4]. Microbes, including bacteria, yeasts, and molds, metabolize ingredients in the meat and produce various metabolites that affect the flavor, tenderness, and rancidity of dry aged meat [5,6]. Therefore, the quality of dry aged beef is related to changes in the microbial community on the meat. For example, Pseudomonas spp., the main spoilage bacterium, metabolizes glucose, lactate, and amino acid, which results in the formation of slime and generation of off-odor, while lactic acid bacteria cause greening as a consequence of H2O2 generation [7,8]. Psychrotrophs, such as pseudomonads and lactobacilli, largely contribute to the spoilage of meat at chilling temperatures and continuously compete with each other during the storage time. Under aerobic conditions, Pseudomonas species dominate, but lactobacilli dominate under anaerobic conditions by producing an antimicrobial agent that inhibits the growth of other species [9].
Recently, the microbial community on dry aged beef was characterized using metagenomic analysis [4]. In this study, dry aging led to prominent changes in the microbial composition, especially in the abundance of lactic acid bacteria, and some yeast/mold strains were prevalent in dry aged beef for a certain duration. In addition, Lee et al. (2019) [10] revealed the effects of air velocities on changes in microbial composition and on the properties of dry aged beef. Although little is known about the correlation between the microbial community and the quality of dry aged meat, some specific strains, such as Pilaira anomala and Debaryomyces hansenii, have been proven to have a positive effect on the quality of dry aged meat [10,11]. Based on these findings, it is expected that analysis of the microbial community on dry aged beef can provide information about the quality of the beef.
As the period of dry aging is extended, the quality of the meat gradually decreases. During this period, proteins and lipids are broken down extensively, and meat flavor, tenderness, juiciness, odor, and texture are affected negatively [12]. The rancidity of dry aged beef cannot be easily evaluated based on its appearance. Thiobarbituric acid reactive substance (TBARS) and volatile basic nitrogen (VBN) values are well-known indices for distinguishing the rancidity of meat, because these parameters are quantitative indices of the oxidative deterioration of lipids and ammonia production by deamination of amino acids, respectively [13]. Although some strains, such as Pseudomonas spp., and members of Enterobacteriaceae, are known as meat spoilage bacteria [14], the specific microbial strains that can be used to evaluate the rancidity of dry aged beef are not yet known.
Metagenomics is one of the tools for genetic analysis (sequencing and identification), which can be used to study the genetic content of the entire microbial community in certain environments [15]. The analyses start with the extraction of deoxyribonucleic acid (DNA) from the microbial community, and then the genetic information is obtained by random shotgun sequencing, followed by metadata analysis [16]. Given that metagenomics can easily detect anaerobes or newly isolated microorganisms compared with culturing methods [17], metagenomics is widely used for analyzing microflora [18,19]. Therefore, in this study, we aimed to investigate changes in the microbial community during dry aging to find relationships between rancidity and microflora in dry aged beef.
2. Materials and Methods
2.1. Dry Aging of Beef
The round of beef (2.5–3 kg) was purchased from a local market (Seoul, Korea). The whole beef was dry aged in DRY AGER® (DX1000, Landig + Lava GmbH & Co., Bad Saulgau, Germany) at 1.5 ± 1 °C and 82 ± 5% moisture for 17 weeks. A microbial cluster formed outside of the beef as the aging progressed. A portion (0.25 g) of the cluster (two for each of three samples) was used to analyze the microflora [10] and the microbial level (25 g of the cluster), and the portion of meat inside (10 g) was used to measure the VBN and TBARS values.
2.2. Analysis of Microflora on Beef during Dry Aging
The microbial cluster (0.25 g) that formed outside the beef was collected at certain intervals (1–3 weeks) during dry aging. Microbial DNA was extracted from the cluster using a DNeasy PowerFood Microbial Kit (Cat. No. 21000-100; Qiagen, Hilden, Germany) according to the manufacturer’s instructions. Briefly, the cluster samples in 2 mL microcentrifuge tubes were homogenized with MBL buffer (a cell lysis buffer) using a Vortex Adapter (Cat. No. 13000-V1-24; Qiagen, Hilden, Germany) and vortexed thoroughly. After centrifuging the lysate at 13,000× g for 1 min, an IRS solution (inhibitor removal solution) was added to the supernatant, and the mixture was refrigerated at 4 °C for 5 min to remove contaminants. Centrifugation was repeated, and the supernatants were transferred to a new 2 mL collection tube. To induce the DNA to bind the membrane in the column, the supernatants were mixed with solution MR (highly concentrated salt solution), and the mixtures were loaded onto the MB spin columns and centrifuged. After washing, the DNA was eluted with 100 μL of solution EB (elution buffer). The DNA samples were subjected to meta-analysis using an Illumina MiSeq Sequencing system (SY-410-1003, Illumina, San Diego, CA, USA), and the sequencing data were then clustered using Cluster Database at High Identity with Tolerance (CD-HIT) and UCLUST. Processing of raw reads started with quality check, and filtering of low quality (<Q25) reads using Trimmomatic ver. 0.32. After QC-pass results, paired-end sequence data were merged using the fastq_mergepairs command of VSEARCH version 2.13.4 with default parameters. Primers were then trimmed with the alignment algorithm of Myers and Miller at a similarity cut-off of 0.8. Non-specific amplicons that do not encode 16S rRNA were detected by nhmmer in HMMER software package ver. 3.2.1 with hmm profiles. Principal coordinates analysis (PCoA), which converts data on distances between items into a map-based visualization, was conducted using EzBioCloud Program (Chunlab, Inc., Seoul, Korea).
2.3. Quantitative Polymerase Chain Reaction PCR (q-PCR)
The bacterial on the dry aged beef (25 g) were quantified using q-PCR. The primer sequences used in this study are listed in Table 1. A primer targeting Pantoea spp. was developed in this study, and its sensitivity and specificity were verified using various bacterial strains, such as Pseudomonas spp. and Streptococcus spp. (Supplementary Table S1; Supplementary Figure S1). For q-PCR, the reaction mixture was prepared in a 0.1 mL Strip q-PCR tube (Cat. No. 981103; Qiagen, Hilden, Germany) as follows: 12.5 μL of 2× Rotor-Gene SYBR Green PCR Master Mix (Cat. No. 204074; Qiagen, Hilden, Germany), 2.5 μL of primer_foward (10 μM), 2.5 μL of primer_reverse (10 μM), 6.5 μL of ribonuclease (RNase)-free water, and 1 μL of DNA template. The mixture was amplified using Rotor-GeneQ (Qiagen) at 95 °C for 5–35 cycles (95 °C, 5–60 °C, 10 s). The cycle threshold (Ct) value was converted to the bacterial level using the standard curve of each primer (Supplementary Figure S2).
2.4. Measurement of the TBARS and VBN Values
The TBARS values were determined according to the method of Witte et al. (1970) [23] with slight modifications. Briefly, beef samples (10 g) were blended for 1 min in a homogenizer (CH580, Hai Xin Technology Company, Shenzhen, China) with water three times the amount of the sample. The homogenate was filtered through an Advantec No. 1 filter paper (Cat. No. 265172; Chiba, Japan), and the filtrate was mixed with 20 mM 2-thiobarbituric acid and 20% trichloroacetic acid. The mixtures were reacted at 99 °C in a water bath, and the reaction was stopped by cooling under running water. After filtration, the absorbance of the samples at 531 nm was measured using a spectrophotometer (BioTek Instruments, Winooski, VT, USA). The VBN value was measured using microdiffusion analysis [24]. The beef sample (10 g) was homogenized in distilled water to a volume of 100 mL using a mess flask. The homogenate was filtered through a filter paper. One milliliter of the filtrate was transferred to the outer part of a Conway dish, and then 1 mL of 0.01 N boric acid (H3BO3) and 0.1 mL of Conway solution (0.066% methyl red + 0.066% bromocresol green in ethanol) was transferred to the inner part. A 50% potassium carbonate (K2CO3) solution was added to the lower layer of the outer part. The dish was then sealed and incubated at 37 °C for 2 h. Finally, a drop of 0.02 N sulfuric acid (H2SO4) was added to the inner part until the color changed from green to red, and the VBN value was calculated.
2.5. Statistical Analysis
The experiment was replicated with three samples. Data for the microflora were analyzed using the Wilcoxon rank-sum test. Data for the level of quality factors (TBARS, VBN, and bacterial level) in dry aged beef were analyzed using Analysis of Variance (ANOVA) with SPSS statistical software (SPSS Ver. 20.0; IBM, Chicago, IL, USA). Least square means among the groups were compared using a Tukey’s range test at α = 0.05.
3. Results and Discussion
3.1. Changes in the Level of Quality Factors during Dry Aging of Beef
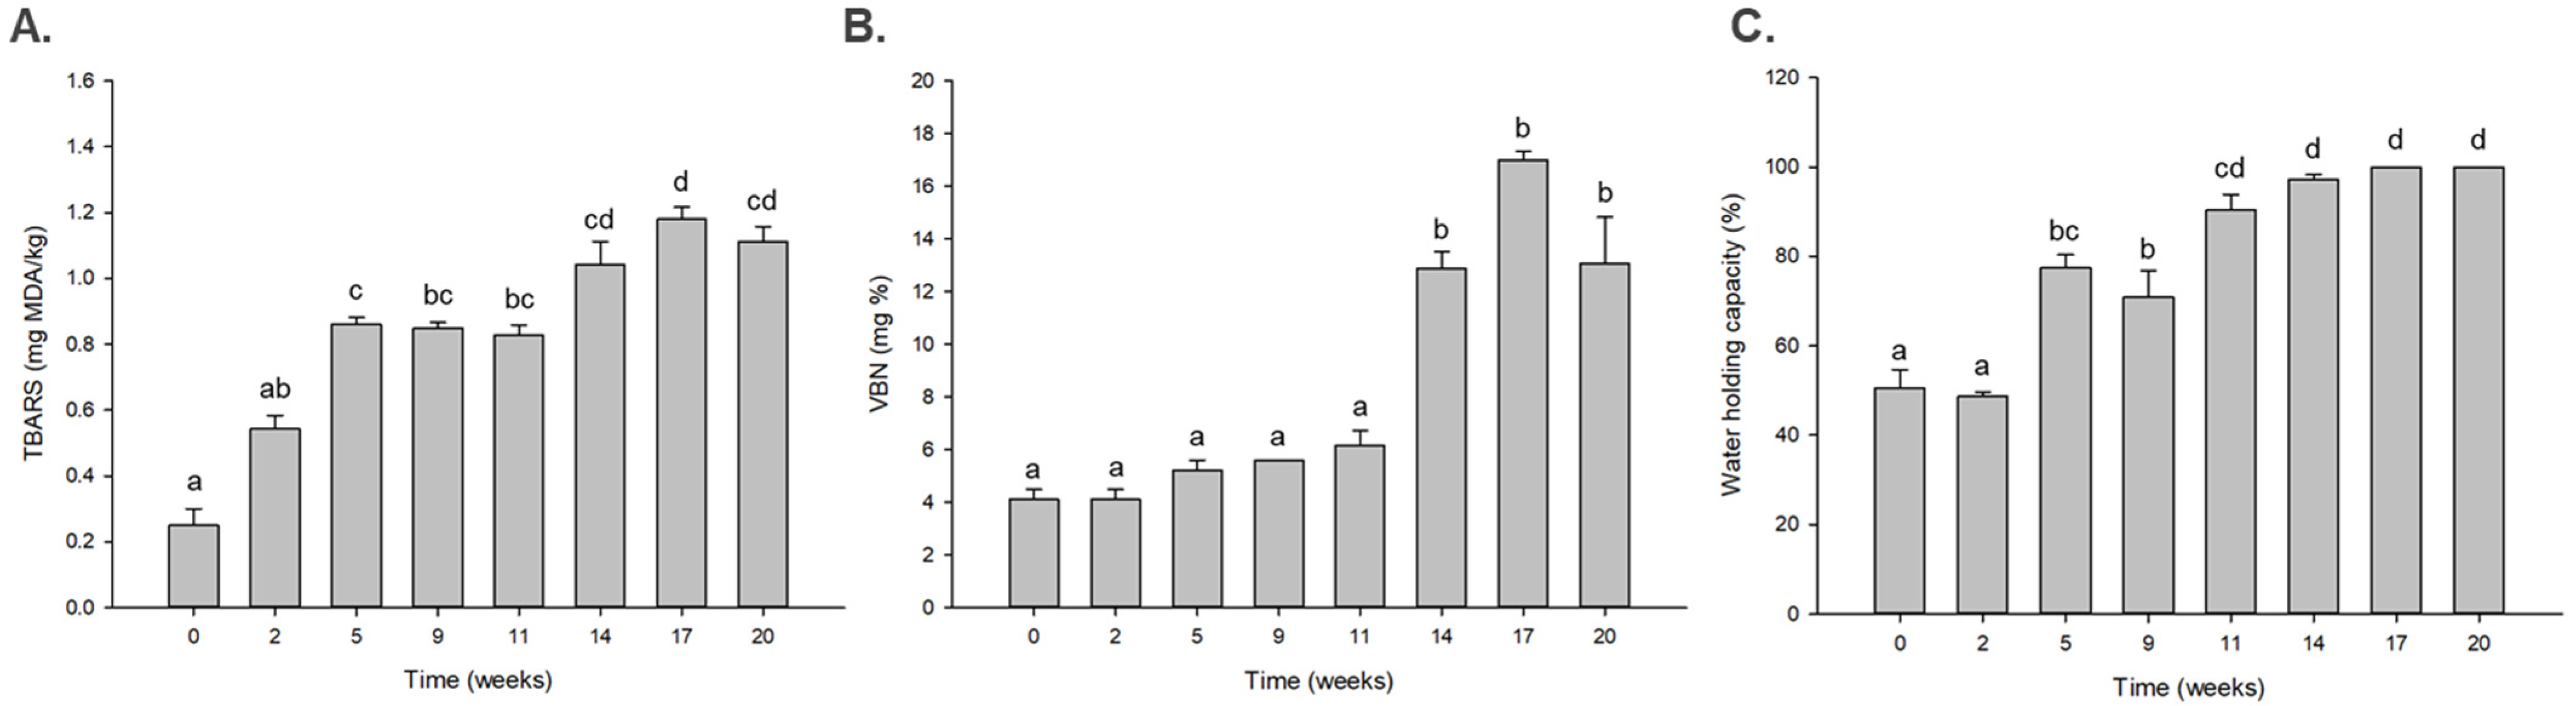
Lipid oxidation and protein putrefaction are highly related to a decrease in taste and flavor in spoiled meat, which are reflected in the TBARS and VBN values, respectively. At low temperatures, the pH of meat is increased as the meat is spoiled, and this causes an increase in the water-holding capacity of the meat [25]. In this study, round beef was dry aged under low temperature for a long time, and its quality factors, including TBARS, VBN, and water holding capacity (WHC), were analyzed at certain intervals during 24 weeks of dry aging. The TBARS value was significantly increased at the fifth week, and the VBN value increased at the 14th week of dry aging (p < 0.05) (Figure 1A,B). The WHC of beef considerably increased after the 11th week (p < 0.05) (Figure 1C). These results indicate that the quality of dry aged beef decreased from the 11th week. Therefore, the dry aging duration was divided into early and late stages based on the 11th week, the time at which the quality of the dry aged beef decreased.
3.2. Changes in the Composition of Microflora during Dry Aging of Beef
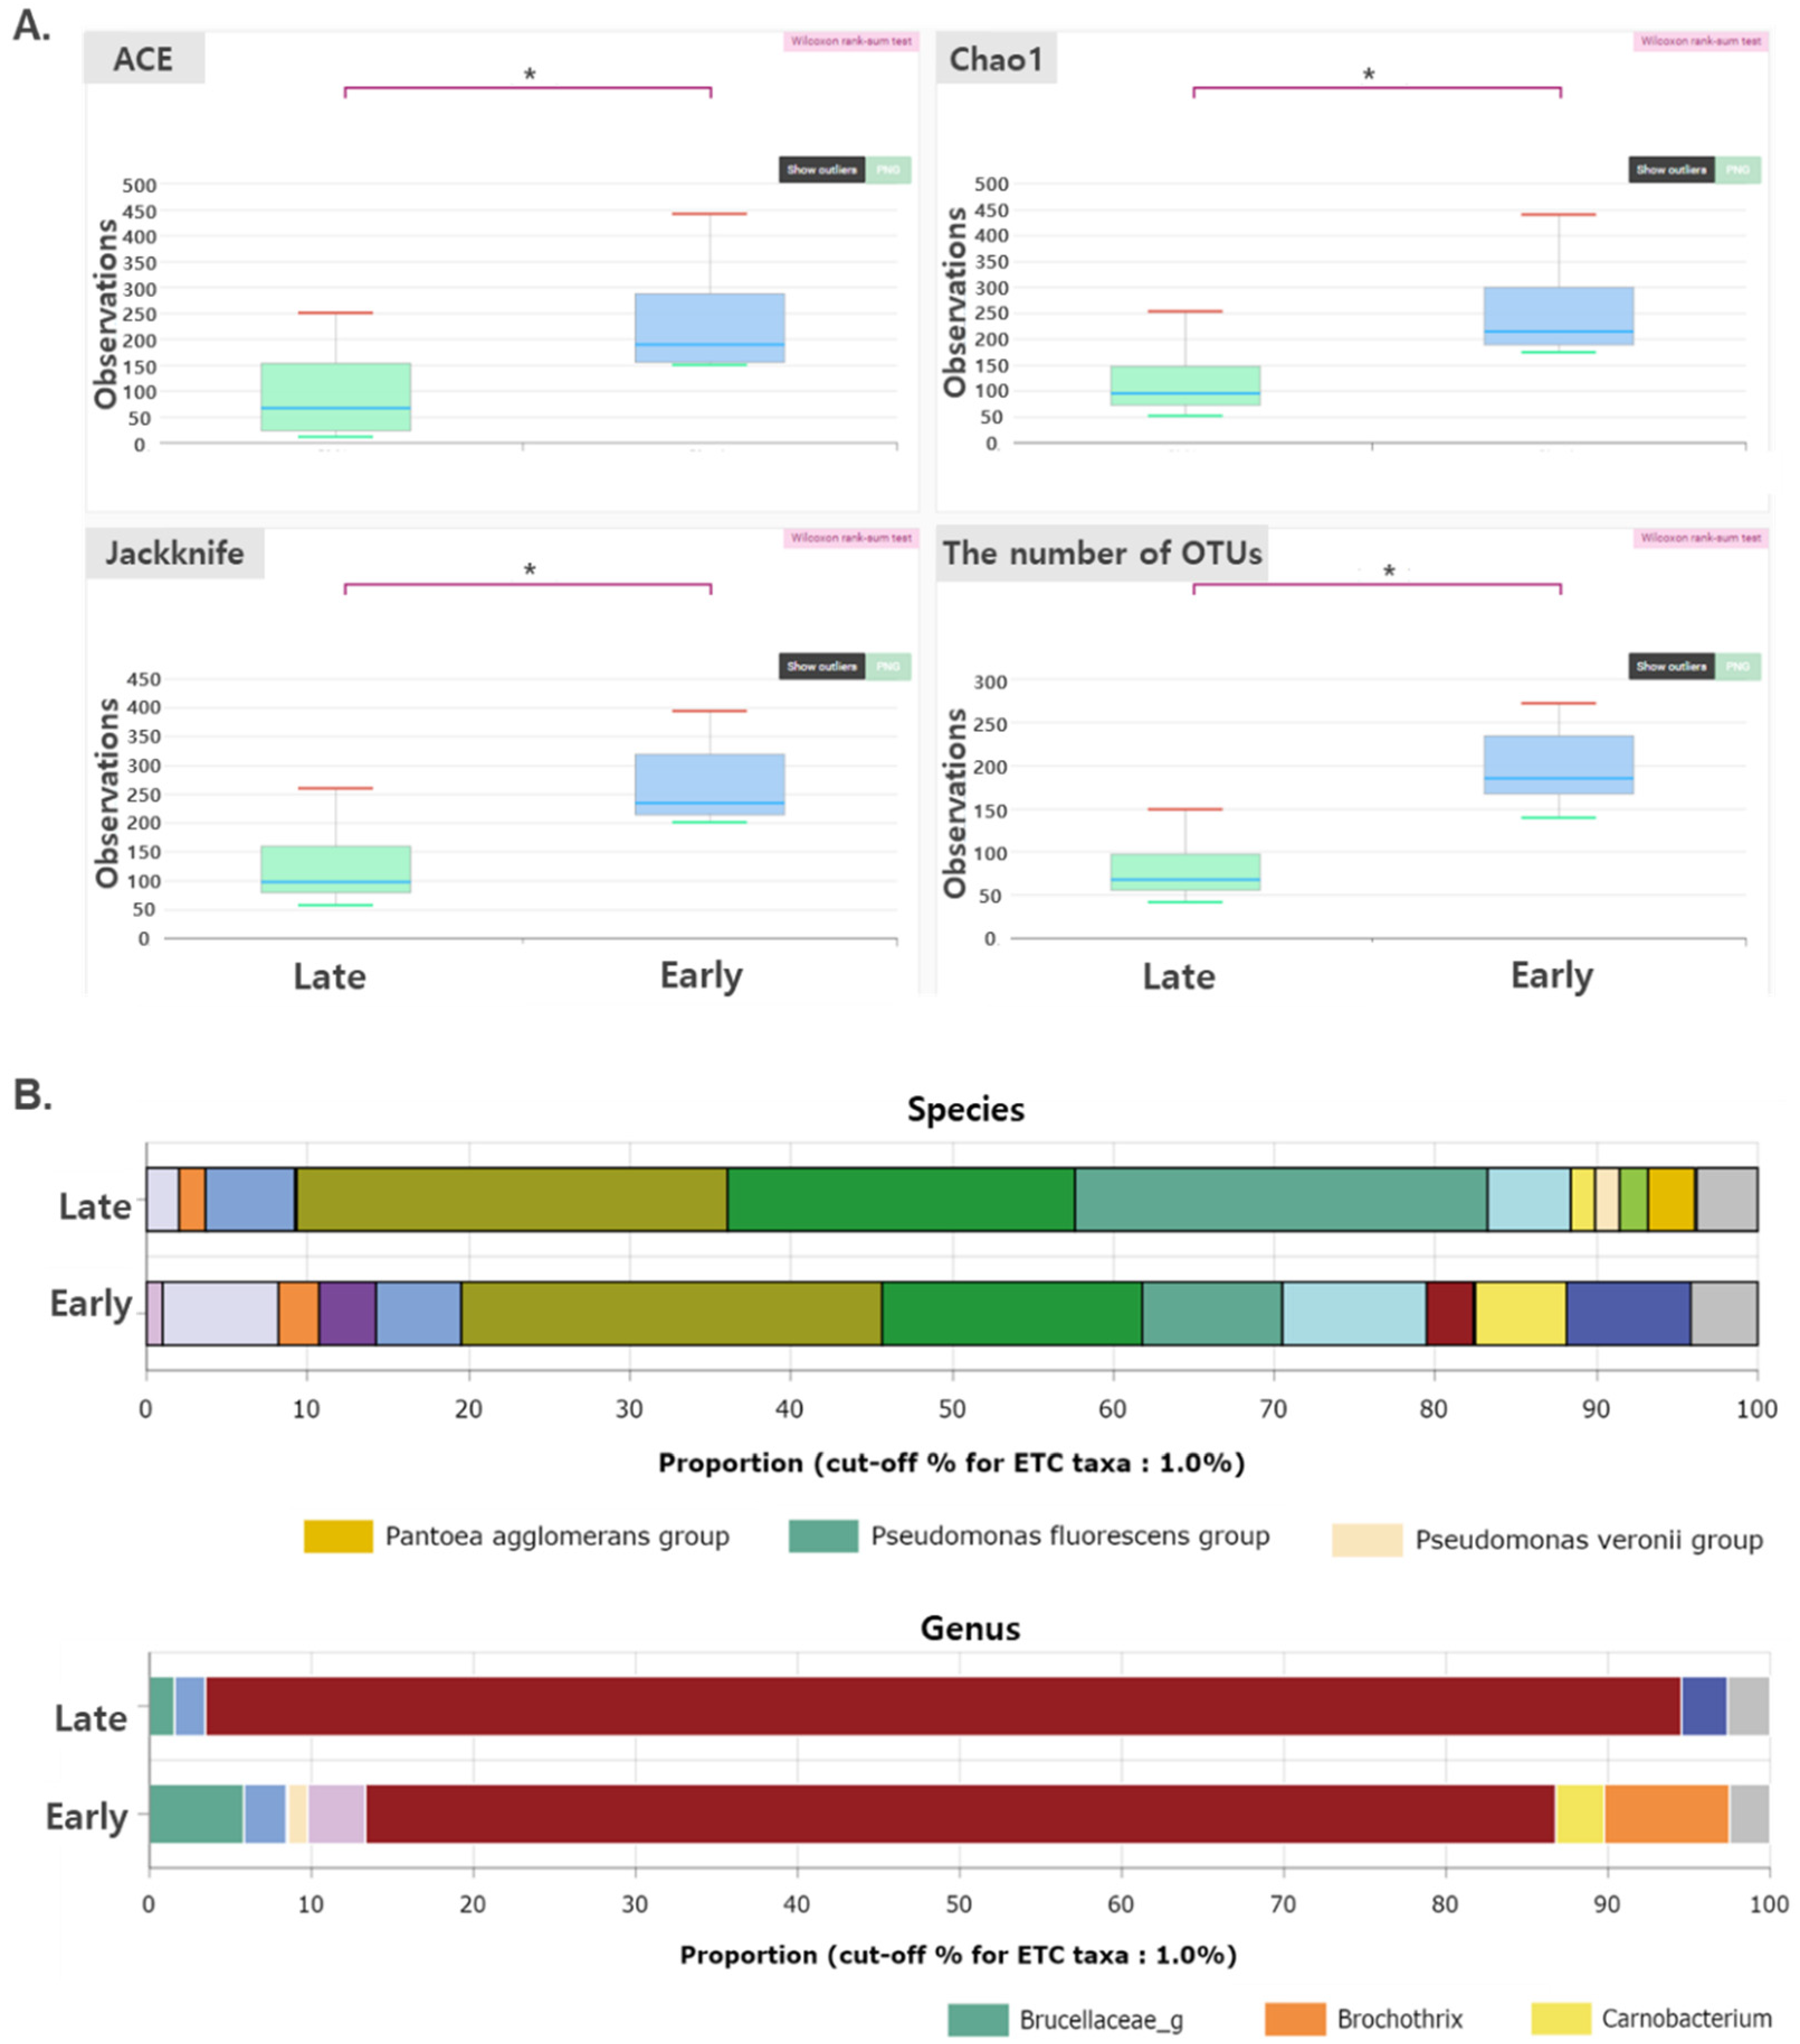
The microflora that colonized on the surface of the dry aged beef (cluster) were analyzed using metagenomics analysis at 0–24 weeks of age. The number of valid reads ranged from 14,817 to 115,681. PCoA showed that the composition of microflora was grouped by dry aging duration (Supplementary Figure S3). To facilitate the analysis, the data were divided into two groups: early (~11th week) and late (~11th week), and the compositions of the two groups were compared. Diversity indices of microflora, such as Chao1, abundance-based coverage estimator (ACE), and Jackknife, were significantly lower in the early group than in the late group (p < 0.05) (Figure 2A). This result indicates that the diversity of the microflora is correlated with the rancidity of dry aged beef. Similar results were observed in a previous study [24]. In the previous study, differences between fresh and low-temperature spoiled round beef were compared, and it was observed that the general type of flora changed from mixed and many types of microflora in the fresh meat to homogeneous and few types of microflora in the spoiled meat. Similar trends of decreased microbial diversity in spoiled meats were observed in other types of red meats and under various storage conditions [26,27].
The microflora was further analyzed to investigate the microbial strains and determine the rancidity of the dry aged beef. At the species level, the compositions of the Pantoea agglomerans, Pseudomonas fluorescens, and Pseudomonas veronii groups were higher in the late group than in the early group (Figure 2B). At the genus level, the composition of microorganisms, such as Brucellaceae, Brochothrix, and Carnobacterium, was higher in the early group compared with that in the late group (Figure 2B). These differences in the microbial composition between the early and late groups mean that the dry aging process (also decrease in quality) is highly correlated with the composition of the microbial community. However, the specific relationship between the quality and the microbial community of dry aged beef has hitherto not been clearly understood.
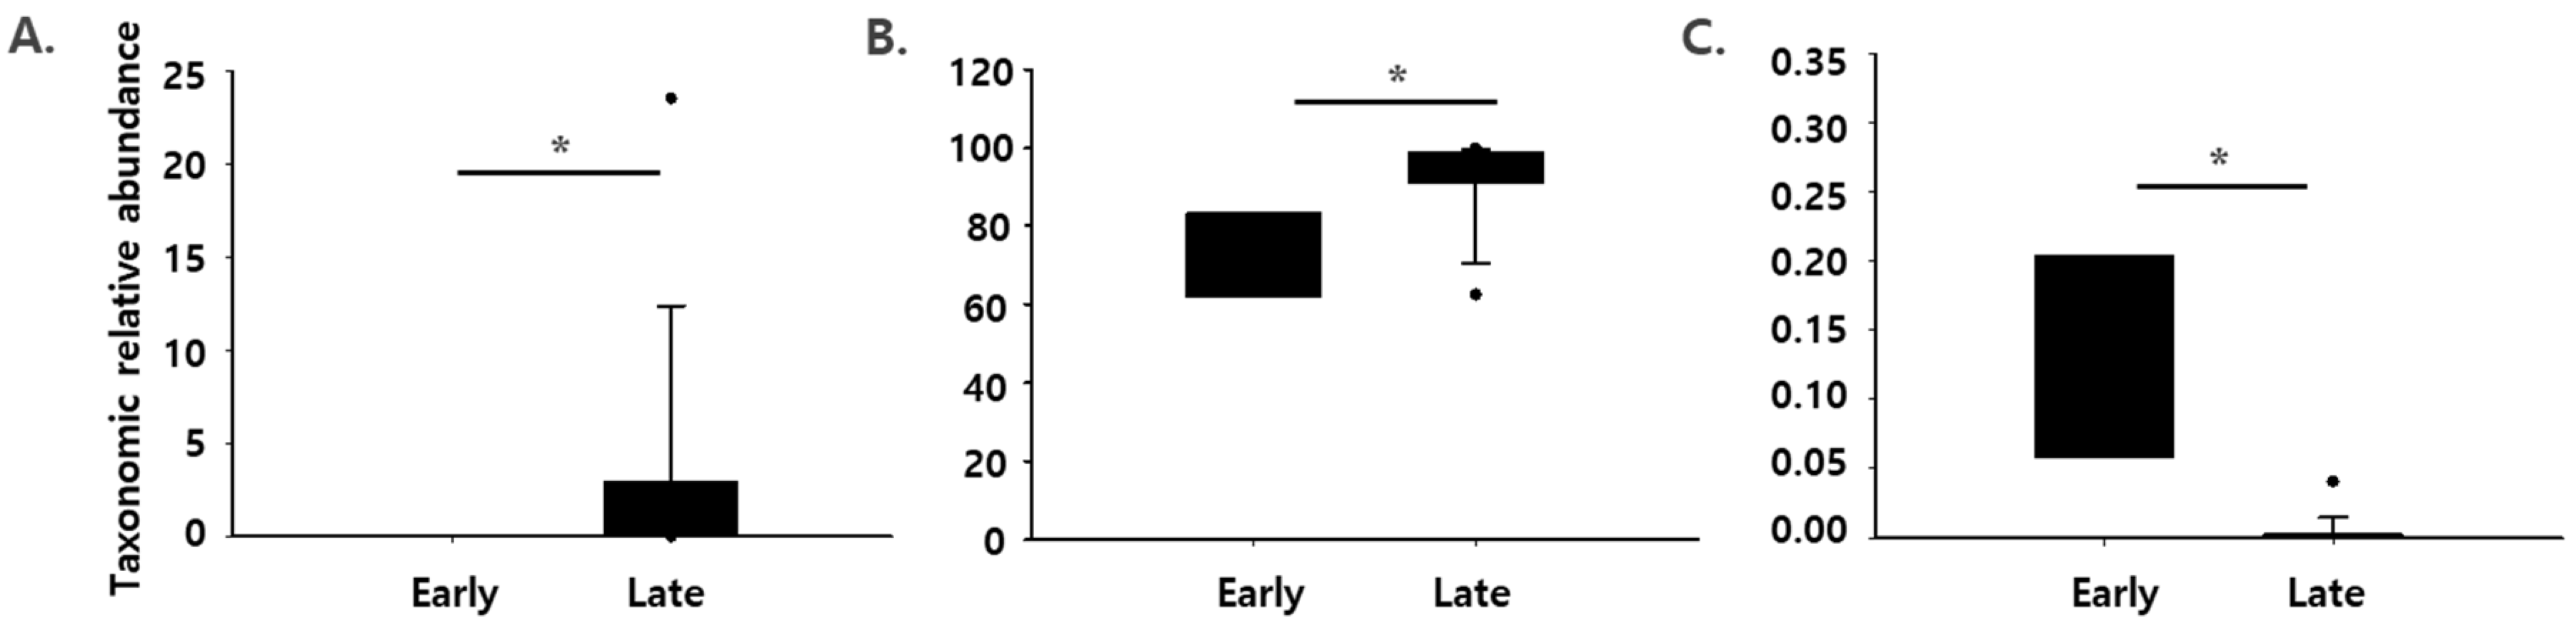
In particular, the relative abundances of Pantoea spp. and Pseudomonas spp. were significantly higher in the late group than in the early group, while that of Streptococcus spp. was significantly lower in the late group (p < 0.05) (Figure 3). Similar changes in relative bacterial levels of Pseudomonas spp. and Streptococcus spp. have been observed in previous studies [4,28]. Pantoea, a genus belonging to the Enterobacteriaceae family, contributes to meat spoilage [29]. Pseudomonas spp. are well-known psychrotrophic bacteria, which are often isolated from spoiled meat, and Pseudomonas fragi, Pseudomonas lundensis, and Pseudomonas fluorescens are frequently found species [5]. Streptococcus is a genus of lactic acid bacteria, which are the most abundant strains in the early stage of dry aging, but their number decreases as ripening progresses [4]. These genera are commonly found in meat that is spoiled/stored in air [5]. Therefore, together with the results from Figure 1, changes in the abundance of Pantoea spp., Pseudomonas spp., and Streptococcus spp. could be used to determine the rancidity of dry aged beef.
3.3. Level of the Microbes Quantified Using Real-Time q-PCR (qRT-PCR) during Dry Aging in Beef
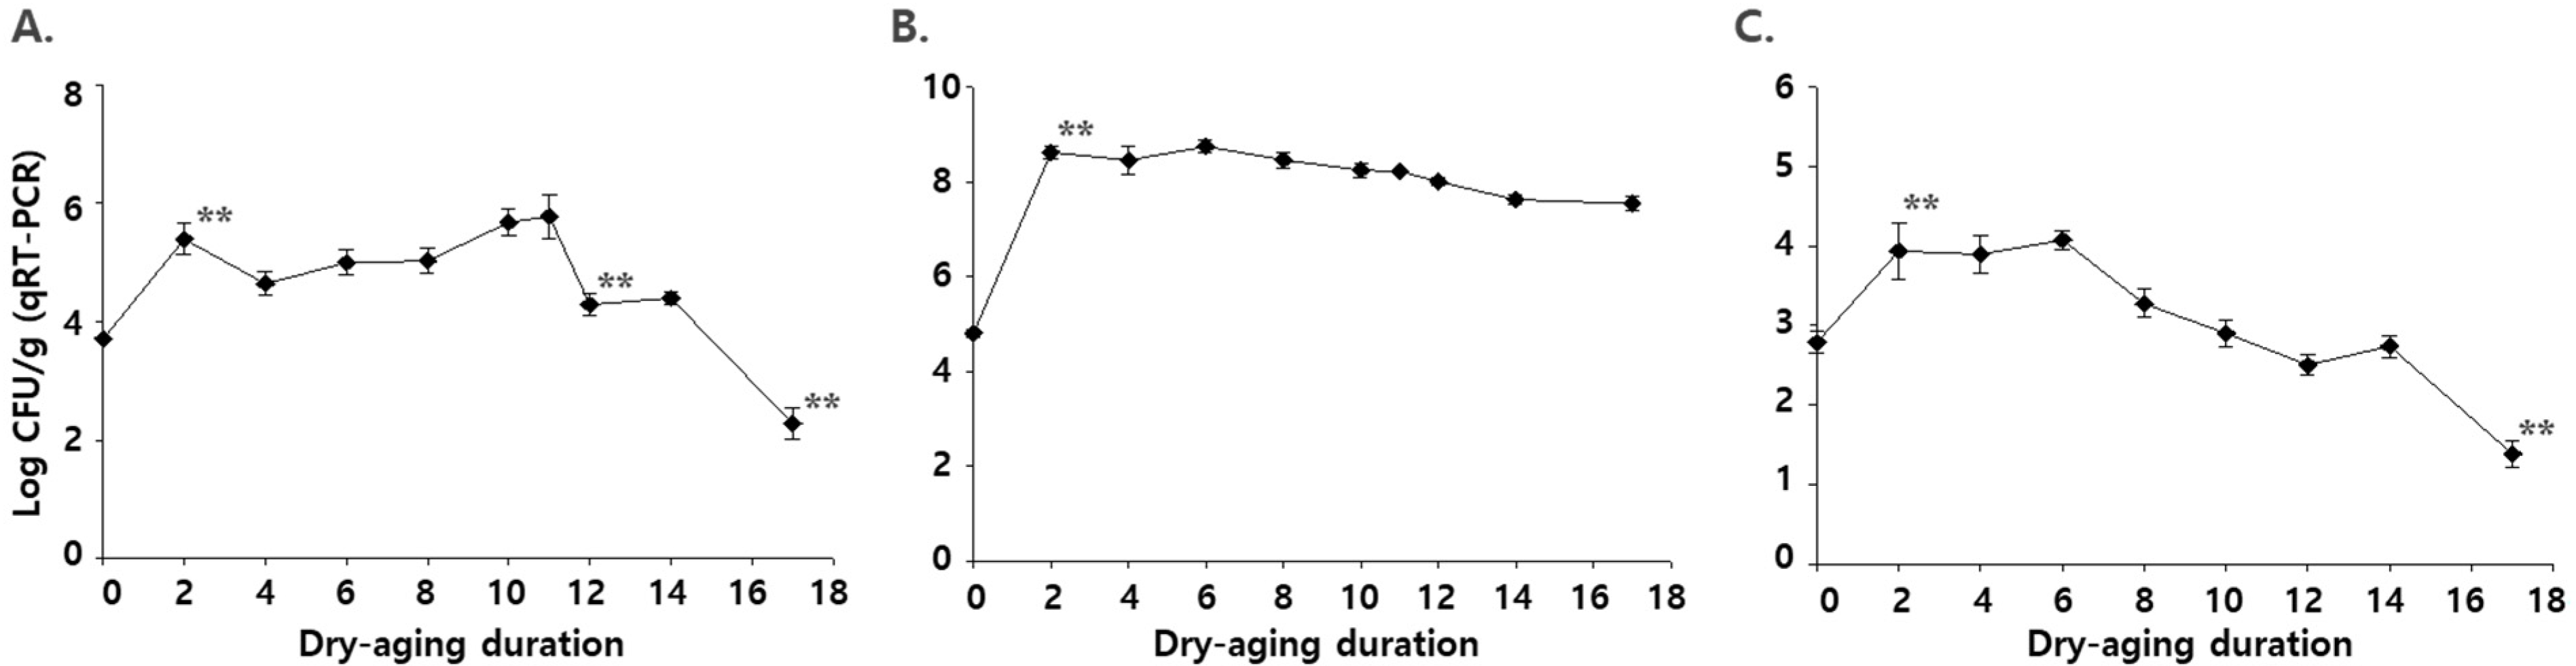
To validate the use of Pantoea spp., Pseudomonas spp., and Streptococcus spp. as indices for the rancidity of dry aged beef, the abundance of these microbes was quantified in newly produced dry aged beef using qRT-PCR. In the initial stage, the number of Pantoea spp. was 3.7 log CFU/g, which increased during the early stage of dry aging (Figure 2). The number of Pantoea spp. was significantly decreased after the 10th week of dry aging (p < 0.05), and it was 2.3 log CFU/g at the very late stage of dry aging (the 17th week). This result indicates that the number of Pantoea spp. is highly related to the quality of dry aged beef. Li et al. (2020) [30] also found that the number of Pantoea spp. was lower in spoiled meat products compared with that in normal meat products. However, these results are different from that of the microflora analysis in the present study, which showed a decreased abundance of Pantoea spp. in the late group (Figure 3). The reason for these differences could be as follows: (1) differences between “composition” in the microflora analysis and “quantity” in the qRT-PCR analysis; and/or (2) limitation of primers that could cover all strains of Pantoea spp. on the beef.
The number of Pseudomonas spp. increased initially and slightly decreased, but not significantly, in the late stage of dry aging (Figure 4). It was also reported in a previous study that Pseudomonas spp. (most are P. fragi, P. flourescens, and P. lundensis) were prevalent both in the fresh and spoiled meat [7,25]. Increase in Pseudomonas spp. composition in the microflora analysis might be due to a decrease in the total number of microorganisms. This result indicates that Pseudomonas spp. cannot be used to determine the rancidity of dry aged beef. Similar results were observed for Streptococcus spp. The number of strains gradually decreased after the sixth week of dry aging, but it was not significant (Figure 4). At the 17th week of dry aging, however, the number of Streptococcus spp. was significantly decreased to 1.4 log CFU/g. The results indicate that the abundance of Streptococcus spp. can be used to determine rancidity in the very late stage of dry aging of beef.
4. Conclusions
In this study, changes in the microbial community during dry aging were investigated, and it was proven that microbial strains are highly related to the rancidity of dry aged beef. Based on the microflora analysis and quantification using qRT-PCR, Pantoea spp. and Streptococcus spp. could be used to determine the rancidity of dry aged beef. Findings from this study might be helpful for manufacturers to manage the decay of dry aged beef. Further studies are needed to validate the use of these strains under various conditions of dry aging or in applications with other parts of beef.
Supplementary Materials
The following are available online at https://0-www-mdpi-com.brum.beds.ac.uk/article/10.3390/pr9112049/s1, Figure S1: Sensitivity and specificity of primers used to detect Pantoea spp.; Figure S2: Standard curve for each primer used to detect bacteria in the study; Figure S3: Metagenomic analysis on the microflora on the dry aged beef (0–20 weeks). (a) Principal coordinates analysis (PoCA) graph; (b) diversity indices; and (c) microbial composition at the species level; Table S1: Bacterial strains used in this study.
Author Contributions
Conceptualization, S.K., Y.Y. and H.L.; methodology, S.K.; formal analysis, S.K., S.P. and J.K.; investigation, S.K., S.P., J.K. and H.L.; data curation, S.K. and H.L.; writing—original draft preparation, S.K.; writing—review and editing, J.-C.K., Y.Y. and H.L.; supervision, J.-C.K.; project administration, J.-C.K. All authors have read and agreed to the published version of the manuscript.
Funding
This research was supported by the Main Research Program (E0211400-01) of the Korea Food Research Institute (KFRI), funded by the Ministry of Science and ICT (Korea).
Conflicts of Interest
The authors declare no conflict of interest.
References
- Kim, Y.H.B.; Kemp, R.; Samuelsson, L.M. Effects of dry-aging on meat quality attributes and metabolite profiles of beef Loins. Meat Sci. 2016, 111, 168–176. [Google Scholar] [CrossRef]
- Allied Market Research. U.S. Dry Aging Beef Market—Opportunity Analysis and Industry Forecast, 2014–2020. Available online: https://www.alliedmarketresearch.com/US-dry-aging-beef-market (accessed on 5 November 2021).
- Ashaman, H.; Hastie, M.; Warner, R.; Jacob, R.; Hunyh, L. Dry-Aging—Introduction and Insights. Available online: https://www.mla.com.au/globalassets/mla-corporate/news-and-events/documents/dry-ageing-meat/introduction-and-market-insights (accessed on 5 November 2021).
- Ryu, S.; Shin, M.; Cho, S.; Hwang, I.; Kim, Y.; Oh, S. Microbial and fungal communities on dry aged beef of Hanwoo using metagenomic analysis. Foods 2020, 9, 1571. [Google Scholar] [CrossRef] [PubMed]
- Casaburi, A.; Piombino, P.; Nychas, G.J.; Villani, F.; Ercolini, D. Bacterial populations and the volatilome associated to meat spoilage. Food Microbiol. 2015, 45, 83–102. [Google Scholar] [CrossRef]
- Terkimg, N.; Witte, F.; Heinz, V. The dry aged beef paradox: Why dry aging is sometimes not better than wet aging. Meat Sci. 2021, 172, 108355. [Google Scholar]
- Raposo, A.; Perez, E.; de Faria, C.T.; Ferrus, M.A.; Carrascosa, C. Chapter 3—Food Spoilage by Pseudomonas spp. An Overview. In Foodborne Pathogens and Antibiotic Resistance; Singh, O.V., Ed.; John Wiley & Sons, Inc.: Hoboken, NJ, USA, 2016; pp. 21–39. [Google Scholar]
- Nychas, G.-J.E.; Marshall, D.; Sofos, J. Chapter 6—Meat Poultry and Seafood. In Food Microbiology Fundamentals and Frontiers; Doyle, M.P., Beuchat, L.R., Montville, T.J., Eds.; ASM Press: New York, NY, USA, 2007. [Google Scholar]
- Gill, C.O.; Newton, K.G. The ecology of bacterial spoilage of fresh meat at chill temperatures. Meat Sci. 1978, 2, 207–217. [Google Scholar] [CrossRef]
- Lee, H.J.; Yoon, J.W.; Kim, M.; Oh, H.; Yoon, Y.; Jo, C. Changes in microbial composition on the crust by different air flow velocities and their effect on sensory properties of dry aged beef. Meat Sci. 2019, 153, 152–158. [Google Scholar] [CrossRef] [PubMed]
- Oh, H.; Lee, H.J.; Lee, J.; Jo, C.; Yoon, Y. Identification of microorganisms associated with the quality improvement of dry aged beef through microbiome analysis and DNA sequencing, and evaluation of their effects on beef quality. J. Food Sci. 2019, 84, 2944–2954. [Google Scholar] [CrossRef] [PubMed]
- Dave, D.; Ghaly, A.E. Meat spoilage mechanisms and preservation techniques: A critical review. Am. J. Agric. Biol. Sci. 2011, 6, 486–510. [Google Scholar]
- Byun, J.S.; Min, J.S.; Kim, I.S.; Chung, M.S.; Lee, M. Comparison of indicators of microbial quality of meat during aerobic cold storage. J. Food Prot. 2003, 66, 1733–1737. [Google Scholar] [CrossRef]
- Borch, E.; Kant-Muermans, M.L.; Blixt, Y. Bacterial spoilage of meat and cured meat products. Int. J. Food Microbiol. 1996, 33, 103–120. [Google Scholar] [CrossRef]
- Govindarajulu, S.N.; Varier, K.M.; Jayamurali, D.; Liu, W.; Chen, J.; Manoharan, N.; Li, Y.; Gajendran, B. Chapter 16—Insect Gut Microbiome and Its Applications. In Recent Advancements in Microbial Diversity; De Mandal, S., Bhatt, P., Eds.; Academic Press: Cambridge, MA, USA, 2020; pp. 379–395. [Google Scholar]
- Thomas, T.; Gilbert, J.; Meyer, F. Metagenomics—A guide from sampling to data analysis. Microb. Inform. Exp. 2012, 2, 3. [Google Scholar] [CrossRef] [Green Version]
- Neelakanta, G.; Sultana, H. The use of metagenomic approaches to analyze changes in microbial communities. Microbiol. Insights 2013, 6, 37–48. [Google Scholar] [CrossRef] [PubMed]
- Yang, S.; Gao, X.; Meng, J.; Zhang, A.; Zhou, Y.; Long, M.; Li, B.; Deng, W.; Jin, L.; Zhao, S.; et al. Metagenomic analysis of bacteria, fungi, bacteriophages, and helminths in the gut of giant pandas. Front. Microbiol. 2018, 9, 1717. [Google Scholar] [CrossRef] [Green Version]
- Wang, W.; Xu, S.; Ren, Z.; Tao, L.; Jiang, J.; Zheng, S. Application of metagenomics in the human gut microbiome. World J. Gastroenterol. 2015, 21, 803–814. [Google Scholar] [CrossRef] [PubMed]
- Bergmark, L.; Poulsen, P.H.B.; Al-Soud, W.A.; Norman, A.; Hansen, L.H.; Sørensen, S.J. Assessment of the specificity of Burkholderia and Pseudomonas qPCR assays for detection of these genera in soil using 454 pyrosequencing. FEMS Microbiol. Lett. 2012, 333, 77–84. [Google Scholar] [CrossRef] [Green Version]
- Chumponsuk, T.; Jaroensuk, S.; Phengkhot, S.; Gentekaki, E.; Popluechai, S.; Kullawong, N. Development of genus-specific primers for quantitative PCR analysis of Streptococcus in human feces. In Proceeding of the 29th Annual Meeting of the Thai Society for Biotechnology and International Conference, Bangkok, Thailand, 23–25 November 2017. [Google Scholar]
- Dolan, A.; Burgess, C.M.; Barry, T.B.; Fanning, S.; Duffy, G. A novel quantitative reverse-transcription PCR (qRT-PCR) for the enumeration of total bacteria, using meat micro-flora as a model. J. Microbiol. Methods 2009, 77, 1–7. [Google Scholar] [CrossRef] [PubMed]
- Witte, V.C.; Krause, G.F.; Bailey, M.E. A new extraction method for determining 2-thiobarbituric acid values of pork and beef during storage. J. Food Sci. 1970, 35, 582–585. [Google Scholar] [CrossRef]
- Conway, E.J.; Byrne, A. An absorption apparatus for the micro-determination of certain volatile substances: The micro-determination of ammonia. Biochem. J. 1933, 27, 419–429. [Google Scholar]
- Jay, J.M. Mechanism and detection of microbial spoilage in meats at low temperatures: A status report. J. Milk Food Technol. 1972, 35, 467–471. [Google Scholar] [CrossRef]
- Li, M.Y.; Zhou, G.H.; Xu, X.L.; Li, C.B.; Zhu, W.Y. Changes of bacterial diversity and main flora in chilled pork during storage using PCR-DGGE. Food Micobiol. 2006, 23, 607–611. [Google Scholar] [CrossRef] [PubMed]
- Dainty, R.H.; Mackey, B.M. The relationship between the phenotypic properties of bacteria from chill-stored meat and spoilage processes. J. Appl. Microbiol. 1992, 73, 103S–114S. [Google Scholar] [CrossRef] [PubMed]
- Ercolini, D.; Russo, F.; Torrieri, E.; Masi, P.; Villani, F. Changes in the spoilage-related microbiota of beef during refrigerated storage under different packaging conditions. Appl. Environ. Microbiol. 2006, 72, 4663–4671. [Google Scholar] [CrossRef] [PubMed] [Green Version]
- Li, R.; Cai, L.; Gao, T.; Li, C.; Zhou, G.; Ye, K. Comparing the quality characteristics and bacterial communities in meatballs with or without blown pack spoilage. LWT 2020, 130, 109529. [Google Scholar] [CrossRef]
- Oh, H.; Kim, S.; Lee, S.; Lee, H.; Ha, J.; Lee, J.; Choi, Y.; Choi, K.H.; Yoon, Y. Prevalence, serotype diversity, genotype and antibiotic resistance of Listeria monocytogenes isolated from carcasses and human in Korea. Food Sci. Anim. Resour. 2018, 38, 851–865. [Google Scholar] [CrossRef] [Green Version]
Figure 1.
Changes in the (A) thiobarbituric acid reactive substance (TBARS), (B) volatile basic nitrogen (VBN), and (C) water holding capacity values in the dry aged beef during an aging time of 24 weeks. a–d: means with different letters are significantly different (p < 0.05). The data were analyzed using Analysis of Variance (ANOVA).

Figure 2.
Metagenomic analysis of the microflora in the early (before the 11th week) or late stage (after the 11th week) of dry aging. (A) Diversity indices; and (B) microbial composition at the genus and species levels. * indicates that the two groups are significantly different (p < 0.05). The data were analyzed using Wilcoxon rank-sum test.

Figure 3.
Bacterial levels in the early (before the 11th week) or late stage (after the 11th week) of dry aging observed using the 16S sequencing-based method. (A) Pantoea spp., (B) Pseudomonas spp., and (C) Streptococcus spp. * indicates that the two groups are significantly different (p < 0.05). The data were analyzed using Wilcoxon rank-sum test.

Figure 4.
Levels of (A) Pantoea spp., (B) Pseudomonas spp., and (C) Streptococcus spp. measured using qRT-PCR during dry aging of beef. ** indicates that the points are significantly different from those in the previous week (p < 0.05). The data were analyzed using Analysis of Variance (ANOVA).
Figure 4.
Levels of (A) Pantoea spp., (B) Pseudomonas spp., and (C) Streptococcus spp. measured using qRT-PCR during dry aging of beef. ** indicates that the points are significantly different from those in the previous week (p < 0.05). The data were analyzed using Analysis of Variance (ANOVA).


Table 1.
Primers used to detect bacteria on dry aged beef.
| Strain | Primer (3′–5′) | Target Gene | Reference |
|---|---|---|---|
| Pantoea spp. | F: CACTGGAAACGGTGGCTAAT | 16S rRNA | This study |
| R: CTGGGTTCATCCGATAGTGAG | |||
| Pseudomonas spp. | F: ACTTTAAGTTGGGAGGAAGGG R: ACACAGGAAATTCCACCACCC | 16S rRNA | [20] |
| Streptococcus spp. | F: CGATACATAGCCGACCTGAGA R: CCACTCTCCCCTYYTGCAC | 16S rRNA | [21] |
| Universal bacteria | |||
| Gram-positive | F: GAAAGTCCGGGCTCCATA R: ATAAGCCGGGTTCTGT | mp(G–) | [22] |
| Gram-negative | F: GAGGAAATCCRKGCTCGCAC R: AGGGGTTTACCGCGTTCC | mp(G+) | [22] |
rRNA, ribosomal ribonucleic acid.
Publisher’s Note: MDPI stays neutral with regard to jurisdictional claims in published maps and institutional affiliations. |
© 2021 by the authors. Licensee MDPI, Basel, Switzerland. This article is an open access article distributed under the terms and conditions of the Creative Commons Attribution (CC BY) license (https://creativecommons.org/licenses/by/4.0/).
Share and Cite
MDPI and ACS Style
Kim, S.; Kim, J.-C.; Park, S.; Kim, J.; Yoon, Y.; Lee, H. Identification of Microbial Flora in Dry Aged Beef to Evaluate the Rancidity during Dry Aging. Processes 2021, 9, 2049. https://0-doi-org.brum.beds.ac.uk/10.3390/pr9112049
AMA Style
Kim S, Kim J-C, Park S, Kim J, Yoon Y, Lee H. Identification of Microbial Flora in Dry Aged Beef to Evaluate the Rancidity during Dry Aging. Processes. 2021; 9(11):2049. https://0-doi-org.brum.beds.ac.uk/10.3390/pr9112049
Chicago/Turabian StyleKim, Sejeong, Jong-Chan Kim, Sunhyun Park, Jinkwi Kim, Yohan Yoon, and Heeyoung Lee. 2021. "Identification of Microbial Flora in Dry Aged Beef to Evaluate the Rancidity during Dry Aging" Processes 9, no. 11: 2049. https://0-doi-org.brum.beds.ac.uk/10.3390/pr9112049
Note that from the first issue of 2016, this journal uses article numbers instead of page numbers. See further details here.