Article

Formation of Giant Lipid Vesicles in the Presence of Nonelectrolytes—Glucose, Sucrose, Sorbitol and Ethanol

1
Chongqing Engineering and Technology Research Center of Intelligent Rehabilitation and Eldercare, Chongqing City Management College, Chongqing 401331, China
2
Key Laboratory of Biorheological Science and Technology, Ministry of Education, Bioengineering College, Chongqing University, Chongqing 400030, China
*
Authors to whom correspondence should be addressed.
Submission received: 16 April 2021 / Revised: 18 May 2021 / Accepted: 24 May 2021 / Published: 27 May 2021

Abstract

:
Lipid vesicles, especially giant lipid vesicles (GLVs), are usually adopted as cell membrane models and their preparation has been widely studied. However, the effects of some nonelectrolytes on GLV formation have not been specifically studied so far. In this paper, the effects of the nonelectrolytes, including sucrose, glucose, sorbitol and ethanol, and their coexistence with sodium chloride, on the lipid hydration and GLV formation were investigated. With the hydration method, it was found that the sucrose, glucose and sorbitol showed almost the same effect. Their presence in the medium enhanced the hydrodynamic force on the lipid membranes, promoting the GLV formation. GLV formation was also promoted by the presence of ethanol with ethanol volume fraction in the range of 0 to 20 percent, but higher ethanol content resulted in failure of GLV formation. However, the participation of sodium chloride in sugar solution and ethanol solution stabilized the lipid membranes, suppressing the GLV formation. In addition, the ethanol and the sodium chloride showed the completely opposite effects on lipid hydration. These results could provide some suggestions for the efficient preparation of GLVs.

Graphical Abstract

1. Introduction

Plasma membranes form dynamic and flexible barriers to separate cells from environments, defending the cells against intrusive extracellular molecules [1,2]. However, it is difficult to study a simple functional process on the membranes both in vivo and in vitro because of the complexity of the membranes. Fortunately, many artificial membranes with precisely controlled composition, especially the lipid vesicles, can be used as models of plasma membranes [3,4]. For example, it was found that the malfunction of natural Cl ion transport systems on the cell membranes may lead to some diseases, such as cystic fibrosis, Barton’s syndrome and myotonia. Saha et al. developed a new selective Cl ion carrier (bis(iminourea)) and investigated its functions on the large lipid vesicles, providing a valuable tool in investigating the role of ion transport in these diseases [5]. Jenkins et al. established a model of immune cell by utilizing giant lipid vesicle (GLV) embedded with some membrane proteins. They explored the interactions of T cells and mast cells with the membrane model [6].
The lipid vesicles used in these studies were the oil-free vesicles generated by hydration methods (also called swelling methods), such as the gentle hydration method (also called natural swelling method) or electroformation. When using the hydration methods, the vesicle formation efficiency is known to be affected by the medium composition [1,7,8]. In particular, it was found that the formation of lipid vesicles (especially GLVs) was suppressed by the presence of salts [7,8]. Because a physiological amount of ions is essential for the stability of proteins and membranes and the interaction between them [1], this problem has bothered researchers for a long time.
In addition to salts, some nonelectrolytes were also involved in GLV formation. For example, highly concentrated sucrose solutions were usually used as growth mediums for GLV formation [9,10,11]. By diluting the solutions with an isoosmolar glucose solution after GLV formation, the phase contrast imaging of GLVs was facilitated by the mismatch in refraction index between the inside and outside of the GLVs [11]. Angelova and Dimitrov found that GLV formation was suppressed by the presence of high concentration of sucrose [12], as well as dextran [13], which were attributed to the buildup of an external osmotic pressure. However, the effects of these nonelectrolytes on GLV formation has not been specifically studied so far.
In 2017, in order to figure out how the presence of salt suppressed GLV formation, we designed and fabricated a miniaturized chip, and based on the miniaturized chip we investigated the effect of sodium chloride on the processes and results of lipid hydration [14]. We found that the presence of sodium chloride suppressed GLV formation mainly because the swelling and detachment of the lipid membranes were suppressed under a stronger hydrophobic repulsion. Based on this conclusion, in 2019 we treated the chip for GLV preparation with oxygen plasma to make the chip hydrophilic, removing the hydrophobic shelter of the lipids. This operation promoted the swelling and detachment of the lipid membranes, thus promoting GLV formation [15].
In this work, using the same method as that in reference [14], we investigated how the lipid hydration and GLV formation would be influenced by the presence of several nonelectrolytes that commonly appeared in physiological conditions and laboratories, including sucrose, glucose, sorbitol and ethanol. These molecules also play important roles in life activities. For example, the sugars and sugar alcohols are found to be able to stabilize the structure and functionality of biomembranes under extreme conditions such as heat, cold, drought, or chemical stressors [16,17,18,19,20]. Accumulating high concentrations of sugars in the cells was important for seeds and other anhydrous plant forms to survive the withdrawal of water [21]. Since these molecules usually do not exist alone but coexist with other molecules or ions whether in the vesicle preparation or in the living body [22], we also investigated the effects of their coexistence with sodium chloride on GLV formation. We expect that this work could also provide suggestions for the efficient formation of GLVs.

2. Materials and Methods

2.1. Materials

L-α-phosphatidylcholine (1,2-diacyl-sn-glycero-3-phosphocholine, PC, 14–23%) and fluorescent dye (DiI,1,10-dihexadecyl-3,3,30,30-tetramethylindocarbocyanie perchlorate, ex/em: 549/564 nm, ≥98%) were purchased from Sigma-Aldrich (Saint Louis, MO, USA). The sucrose (≥99%), glucose (≥99%) and ethanol (AR) were purchased from Sinopharm Chemical Reagent Co., Ltd. (Shanghai, China); and D-Sorbitol (≥98%) was purchased from Sigma-Aldrich (Saint Louis, MO, USA). Sodium chloride and ether (AR) were purchased from Dongfang Huabo (Chongqing, China), and polydimethylsiloxane (PDMS) was purchased from Dow Corning (Midland, TX, USA).

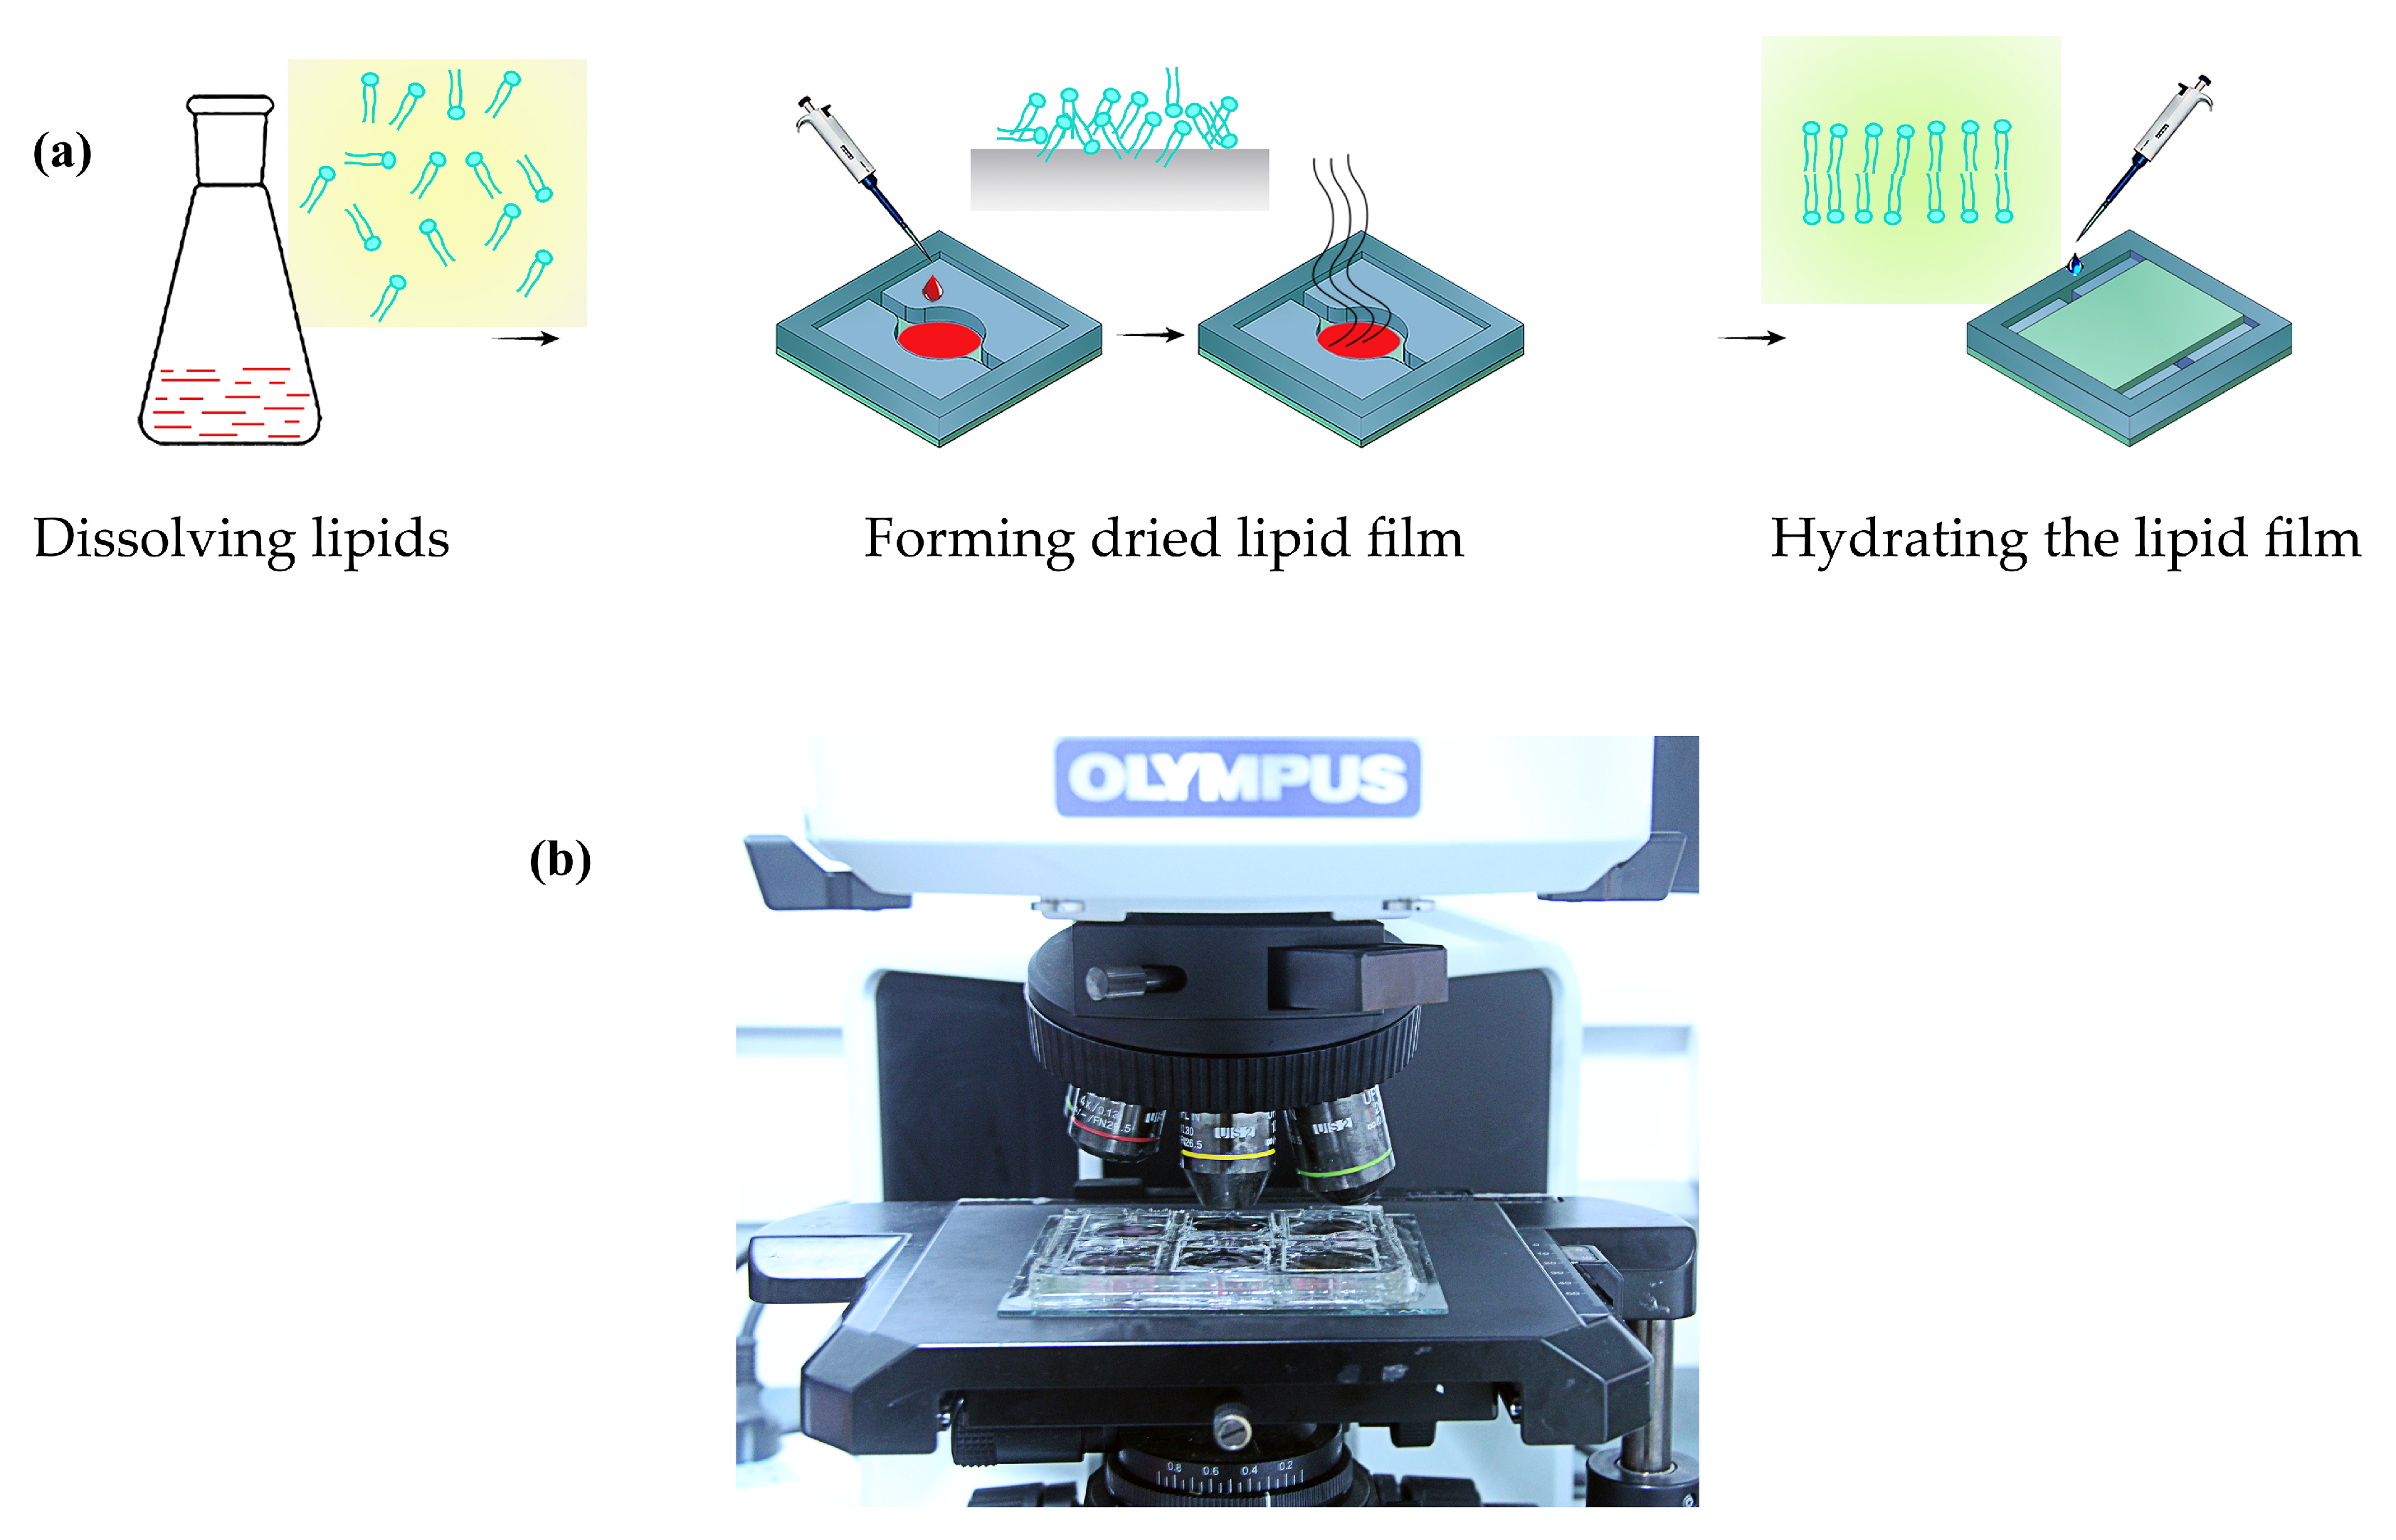
2.2. The Experimental Method

As shown in Figure 1, the chip consisted of six miniaturized cells which allowed six groups of experiments to be carried out at the same time. The experimental processes are schematically shown in Figure 1a. In short, 40 mg lipids were dissolved in ether, and 30 μL fluorescent dye was added for labeling, resulting in the lipid concentration of 4 mg/mL and lipid/fluorescent dye mass ratio of 99.5:0.5. Then, 40 μL of the organic solution was gently dripped into the central regions of the cells, avoiding the organic solution spreading to the side walls of the cells at the same time. In order to decrease the influence of the airflow, a lid was put on the chip to make the organic solvent gently evaporate. Then, the chip was placed in vacuum for 4 h to remove the organic solvent completely, and dried lipid films were formed on the substrates of the cells. After that, six glass slips were fixed on the top of the cells, and the chip was transferred to the fluorescence microscope. The aqueous solution dissolved with the specific nonelectrolyte was then gently added to the cells from the inlets, and the contents of these nonelectrolytes were increased until significant changes to the results were observed so that the clear trend of their effect can be obtained. Aided by the microscope, the dynamic process of the lipid hydration and the GLV formation can be observed.

2.3. Calculation of the Relative Fluorescence Intensity and the Relative Membrane Continuity

After sufficiently hydrating the dried lipids for 4 h, the fluorescence images under the same time of exposure were obtained and analyzed in MATLAB software (MathWorks, MATLAB R2018b, Natick, MA, USA). Due to the “coffee ring” effect, the fluorescence images were selected from both the center area and the edge area of each group for calculating the fluorescence intensity and the membrane continuity. The relative fluorescence intensity and the relative membrane continuity were obtained by dividing the experimental values by the values of the control group (in pure water) on the same chip. By repeating the experiments and using the same calculating method, several sets of values of the relative fluorescence intensity and relative membrane continuity were obtained for plotting. Both the fluorescence intensity and membrane continuity were calculated based on the grayscale value of the images. The process of getting the set of data of one chip is as follows.
First, choose a proper threshold value of the images from the same chip by the mat file named “get_threshold.m” (see “Supplementary Material”), as shown in Figure 2. Second, calculate the average fluorescence intensity and the average membrane continuity of each chamber by the mat file named “get_fluorescence_intensity_continuity.m” (see “Supplementary Material”). In the mat file, the fluorescence intensity i = g s p , where g are the grayscale values that are greater than the threshold value and s p is the sum of the pixels with grayscale values greater than the threshold value; the membrane continuity c = s p s , where s is the total pixels of the image. Third, collect these values (the average fluorescence intensity and the average continuity) into an Excel file. Finally, divide the experimental values by the values of the control group (in pure water) to obtain the relative fluorescence intensities and the relative membrane continuities.

3. Results

3.1. The Effects of Sucrose, Glucose and Sorbitol

Figure 3 shows the fluorescence results of lipid hydration in solutions with different concentrations of sucrose and those when the sucrose coexisted with 50 mM sodium chloride (the NaCl/water molar ratio is 0.09%). As shown in Figure 3a, the presence of sucrose promoted the swelling and detachment of the lipid membranes, thus promoting the GLV formation, which was opposite to the effect of sodium chloride [14]. At high sucrose concentrations, the supported lipid membranes and GLVs were dragged by the water flow generated by adding aqueous solution and moved with it (indicated by the arrows in Figure 3a), and they were even detached from the substrate and dispersed in the solutions, which made the GLVs difficult to count. Moreover, glucose and sorbitol showed almost the same effects as sucrose on lipid hydration and GLV formation, similar to the results of Nagle et al. [23]. Therefore, the fluorescence results of glucose and sorbitol were not specified here.
The presence of these three nonelectrolytes increased the viscosity of the system, and this was the most noticeable characteristic that has never been observed when salts were used. In order to explain this phenomenon, we proposed a possible interaction that might occur at the solution/lipid interface as shown in Figure 3c and described in detail in the discussion. We suggested that the sugars could bridge the phases of lipids and solution tightly (we categorize sorbitol as sugar temporarily). As a result, the hydrodynamic force on the lipid phase was enhanced, and the enhanced force dragged the lipid membrane to move with the fluid flow.
Addition of a small amount of sodium chloride to the solutions rapidly suppressed the swelling and detachment of the lipid membranes, thus suppressing GLV formation. As shown in Figure 3b, in mixed solutions containing both 50 mM NaCl (NaCl/water molar ratio is 0.09%) and different concentrations of sucrose, the membranes became stable and attached to the substrate firmly from beginning to end. No GLVs were formed under such conditions. These results suggested that the effect of sodium chloride on lipid hydration and GLV formation was much stronger than that of sugars. Although the effects of the sugars were severely covered by the presence of sodium chloride, their specific effect on lipid hydration was still apparent at high concentrations. Namely, the supported lipid membranes were dragged by the water flow and moved with it (indicated by the arrows in Figure 3b).
In addition, in order to gain an insight into how the sugars affect GLV formation at molecular level, we calculated the relative fluorescence intensity of the swelled membranes, that is, the ratio of the average fluorescence intensity of the membranes formed in sugar solution and that formed in pure water on the same chip and in the same experiment. Figure 4 shows the dependence of fluorescence intensity of the swelled membranes on the contents of sodium chloride and sugars. It was found that the fluorescence intensity of the swelled membranes increased with increasing sodium chloride concentration with NaCl/water molar ratio in the range of 0 to 0.4% (NaCl molar concentration within 0–200 mM). Because Na+ ions were the well-known kosmotropic ions, their presence compressed the water structure in the hydration shells similar to exerting a pressure on the water, increasing the local density of the water [24,25,26,27]. Therefore, the binding of Na+ ions with the phosphate groups and carbonyl groups of lipid molecules [28,29] may also increase the local density of lipid molecules compared with the binding of water molecules, resulting in an enhanced hydrophobic association among the lipid tails because of small interspaces among the tails and resulting in a higher local density of the hydrophobic fluorescence probes because they were just embedded among the lipid chains. This may be the reason that the fluorescence intensity of the swelled membranes increased with increasing sodium chloride concentration.
Although the sugars exhibited the effects on lipid hydration opposite to that of sodium chloride (i.e., promoting the membrane swelling and detachment), their presence did not influence the fluorescence intensity of the lipid membranes (Figure 4b). This was consistent with the previous studies by other researchers in which the packing of the lipid chains was shown to be not influenced by the presence of sugars [30,31,32,33]. Same as what we observed, the sucrose, glucose, and sorbitol showed no obvious different effects on the fluorescence intensity of the swelled membranes (Figure 4b).

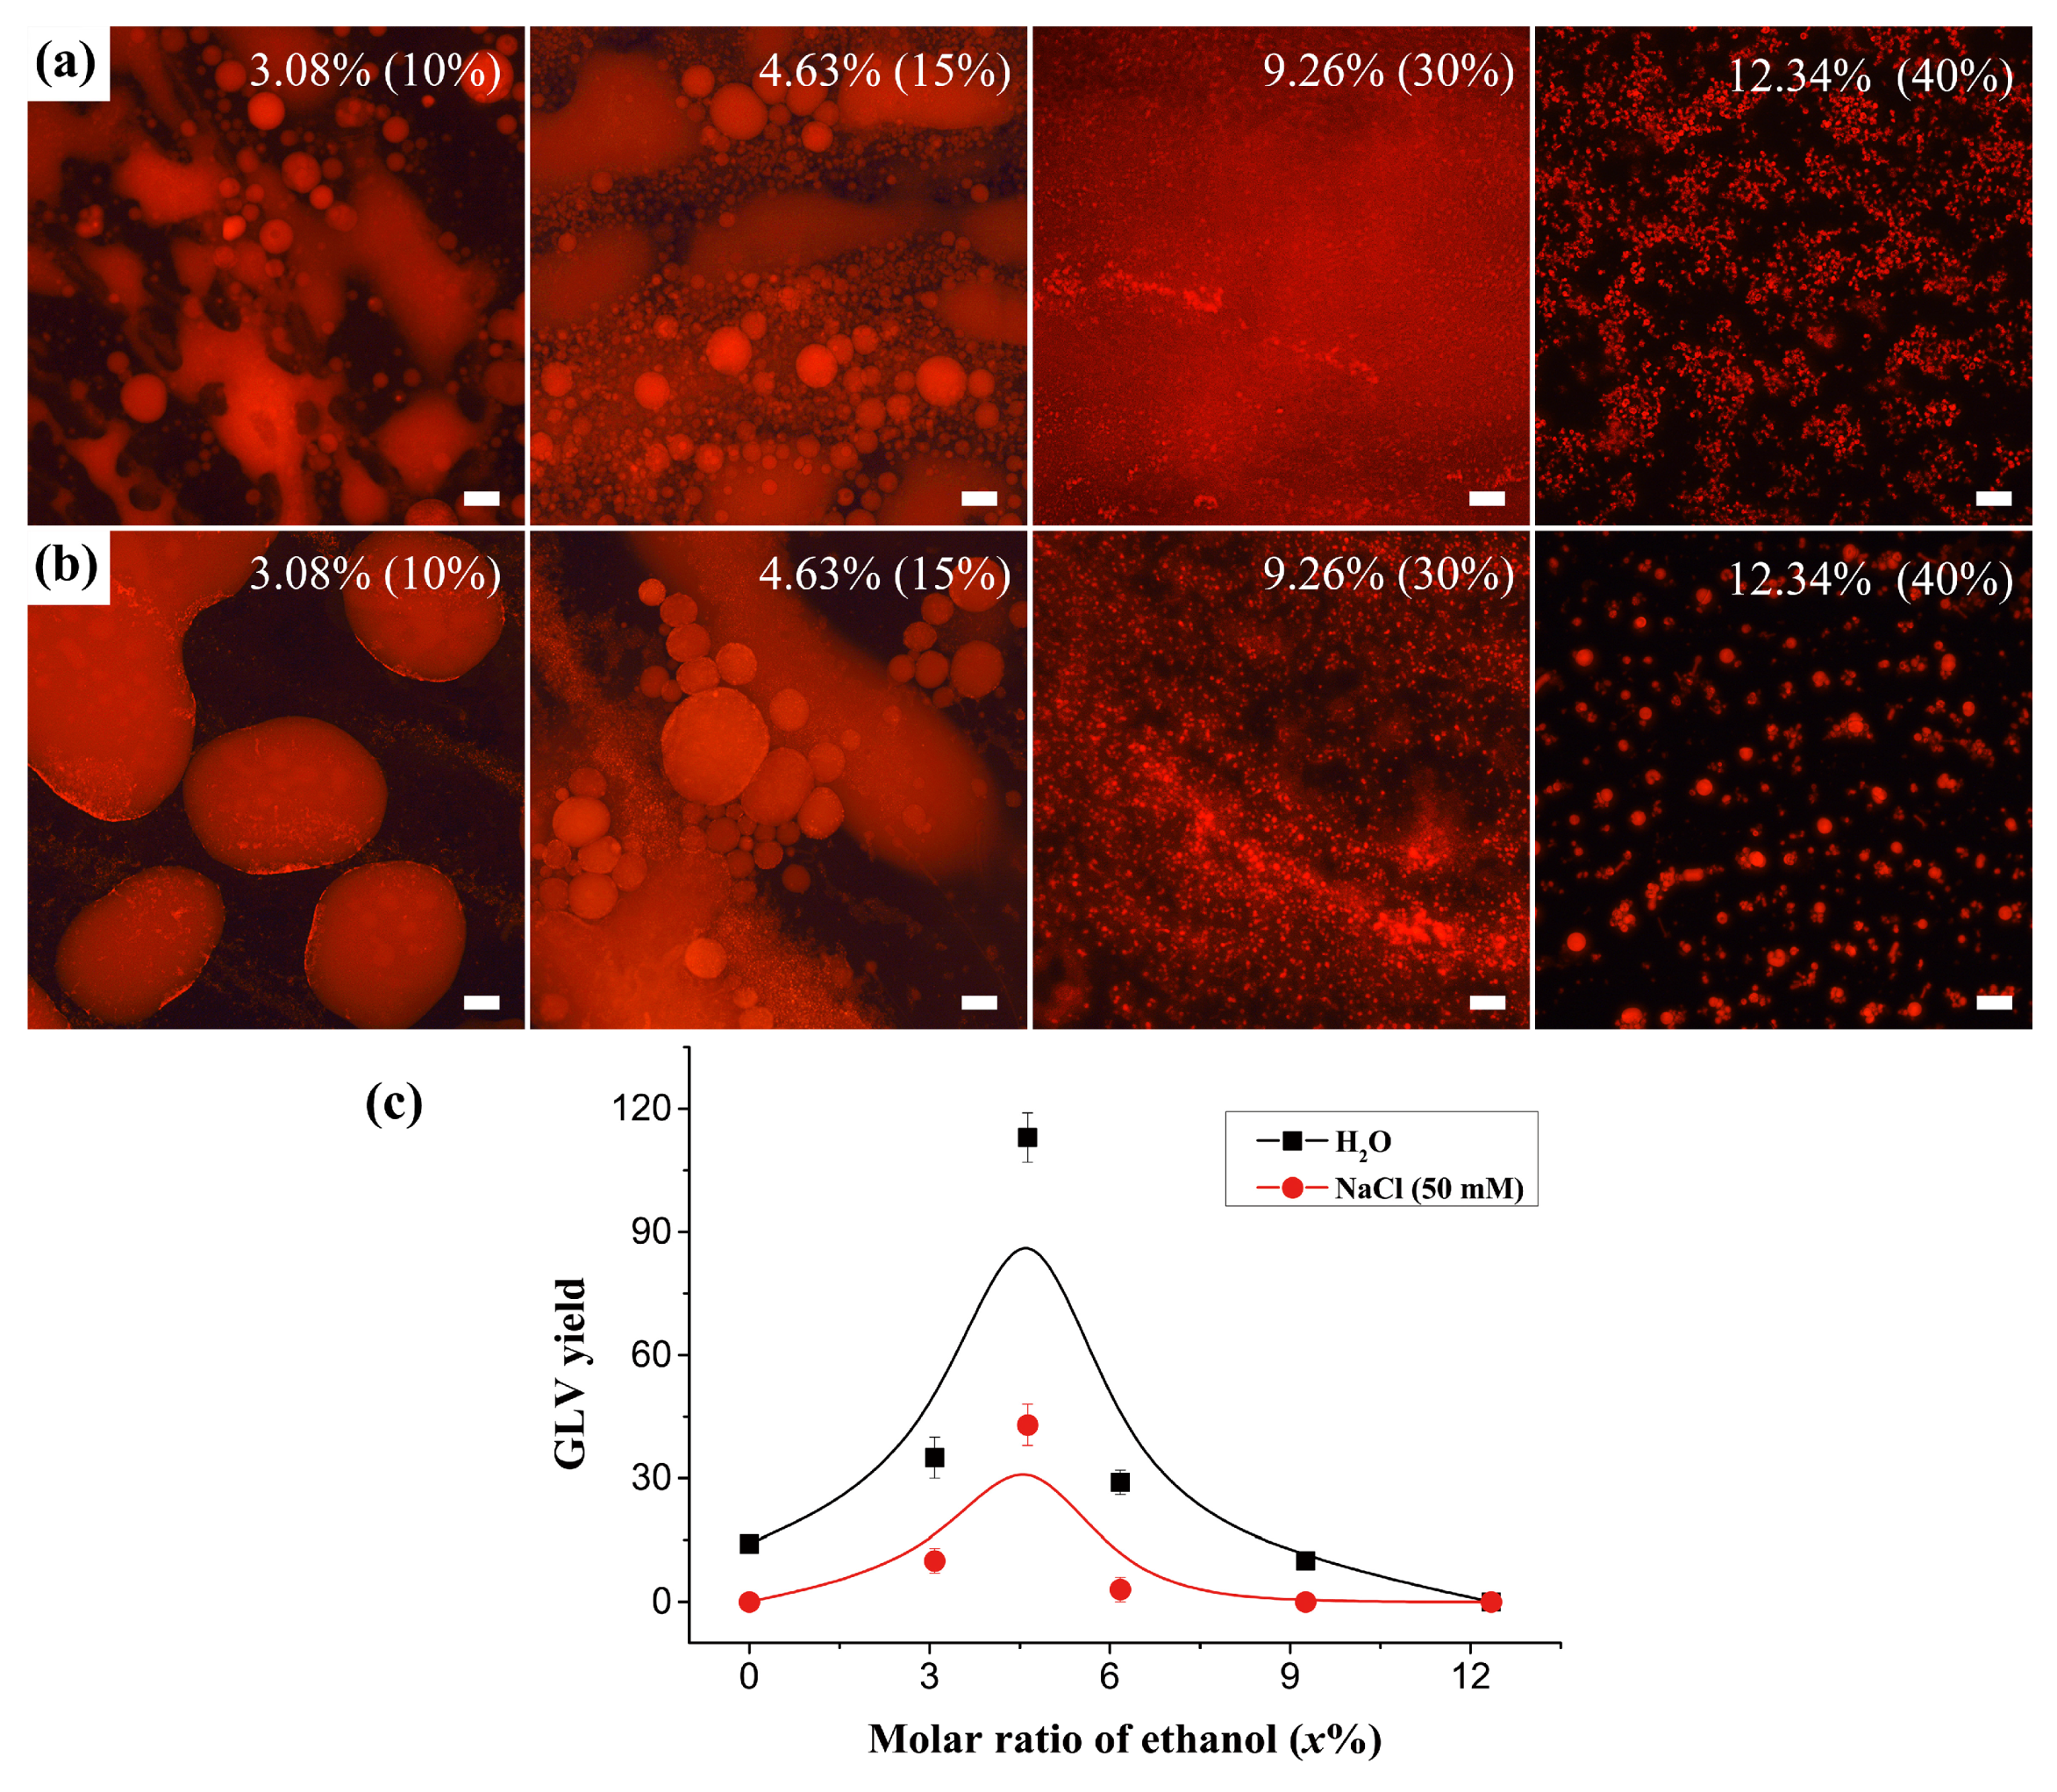
3.2. The Effect of Ethanol

Figure 5 shows the hydration results in ethanol solutions and those in NaCl/ethanol mixed solutions. It was found that the presence of ethanol promoted the membrane swelling both in pure water (Figure 5a) and 50 mM NaCl solution (Figure 5b). In addition, the fusion among the membranes was suppressed, resulting in promotion of GLV formation in solutions with ethanol/water molar ratio in the range of 0 to 5% (ethanol volume fraction within 0–20%). However, when the ethanol/water molar ratio was larger than 5% (ethanol volume fraction at 20%), the GLV yield decreased and the lipids were present as sparse and disordered membranes. When the ethanol/water molar ratio increased to 12% (ethanol volume fraction at 40%), the lipids were present as completely separated clustered complexes in the case of pure water (Figure 5a) and granular complexes in the case of 50 mM NaCl solution. This suggested that the lipids packed more tightly when sodium chloride was present in the solution. The lipid membranes had no sign of disturbance dragged by the water flow. Figure 5c shows the GLV yield as a function of the ethanol content after 4 h. It can be found that the addition of sodium chloride decreased the GLV yield but did not influence the effect of ethanol on GLV formation.
Figure 6 shows the hydration processes of lipids in salt solution (50 mM sodium chloride) and ethanol solution (ethanol volume fraction at 40%). They exhibited the opposite processes. In NaCl solution, separated lipid membranes were formed first, which continually fused later and finally resulted in a huge membrane (Figure 6a). However, in ethanol solution, the lipid film were sharply split, resulting in many clusters (Figure 6b), which was the direct evidence that the hydrophobic association among the lipid chains was destroyed by the presence of ethanol [34]. The lipids are able to self-assemble into ordered structures (monolayer and bilayer) because of their specific amphiphilicity. Therefore, we may speculate that the amphiphilicity of the lipid molecules has been changed by the presence of ethanol, causing the failure of GLV formation in solution with high content of ethanol (Figure 5).
Figure 7 shows the relative fluorescence intensity and relative continuity of the swelled lipid membranes as a function of ethanol content. As shown in Figure 7a, the relative fluorescence intensity decreased with the increase of ethanol content. Apart from the relative fluorescence intensity, we also calculated the membrane continuity, as shown in Figure 7b. The membrane continuity first increased, which was due to the promotion of membrane swelling within this region. However, when the ethanol molar ratio was larger than 6% (ethanol volume fraction at 20%), the membrane continuity decreased rapidly, suggesting that the hydrophobic association among the lipid tails may be severely disrupted. In addition, one can see that although the sodium chloride and the ethanol affected the lipid hydration in the opposite way (Figure 6), the presence of sodium chloride did not influence the effect of ethanol on lipid hydration (Figure 7) and also GLV formation (Figure 5c).
In addition, by comparing the results of the sugars and ethanol, it was found that a larger amount of ethanol than sugars was needed to induce recognizable change of the lipid membranes (0.36% for sucrose and 3.08% for ethanol as shown in Figure 3 and Figure 5), and the sugars were more efficient in promoting GLV formation than ethanol. Therefore, the sodium chloride, sugars and ethanol affected lipid hydration and GLV formation following the order of sodium chloride > sugars > ethanol. GLV formation was suppressed by the presence of sodium chloride but promoted by the presence of sugars and ethanol with ethanol volume fraction in the range of 0–20%.

4. Discussion

Although the effects of sugar and ethanol on GLV formation have not been specifically investigated so far, studies on sugar-membrane interaction [17,19,20,35,36,37,38,39,40,41,42,43] and alcohol-membrane interaction [2,44,45,46,47,48,49] have been widely reported which could provide us a lot of valuable information. After extensively reading the literature, we attempt to analyze our results at molecular level to provide some possible explanations.
Both experiments and computer simulations showed that sugar can preferentially form hydrogen bonds with the lipid molecule [30,31,32,33]. It was usually believed that the preferential interaction occurred between the hydroxyl hydrogens of sugar and the phosphate group and carbonyl groups of lipid [31,34,50,51]. However, the results of Leekumjorn and Sum showed that strong interaction also existed between the sugar hydroxyl and the NH3 group of DPPE [32]. Sugar also formed hydrogen bonds with the methyl groups from the choline moiety, since the methyl groups were substantially acidified by the electron-withdrawing effect of quaternary nitrogen [49]. Based on this, we could speculate that the electron-withdrawing ability of hydroxyl oxygen also resulted in increase of the nucleophilicity of the hydroxyl oxygen in the same way. The electronegativity between the hydroxyl oxygen and hydroxyl hydrogen decreased, resulting in decrease of the electrophilicity of the hydroxyl hydrogen compared with that of water molecule.
Therefore, the preferential interaction between the sugar hydroxyl and lipid molecule should occur at the positively charged sites (choline moiety of PC molecule or NH3 group of PE molecule), as shown in Figure 8. In fact, the results of Cacela et al. have confirmed this point. They found that parts of the sugar hydroxyls established weaker interactions with the C=O and P=O groups than that of water, but had similar interaction with the choline groups to that of water (we think it may be stronger) [49]. In addition, the rest of the sugar hydroxyls strongly interacted with the water molecules (Figure 8), leading to increase of the interfacial viscosity (η) between the aqueous solution and the lipid membranes, thus increasing the hydrodynamic force on the membrane ( F H D ), as seen from the following equation. F H D was the sum of the pressure ( p ) and the viscous forces on the lipid phase exerted by the hydrodynamic flows [50].
F H D = n · ( p I + η ( u ) )
where n is the normal vector to the membrane surface, I and u are the unit vector and the velocity, respectively. The enhanced F H D promoted the swelling of the lipid membranes, and even drove the membranes moving with the water flow, as shown in Figure 3. Since the water molecules had stronger interactions with the C=O and P=O groups which were adjacent to the lipid chain than the sugar molecules, it was the water molecules, rather than the sugar molecules, which interacted with the C=O and P=O groups in sugar solution. Therefore, the packing of the lipid chains was not influenced by the presence of sugar (Figure 4).
With regard to the effect of sodium chloride, as stated above, Na+ ion was the well-known kosmotropic ion and its presence compressed the water structure in the hydration shells similar to exerting a pressure on the water, increasing the local density [24,25,26,27]. The same situation may also apply to the interaction between the Na+ ions and the lipid molecules [25,26,51]. The Na+ ions bridge the lipid molecules more closely than water molecules because of the larger charge density of Na+ ions [43,51]. The interspaces among the lipid tails thus decreased and the van der Waals attractions among them increased, resulting in tighter packing of the lipid tails and higher fluorescence intensity of the swelled lipid membranes in the experiments.
With regard to the effect of ethanol, the hydrophobic association between the lipid chains was found to be disrupted by the presence of ethanol, which was also observed in other studies and should be attributed to the effect of the ethyl groups of ethanol molecules [34]. As shown in Figure 8, they may interact with the nonpolar chains of the lipid molecules under hydrophobic force and VDW force [52], resulting in an increase of the hydrophilicity of the lipid molecules. The hydration of the lipids was thus facilitated, as well as the membrane swelling.
In summary, the sodium chloride affected the lipid hydration and GLV formation mainly through the interaction between Na+ ion and the negatively charged site of lipid molecule, whereas ethanol molecule affected the lipid hydration and GLV formation mainly through the interaction between the ethyl group and the lipid chain. Their binding sites on the lipid molecules were different. This may be the reason that the presence of sodium chloride in ethanol solution did not influence the effect of ethanol on lipid hydration (Figure 7). The sugars affected the lipid hydration and GLV formation mainly through the interaction between the sugar hydroxyls and the positively charged site of lipid molecule. In addition, no remarkable difference was observed among the effects of sucrose, glucose and sorbitol on lipid hydration, which may suggest that these three molecules interact with the lipid molecules in a linear way.

5. Conclusions

This work investigated the effect of several nonelectrolytes (sucrose, glucose, sorbitol and ethanol) on GLV formation, as well as the cases when they were coexisting with sodium chloride. The presence of sugars (sucrose, glucose and sorbitol) was found to increase the hydrodynamic force on the lipid membranes, thus promoting GLV formation. The participation of sodium chloride in sugar solution stabilized the lipid membranes and made the membranes able to bear the enhanced hydrodynamic force. A small amount of ethanol in the medium also promoted GLV formation, while a large amount of ethanol caused the hydrophobic association among the lipids to be disrupted severely, causing the failure of GLV formation. The sodium chloride and the ethanol showed totally opposite effects on lipid hydration, but the presence of sodium chloride in ethanol solution did not change the effect of ethanol on lipid hydration and GLV formation. This was attributed to their different binding sites on the lipid molecules.
These results may provide some suggestions for the efficient preparation of GLVs. However, how the interaction between the ethanol hydroxyl and the lipid molecule influenced the GLV formation was not recognized in this work and may be investigated in the future.

Supplementary Materials

The following are available online at https://0-www-mdpi-com.brum.beds.ac.uk/article/10.3390/pr9060945/s1, get_threshold.m: the mat file for getting the threshold, get_fluorescence_intensity_continuity.m: the mat file for getting the fluorescence intensity of membrane and the membrane continuity.

Author Contributions

Conceptualization, J.L. and J.Y.; funding acquisition, N.H. and J.Y.; methodology, Q.W.; validation, Q.Q., J.H., K.T., S.Z. and K.S.; writing—original draft, Q.W.; writing—review & editing, J.Y. All authors have read and agreed to the published version of the manuscript.

Funding

This research was funded by the National Natural Science Foundation of China (Nos. 32071408, 21827812 and 81871450), Natural Science Foundation of Chongqing (Nos. cstc2018jcyjAX0389, stc2020jcyj-msxmX0680, and cstc2019jcyj-bshX0006), and project of science and technology research program of Chongqing Education Commission of China (No. KJQN201903312).

Institutional Review Board Statement

Not applicable.

Informed Consent Statement

Not applicable.

Data Availability Statement

Not applicable.

Conflicts of Interest

The authors declare no conflict of interest.

References

  1. Stein, H.; Spindler, S.; Bonakdar, N.; Wang, C.; Sandoghdar, V. Production of Isolated Giant Unilamellar Vesicles under High Salt Concentrations. Front. Physiol. 2017, 8, 63. [Google Scholar] [CrossRef] [Green Version]
  2. Dickey, A.N.; Faller, R. How Alcohol Chain-Length and Concentration Modulate Hydrogen Bond Formation in a Lipid Bilayer. Biophys. J. 2007, 92, 2366–2376. [Google Scholar] [CrossRef] [Green Version]
  3. Jørgensen, I.L.; Kemmer, G.C.; Pomorski, T.G. Membrane protein reconstitution into giant unilamellar vesicles: A review on current techniques. Eur. Biophys. J. 2017, 46, 103–119. [Google Scholar] [CrossRef]
  4. Fenz, S.F.; Sengupta, K. Giant vesicles as cell models. Integr. Biol. 2012, 4, 982–995. [Google Scholar] [CrossRef]
  5. Saha, A.; Akhtar, N.; Kumar, V.; Kumar, S.; Srivastava, H.K.; Kumar, S.; Manna, D. pH-Regulated anion transport activities of bis(iminourea) derivatives across the cell and vesicle membrane. Org. Biomol. Chem. 2019, 17, 5779–5788. [Google Scholar] [CrossRef]
  6. Jenkins, E.; Santos, A.M.; O’Brien-Ball, C.; Felce, J.H.; Wilcock, M.J.; Hatherley, D.; Dustin, M.L.; Davis, S.J.; Eggeling, C.; Sezgin, E. Reconstitution of immune cell interactions in free-standing membranes. J. Cell Sci. 2019, 132, jcs219709. [Google Scholar] [CrossRef] [PubMed] [Green Version]
  7. Pott, T.; Bouvrais, H.; Méléard, P. Giant unilamellar vesicle formation under physiologically relevant conditions. Chem. Phys. Lipids 2008, 154, 115–119. [Google Scholar] [CrossRef]
  8. Montes, L.-R.; Alonso, A.; Goñi, F.M.; Bagatolli, L.A. Giant Unilamellar Vesicles Electroformed from Native Membranes and Organic Lipid Mixtures under Physiological Conditions. Biophys. J. 2007, 93, 3548–3554. [Google Scholar] [CrossRef] [PubMed] [Green Version]
  9. Bi, H.; Yang, B.; Wang, L.; Cao, W.; Han, X. Electroformation of giant unilamellar vesicles using interdigitated ITO electrodes. J. Mater. Chem. A 2013, 1, 7125–7130. [Google Scholar] [CrossRef]
  10. Tsuji, G.; Sunami, T.; Ichihashi, N. Production of giant unilamellar vesicles by the water-in-oil emulsion-transfer method without high internal concentrations of sugars. J. Biosci. Bioeng. 2018, 126, 540–545. [Google Scholar] [CrossRef] [PubMed]
  11. Yamashita, Y.; Oka, M.; Tanaka, T.; Yamazaki, M. A new method for the preparation of giant liposomes in high salt concentrations and growth of protein microcrystals in them. Biochim. Biophys. Acta (BBA) Biomembr. 2002, 1561, 129–134. [Google Scholar] [CrossRef] [Green Version]
  12. Angelova, M.I. Liposome Electroformation. Perspect. Supramol. Chem. 2007, 81, 26–36. [Google Scholar] [CrossRef]
  13. Angelova, M.; Dimitrov, D.S. A mechanism of liposome electroformation. Trends Colloid Interface Sci. II 2007, 59–67. [Google Scholar] [CrossRef]
  14. Wang, Q.; Li, W.; Hu, N.; Chen, X.; Fan, T.; Wang, Z.; Yang, Z.; Cheney, M.A.; Yang, J. Ion concentration effect (Na+ and Cl−) on lipid vesicle formation. Colloids Surf. B: Biointerfaces 2017, 155, 287–293. [Google Scholar] [CrossRef] [PubMed]
  15. Fan, T.; Wang, Q.; Hu, N.; Liao, Y.; Chen, X.; Wang, Z.; Yang, Z.; Yang, J.; Qian, S. Preparation of giant lipid vesicles with controllable sizes by a modified hydrophilic polydimethylsiloxane microarray chip. J. Colloid Interface Sci. 2019, 536, 53–61. [Google Scholar] [CrossRef] [PubMed]
  16. Rudolph, A.S.; Crowe, R.J.H. Membrane stabilization during freezing: The role of two natural cryoprotectants, trehalose and proline. Cryobiology 1985, 22, 367–377. [Google Scholar] [CrossRef]
  17. Konov, K.B.; Leonov, D.V.; Isaev, N.P.; Fedotov, K.Y.; Voronkova, V.K.; Dzuba, S.A. Membrane–Sugar Interactions Probed by Pulsed Electron Paramagnetic Resonance of Spin Labels. J. Phys. Chem. B 2015, 119, 10261–10266. [Google Scholar] [CrossRef]
  18. Koynova, R.; Brankov, J.; Tenchov, B. Modulation of lipid phase behavior by kosmotropic and chaotropic solutes. Eur. Biophys. J. 1997, 25, 261–274. [Google Scholar] [CrossRef] [PubMed]
  19. Andersen, H.D.; Wang, C.; Arleth, L.; Peters, G.H.; Westh, P. Reconciliation of opposing views on membrane–sugar interactions. Proc. Natl. Acad. Sci. USA 2011, 108, 1874–1878. [Google Scholar] [CrossRef] [PubMed] [Green Version]
  20. Takahashi, H.; Ohmae, H.; Hatta, I. Trehalose-induced destabilization of interdigitated gel phase in dihexadecylphosphatidylcholine. Biophys. J. 1997, 73, 3030–3038. [Google Scholar] [CrossRef] [Green Version]
  21. Caffrey, M.; Fonseca, V.; Leopold, A.C. Lipid-Sugar Interactions: Relevance to Anhydrous Biology. Plant Physiol. Mar. 1988, 86, 754–758. [Google Scholar] [CrossRef] [PubMed] [Green Version]
  22. Mikelj, M.; Praper, T.; Demič, R.; Hodnik, V.; Turk, T.; Anderluh, G. Electroformation of giant unilamellar vesicles from erythrocyte membranes under low-salt conditions. Anal. Biochem. 2013, 435, 174–180. [Google Scholar] [CrossRef] [PubMed]
  23. Nagle, J.F.; Jablin, M.S.; Tristram-Nagle, S. Sugar does not affect the bending and tilt moduli of simple lipid bilayers. Chem. Phys. Lipids 2016, 196, 76–80. [Google Scholar] [CrossRef] [Green Version]
  24. Marcus, Y. Effect of Ions on the Structure of Water: Structure Making and Breaking. Chem. Rev. 2009, 109, 1346–1370. [Google Scholar] [CrossRef]
  25. Mancinelli, R.; Botti, A.; Bruni, A.F.; Ricci, M.A.; Soper, A.K. Hydration of Sodium, Potassium, and Chloride Ions in Solution and the Concept of Structure Maker/Breaker. J. Phys. Chem. B 2007, 111, 13570–13577. [Google Scholar] [CrossRef] [PubMed]
  26. Imberti, S.; Botti, A.; Bruni, F.; Cappa, G.; Ricci, M.A.; Soper, A.K. Ions in water: The microscopic structure of concentrated hydroxide solutions. J. Chem. Phys. 2005, 122, 194509. [Google Scholar] [CrossRef]
  27. Botti, A.; Bruni, F.; Imberti, S.; Ricci, M.A.; Soper, A.K. Ions in water: The microscopic structure of concentrated NaOH solutions. J. Chem. Phys. 2004, 120, 10154. [Google Scholar] [CrossRef]
  28. Vácha, R.; Jurkiewicz, P.; Petrov, M.; Berkowitz, M.L.; Böckmann, R.A.; Barucha-Kraszewska, J.; Hof, M.; Jungwirth, P. Mechanism of Interaction of Monovalent Ions with Phosphatidylcholine Lipid Membranes. J. Phys. Chem. B 2010, 114, 9504–9509. [Google Scholar] [CrossRef] [PubMed]
  29. Vácha, R.; Siu, S.W.I.; Petrov, M.; Böckmann, R.; Barucha-Kraszewska, J.; Jurkiewicz, P.; Hof, M.; Berkowitz, M.L.; Jungwirth, P. Effects of Alkali Cations and Halide Anions on the DOPC Lipid Membrane. J. Phys. Chem. A 2009, 113, 7235–7243. [Google Scholar] [CrossRef]
  30. Skibinsky, A.; Venable, R.M.; Pastor, R.W. A Molecular Dynamics Study of the Response of Lipid Bilayers and Monolayers to Trehalose. Biophys. J. 2005, 89, 4111–4121. [Google Scholar] [CrossRef] [Green Version]
  31. Lambruschini, C.; Relini, A.; Ridi, A.; Cordone, L.; Gliozzi, A. Trehalose Interacts with Phospholipid Polar Heads in Langmuir Monolayers. Langmuir 2000, 16, 5467–5470. [Google Scholar] [CrossRef]
  32. Leekumjorn, S.; Sum, A.K. Molecular investigation of the interactions of trehalose with lipid bilayers of DPPC, DPPE and their mixture. Mol. Simul. 2006, 32, 219–230. [Google Scholar] [CrossRef]
  33. Villarreal, M.A.; Díaz, S.B.; Disalvo, E.A.; Montich, G.G. Molecular Dynamics Simulation Study of the Interaction of Trehalose with Lipid Membranes. Langmuir 2004, 20, 7844–7851. [Google Scholar] [CrossRef]
  34. Ma, C.D.; Wang, C.; Acevedo-Vélez, C.; Gellman, S.H.; Abbott, N.L. Modulation of hydrophobic interactions by proximally immobilized ions. Nat. Cell Biol. 2015, 517, 347–350. [Google Scholar] [CrossRef]
  35. Ricker, J.V.; Tsvetkova, N.M.; Wolkers, W.F.; Leidy, C.; Tablin, F.; Longo, M.; Crowe, J.H. Trehalose Maintains Phase Separation in an Air-Dried Binary Lipid Mixture. Biophys. J. 2003, 84, 3045–3051. [Google Scholar] [CrossRef] [Green Version]
  36. Fabrie, C.H.; De Kruijff, B.; De Gier, J. Protection by sugars against phase transition-induced leak in hydrated dimyristoylphosphatidylcholine liposomes. Biochim. Biophys. Acta (BBA) Biomembr. 1990, 1024, 380–384. [Google Scholar] [CrossRef]
  37. Zavaglia, A.G.; Tymczyszyn, E.; De Antoni, G.; Disalvo, E.A. Action of trehalose on the preservation of Lactobacillus delbrueckii ssp. bulgaricus by heat and osmotic dehydration. J. Appl. Microbiol. 2003, 95, 1315–1320. [Google Scholar] [CrossRef] [PubMed] [Green Version]
  38. Sun, W.; Leopold, A.; Crowe, L.; Crowe, J. Stability of dry liposomes in sugar glasses. Biophys. J. 1996, 70, 1769–1776. [Google Scholar] [CrossRef] [Green Version]
  39. Belton, P.S.; Gil, A.M. IR and Raman spectroscopic studies of the interaction of trehalose with hen egg white lysozyme. Biopolymers 1994, 34, 957–961. [Google Scholar] [CrossRef]
  40. Bryant, G.; Koster, K. Dehydration of solute–lipid systems: Hydration forces analysis. Colloids Surf. B Biointerfaces 2004, 35, 73–79. [Google Scholar] [CrossRef] [Green Version]
  41. Lenné, T.; Garvey, C.J.; Koster, K.; Bryant, G. Effects of Sugars on Lipid Bilayers during Dehydration—SAXS/WAXS Measurements and Quantitative Model. J. Phys. Chem. B 2009, 113, 2486–2491. [Google Scholar] [CrossRef]
  42. Kapla, J.; Wohlert, J.; Stevensson, B.; Engström, O.; Widmalm, G.; Maliniak, A. Molecular Dynamics Simulations of Membrane–Sugar Interactions. J. Phys. Chem. B 2013, 117, 6667–6673. [Google Scholar] [CrossRef] [PubMed]
  43. Bogaart, G.V.D.; Hermans, N.; Krasnikov, V.; de Vries, A.H.; Poolman, B. On the Decrease in Lateral Mobility of Phospholipids by Sugars. Biophys. J. 2007, 92, 1598–1605. [Google Scholar] [CrossRef] [Green Version]
  44. Manca, M.L.; Castangia, I.; Matricardi, P.; Lampis, S.; Fernàndez-Busquets, X.; Fadda, A.M.; Manconi, M. Molecular arrangements and interconnected bilayer formation induced by alcohol or polyalcohol in phospholipid vesicles. Colloids Surf. B Biointerfaces 2014, 117, 360–367. [Google Scholar] [CrossRef]
  45. Feller, S.E.; Brown, C.A.; Nizza, D.T.; Gawrisch, K. Nuclear Overhauser Enhancement Spectroscopy Cross-Relaxation Rates and Ethanol Distribution across Membranes. Biophys. J. 2002, 82, 1396–1404. [Google Scholar] [CrossRef] [Green Version]
  46. Cevc, G.; Löbbecke, L.; Nagel, N.; Vierl, U. Phospholipid-Alcohol Interactions: Effects of Chain-Length and Headgroup Variations. Phosphorus Sulfur Silicon Relat. Elem. 1996, 109, 285–288. [Google Scholar] [CrossRef]
  47. Wanderlingh, U.; D’Angelo, G.; Nibali, V.C.; Crupi, C.; Rifici, S.; Corsaro, C.; Sabatino, G. Interaction of alcohol with phospholipid membrane: NMR and XRD investigations on DPPC–hexanol system. Spectroscopy 2010, 24, 375–380. [Google Scholar] [CrossRef]
  48. Spector, M.S.; Selinger, J.V.; Schnur, J.M. Thermodynamics of Phospholipid Tubules in Alcohol/Water Solutions. J. Am. Chem. Soc. 1997, 119, 8533–8539. [Google Scholar] [CrossRef]
  49. Cacela, C.; Hincha, D.K. Low Amounts of Sucrose Are Sufficient to Depress the Phase Transition Temperature of Dry Phosphatidylcholine, but Not for Lyoprotection of Liposomes. Biophys. J. 2006, 90, 2831–2842. [Google Scholar] [CrossRef] [PubMed] [Green Version]
  50. Ziebert, F.; Lacoste, D. A Poisson–Boltzmann approach for a lipid membrane in an electric field. New J. Phys. 2010, 12, 095002. [Google Scholar] [CrossRef]
  51. Böckmann, R.; Hac, A.; Heimburg, T.; Grubmüller, H. Effect of Sodium Chloride on a Lipid Bilayer. Biophys. J. 2003, 85, 1647–1655. [Google Scholar] [CrossRef] [Green Version]
  52. Chong, Y.; Kleinhammes, A.; Tang, P.; Xu, Y.; Wu, Y. Dominant Alcohol–Protein Interaction via Hydration-Enabled Enthalpy-Driven Binding Mechanism. J. Phys. Chem. B 2015, 119, 5367–5375. [Google Scholar] [CrossRef] [PubMed] [Green Version]
Figure 1. The experimental processes (a) and experimental setup (b).
Processes 09 00945 g001
Figure 2. An example of choosing the threshold value of the images: (a) the fluorescence image of experimental result; (b) the distribution of the gray values on the line of image (a).
Processes 09 00945 g002
Figure 3. The hydration results of lipids in solutions with different content of sucrose (a); and that mixed solution containing both 50 mM NaCl and different concentrations of sucrose (b). The scale bars are 100 μm. The arrows represent the directions of the water flow. To compare with the results of ethanol, the sugar contents were expressed by sugar/water molar ratios, and the molar concentrations of sucrose were placed in the brackets. (c) The schematic diagram of the characteristic phenomenon caused by the presence of sugars.
Processes 09 00945 g003
Figure 4. The dependence of fluorescence intensity of the swelled membranes after hydration for 4 h on the concentration of sodium chloride (a) and on the concentration of sucrose, glucose, and sorbitol (b). The fluorescence images for (a) were proceeded on the data from our previous study [14].
Processes 09 00945 g004
Figure 5. The hydration results of lipids in solutions with different contents of ethanol (a); and those in mixed solutions containing both 50 mM NaCl and different contents of ethanol (b). To compared with the results of sugars, the ethanol contents were expressed by ethanol/water molar ratios, and the volume fractions of ethanol were placed in the brackets. The scale bars are 100 μm. (c) The dependence of GLV yield on the ethanol content after 4 h.
Processes 09 00945 g005
Figure 6. The hydration processes of lipids in 50 mM NaCl solution (a), and ethanol solution with ethanol volume fraction at 40% (b). The scale bars are 100 μm.
Processes 09 00945 g006
Figure 7. The dependence of the relative fluorescence intensity (a) and relative continuity (b) of the swelled membranes on the ethanol content after hydration for 4 h.
Processes 09 00945 g007
Figure 8. The schematic diagram of partition of ethanol, sugar, Na+ and Cl near the phosphatidylcholine molecules.
Processes 09 00945 g008
Publisher’s Note: MDPI stays neutral with regard to jurisdictional claims in published maps and institutional affiliations.

