
Impact of Bullwhip Effect in Quality and Waste in Perishable Supply Chain


1
Research Centre on Production Management and Engineering CIGIP, Camino de Vera s/n, 46022 Valencia, Spain
2
Department of Accounting, Autonomous University of Bucaramanga, Avenida 42 48-11, Bucaramanga 680003, Colombia
*
Authors to whom correspondence should be addressed.
Processes 2021, 9(7), 1232; https://0-doi-org.brum.beds.ac.uk/10.3390/pr9071232
Submission received: 18 May 2021
/
Revised: 21 June 2021
/
Accepted: 9 July 2021
/
Published: 16 July 2021
Abstract
:The bullwhip effect results from inefficiencies in the supply chain; in perishable products, the inefficiencies are quality in the supply chain and product waste. We carried out a literature review to determine the causes of the bullwhip effect and the supply chain’s quality factors of this phenomenon’s perishable products. Update the demand, the level of deterioration of the product, and the number of intermediaries is the causes of the bullwhip effect most investigated. On the other hand, the product’s safety and the quality of the information are the quality factors of the chain of supplies of perishable products more researched. Future research should address the causes of human behavior that affect the bullwhip effect in the perishable goods supply chain.
1. Introduction
The supply chain connects customers with distributors, manufacturers, and suppliers. During this process, their decisions increase or decrease the cost of operation and service level provided to the client. One of the phenomena that occur is the bullwhip effect, which presents an amplification of the variability of demand upstream of the supply chain [1].
In this process, we evidenced that four causes generate this phenomenon, such as (i) Processing of the Demand signal; (ii) Surplus-missing rational game; (iii) Batch Order; (iv) Price variations [2] proposed some solutions to the causes found, for example avoiding various sources of forecasts, agreeing appointments for merchandise delivery, automatic replenishment program or sharing sales data among others.
The causes that generate the bullwhip effect can be differentiated between operational and human [3]. Within the operational causes [4] indicates that the price of substitute products may increase or decrease the bullwhip effect. [5] proposes to reduce delivery time in seasonal demand-supply chains. The complexity of supply chain operations driven by globalization and the amount of information generated at all times. [6] proposes an information system that allows visualizing the entire supply chain, improving resource management and flexibility; however, this increases the supply chain’s complexity due to the amount of processed information. Although the bullwhip effect increased upstream of the supply chain, [7] shows that it is possible to manage the chain from suppliers, reducing the bullwhip effect, especially in commodities and semi-commodities.
When reviewing the bullwhip effect in perishable products, [8] indicates that research does not look at the level of waste, interaction with similar products, and impact over multiple periods. This process [9] states that it is better to focus on improving forecasting methods than clearly defining safety inventory.
Feeding more than seven billion people becomes an essential factor in guaranteeing food security; it is imperative to design operating models to reduce food waste [10].
This increase in the number of people in the world directs the gaze towards the loss and waste of food, directly affecting people’s nutrition [11]. This population increase can reach 1.7% per year, making it necessary to guarantee food availability and improve the supply chain’s effectiveness [12]. Ref. [13] shows us the interest of researchers in knowing the quality of the supply chain’s performance and the technological and logistical tools to identify these factors.
The research has three objectives: (1) to identify the variables that are causing the bullwhip effect in supply chains; (2) establish the factors that affect the quality of the perishables supply chain and (3) articulate those quality factors of the perishables supply chain, which may be impacting the bullwhip effect. Paper seeks to identify the variables of the bullwhip effect by researchers, the type of solution they have proposed for the perishables supply chain, and the variables and factors not investigated yet, which will serve as future framework research.
2. Bullwhip Effect
2.1. Search Equation Cases Bullwhip Effect
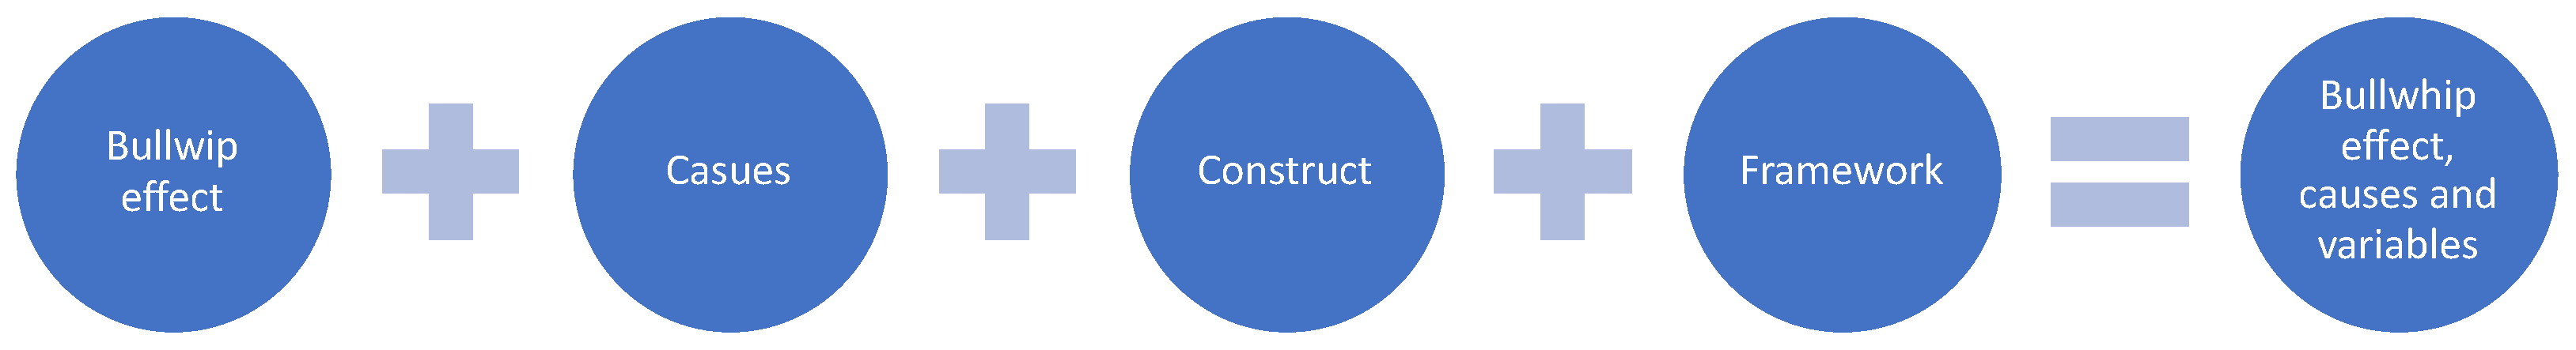
The search equation focused on the variables that cause the bullwhip effect. During the process, the article of [2], due to its importance in proposing the first factors that cause the bullwhip effect in supply chains, will show the most relevant causes of the bullwhip effect create a complete framework on the generators of this phenomenon. Figure 1 shows the structure of the keywords used.
We made a paper’s search using the figure’s 1 keywords in several databases (Web of science, Scopus, Taylor and Francis, MDPI and Wiley). After a carefully analysis of the papers found, 28 papers were used to derive the main variables, causes and effects of the bullwhip effect.
The supply chain becomes increasingly complex as technological development advances in the world. This complexity on the amount of information that those responsible for the supply chain must process [6]. This information makes supply chain management even more complex, and therefore the impact of the bullwhip effect. Ref. [2] raises the problem of the bullwhip effect as excess inventory upstream of the supply chain, one of the causes of losses of trillions of dollars and many days of inventory. This consequence of the bullwhip effect from operational causes and human behaviors [3] establishes that the operational causes are inherent to the same dynamics of the operation, while the causes of human behavior are inherent to the strategic interaction between two members of the supply chain.
The bullwhip effect can cause the expansion of demand upstream of the supply chain; it is evident that the possible causes of this are four: (1) processing of the demand signal, (2) excess-missing rational game, (3) size of the production order, and finally (4) variations in the price [1]. In the case of price variations, [4] proposes that the interaction between supply chains of substitute and complementary products may suffer an increase in the bullwhip effect due to the price coefficient and a slight variation in demand. Ref. [5] finds that many products have a seasonal demand behavior, the bullwhip effect increases in these cases when the lead time exceeds the demand cycle.
2.2. Causes Bullwhip Effect
Since ref. [2] established the four causes of the bullwhip effect: demand management, order batch, price variation, and the rational game of shortages; Other authors have emerged who have dared to make contributions on other possible causes of the bullwhip effect, as well as those that turn out to be more relevant. Ref. [14] stablish that causes bullwhip effect are similar in forward supply chain and closed-loop supply chain. Refs. [3,15] evidenced that the causes may be specific to human behavior and others specific to the operation, ref. [16] confirms that if decision makers understood the situation the face it, then made better decisions, and ref. [17] indicates that human attitude affect inventory factor. In the same way, it indicated that the causes proposed by [2] are part of the operation [3]. It added other causes of operations such as delivery time, inventory and supply policy, lack of synchronization, lack of perception of information, optimal operations without looking at the whole, company processes, and limited capacity, ref. [18] indicates that best way to solve bullwhip effect is ensure accuracy of information. On the other hand, the human causes included fear of running out of inventory, lack of training, and negligence when making decisions about orders.
Researchers like [5,19,20,21,22,23] indicate that demand management is a relevant factor when measuring the impact of the bullwhip effect. The seasonality of demand can cause sales promotions in periods of low demand; the variation in prices to boost sales can be another critical factor that increases the bullwhip effect. Refs. [4,14,19,24] indicate that price fluctuation amplifies orders upstream of the chain, in that order of ideas [17] indicates that the price variation is the most crucial cause of the bullwhip effect.
Regarding inventory and restocking policy, refs. [9,14,15] indicate that its control may become relevant to reduce the bullwhip effect. Refs. [6,17] they establish the lack of synchronization between the actors in the chain and the failure to share information as operational causes of the bullwhip effect, and ref. [25] ensures that information sharing reduces the influence of bullwhip effect [26] added more categories to the operational causes and found that the pressures caused by the commercial part of the company to meet sales goals and the number of actors in the supply chain and damage to production machines are additional factors that increase the whip effect.
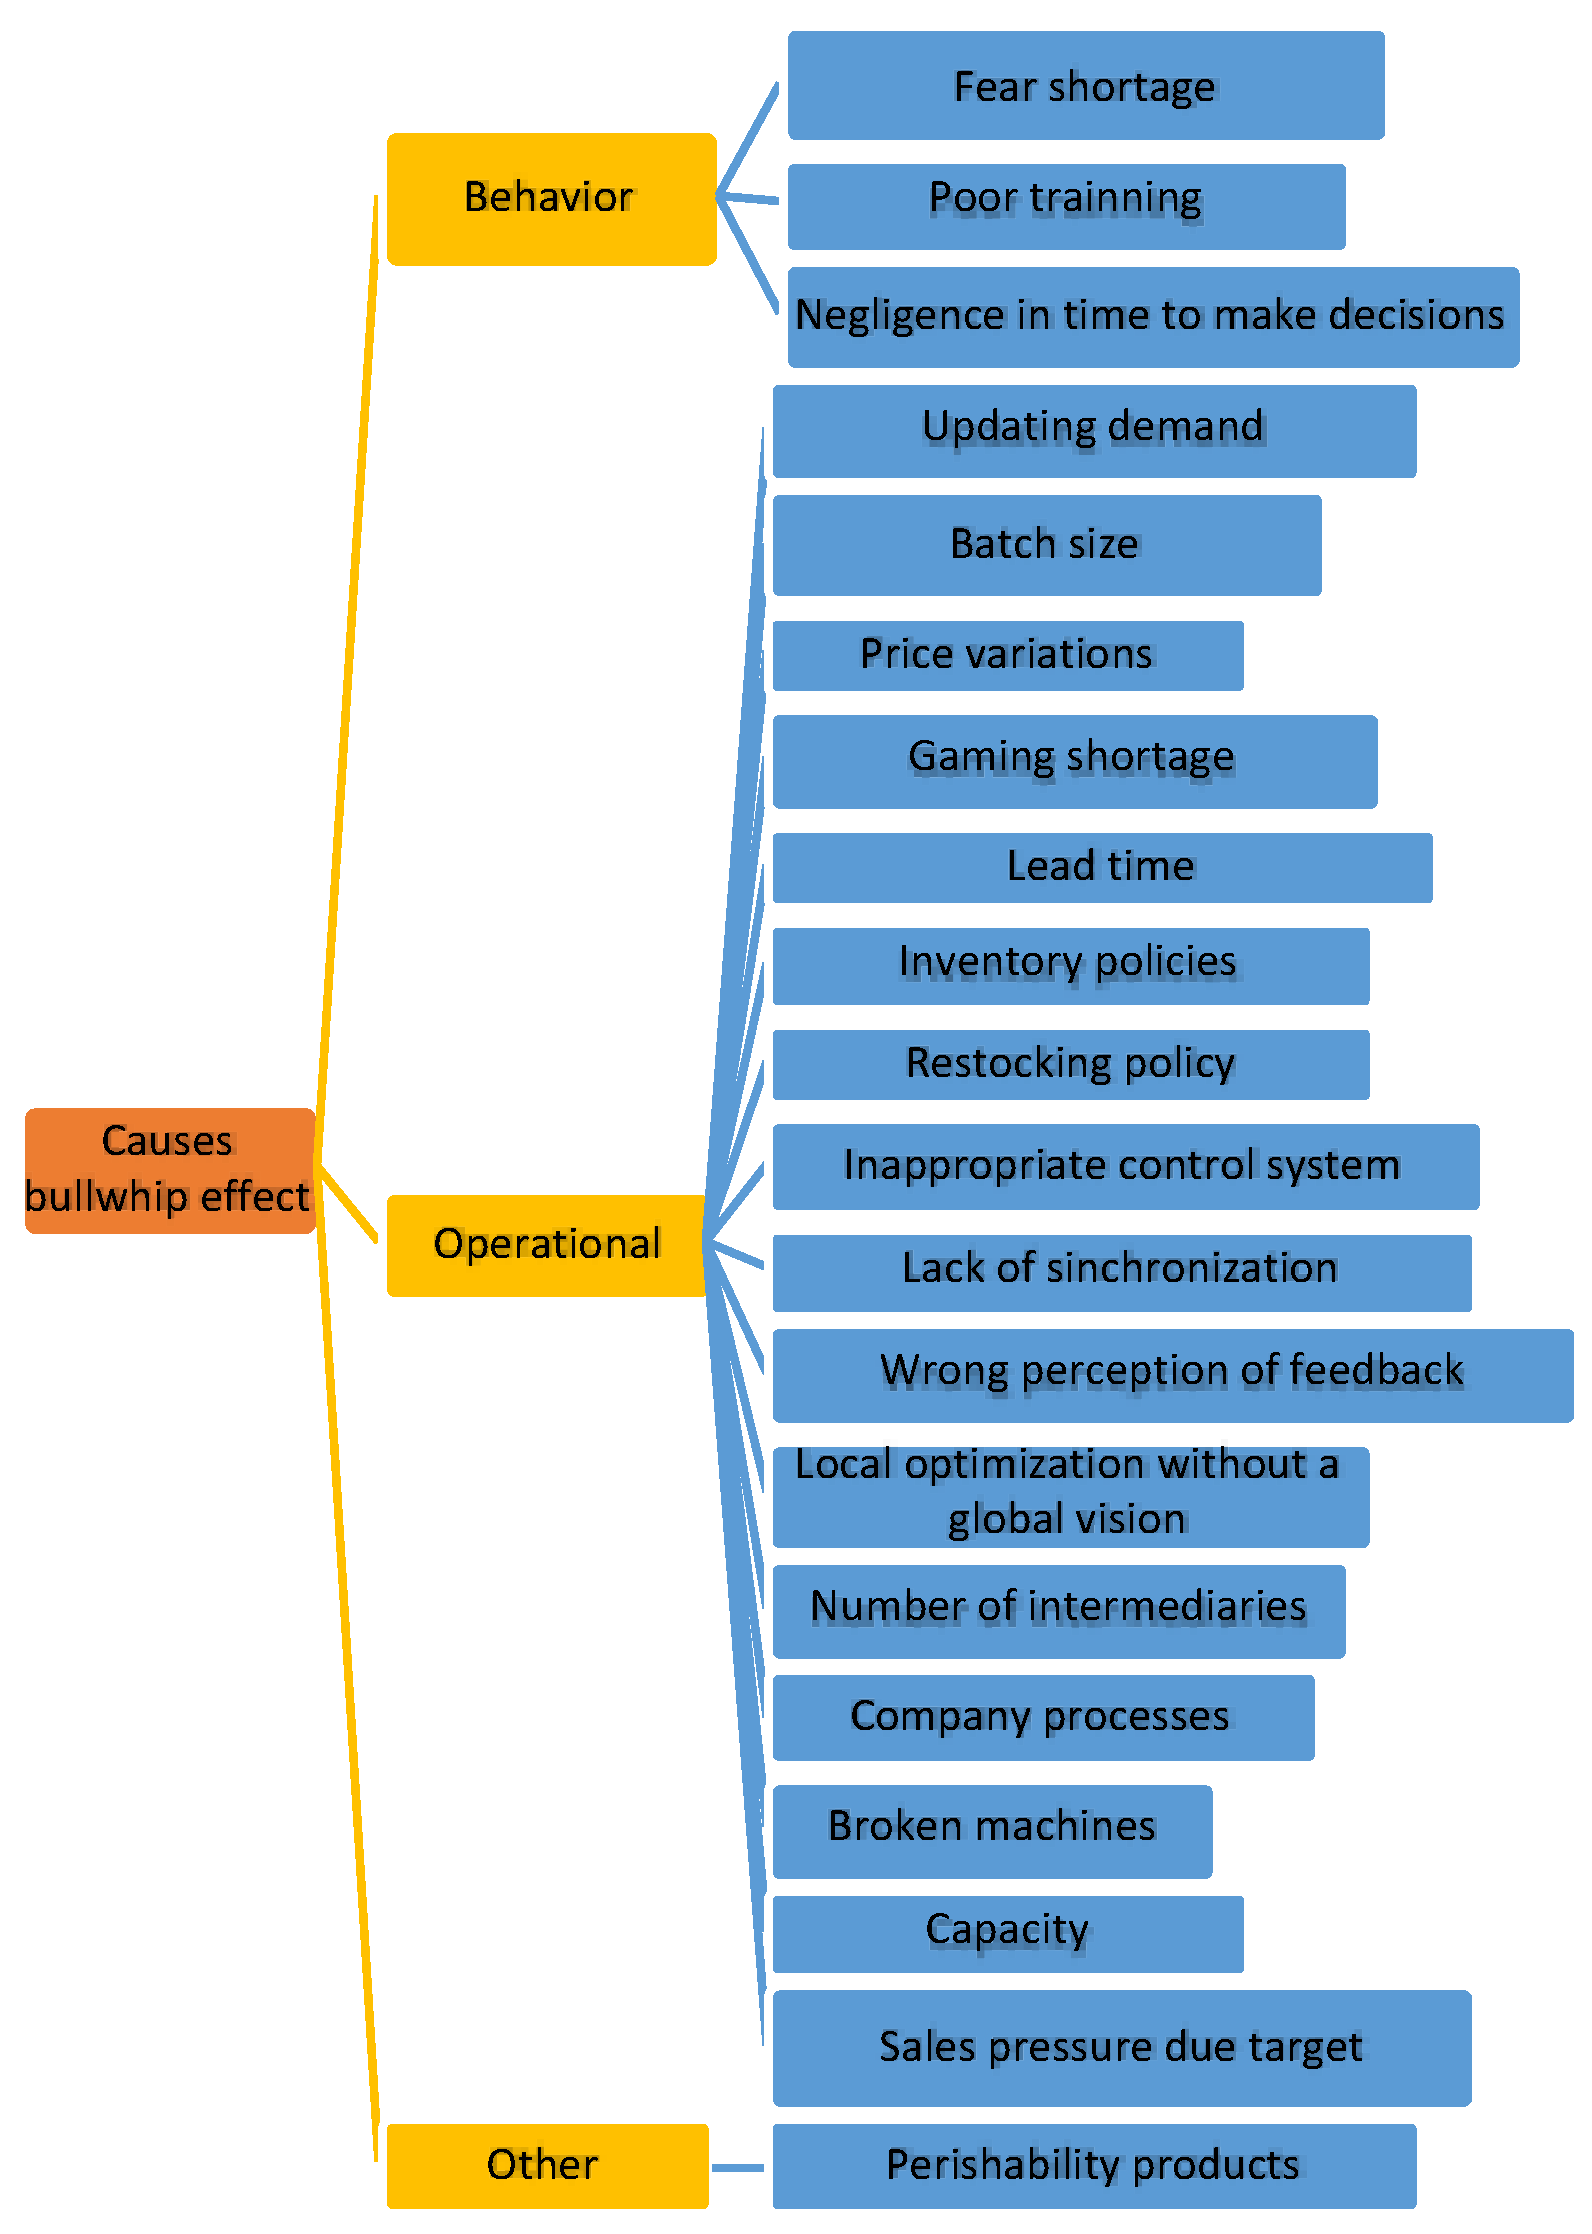
The bullwhip effect review references [2] and his postulate on the causes of the bullwhip effect. This classification complete with the characterization of the bullwhip effect proposed by [3], which involves behavioral and operational reasons. Ref. [26] makes contributions such as the breakdown of machinery and the number of intermediaries as other operational causes. [7] proposes a new cause such as the level of deterioration of the product, found in “other causes”—the structure of the bullwhip effect’s causes shown in Figure 2.
Table 1 shows the identification assigned to each cause of the bullwhip effect in the supply chain, as well as the research that support the cause of the bullwhip effect.
Since ref. [2] identified the first causes of the bullwhip effect: demand update, order lot size, price variation, and the rational game of shortages, other authors have wanted to investigate this phenomenon through the causes identified by [2], thus increasing the amount of research around these causes. Other causes of the bullwhip effect are not as prevalent in research because they have not been identified in recent years yet. In recent years, ref. [3] proposed the classification of the causes of the bullwhip effect between operations and behavior, followed [15] consolidating the causes of behavior and in the last year [19] broadens the classification of operational causes, including “machine breakdowns” and “pressure for sales compliance.” Although other causes of the bullwhip effect identified along the supply chain, researchers should investigate in greater depth to know the level of impact of the bullwhip effect. The characteristics of the supply chains that it affects, to a greater extent, the types of products that are more susceptible to this phenomenon, among others. The causes of the bullwhip effect identified in recent years are beginning to make their way among researchers. The increase in the number of causes of the bullwhip effect corroborates the interest in studying this supply chain phenomenon.
3. Perishable Products
3.1. Search Equation Quality Factors Perishable Supply Chain
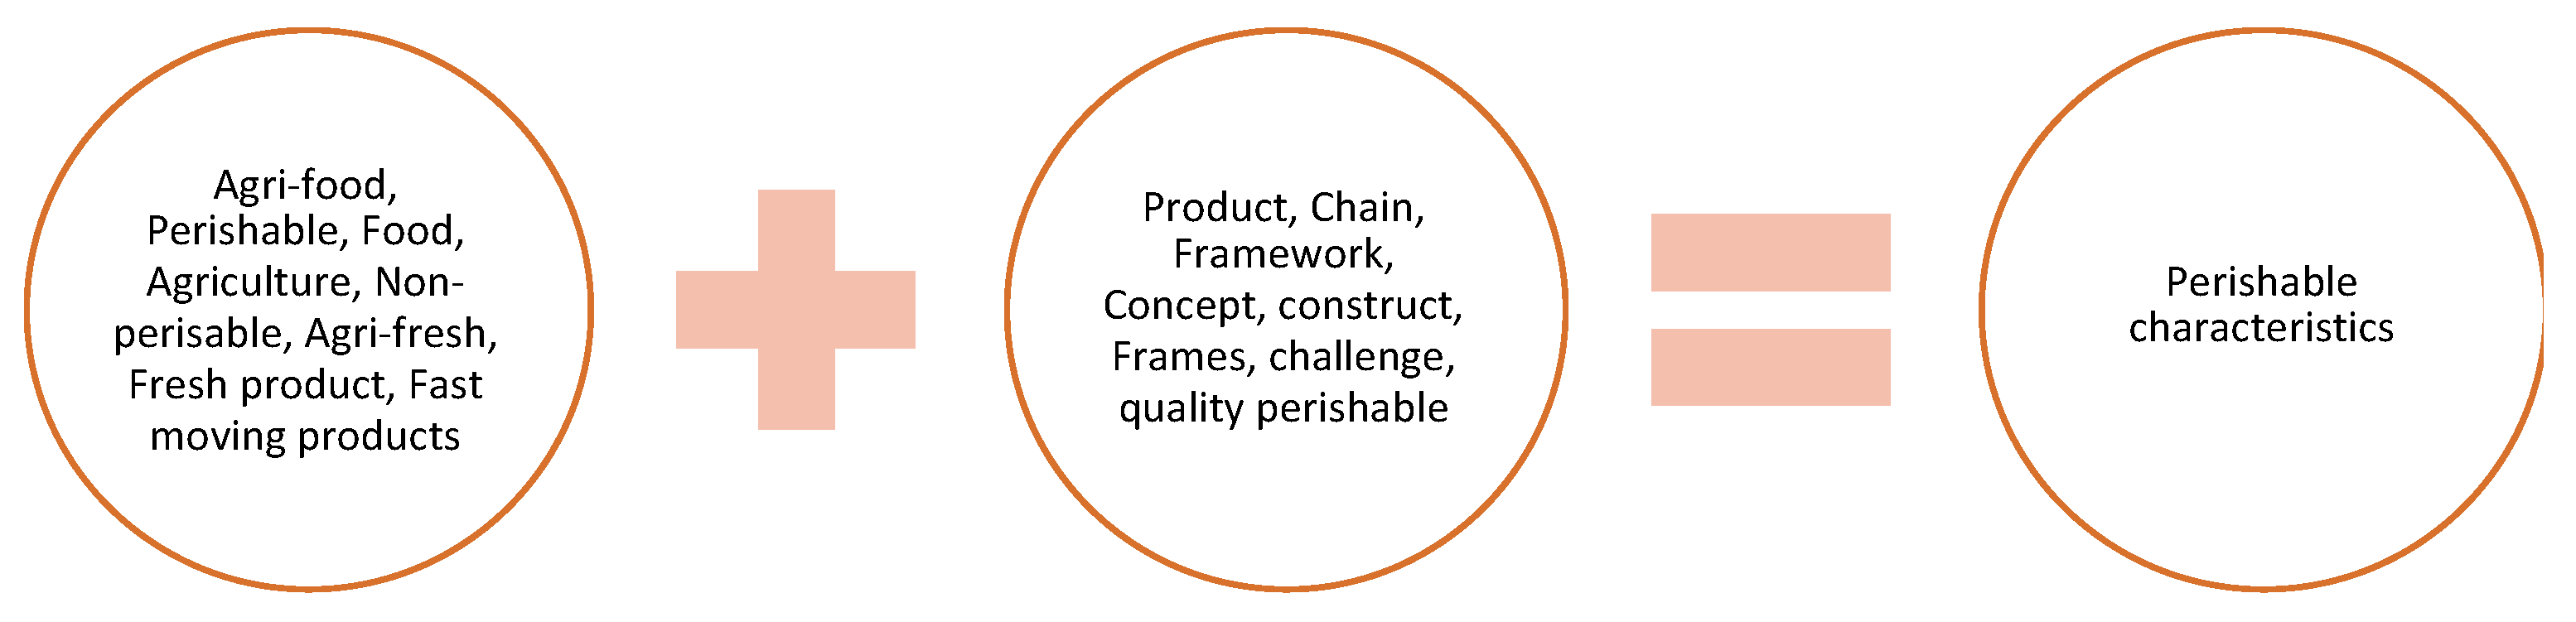
In the case of perishable products, the search focused on the factors that affect the perishable supply chain’s quality. There are several definitions of perishable products, ref. [20] establishes as any processed or semi-processed substance that is useful for human consumption; however other authors such as ref. [21] adds that they must be of short duration. Figure 3 establishes the search equation for the characteristics of the perishables supply chain.
We made a paper’s search using the figure’s 3 keywords in several databases (Web of science, Scopus, Taylor and Francis, MDPI and Wiley). After a carefully analysis of the papers found, 35 papers were used to derive the main characteristics of perishables products considering the quality aspects.
The goods that sell worldwide have a different added value according to the customer’s level of satisfaction. It is said that the more satisfied the customer feels, the greater the added value of the product compared to another. In this game of added value to the customer, the supply chain causes can differentiate two categories in the research: durable products and perishable products. There is a high interference of perishable products; these products classify for lose value over time; Thus, many products fall into this classification [30].
The loss of value can affect the profitability of this economic sector. In the case of agricultural products, which are part of the family of perishable products, it can say that it is very profitable for producers and the community, given the many jobs it generates for the region. In this last decade, the changes that have occurred in the agricultural industry place it in an important position in the world economy, making it the main supply for various food processing industries [13].
3.2. Structure Perishable Products
When looking inside the supply chain of agricultural products, factors make it more complex than a traditional supply chain. Factors such as deterioration, the short useful life, the seasonality of the product, the variability of quality and quantity, as well as the specialized transport requirements and the environmental impact that some of them may cause, make the management of the more complex, expensive and unpredictable perishable products [31]. The complexity is significant in the case of perishable products. The time passes through the supply chain, and days of inventory in the warehouse, in the face of the variability of demand and transport, are minimal. Additionally, this complexity has increased globally thanks to the new approach, which has set aside a single step of the chain, such as production. Now the investigations are dealt with in the entirety of the supply chain [32].
Characterizing perishable products is not an easy task, as has been shown by research in which there has been confusion about products for animal, vegetable, fruit, processed consumption, etc., ref. [33] proposes a classification scheme for consumer goods traded in the world.
According to the classification this paper is focused on perishable products, and more specifically in the agricultural produce. Ref. [34] indicates that the perishable product is short-lived and the non-perishable is long-lasting. There are various factors such as product quality, logistics quality, and quality cost, Etc., which affect the quality of the perishables supply chain. Ref. [35], which in turn are part of the quality problems of the supply chain of the sub-category of agricultural products [13]. The food and Agriculture Organization of the United Nations FAO indicates that in the sub-category of edible products are agricultural production and animal products. For ref. [36], The loss and waste of food are among the factors that most affect the supply chain of the grocery sub-category; loss food is on two segments of products: (i) primary and non-basic vegetable products and (ii) primary and non-basic animal products. basic
From a theoretical point of view, eatable products are as next
“Refers to any substance, whether processed, semi-processed, or raw, intended for human consumption. It includes a drink, chewing gum, and any substance used in the manufacture, preparation, or treatment of food but does not include cosmetics, tobacco, or substances used only as drugs. Food products can be of animal or plant origin and are considered food from the moment that: (i) crops are harvest-mature or suitable for their purpose; (ii) animals are ready for slaughter; (iii) milk drawn from the udder; (iv) eggs are laid by a bird; (v) aquaculture fish is mature in the pond, and (vi) wild fish are caught with fishing gear [37]”.
Eatables products is a sub-category of perishable products [33]; that is why the loss and waste of these products is part of the quality factors that affect the perishables supply chain.
3.3. Factors Affecting the Quality of the Perishable Supply Chain
The structure of the supply chain for perishable products may vary between the different authors. [38] establishes the supply chain as inputs, processing, and outputs, where the inputs are pesticides, fertilizers, agricultural products, crops, dispatch orders, packaging, ingredients, and processes; in the processing are agricultural producers, product processors, and transactional actors; and finally, the outputs are all the goods and services delivered to the consumer. Refrigeration is a crucial element to guarantee the quality of fruits and vegetables, ref. [39] establishes lack of cooling infrastructure as a waste factor in the food supply chain, ref. [40] proposes a model where temperature is a constant but a capacity restriction. Ref. [41] proposes a supply chain that conserves the nutrients of these products starting from the producer or farmer, continuing with the packaging process, pre-cooling, primary transport, frozen storage, secondary transport, and retail. Ref. [42] proposes an attributes to keep food safety: traceability, transparency, time, testability, training, tactics and target. Ref. [43] indicates that quality technology helps retain perishable food characteristics.
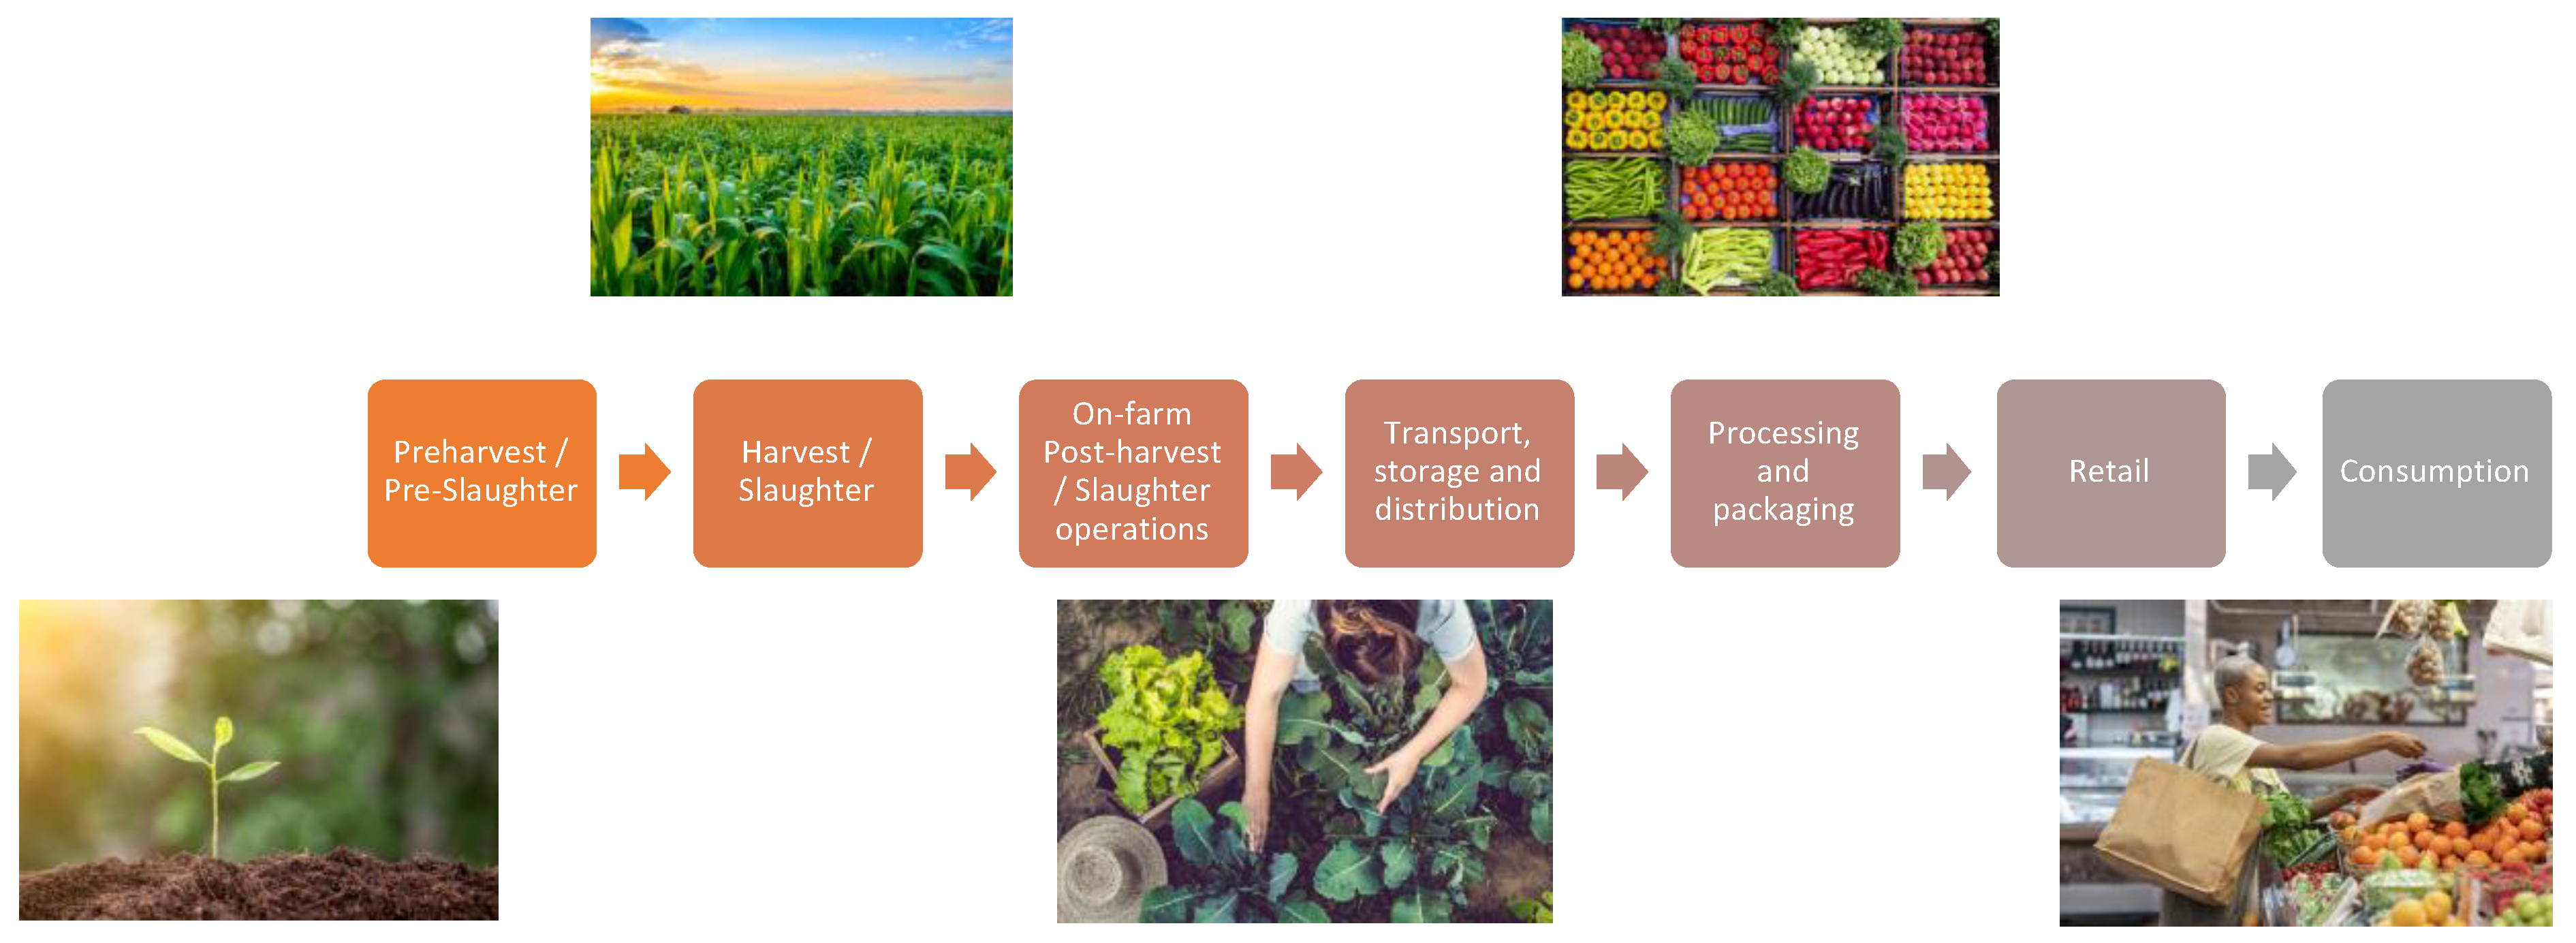
FAO establishes a supply chain that starts from the processes that occur in the Farm, that is, Agricultural production, then Post-harvest handling & storage, Processing, Distribution, and Consumption [44]. Figure 4 shows the structure of the supply chain for perishable products proposed for this research.
In the sub-category of agricultural products, some factors concern the production of these products globally; globalization, technological innovation, trade agreements, consumer sensitivity, and environmental concern can increase or decrease these products [33]. However, waste has been gaining strength in recent years as the most important factor that concerns the supply chain of agricultural products, ref. [36] establishes that 30% of the food produced in the world lost along the supply chain, ref. [33] indicates that between 20% and 60% of food lost in the post-harvest stages of the supply chain. Ref. [33] identifies some areas of the supply chain of agricultural products that have the most significant impact on food loss and waste: (i) demand forecasting, (ii) production planning, (iii) inventory management, and (iv) transportation. Ref. [39] adds other elements that impact the waste of products such as shared information, number of intermediaries, lack of cooling infrastructure, lack of scientific harvesting methods, poor logistics infrastructure, poor design of the logistics network, lack of packaging and design, lack of process standardization, lack of traceability [45] and inadequate training.
Waste has increased in recent years due to population growth [37]; however, it is necessary to broaden the vision of the supply chain and analyze the factors that affect not only waste but also the quality of the supply chain of agricultural products [13] identifies thirteen quality factors that affect the supply chain of agricultural products: sustainability management, information management, logistics management, coordination and collaboration management, strategic management, inventory management, demand management, safety management food, performance management, integration management, supplier management, quality management. Quality system provides a guide to improve customer relationship and better monitor processing [46]. Otherwise ref. [47] identify another quality factors such as commitment, communication, product quality, satisfaction, information quality, leadership, training, environment factors, quality protocol, personal relationship and financial support.
Similarly, as this researcher can identify factors that affect the quality of agricultural products, the author can also identify quality factors that affect the supply chain of perishable products. Ref. [35] establishes the following factors: quality of relationships [48], cost of quality, quality assurance, extrinsic quality, product quality, product safety, logistics quality, quality of human resources, quality of information technology, marketing quality, quality of performance, refs. [49,50] sustainability, and ref. [45] says traceability is becoming a marketing factor itself.
The classification of the quality factors of the supply chain of perishable products was carried out by [35]; it follows by other authors, who corroborate the impact on the quality of the supply chain. Table 2 details the quality factors that affect the supply chain of perishable products and the consequence it generates.
Factors that only affect the quality of the perishables supply chain investigated to a lesser extent than those that affect the quality and food waste. It is striking that factor such as “quality cost” have been investigated only by [35,53] within the articles analyzed in this review. Regarding food loss and waste, ref. [36] focuses on agricultural and animal production products for human consumption; under this classification is that [33,34,39,52] identify the factors that most generate food waste (see Table 2).
4. Bullwhip Effect in Perishable Supply Chain
4.1. Search Equation for the Bullwhip Effect and Perishable Products
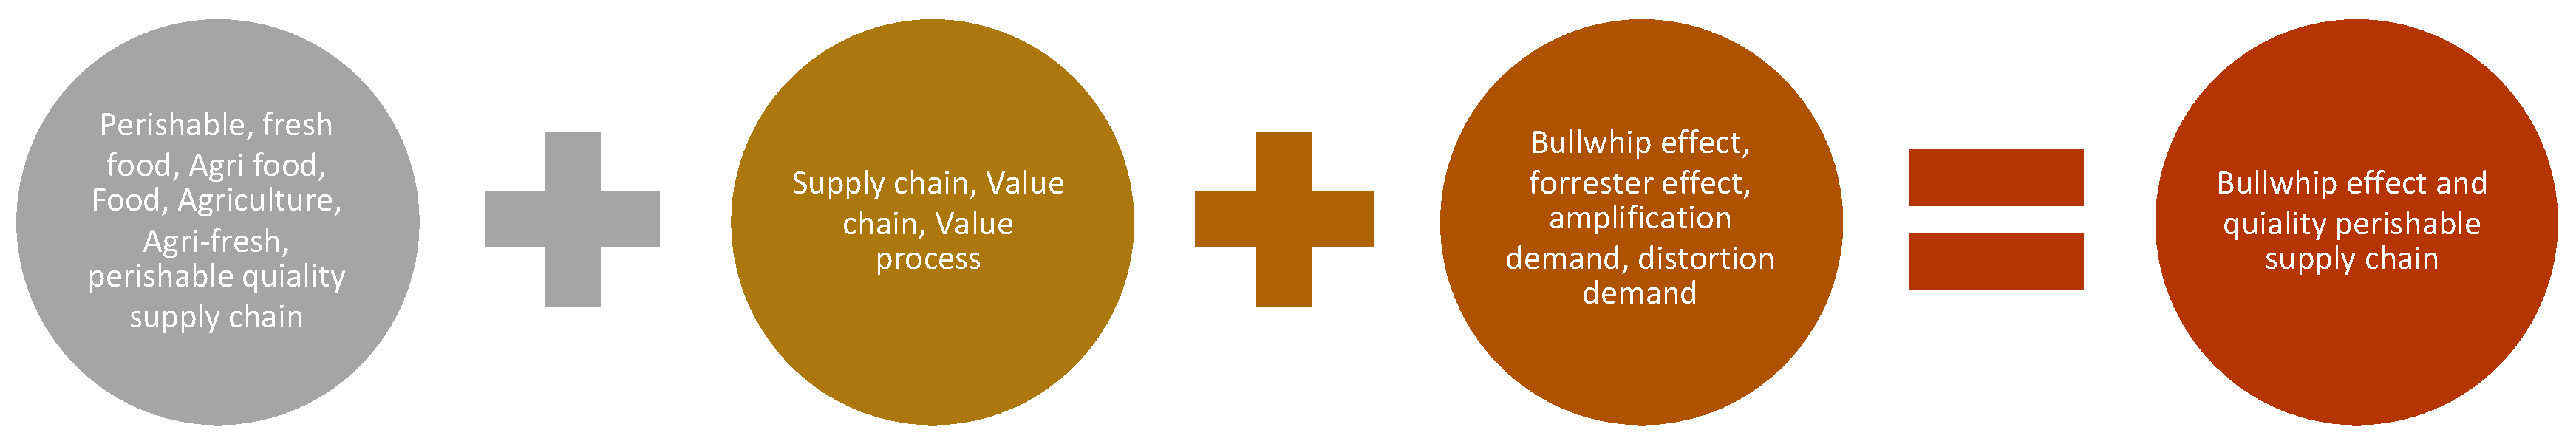
The articulation of these two concepts seeks to understand the characteristics of perishable products that motivated the researchers to relate them to the variables that cause the bullwhip effect. In this research, information searched in databases with international peer review and the search equation involved concepts from the two previous reviews, allowing the results focused on variables and characteristics articulated to reduce the bullwhip effect in the supply chain of perishable products. The selected articles had to comply with a theoretical or case study proposal to reduce the bullwhip effect in the supply chain of perishable products. Figure 5 establishes the keywords used.
The result obtained was limited in that the keyword “Bullwhip effect” was used together with the other keywords. In the first review, for research, were selected 485 articles; however, the search was reduced to 121 articles when this keyword included it.
We choose the articles referenced in the research, it was necessary to read each one of them in detail since in many of them, the bullwhip effect was not the focus of the research, others did not refer to the perishable product or fresh food such as the main case, but as a reference to consider for the investigation of another durable product. At the end of the process, 27 articles were selected that identify the causes of the bullwhip effect within the supply chains of perishable products, taking into account the quality factors of perishable products.
Table 3 describes the 27 items bearing in mind the causes of the bullwhip effect and the quality factors of the perishables supply chain.
The analysis of the articles allowed us to know the value they contribute to the reduction of the bullwhip effect in the supply chain of perishable products. In this process, the causes of the bullwhip effect most studied by the researchers, and the quality factors of the supply chain of perishable products associated with these causes (see Table 4). We identify the phases of the supply chain of perishable products to which the 25 articles analyzed point in their investigations; according to [37], which identifies seven phases of the perishable product supply chain (see Figure 4). Table 5 classifies the articles according to the phase of the supply chain in which their research.
Table 4 shows which are the causes of the bullwhip effect most studied in the 25 articles: update of the demand with 17.1%, the inventory policy and the number of intermediaries with 12.2% each; It also shows which are the most studied quality factors of the perishables supply chain in the causes of the bullwhip effect: product safety with 40.5% and quality of information and information technologies with 21.6%.
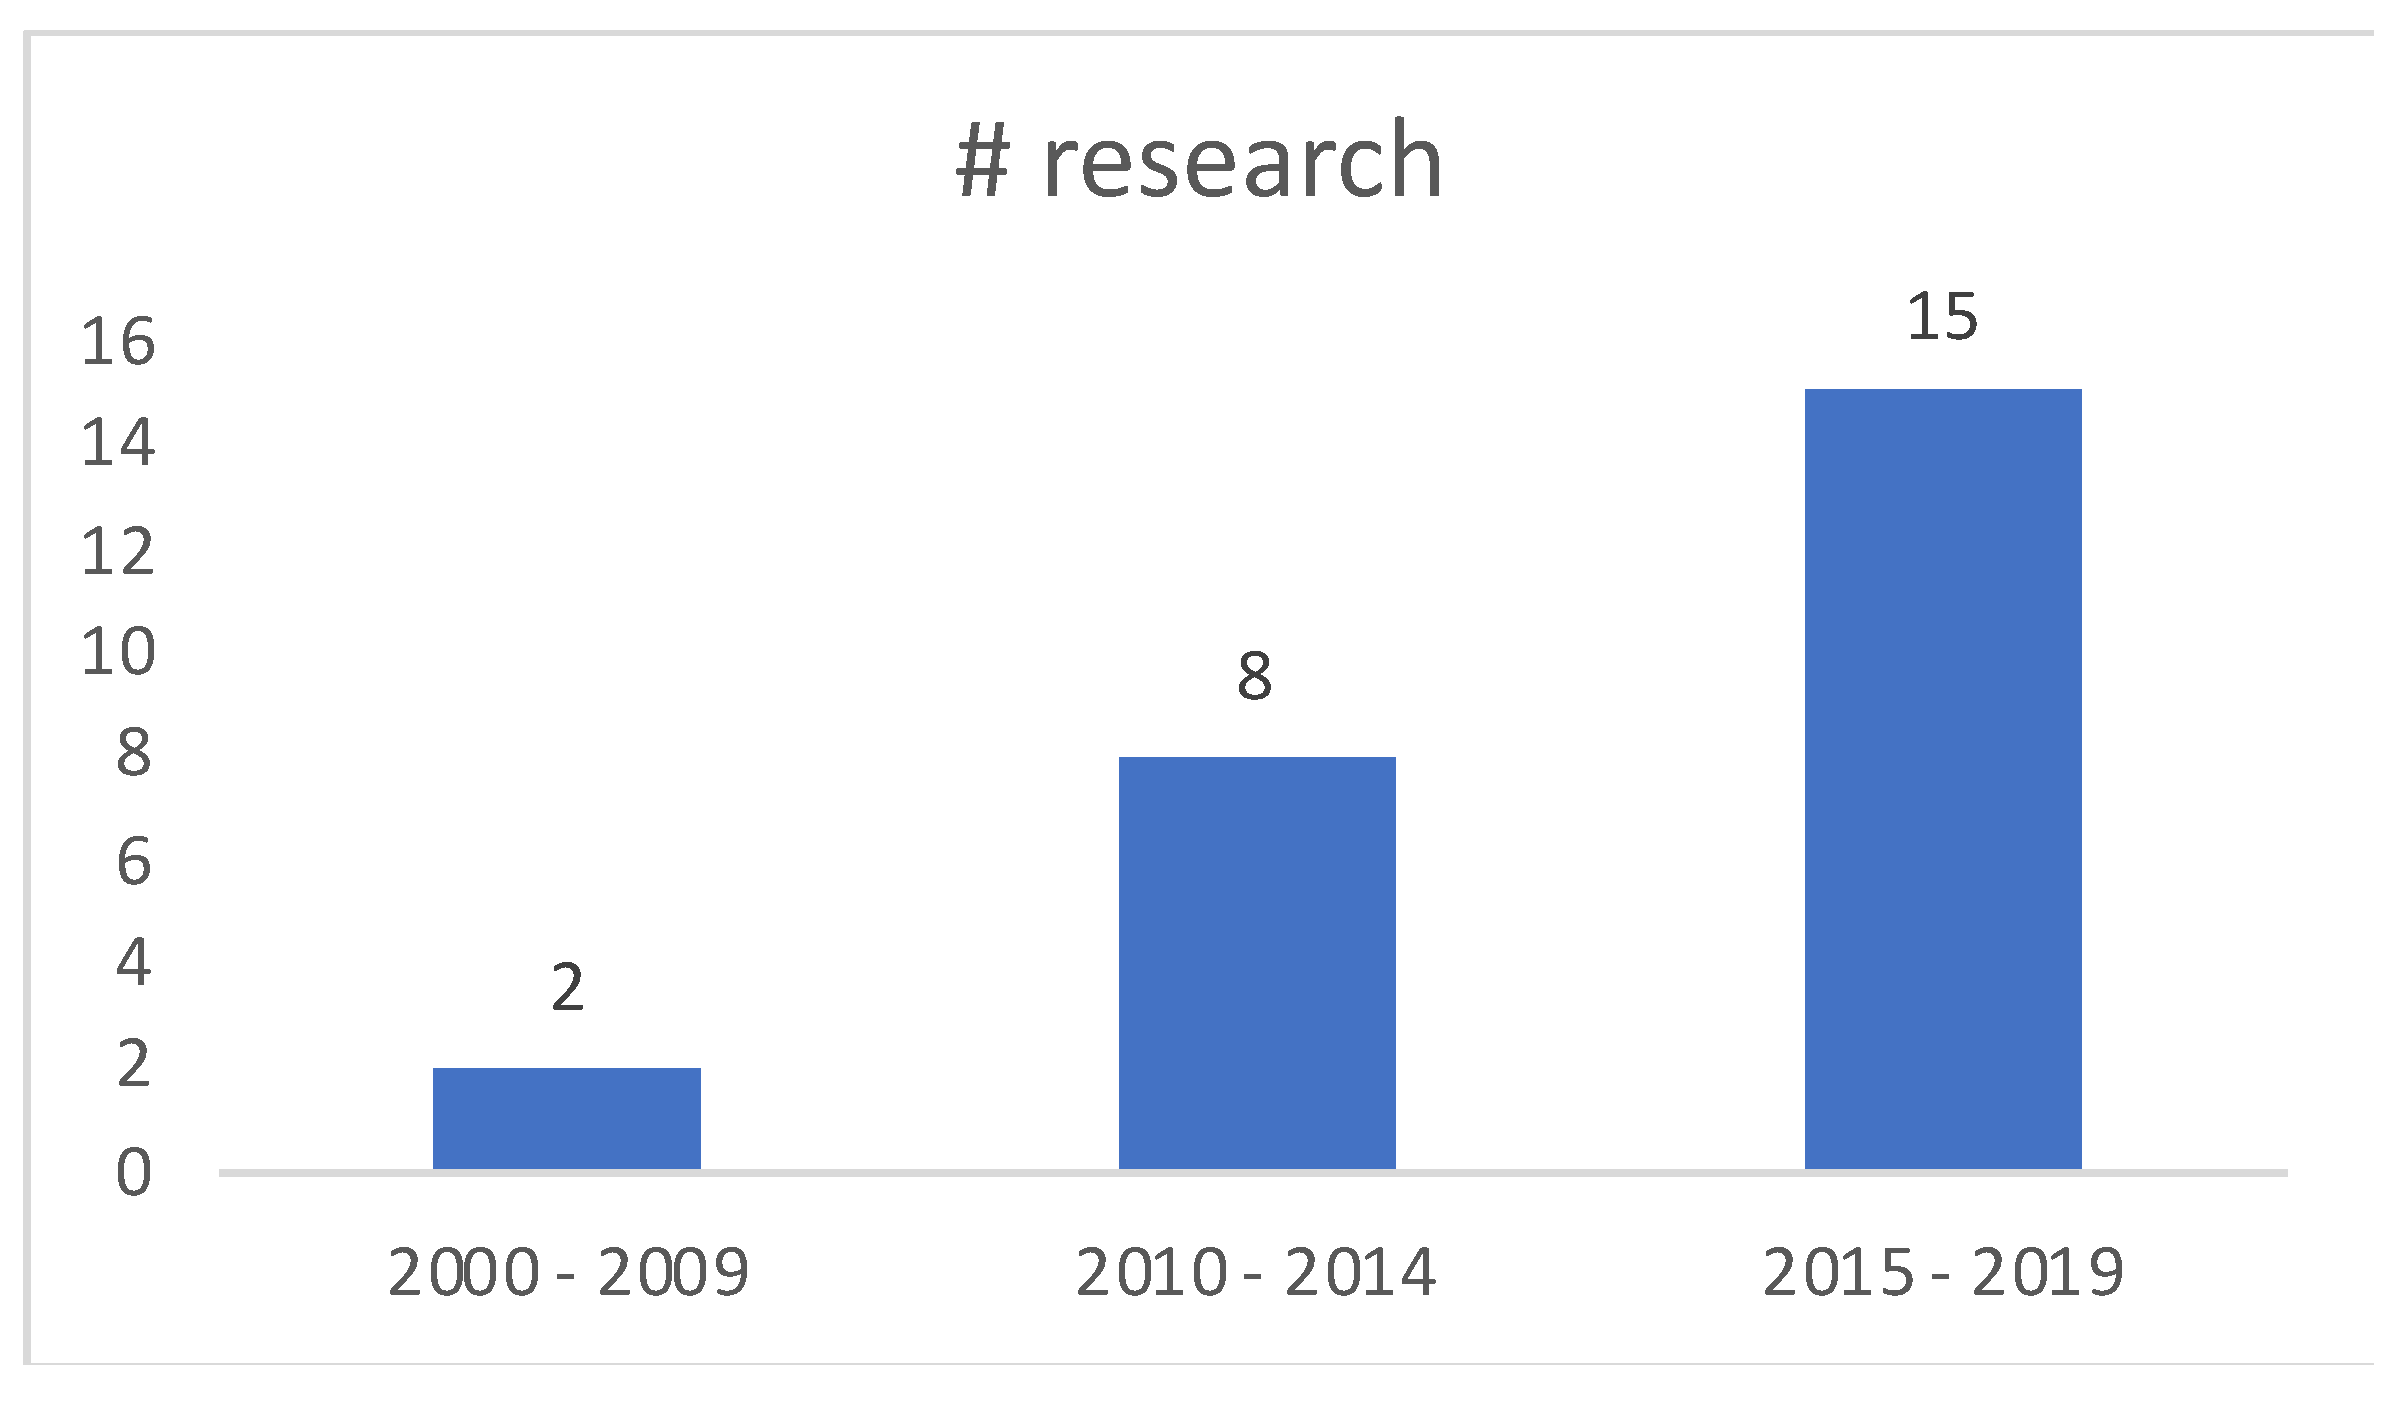
The interest in investigating the bullwhip effect in the supply chain of perishable products show in Figure 6. After [1] established the first causes of the bullwhip effect in traditional supply chains, the study of the bullwhip effect began to gain relevance, only until [75] proposes the first postulate to measure the bullwhip effect. In the last decade, and with the exponential increase in the world population and the recent interest of the Food and Agriculture Organization of the United Nations FAO in guaranteeing food security, the interest in measuring the bullwhip effect in product supply chains perishables has been on the rise.
The published articles specialize in some phase of the supply chain. Table 5 establishes the phases of the supply chain for perishable products, keeping in mind [37], There, the phase or phases of the supply chain to which each investigation points are classified, showing that most of these articles are focused on the last phases of the supply chain of perishable products [54].
4.2. Types of Perishable Products Analyzed
The development and solution of the problems raised in the articles are based initially on obtaining the data. The verification of the results begins with the source of the data, and here we find first the data collected directly from the companies that present problems related to the bullwhip effect in their chain of perishables. Secondly, data is collected based on the random generation of data with the proposed models.
The types of products were also a point of classification in the articles investigated. Table 6 identifies the types of perishable products investigated and the typology of the solution, whether it is a case study or a real case. In the type of solution, the models used to reduce the bullwhip effect in the supply chain of perishable products were also identified (see Table 7).
Table 6 also shows that most of the research is related to agricultural products; this may mean an interest in researchers related to the increase in world population [12].
The information available in the supply chain can limit the investigation of the supply chain of perishable products. On the other hand, there is a strong tendency to investigate agricultural products within the perishables family, where one of the factors that drive this interest is the increase in the world population [10].
4.3. Solutions Models
Each of the articles addresses one or more causes of the bullwhip effect in the supply chain; however, conditions of perishable products could generate the bullwhip effect. Likewise, each article addresses the problem of the bullwhip effect through several phases of the supply chain, and Table 7 indicates the solution model used in each investigation, taking as a reference the classification proposed by ref. [86].

Table 7.
Solutions models.
| Kind of Solution * | Author(s) |
|---|---|
| ILP | [10,65,74] |
| NLP | [71,72,73] |
| MOLP | [62,76,77,79] |
| SM | [10,65,67,70,76,80,83] |
| DP | [63,64,66] |
| HEU | [77,78] |
| STAT | [61,67,68,74,75,78,81,82,83,85] |
| ML | [68,69] |
* ILP: Linear programming Mixed integer/integer linear programming; NLP: Non-linear programming; MOLP: Multi-objective linear programming; SM: Simulation models; DP: Dynamic programming; HEU: Heuristics algorithms and metaheurıstics; STAT: Statistics analysis; ML: Machine Learning.
5. Discussion
Jhonson & Jhonson initially investigated the bullwhip effect in the supply chain was initially investigated by Jhonson & Jhonson by showing an increase in the variability of their inventories and their demand throughout their supply chain [87]. The phenomenon continues investigated in the following years, at the end of the 90s. Ref. [2] identified four causes that may be generating the bullwhip effect: demand update, price variation, order batch, a rational game of shortages. Research in the last 20 years has made it possible to identify additional causes of the bullwhip effect and classify them according to human behavior and the behavior of the company’s operation [3,26].
Research on perishable products began to gain importance due to the worrying increase in the world population [10,11], which leads to a growth in the consumption of perishable products and, at the same time, losses of 5 trillion dollars [79]. The growing interest in studying the loss and waste of perishable products refers to the amount of research around the bullwhip effect in the supply chain of perishable products. Refs. [13,35,54,55], identify sustainability and waste as a factor affecting the performance of the perishable goods supply chain. Refs. [62,68,73,76,79,82], identify that the waste factor and level of degradation is one of the causes of the bullwhip effect in the supply chain of perishable products.
Investigations of the bullwhip effect focus on the later phases of the supply chain of perishable products, particularly in the phases of Distribution and Retail [54]. Although the bullwhip effect has a more significant impact when we are closer to the supplier [1], research in these early stages of the supply chain is scarce, and it does not allow quantifying the full impact of the bullwhip effect on the entire supply chain.
The perishable products investigated can be classified according to the structure of [33]. It is evident that the category “agricultural produces” are the most investigated types of product, its importance may be due in a certain way to the fact that [36] classifies it as relevant in their fight for the food security of humanity, and also for the strategic importance they can take in decision-making [88]. The interest in solving the consequences of the bullwhip effect in the supply chain of perishable products is moving towards the “real case”, while the “case studies” has lost ground in the interest of researchers, who see in the rates of solutions to real cases, a way to test your theories in the real world.
The use of statistics and simulation models to solve the bullwhip effect in the supply chain of perishable products is evident, the possibility of finding correlations between the causes and variables of the bullwhip effect, validations of the proposals made, and regressions to find Forecasts are driving solutions to these problems, also the application of Agent Based Models ABM to improve the coordination between the echelon in a supply chain [84]. Simulation models are another tool used to a great extent to know the new parameters that can reduce the bullwhip effect in the supply chain of perishable products. Machine learning and heuristics models are the least used to provide a solution to the bullwhip effect in the supply chain of perishable products; it will be interesting to see how the new business dynamics around the increase in data can change the way it addresses new solutions.
The level of product deterioration and demand update processes were the most investigated causes in this literature review, secondly are the causes related to inventory policy and the number of intermediaries. These four causes of the bullwhip effect represent almost 60% of the total articles investigated, which may be a sample of the most common causes of the bullwhip effect in perishable products. On the other hand, the quality factors investigated in the supply chain of perishable products are even more concentrated than the causes of the bullwhip effect; Product safety and the quality of information and its information technologies represent 62% of all quality factors, this being the characteristics most taken into account by researchers in the supply chain of perishable products.
6. Conclusions
Research on the causes of the bullwhip effect is a journey that began with [87] when first identifying this phenomenon. Today there are human and operational classifications for the causes of the bullwhip effect, to the point that it is possible to go more in detail and find sub-classifications that show new elements such as machinery maintenance plans and changes in the methods to process information such as causes of the bullwhip effect in the supply chain [26]. According to the review carried out, we can conclude:
- The causes of the bullwhip effect most investigated in the supply chain of perishable products are demand update processes, the level of deterioration of the product, the inventory policy, and the number of intermediaries.
- The quality factors of the supply chain of perishable products most investigated to reduce the bullwhip effect in the supply chain are the safety of the product and the quality of the information and its information technologies.
Future research should review how the bullwhip effect affects human behavior in perishable product supply chains, and no research articulates these two variables. Similarly, there is no research on the causes of the bullwhip effect in perishable products: rational game of shortages, wrong perception of feedback, local optimization without a global vision, machinery breakdown, limited capacity, and pressure to meet production goals. Similarly, the quality factors of the supply chain of perishable products not investigated yet as variables of the bullwhip effect are quality assurance, quality of human resources, and sustainability.
Author Contributions
Investigation J.A.D.P. and Á.O.B.; writing, review, and editing, J.A.D.P., Á.O.B., N.M.R.M.; supervision, Á.O.B. All authors have read and agreed to the published version of the manuscript.
Funding
This research received no external funding.
Institutional Review Board Statement
Not applicable.
Informed Consent Statement
Not applicable.
Data Availability Statement
Study did not report any data.
Acknowledgments
The authors gratefully acknowledge the financial support from Research Centre on Production Management and Engineering (CIGIP), Autonomous University of Bucaramanga (UNAB), and the Iberoamerican University Association for Postgraduates (AUIP).
Conflicts of Interest
The authors declare no conflict of interest.
Abbreviations
The follow abbreviations are used in this manuscript.
| FAO | Food and agriculture organization of the United Nations |
| PSC | Perishable supply chain |
| LQ | Linear quadratic |
| RFID | Radio Frequency Identification |
References
- Padmanabhan, V.; Lee, Y.H.; Kim, W.-S. Information Distortion in a Supply Chain: The Bullwhip Effect. Manag. Sci. 1997, 43, 546–558. [Google Scholar]
- Lee, H.L. The bullwhip effect in supply chains. Sloan Manag. Rev. 1997, 38, 93–102. [Google Scholar] [CrossRef]
- Bhattacharya, R.; Bandyopadhyay, S. A review of the causes of bullwhip effect in a supply chain. Int. J. Adv. Manuf. Technol. 2011, 54, 1245–1261. [Google Scholar] [CrossRef]
- Ma, Y.; Wang, N.; He, Z.; Lu, J.; Liang, H. Analysis of the bullwhip effect in two parallel supply chains with interacting price-sensitive demands. Eur. J. Oper. Res. 2015, 243, 815–825. [Google Scholar] [CrossRef]
- Cho, D.W.; Lee, Y.H. Bullwhip effect measure in a seasonal supply chain. J. Intell. Manuf. 2012, 23, 2295–2305. [Google Scholar] [CrossRef]
- Ekinci, E.; Baykasoglu, A. Modelling complexity in retail supply chains. Kybernetes 2016, 45, 297–322. [Google Scholar] [CrossRef]
- Hull, B.Z. Are supply (driven) chains forgotten? Int. J. Logist. Manag. 2005, 16, 218–236. [Google Scholar] [CrossRef]
- Esteso, A.; Alemany Díaz, M.D.M.; Ortiz Bas, Á. Conceptual framework for designing agri-food supply chains under uncertainty by mathematical programming models. Int. J. Prod. Res. 2018, 4418–4446. [Google Scholar] [CrossRef]
- Villegas, F.A.; Smith, N.R. Supply chain dynamics: Analysis of inventory vs. order oscillations trade-off. Int. J. Prod. Res. 2006, 44, 1037–1054. [Google Scholar] [CrossRef]
- Duong, L.; Wood, L.; Wang, W. Effects of Consumer Demand, Product Lifetime, and Substitution Ratio on Perishable Inventory Management. Sustainability 2018, 10, 1559. [Google Scholar] [CrossRef] [Green Version]
- Parfitt, J.; Barthel, M.; Macnaughton, S. Food waste within food supply chains: Quantification and potential for change to 2050. Philos. Trans. R. Soc. B Biol. Sci. 2010, 365, 3065–3081. [Google Scholar] [CrossRef] [Green Version]
- Nakandala, D.; Samaranayake, P.; Lau, H.; Ramanathan, K. Modelling information flow and sharing matrix for fresh food supply chains. Bus. Process Manag. J. 2017, 23, 108–129. [Google Scholar] [CrossRef]
- Siddh, M.M.; Soni, G.; Jain, R.; Sharma, M.K.; Yadav, V. Agri-fresh food supply chain quality (AFSCQ): A literature review. Ind. Manag. Data Syst. 2017, 117, 2015–2044. [Google Scholar] [CrossRef] [Green Version]
- Braz, A.C.; De Mello, A.M.; de Vasconcelos Gomes, L.A.; de Souza Nascimento, P.T. The bullwhip effect in closed-loop supply chains: A systematic literature review. J. Clean. Prod. 2018, 202, 376–389. [Google Scholar] [CrossRef]
- Yang, Y.; Lin, J.; Liu, G.; Zhou, L. The behavioural causes of bullwhip effect in supply chains: A systematic literature review. Int. J. Prod. Econ. 2021, 236, 108120. [Google Scholar] [CrossRef]
- Haines, R.; Hough, J.; Haines, D. A metacognitive perspective on decision making in supply chains: Revisiting the behavioral causes of the bullwhip effect. Int. J. Prod. Econ. 2017, 184, 7–20. [Google Scholar] [CrossRef]
- Zhao, Y.; Zhao, X. On human decision behavior in multi-echelon inventory management. Int. J. Prod. Econ. 2015, 161, 116–128. [Google Scholar] [CrossRef]
- Dai, J.; Li, S.; Peng, S. Analysis on causes and countermeasures of bullwhip effect. MATEC Web Conf. 2017, 100, 5018. [Google Scholar] [CrossRef] [Green Version]
- Zhang, X.; Burke, G.J. Analysis of compound bullwhip effect causes. Eur. J. Oper. Res. 2011, 210, 514–526. [Google Scholar] [CrossRef]
- Udenio, M.; Vatamidou, E.; Fransoo, J.C.; Dellaert, N. Behavioral causes of the bullwhip effect: An analysis using linear control theory. IISE Trans. 2017, 49, 980–1000. [Google Scholar] [CrossRef] [Green Version]
- Hassanzadeh, A.; Jafarian, A.; Amiri, M. Modeling and analysis of the causes of bullwhip effect in centralized and decentralized supply chain using response surface method. Appl. Math. Model. 2014, 38, 2353–2365. [Google Scholar] [CrossRef]
- Paik, S.-K.; Bagchi, P.K. Understanding the causes of the bullwhip effect in a supply chain. Int. J. Retail Distrib. Manag. 2007, 35, 308–324. [Google Scholar] [CrossRef]
- Barlas, Y.; Gunduz, B. Demand forecasting and sharing strategies to reduce fluctuations and the bullwhip effect in supply chains. J. Oper. Res. Soc. 2011, 62, 458–473. [Google Scholar] [CrossRef]
- Zotteri, G. An empirical investigation on causes and effects of the Bullwhip-effect: Evidence from the personal care sector. Int. J. Prod. Econ. 2013, 143, 489–498. [Google Scholar] [CrossRef]
- Park, K. A Heuristic Simulation-Optimization Approach to Information Sharing in Supply Chains. Symmetry 2020, 12, 1319. [Google Scholar] [CrossRef]
- Rahman, M.H.; Rahman, M.A.; Talapatra, S. The bullwhip effect: Causes, intensity, and mitigation. Prod. Manuf. Res. 2020, 8, 406–426. [Google Scholar] [CrossRef]
- Jain, R.; Verma, M.; Jaggi, C.K. Impact on bullwhip effect in food industry due to food delivery apps. Opsearch 2021, 58, 148–159. [Google Scholar] [CrossRef]
- Li, C.; Liu, S. A robust optimization approach to reduce the bullwhip effect of supply chains with vendor order placement lead time delays in an uncertain environment. Appl. Math. Model. 2013, 37, 707–718. [Google Scholar] [CrossRef]
- Goodarzi, M.; Makvandi, P.; Saen, R.F.; Sagheb, M.D. What are causes of cash flow bullwhip effect in centralized and decentralized supply chains? Appl. Math. Model. 2017, 44, 640–654. [Google Scholar] [CrossRef]
- Chaudhary, V.; Kulshrestha, R.; Routroy, S. State-of-the-art literature review on inventory models for perishable products. J. Adv. Manag. Res. 2018, 15, 306–346. [Google Scholar] [CrossRef]
- Moazzam, M.; Akhtar, P.; Garnevska, E.; Marr, N.E. Measuring agri-food supply chain performance and risk through a new analytical framework: A case study of New Zealand dairy. Prod. Plan. Control 2019, 29, 1258–1274. [Google Scholar] [CrossRef]
- Zhong, R.; Xu, X.; Wang, L. Food supply chain management: Systems, implementations, and future research. Ind. Manag. Data Syst. 2017, 117, 2085–2114. [Google Scholar] [CrossRef]
- Shukla, M.; Jharkharia, S. Agri-fresh produce supply chain management: A state-of-the-art literature review. Int. J. Oper. Prod. Manag. 2013, 33, 114–158. [Google Scholar] [CrossRef]
- Chauhan, A.; Debnath, R.M.; Singh, S.P. Modelling the drivers for sustainable agri-food waste management. Benchmarking Int. J. 2018, 25, 981–993. [Google Scholar] [CrossRef]
- Siddh, M.M.; Soni, G.; Jain, R. Perishable food supply chain quality (PFSCQ): A structured review and implications for future research. J. Adv. Manag. Res. 2015, 12, 292–313. [Google Scholar] [CrossRef]
- FAO. Pérdidas y Desperdicios de Alimentos en el Mundo; FAO: Dusseldorf, Alemania, 2011. [Google Scholar]
- FAO. The State of Food and Agriculture; FAO: Rome, Italy, 2019. [Google Scholar]
- Zambon, I.; Cecchini, M.; Egidi, G.; Saporito, M.G.; Colantoni, A. Revolution 4.0: Industry vs. Agriculture in a Future Development for SMEs. Processes 2019, 7, 36. [Google Scholar] [CrossRef] [Green Version]
- Balajiab, M.; Arshinder, K. Modeling the causes of food wastage in Indian perishable food supply chain. Resour. Conserv. Recycl. 2016, 114, 153–167. [Google Scholar] [CrossRef]
- Manouchehri, F.; Nookabadi, A.S.; Kadivar, M. Production routing in perishable and quality degradable supply chains. Heliyon 2020, 6, e03376. [Google Scholar] [CrossRef] [PubMed]
- Onwude, D.I.; Chen, G.; Eke-emezie, N.; Kabutey, A.; Khaled, A.Y.; Sturm, B. Recent Advances in Reducing Food Losses in the Supply Chain of Fresh Agricultural Produce. Processes 2020, 8, 1431. [Google Scholar] [CrossRef]
- Machado Nardi, V.A.; Auler, D.P.; Teixeira, R. Food safety in global supply chains: A literature review. J. Food Sci. 2020, 85, 883–891. [Google Scholar] [CrossRef] [Green Version]
- Haji, M.; Kerbache, L.; Muhammad, M.; Al-Ansari, T. Roles of Technology in Improving Perishable Food Supply Chains. Logistics 2020, 4, 33. [Google Scholar] [CrossRef]
- FAO. Food Loss and Waste and the Right to Adequate Food: Making the Connection; FAO: Rome, Italy, 2018; Volume 1. [Google Scholar]
- Mol, A.P.J.; Oosterveer, P.J.M. Certification of Markets, Markets of Certificates: Tracing Sustainability in Global Agro-Food Value Chains. Sustainability 2015, 7, 12258–12278. [Google Scholar] [CrossRef] [Green Version]
- Wilcock, A.E.; Boys, K.A. Improving quality management: ISO 9001 benefits for agrifood firms. J. Agribus. Dev. Emerg. Econ. 2017, 7, 2–20. [Google Scholar] [CrossRef]
- Jraisat, L.E.; Sawalha, I.H. Quality control and supply chain management: A contextual perspective and a case study. Supply Chain. Manag. 2013, 18, 194–207. [Google Scholar] [CrossRef]
- Handayati, Y.; Simatupang, T.M.; Perdana, T. Agri-food supply chain coordination: The state-of-the-art and recent developments. Logist. Res. 2015, 8, 5. [Google Scholar] [CrossRef] [Green Version]
- Siddh, M.M.; Soni, G.; Jain, R.; Sharma, M.K.; Yadav, V. A framework for managing the agri-fresh food supply chain quality in Indian industry. Manag. Environ. Qual. 2021, 32, 436–451. [Google Scholar] [CrossRef]
- Chi Ffoleau, Y.; Dourian, T. Sustainable food supply chains: Is shortening the answer? A literature review for a research and innovation agenda. Sustainability 2020, 12, 9831. [Google Scholar] [CrossRef]
- Zhu, Q.; Krikke, H.R. Managing a Sustainable and Resilient Perishable Food Supply Chain (PFSC) after an Outbreak. Sustainability 2020, 12, 5004. [Google Scholar] [CrossRef]
- do Carmo Stangherlin, I.; de Barcellos, M.D. Drivers and barriers to food waste reduction. Br. Food J. 2018, 120, 2364–2387. [Google Scholar] [CrossRef]
- Coti-Zelati, P.E.; de Mauricio Jucá, Q.; de Davi Lucas Arruda, A. The bullwhip effect in Brazilian supply chain of organic products: An analysis from the perspective of transaction cost theory. Indep. J. Manag. Prod. 2019, 10, 1015–1035. [Google Scholar] [CrossRef]
- Akkerman, R.; Farahani, P.; Grunow, M. Quality, safety and sustainability in food distribution: A review of quantitative operations management approaches and challenges. OR Spectr. 2010, 32, 863–904. [Google Scholar] [CrossRef]
- Siddh, M.M.; Soni, G.; Jain, R.; Sharma, M.K. Structural model of perishable food supply chain quality (PFSCQ) to improve sustainable organizational performance. Benchmarking Int. J. 2018, 25, 2272–2317. [Google Scholar] [CrossRef]
- Manzini, R.; Accorsi, R.; Ayyad, Z.; Bendini, A.; Bortolini, M.; Gamberi, M.; Valli, E.; Gallina Toschi, T. Sustainability and quality in the food supply chain. A case study of shipment of edible oils. Br. Food J. 2014, 116, 2069–2090. [Google Scholar] [CrossRef]
- Costa, C.; Costa, C.; Antonucci, F.; Antonucci, F.; Pallottino, F.; Pallottino, F.; Aguzzi, J.; Aguzzi, J.; Sarriá, D.; Sarriá, D.; et al. A Review on Agri-food Supply Chain Traceability by Means of RFID Technology. Food Bioprocess Technol. 2013, 6, 353–366. [Google Scholar] [CrossRef]
- He, Y.; Huang, H.; Li, D.; Shi, C.; Wu, S.J. Quality and Operations Management in Food Supply Chains: A Literature Review. J. Food Qual. 2018, 2018, 7279491. [Google Scholar] [CrossRef]
- Ouma, S. Global Standards, Local Realities: Private Agrifood Governance and the Restructuring of the Kenyan Horticulture Industry. Econ. Geogr. 2010, 86, 197–222. [Google Scholar] [CrossRef]
- Pereira, L.M. The future of the food system: Cases involving the private sector in South Africa. Sustainability 2013, 5, 1234–1255. [Google Scholar] [CrossRef] [Green Version]
- Chocholáč, J.; Prusa, P. The Analysis of Orders of Perishable Goods in Relation to the Bullwhip Effect in the Logistic Supply Chain of the Food Industry: A Case Study. Open Eng. 2016, 6. [Google Scholar] [CrossRef] [Green Version]
- Duong, L.N.; Wood, L.C.; Wang, W.Y.C. A Multi-criteria Inventory Management System for Perishable & Substitutable Products. Procedia Manuf. 2015, 2, 66–76. [Google Scholar]
- Campuzano-Bolarin, F.; Mula, J.; Diaz-Madronero, M. A supply chain dynamics model for managing perishable products under different e-business scenarios. In Proceedings of the 2015 International Conference on Industrial Engineering and Systems Management, Seville, Spain, 21–23 October 2015; pp. 329–337. [Google Scholar]
- Kumar, S.; Nigmatullin, A. A system dynamics analysis of food supply chains—Case study with non-perishable products. Simul. Model. Pract. Theory 2011, 19, 2151–2168. [Google Scholar] [CrossRef]
- Jiang, Q.; Xing, W.; Hou, R.; Zhou, B. An Optimization Model for Inventory System and the Algorithm for the Optimal Inventory Costs Based on Supply-Demand Balance. Math. Probl. Eng. 2015, 2015, 508074. [Google Scholar] [CrossRef]
- Wang, W. Analysis of Bullwhip Effects in Perishable Product Supply Chain Based on System Dynamics Model. Icicta 2011, 1, 1018–1021. [Google Scholar] [CrossRef]
- Hamiche, K.; Fliess, M.; Join, C.; Abouaïssa, H. Bullwhip effect attenuation in supply chain management via control-theoretic tools and short-term forecasts: A preliminary study with an application to perishable inventories. In Proceedings of the International Conference on Control, Decision and Information Technologies (CoDIT), Paris, France, 23–26 April 2019. [Google Scholar]
- Huber, J.; Gossmann, A.; Stuckenschmidt, H. Cluster-based hierarchical demand forecasting for perishable goods. Expert Syst. Appl. 2017, 76, 140–151. [Google Scholar] [CrossRef]
- Caniato, F.; Kalchschmidt, M.; Ronchi, S.; Verganti, R.; Zotteri, G. Clustering customers to forecast demand. Prod. Plan. Control 2005, 16, 32–43. [Google Scholar] [CrossRef]
- Ji, H. Simulation and analysis on the bullwhip effect based on Farming-Supermarket Docking. In Proceedings of the 2016 International Conference on Logistics, Informatics and Service Sciences (LISS), Sydney, NSW, Australia, 24–27 July 2016. [Google Scholar]
- Ignaciuk, P.; Bartoszewicz, A. Linear-Quadratic Optimal Control of Periodic-Review Perishable Inventory Systems. IEEE Trans. Control Syst. Technol. 2012, 20, 1400–1407. [Google Scholar] [CrossRef]
- Leśniewski, P.; Bartoszewicz, A. LQ Optimal Sliding Mode Control of Periodic Review Perishable Inventories with Transportation Losses. Math. Probl. Eng. 2013, 2013, 325274. [Google Scholar] [CrossRef]
- Ignaciuk, P. LQ Suboptimal Control of Perishable Inventory Systems with Multiple Supply Alternatives. IFAC Proc. Vol. 2012, 45, 200–205. [Google Scholar] [CrossRef]
- Henry, J.Y.; Williams, B.D.; Waller, M.A.; Hofer, A.R. Masking the bullwhip effect in retail: The influence of data aggregation. Int. J. Phys. Distrib. Logist. Manag. 2015, 45, 814–830. [Google Scholar] [CrossRef]
- Fransoo, J.C.; Wouters, M.J.F. Measuring the bullwhip effect in the supply chain. Supply Chain Manag. 2000, 5, 78–89. [Google Scholar] [CrossRef]
- Minner, S.; Transchel, S. Order variability in perishable product supply chains. Eur. J. Oper. Res. 2017, 260, 93–107. [Google Scholar] [CrossRef]
- Akbari Kaasgari, M.; Imani, D.M.; Mahmoodjanloo, M. Optimizing a vendor managed inventory (VMI) supply chain for perishable products by considering discount: Two calibrated meta-heuristic algorithms. Comput. Ind. Eng. 2017, 103, 227–241. [Google Scholar] [CrossRef]
- Dellino, G.; Laudadio, T.; Mari, R.; Mastronardi, N.; Meloni, C. Microforecasting methods for fresh food supply chain management: A computational study. Math. Comput. Simul. 2018, 147, 100–120. [Google Scholar] [CrossRef]
- Zhang, Y.; Zhao, L.; Qian, C. Modeling of an IoT-enabled supply chain for perishable food with two-echelon supply hubs. Ind. Manag. Data Syst. 2017, 117, 1890–1905. [Google Scholar] [CrossRef]
- Giro, R.; Jacob, L.; Roque, E. An analytical investigation of the bullwhip effect in the food supply chain Un análisis investigativo del efecto chicote en la cadena de suministros de la industria alimenticia Uma análise investigativa do efeito chicote na cadeia de suprimentos da indúst. REGE Rev. Gestão 2011, 18, 469–489. [Google Scholar]
- Bottani, E.; Montanari, R.; Volpi, A. The impact of RFID and EPC network on the bullwhip effect in the Italian FMCG supply chain. Int. J. Prod. Econ. 2010, 124, 426–432. [Google Scholar] [CrossRef]
- Novitasari, N.; Damayanti, N. Systematic Literature Review and Improved Model for Mitigating Bullwhip Effect in Low Shelf Life Food Supply Chain. In Proceedings of the 5th International Conference on Industrial Engineering and Applications, Singapore, 26–28 April 2018; IEEE: Piscataway, NJ, USA, 2018; pp. 531–535. [Google Scholar]
- Raju, J.K.; Patil, H.; Somashekhar, I.C. Reducing Bullwhip Effect in Fresh Food Vegetable Supply Chain Management: A Strategic Approach for Inclusive Growth. IJSCM 2013, 2, 53–64, (Online). [Google Scholar]
- Naghavi, S.; Karbasi, A.; Kakhki, M.D. Agent Based Modelling of Milk and its Productions Supply Chain and Bullwhip Effect Phenomena (Case Study: Kerman). Int. J. Supply Oper. Manag. 2020, 7, 279–294. [Google Scholar]
- Isaksson, O.H.D.; Seifert, R.W. Quantifying the bullwhip effect using two-echelon data: A cross-industry empirical investigation. Int. J. Prod. Econ. 2016, 171, 311–320. [Google Scholar] [CrossRef]
- Soto-Silva, W.E.; Nadal-Roig, E.; González-Araya, M.C.; Pla-Aragones, L.M. Operational research models applied to the fresh fruit supply chain. Eur. J. Oper. Res. 2016, 251, 345–355. [Google Scholar] [CrossRef]
- Forrester, J. Industrial Dynamics, 1st ed.; MIT Press: Cambridge, MA, USA, 1961. [Google Scholar]
- Esteso, A.; Alemany, M.M.E.; Ortiz, Á. Impact of product perishability on agri-food supply chains design. Appl. Math. Model. 2021, 96, 20–38. [Google Scholar] [CrossRef]
Figure 1.
Search equation causes bullwhip effect. Reference: Authors.

Figure 2.
Causes of bullwhip effect. Reference: Authors.

Figure 3.
Search equation quality factors perishable supply chain.

Figure 4.
Structure perishable supply chain. Reference: Authors adapted from [37].
Figure 4.
Structure perishable supply chain. Reference: Authors adapted from [37].

Figure 5.
Literature review bullwhip effect and perishable.

Figure 6.
No. research published. Reference: Authors.

Table 1.
Causes bullwhip effect classification.
| Classification | Description | Authors | ID |
|---|---|---|---|
| Behavior | Fear shortage | [3,15,17,20] | B-1 |
| Poor training | [3,15,16,20] | B-2 | |
| Negligence in time to make decisions | [3,16] | B-3 | |
| Operational | Updating demand | [2,5,19,20,21,22,23,27] | O-1 |
| Batch size | [2,3,21,28] | O-2 | |
| Price variations | [2,3,4,19,22,24,26] | O-3 | |
| Gaming shortages | [2,3,21,29] | O-4 | |
| Lead time | [4,5,21,28] | O-5 | |
| Inventory policies | [3,9] | O-6 | |
| Restocking policies | [19,20] | O-7 | |
| Inappropriate control system | [3,18] | O-8 | |
| Lack of synchronization | [6,22,25] | O-9 | |
| Wrong perception of feedback | [3] | O-10 | |
| Local optimization without a global vision | [3] | O-11 | |
| Number of intermediaries | [22,26] | O-12 | |
| Company processes | [3,14] | O-13 | |
| Broken machines | [26] | O-14 | |
| Capacity | [3] | O-15 | |
| Sales pressure due target | [24,26] | O-16 | |
| Other | Perishability products | [7] | N-1 |
Reference: Authors.
Table 2.
Factors affecting the quality of the perishable goods supply chain.
| Quality Factor | Consequence | Authors | ID ** |
|---|---|---|---|
| Relationship | Collaboration and trust | [13,35,47,48,51,52] | PSC 1 |
| Cost | High cost of the supply chain, wrong payment system | [35,53] | PSC 2 |
| Quality assurance | Lack of quality standards, quality policies, and quality attributes | [35,46] | PSC 3 |
| Extrinsic quality * | Poor processes with suppliers, retailers, and quality deliveries | [13,35,49], [39] * | PSC 4 |
| Product quality * | Low quality raw materials, nutritional and resource quality | [13,35,47,54,55,56], [34] *, [52] * | PSC 5 |
| Product safety * | Low level freshness, inappropriate packing, lack of traceability | [13,35,42,54,56,57], [33] *, [52] * | PSC 6 |
| Logistics quality * | Low quality of roads, distribution and logistics operation | [13,35,40,55,56,58], [33] *, [34] *, [52] * | PSC 7 |
| Quality of human resources * | Low quality of morale, quality of work, low level of education | [13,35,47], [34] *, [39] * | PSC 8 |
| Information technology quality * | Lack of clarity in product information, information quality, wrong forecast, and data quality | [13,35,43,45,55], [34] *, [39] *, [52] * | PSC 9 |
| Marketing quality | There is not brand care | [35,45,52] | PSC 10 |
| Performance quality | Erroneous or non-existent performance measures, low customer perception, quality indexes | [13,35,59] | PSC 11 |
| Sustainability | Non-existent or low level of application of the sustainability strategy, of animal and flora protection | [13,35,47,49,50,54,60] | PSC 12 |
* In addition to the consequences they generate, they are also the ones most responsible for food waste ** PSC: Perishable Supply Chain. Reference: Authors.
Table 3.
Description of articles in quality factors and causes of the bullwhip effect in perishables supply chain.
Table 3.
Description of articles in quality factors and causes of the bullwhip effect in perishables supply chain.
| Author(s) | Summary |
|---|---|
| [61] | The short shelf life of perishable products raises concerns in the supply chain, and this generates actions such as promotions that alter demand management and generate the bullwhip effect. |
| [62] | The management of substitute products plays a vital role in the chain of perishable products due to their short helpful life; for this reason, factors such as inventory policy and the batch order lot of the products reduce the bullwhip effect. in supply chains of perishable substitute products. |
| [63] | Food waste in traditional and e-business models is an indicator of inefficiency in the supply chain, and inventory and restocking policy is proposed through a simulation using System Dynamics to reduce the bullwhip effect. |
| [64] | Some links in the supply chain of perishable products do not communicate with each other, creating uncertainty in demand and delivery times. The problem increases by the number of intermediaries in the supply chain; therefore, it seeks to design a simulation model of system dynamics, which determines how these factors impact a three-level food supply chain (manufacturing, distribution, retail) in order to reduce the expansion of demand among chain actors. |
| [65] | Characteristics of agricultural products are seasonal production; the delivery time is causing an imbalance between demand and supply, causing the bullwhip effect; authors propose an inventory model to reduce the cost of an agricultural supply chain of two steps. |
| [66] | The long production times, the short time to sell, and the uncertainty of the demand make perishable products a challenge for the managers of this supply chain, and the lack of a mechanism to share information is causing the bullwhip effect. A model based on system dynamics to reduce the bullwhip effect. Authors conclude that sharing information such as inventory level, delivery time, and sales price help to reduce the bullwhip effect. |
| [67] | Inventory management is essential in perishable products because the products can deteriorate quickly; Delivery time and production time are variables that increase the bullwhip effect. Therefore, it proposes to design a predictive model of demand and inventory to mitigate the bullwhip effect in perishable products. |
| [68] | The short helpful life of perishable products can be compensated with the sale of substitute products and there reduce the loss and waste of food; this situation generates changes in demand, it proposes to design a DSS (Decision Support System) that allows to identify the demand at the point of sale and decrease the amplification of demand. |
| [69] | The variability of demand in the supply chain for perishable products causes several inefficiencies in operation. This variability of demand increases the risk of product loss due to rapid deterioration, and it proposes to apply the Cluster method to group the different products based on characteristics such as seasonality, promotion, and uneven pattern (main generator of the bullwhip effect), with them in order to improve the forecast that applies to each cluster. |
| [10] | Food safety must guarantee by reducing waste. It identifies that the resupply policy and the number of intermediaries are causing the bullwhip effect; a new replenishment model seeks to reduce the level of the bullwhip effect in supply chains of two-tier perishable goods. |
| [70] | The barrier that exists in the information of the supply chain of perishable products and the seasonality of demand and the variation of prices can affect the synchronization of the actors in the supply chain, generating the bullwhip effect. It proposes applying the strategy of sharing information in a farm-supermarket docking system of a company such as Carrefour for agricultural products to reduce the bullwhip effect and reduce the transport and intermediary time of the products. |
| [71] | The deterioration rate is a quality factor in the perishables supply chain; it affects the inventory policy. The aim is to design an inventory control system through the LQ Optimal model, which guarantees product sales without increasing the bullwhip effect. |
| [72] | Factors such as transportation and storage deteriorate the perishable product and increase the bullwhip effect in the supply chain; therefore, an inventory control system proposes to reduce the deterioration of the product in storage, transport, and at the same time, the bullwhip effect. |
| [73] | The ignorance of the deterioration time of perishable products and the variability of the delivery time makes the supply chain complex manage. These conditions raise the challenge of managing demand (causing the bullwhip effect), especially when you have more than one supplier. An LQ control system proposes that allows to guarantee a satisfactory inventory level for the customer and at the same time does not exceed the allowed storage. |
| [74] | The seasonality of the demand for perishable products and the aggregation of data (level of detail of the information) can increase the bullwhip effect and its measurement; It is evident that these conditions affect the generation of the bullwhip effect. |
| [75] | The lack of coordination between the actors in the perishables supply chain is a quality factor present in this product type. Demand management becomes a more complex activity, generating the bullwhip effect. The authors design a model for measuring and managing the bullwhip effect in supply chains. |
| [76] | The useful life of perishable products is a factor that challenges many administrators. In this case, we studied how this factor affects the size of orders since this is causing the bullwhip effect. The author designs an inventory model to identify how the deterioration of perishable products affects the batch order between the retailer and the supplier. |
| [77] | Product deterioration increases operating costs, and a non-linear inventory model proposes to reduce the bullwhip effect. |
| [78] | The cost caused by lost sales, the loss of the client, and the waste of products due to their expiration create uncertainty in operation. Three forecasting methods are proposed, such as ARIMA, ARIMAX, and Transfer function model, to decrease the uncertainty of demand and the bullwhip effect. |
| [79] | The increase in the demand for perishable products that move throughout the regions requires more significant challenges; therefore, it seeks to implement an IoT scheme in logistics processes that reduce this uncertainty and minimizes the bullwhip effect and improves the quality of the information in real-time. |
| [80] | The low collaboration between the actors in the perishables supply chain does not allow producers to have a complete vision, which implies a significant variation in prices and in-between times, increasing the bullwhip effect. |
| [81] | With the variety of perishable products and their demand, it is analysis to understand the lack of synchronization between the actors in the supply chain. RFID technology is an opportunity to improve supply chain management. Its implementation in perishables helps to have the demand signal in real-time, which is an essential element that impacts the bullwhip effect. |
| [82] | The characteristics of resupply and errors in the demand of food served on Indonesian trains are causing losses and an increase in the bullwhip effect; a mathematical model is proposed that minimizes the impact and decreases the bullwhip effect. |
| [83] | The retail of the fresh vegetable sector in India is growing. This forces to improve the quality processes with suppliers and customers, as well as the competitiveness indicators. It seeks to determine the attributes that packaging and retail must have to improve inventory management. It found that the supplier must make its daily supply process, purchases, and inventory handle it as a management of two combinations and propose to share information to reduce the bullwhip effect. |
| [84] | The research seeks to reduce the bullwhip effect in a supply chain of dairy products, which have relationship problems between the actors in the chain. The study proposes the mobile average forecasting application and optimization with Agent-Based Modeling to attack the two causes of the bullwhip effect, the price variation, and the demand variation. |
| [53] | The article focuses on the sustained growth of the cultivation of organic products in the Brazilian supply chain. A conceptual model based on the theory of costs designed to reduce the bullwhip effect, taking into account the variation in demand. |
| [85] | The quality of the information in the financial statements of the perishables supply chain is essential to measure the bullwhip effect. Depending on the economic and operational performance, the increase in this phenomenon identifies over the years. It shows that this phenomenon exists in all industries through financial data on sales and purchases, some more than in others. A model for measuring the bullwhip effect proves that it occurs every time we move away from the final consumer and can impact more than 60% of the variation in demand. |
Table 4.
Classification causes bullwhip effect vs. Quality factors perishable.
| Causes Bullwhip Effect | Quality Factors of Perishable Supply Chain | |||||||||||||
|---|---|---|---|---|---|---|---|---|---|---|---|---|---|---|
| PSC1 | PSC2 | PSC3 | PSC4 | PSC5 | PSC6 | PSC7 | PSC8 | PSC 9 | PSC10 | PSC11 | PSC12 | TOTAL | % | |
| B1 | 0 | 0.0% | ||||||||||||
| B2 | 0 | 0.0% | ||||||||||||
| B3 | 0 | 0.0% | ||||||||||||
| O1 | [64] | [83] | [61,68,69,82] | [73,79] | [83] | 7 | 17.1% | |||||||
| O2 | [62,76] | [65] | [62] | 3 | 7.3% | |||||||||
| O3 | [80] | [82] | 2 | 4.9% | ||||||||||
| O4 | 0 | 0.0% | ||||||||||||
| O5 | [64,80] | [67,82] | [65] | 4 | 9.8% | |||||||||
| O6 | [62,63,71,77,82] | [62] | 5 | 12.2% | ||||||||||
| O7 | [75] | [63,10] | 3 | 7.3% | ||||||||||
| O8 | [74] | 1 | 2.4% | |||||||||||
| O9 | [70] | [81] | [66,81] | [66,70,81] | [66,70] | 3 | 7.3% | |||||||
| O10 | 0 | 0.0% | ||||||||||||
| O11 | 0 | 0.0% | ||||||||||||
| O12 | [64,75] | [70] | [10] | [70,73] | [70] | 5 | 12.2% | |||||||
| O13 | [85] | [85] | 1 | 2.4% | ||||||||||
| O14 | 0 | 0.0% | ||||||||||||
| O15 | 0 | 0.0% | ||||||||||||
| O16 | 0 | 0.0% | ||||||||||||
| N1 | [78] | [62,72,76,77,78,82] | [72] | [73] | [62] | [78] | 7 | 17.1% | ||||||
| TOTAL | 3 | 1 | 0 | 2 | 1 | 15 | 1 | 0 | 8 | 3 | 3 | 0 | ||
| % | 8.1% | 2.4% | 0.0% | 5.4% | 2.4% | 40.5% | 2.4% | 0.0% | 21.6% | 8.1% | 8.1% | 0.0% | ||
Table 5.
Phased characterization of the perishables supply chain.
| Phases of Perishable Supply Chain | Author(s) |
|---|---|
| Pre-Harvest | - |
| Harvest | [70,79] |
| On Farmer Post Farmer/Transport Storage | [70,79] |
| Processing and Packaging | [63,64,65,66,70,71,73,77,79,81] |
| Distribution | [10,62,64,65,66,67,70,71,72,73,74,75,76,78,81,82,85] |
| Retail | [10,61,62,63,66,67,68,69,70,71,72,74,75,76,77,78,79,80,81,82,83,85] |
| Consumption | - |
Table 6.
Type of perishable products analyzed.
| Type of Perishable Product | DATA | |
|---|---|---|
| Real Case | Case Study | |
| Perishable | [63,79] | [66,71,72,73,77,85] |
| Obsolete/Out date | [64] | |
| Deteriorate/Decay: | ||
| Non-eatables | ||
| Eatables: | ||
| Animal/Birds and their produce | [76] | |
| Agricultural produce: | [65,81] | [80] |
| Long shelf life | [70] | |
| Processed produce | [10,61,68,74,75,78,82] | |
| Fresh produce | [69,83] | [62,67] |
Publisher’s Note: MDPI stays neutral with regard to jurisdictional claims in published maps and institutional affiliations. |
© 2021 by the authors. Licensee MDPI, Basel, Switzerland. This article is an open access article distributed under the terms and conditions of the Creative Commons Attribution (CC BY) license (https://creativecommons.org/licenses/by/4.0/).
Share and Cite
MDPI and ACS Style
Durán Peña, J.A.; Ortiz Bas, Á.; Reyes Maldonado, N.M. Impact of Bullwhip Effect in Quality and Waste in Perishable Supply Chain. Processes 2021, 9, 1232. https://0-doi-org.brum.beds.ac.uk/10.3390/pr9071232
AMA Style
Durán Peña JA, Ortiz Bas Á, Reyes Maldonado NM. Impact of Bullwhip Effect in Quality and Waste in Perishable Supply Chain. Processes. 2021; 9(7):1232. https://0-doi-org.brum.beds.ac.uk/10.3390/pr9071232
Chicago/Turabian StyleDurán Peña, Julián Andrés, Ángel Ortiz Bas, and Nydia Marcela Reyes Maldonado. 2021. "Impact of Bullwhip Effect in Quality and Waste in Perishable Supply Chain" Processes 9, no. 7: 1232. https://0-doi-org.brum.beds.ac.uk/10.3390/pr9071232
Note that from the first issue of 2016, this journal uses article numbers instead of page numbers. See further details here.