Article

An Experimental Investigation of Water Vapor Condensation from Biofuel Flue Gas in a Model of Condenser, (2) Local Heat Transfer in a Calorimetric Tube with Water Injection

1
Nuclear Engineering Laboratory, Lithuanian Energy Institute, Breslaujos 3, LT-44403 Kaunas, Lithuania
2
Heat Pipe and Thermal Management Research Group, College of Engineering, Design and Physical Sciences, Brunel University London, Uxbridge UB8 3PH, UK
3
Department of Energy, Faculty of Mechanical Engineering and Design, Kaunas University of Technology, Studentu 56, LT-51424 Kaunas, Lithuania
*
Author to whom correspondence should be addressed.
Submission received: 23 June 2021 / Revised: 26 July 2021 / Accepted: 27 July 2021 / Published: 29 July 2021
(This article belongs to the Special Issue Advances in Bioprocess Technology)

Abstract

:
In order for the operation of the condensing heat exchanger to be efficient, the flue gas temperature at the inlet to the heat exchanger should be reduced so that condensation can start from the very beginning of the exchanger. A possible way to reduce the flue gas temperature is the injection of water into the flue gas flow. Injected water additionally moistens the flue gas and increases its level of humidity. Therefore, more favorable conditions are created for condensation and heat transfer. The results presented in the second paper of the series on condensation heat transfer indicate that water injection into the flue gas flow drastically changes the distribution of temperatures along the heat exchanger and enhances local total heat transfer. The injected water causes an increase in the local total heat transfer by at least two times in comparison with the case when no water is injected. Different temperatures of injected water mainly have a major impact on the local total heat transfer until almost the middle of the model of the condensing heat exchanger. From the middle part until the end, the heat transfer is almost the same at different injected water temperatures.

1. Introduction

This is the second paper of the series on water vapor condensation from the flue gas in a long vertical tube—model of the condensing heat exchanger. Therefore, the review of the literature related to water vapor condensation from flue gases has already been presented in [1]. The results presented in [1] revealed that, under certain inlet flue gas conditions, the initial part of the condensing heat exchanger is not used efficiently for condensation heat and mass transfer due to the cause that the flue gas has to be cooled down until its temperature reaches the dew point temperature. Usually after that, a significant increase in heat transfer was determined due to condensation of water vapor from the flue gas. Therefore, in order to use such type of heat exchanger more efficiently from its beginning, certain parameters of the flue gas at the inlet to the exchanger should be reached.
The results presented in [1] showed that there is a necessity to reduce the flue gas temperature prior to the condensing heat exchanger in order to have condensation in the heat exchanger from its very beginning. A possible way to reduce the flue gas temperature is the injection of water into the flue gas flow [2,3]. The water injected via a nozzle creates water droplets, which in the injection chamber directly contact with the flue gas and the water vapor existing in the flue gas. Then, such a “mixture” is routed into the condensing heat exchanger. In addition, the injected water additionally moistens the flue gas and increases its humidity. Due to this, more favorable conditions for condensation and heat transfer in the condensing heat exchanger should occur. Besides, the injected water allows the recovery of some heat and water due to vapor condensation [4,5,6] and also reduces the concentration of solid particles [7] in flue gas which, when released into the atmosphere, are the main pollution sources when incinerating biofuel [8]. In addition, the benefit of the injected water is that it can be used for flue gas cleaning from acidic components [9] and for flue gas desulfurization [10].
In boiler plants, condensed moisture is usually collected at the bottom part of condensing heat exchangers. Then a part of it is routed back and injected again into the flue gas flow at the top part of heat exchangers. The efficiency of heat exchangers in boiler houses depends on the rates of injected water and gas flow and also the height and diameter of the heat exchanger [11]. The use of condensing heat exchangers in boiler plants allows significant annual fuel savings [12,13].
One of the ways to achieve better heat and mass transfer results of the condensation process is the use of direct contact condensation [14]. Direct contact condensation is the process when vapor directly contacts with water, which can result in very high heat transfer rates. However, such high heat transfer rates can be obtained only in the case of pure vapor condensation. Meanwhile, in reality there might always be a huge portion of noncondensable gases, especially when incinerating biofuels.
The study presented in [15] was dealing with the condensation heat transfer of saturated vapor in a stainless-steel cylindrical vessel (158 mm in diameter and 360 mm length), when subcooled water was sprayed into the vessel with a hollow cone nozzle. The measured increase in sprayed water temperature in the flow direction was rather significant up to x/d ≈ 10. After that, the water temperature of the spray was close to the vapor temperature.
In another study [16], an analytical model was proposed for the behavior of a water spray in vapor. The spray experiments were performed in a chamber 250 mm in diameter and 300 mm in length with pure vapor. The sprayed droplet sizes used in the experiments were in the range of 0.67–1.32 mm. The water spray pattern determined was divided into several regions. The modeling results compared with the experimental results showed a reasonable agreement. When water was sprayed into the same chamber with air (no condensation) and into the chamber with vapor (with condensation), the structure of the flow streamlines showed a considerable difference between the two cases, and the breakup spray length was shorter in the vapor environment. Moreover, the droplet size was determined to be larger in vapor than in the air environment. However, the authors did not analyze heat transfer. The influence of droplet size on heat transfer was analyzed in [17]. It was determined that the larger the droplet size, the lower the total average heat transfer obtained. The droplet radius increased from ~0.25 mm to ~0.75 mm, resulting in an average total heat transfer decrease of about 3.3 times.
In [18], the experiments were carried out in a cylindrical vessel of 610 mm diameter and 915 mm length to observe the characteristics of water spray from full cone-type coarse nozzles into water vapor. The droplet sizes of the sprayed water were in the range between 0.25 and 1 mm. The analysis of the spray photos showed that for the flow of sprayed water, the film and the droplet phases could be distinguished. The results also indicated that increasing the number of the nozzles that generated smaller drops did not have an expected impact on the heat transfer. It was concluded that heat transfer in the film phase is about five times higher than in the droplet phase.
A series of experiments on direct contact condensation of an air-vapor mixture on a water surface in a vertical test section with the dimensions of 150W × 100D × 1510L mm was carried out in [19]. The results revealed that the average condensation heat transfer coefficient for a vapor-air mixture decreased when the air mass fraction was increased. The average heat transfer coefficients obtained for different mixture velocities and condensation film Reynolds numbers were in the range between 550 and 2000 W/m2K.
The injection of water droplets in the range of 0.3–2.8 mm to humid hot air of relative humidity 80% and temperature 65–85 °C using a hollow cone nozzle was studied in [20]. The results showed that, due to direct contact condensation, vapor condenses on the surface of droplets because the temperature of water droplets is less than the dew point of air.
Although condensing heat exchangers are widely used in boiler plants, there is not much analysis done on local distributions of temperatures and processes of condensation heat and mass transfer when water is injected into the flue gas flow. The study described in [21] presented a numerical simulation of a quench tower (2.5 m in diameter and 10 m in height) for high inlet temperature (>500 °C) flue gas purification in the case of water droplets of 0.1 mm diameter injected using one to four nozzles located in the upper part of the quench tower. The temperature distribution in the center of the tower indicated that after the spraying, a large amount of flue gas heat was absorbed due to droplet evaporation. With the downward movement of the flue gas, the gas temperature was continuously decreasing and the droplets were gradually evaporating. At about 4 m from the top of the tower, the temperature of flue gas and water vapor were almost the same, and therefore the evaporation of the injected water droplets was negligible. It was determined that the gas with a high temperature was concentrated in the central part of the tower. The flue gas temperature change rates obtained using one to four nozzles for water injection showed that the highest temperature change rate in the case of one nozzle was between 1 and 3 m from the top of the tower, in the case of two, three and four nozzles it was between 2 and 4 m from the top of the tower. From almost the middle of the tower, the flue gas temperature change rate was negligible and this did not depend on the number of nozzles used. In general, spray cooling is an efficient way to reduce gas temperature, especially in confined spaces [22].
Experiments with a water spray for air cooling were carried out in a heat exchanger located in a channel with a rectangular cross section of 36 × 25 cm and a length of 1.7 m with the purpose of improving heat transfer [23]. An increase in the heat transfer of up to three times was reached for a counter-flow injection with the injected droplets smaller than 0.025 mm in diameter. A co-flow injection was found not to be very effective due to bad dispersion of the droplets. Such dispersion resulted in very heterogeneous cooling.
Heat transfer analysis in a flat tube heat exchanger showed that the heat transfer was increasing with an increasing water spraying rat; however, only up to a certain water spray flow rate. It was found that in the case of a high spraying rate, parts of the flow passage of the heat exchanger can be blocked by water droplets and this may result in regions with poor heat transfer. Thus, an optimum water spray rate should be achieved to give an increase in total heat transfer [24].
Flue gas might contain some components in vapor form, which, when condensed on the surfaces of the heat exchanger, can cause corrosion of the surfaces of heat exchanger. In such cases, it is necessary to make heat exchangers from corrosions resistant materials (stainless steel, various corrosion resistant alloys, etc.). Moreover, some reagents could be injected in order to decrease the acidity of vapors.
The literature review showed that a lot of studies are devoted to investigating pure vapor condensation when water is injected into short vessels, as well as flue gas cleaning from gaseous pollutants, solid particles and for the reduction of the temperature of the flow. In the case of biofuel incineration, the flue gas contains a significant amount of noncondensable gases with the remaining portion of water vapor, which, if condensed in an efficiently operating economizer, could increase the efficiency of the boiler station and guarantee huge fuel savings. Although condensing heat exchangers are widely used, there are no studies devoted to the local total heat transfer characteristics of condensing heat exchangers with water injection [25].
Therefore, the aim of this study was to investigate the influence of water injected into the flue gas flow on the distribution of temperatures and total local heat transfer along the model of the condensing heat exchanger.

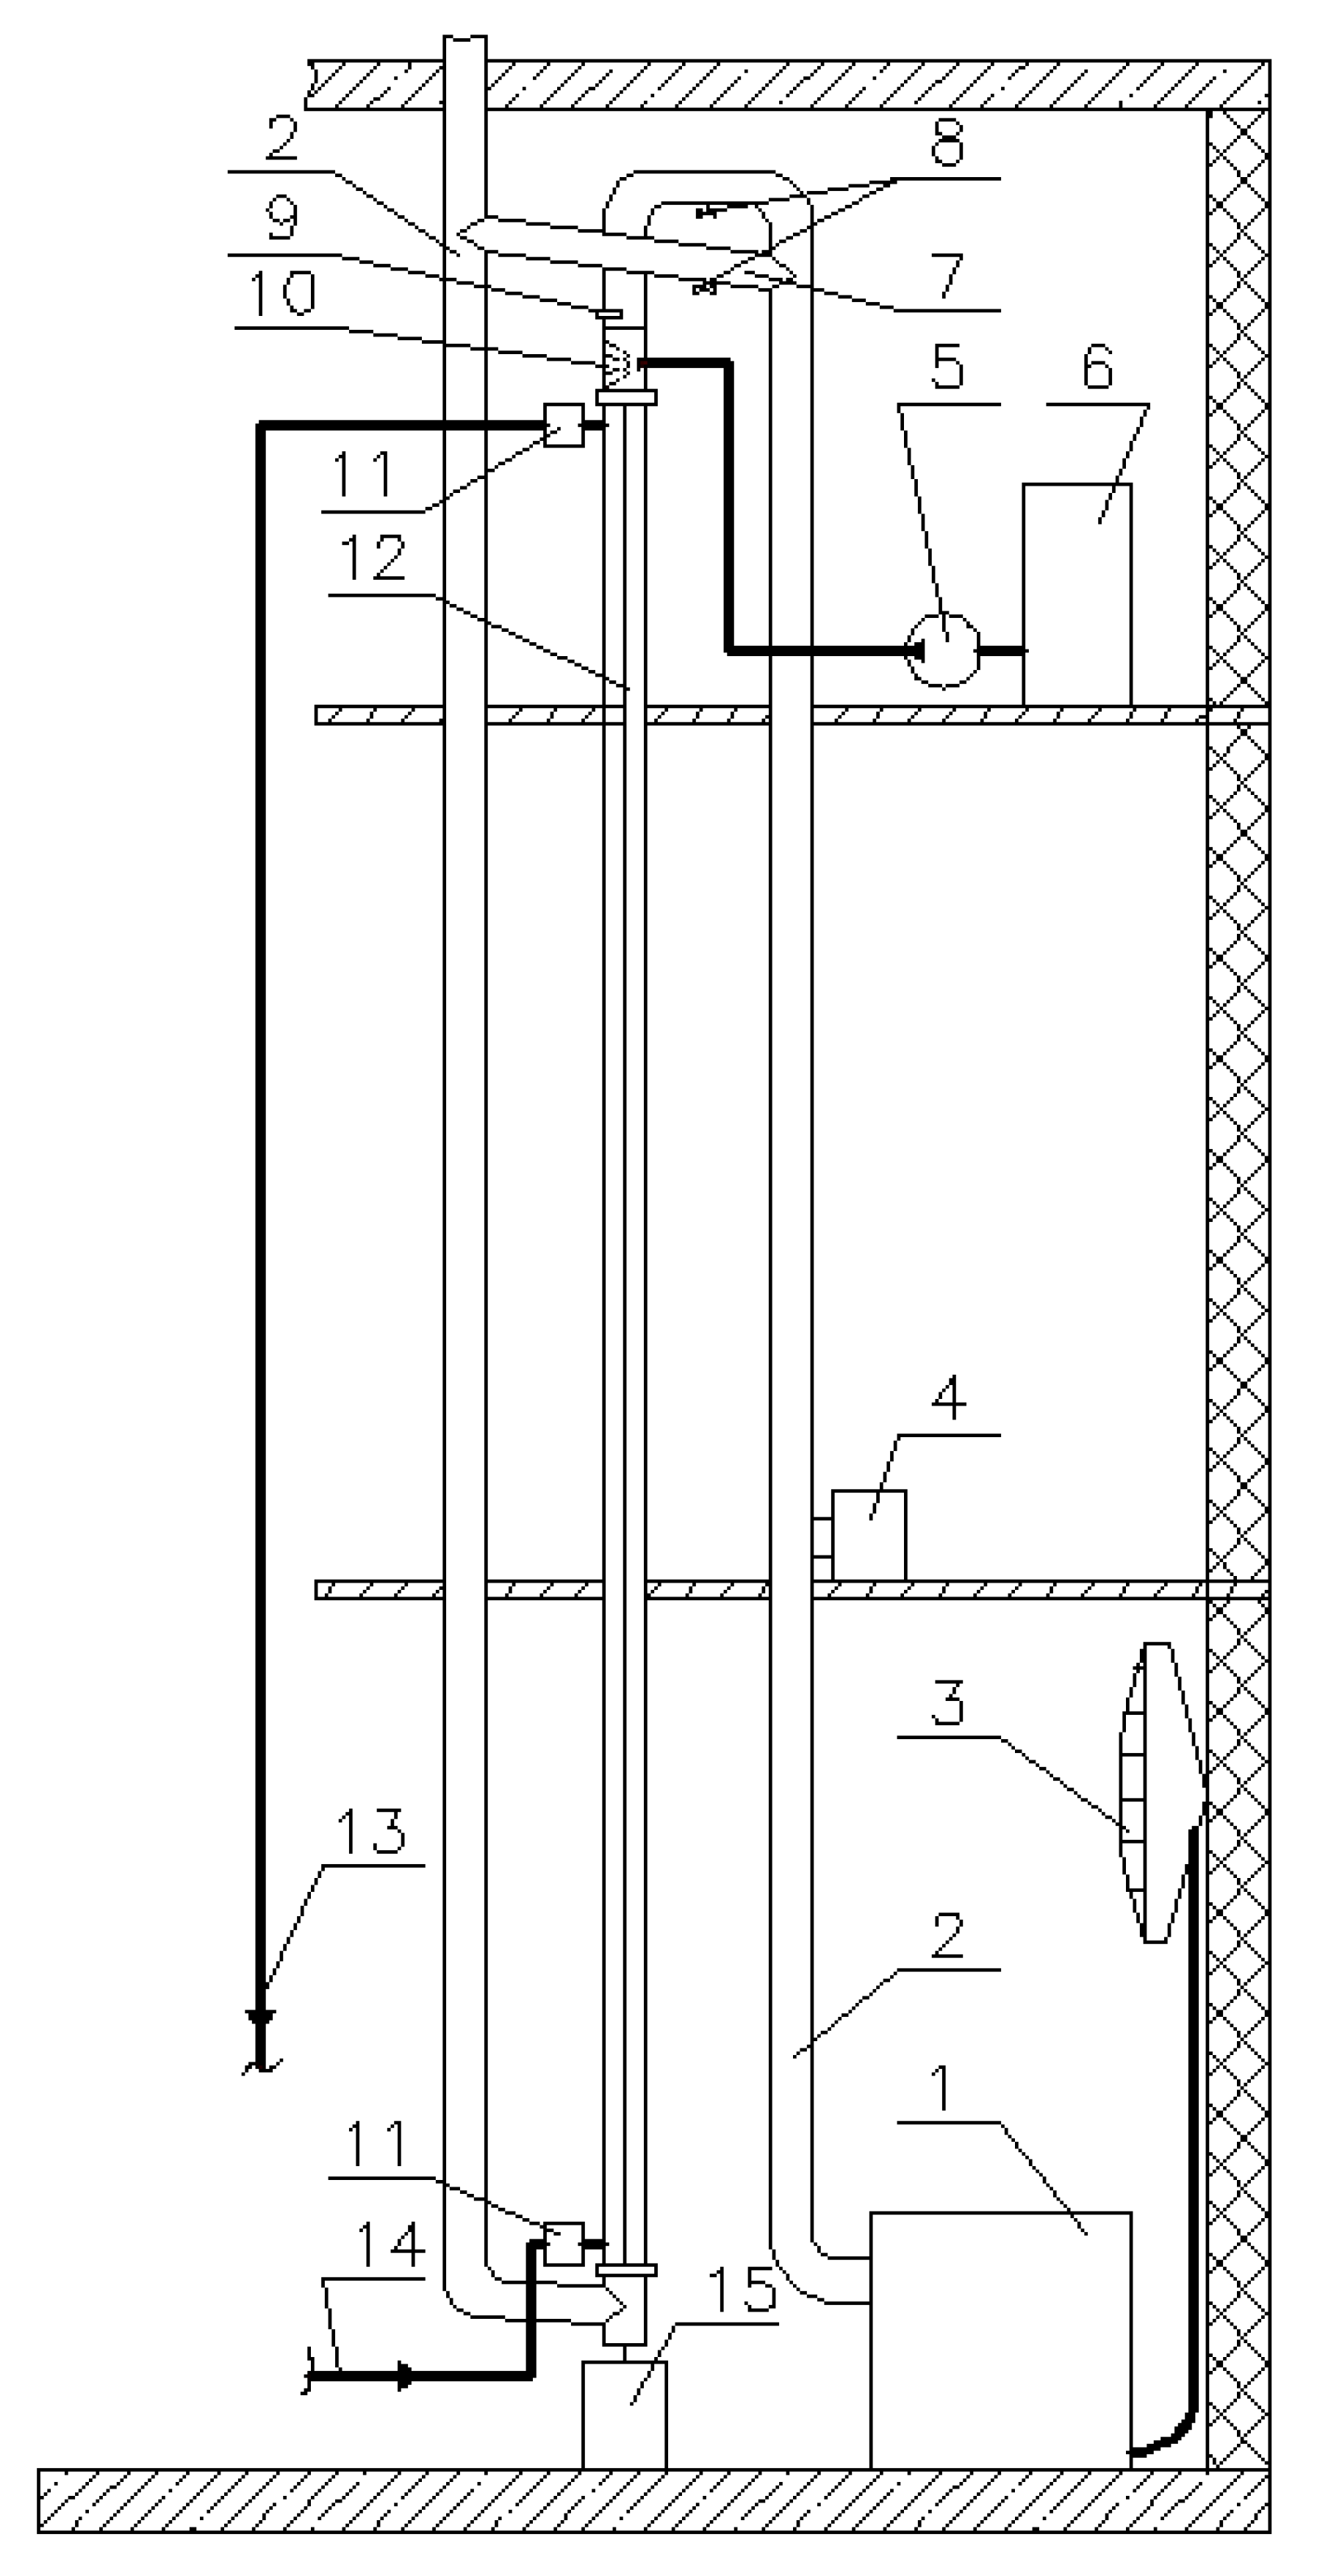
2. Experimental Setup

The experimental setup (Figure 1) which was used for the investigations was the same as described in [1]. However, some minor changes necessary for water injection were introduced and are described further.
To generate flue gas from incinerated wood pellets, the automatic boiler Kostrzewa (Poland) from the first experiments (without water injection) was used. The boiler has a maximum power of 50 kW. The power can be adjusted in a certain range according to the needs. Flue gas generated with a temperature of about 180–190 °C at the exit from the boiler was routed into the experimental section. Using the economizer of the boiler, different temperatures of the flue gas could be obtained at the inlet to the test section.
Dampers were used for flue gas flow rate adjustment. After that, the flue gas was supplied to the top of the test section, flowed via the internal vertical calorimetric tube, passed it, flew to the flue gas chimney and discharged into the atmosphere.
The test section was made of stainless steel. It was composed of an internal calorimetric tube (length x ≈ 5.8 m, inner diameter d = 0.034 m, wall thickness δ = 2 mm, x/d ≈ 170) where condensation takes place on its internal surface and an outer tube (length x ≈ 5.9 m, inner diameter D = 0.108 m) [1].
A water injection chamber with one nozzle was installed just before the inlet into the calorimetric tube. The internal diameter of the chamber was 100 mm and the height 250 mm. The nozzle for water injection was mounted in the middle of the chamber’s height at its side surface. Therefore, the directions of flue gas flow and water injection to the gas flow were perpendicular to each other. The distilled water was supplied to the nozzle via a flexible hose from the water tank with a pump. The hose was insulated using 6 mm thick polyethylene insulation.
All of the experimental section as well as flue gas chimney were also insulated using 5 cm thick rockwool insulation.
For cooling the calorimetric tube, water from a municipal water supply network was supplied in the space between the inner and outer tubes. Flow rate of the cooling water was measured at its discharge line by weighing, and the necessary rate was adjusted by the valve. To have uniform inlet temperature before entering the experimental section at its bottom, the water was mixed in the water mixer. When leaving the experimental section, the water was also mixed in the same type of mixer. During the experiments, the condensed and injected water was collected in a collection tank.

3. Materials and Methods

The investigations were performed using different inlet flue gas temperatures and for two different Reynolds numbers at the inlet into the calorimetric tube. The water vapor mass fraction in the flue gas of about 17% was achieved when incinerating biofuel pellets in the boiler and additionally spraying water into the furnace of the boiler due to the reasons indicated in [1].
Calibrated chromel-copel thermocouples (wire diameter 0.2 mm, accuracy ±0.3%) were installed to measure flue gas (20 pieces), inner wall of the calorimetric tube (20 pieces) and cooling water temperatures (10 pieces) along the model of the condensing heat exchanger. The same type of thermocouples (3 pieces) was also installed in each of the water mixers. For details see [1].
During the experiments, all the thermocouple data were collected using the Keithley data acquisition system. Flue gas inlet temperature (tin, °C) and inlet relative humidity (RHin, %) were measured using a KIMO C310 sensor installed before the inlet to the water injection chamber (250 mm before inlet into the calorimetric tube). Therefore, Rein and dew point temperatures indicated in the Figures presented in this article were calculated based on these parameters. Bellmouth with installed Pitot and Prandtl tubes connected to a differential micromanometer [1] was used to measure the inlet flue gas flow rate.
The flow rate of the cooling water was determined using weighing method. Experiments were carried out for a cooling water flow rate of 60 kg/h. The cooling water temperature at the inlet to the test section was about 9–10 °C.
The flow rate of the water injected into the flue gas stream was defined by the water level change in the distilled water tank, applying the weighing method. During experiments, the flow rate of the injected water was 33.6 kg/h (or 0.56 kg/min). According to the manufacturer of the injector, the injector used in experiments was the full cone injector and the droplets generated by it are in the range of 36–864 μm. The Sauter mean diameter of the droplet is 481 μm and the surface mean diameter is 361 μm.
The temperature of the injected water was measured by two thermocouples installed at the bottom of the distilled water tank—in the zone where the water take-up by the pump was realized. The distilled water tank was equipped with electric heating coils, and a mixer installed in the tank allowed to have a uniform temperature of the water. The temperature of the water injected into the injection chamber was about 25 °C. For the purpose of comparison between the heat transfer results, it was also increased to about 40 °C.
In the formulas presented further the properties (cp, λ, etc.) of the flue gas and water vapor mixture were calculated using formulas presented in [26]. The properties were calculated based on the flow temperature measured in the center of the calorimetric tube.
The total local heat flux was obtained as
q t i = m H 2 O i ·   c p H 2 O i π · d · d t H 2 O i d x ,
where mH2O is inlet mass flow rate of the cooling water, kg/s, cpH2O is specific heat of the water, kJ/kg·°C, dtH2O/dx is the slope of the cooling water temperature gradient, determined as the least squares polynomial fit of the coolant temperature as a function of the length of the heat exchanger model, and d is the inner diameter of the calorimetric tube, m.
The local total heat transfer coefficient was calculated as
α t i = q t i / ( t c t w ) i ,
where tc is the temperature measured in the center of the calorimetric tube, °C, tw is the measured inner wall temperature of the calorimetric tube, °C.
The total Nusselt number:
N u t i = α t i · d / λ i
To evaluate the performance of the condensing heat exchanger, the condensation efficiency (%) was used [27]. Condensation efficiency was calculated as
n c d = m c d m H 2 O i n · 100 ,
where mcd is the mass flow rate of the condensate, kg/s, mH2Oin is the inlet flow rate of the water vapor, kg/s.
The condensate mass flow rate was obtained:
m c d = m Σ m i n j h ,
where mΣ is the total water mass collected in the collection tank, kg, minj is the mass of the injected water, kg and h is the time, s.
Flue gas Reynolds number at the inlet to the calorimetric tube was calculated based on the flue gas parameters before the water injection section:
R e i n = u i n · d / ν i n ,
where uin is the flue gas bulk velocity in the calorimetric tube, m/s, d is the inner diameter of the calorimetric tube, m, νin is the kinematic viscosity, m2/s.
The uncertainty of the data evaluated by using the methodology presented in [28] showed that for the Nusselt number the uncertainty is 6–14%.

4. Results and Discussions

Experiments with water injection were carried out for different injected water temperatures, and different flue gas temperatures (tin) and Reynolds numbers (Rein) at the inlet into the calorimetric tube.

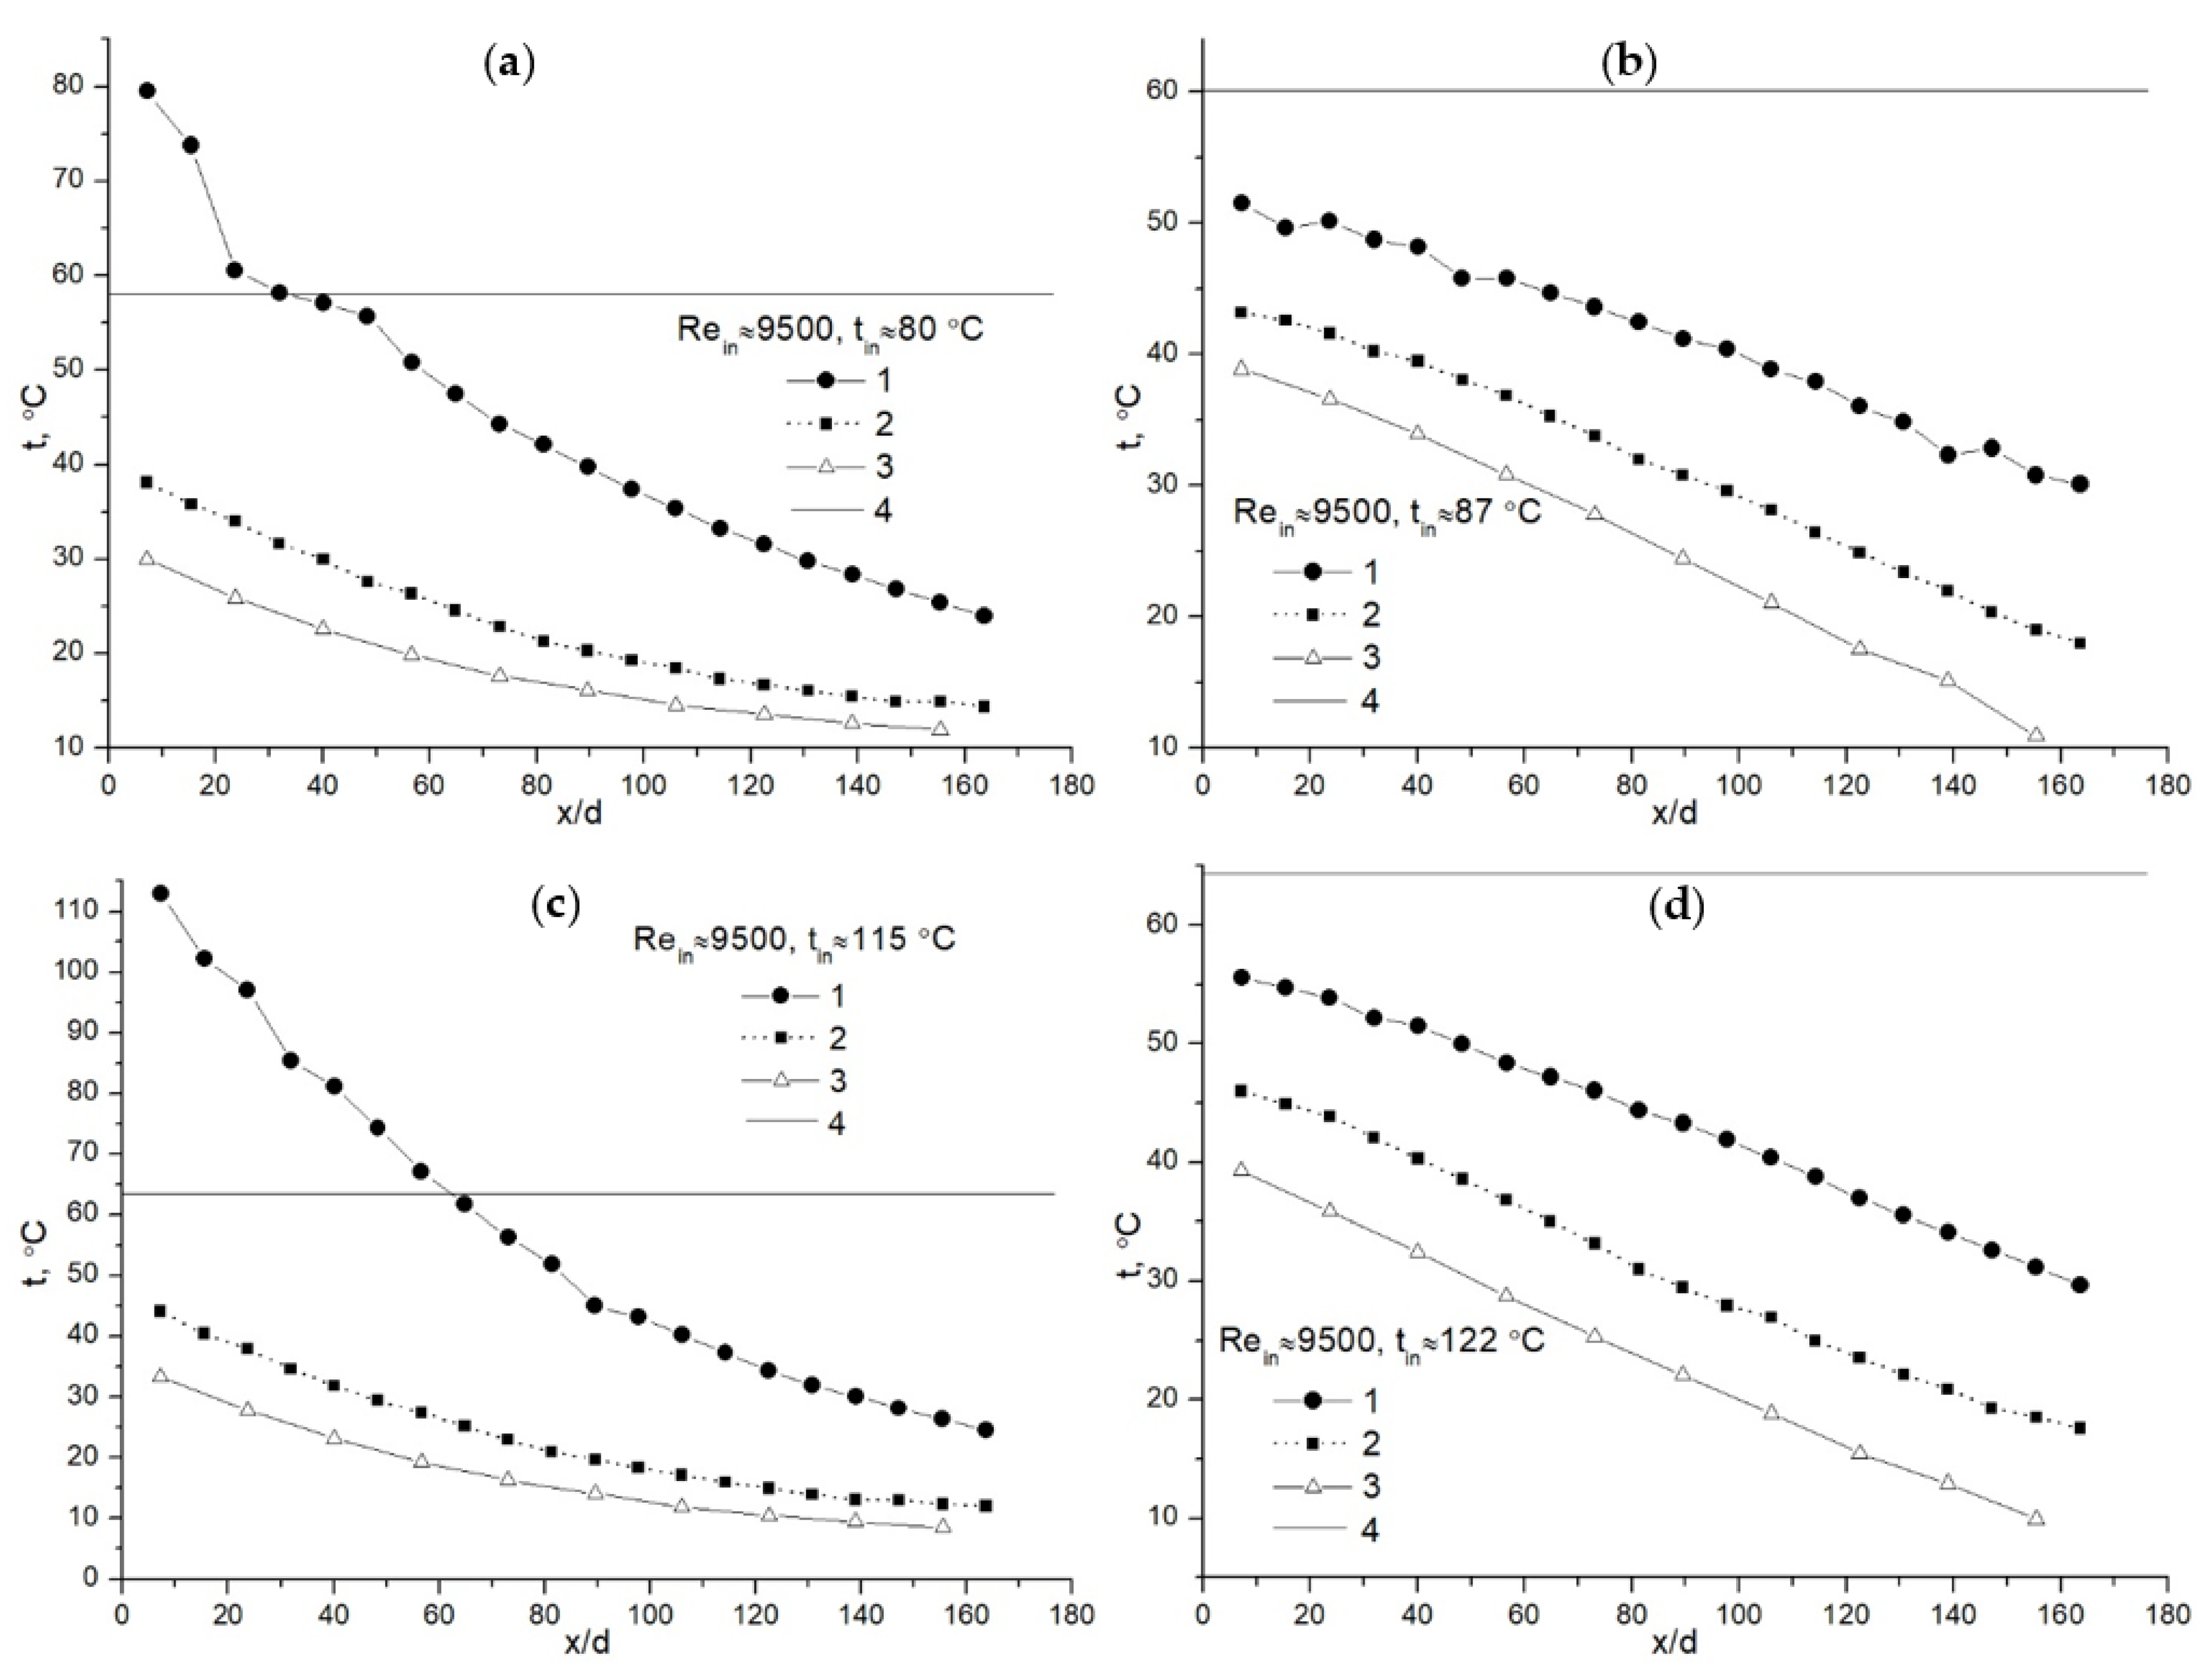
4.1. Water Injection with a Temperature of 25 °C

Figure 2 presents typical distribution of temperatures along the model of the condensing heat exchanger at the same inlet Reynolds number (Rein), different inlet flue gas temperatures and in cases when no water was injected and when water was injected into the flue gas flow. The dew point temperature at the inlet to the test section for the cases presented was calculated according to tin, RHin and using the equations presented in [29] and was in the range of ~58–64 °C (the dew point temperature was calculated according to tin, RHin, i.e., results before injection section).
If the condenser wall temperature from the flue gas flow side is lower than the dew point temperature, water vapor should start to condensate on the wall of a calorimetric tube. If the temperature of the flue gas in the center of a calorimetric tube reaches the dew point temperature, water vapor should start to condense in all its volume.
For all the cases shown in Figure 2, the tube wall temperature (curve 2) is much lower than the dew point temperature. Therefore, condensation on the wall of the calorimetric tube should start from the beginning of the tube and the results of heat transfer presented in Figure 3 (curve 1) confirm that.
The flue gas temperature measured in the center of the calorimetric tube rather rapidly and almost linearly decreases from x/d = 0 to x/d ≈ 20 for about 20 °C (Figure 2a, curve 1), then some stabilization of the temperature between x/d ≈ 20–40 is observed and after that, until the end of the tube, it decreases gradually. The stabilization of temperature (Figure 2a, curve 1) could mean that the condensation of vapor occurred in the whole cross section of the calorimetric tube, and due to this, a sudden increase in the total heat transfer was obtained in the x/d range between 20–40 (Figure 3, curve 1). Further on, as some vapor is condensed and the difference between the flue gas and the tube wall temperature is decreasing (Figure 2a, curves 1 and 2), heat transfer is also gradually decreasing; however, the results show that it is still rather high and at the end of the calorimetric tube Nut is ≈ 140 (Figure 3, curve 1).
The cooling water temperature (Figure 2a, curve 3) from the inlet into the model of the condensing heat exchanger (x/d ≈ 170) until the outlet (x/d = 0) is gradually increasing. Initially, the increase from the inlet until x/d ≈ 70 is slight and from x/d ≈ 70 until the outlet it is more pronounced. This means that the heating of water in this section of the model of the condensing heat exchanger (x/d ≈ 0–70) is more intense due to the prevailing condensation process. In total, via all of the test section, the cooling water temperature increases by about 20 °C—from ~10 °C to ~30 °C.
When water of about 25 °C started to be injected into the flue gas flow, the character of the temperatures presented in Figure 2b is different in comparison to those presented in Figure 2a when no water was injected.
Although the flue gas temperature before the water injection chamber was about 87 °C, after mixing with the injected water, at the beginning of the calorimetric tube the flue gas temperature decreases to ~52 °C (Figure 2b, curve 1). The results show that the flue gas temperature from the beginning until the end of the tube is constantly decreasing and at the exit from the tube it is about 30 °C. Therefore, the injection of water reduces the flue gas temperature, and it is likely that at the same time, due to the evaporation of the injected water, an increase in the humidity of the flue gas flow occurs. These factors ensure better conditions for condensation in the calorimetric tube.
The characteristics of the tube wall temperature and cooling water temperature variation along the tube (Figure 2b, curves 2 and 3) are almost the same as the characteristic of flue gas temperature. Figure 2b also shows that the temperature differences between flue gas and tube wall, and between tube wall and cooling water, are almost constant through all the length of the model of the condensing heat exchanger and are in the range of 7–10 °C.
Water injection had a significant impact on total local heat transfer (Figure 3, curve 2). The heat transfer starts to increase from the beginning of the tube from Nut ≈ 400 until Nut ≈ 550 at x/d ≈ 60. The intensification could be related to the conditions suitable for condensation, i.e., a low flue gas temperature, and a possibly increased amount of vapor in the flue gas. Later, the heat transfer starts to decrease. This is related to the fact that some water vapor is condensed and such a tendency remains almost until the end of the tube. In general, the injection of water in comparison with experimental results when no water was injected allowed the increase of the local total heat transfer at least by two times. Condensation efficiencies for the cases when no water was injected and when it was injected did not differ very much—they were 64 and 76%, respectively.
In the case of a higher inlet flue gas temperature (Figure 2c), the flue gas temperature decreases rather sharply until x/d ≈ 90. Then, until the flue gas exits the tube, the decrease in the flue gas temperature becomes smaller (Figure 2c, curve 1). Comparing this with the case presented in Figure 2a, it is obvious that the point of a more sudden flue gas temperature decrease extends farther from the beginning of the tube, i.e., from x/d ≈ 30 to x/d ≈ 90. In this case, the characteristic of the tube wall temperature is also similar to that of the cooling water temperature (Figure 2c, curves 2 and 3). The cooling water temperature increases slightly from the inlet (x/d ≈ 170) until x/d ≈ 90, and from x/d ≈ 90 until the exit, the increase in the cooling water temperature is bigger, which indicates that the water is receiving more heat due to vapor condensation.
The comparison of local total heat transfer in cases of lower and higher inlet flue gas temperatures (Figure 3, curves 1 and 3) without water injection indicates that the main differences are at the beginning of the tube. In the case of a higher inlet flue gas temperature, lower heat transfer was obtained due to conditions unfavorable for intense condensation heat transfer. Further, as the flue gas cooled down, there were almost no differences in heat transfer from x/d > 80 for both inlet flue gas temperatures.
When the flue gas inlet temperature was increased to ~122 °C and water was injected into the flow, all the temperatures (Figure 2d) measured in the test section increased only by about 3–4 °C in comparison with the case presented in Figure 2b. The decreasing characteristics and temperature differences (Figure 2d, curves 1–3) remained almost constant and in the range of 8–12 °C along the tube. Water injection in this case resulted in much higher total heat transfer in comparison to the case when no water was injected (Figure 3, cf. curves 3 and 4). Because the flue gas inlet temperature at the injection chamber (Figure 2d) is rather high and exceeds 100 °C, some injected water in the injection chamber evaporates, and the flue gas with possibly increased water vapor content enters the calorimetric tube. In the tube, it starts to condense, resulting in very high heat transfer (Figure 3, curve 4, Nut ≈ 600 in x/d range between 0 and ~30). As some water vapor is condensed initially in the calorimetric tube, heat transfer starts to decrease gradually along the tube. This means that the influence of condensation also decreases yet is still dominant. The comparison of total heat transfer in cases when no water was injected and when it was injected (Figure 3, curves 3 and 4) indicates that water injection results in a local total heat transfer increase by at least about four times.
In this case, water injection allowed an increase in the condensation efficiency by about 12%—from 52% (without water injection) to about 64% (with water injection).
Temperature distributions in the case of a higher inlet flue gas Reynolds number (Rein ≈ 21,000) are presented in Figure 4. It should be noticed that in this case, the characteristics of the temperature distributions differ from those obtained for lower Rein numbers (Figure 2). For all the cases presented in Figure 4, the tube wall temperature (Figure 4, curve 2) is also lower the dew point temperature.
Figure 4a,c shows that with the increase in flue gas Rein, the part of the calorimetric tube where a sharp flue gas temperature decrease is noticed (Figure 4a,c, curve 1) extends farther, i.e., until x/d ≈ 120–130 in comparison with lower Rein numbers (Figure 2a,c). After that, a not so sharp decrease in temperature is observed. The tube wall and the cooling water temperatures demonstrate identical changes with position in the model of the condensing heat exchanger. The cooling water temperature increases intensively from the inlet (x/d ≈ 170) until x/d ≈ 40, from 15 °C until 46 °C, then the increase is less intense, and finally, at the outlet the cooling water temperature is about 52 °C (Figure 4a, curve 3). Although the tube wall temperature is less than the dew point temperature, the difference between these temperatures in comparison with the results presented in Figure 2a,c is not significant: 2–4 °C. Due to this, the condensation at the beginning of the tube is not intensive (Figure 5, curve 1). As the temperature difference (the driving force of the condensation heat transfer) between the dew point temperature and the tube wall temperatures increases with x/d (Figure 4a), the Nusselt number also increases until x/d ≈ 130 (Figure 5, curve 1). Further on, the Nusselt number decreases slightly, possibly due to a decrease in the water vapor mass fraction in the flue gas flow, and thus, condensation also becomes weaker.
In the case with water injection at higher flue gas Rein, the characteristics of temperature variations (Figure 4b) are different in comparison to those obtained for a lower Rein number with water injection (Figure 2b). Due to water injection, the flue gas temperature decreases from 97 °C to 58 °C. Further, in the calorimetric tube, the flue gas temperature decreases slightly from the inlet until x/d ≈ 110 (Figure 4b, curve 1). After that, a more pronounced decrease is observed. The distribution of the cooling water temperature indicates that the water is gaining heat rather intensively from the inlet (x/d ≈ 170) until x/d ≈ 50 (Figure 4b, curve 2). In this region, the water temperature increases by about 35 °C (from 15 to 50 °C). From x/d ≈ 50 until the outlet, the water temperature increased insignificantly, i.e., by ~5 °C, up to ~ 55 °C. The tube wall temperature characteristic (Figure 4b, curve 3) is similar to the cooling water temperature characteristic.
In general, from the temperature distribution results presented in Figure 4b it is evident that from x/d ≈ 50 till the end of the model of the condensing heat exchanger, the differences between flue gas, tube wall and water temperatures increase significantly.
Heat transfer data presented in Figure 5 (curves 1 and 2) indicate that condensation occurs at the beginning of the calorimetric tube, and here the Nut obtained when no water was injected and when it was injected are almost the same. However, in the case with water injection (Figure 5, curve 2), the heat transfer increases rapidly until x/d ≈ 60 and Nut reaches ~1450. Then, it decreases gradually until the end of the tube. The increase indicates that the injection of water intensifies heat transfer due to the influence of condensation, and then, as the water vapor is being condensed, the heat transfer gradually decreases. At the end of the tube, Nut is still high—about 1000.
Condensation efficiencies for the cases without and with water injection were 52% and 73%, respectively. In general, the results of condensation efficiency show that higher efficiency is obtained at lower Rein numbers. At lower Rein, the time of the flue gas travelling through the calorimetric tube is longer, and thus more water vapor is condensed.
At a higher flue gas inlet temperature (Figure 4c,d), the distribution of temperatures obtained are very similar to the case of a lower inlet flue gas temperature for the cases without and with water injection (Figure 4a,b), respectively. The difference is that the absolute values of the temperatures in the case of a higher flue gas inlet temperature are slightly higher.
The characteristics of the local total Nusselt numbers in the case of a higher flue gas inlet temperature without and with water injection (Figure 5, curves 3 and 4) are similar to the Nusselt numbers in the case of a lower flue gas inlet temperature without and with water injection (Figure 5, curves 1 and 2). The difference is that in the case of a higher flue gas inlet temperature and using water injection, the maximum value of Nut was ≈ 1500, and with a lower flue gas inlet temperature it was lower, i.e., about 1200 (Figure 5, curves 2 and 4). However, condensation efficiency does not differ very much, as it is 42% and 49% for the cases when no water was injected and when it was injected, respectively.
From the results presented in Figure 5 for the cases without water injection (curves 1 and 3), it is evident that the flue gas inlet temperature, especially in the beginning of the tube (x/d = 0–80), has a definite influence on heat transfer. The lower the flue gas inlet temperature, the higher the heat transfer obtained in the beginning of the tube. This means that at a lower flue gas inlet temperature, a better condition for more intense condensation heat transfer is created. Farther on (x/d = 80–170), as the flue gas temperature decreases, the heat transfer remains almost the same independently of the flue gas inlet temperature (Figure 5, curves 1 and 3), i.e., the same tendencies exist as for the lower Rein number (see Figure 3, curves 1 and 3).
In the case of water injection, the opposite can be noticed: the higher flue gas inlet temperature, the higher heat transfer (see Figure 3 and Figure 5, curves 2 and 4).

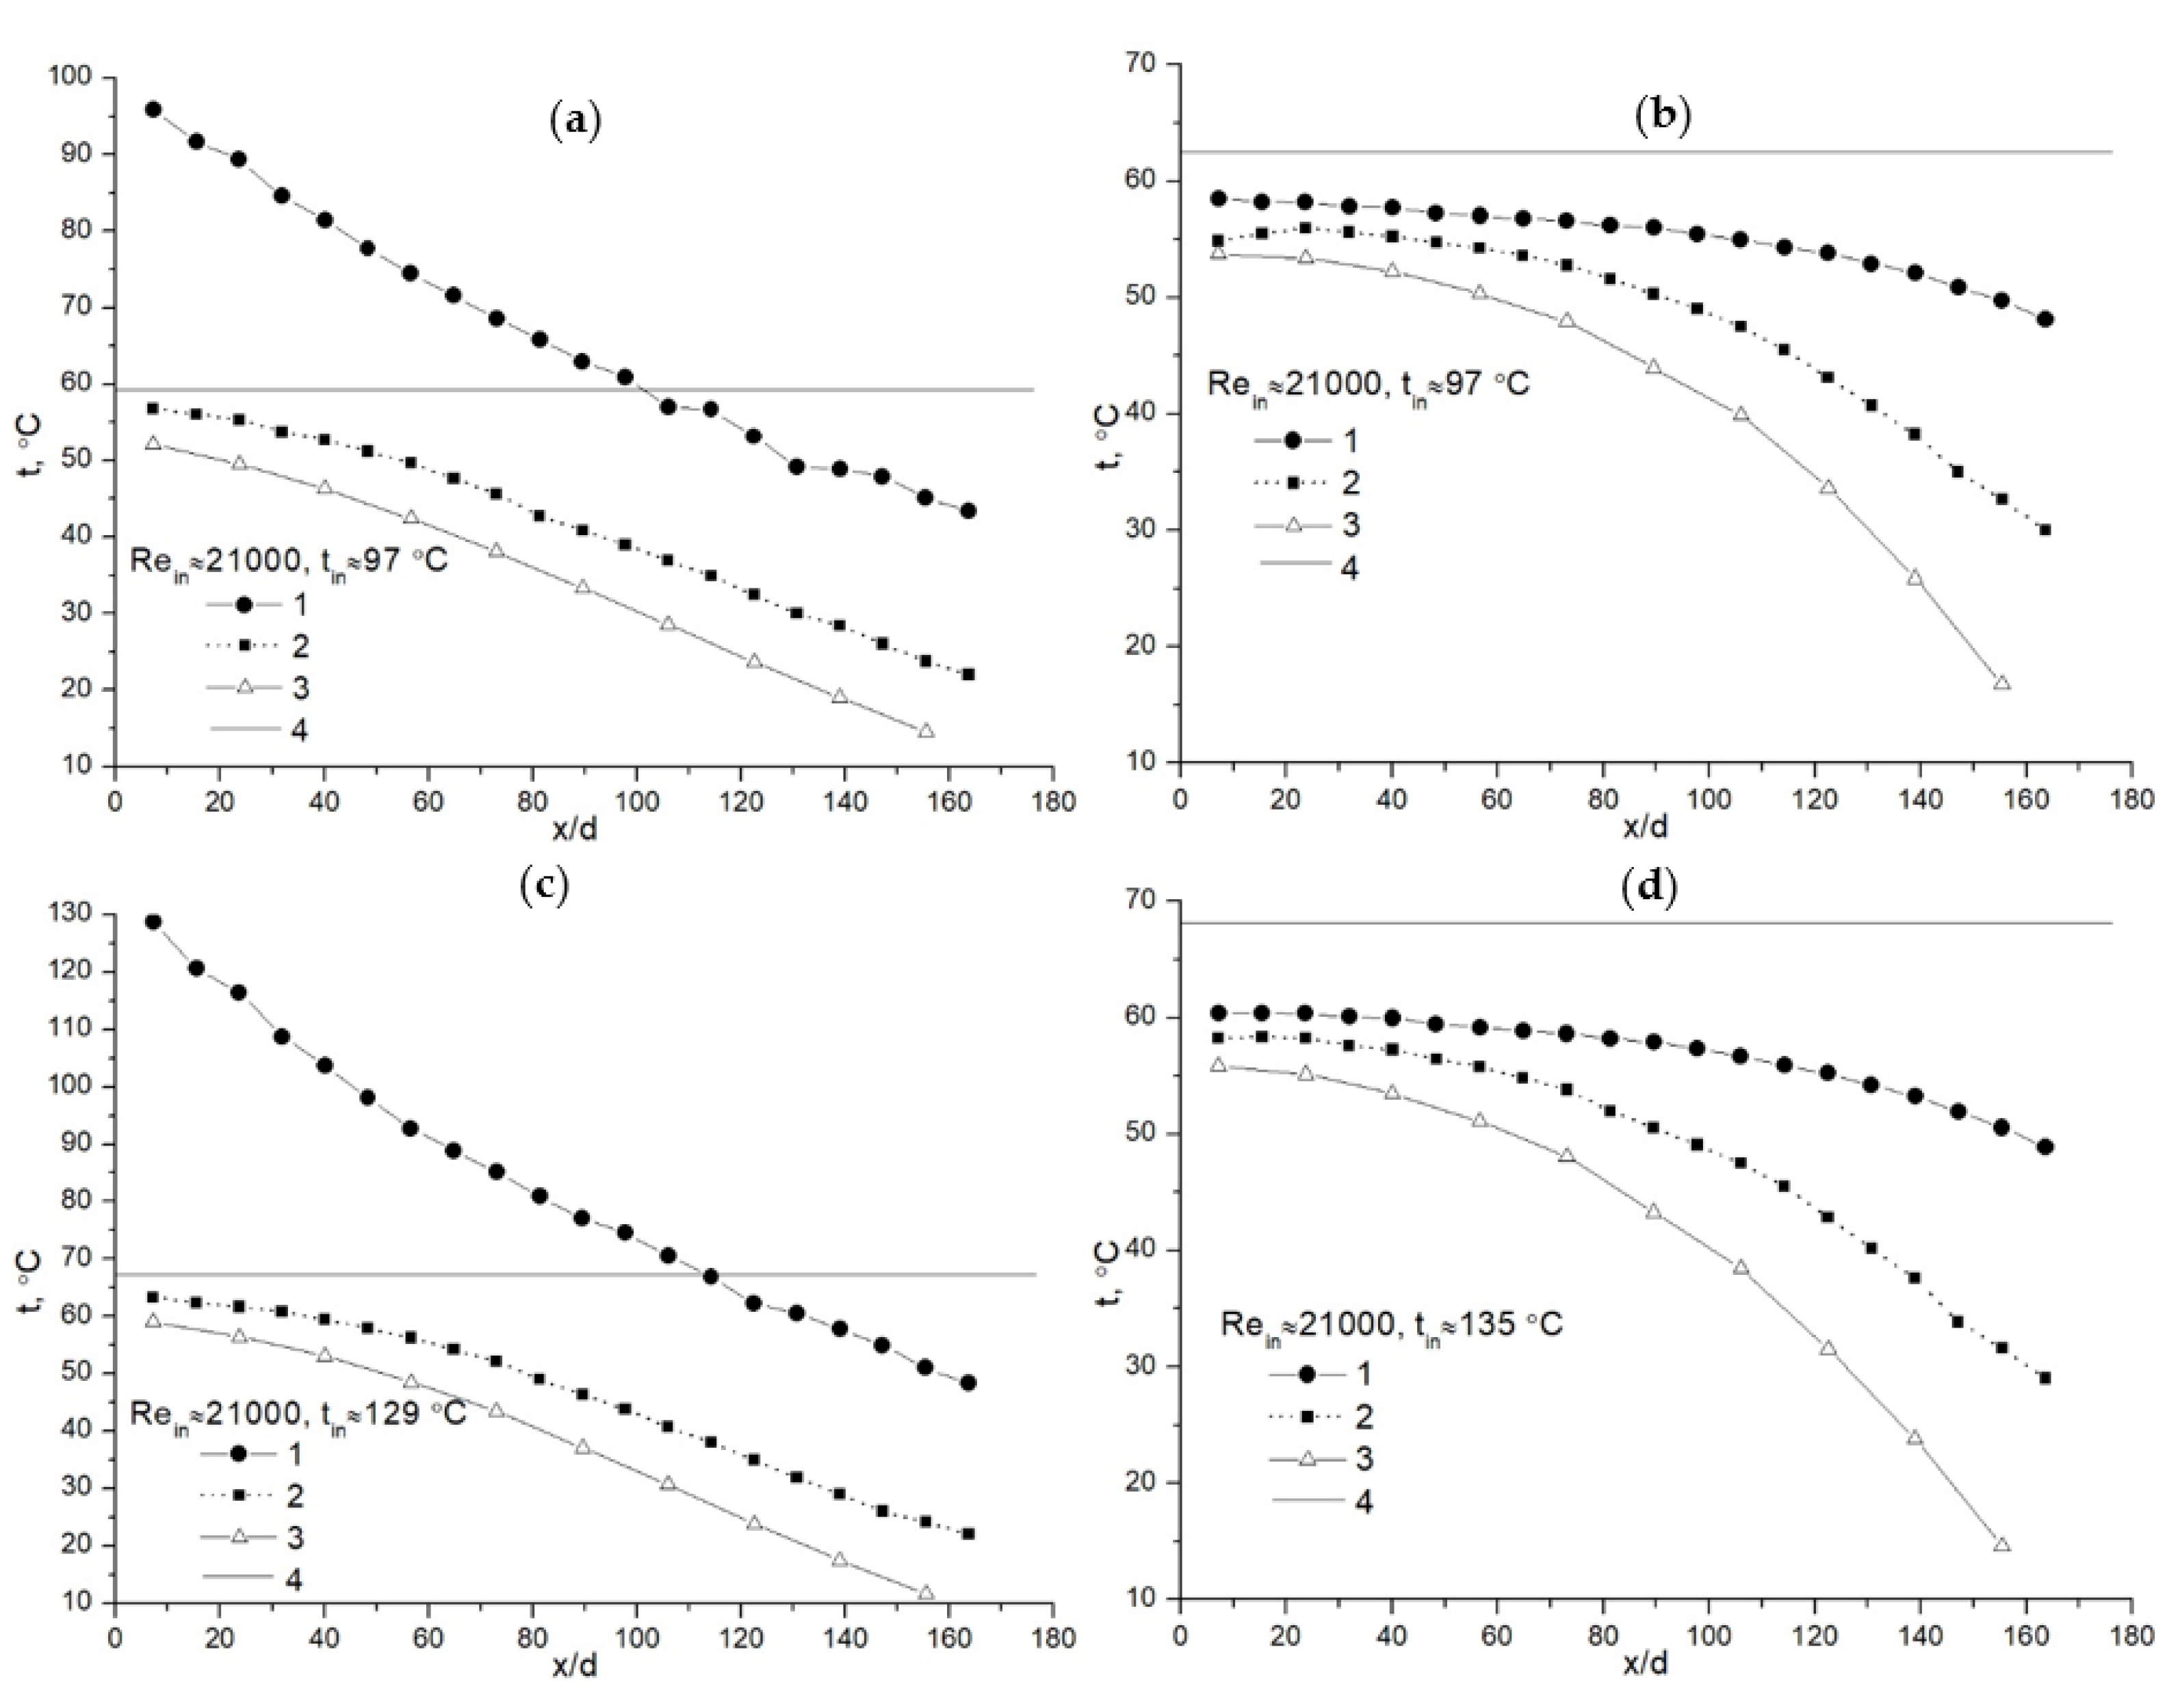
4.2. Water Injection with a Temperature of 40 °C

The temperature of the injected water was chosen to be 40 °C because it is a typical temperature of condensed water vapor obtained at the bottom of condensing heat exchangers in heating power plants. Condensed water in power plants is routed back to the flue gas inlet into the condensing heat exchanger and injected into the flue gas flow.
Temperature distributions for different flue gas inlet temperatures when water was injected into the calorimetric tube are presented in Figure 6. In general, the characteristics of the curves are the same as presented for the case when water of 25 °C was injected (Figure 2b,d). The difference is that all the temperatures obtained for the current case are higher by about 3–5 °C in comparison with the case when water of 25 °C was injected.
Heat transfer results indicate that in the case of a lower flue gas inlet temperature (Figure 7, curve 1), heat transfer at the beginning of the tube is higher by at least 1.3 times and in the case of a higher flue gas inlet temperature (Figure 7, curve 2), it is higher by at least 1.5 times in comparison with the results when water of 25 °C was injected (Figure 3, curves 2 and 4).
Heat transfer data obtained for different flue gas inlet temperatures (Figure 7) show a decreasing trend along the calorimetric tube. From about the middle of the tube (x/d > 100) there are almost no differences in heat transfer for different flue gas inlet temperatures, and from x/d > 150 heat transfer is almost the same (Nut ≈ 350–380), as obtained for the case when the injected water temperature was 25 °C (Figure 3, curves 2 and 4).
The same trends of heat transfer were obtained in the calorimetric tube as described previously for the cases with water injection: the higher the flue gas inlet temperature, the higher the heat transfer. However, it should be noticed that for the case with injected water of 40 °C, higher heat transfer for different flue gas inlet temperatures remains only over a short distance along the calorimetric tube (up to x/d ≈ 50, then the difference lessen).
Although the distribution of Nut shows some differences in Figure 7, the condensation efficiencies obtained for different flue gas inlet temperatures tin ≈ 88 °C and tin ≈ 125 °C do not differ very much and are about 77–78%.
The characteristics of temperature distributions at a higher inlet flue gas Reynolds number (Figure 8) do not differ from those presented in the case of a higher inlet flue gas Reynolds number and using a lower injected water temperature (Figure 4b,d); the temperatures obtained are higher by a few degrees.
The influence of flue gas inlet temperature on total local heat transfer is presented in Figure 9. For both flue gas inlet temperatures, the heat transfer is almost the same up to x/d ≈ 20. After that, the heat transfer is about 1.2 times higher in the case of the higher flue gas inlet temperature. This tendency and distribution characteristic remain almost until the end of the calorimetric tube for both flue gas inlet temperatures.
Condensation efficiency in this case almost does not differ and is about 48–49% for both flue gas inlet temperatures.

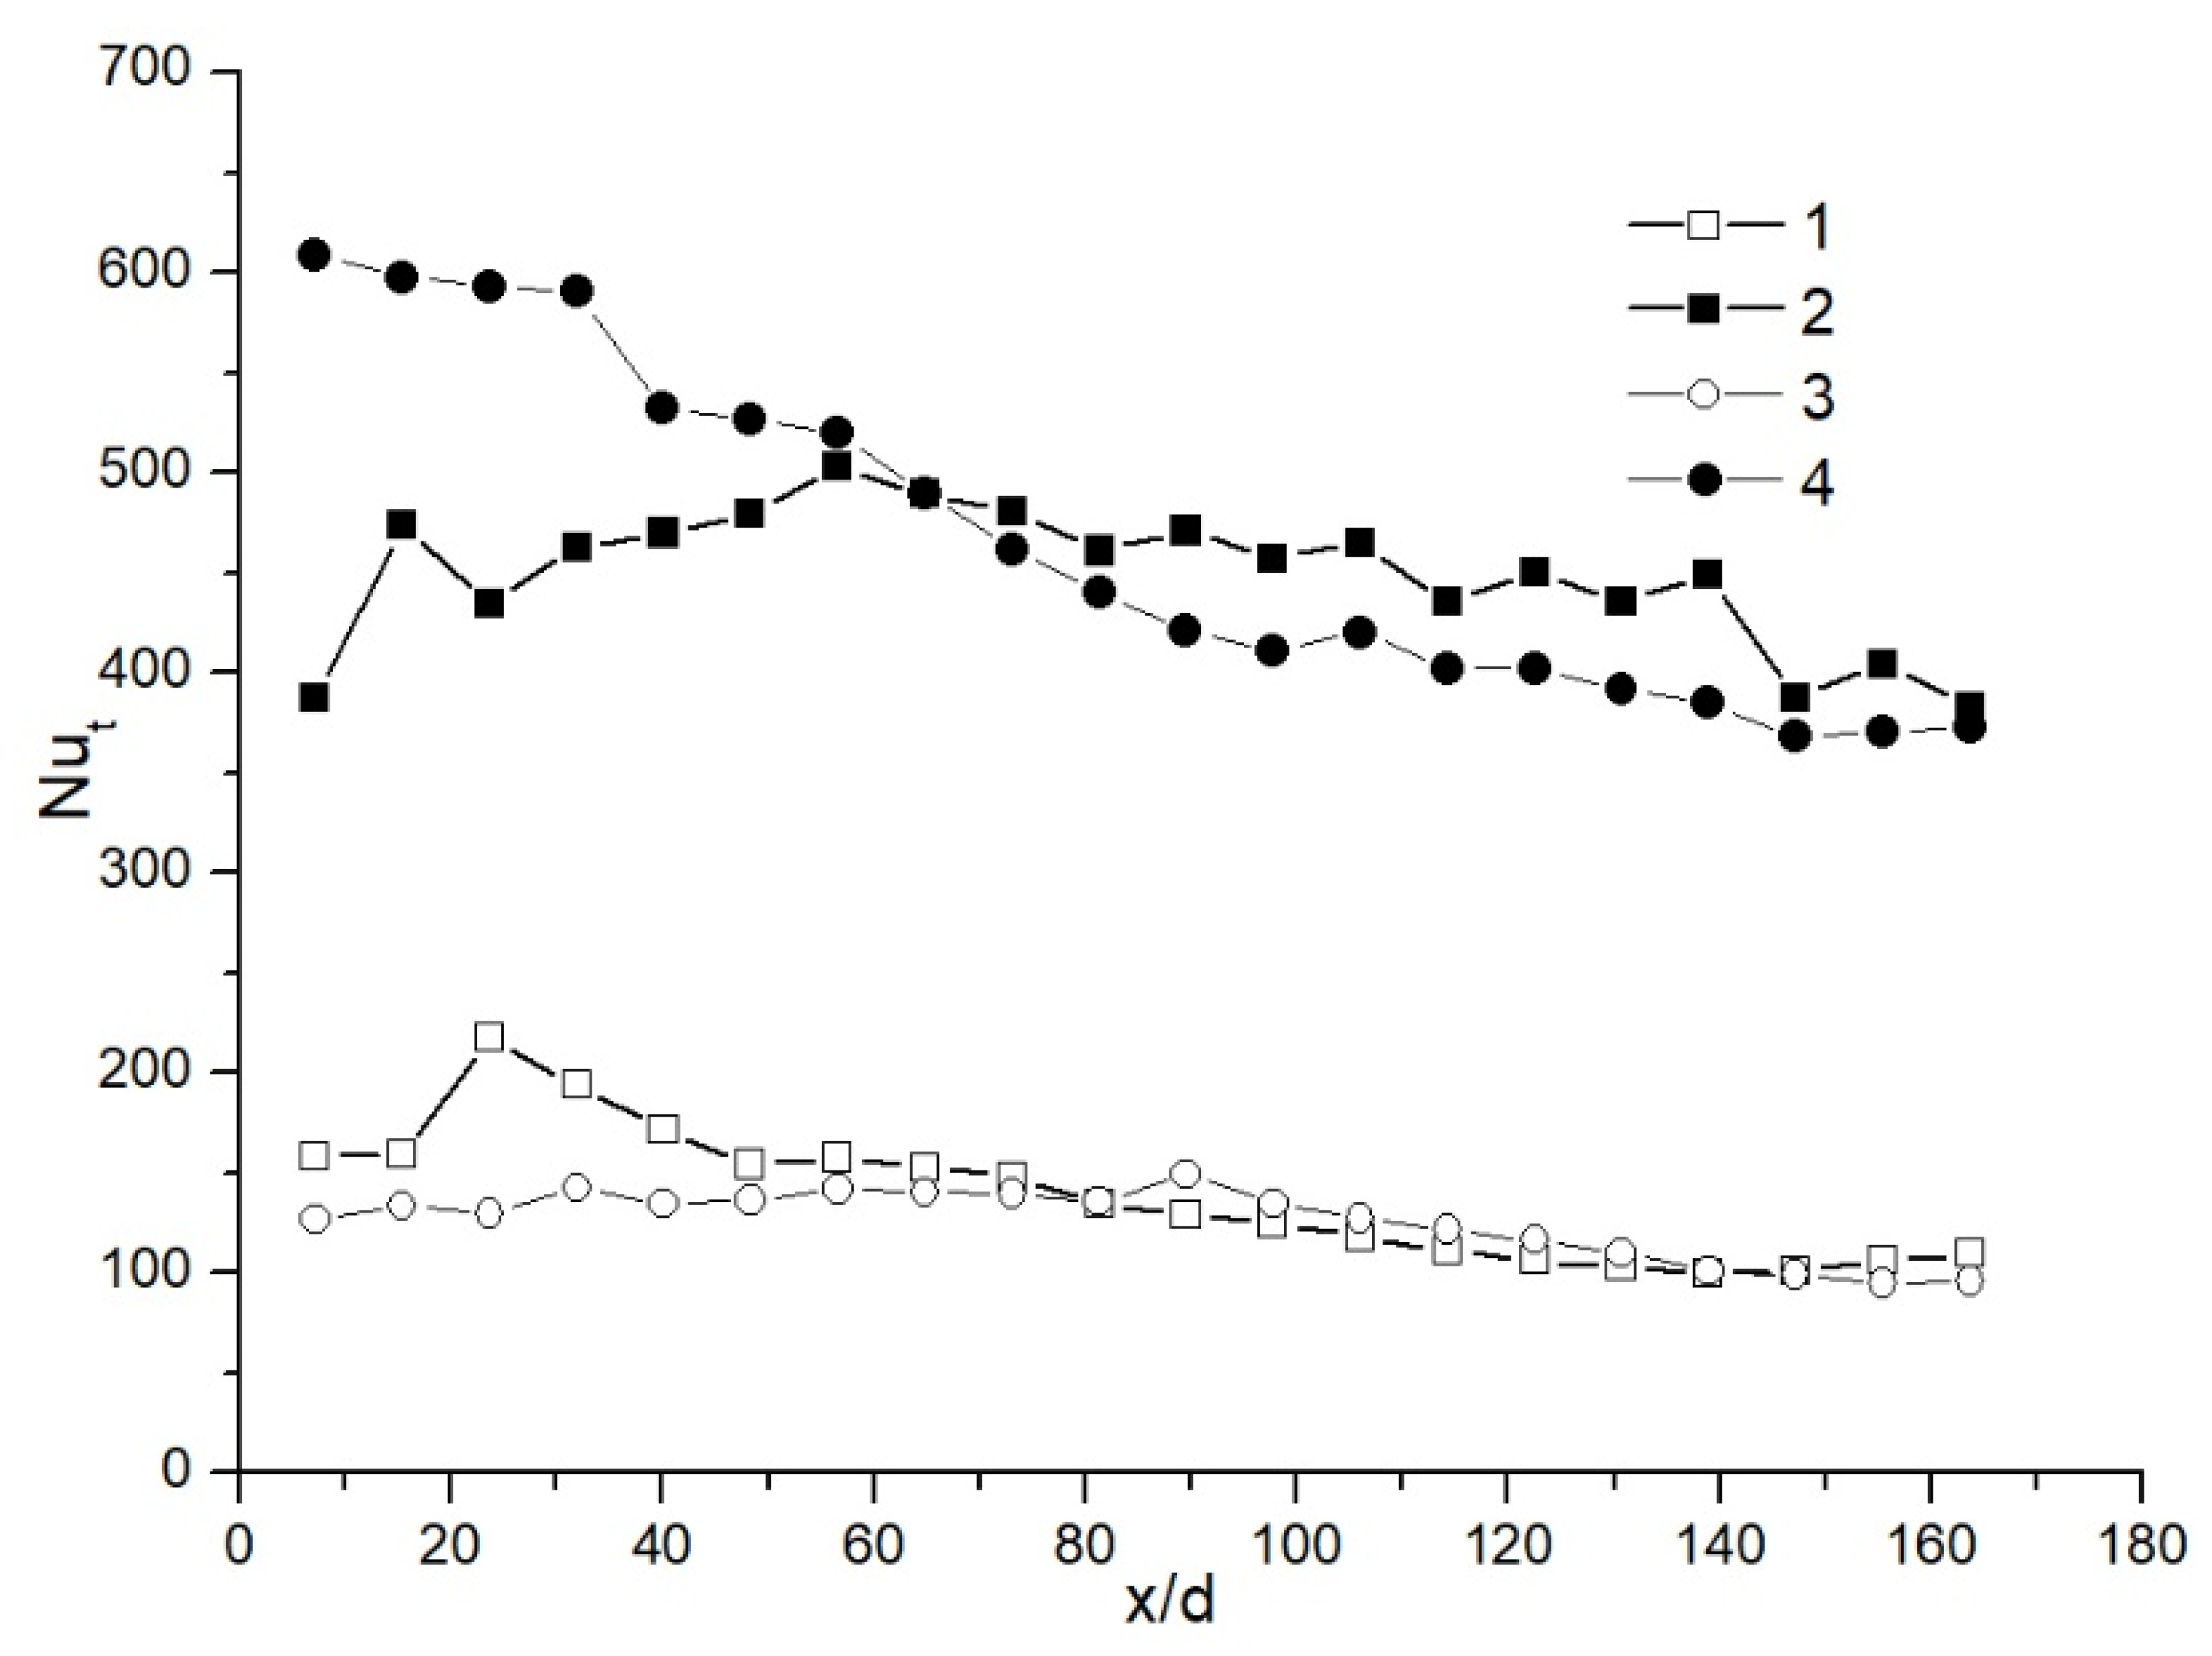
4.3. Comparison of Heat Transfer Results for Different Injected Water Temperatures

Heat transfer data obtained at almost the same flue gas inlet temperature (≈87–88 °C) but different injected water temperature in the case of Rein ≈ 9500 show (Figure 10, curves 1 and 2) that a higher temperature of the injected water results in a substantial increase in heat transfer along the tube. The increase is especially pronounced in the initial part of the tube (x/d = 0–60). At the end of the tube (x/d > 150) heat transfer data in case for both injected water temperatures do not differ very much.
In the case of a higher flue gas inlet temperature (≈122–125 °C) the same tendencies in heat transfer (Figure 10, curves 3 and 4) for different injected water temperatures were noticed: the higher the injected water temperature, the higher the heat transfer obtained in the tube, especially in its initial part. The results also show that heat transfer for both cases decreases along the tube and from x/d > 105 there are almost no differences in heat transfer for different injected water temperatures.
For higher Rein numbers, heat transfer results presented in Figure 11 show that at the beginning of the calorimetric tube, heat transfer does not differ very much for the cases of different inlet flue gas and injected water temperatures. However, in this case, the distribution of total heat transfer along the tube differs very much from distributions presented for lower Rein numbers (Figure 10).
For the lower flue gas inlet temperature (≈97–103 °C), results show that for both injected water temperatures (Figure 11, curves 1 and 2), heat transfer increases rather steeply until x/d ≈ 55–65. The maximum total heat transfer in the case of a higher injected water temperature is about 1.2 times higher in comparison with data at the lower injected water temperature. After both heat transfer curves reach their maximum values (at x/d ≈ 65 and 55, respectively), then heat transfer starts to decrease and from x/d > 100 only an insignificant difference in heat transfer is observed.
For the higher flue gas inlet temperature (≈135–138 °C), the characteristics of the heat transfer distribution along the tube (Figure 11, curves 3 and 4) for different injected water temperatures are very similar to those described before. However, the maximum heat transfer obtained in this case is higher in comparison with data from the lower flue gas inlet temperature. After the maximum heat transfer is reached (at x/d ≈ 55), then both curves (Figure 11, curves 3 and 4) show decreasing heat transfer along the tube: i.e., the tendency is the same as for the lower flue gas inlet temperature. From x/d > 110, heat transfer along the tube for both injected water temperatures remains almost the same.

5. Conclusions

After analysis, the following conclusions have been made:
  • Performed investigations revealed the regularities of the local heat transfer during operation of condensing heat exchangers with water injection.
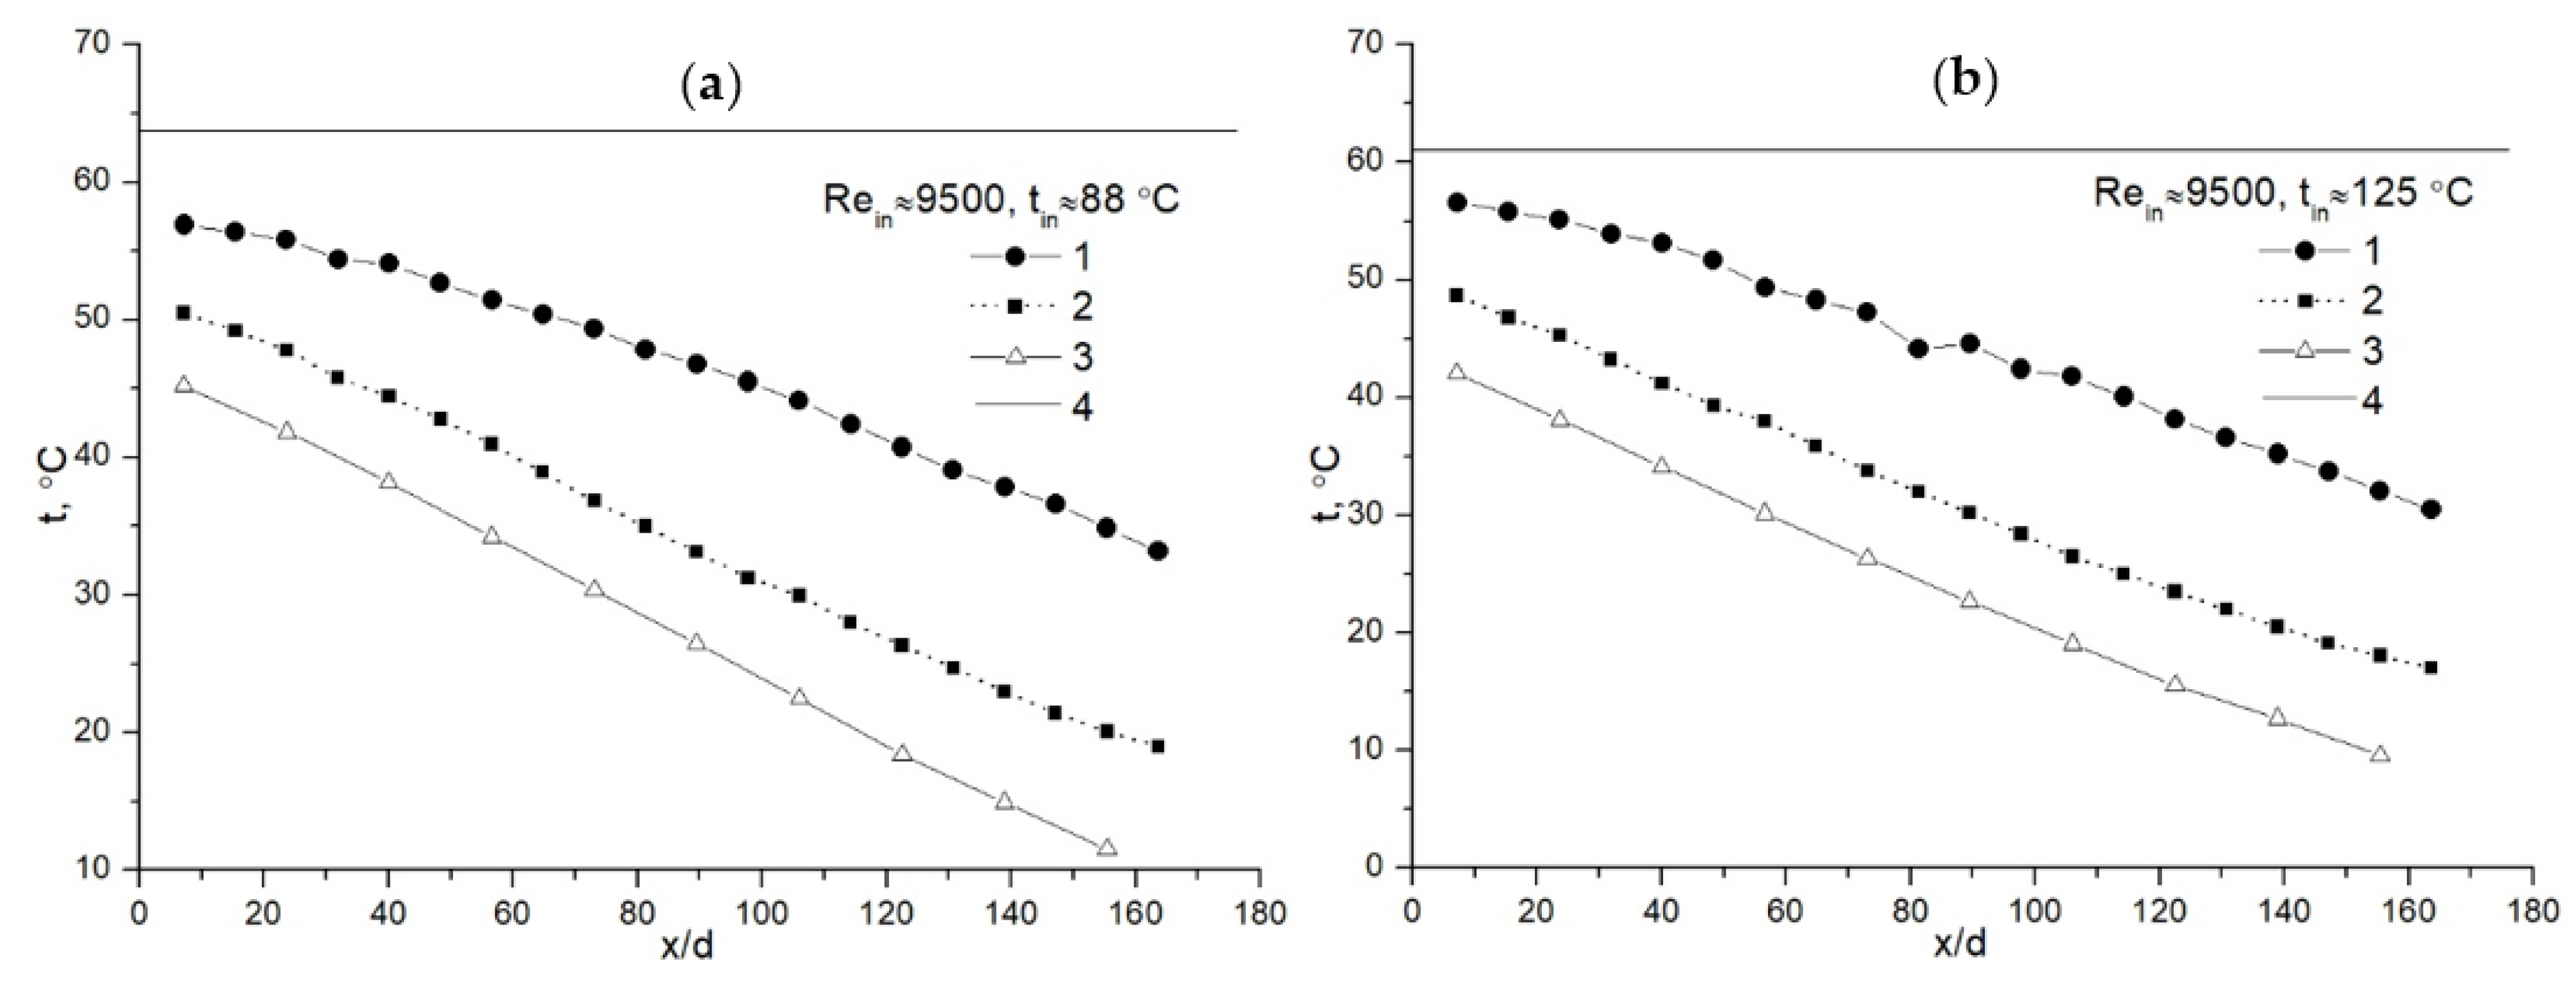
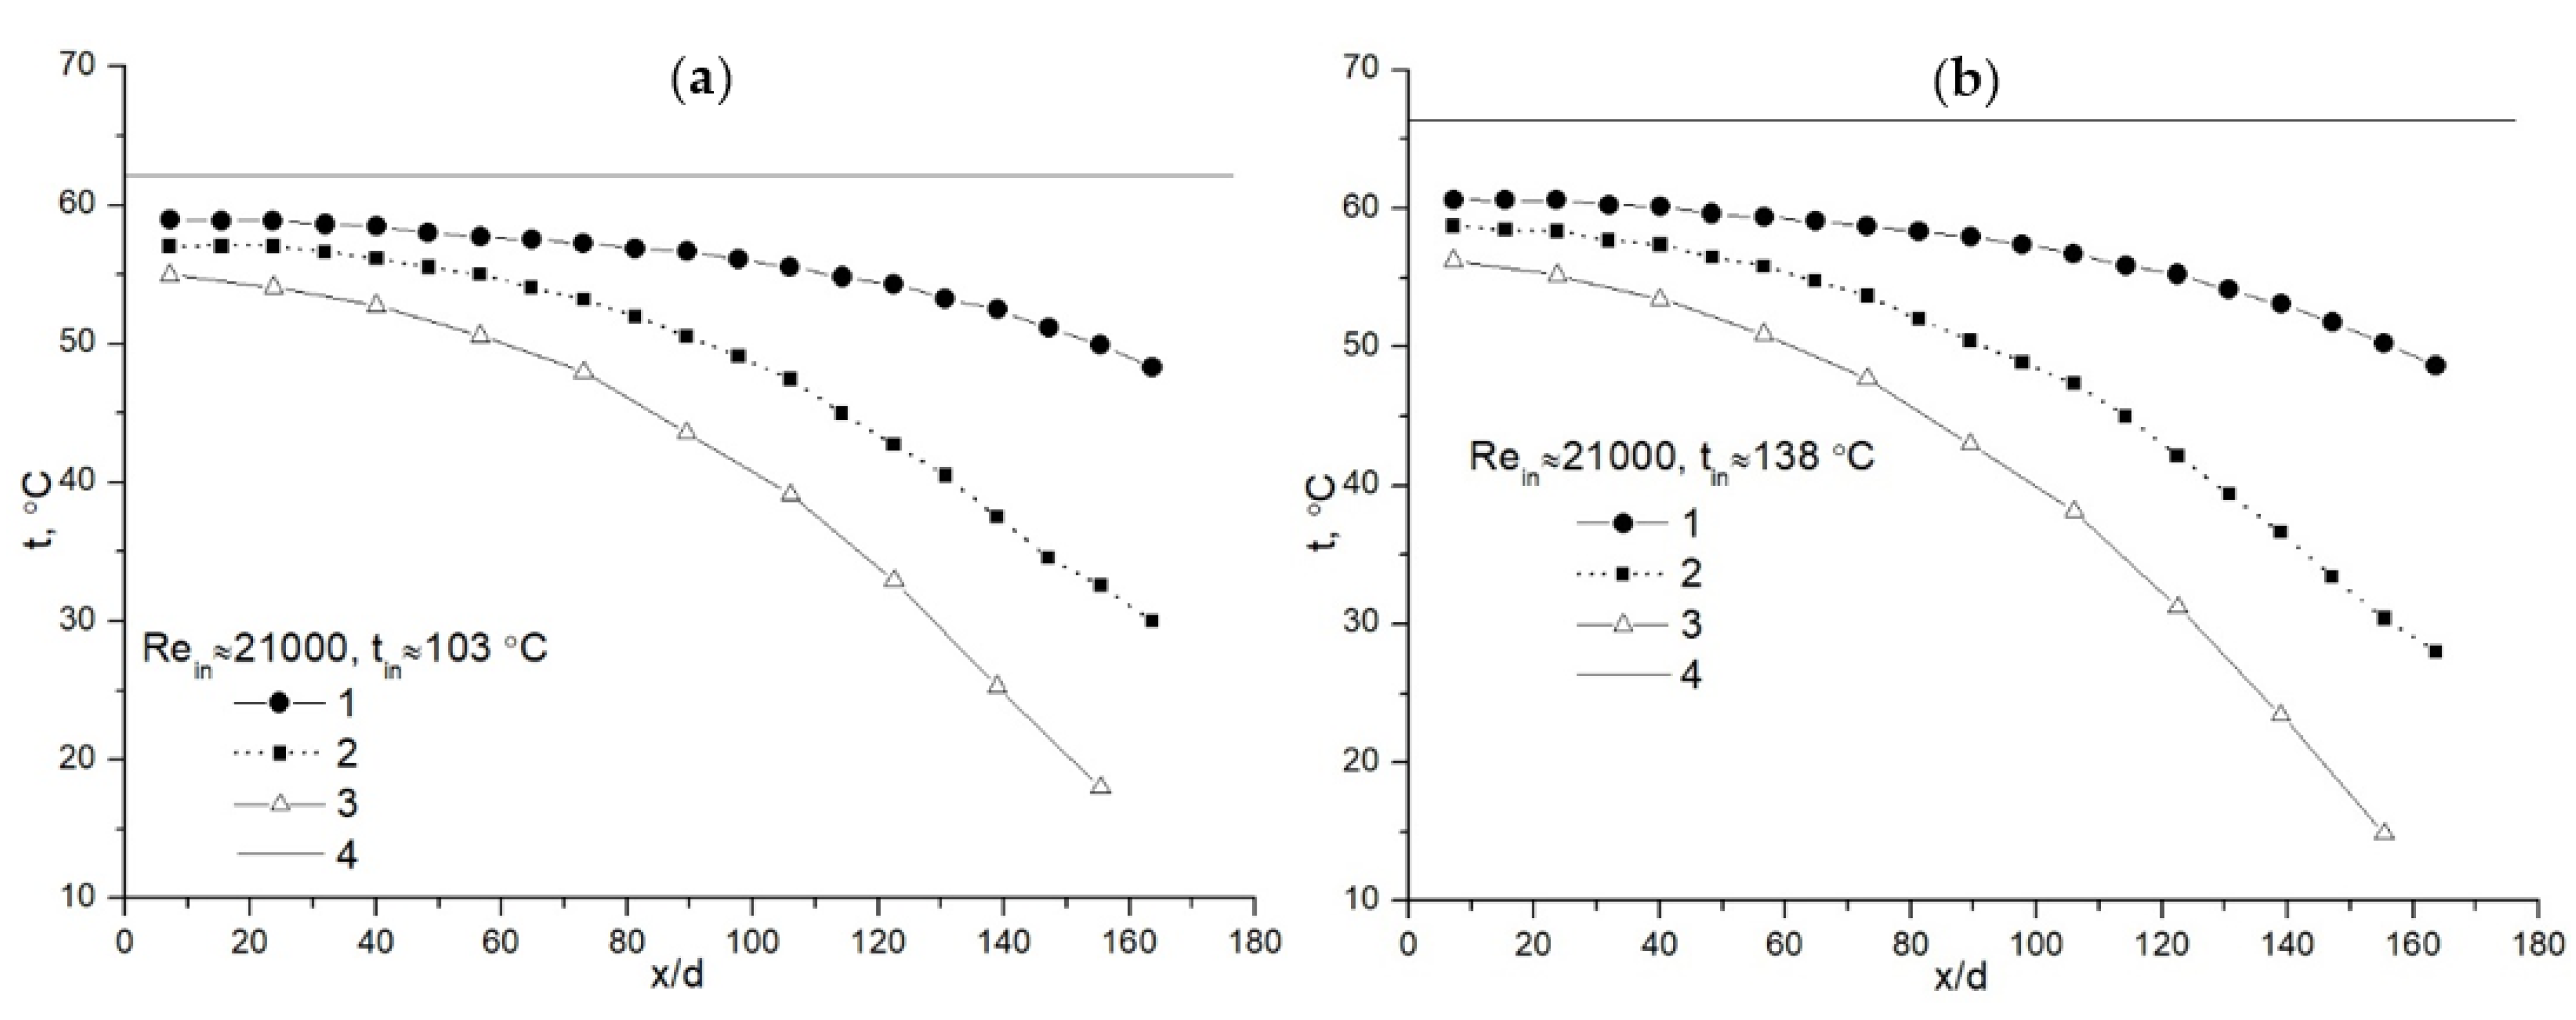
  • Water injection drastically changes the distribution of temperatures and has a significant effect on heat transfer along the calorimetric tube.
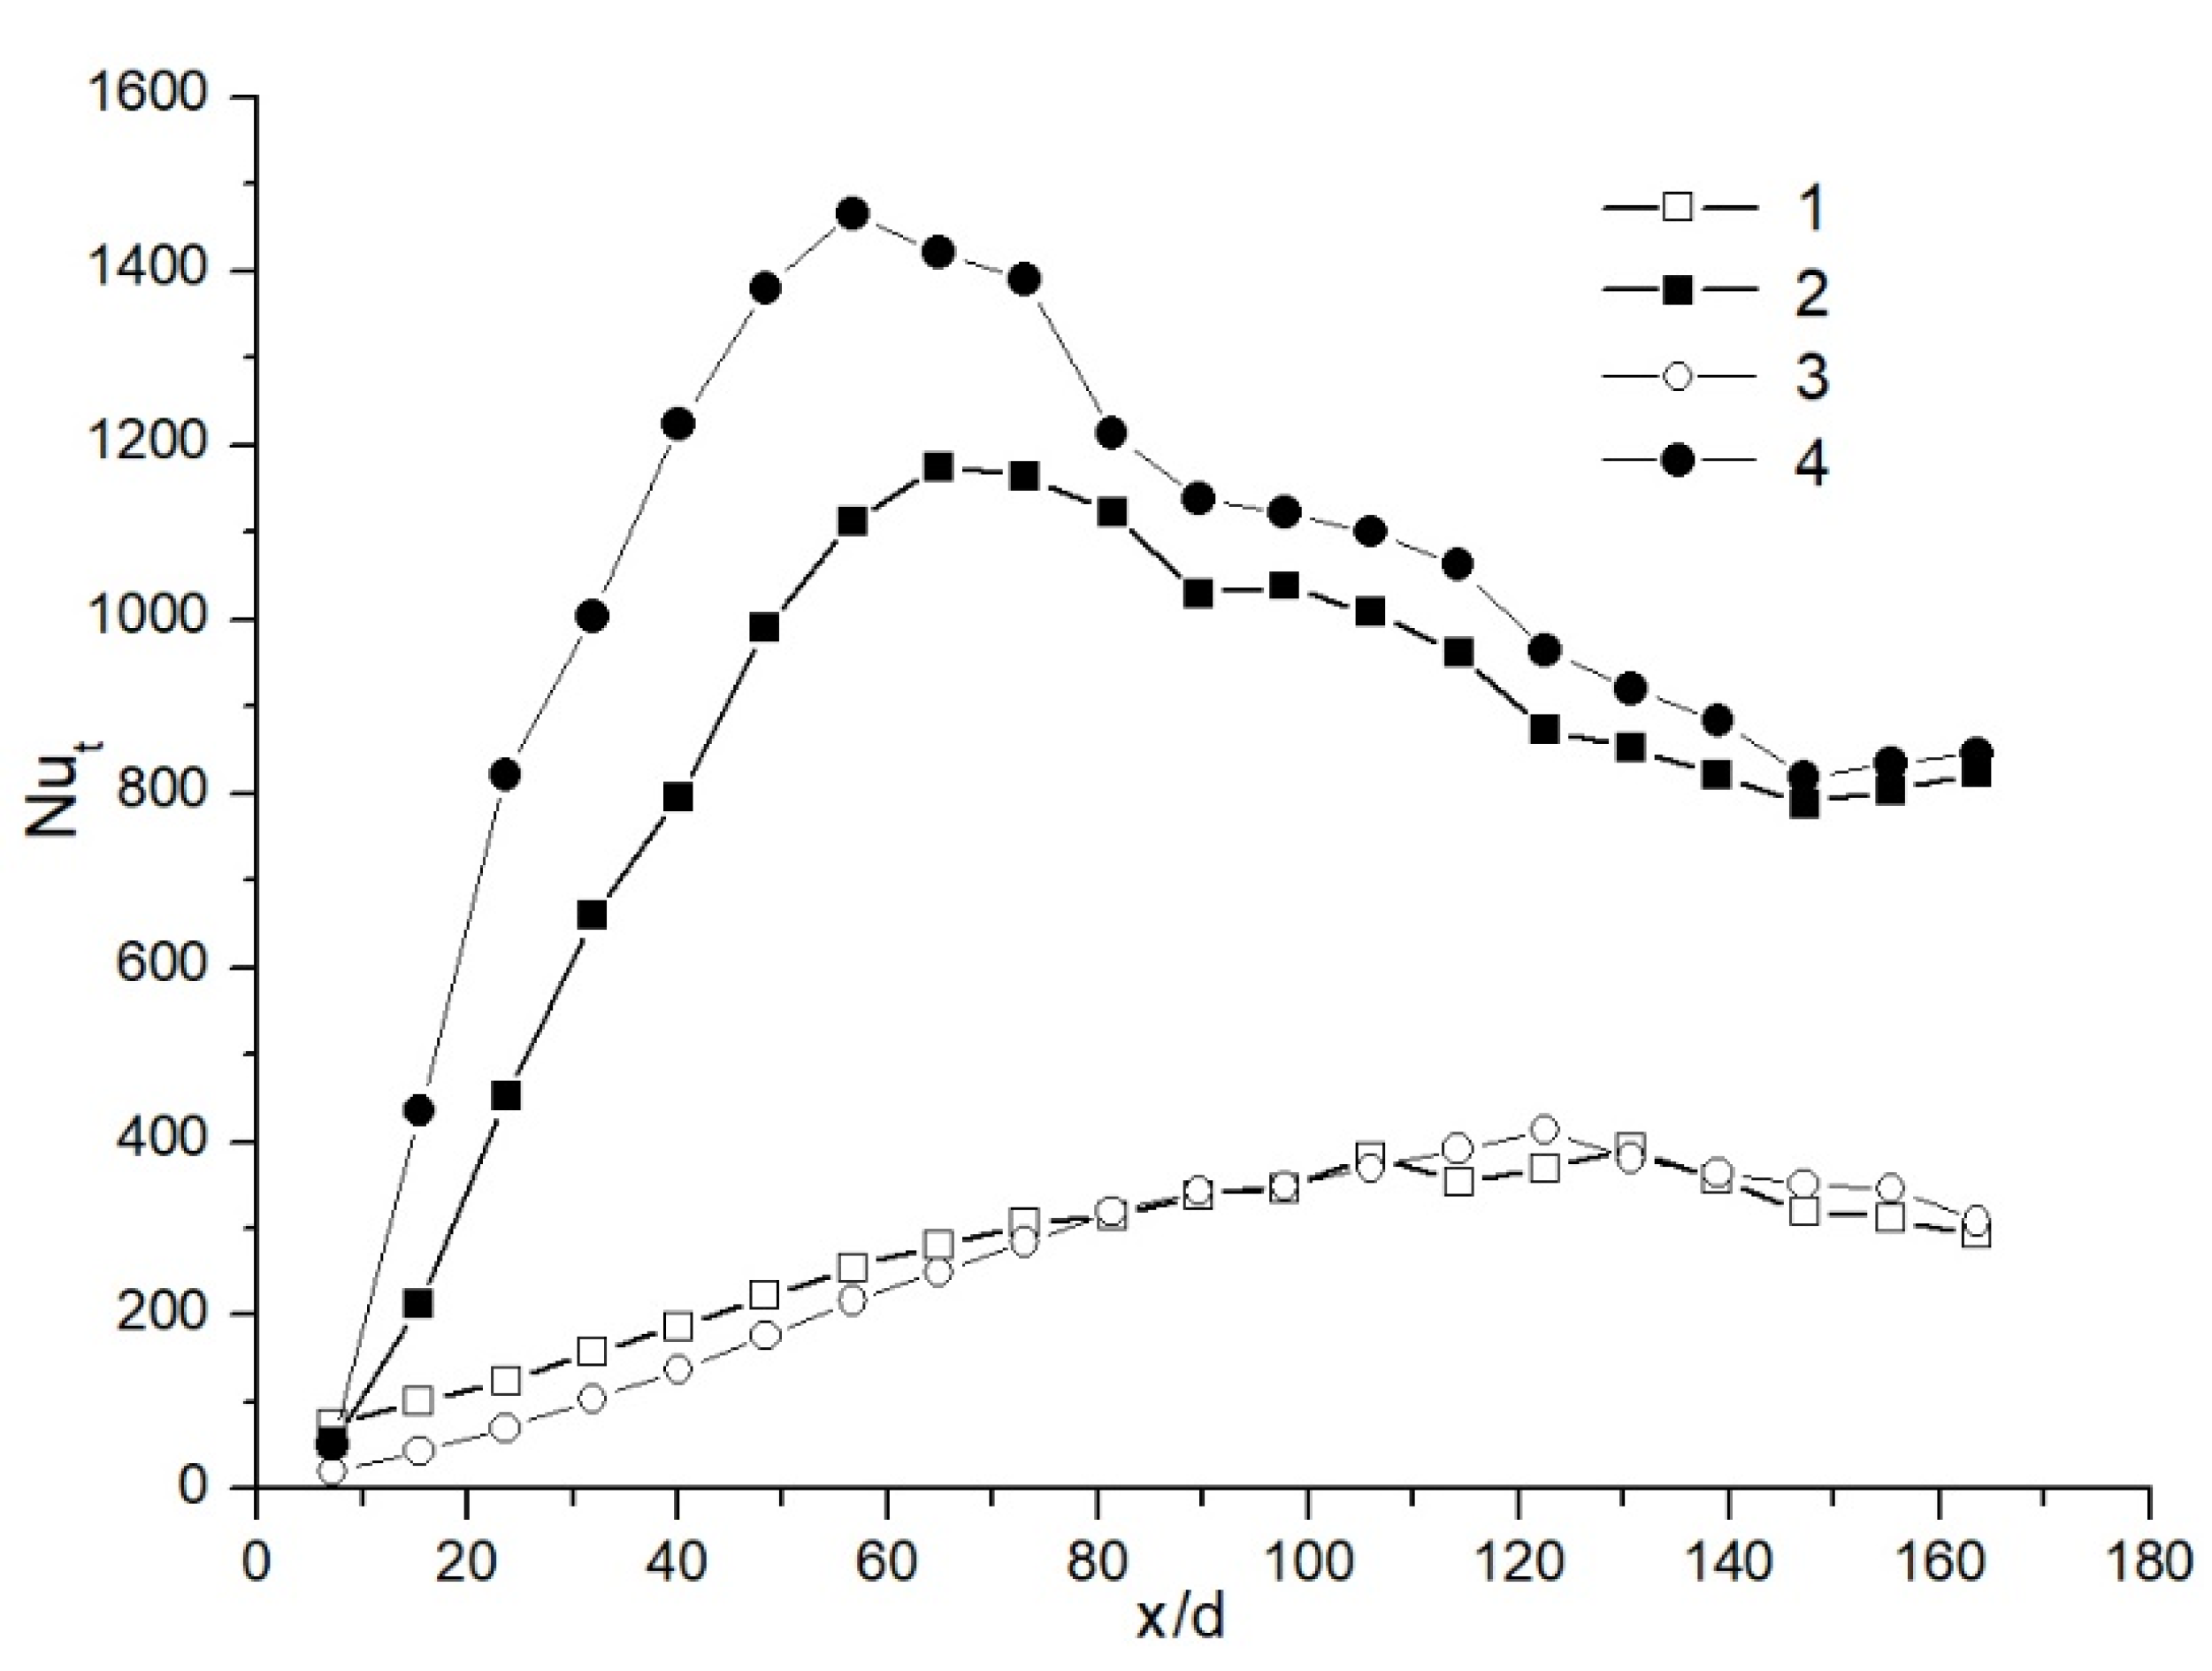
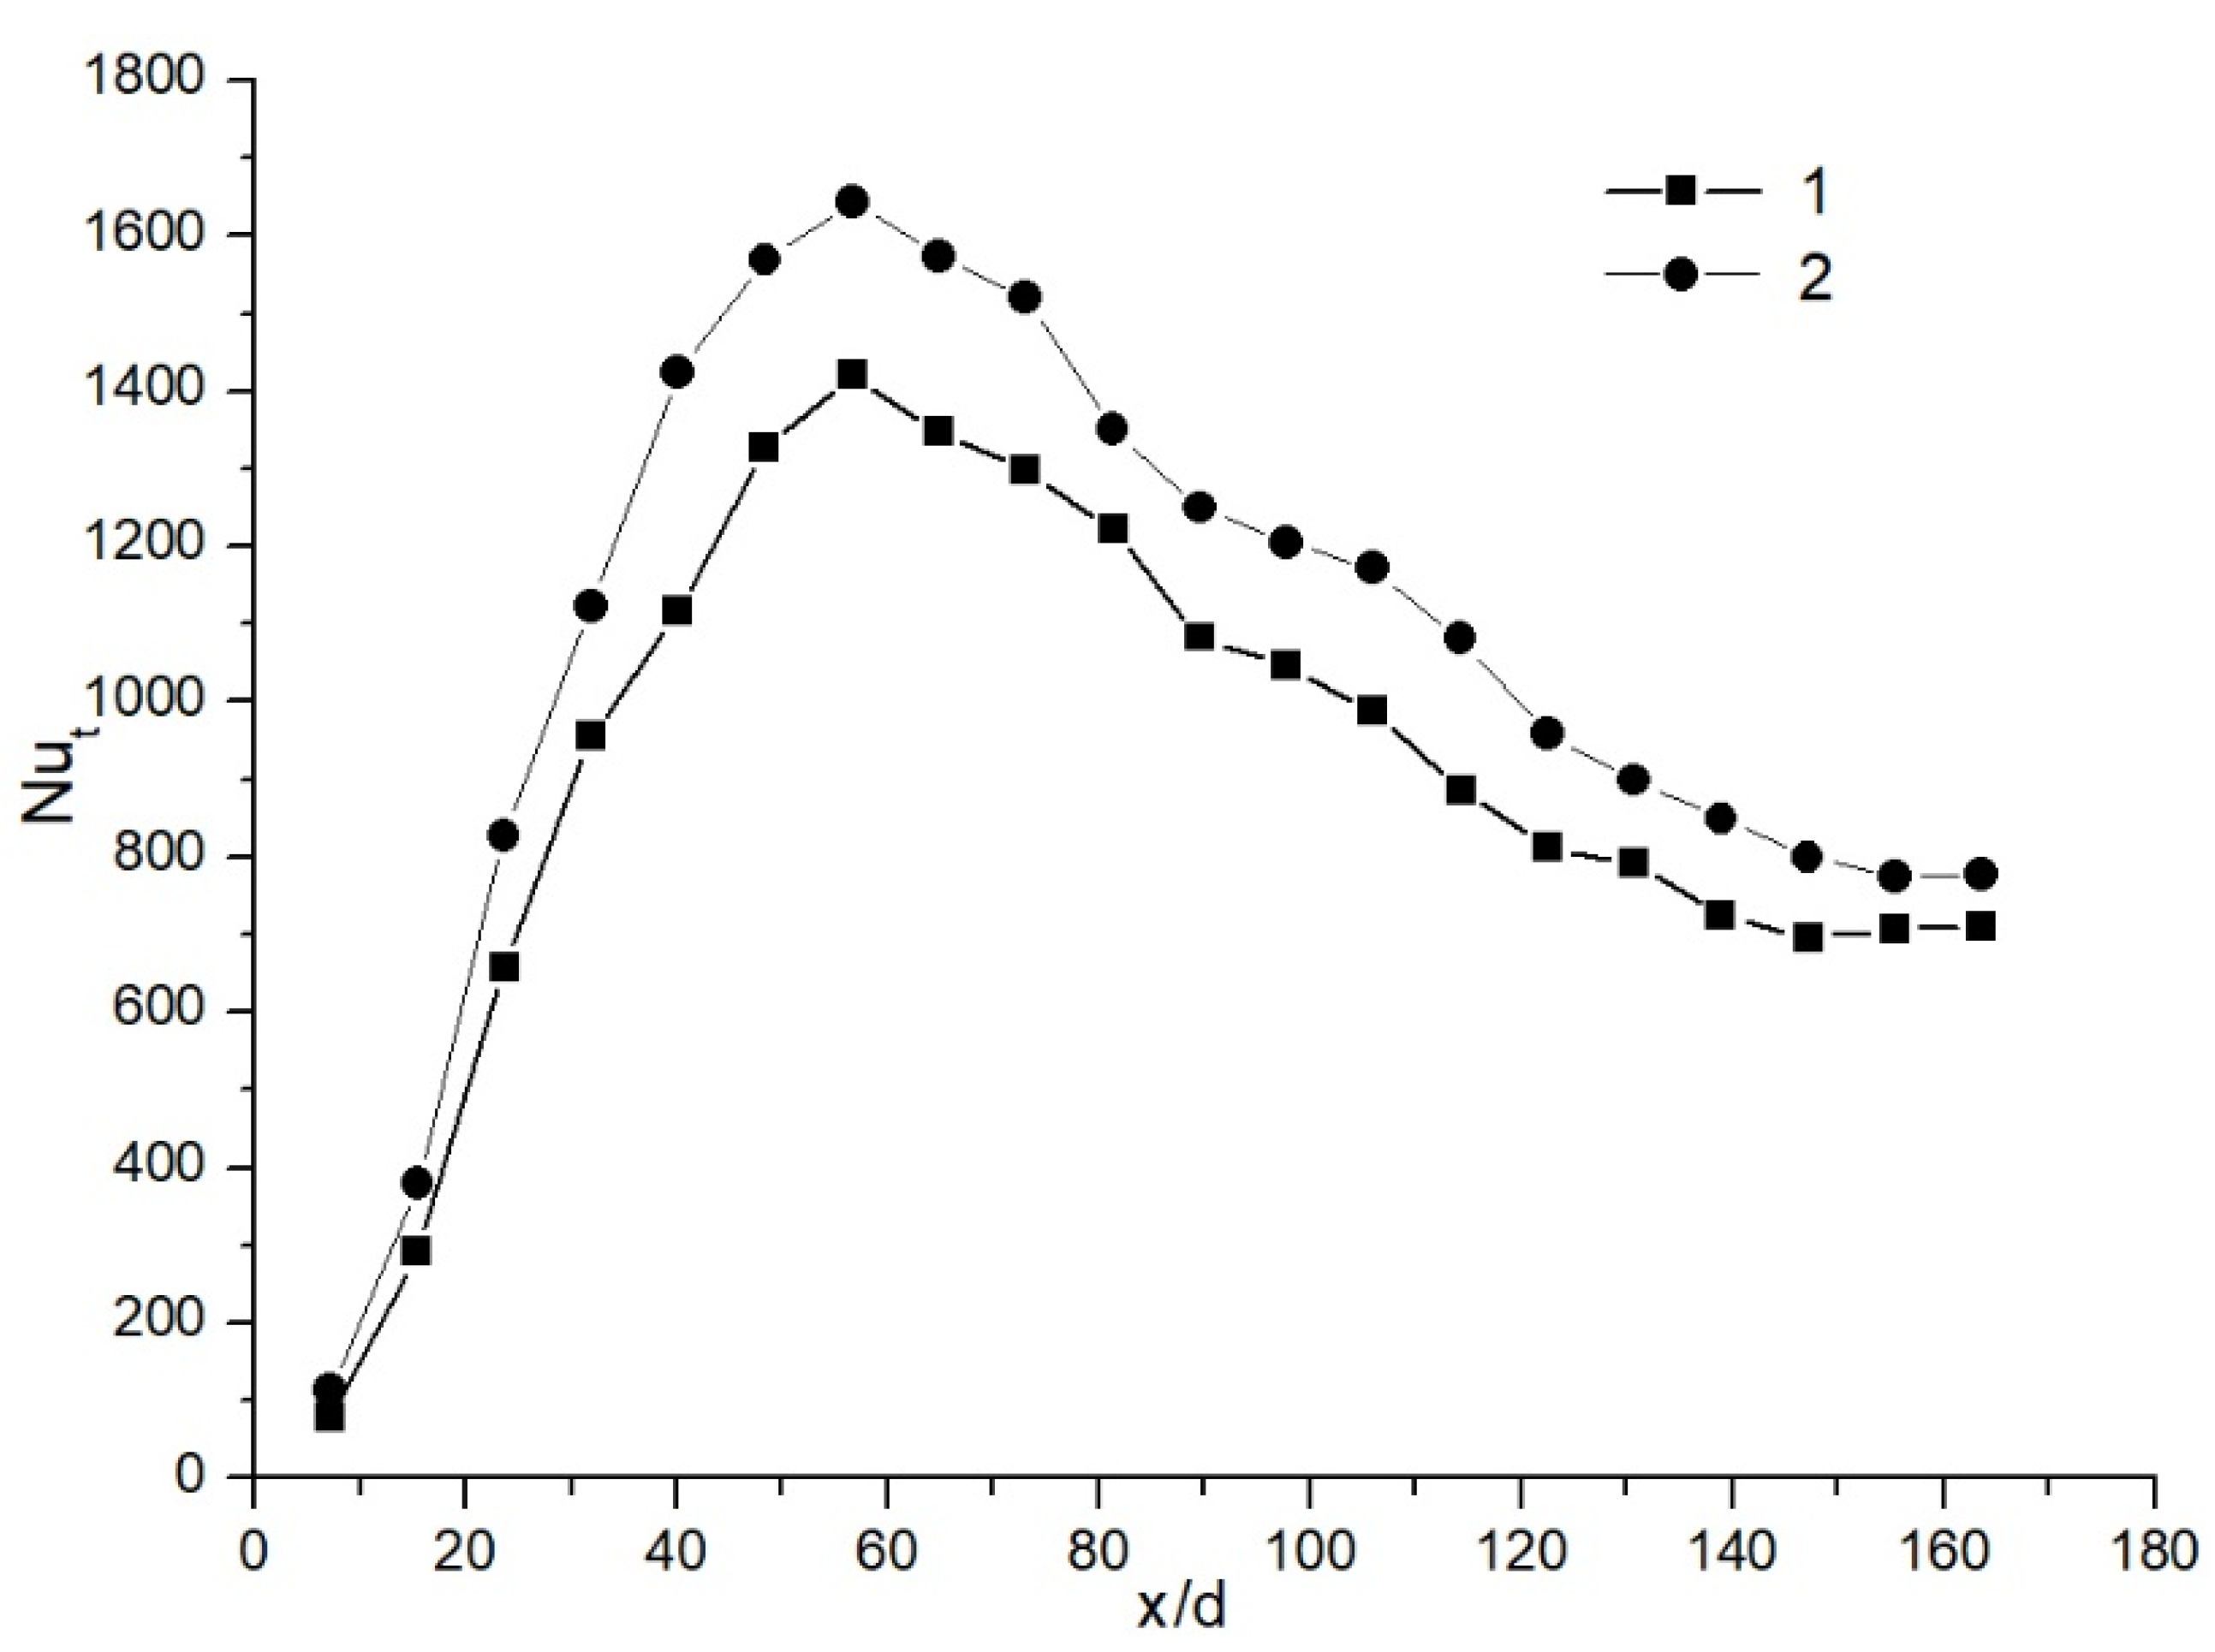
  • In the case of the water injection with a temperature of 25 °C, at lower Rein numbers, the local total heat transfer along the tube increased by at least four times, and at higher Rein numbers, at least by two times in comparison with the case without water injection.
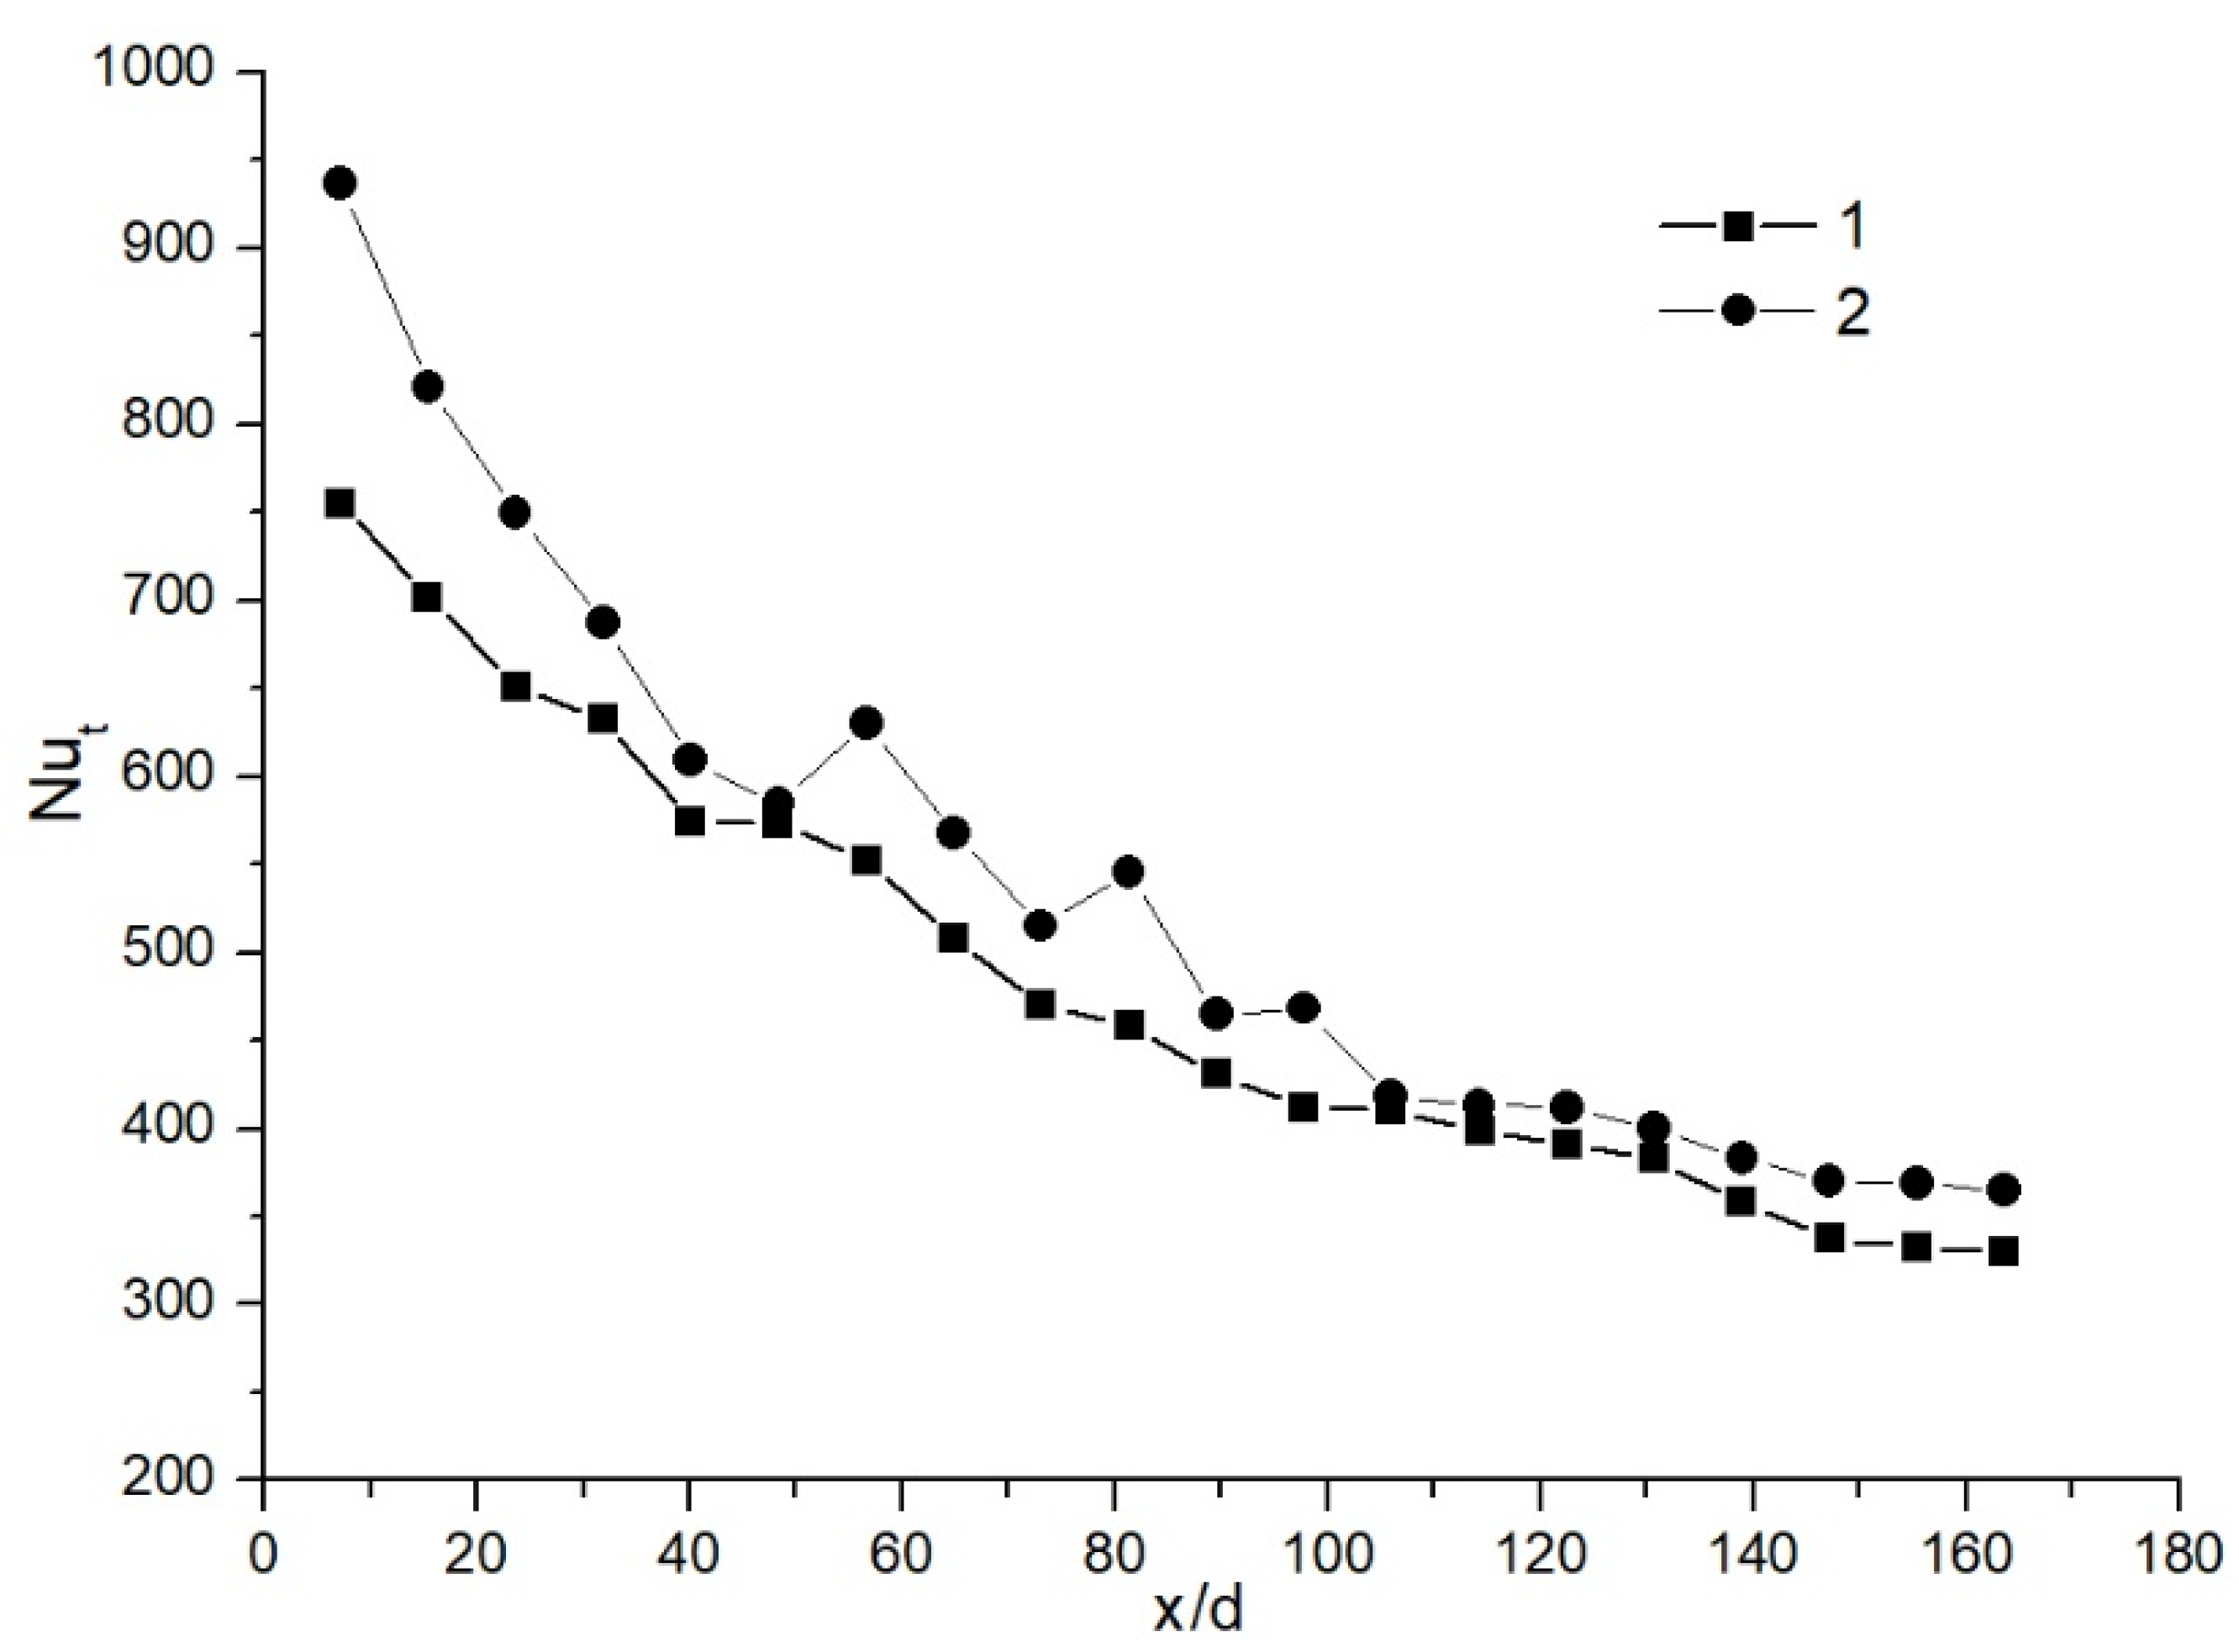
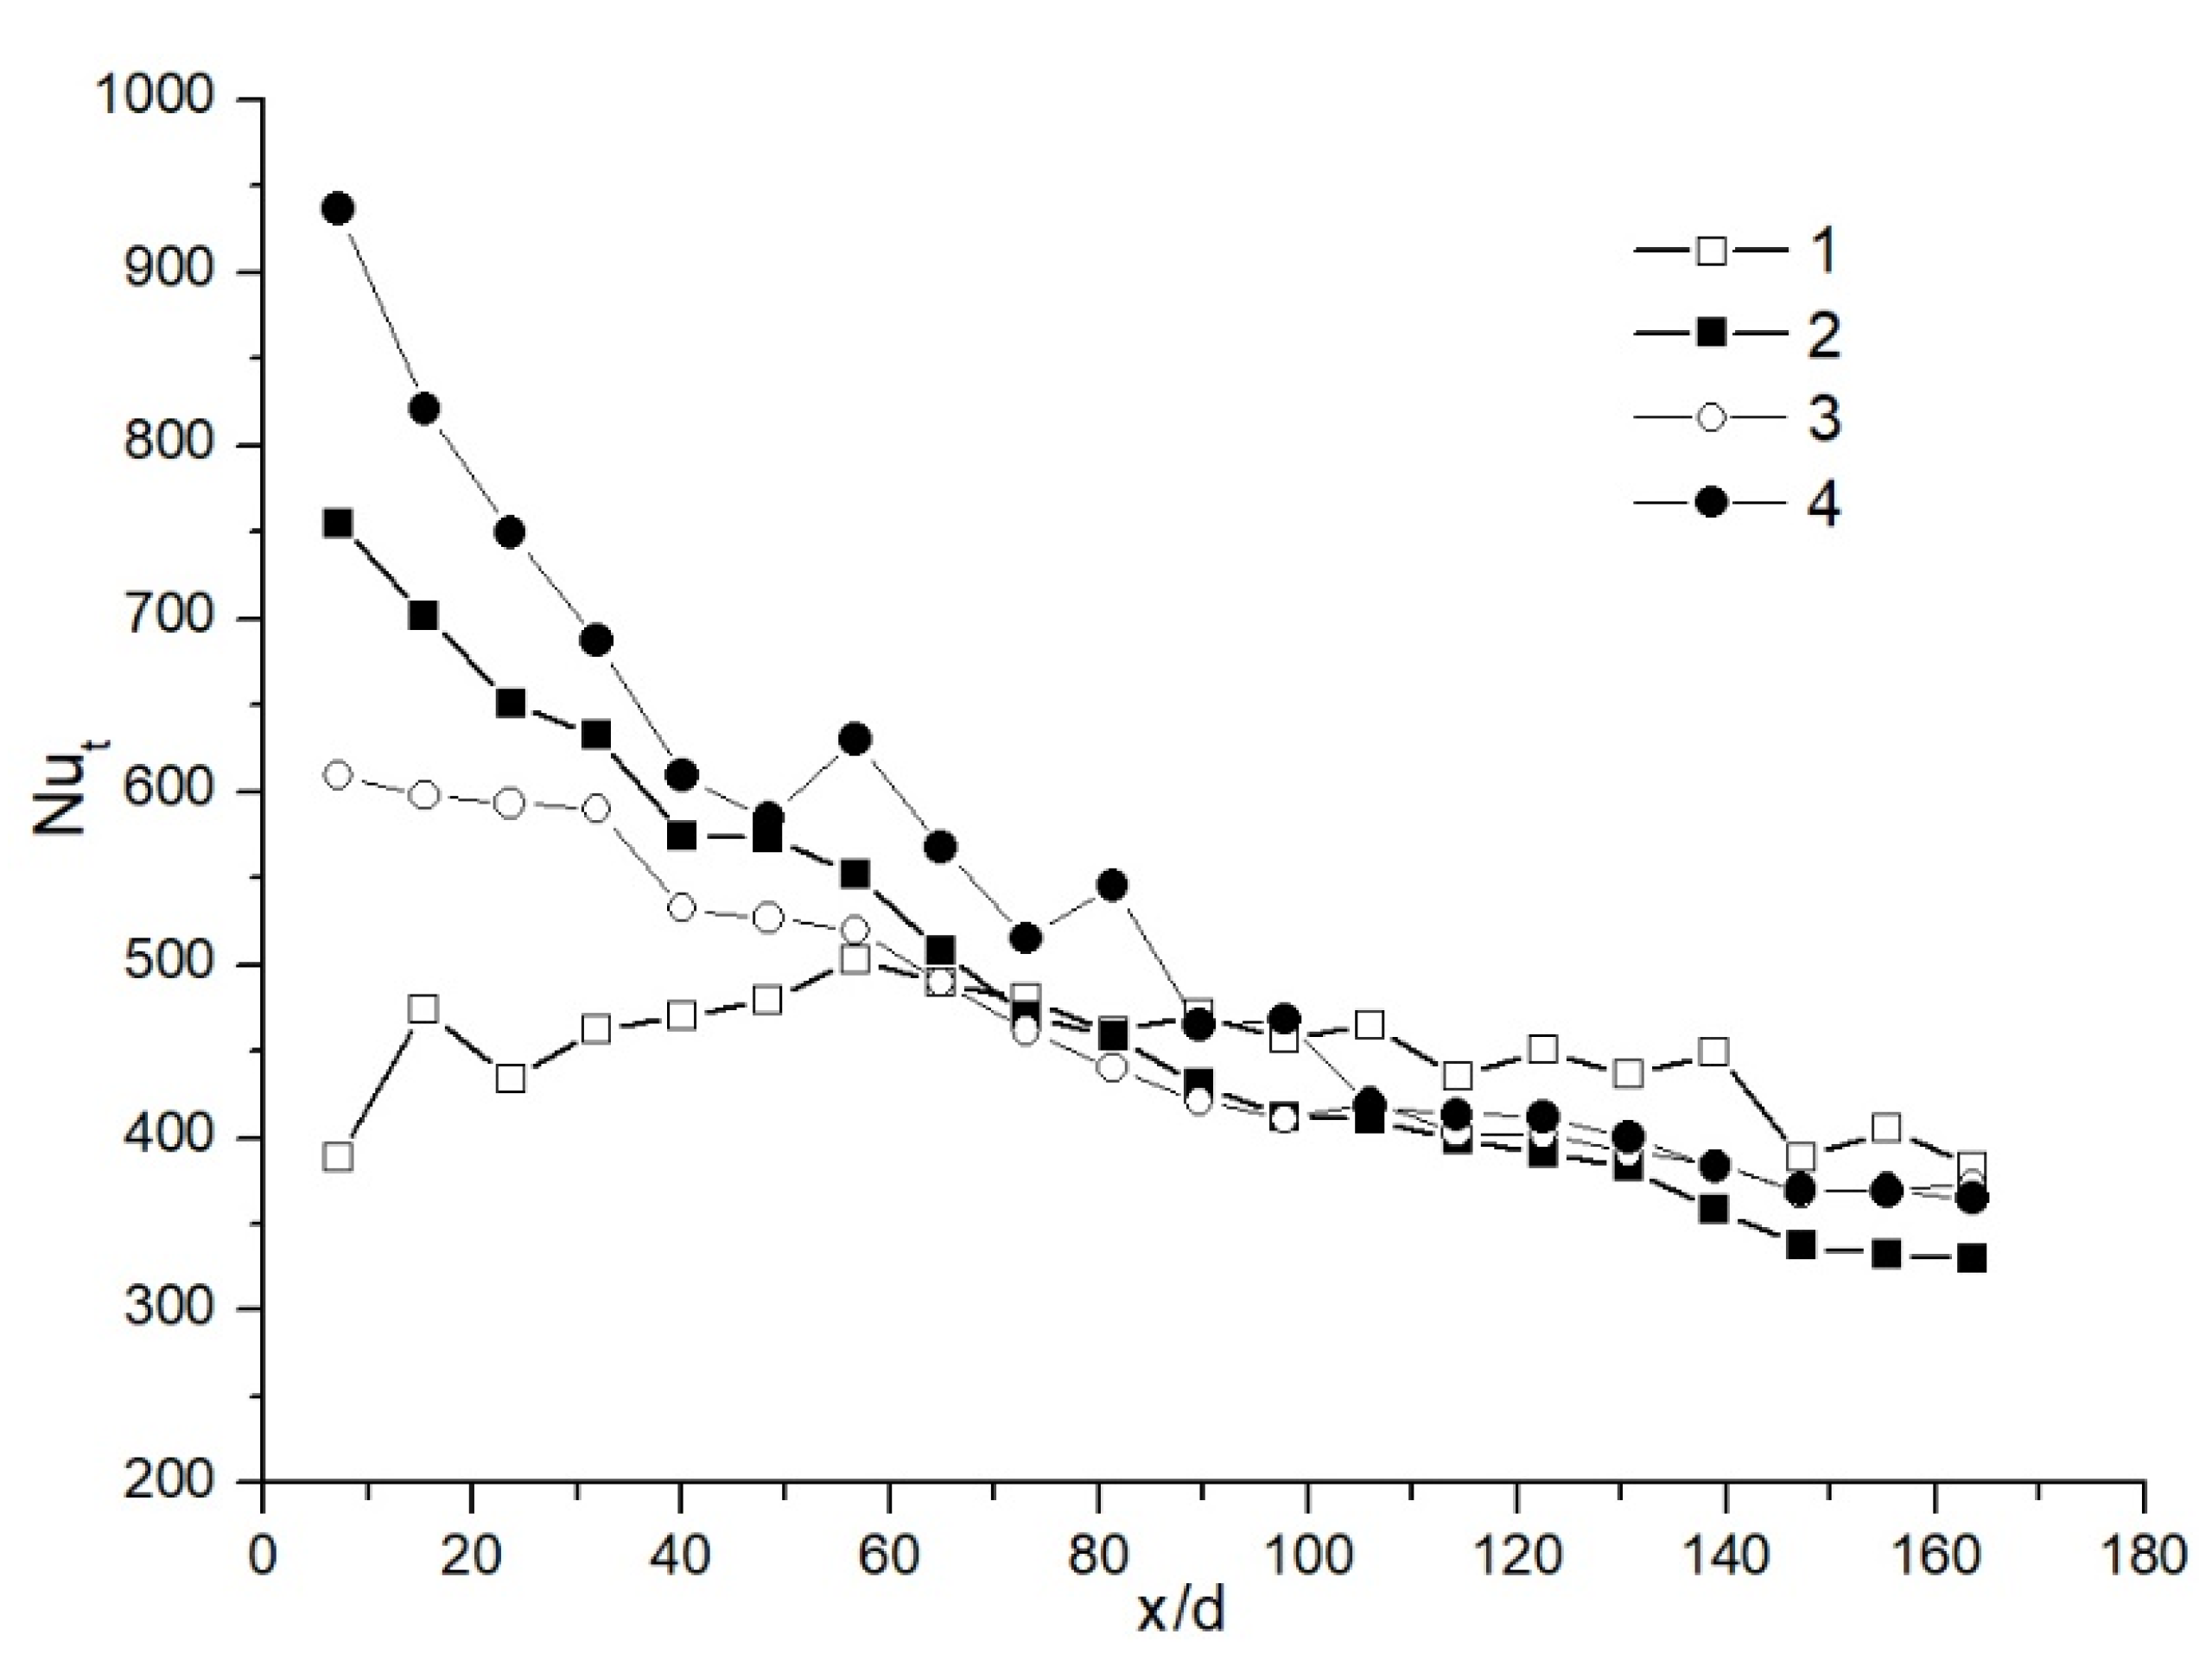
  • In the case of water injection with a temperature of 40 °C, at lower Rein numbers, the local total heat transfer increased by at least 2.3 times and at higher Rein numbers, by at least 1.7 times in comparison with the case without water injection.
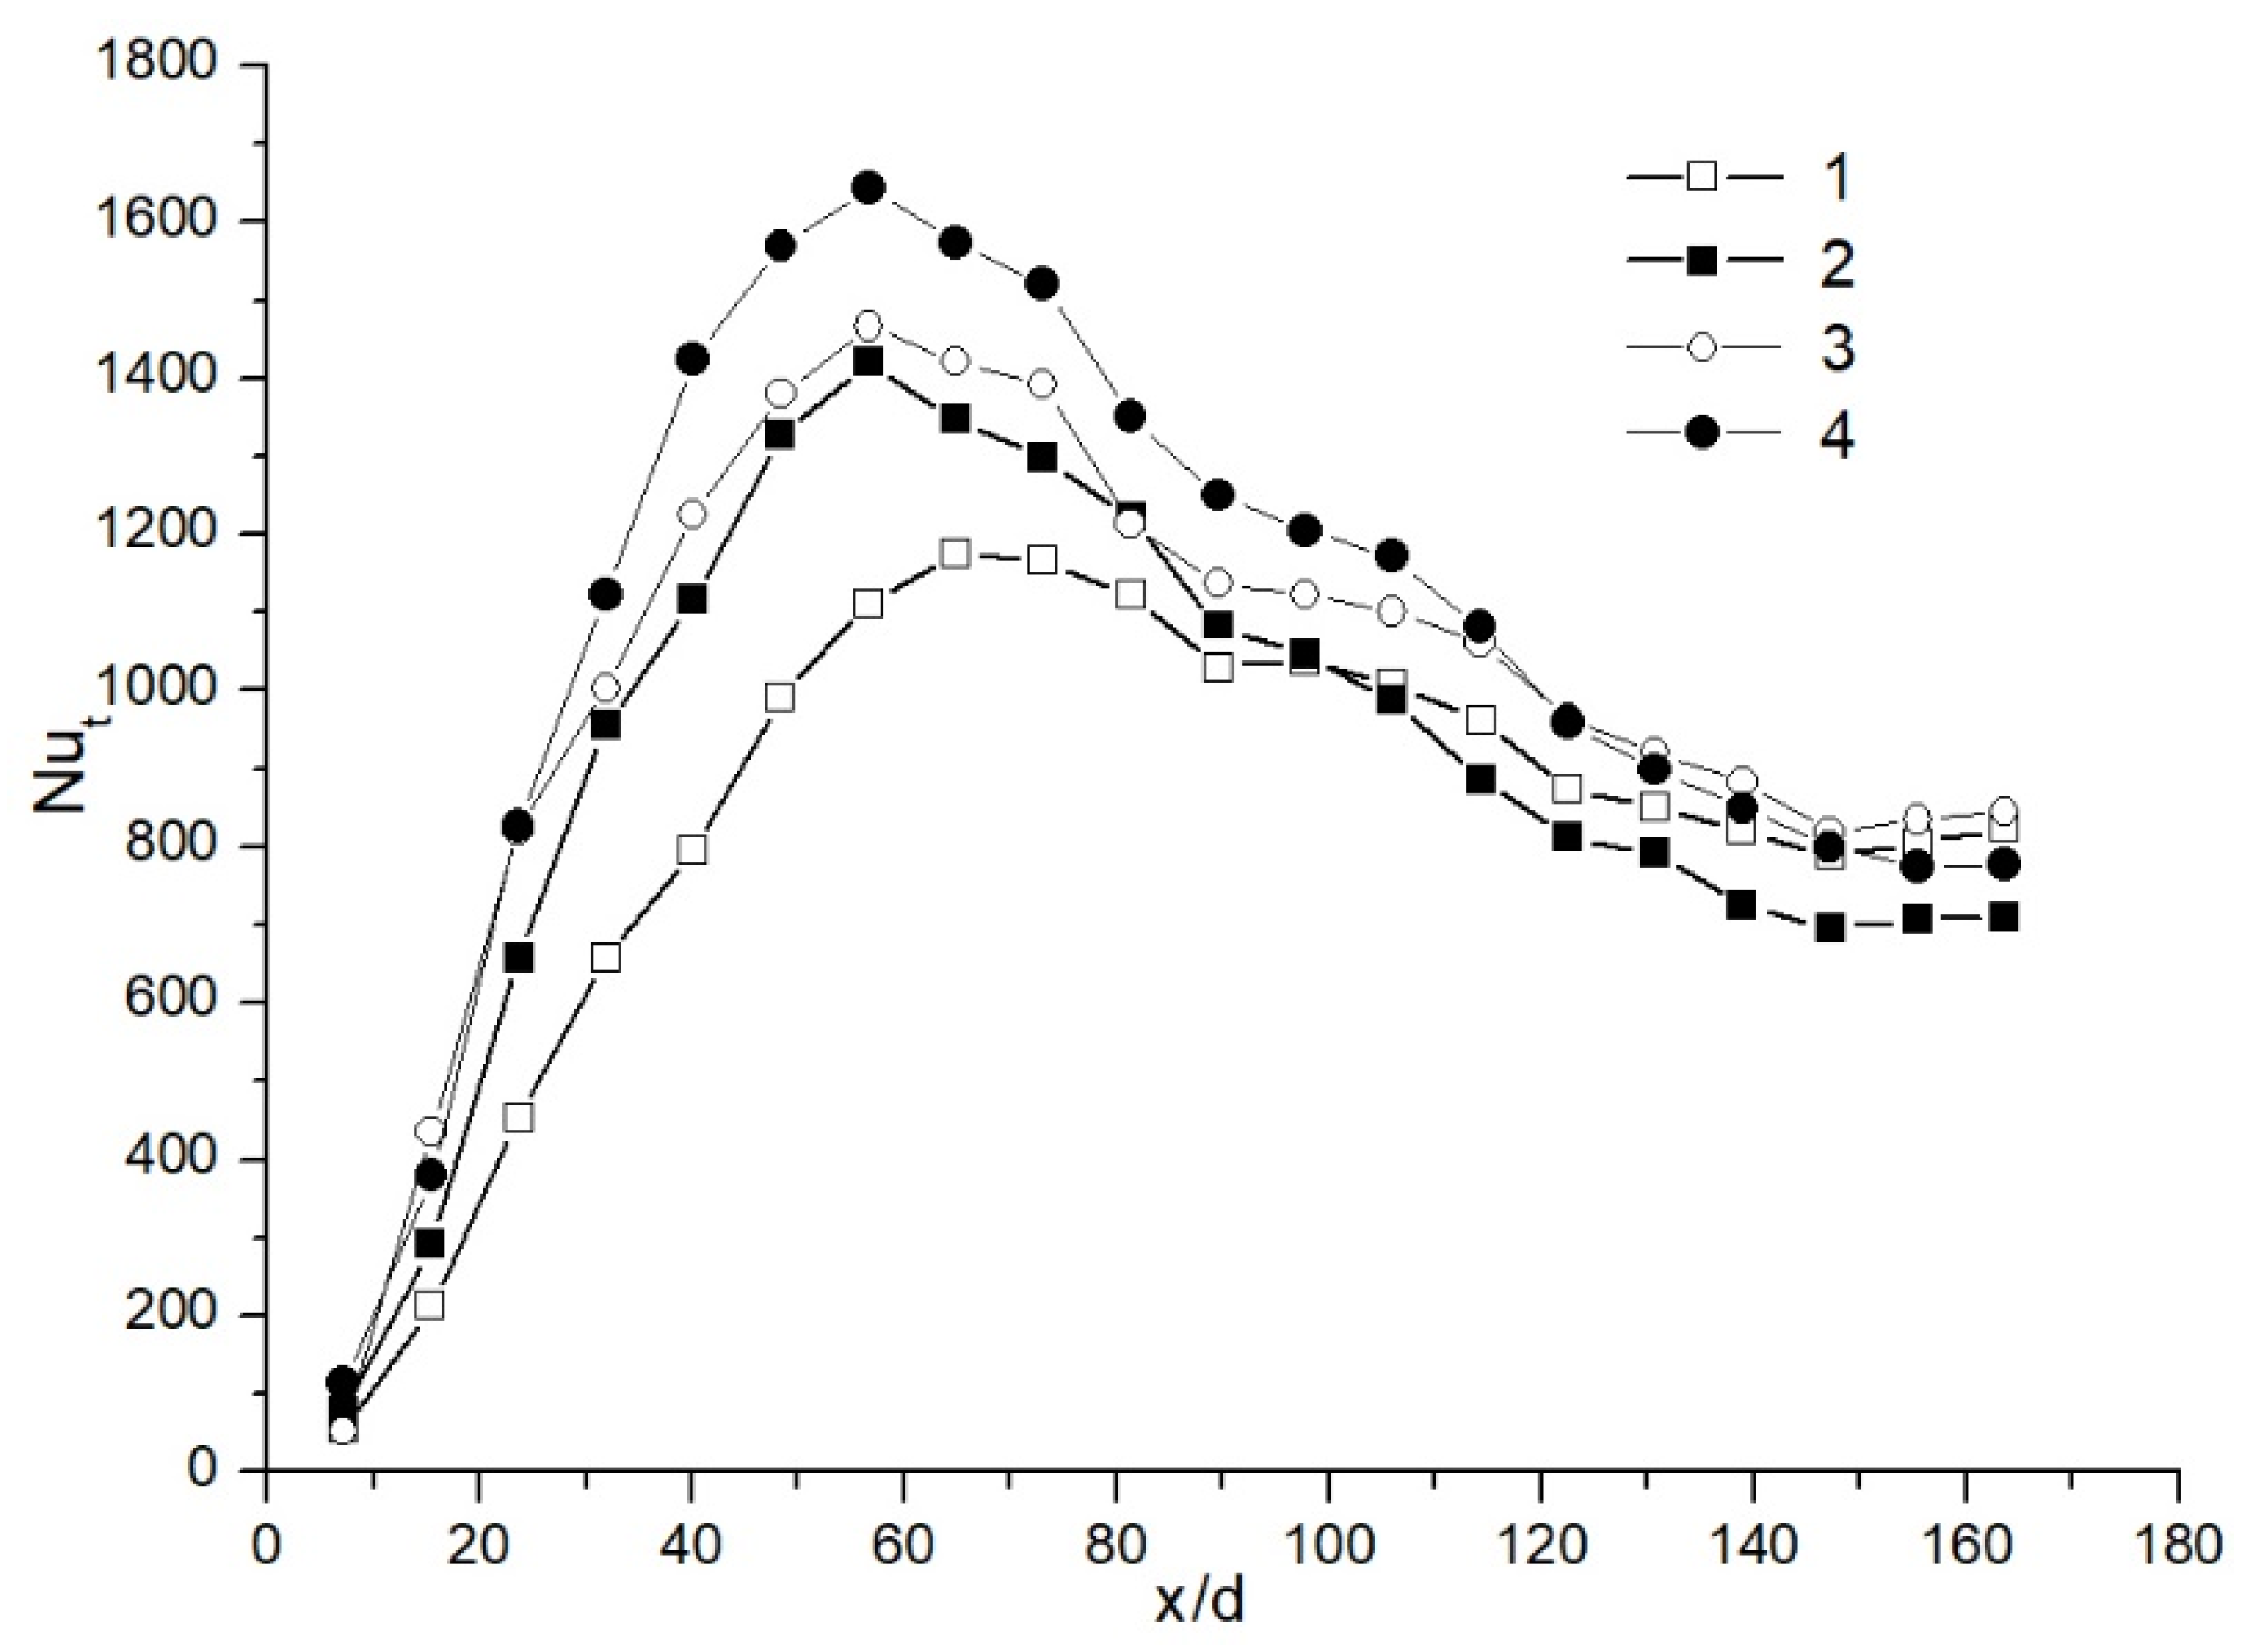
  • At higher flue gas inlet temperatures, the effect of water injection on heat transfer is also stronger. For lower Rein, the effect is more pronounced in the initial part of the tube (up to x/d ≈ 60), and for higher Rein, it is in the x/d range between 20 and 110.
  • Condensation efficiency increases with decreasing Rein number, flue gas temperature and injected water temperature.
  • To optimize the operation of condensing heat exchangers with water injection, it is necessary to perform wider investigations on the effect of different flue gases, cooling water and injected water parameters.

Author Contributions

Conceptualization, R.P.; methodology, A.S. and P.P.; formal analysis, A.S. and V.K.; experimental investigation, A.S. and V.K.; resources, A.S., R.P., G.M., E.P.; writing—original draft preparation, A.S.; writing—review and editing, P.P., H.J., G.M. and E.P.; supervision, R.P. All authors have read and agreed to the published version of the manuscript.

Funding

This research was funded by Research Council of Lithuania (LMTLT), grant number S-MIP-20-30.

Institutional Review Board Statement

Not applicable.

Informed Consent Statement

Not applicable.

Data Availability Statement

Not applicable.

Conflicts of Interest

The authors declare no conflict of interest.

References

  1. Poskas, R.; Sirvydas, A.; Kulkovas, V.; Poskas, P. An Experimental investigation of water vapor condensation from biofuel flue gas in a model of vertical condensing heat exchanger. 1. Base case: Local heat transfer in a calorimetric tube without water injection. Processes 2021, 9, 844. [Google Scholar] [CrossRef]
  2. Liu, J.; Zhu, F.; Ma, X. Industrial application of a deep purification technology for flue gas involving phase-transition agglomeration and dehumidification. Engineering 2018, 4, 416–420. [Google Scholar] [CrossRef]
  3. Xia, J.L.; Järvi, J.; Nurminen, E.; Peuraniemi, E.; Gasik, M. Cooling of gas by a water spray in a straight duct—cross flow. In Proceedings of the 10th International Congress on Liquid Atomization and Spray Systems, ICLASS-2006, Kyoto, Japan, 27 August–1 September 2006. [Google Scholar]
  4. Priedniecea, V.; Kirsanovsa, V.; Dzikēvičs, M.; Vīgants, G.; Veidenbergs, I.; Blumberga, D. Experimental and analytical study of the flue gas condenser—fog unit. Energy Procedia 2019, 158, 822–827. [Google Scholar] [CrossRef]
  5. Cao, R.; Ruan, R.; Tan, H.; Bai, S.; Du, Y.; Liu, H. Condensational growth activated by cooling method for multi-objective treatment of desulfurized flue gas: A full-scale study. Chem. Eng. J. 2021, 410, 128296. [Google Scholar] [CrossRef]
  6. Egilegor, B.; Jouhara, H.; Al-Mansour, F.; Plesnik, K.; Montorsi, L.; Manzini, L. ETEKINA: Analysis of the potential for waste heat recovery in three sectors: Aluminium low pressure die casting, steel sector and ceramic tiles manufacturing sector. Int. J. Thermofluids 2020, 1–2, 100002. [Google Scholar] [CrossRef]
  7. Wang, Q.; Wang, L.; Wua, H.; Yanga, H. Promoting fine particle removal in double-tower cascade wet flue gas desulfurization system by flue gas temperature reduction. Chem. Eng. J. 2020, 373, 581–589. [Google Scholar] [CrossRef]
  8. Gimbutaite, I.; Venckus, Z. Air pollution burning different kinds of wood in small power boilers. J. Environ. Eng. Landsc. Manag. 2008, 16, 97–103. [Google Scholar] [CrossRef]
  9. Wang, H.; Li, B.; Liu, S.; Pan, Z.; Yan, G. The effect of water spray upon incineration flue gas clean-up. J. Therm. Sci. 2000, 9, 182–186. [Google Scholar] [CrossRef]
  10. Poullikkas, A. Review of Design, Operating, and Financial Considerations in Flue Gas Desulfurization Systems. Energy Technol. Policy 2015, 2, 92–103. [Google Scholar] [CrossRef]
  11. Liua, D.; Jina, J.; Gaoa, M.; Xionga, Z.; Stangerb, R.; Wall, T. A comparative study on the design of direct contact condenser for air and oxy-fuel combustion flue gas based on Callide Oxy-fuel Project. Int. J. Greenhouse Gas Control 2018, 75, 74–84. [Google Scholar] [CrossRef]
  12. Terhan, M.; Comakli, K. Design and economic analysis of a flue gas condenser to recover latent heat from exhaust flue gas. Appl. Therm. Eng. 2016, 100, 1007–1015. [Google Scholar] [CrossRef]
  13. Venturelli, M.; Brough, D.; Milani, M.; Montorsi, L.; Jouhara, H. Comprehensive numerical model for the analysis of potential heat recovery solutions in a ceramic industry. Int. J. Thermofluids 2021, 10, 100080. [Google Scholar] [CrossRef]
  14. Sideman, S.; Moalem-Maron, D. Direct Contact Condensation. Adv. Heat Transf. 1982, 15, 227–281. [Google Scholar] [CrossRef]
  15. Takahashi, M.; Nayak, A.K.; Kitagawa, S.I.; Murakoso, H. Heat transfer in direct contact condensation of steam to subcooled water spray. J. Heat Transf. 2001, 123, 703–710. [Google Scholar] [CrossRef]
  16. Lee, S.Y.; Tankin, R.S. Study of liquid spray (water) in a condensable environment (steam). Int. J. Heat Mass Transf. 1984, 27, 363–374. [Google Scholar] [CrossRef]
  17. Chung, J.N.; Chang, T.H. A mathematical model of condensation heat and mass transfer to a moving droplet in its own vapor. J. Heat Transf. 1984, 6, 417–424. [Google Scholar] [CrossRef]
  18. Weinberg, S. Heat transfer to low pressure sprays of water steam atmosphere. Environ. Sci. 1953, 167, 240–258. [Google Scholar] [CrossRef]
  19. Choon, L.H.; Hwan, K.M.; Ki, P.S. The effect of non-condensable gas on direct contact condensation of steam/air mixture. Nucl. Eng. Technol. 2001, 33, 585–595. [Google Scholar]
  20. Gümrük, S.; Aktaş, M.K. Experimental Study of Direct Contact Condensation of Steam on Water Droplets. In Proceedings of the World Congress on Engineering 2015, London, UK, 1–3 July 2015. [Google Scholar]
  21. Long, P.; Li, Z.; Li, M. Numerical simulation study of quench tower in flue gas purification system. IOP Conf. Ser. Earth Environ. Sci. 2020, 569, 012028. [Google Scholar] [CrossRef]
  22. Ye, W.; Zhang, Q.; Xie, Y.; Cai, J.; Zhang, X. Spray cooling for high temperature of exhaust gas using a nozzle array in a confined space: Analytical and empirical predictions on cooling capacity. Appl. Therm. Eng. 2017, 127, 889–900. [Google Scholar] [CrossRef]
  23. Tissot, J.; Boulet, P.; Labergue, A.; Castanet, G.; Trinquet, F.; Fournaison, L. Experimental study on air cooling by spray in the upstream flow of a heat exchanger. Int. J. Therm. Sci. 2012, 60, 23–31. [Google Scholar] [CrossRef] [Green Version]
  24. Chen, C.W.; Yang, C.Y.; Hu, Y.T. Heat Transfer Enhancement of Spray Cooling on Flat Aluminum Tube Heat Exchanger. Heat Transf. Eng. 2013, 34, 29–36. [Google Scholar] [CrossRef]
  25. Thulukkanam, K. Heat Exchanger Design Handbook, 2nd ed.; CRC Press: Boca Raton, FL, USA, 2013. [Google Scholar]
  26. Siddique, M. The Effects of Noncondensable Gases on Steam Condensation under Forced Convection Conditions. Ph.D. Thesis, Department of Nuclear Engineering, Massachusetts Institute of Technology, Cambridge, MA, USA, 1992. [Google Scholar]
  27. Jeong, K.; Kessen, M.J.; Bilirgen, H.; Levy, E.K. Analytical modelling of water condensation in condensing heat exchanger. Int. J. Heat Mass Transf. 2010, 53, 2361–2368. [Google Scholar] [CrossRef]
  28. Barford, N.C. Experimental Measurements: Precision, Error and Truth, 2nd ed.; John Willey & Sons: Hoboken, NJ, USA, 1985. [Google Scholar]
  29. American Meteorological Society. Available online: https://journals.ametsoc.org/doi/pdf/10.1175/BAMS-86-2-225 (accessed on 18 May 2021).
Figure 1. (1) boiler; (2) flue gas pipe; (3) heat exchanger (fan-coil type); (4) flue gas exhauster; (5) water injection supply pump; (6) injection water tank; (7) bypass pipe; (8) damper; (9) inlet flue gas flow rate, temperature and humidity measurement point (before test section); (10) water injection chamber; (11) water mixer; (12) vertical calorimetric tube—the model of flue gas condensing heat exchanger (economizer); (13) cooling water discharge line; (14) cooling water supply line; (15) collection tank.
Processes 09 01310 g001
Figure 2. Temperature distribution along the model of the condensing heat exchanger at Rein ≈ 9500, different flue gas inlet temperatures and in the case when water is not injected (a) Rein ≈ 9500, tin≈ 80 °C, (c) Rein ≈ 9500, tin ≈ 115 °C and is injected (b) Rein ≈ 9500, tin ≈ 87 °C, (d) Rein ≈ 9500, tin ≈ 122 °C: (1) center of the calorimetric tube, (2) inner wall of the calorimetric tube, (3) cooling water in the middle of the inner and the outer tubes, (4) dew point temperature at the inlet to the calorimetric tube.
Processes 09 01310 g002
Figure 3. Distribution of the total local Nusselt number along the model of the condensing heat exchanger at Rein ≈ 9500, different flue gas inlet temperatures and for the cases when no water was injected into the flue gas flow and when it was injected: (1) tin ≈ 80 °C without injection, (2) tin ≈ 87 °C with injection, (3) tin ≈ 115 °C without injection, (4) tin ≈ 122 °C with injection.
Processes 09 01310 g003
Figure 4. Temperature distribution along the model of the condensing heat exchanger at Rein ≈ 21,000, different flue gas inlet temperatures and in the case when water is not injected (a) Rein ≈ 21,000, tin ≈ 97 °C, (c) Rein ≈ 21,000, tin ≈ 97 °C and is injected (b) Rein ≈ 21,000, tin ≈ 129 °C, (d) Rein ≈ 21,000, tin ≈ 135 °C: (1) center of the calorimetric tube, (2) inner wall of the calorimetric tube, (3) cooling water in the middle of the inner and the outer tubes, (4) dew point temperature at the inlet into the calorimetric tube.
Processes 09 01310 g004
Figure 5. Distribution of the total local Nusselt number along the model of the condensing heat exchanger at Rein ≈ 21,000, different flue gas inlet temperatures and for the cases when no water was injected into the flue gas flow and when it was injected: (1) tin ≈ 97 °C without injection, (2) tin ≈ 97 °C with injection, (3) tin ≈ 129 °C without injection, (4) tin ≈ 135 °C with injection.
Processes 09 01310 g005
Figure 6. Temperature distribution along the model of the condensing heat exchanger at Rein ≈ 9500, different flue gas inlet temperatures (a) tin ≈ 88 °C, (b) tin ≈ 125 °C and water injection of 40 °C: (1) center of the calorimetric tube, (2) the inner wall of the calorimetric tube, (3) cooling water in the middle of the inner and the outer tubes, (4) dew point temperature at the inlet to the calorimetric tube.
Processes 09 01310 g006
Figure 7. Distribution of the total local Nusselt number along the model of the condensing heat exchanger at Rein ≈ 9500, different flue gas inlet temperatures and for the case when water was injected into the flue gas flow: (1) tin ≈ 88 °C, (2) tin ≈ 125 °C.
Processes 09 01310 g007
Figure 8. Temperature distribution along the model of the condensing heat exchanger at Rein ≈ 21,000, different flue gas inlet temperatures (a) tin ≈ 103 °C, (b) tin ≈ 138 °C and water injection of 40 °C: (1) center of the calorimetric tube, (2) the inner wall of the calorimetric tube, (3) cooling water in the middle of the inner and the outer tubes, (4) dew point temperature at the inlet to the calorimetric tube.
Processes 09 01310 g008
Figure 9. Distribution of the total local Nusselt number along the model of the condensing heat exchanger at Rein ≈ 21,000, different flue gas inlet temperatures: (1) tin ≈ 103 °C, (2) tin ≈ 138 °C.
Processes 09 01310 g009
Figure 10. Distribution of the total local Nusselt number along the model of the condensing heat exchanger at Rein ≈ 9500 for the different inlet flue gas and injected water temperatures: (1) tin ≈ 87 °C and injected water temperature 25 °C, (2) tin ≈ 88 °C and injected water temperature 40 °C, (3) tin ≈ 122 °C and injected water temperature 25 °C, (4) tin ≈ 125 °C and injected water temperature 40 °C.
Processes 09 01310 g010
Figure 11. Distribution of the total local Nusselt number along the model of the condensing heat exchanger at Rein ≈ 21,000 for the different inlet flue gas and injected water temperatures: (1) tin ≈ 97 °C and injected water temperature 25 °C, (2) tin ≈ 103 °C and injected water temperature 40 °C, (3) tin ≈ 135 °C and injected water temperature 25 °C, (4) tin ≈ 138 °C and injected water temperature 40 °C.
Processes 09 01310 g011
Publisher’s Note: MDPI stays neutral with regard to jurisdictional claims in published maps and institutional affiliations.

