
Design and Analysis of a Mooring Buoy for a Floating Arrayed WEC Platform

VL Offshore, Houston, TX 77084, USA
*
Author to whom correspondence should be addressed.
Processes 2021, 9(8), 1390; https://0-doi-org.brum.beds.ac.uk/10.3390/pr9081390
Submission received: 20 July 2021
/
Revised: 5 August 2021
/
Accepted: 6 August 2021
/
Published: 10 August 2021
(This article belongs to the Special Issue Wave Energy Technologies in Korea)
Abstract
:This paper presents the design and analysis of a mooring buoy and its mooring systems to moor a floating platform mounting an arrayed Wave Energy Converters (WECs). The mooring buoy allows the WEC platform to weathervane around the mooring buoy freely by the prevailing environment directions, which enables consistent power generation. The WEC platform is connected to the buoy with synthetic hawsers, while station-keeping of the buoy is maintained with catenary mooring lines of chains tied to the buoy keel. The buoy also accommodates a power cable to transfer the electricity from the WEC platform to the shore. The WEC platform is designed to produce a total of 1.0 MW with multiple WECs installed in an array. Fully coupled time-domain analyses are conducted under the site sea states, including extreme 50 y and survival 100 y conditions. The buoy motions, mooring tensions and other design parameters are evaluated. Strength and fatigue designs of the mooring systems are validated with requirements according to industry standards. Global and local structural designs of the mooring buoy are carried out and confirm the design compliances.
1. Introduction
There are various types of offshore energy devices that generate power from waves. Those can be broadly categorized into several types of platforms or devices, according to the energy-capturing method [1,2]. A station-keeping system for the floating WEC was developed for the WEC device to meet the design requirements of power production and also safety in the extreme seas. Most WEC systems are non-networked system, so mooring methods used for oil and gas platforms are implemented for a shallow or deep-water application. Those can include spread mooring and vertically tensioned taut mooring. The spread mooring can be configured into catenary, semi-taut and taut. A Single Point Mooring (SPM) or Catenary Anchor Leg Mooring (CALM) is another type of mooring, which may use a single line or multi-line spread system to moor the WEC system. WEC mooring system design, typically for a point observer, aims to resonate the WEC system in a range of wave frequencies to improve the power production. Thus, the system will differ from the oil and gas platform station-keeping systems, which are typically designed to suppress the platform responses. Details of WEC mooring system configurations, designs and modeling methods are reviewed in the documents [3,4].
Most common moorings utilize the catenary configurations. For a point observer, single or multi-line catenary moorings [5,6,7,8,9,10] or taut mooring [11] are used. Large floating WEC systems of Pelamis [12] and Wave Dragon [13,14] are moored with a CALM type spread configuration. A Single Anchor Leg Mooring (SALM) is also implemented in the WEPTOS system [15,16]. A comparison study of CALM and SALM for the large WEC system is described in reference [17].
Hybrid systems are also proposed to combine wave and wind energy production. A hybrid 10 MW platform with multi-WECs uses multi-line catenary mooring [18]. Due to co-application of the WEC with the wind turbine system, the hybrid platform becomes large, so the moorings were developed primarily for station keeping of the wind system [19,20,21,22].
However, the majority of WECs are stand-alone floating systems with spread mooring and their energy production performance is highly dependent on the wave directionality, water depth and design sea states. The existing floating energy devices are also primarily focused on the energy capturing device, and the mooring design is considered secondary. However, the mooring system is an integral part of the floating energy devices, especially for a large system, and can be designed to improve the overall WEC system energy capture performances while also minimizing cost.
CALM buoys have been applied widely over decades to moor the tank vessels to offload oil or gas liquids [23,24,25,26]. However, even though the CALM buoy mooring technology is mature, the CALM buoy to date is only utilized for oil or gas transfer. By implementing the CALM buoy technologies, we are involved in developing a weathervaning mooring buoy to moor a floating platform for multiple arrayed WEC devices [27].
The objective of the present study is to develop an innovative mooring buoy system allowing the connected WEC platform to rotate 360 deg. around the buoy center by a prevailing environmental direction while the produced electricity is transferred through the mooring buoy to shore via an export power cable. The mooring buoy system consists of a stationary cylinder hull and rotating turn table to allow the rotation of the WEC platform that is separated from the mooring buoy at a distance and connected to the buoy with hawsers. The hawsers are designed to disconnect the WEC platform so that the WEC platform can be towed to a port for any major repair, if necessary. The import power cable from the WEC platform is connected to a cable connector on the turntable, while the export cable is connected to the buoy through a moonpool at the buoy center. With this technology, the power production performance is steady for all wave headings, due to the weathervaning characteristics of the WEC platform, resulting in significantly improving the annual energy production. It is also through such innovations as the weathervaning mooring buoy technology, that renewable ocean energy resources can be more efficiently harvested and also harvested further offshore. This, in turn, will help address issues of global sustainable energy production and climate risk mitigation.
According to research about climate change [28], it is suggested that there will be more frequent and severe precipitation events, resulting in increases in runoff and flooding events over land masses, including near coastal areas. It remains to be seen how changes in the volume of water inflow into the oceans could affect currents and waves, though it is also likely that the warming climate will increase storm events near offshore. Thus, the weathervaning buoy technology, along with the WEC platform’s ability to change geometry to the incident storm waves, will help the system’s survivability and durability in areas with higher storm frequencies, going forward
The truss-type WEC platform comprises three hull sections of the fore, starboard and port hulls, which can be configured to a variable shape in response to the incident waves. A rated power of 1.0 MW is produced with a total of 20 WECs with a shape of an asymmetric rotor [29,30,31]. Performance of the integrated platform with the mooring system and WECs was tested in the wave basin in KRISO [32,33]. The WEC system is designed to be installed at a site located in the west offshore of Jeju island in South Korea.
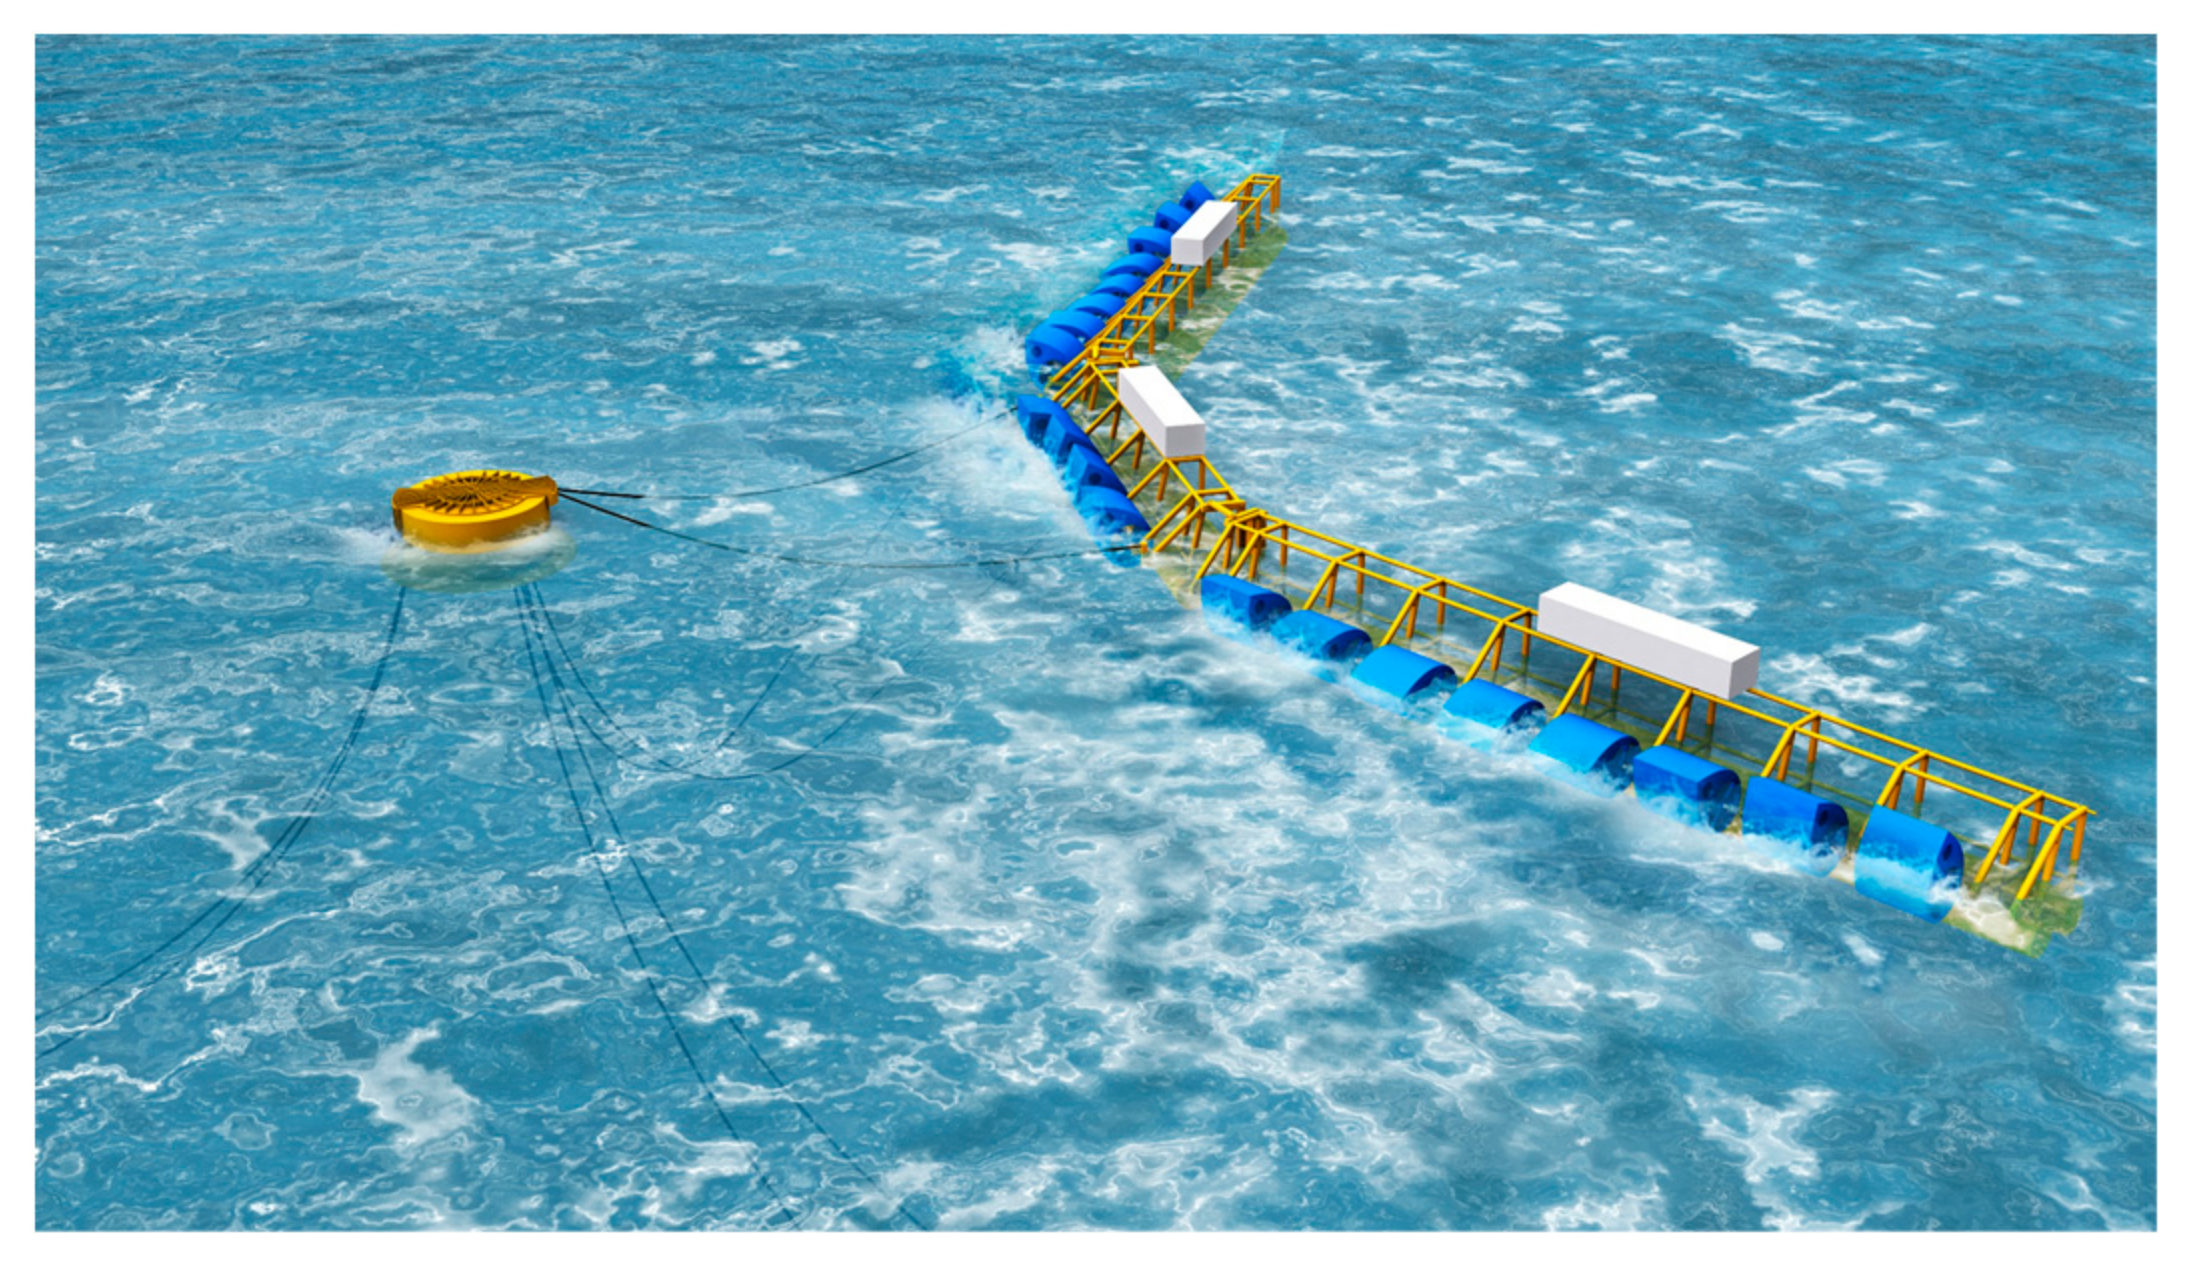
This paper describes the design and analysis results of the mooring buoy system, including the mooring line strength, mooring fatigue and buoy structural design. The buoy is moored with six catenary mooring lines, whereas the platform is moored (connected) to the mooring buoy with two hawsers. Figure 1 presents a layout of the truss-type WEC platform and mooring buoy installed.
The present numerical model includes all the key structures of WEC platform, mooring buoy and lines, hawsers and import and export power cables, to assess the coupled effects to the mooring system. The mooring system strength design and validations are based on the site extreme and survival conditions, whereas the mooring fatigue analysis is conducted for operating seas. Comprehensive analysis to cover the environment headings from 0 deg. to 180 deg., wave–wind–current mis-alignment cases, and mooring line damage conditions required by API RP 2SK [34] were completed; however, the results for the heading 0 deg. with codirection cases are presented in this paper, unless otherwise described.
2. Methods for Design and Numerical Modeling
2.1. Basis of Design
The WEC platform is designed to be installed to the west offshore of Jeju island, South Korea at a water depth of 96 m. The metocean conditions are summarized in Table 1. Return periods of 50 and 100 y conditions are considered design extreme and survival conditions, respectively. The irregular sea states are represented with JONSWAP spectra. The winds are at 10 m above the surface, respectively. Codirectional environments are considered.
The design load cases considered in the buoy and WEC platform response analysis are based on industry standards. The mooring system design shall comply first with the requirements specified by API RP 2SK [34], API RP 2SM [35], ABS FPI [36], ABS Guidance [37], as the WEC platform and mooring buoy stays connected, even during the extreme and survival storm events, except in the disconnected cases for the platform maintenance. The design life of the mooring systems is 20 years. The Factors of Safety (FoS) of the mooring and hawser lines are summarized in Table 2 and Table 3, where the FoSs of the mooring lines are for the dynamic model.
The single point mooring design requirements of mooring lines and hawsers shall comply with ABS SPM [38], as the buoy mooring can be considered a SPM. Table 4 and Table 5 summarize the design requirement of the SPM buoy. When the platform is disconnected (buoy alone, SPM mooring case), the 100 y condition is applied to the buoy mooring.
2.2. Mooring and WEC Platform System Configurations
2.2.1. Mooring System
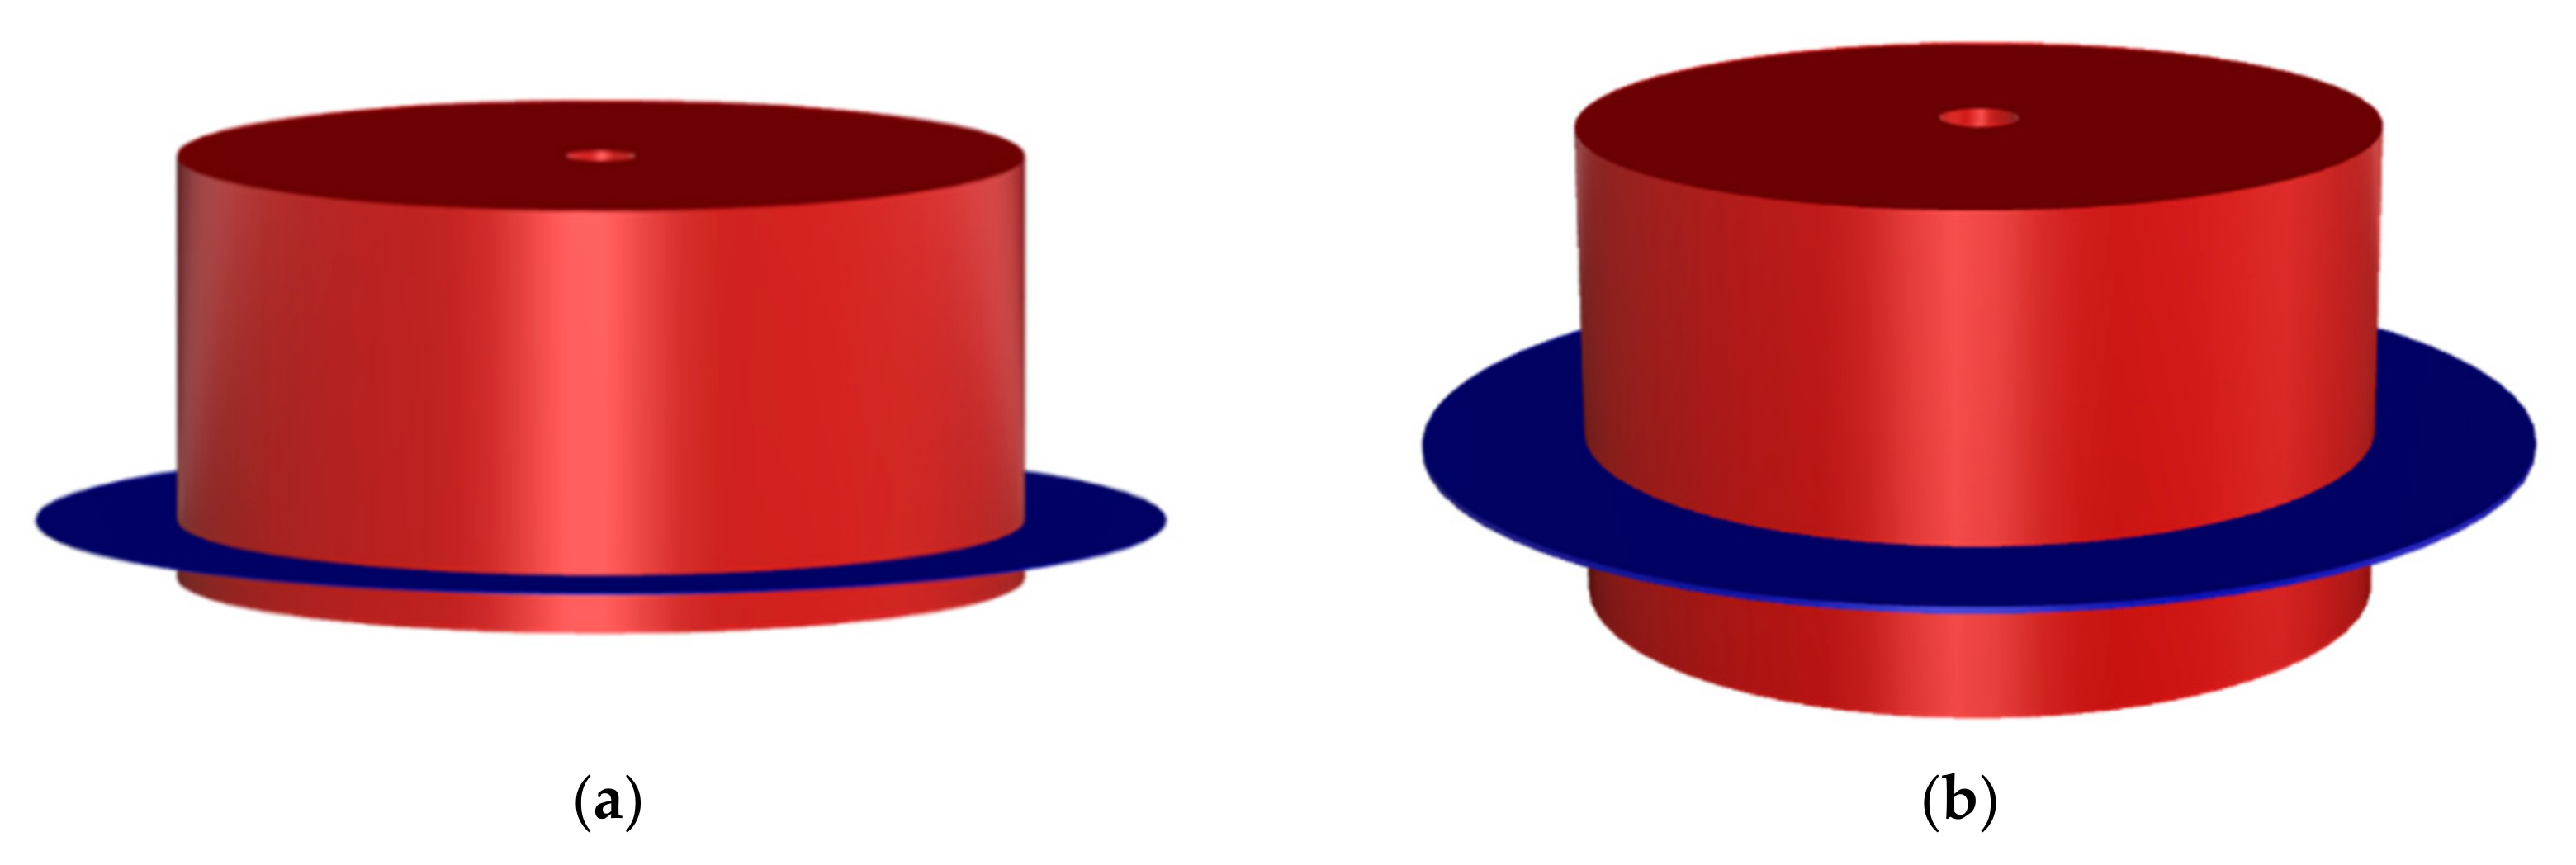
The floating WEC platform is moored to the mooring buoy with the hawsers. The mooring buoy consists of a turn table, a buoy hull with skirt, fairleads, main bearings, a power cable swivel (slip ring), power cable connectors and appurtenances. Two different buoy configurations of A and B (Figure 2) were initially studied to identify the best performance in terms of the buoy steel weight and hydrodynamic responses. Dimensions and weights differ for the options. Options A and B have the buoy hull with skirt, where the skirt location of each option varies as presented. The buoys in Figure 2 exclude the buoy turn table and other details. Through the screening analysis, option A was selected to be used in the foregoing analysis.
Through a design spiral process, the mooring buoy is optimally sized and configured to moor the WEC platform. The particulars of the buoy (option A) are summarized in Table 6. The buoy has a single diameter hull with skirt above the keel of the buoy hull. The overall hull height and diameter are 6 m and 12 m. Displacement is about 463 tonnes at an operating draft of 4 m. A moon pool with a diameter of 1.0 m is used for the export power cable installation. A total of six mooring lines of 500 m long each are selected after the pre-screening analysis of various mooring combinations. The mooring lines consist of three groups of two lines with 10 deg separation between the two lines in the same group, so that the angle between groups is 120 deg. The properties of the mooring and hawser lines are summarized in Table 7. Each mooring line consists of a single studless chain system with a Minimum Breaking Load (MBL) of 11856 kN. The mooring line fairleads are located 0.8 m above the buoy edge keel. The pretension of each mooring line is 337 kN. A corrosion allowance of 9 mm is applied to the nominal diameter of the chain for the mooring strength analysis.
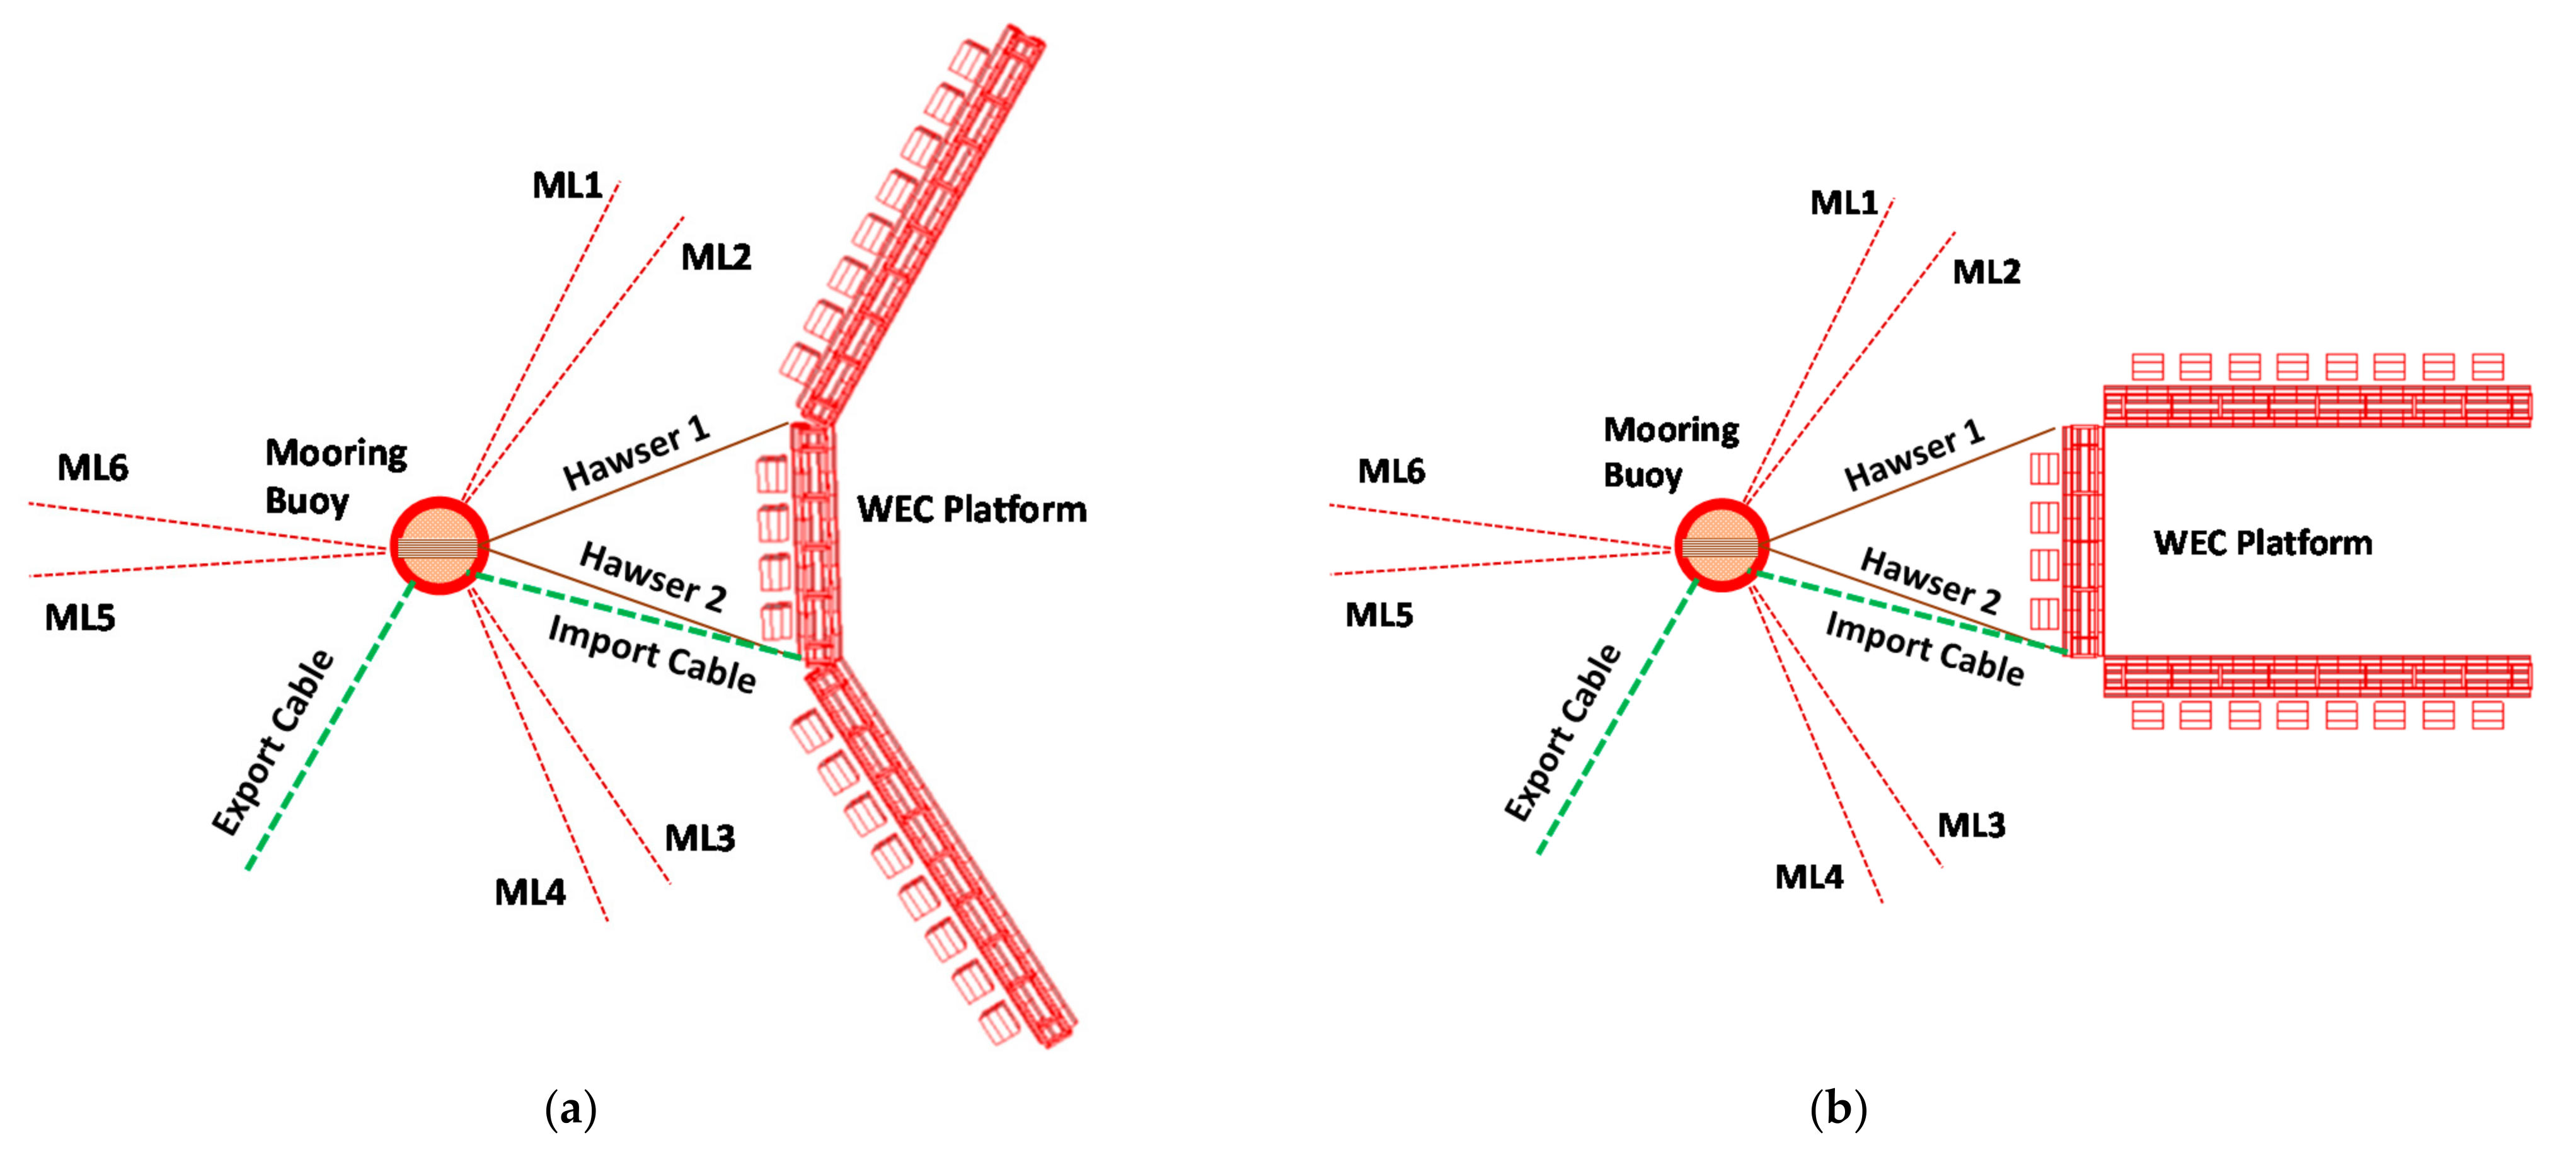
Two hawsers with a length of 50 m each are used to connect the WEC platform to the mooring buoy. One end of the hawser is connected to the turntable, and the other end is connected to the hull of the WEC platform at the mean water level. Mooring and hawser layouts are illustrated in Figure 3. For the hawser stiffness, the stiffness of 4.14 × 10⁵ kN for cycling between 20% and 30% MBL is used for the dynamic analysis.
2.2.2. Arrayed WEC Platform and System Layouts
The arrayed WEC platform with a rated power of 1.0 MW consists of various components: truss type hulls (pontoons, brace members, appurtenances), twenty WEC assemblies (rotor, pump, shaft), generators and electrical equipment, marine systems, power cable from the platform to the buoy, hawser fairleads and power cable connectors, as illustrated in Figure 3. The platform particulars are summarized in Table 8. Each WEC rotor assembly is designed to generate 50 kW [29,30].
The WEC platform has two variable configurations depending on the sea states. Figure 3a presents the operating (power production) mode configured with a side hull angle of 150 deg. under normal operating seas [32]. However, during the storm seas, the platform is changed to the storm configuration to reduce the environmental loads to the system as shown in Figure 3b.
The mooring buoy, six mooring lines from ML1 to ML6 and two hawsers are illustrated in those figures. There are two power transfer cables (Figure 3): import and export cables. One end of the import cable is connected to a connector located at the keel level of the starboard end of the fore hull section, whereas the other end is connected to the bottom end of a pull tube located on the buoy. The export cable is installed through the moon pool in the buoy center and runs toward shore. The export cable is configured with a lazy wave shape, but the import cable is free hanging between the WEC platform and the mooring buoy. The cable subsea shape, tie-in location to the mooring buoy and WEC platform and laying direction are chosen such that no clashing of the cables with the mooring lines or hawsers occurs. Due to the weathervaning capability, the import cable rotates around the buoy along with the turntable as the platform orientation changes.
2.3. Numerical Modeling
2.3.1. Mooring and WEC Platform
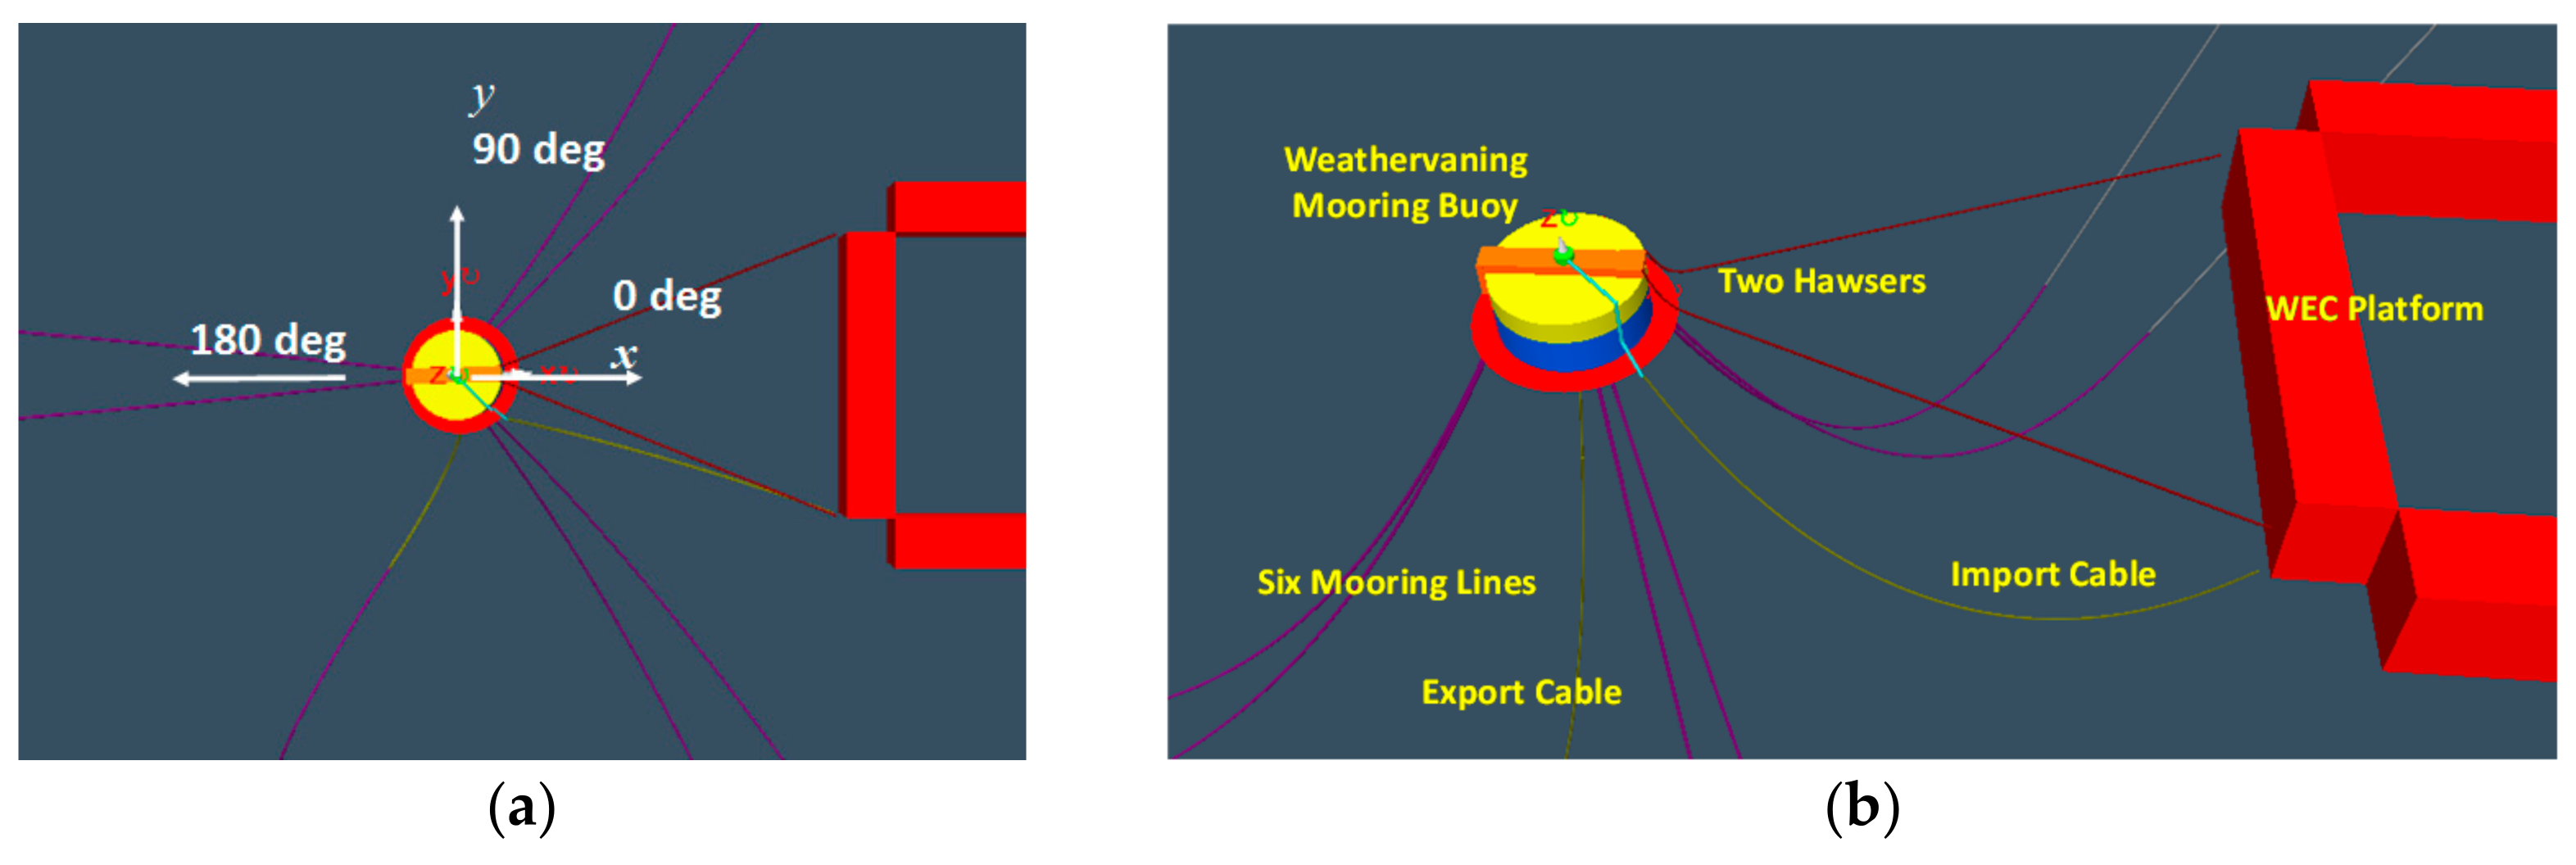
Figure 4a presents a coordinate reference origin located at the buoy center on the mean waterline. The mooring lines are numbered as presented in Figure 3. The headings refer to the direction in which the wave, wind and current flow. The present numerical modeling and mooring analysis are conducted, using Orcaflex [39]. A captured image of a resulting numerical model of the storm configuration is shown in Figure 4b, where all the key components of the system are presented. Additionally, refer to a plan view sketch in Figure 3b.
2.3.2. Uncoupled and Coupled System Modeling
In this paper, two mooring buoy conditions are considered to investigate the platform coupling effects to the mooring systems: uncoupled and coupled systems. The uncoupled system is the only moored buoy not connected to the WEC platform and not connected to the power cables. The coupled system considers the case with the WEC platform and power cables connected to the buoy. The coupled model uses the configuration Figure 3a for the mooring line fatigue analysis and Figure 3b for the buoy system response analysis under the extreme and survival seas. In this paper, the results of a heading of 0 deg. are presented unless otherwise mentioned.
The current loads of the buoy and platform are considered with the drag coefficients and current coefficients, respectively. However, the wind loads on both structures are not included in the present study, due to the very low structure profile of the mooring buoy and WEC platform over the sea surface. The WEC platform hull viscous damping derived from the wave basin model testing [32] is implemented in the coupled model.
Numerical simulations are run for 3 h in the time domain, excluding the initial ramp time. The maximal motion responses of the mooring buoy and WEC platform and mooring line tensions are computed with the extreme method of Most Probable Maximum (MPM), using the simulated time histories. The MPM is estimated with the following equation.
where is the number of peaks and and are the mean, standard deviation and mean up-crossing period, respectively.
3. Results and Discussion
3.1. Mooring Buoy System Identification Tests
3.1.1. Mooring System Restoring Forces
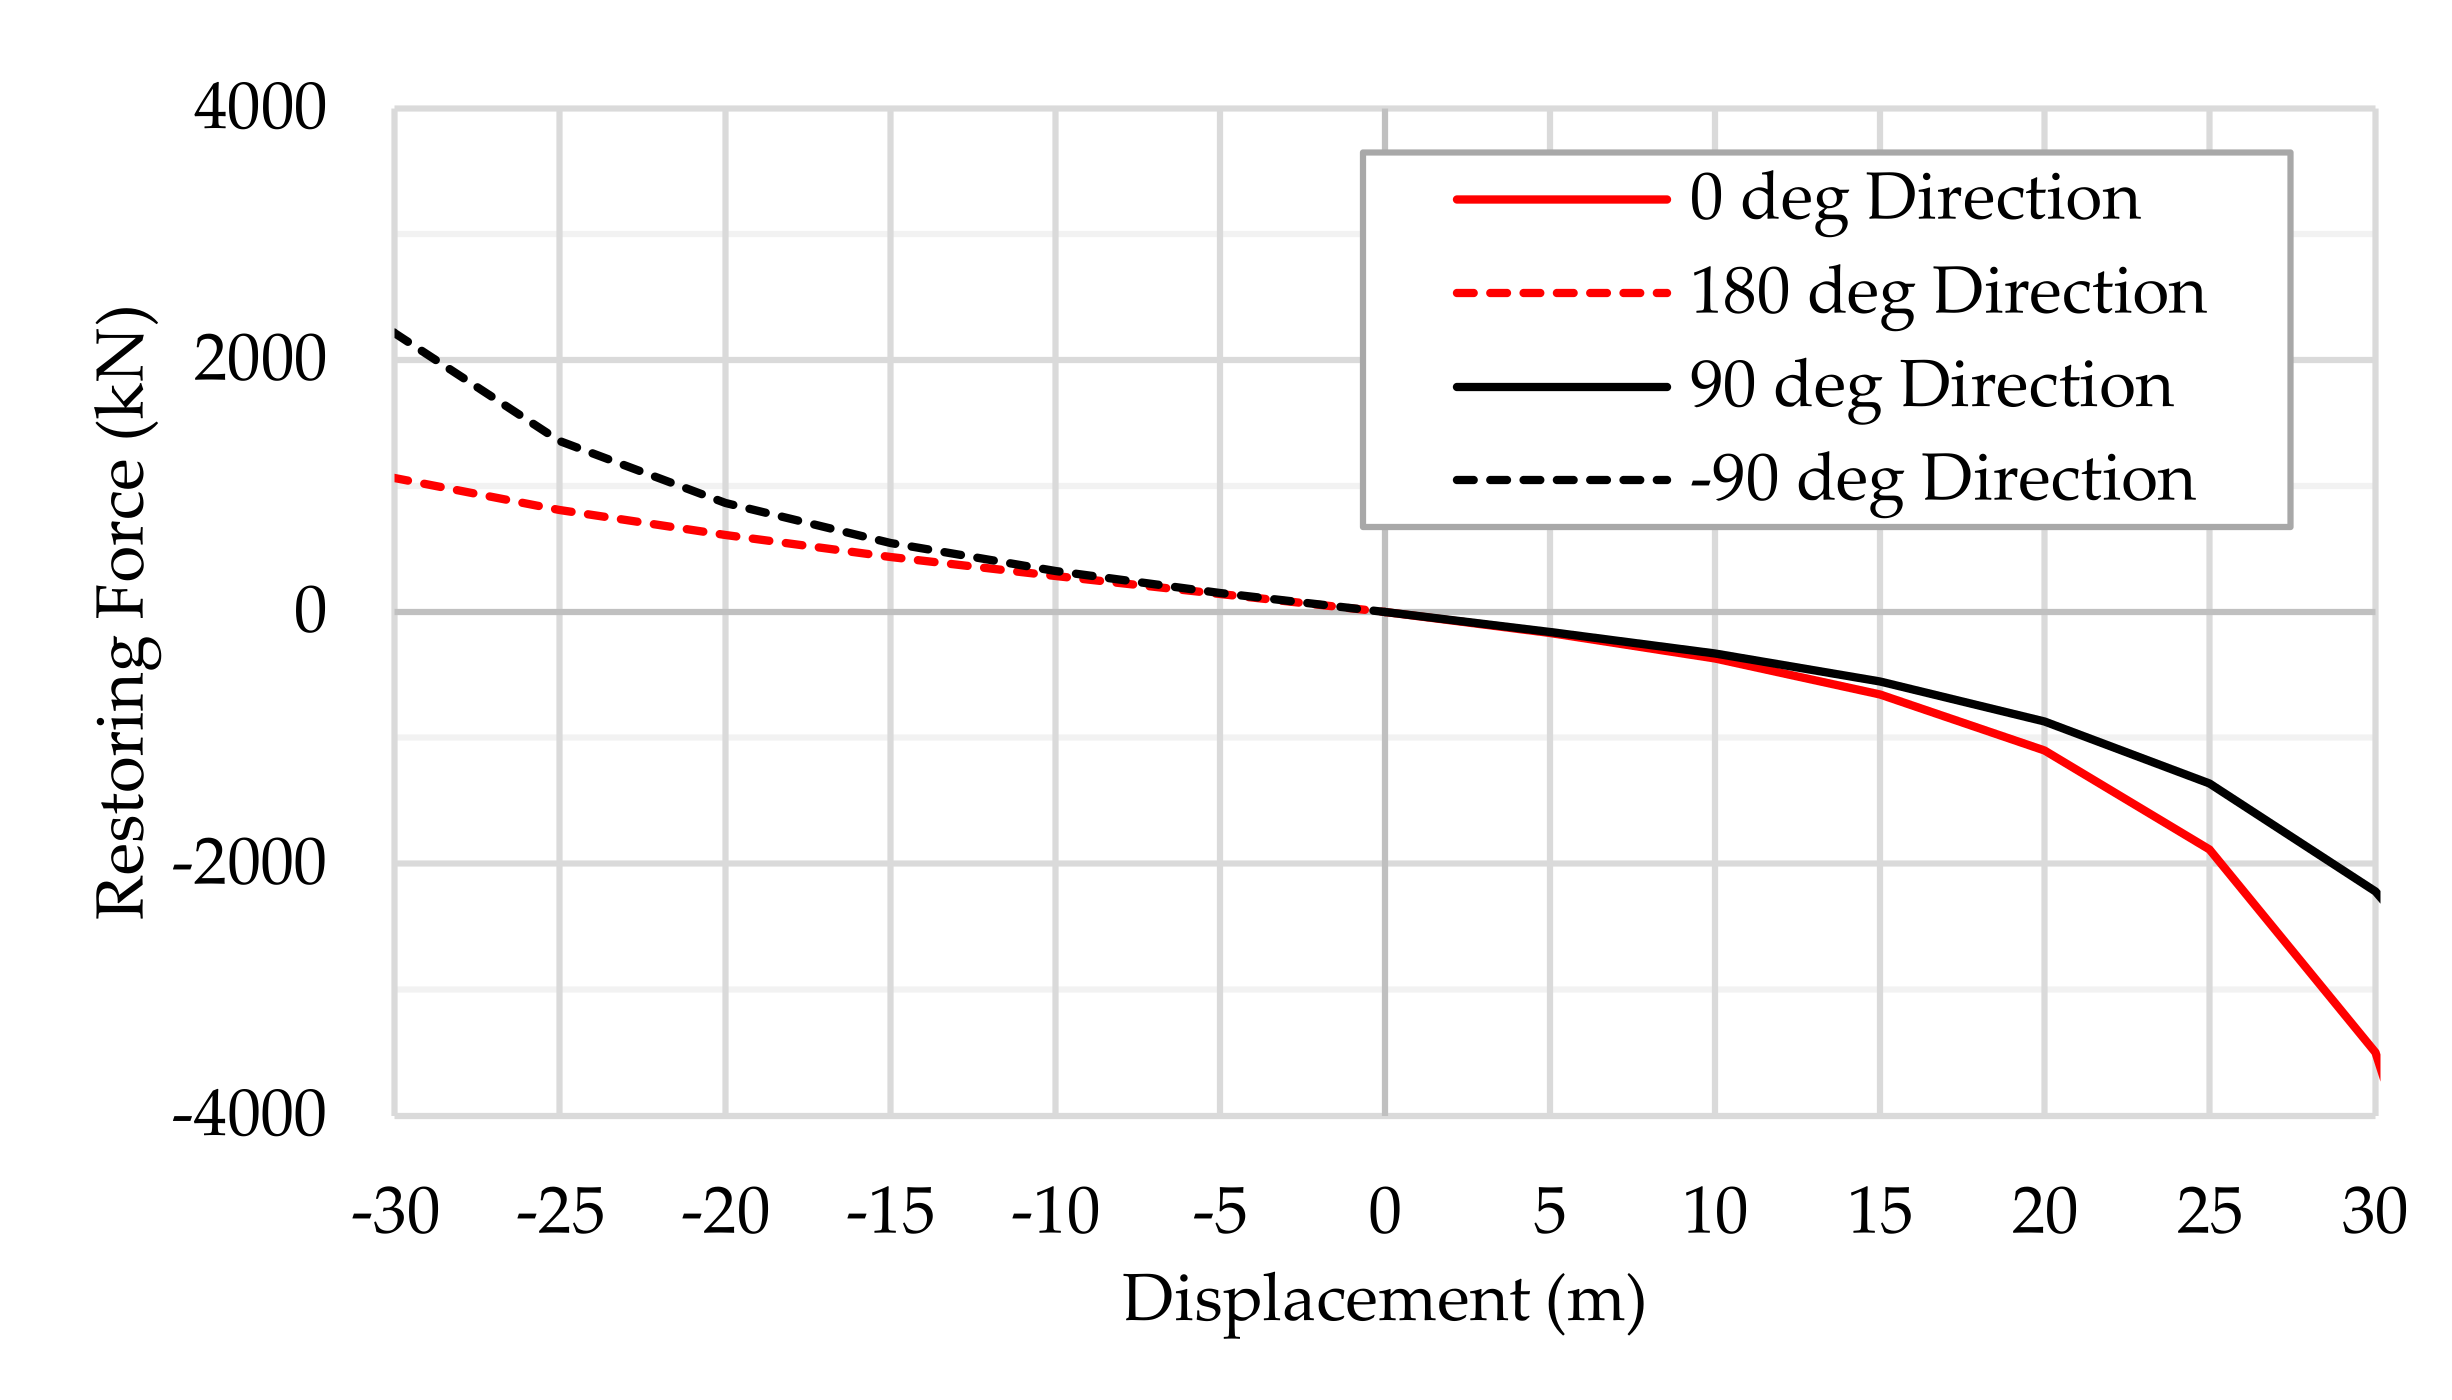
Restoring forces of the entire mooring system of the mooring buoy estimated at four directions of 0, ±90 and 180 deg. are compared in Figure 5. The displacement (offset) directions of 0 and +90 are toward the +x- and +y-axes directions as presented in Figure 4. Nonlinear behaviors of the mooring stiffness are seen from about ±10 m displacement.
3.1.2. Mooring Buoy Free Decay Tests and Viscous Damping
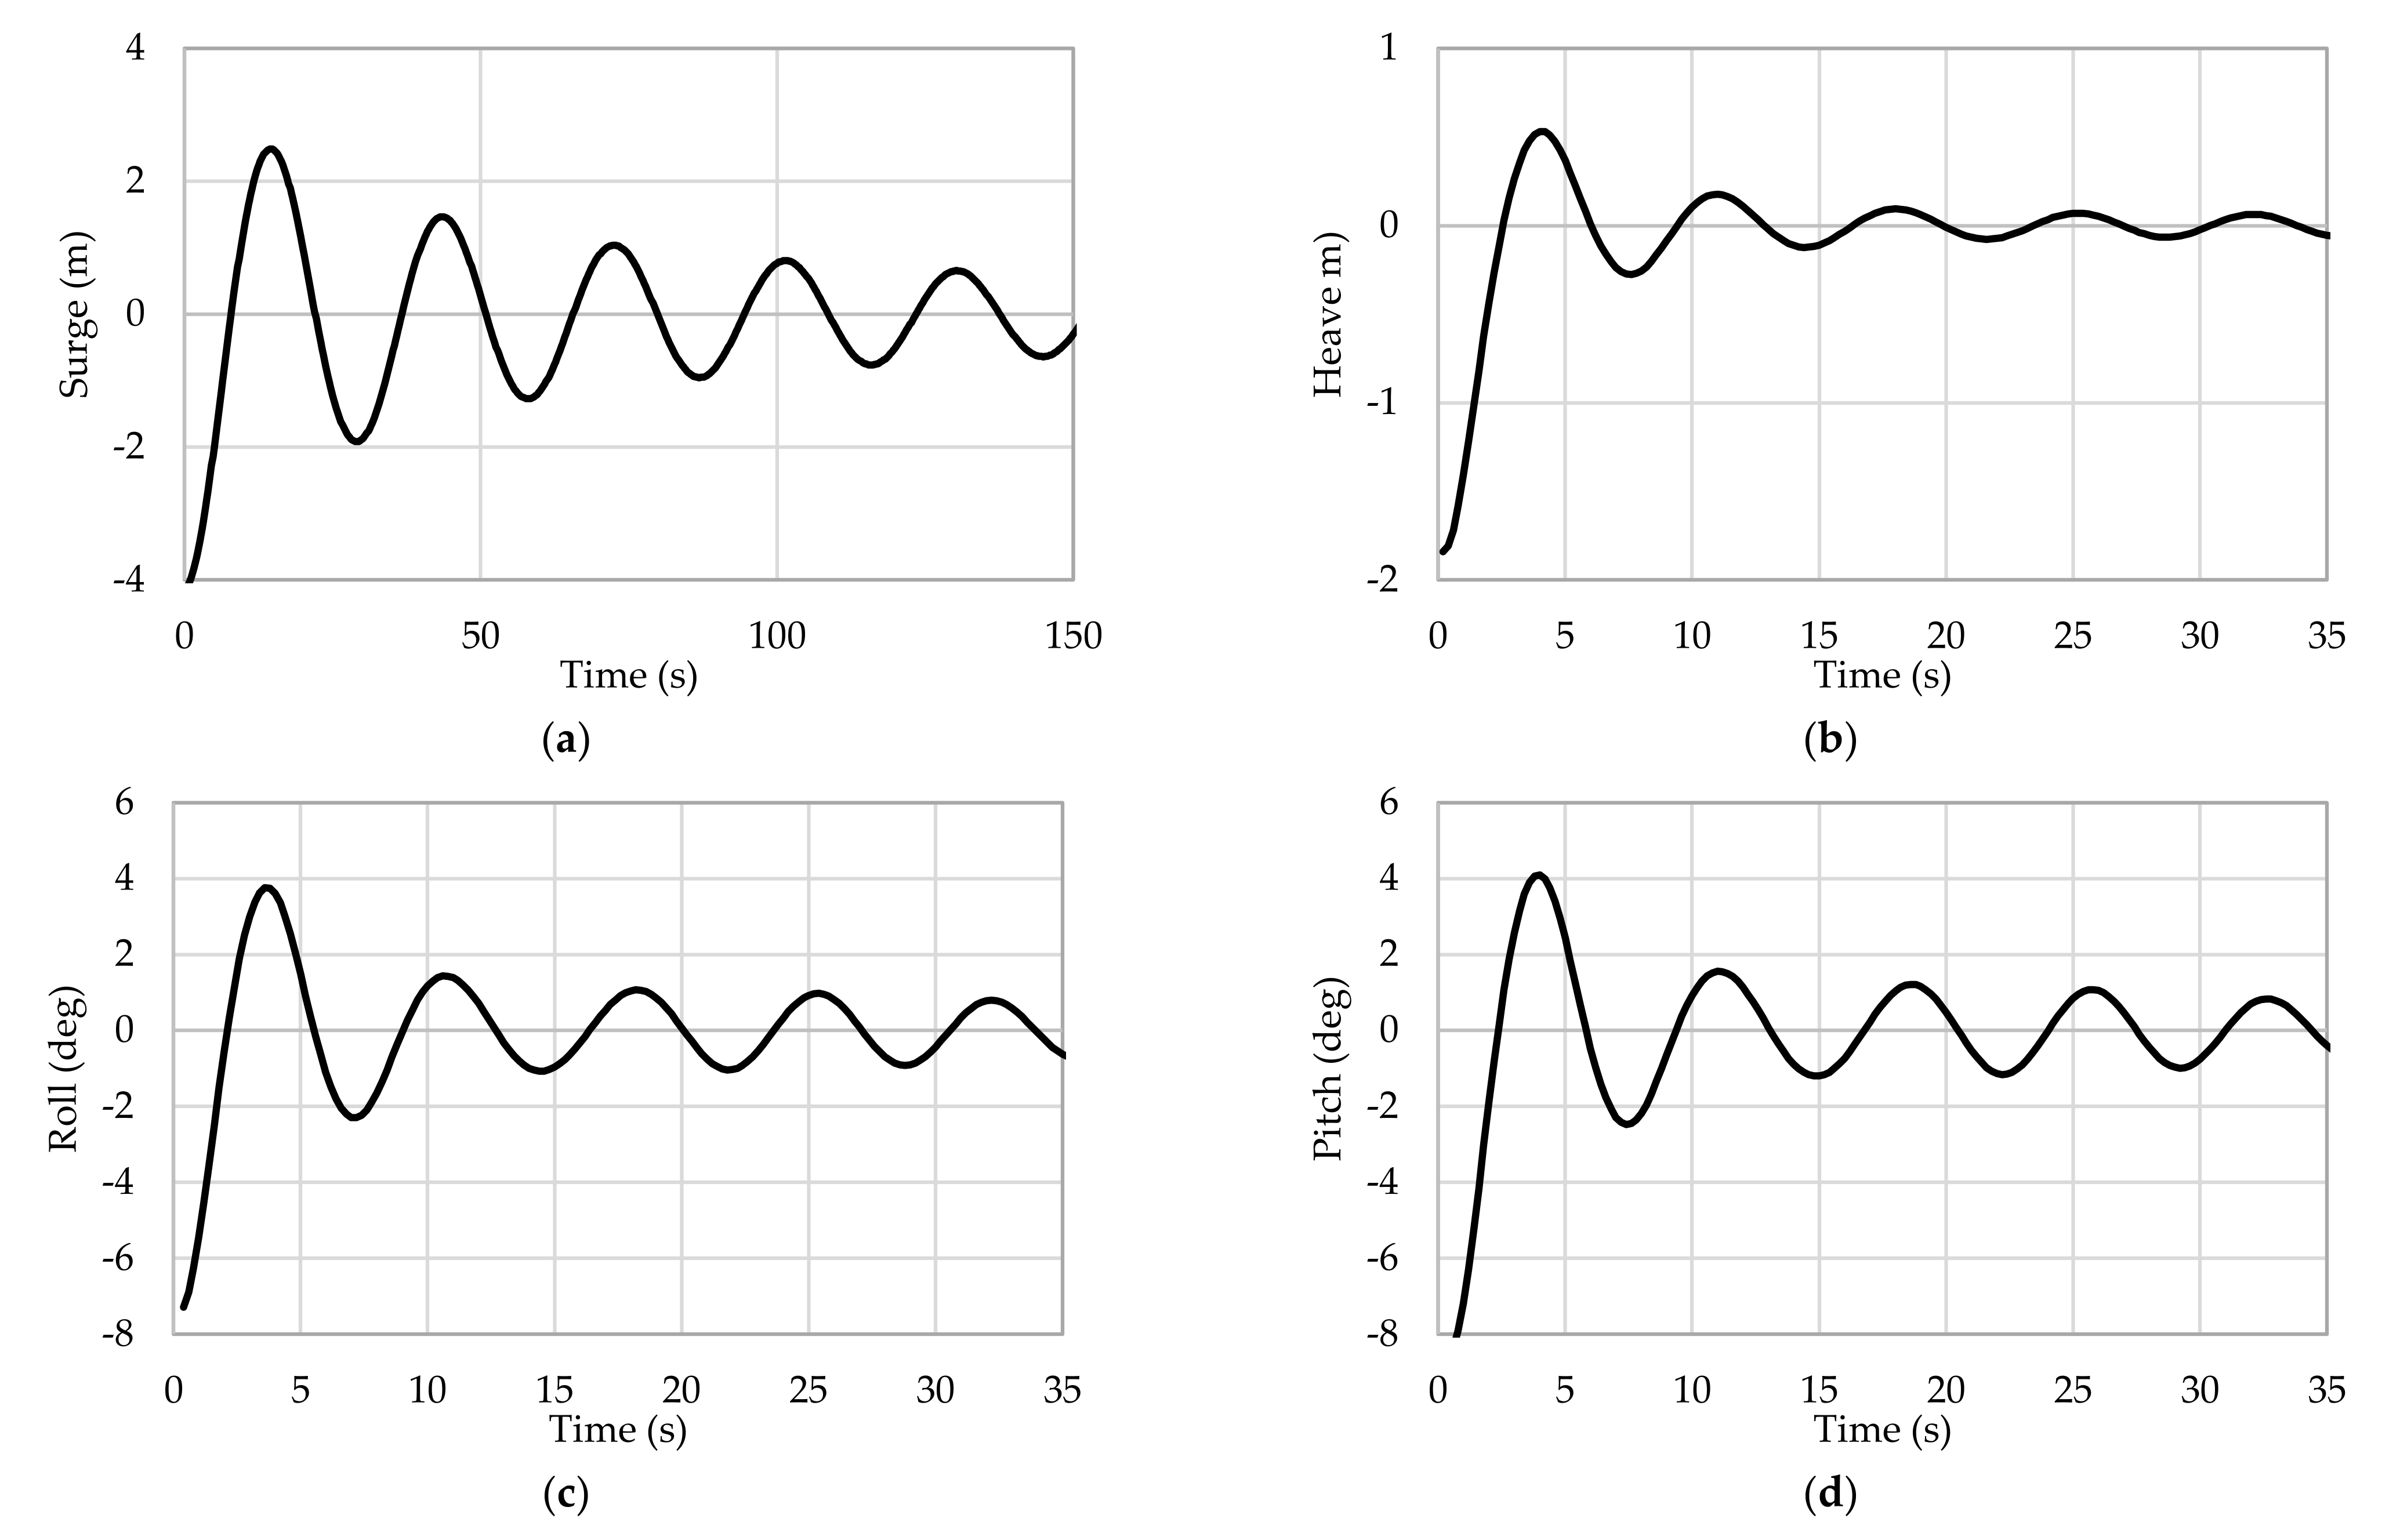
Free decay tests of the mooring buoy (uncoupled) with six lines are conducted at the KRISO wave basin for surge, sway, heave, roll and pitch. The physical decay test results are then used to calibrate the viscous damping of the buoy in the numerical model. The surge, heave and roll decay time histories from the numerical simulations after the correlations are presented in Figure 6.
Natural frequencies of the mooring system between the wave basin model tests and simulations are compared in Table 9, which shows that the differences between the two methods are within about −6% to 8%.
From the free decay tests, the viscous damping ratio can be estimated, using a logarithmic decrement as shown in the following equations.
where , and are three consecutive crest values and and are two consecutive trough values. The damping coefficients are then calculated using the following equation:
where is the mass, the added mass, the natural frequency and ς the critical damping ratio. The total and radiation damping ratios are first computed, using the average values of three cycles of each motion time history. The viscous damping ratios are then computed by subtracting the radiation damping from the total damping. The resulting viscous damping coefficients of the mooring buoy are summarized in Table 10.
3.1.3. RAOs of Mooring Buoy Motion and Tension
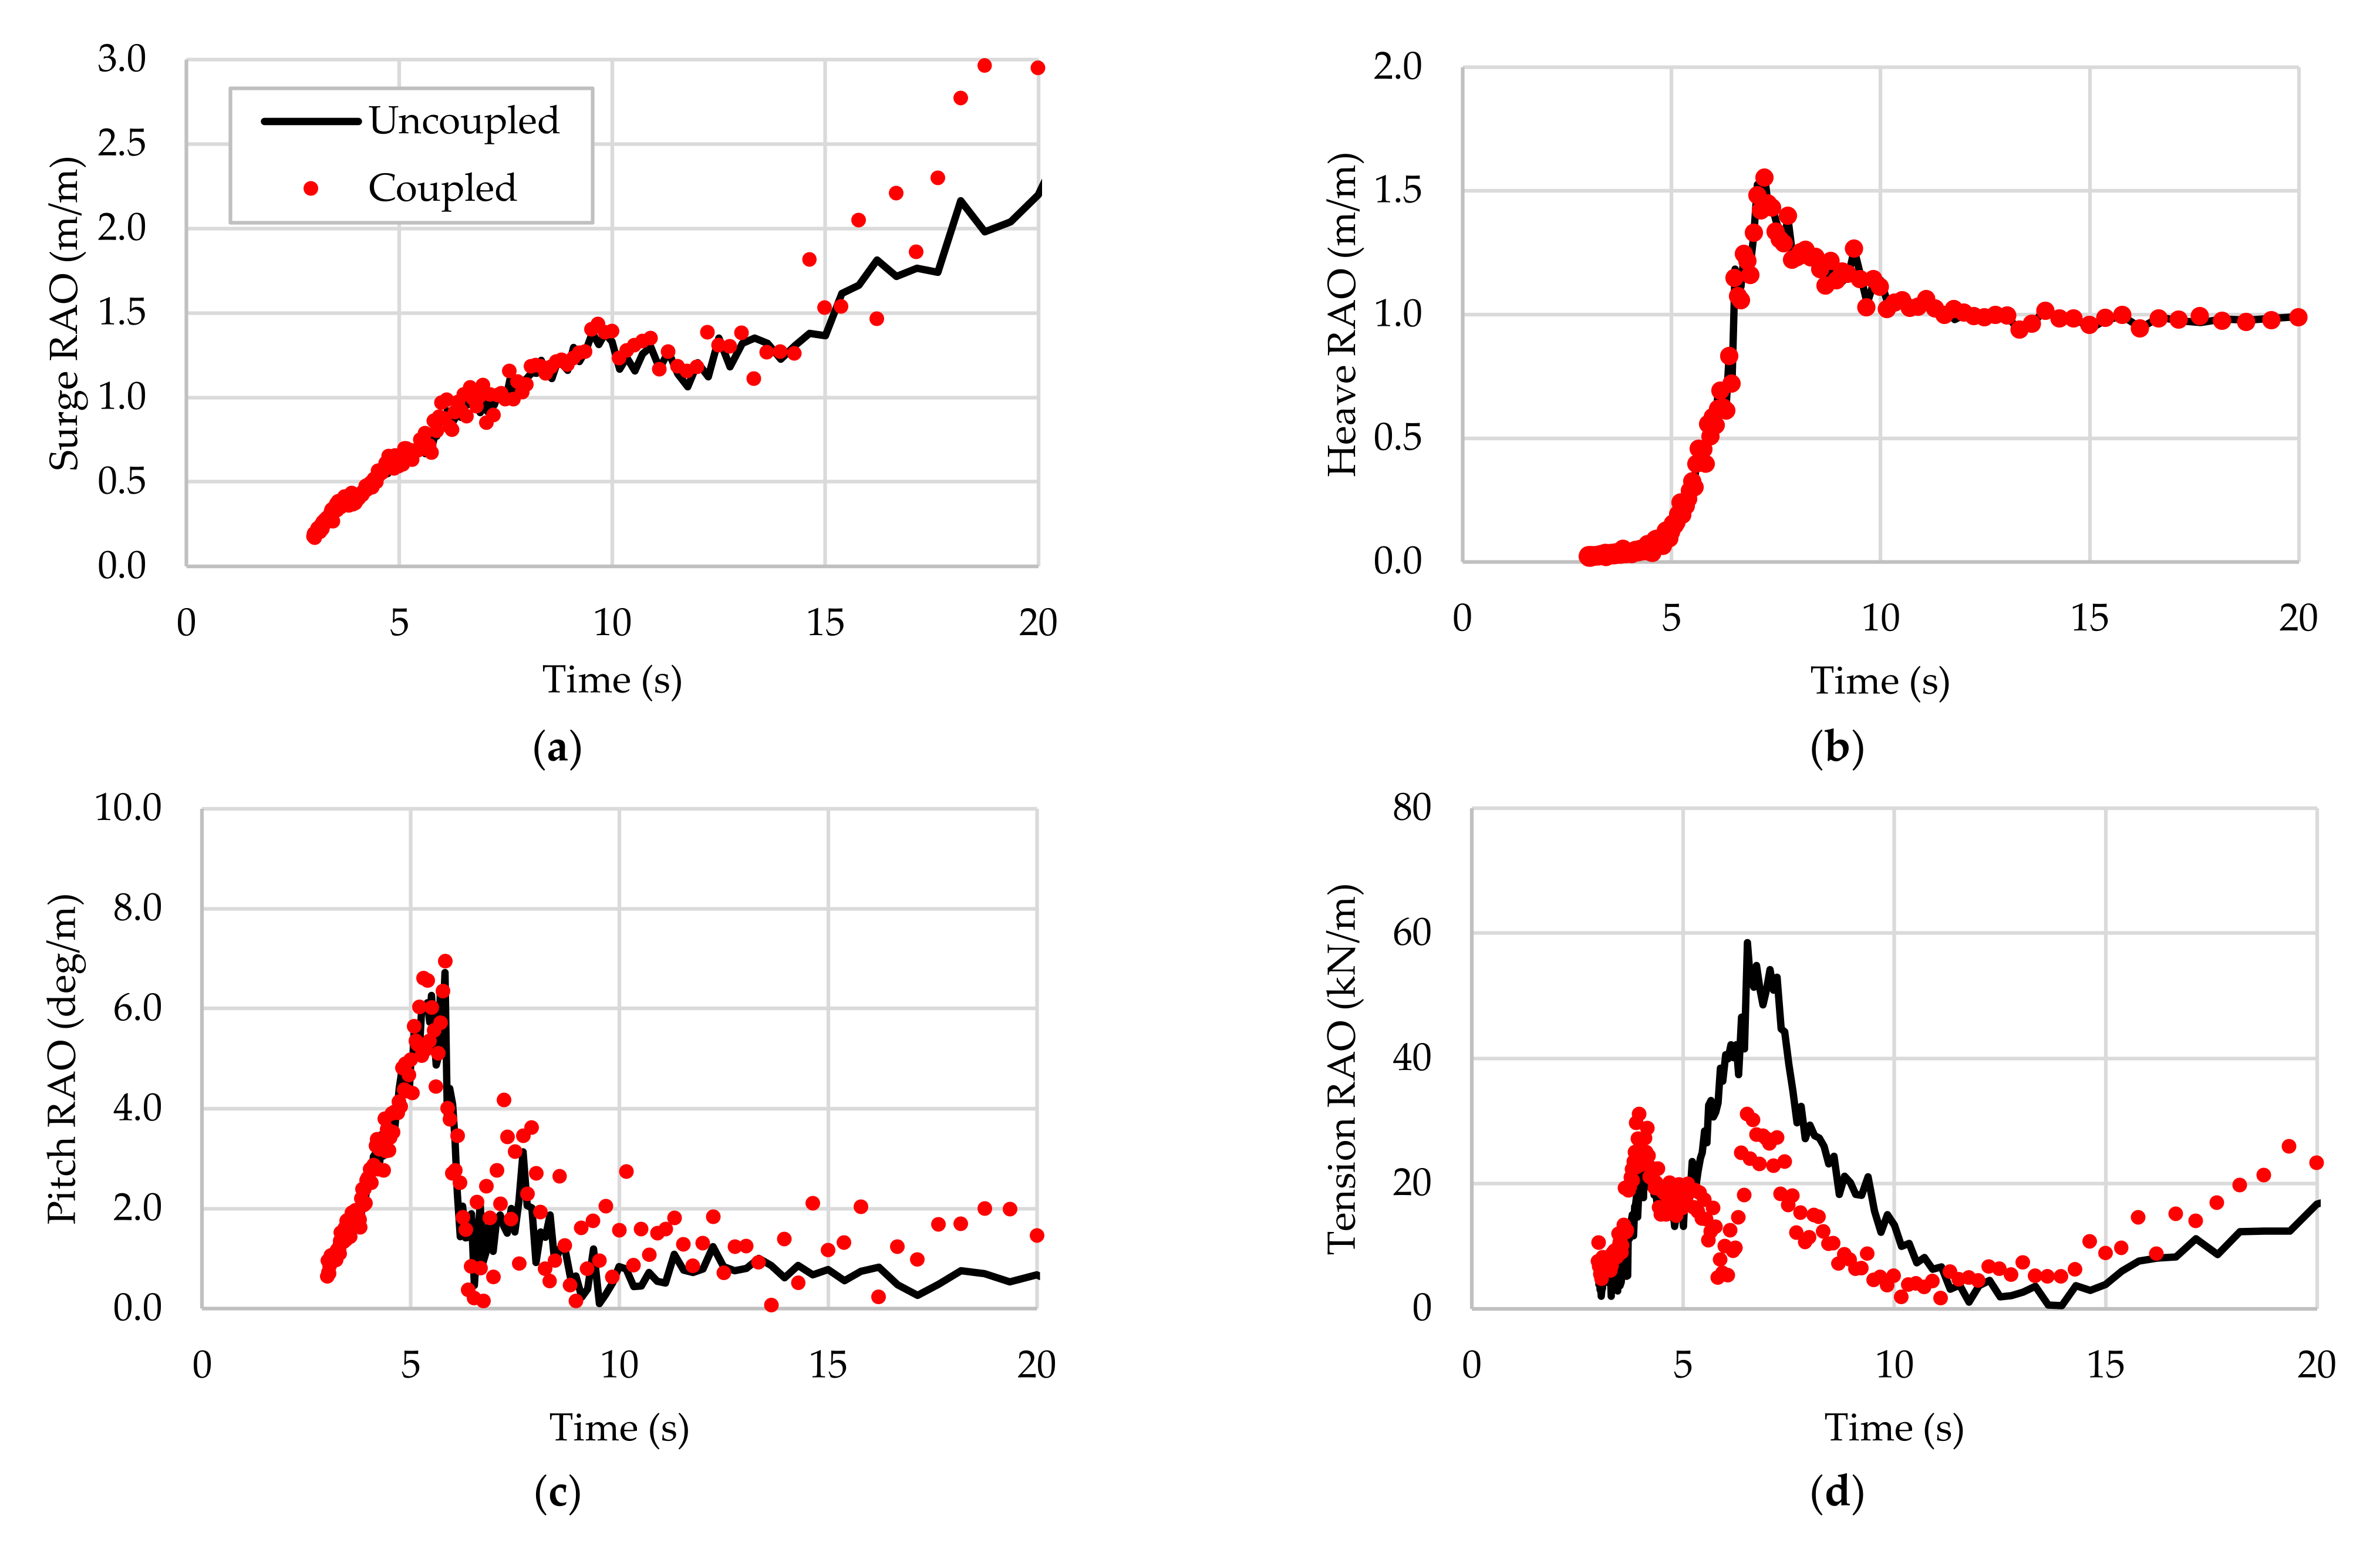
Motion and tension Response Amplitude Ratios (RAOs) of the mooring buoy for the uncoupled and coupled cases are estimated, using white noise waves. Due to the symmetricity of the mooring distribution and nature of the weathervaning platform around the buoy, a single heading of zero degree is selected. Figure 7 presents the RAOs of surge, heave and pitch motions and mooring line ML5 tensions. Here, the mooring line ML5 which is the most loaded line under the wave heading 0 deg., is selected. The buoy surge and pitch RAOs show the coupled effects for the longer period waves greater than about 10 s, whereas the coupled effects to the heave motions are very small. Prominent differences between the uncoupled and coupled systems appear in the mooring line tension RAOs across the wave periods.
3.2. Motion and Mooring Tension Analysis
3.2.1. Mooring Buoy Motions
Numerical simulations are run for three hours each case, excluding an initial ramp time for the environment heading of 0 deg. The wind, wave and currents considered are co-directional. Motions of the buoy are measured at the buoy origin (0, 0, 0).
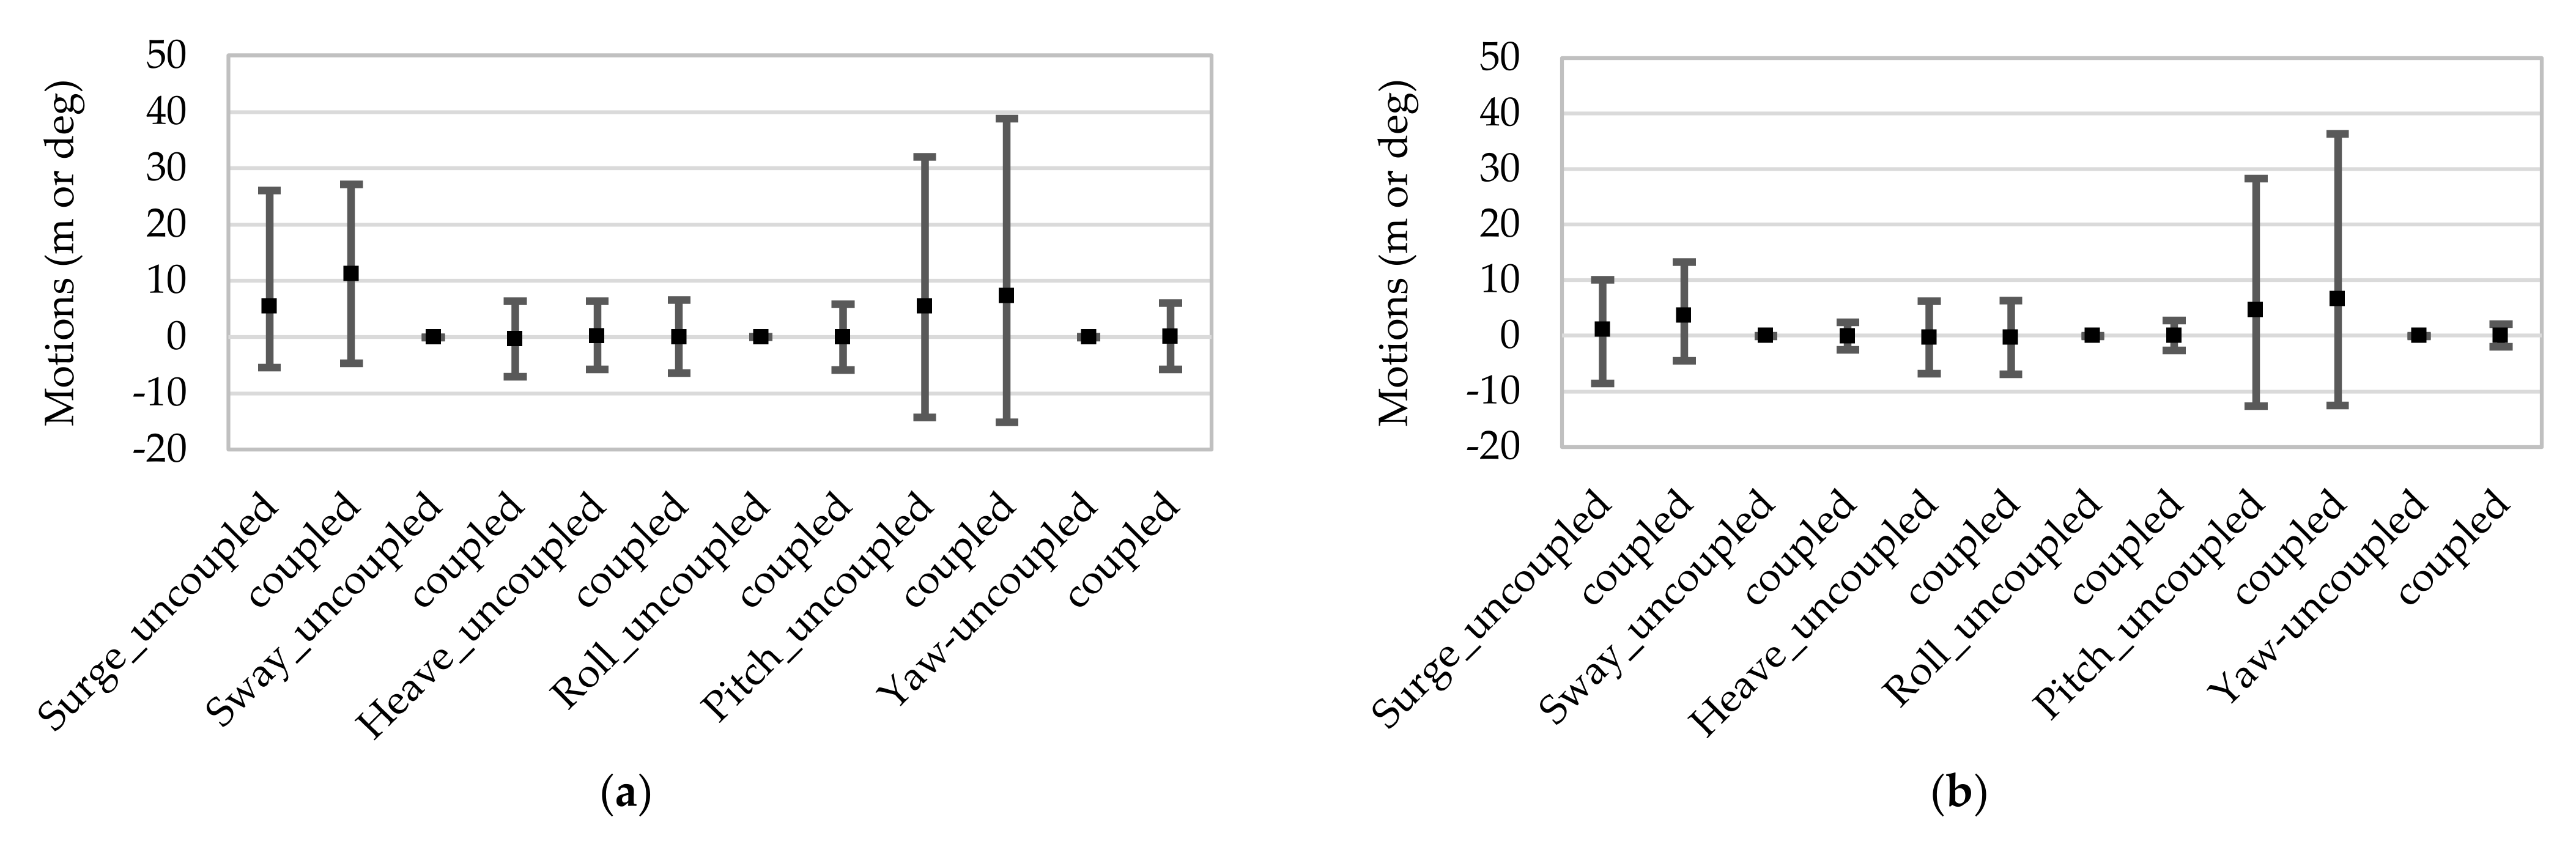
Two mooring pretension options are considered to evaluate the buoy motions. Option A and B use pretensions of 337 kN and 509 kN per line, respectively. Figure 8 compares the motions of the pretension options A and B for the 50 y extreme seas, where the maximum, minimum and mean of the uncoupled and coupled results are compared. Severe pitch motions are observed in both options. The coupled cases cause higher motions than uncoupled cases, especially surge and pitch, which is mainly induced by the coupled loads from the hawsers connected to the WEC platform. It is seen that the surge and pitch are considerably reduced with the higher pretension of option B. No noticeable differences are seen in heaves between uncoupled and coupled for both options A and B. Sway and yaw in option B are near zeros for the uncoupled configuration.
Additionally, the tensions of the most loaded mooring lines (ML5 and ML6) were evaluated for options A and B. There is a tension increase for option B, but the dynamic tensions are within a few percentage difference between the options, indicating that the tension increase originates mainly due to the pretension difference. Based upon this result, option A is selected for the rest of the analysis, which may also yield more conservative outcomes than option B case.
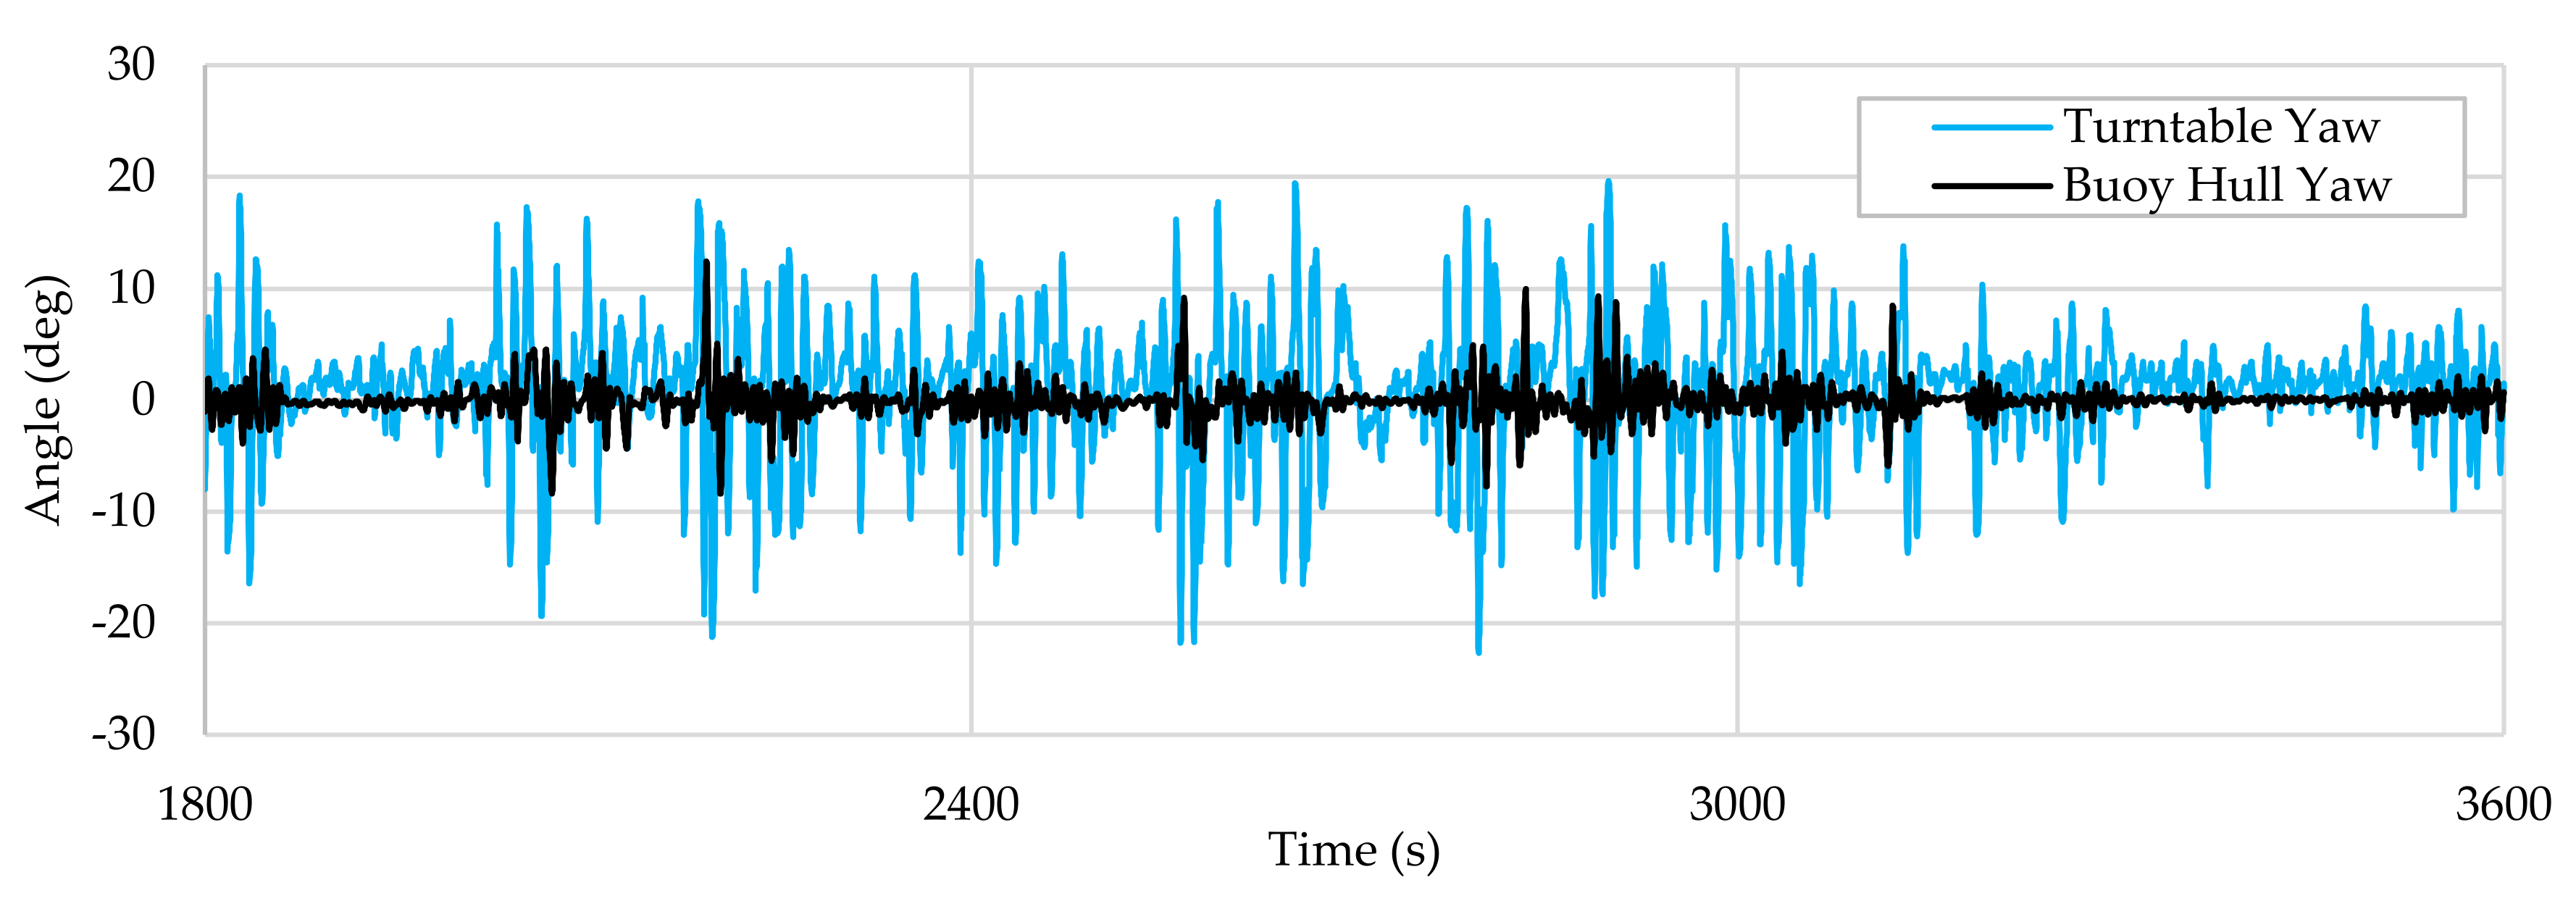
Figure 9 presents the mooring buoy and turntable yaw angle time histories for the 50 y, 0 deg. heading and coupled case between simulation times 1800 s and 3600 s. It is observed that the yaw angles are higher for the turntable than the mooring buoy hull. The mooring buoy hull is connected to the station-keeping system, so its yaw motion is limited. However, the turntable is designed such that it can rotate around the buoy hull with the direction of the hawser loads induced by the WEC platform. Figure 9 demonstrates the highly coupled effects to the turntable due to the platform connected, and its peak yaw angle is about ± 20 deg., which is greater than the buoy hull yaw angle.
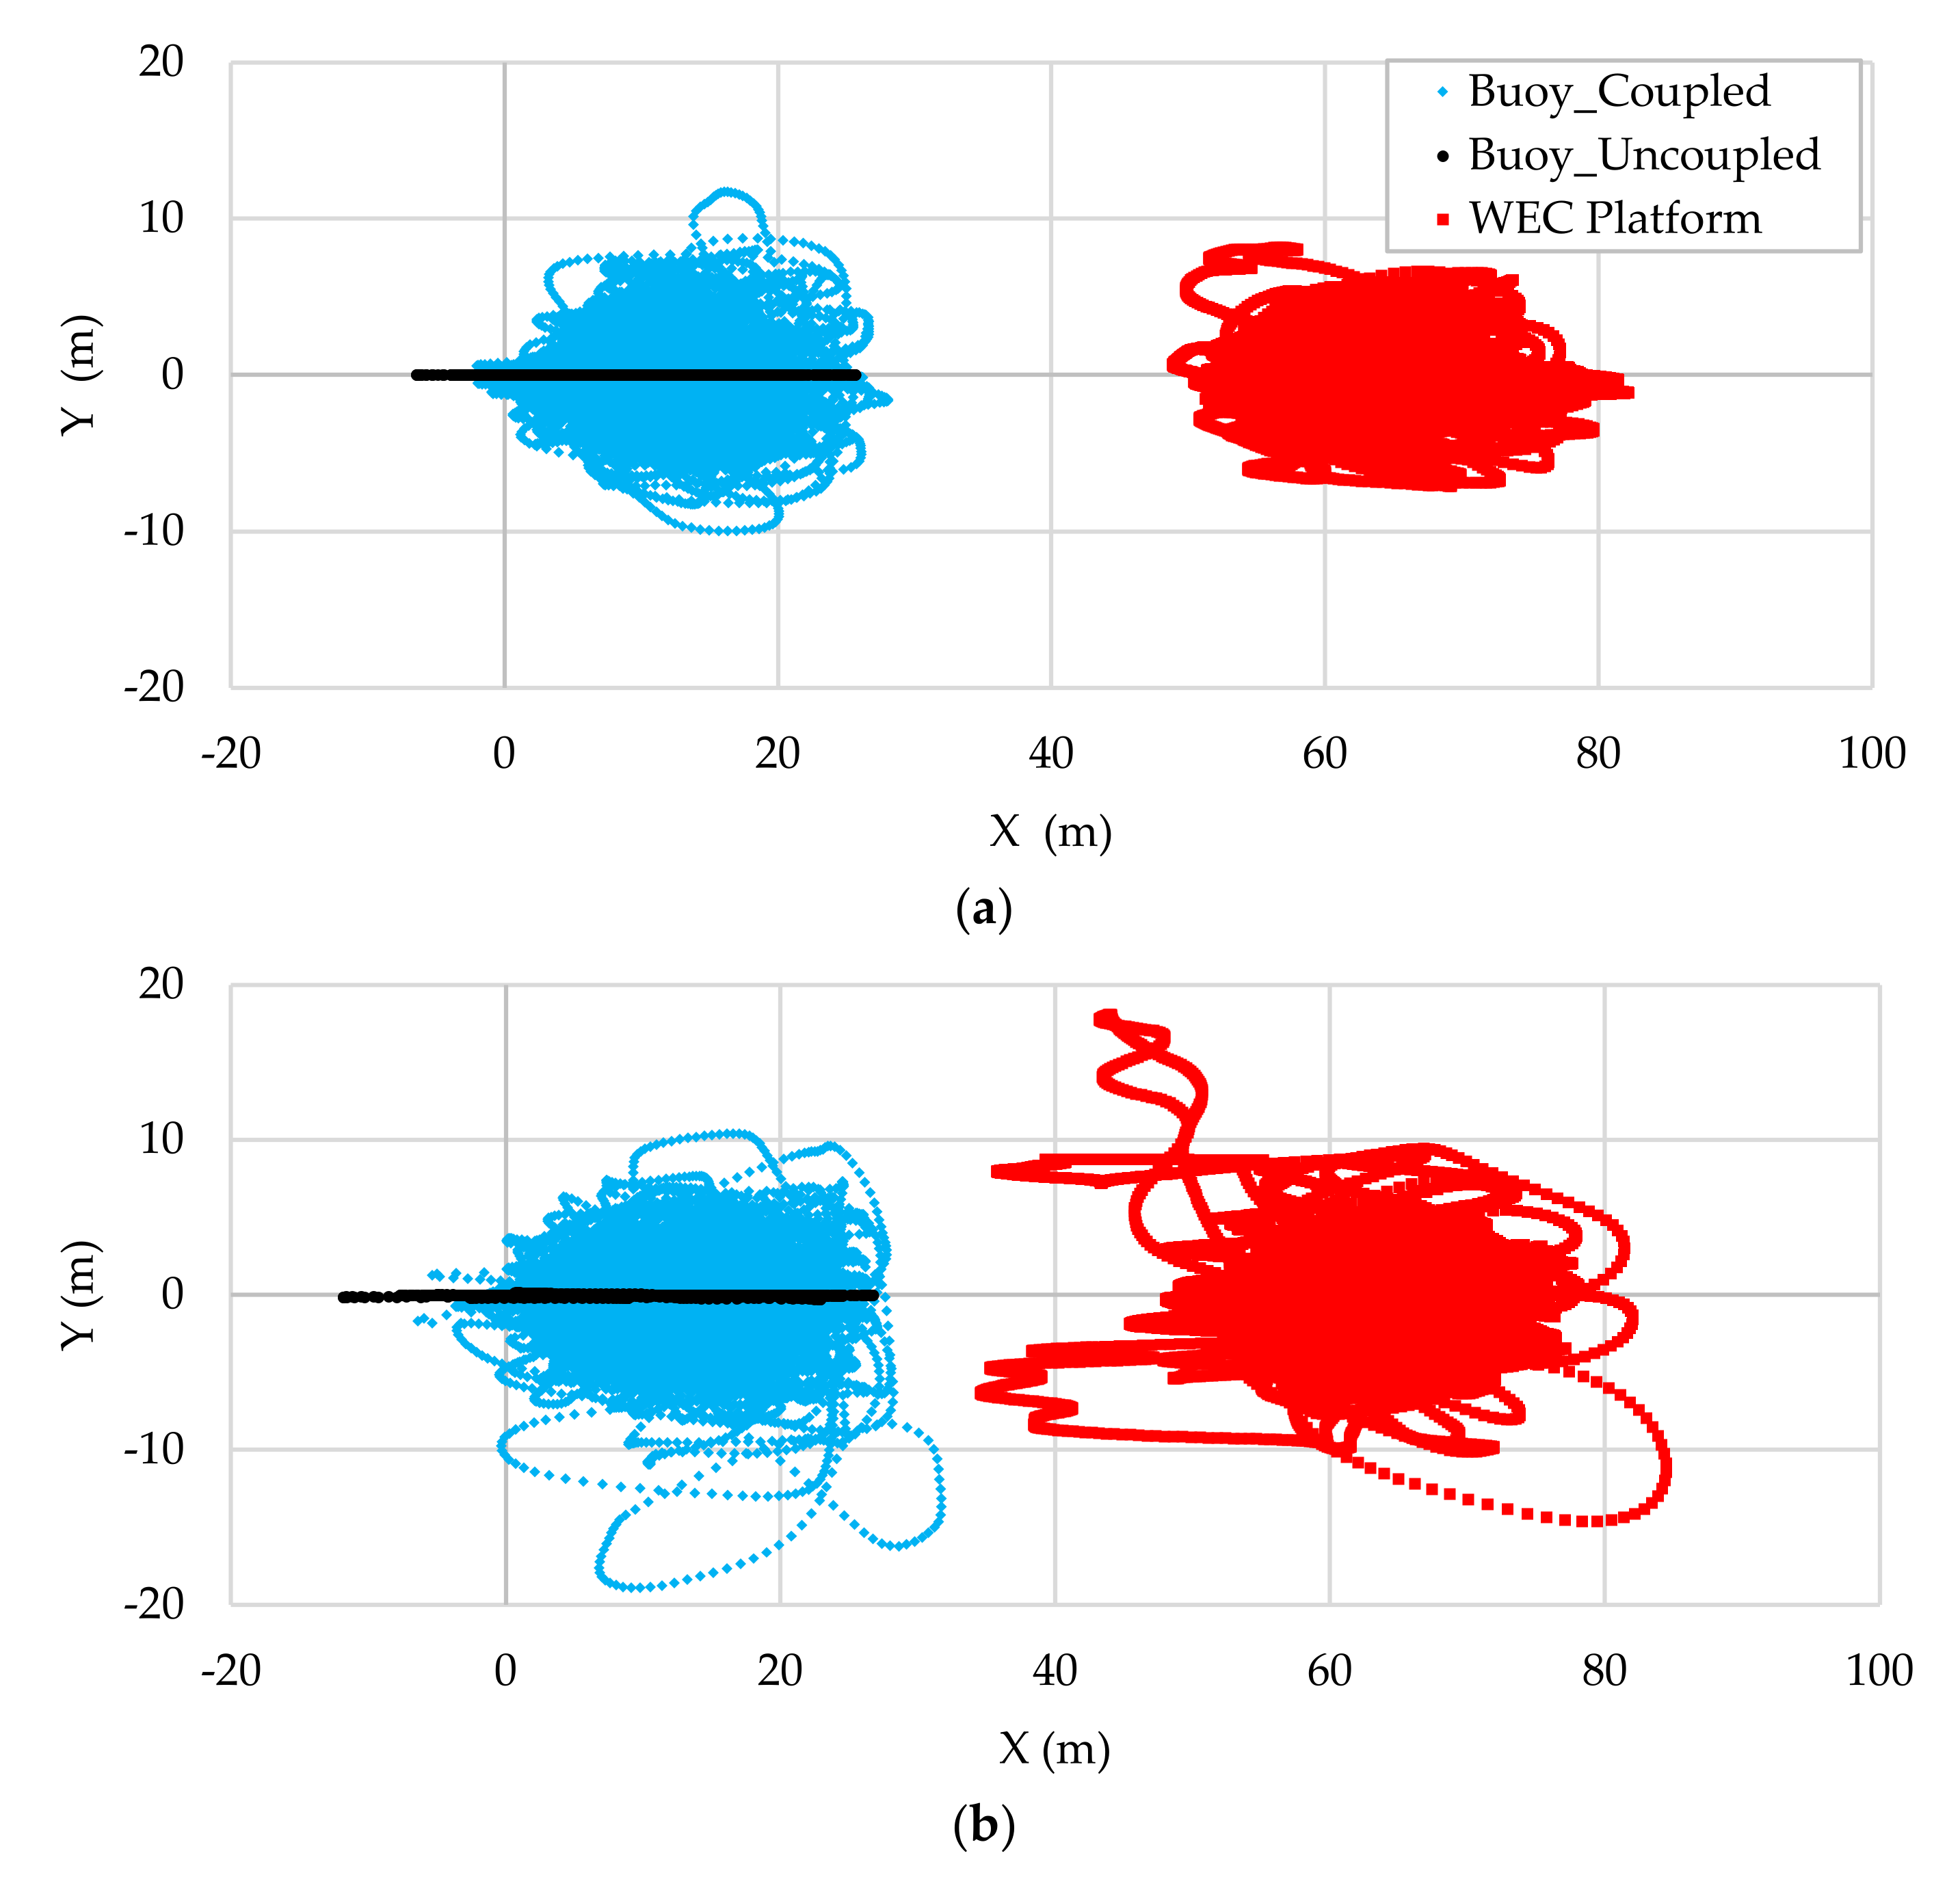
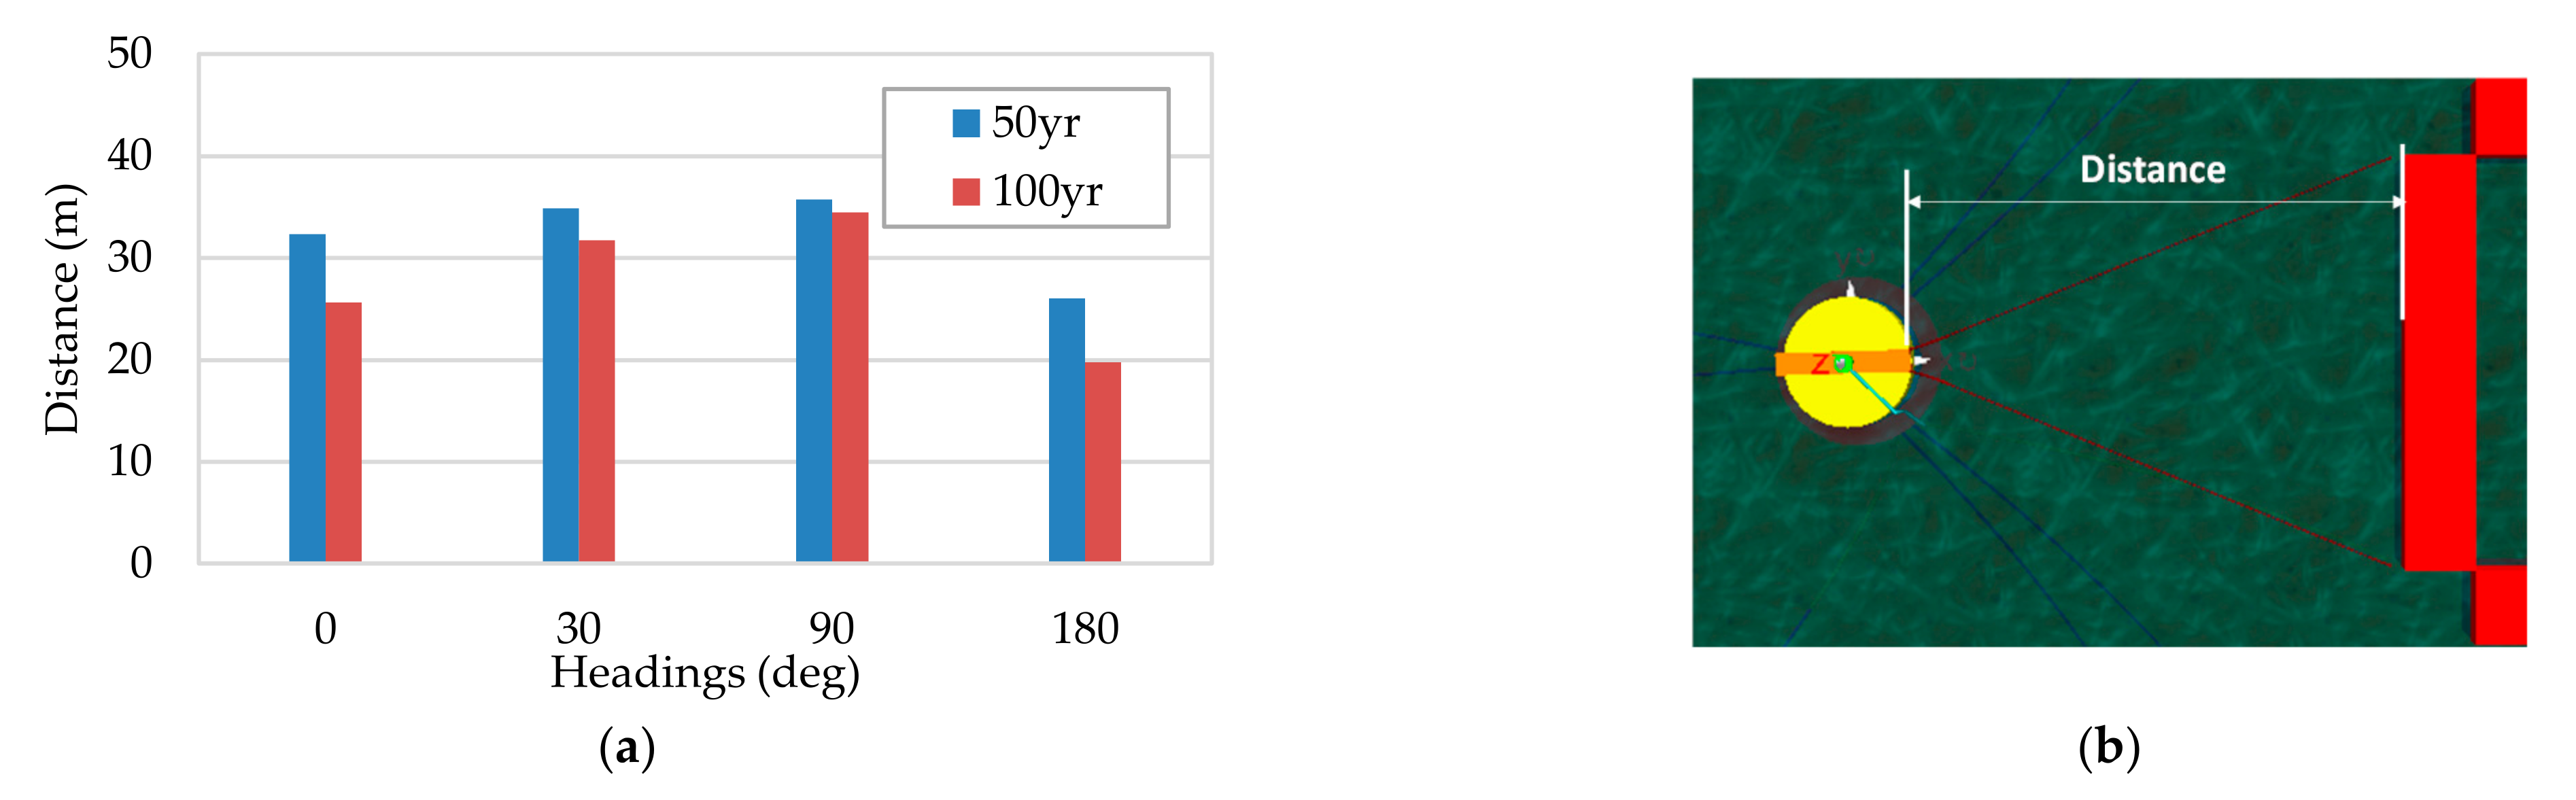
Watch circles (trajectories) of the mooring buoy and platform for 50 y and 100 y under the heading 0 deg. are plotted in Figure 10, where “Buoy_uncoupled” and “Buoy_coupled” are the cases of the buoy and platform, unconnected and connected, respectively. Here, the WEC platform trajectories are for the coupled case. The buoy moves in X direction (surge) mostly for the uncoupled case, but it scatters in both X (surge) and Y (sway) directions when the platform is connected. The WEC platform trajectories show a similar pattern to the buoy. The watch circles of the buoy and platform for the coupled case become broader for 100 y than for 50 y. Figure 11 presents the distances (or separation) between the buoy outer edge to the fore hull section end of the WEC platform, for the headings of 0, 30, 90 and 180 deg. under 50 and 100 y storm seas. A minimum separation is estimated to be about 20 m under 180 deg. heading of the 100 y storm. According to the results of the watch circle and separation, both structures maintain a sufficient distance during the storm, so there will unlikely be any interference between the two.
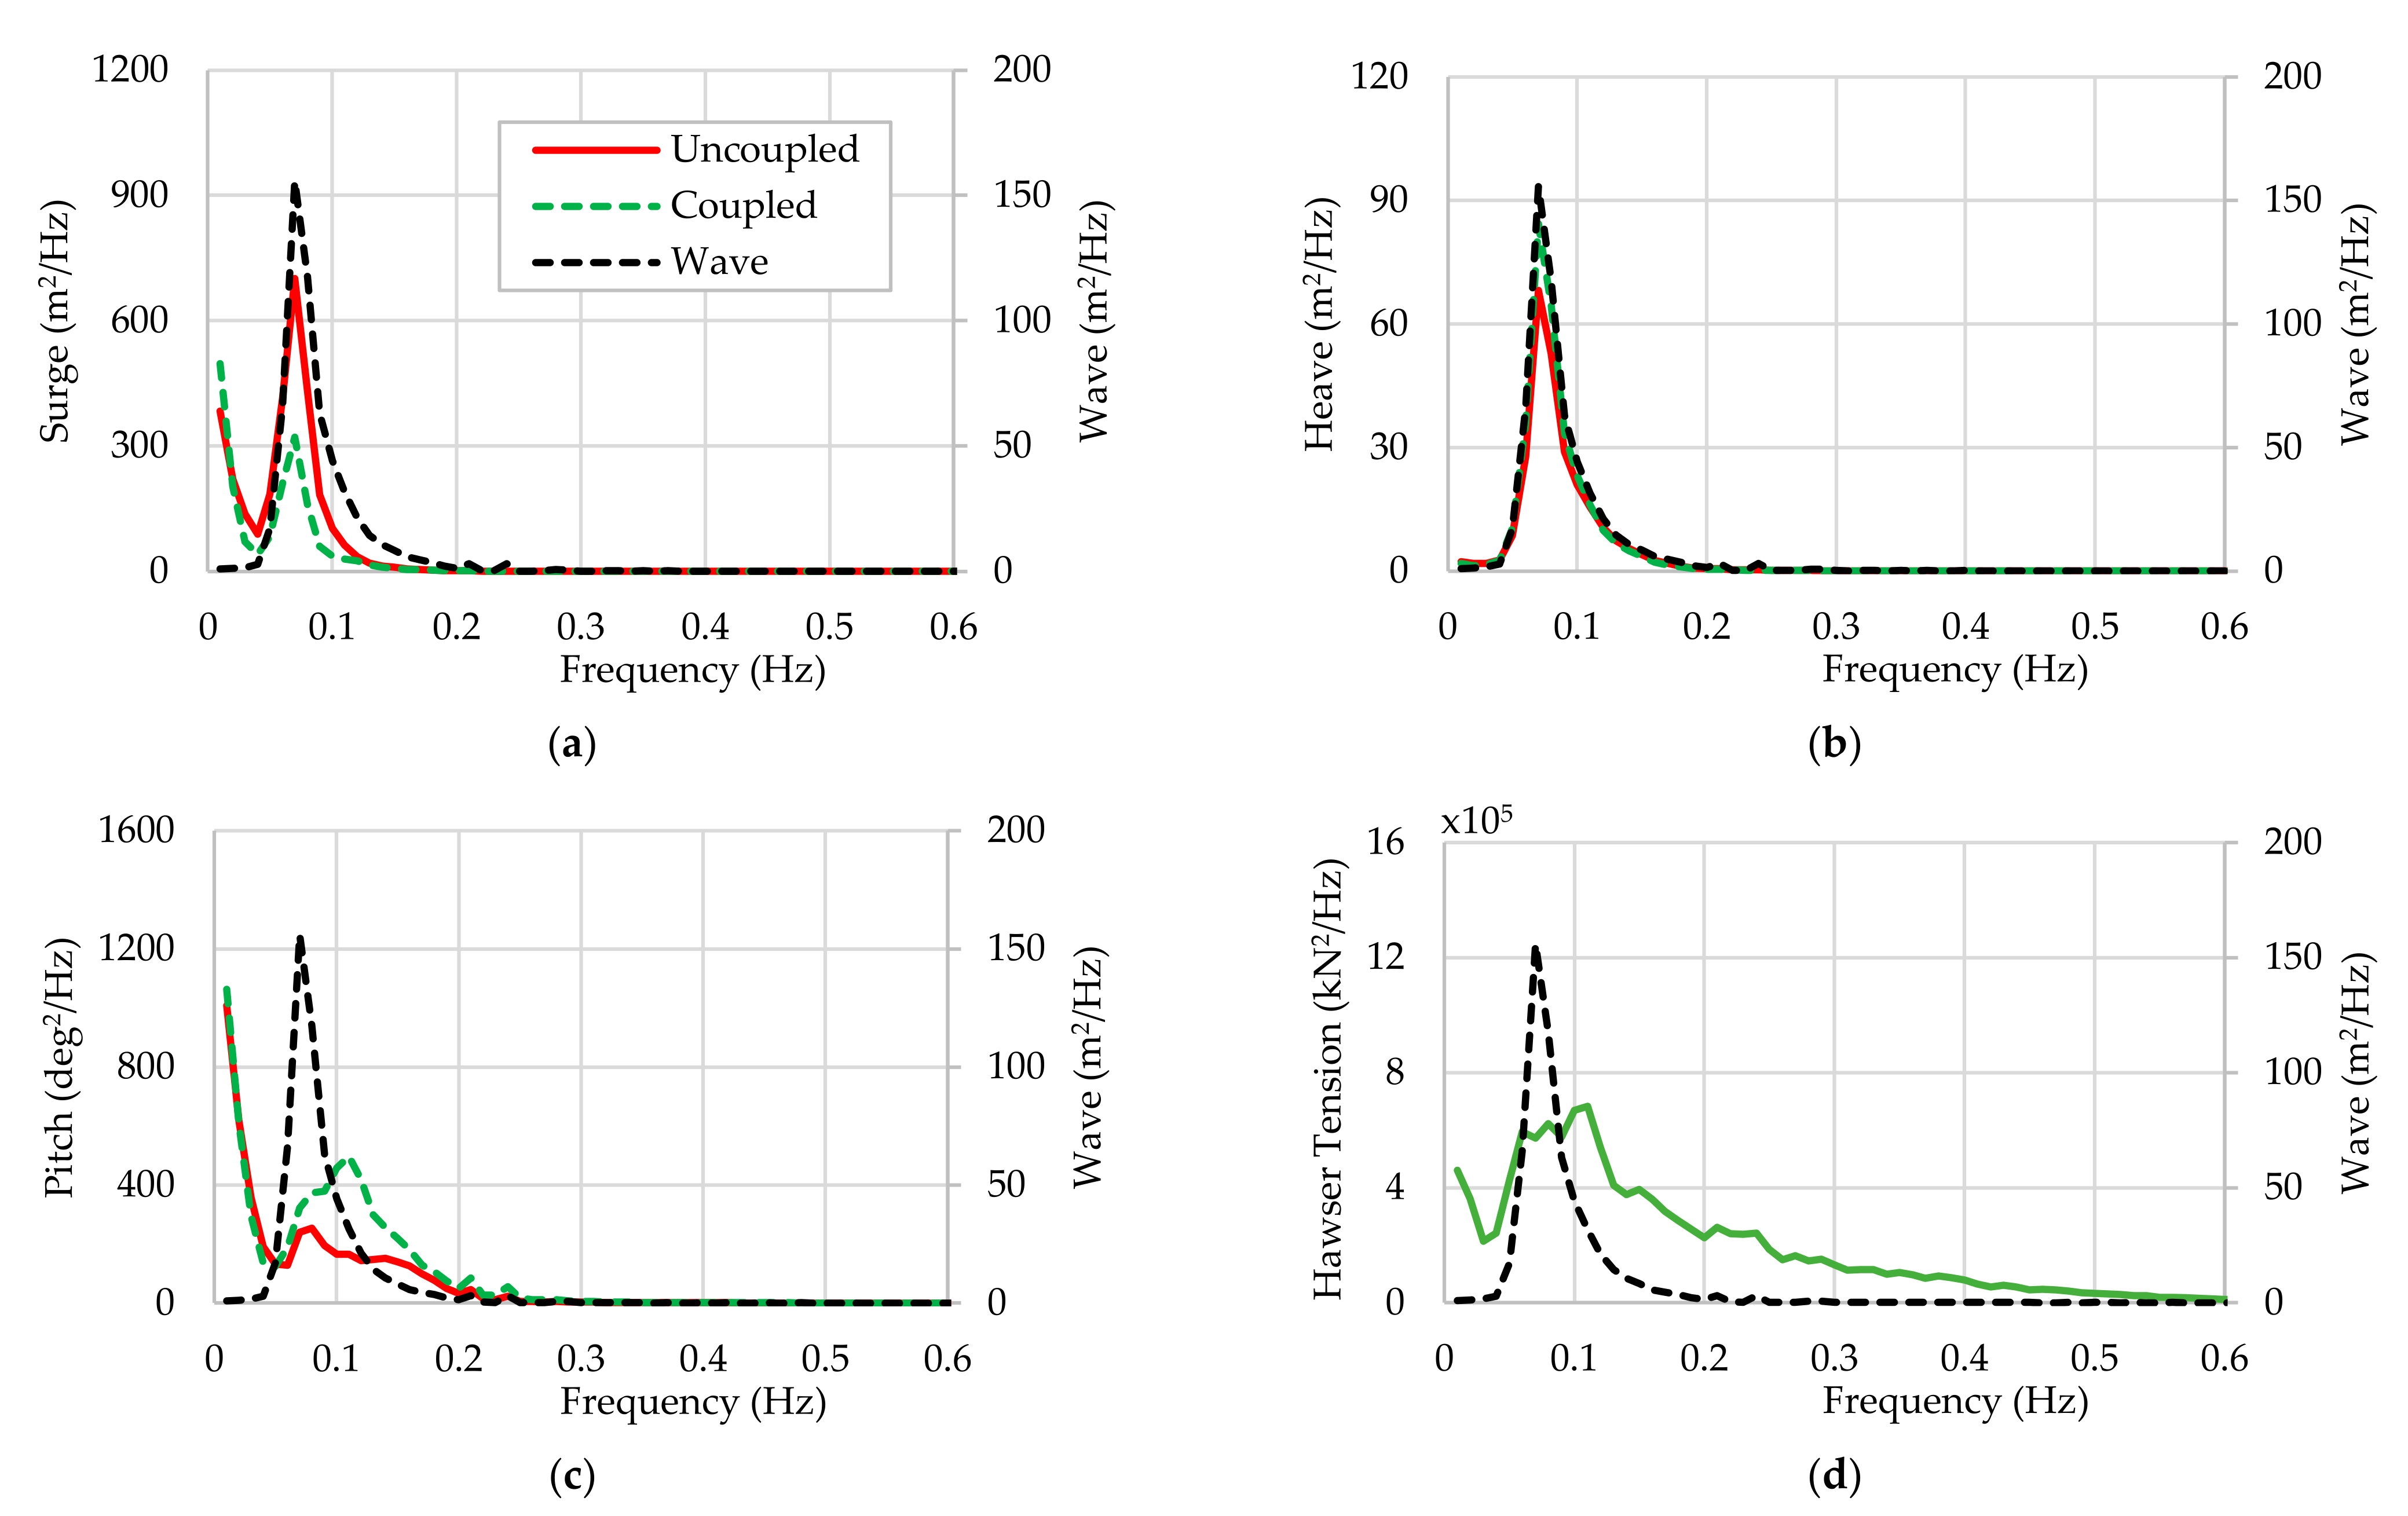
Spectral densities of the surge, heave and pitch of the mooring buoy along with the 50 y waves are shown in Figure 12a–c, where the wave spectral densities are also presented. There are low frequency components in the surge and pitch in the uncoupled and coupled cases. Frequencies of the spectral peaks of the buoy motions for the uncoupled and coupled occur near the peak frequency of the wave, except for the coupled pitch that is located near the mooring buoy pitch natural frequency of 0.14 Hz. The pitch is also likely induced by the hawsers due to the coupled effects as observed in Figure 12d. The peak frequencies of the pitch and hawser tension are nearly the same.
3.2.2. Mooring Line Tensions
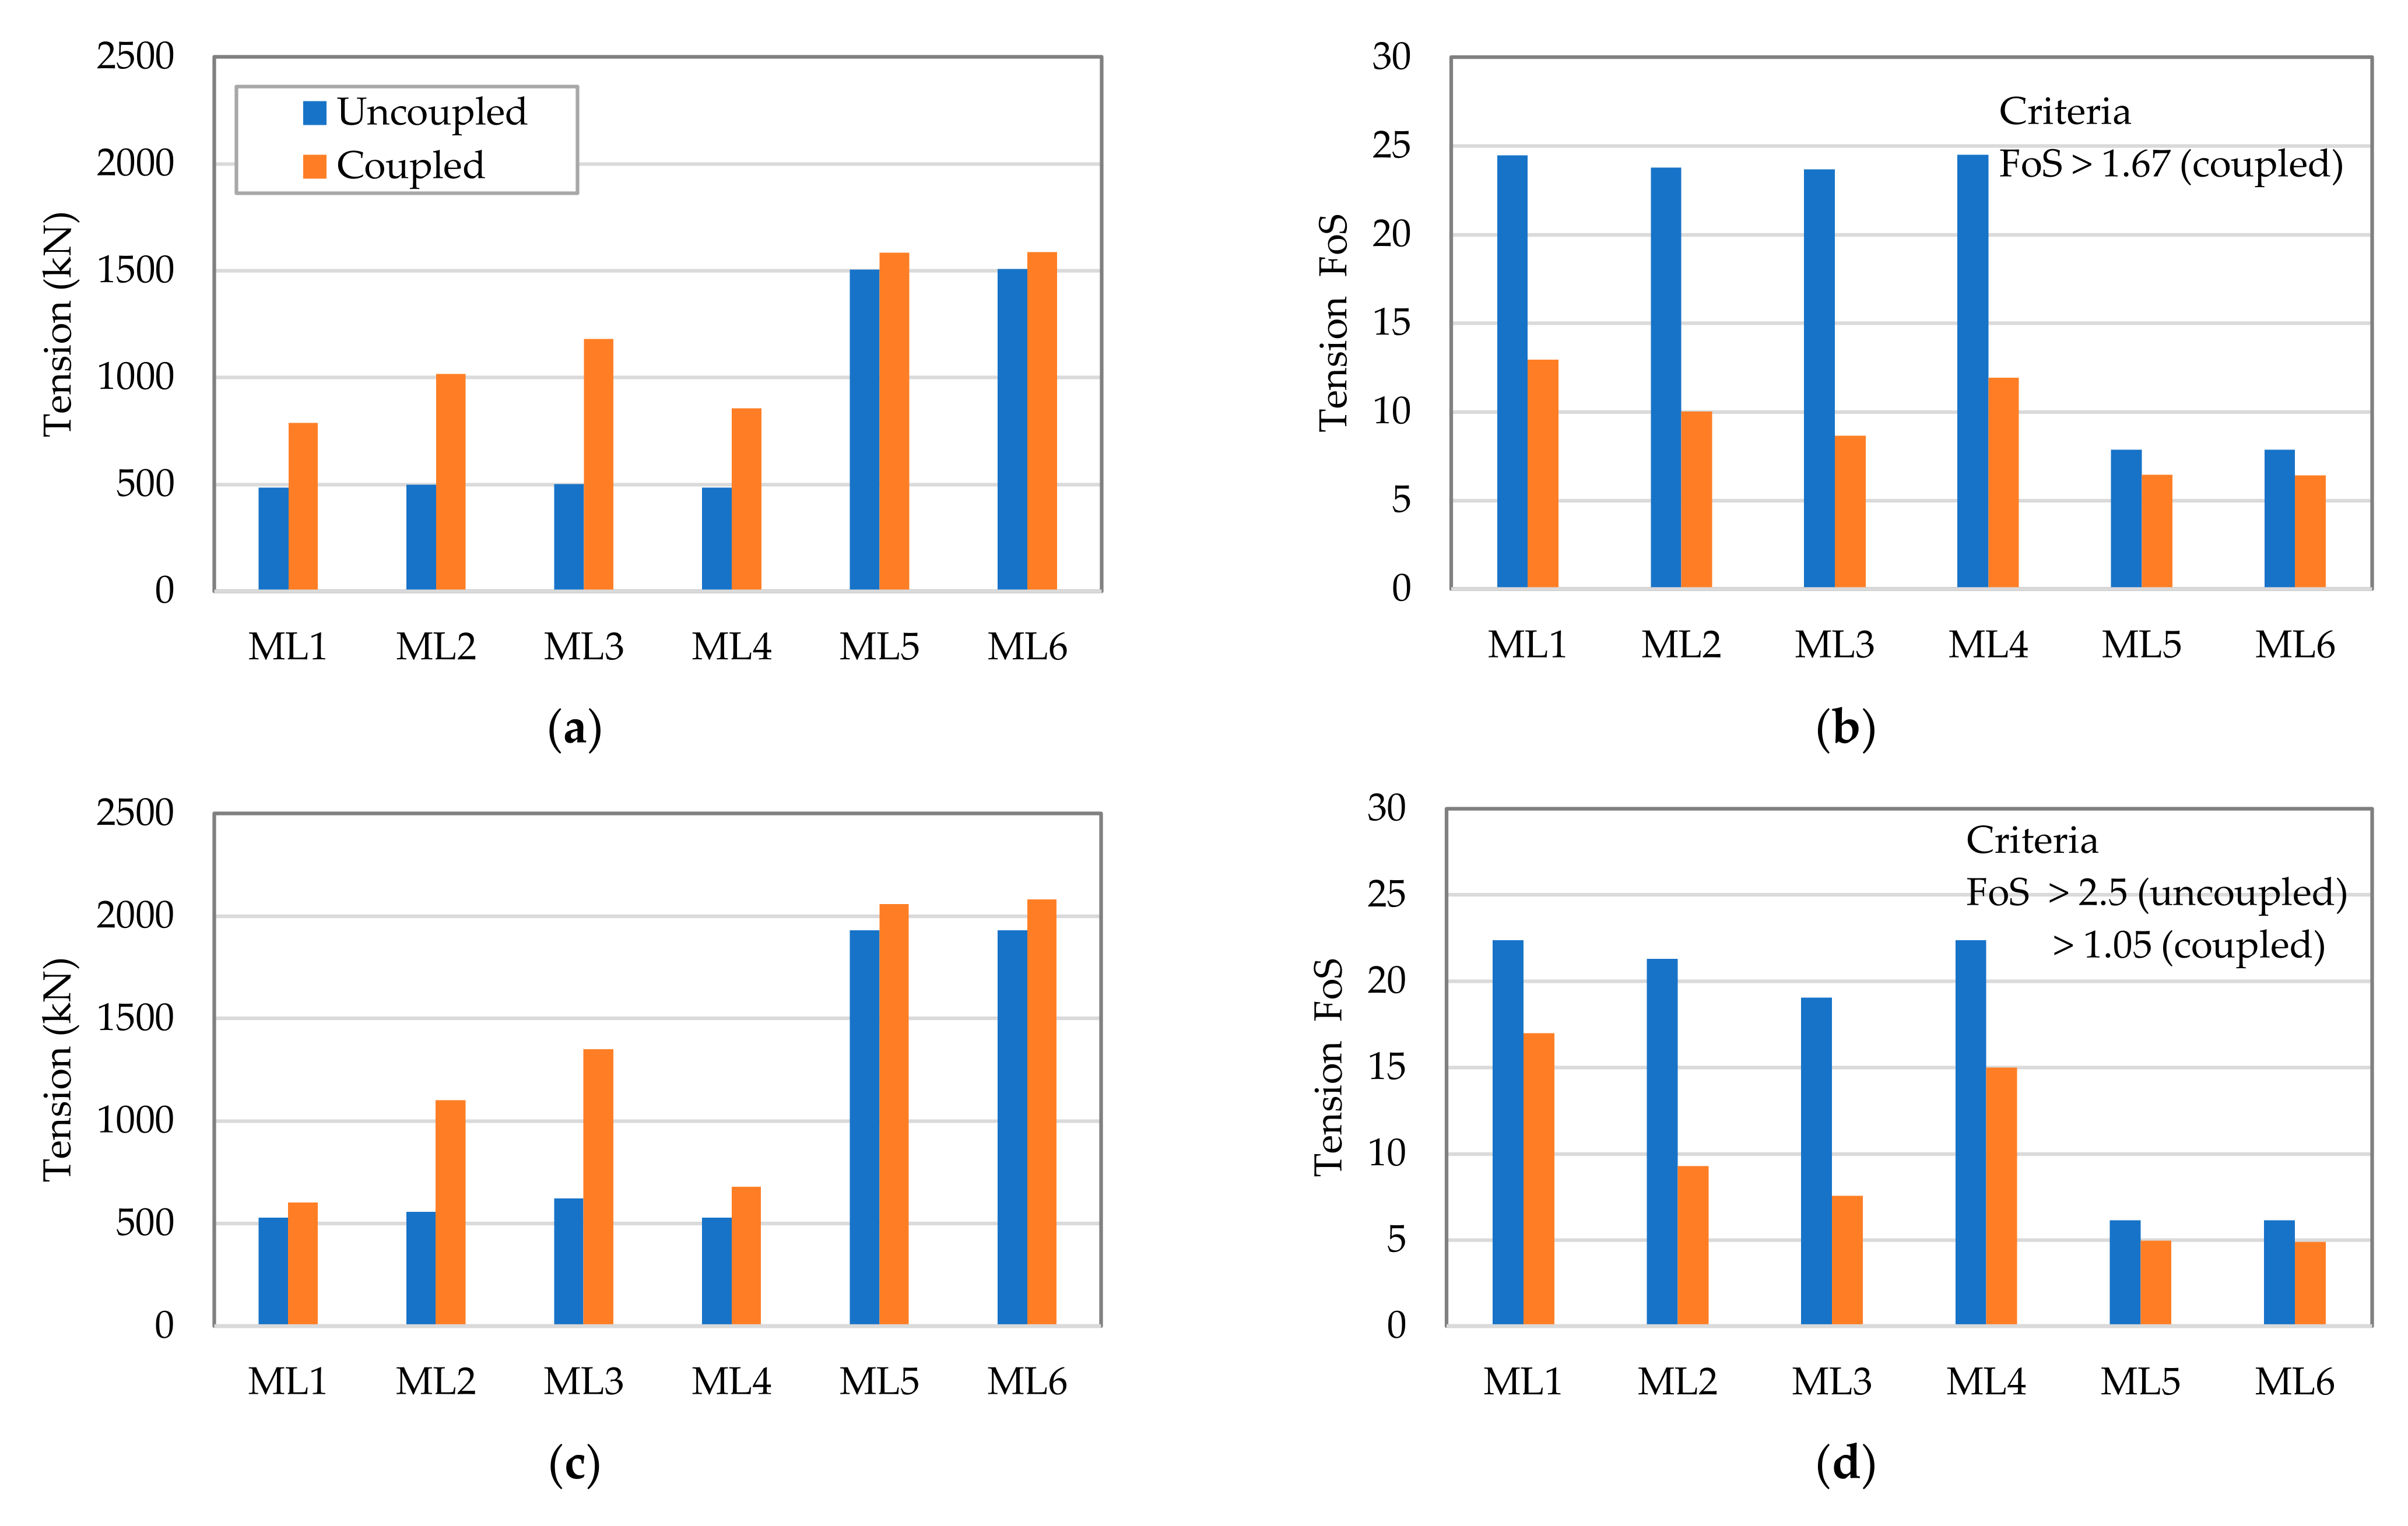
The MPM values of the mooring line and hawser tensions are computed using the tension time histories. These extreme values are used to evaluate the mooring strength with the industry guides [34,35], although the peak values may be considered [40,41]. The mooring lines are considered intact in the analysis. Figure 13 compares the maximum tensions and FoSs of the buoy mooring line under the storm seas of 50 and 100 y. The FoS is a ratio of the MBL of the corroded chain to the max tension from the simulations. The FoS requirements are provided in Table 2, Table 3, Table 4 and Table 5. It is observed that the most loaded line (ML5 and ML6) tensions increase, due to the mooring buoy and WEC platform coupling. Tension increases from the uncoupled case to the coupled are about 5.3% for the 50 y conditions and 7.7% for the 100 y conditions. Under the heading angle of 0 deg., the mooring line ML5 and ML6 are taut, so higher tension on both lines occurs. The lowest FoSs estimated are greater than the allowable minimum of 1.67 for the 50 y (coupled) and 1.05 for the 100 y (coupled) conditions. Additionally, the minimum mooring tension FoS of the uncoupled buoy under the 100 y storm is greater than the minimum allowable of 2.5. These demonstrate that the mooring line strengths comply with the design requirements.
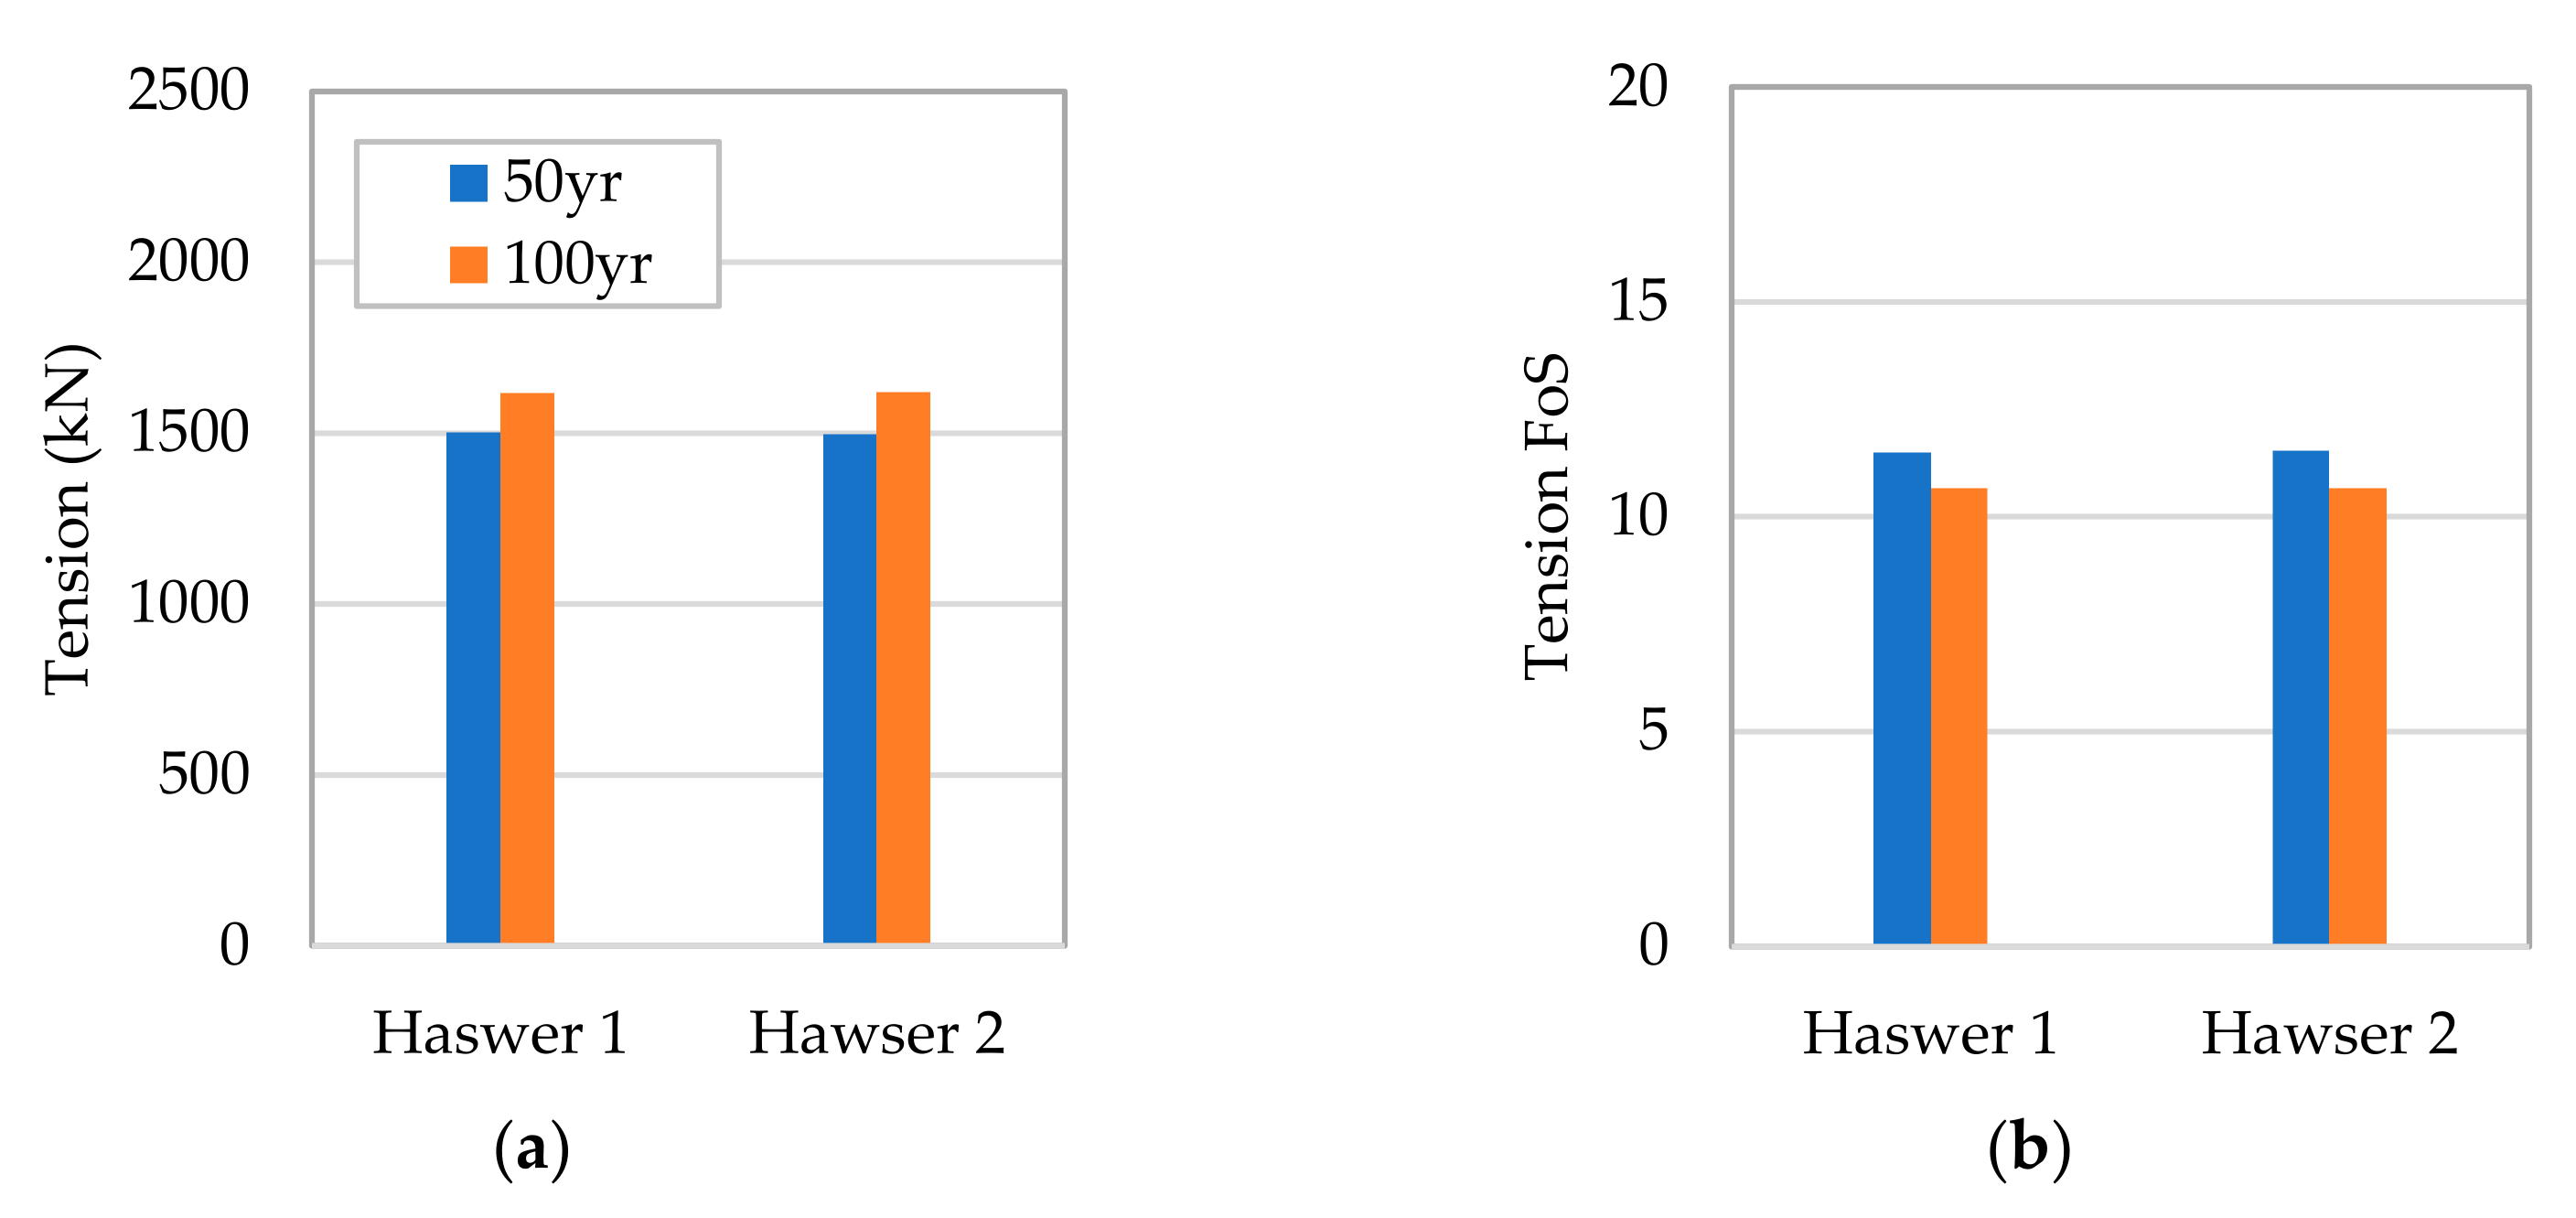
The tensions and FoSs of the hawsers to moor the WEC platform to the mooring buoy are depicted in Figure 14. The hawser tensions increase with higher sea states. They become greater by about 8.3% at the survival than at the extreme condition. The minimum hawser FoSs are greater the allowable minimum of 1.67 for 50 y and 1.05 for 100 y. There is an opportunity to optimize the hawser size, as the present hawser provides an ample strength margin.
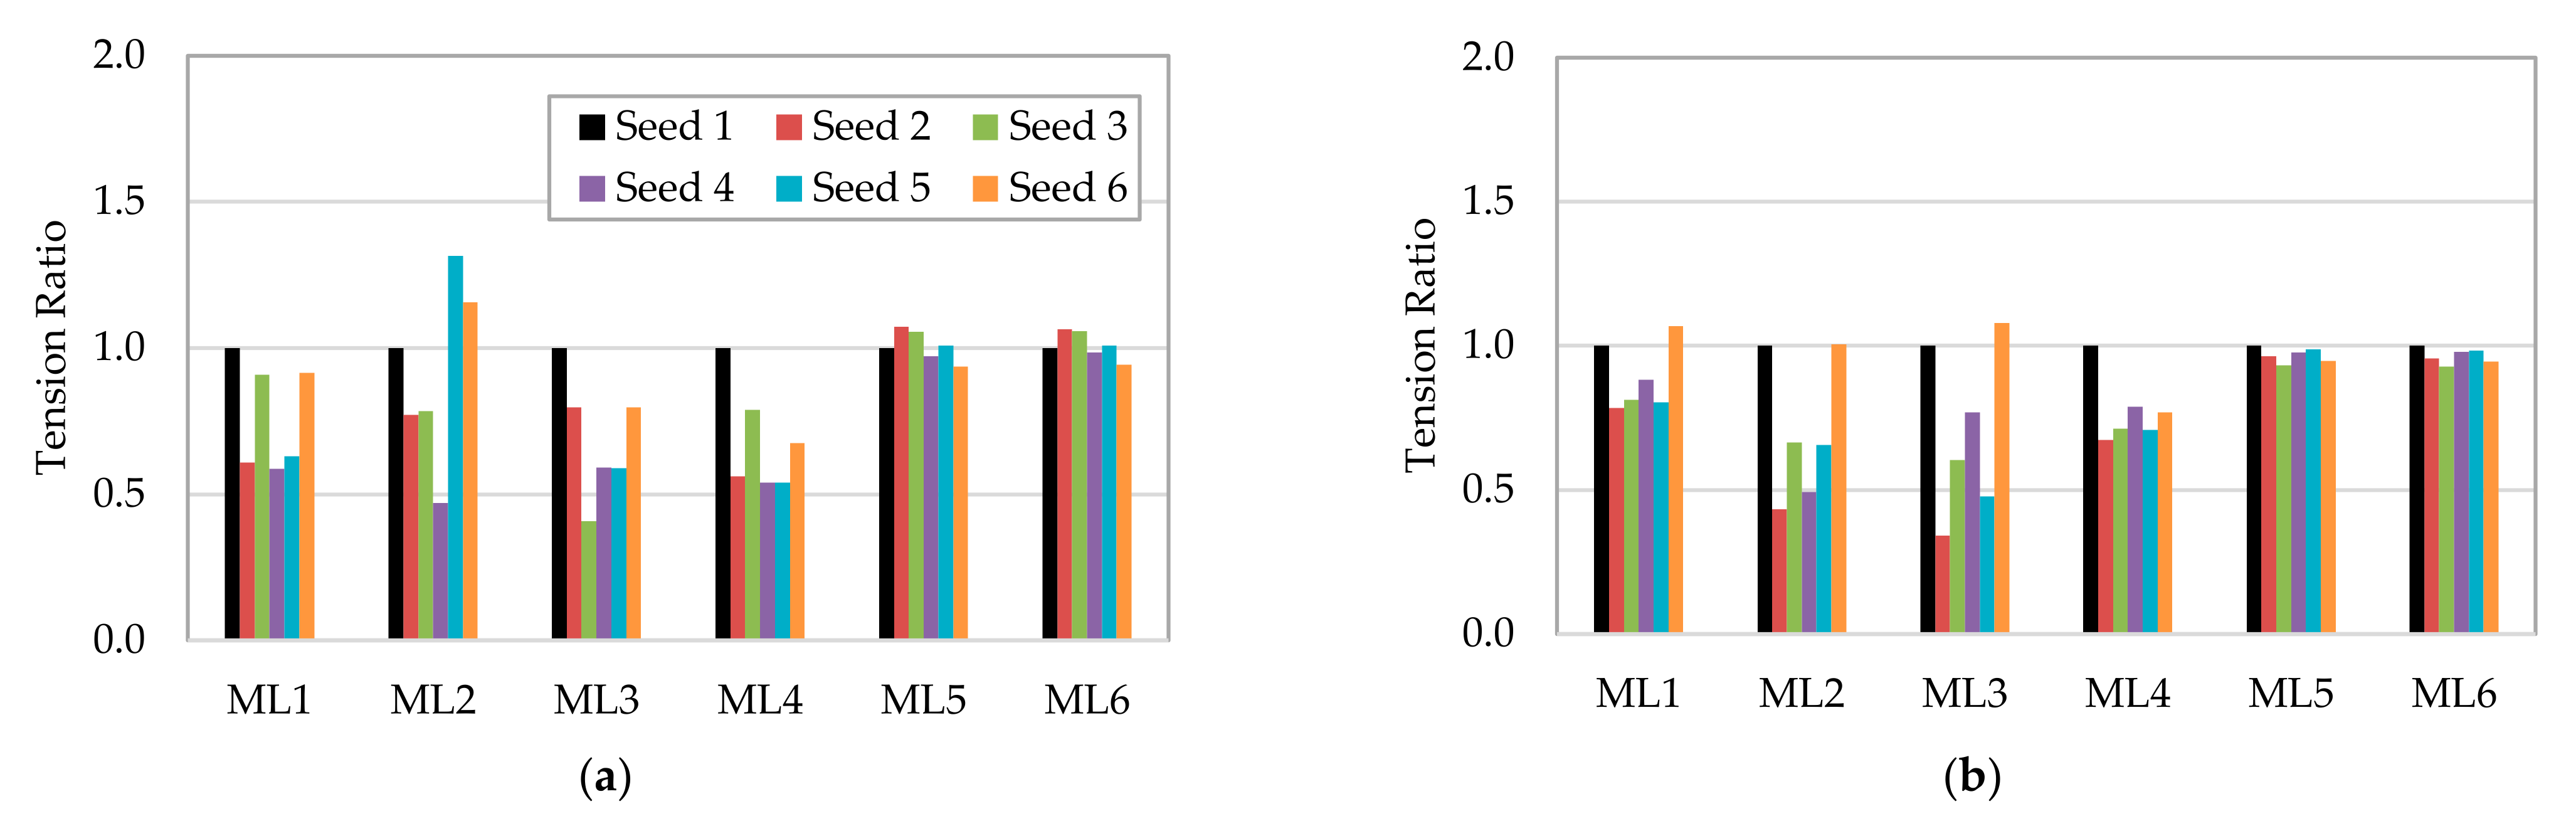
Mooring line tensions may vary due to the wave seeds used to generate the incident irregular waves. Six seeds are considered. Seed 1 is the default seed used for the analysis presented throughout this paper. For a comparison with the seeds, the tensions of each line are normalized by the respective tension by seed 1. The resulting values are compared from ML1 to ML6 for both 50 and 100 y in Figure 15. There are significant tension variations on the slack lines from ML1 to ML4, but small variations of −6.4% to +7.3% for 50 y and −7.2% to −1.1% for 100 y are observed in the taut lines of ML5 and ML6. However, the mooring line strength designs are governed by the maximum tension of the taut lines rather than the slack lines, so it is confirmed that variation of the mooring FoSs due to the seeds is small. This indicates that the mooring line provides the strength to keep the buoy in place during the storm events.
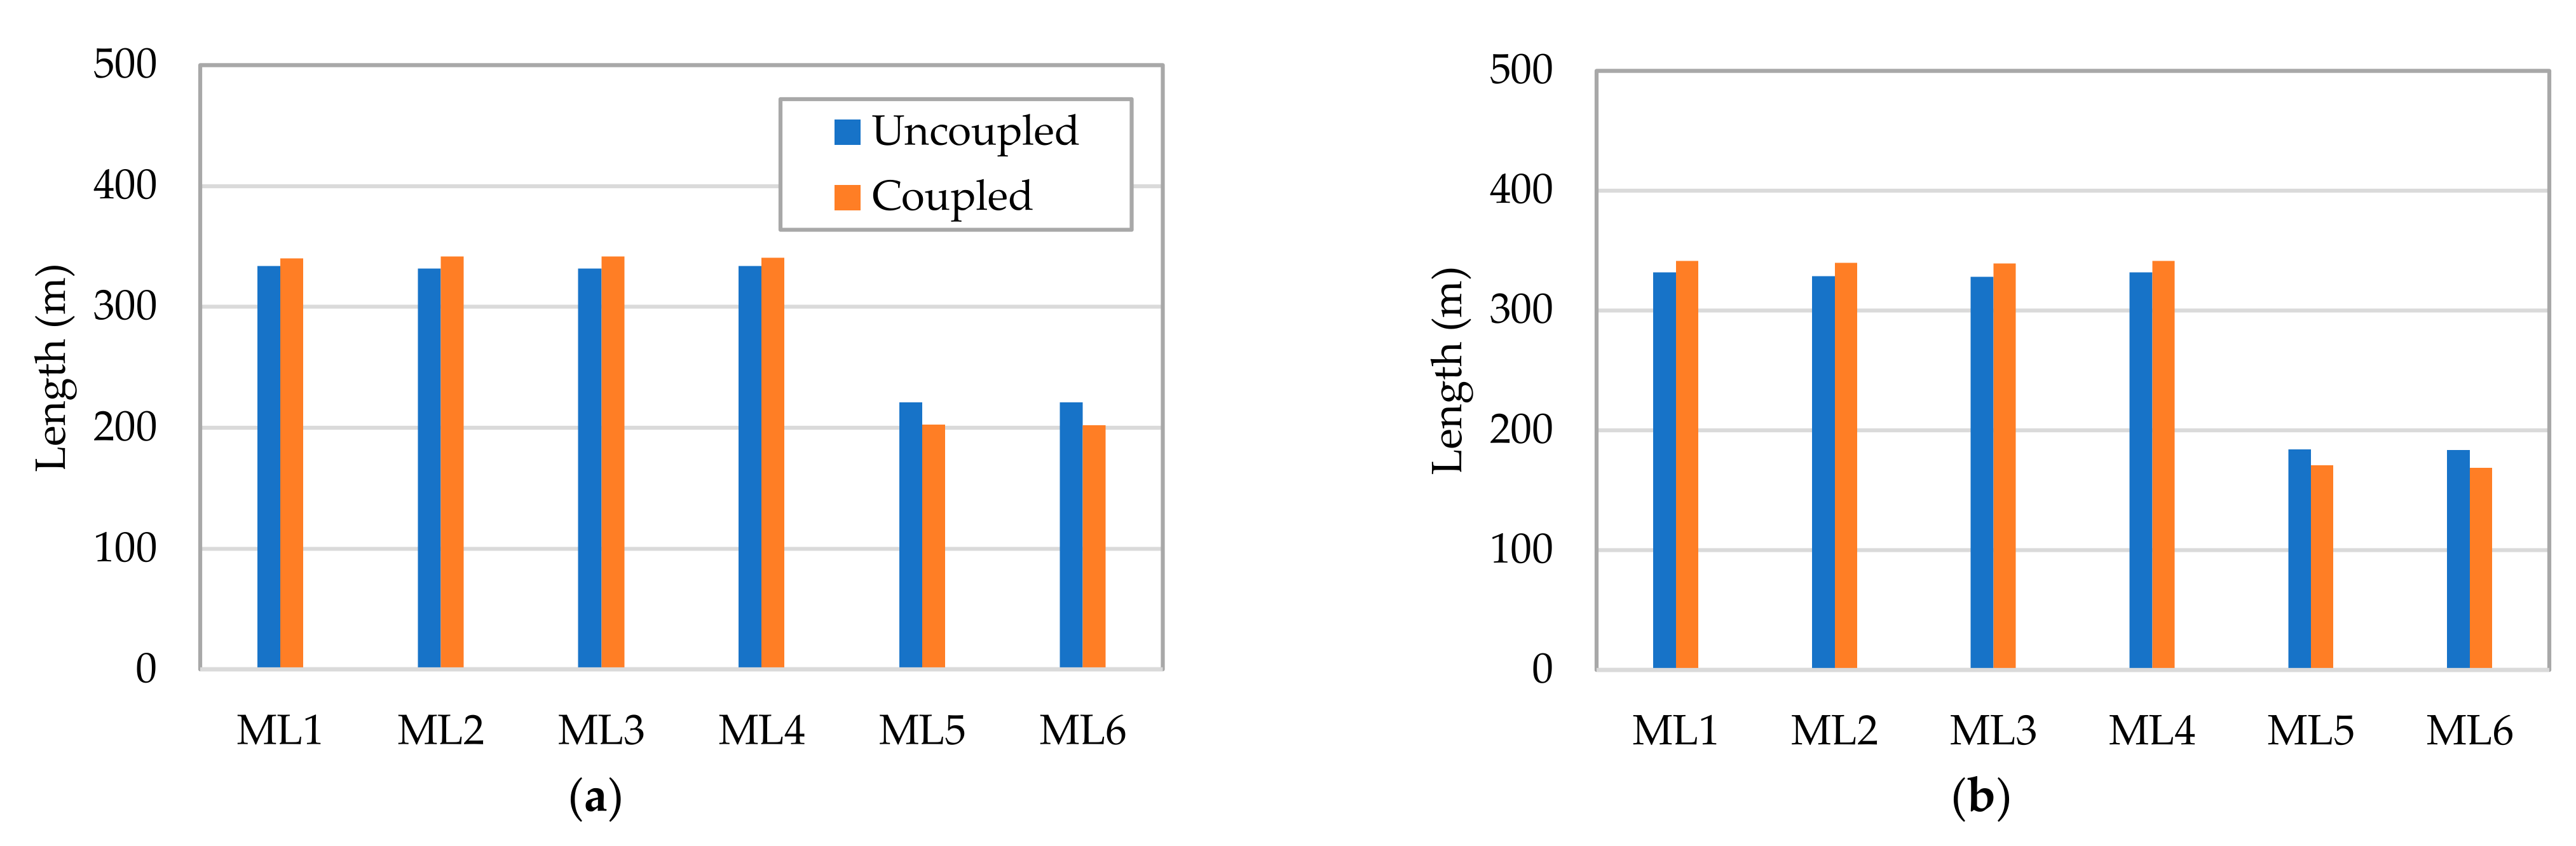
The present spread mooring system uses embedded drag anchors. Therefore, the anchor line length laying on the seabed during the design sea states of the extreme and survival seas must be sufficient to prevent the up-lift loads at the anchor. As presented in Figure 16, the taut lines of ML5 and ML6 under 0 deg heading has the shorter seabed line length as anticipated but it still offers sufficient line length margin to the anchor for the 50 and 100 y conditions. This result confirms that the present mooring design allows to use the drag anchor to moor the buoy coupled with the WEC platform. According to the results, it might be possible to optimize further to reduce the total mooring line length (or reduce the mooring line size), which will be a future phase work.
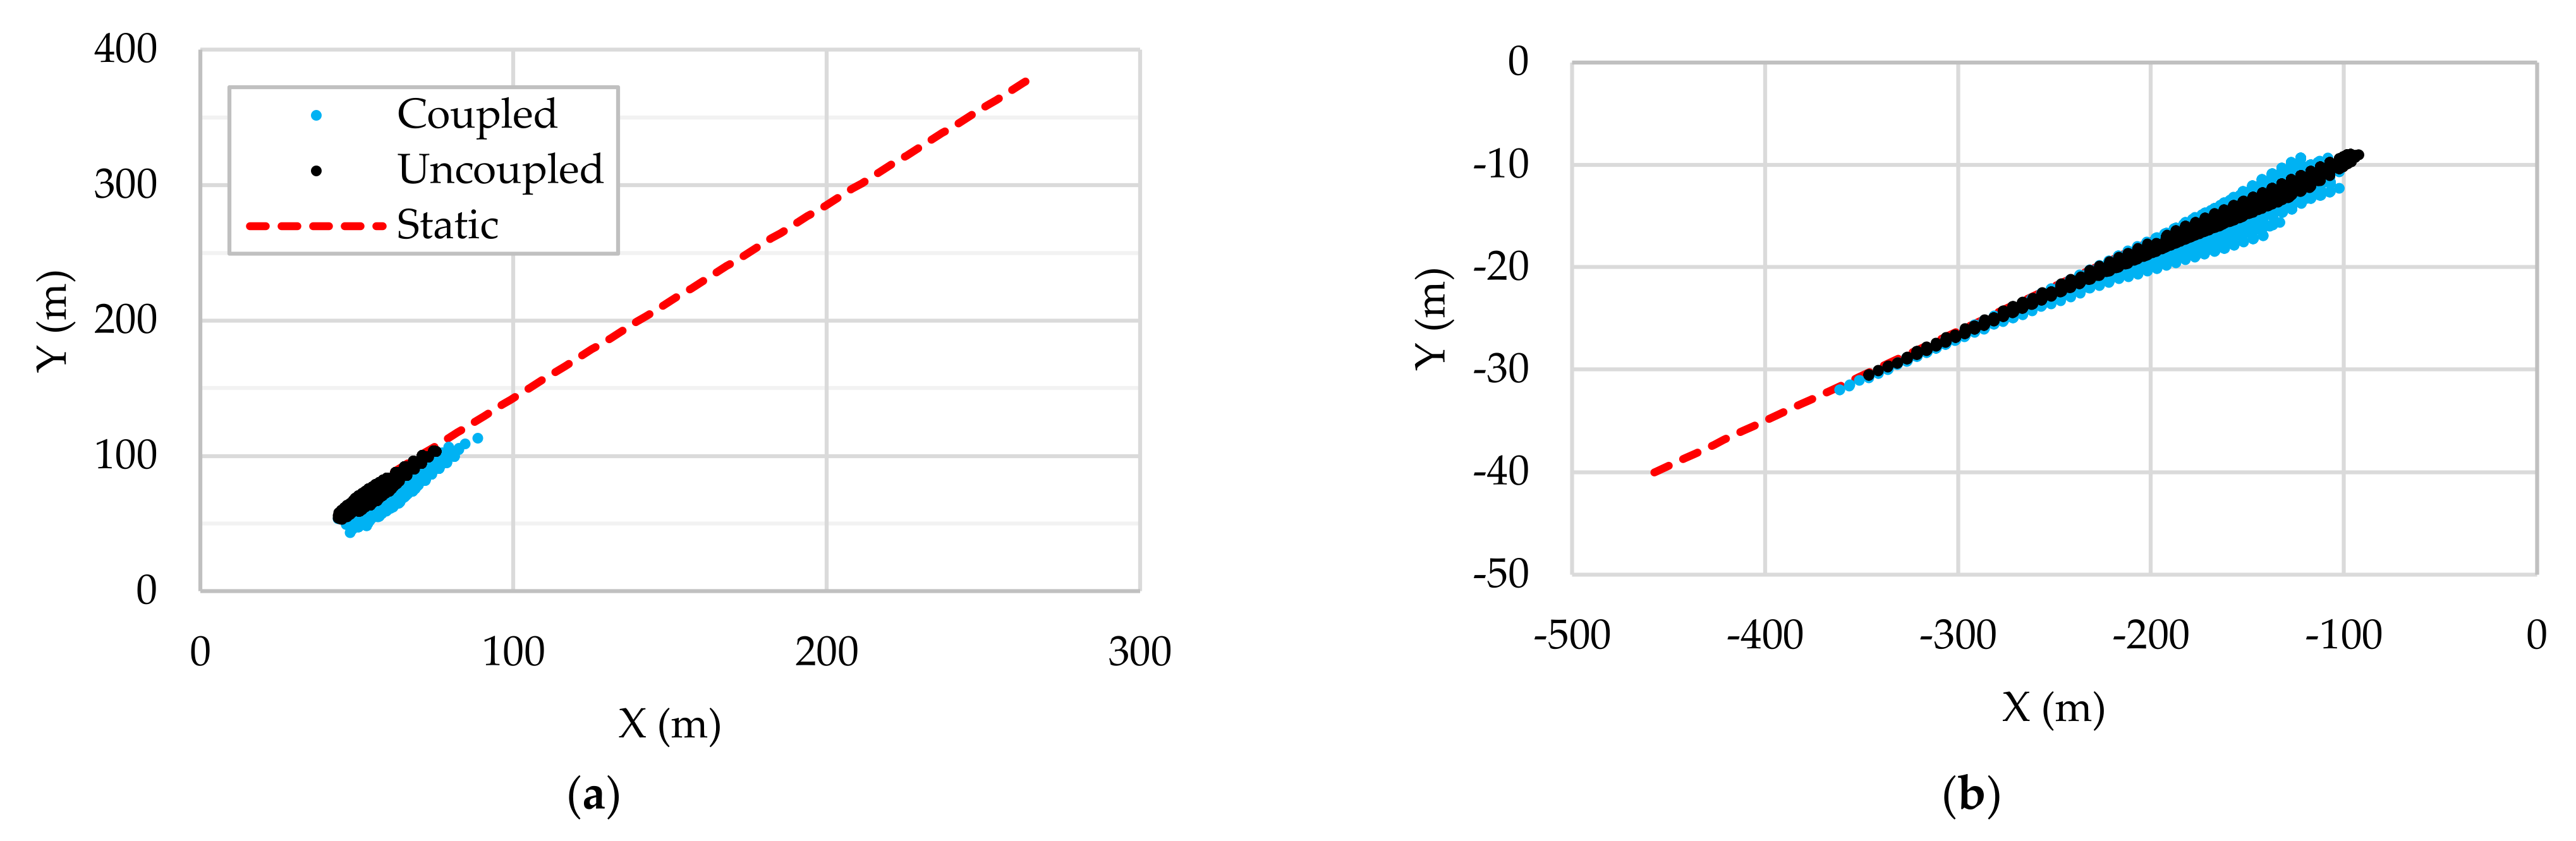
Figure 17 compares the mooring line Touch-Down Point (TDP) footprints for the uncoupled and coupled cases under the 50 y and heading 0 deg. condition. Among the anchor lines, slack line ML2 and taut line ML5 are considered. For comparisons, the initial static locations on the seabed from the static TDP to the anchor point are also presented. The static TDPs of the ML2 and ML5 are located around (+60, +90) m and (−110, −10) m in the global X and Y directions, respectively.
It is seen that the TDP footprints of the uncoupled case are distributed mostly along the static line direction, while the TDPs for the coupled case are broadly distributed, especially near the initial static TDP. These TDP variations for both the uncoupled and coupled cases are related to the mooring buoy motions depicted in Figure 10a. Due to the high tensions on the taut line of ML5, its TDP locations vary with much longer pattern toward the anchor point, compared to the slack line ML2. This results in a shorter seabed anchor line length on the taut lines (ML5, ML6), compared to the slack lines (ML1–ML4), as presented in Figure 16.
3.3. Mooring Line Fatigue Analysis
3.3.1. Fatigue Bins and Mooring Tension-Cycle Curve
Figure 3a illustrates the fatigue analysis model showing the WEC platform, mooring buoy and lines, hawsers and power cables. The original full scatter diagrams presenting the winds, waves, currents and their directionalities are modified for the present mooring fatigue analysis. The original wave scatter diagram consisting of 125 fatigue bins is condensed to 25 bins. The directional probabilities of the waves are also condensed to two headings: 58.7% for −67.5 deg. and 41.3% for 67.5 deg. It is considered that the winds and currents are aligned with the wave direction.
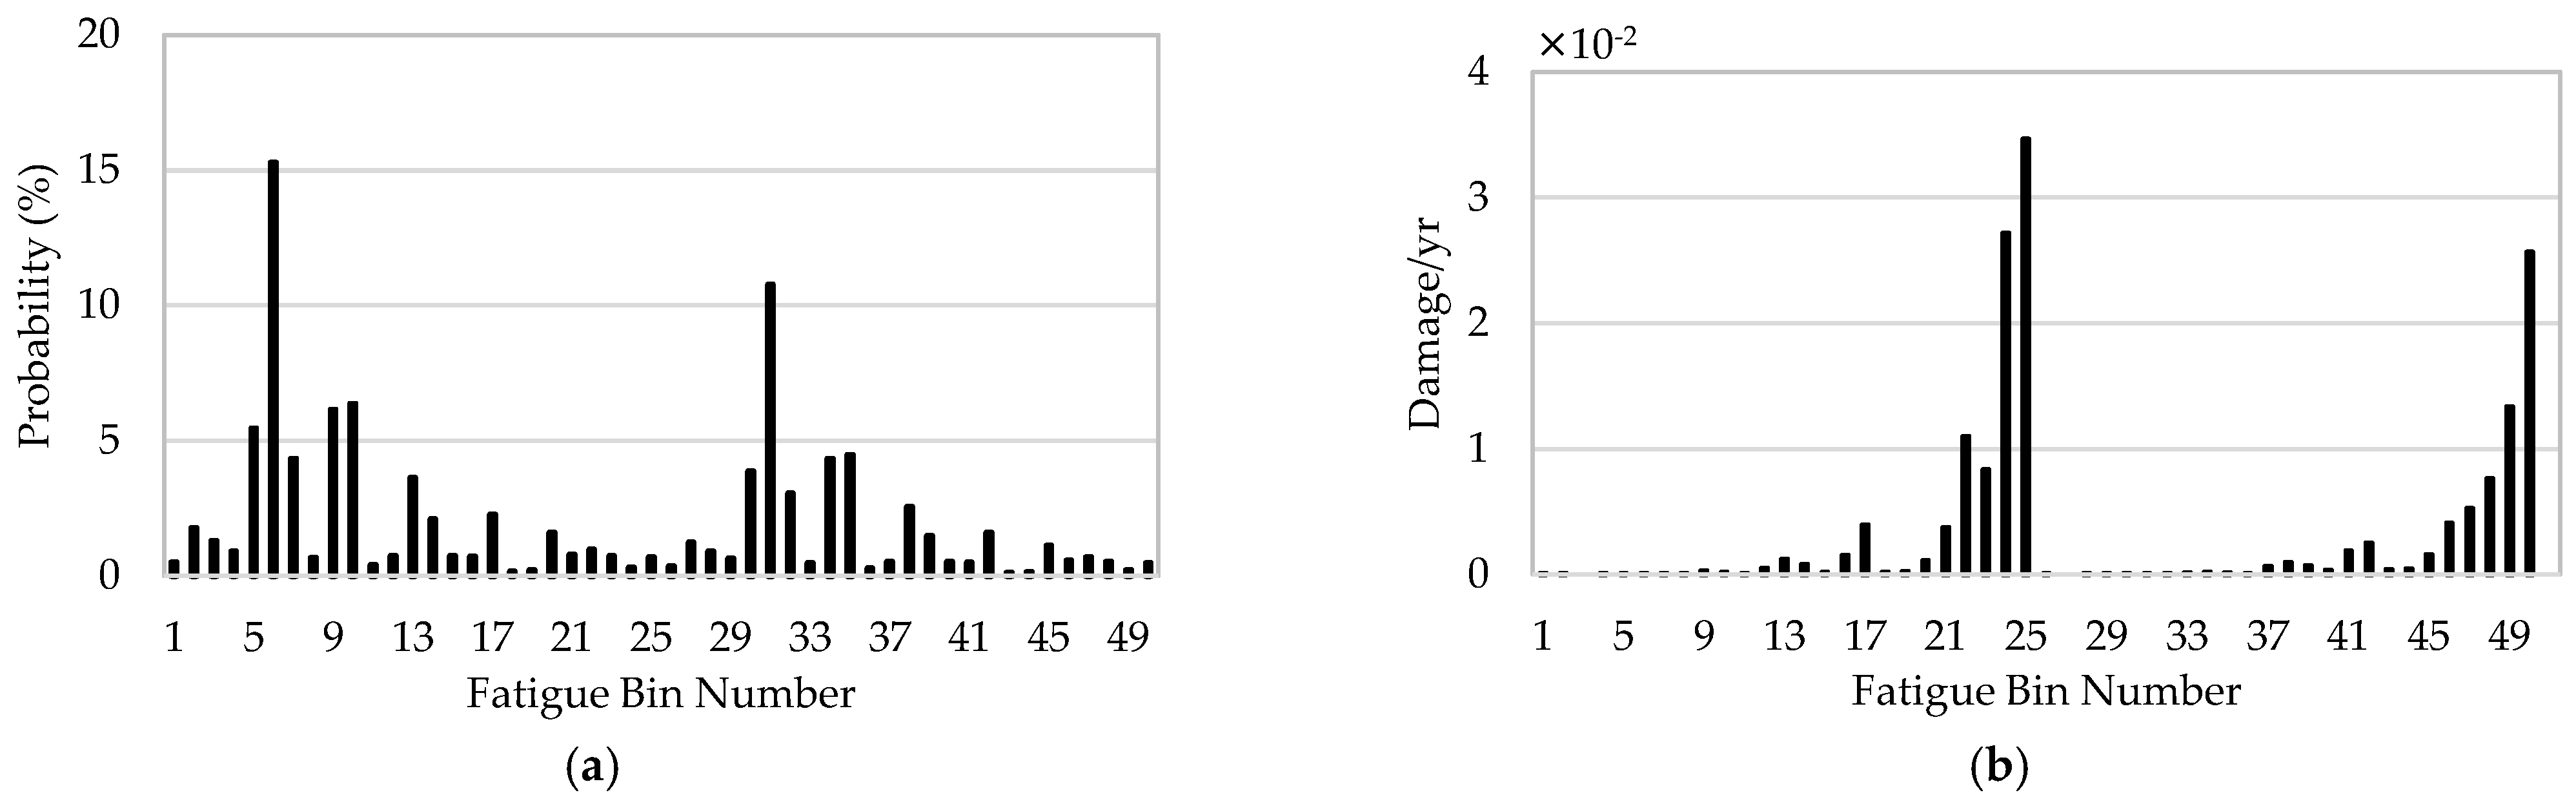
A total of 50 fatigue bins combined with winds, waves and currents are, thus, constructed. Probabilities of the condensed 50 bins are plotted in Figure 18a. The first 25 bins correspond to the heading −67.5 deg and the next 25 bins to 67.5 deg. Constant wind (8.5 m/s) and current (0.5 m/s) across the bins are applied for the fatigue analysis. Fatigue life of the mooring lines is calculated by using Tension–Cycle (T-N) curve in API RP 2SK [34]. Additionally, the standard of DNV [42] provides details of the mooring line fatigue estimation. The T-N curve below is used for calculating the tension-induced fatigue analysis of the mooring components.
where is the number of cycles, and is the ratio of the tension range (double amplitude) to MBL. Curve slope and intercept values for a studless chain (link) are 3 and 316, respectively. A rain-flow counting method is implemented to construct the histograms including and in the present analysis.
3.3.2. Mooring Line Fatigue Life Assessment
The WEC platform configured with a side hull section angle of 150 deg for the normal operating conditions in Figure 3a is considered for the mooring fatigue analysis. Time-domain fully coupled simulations with the corresponding environments of the bins were conducted for one hour per bin to estimate the damage to the mooring lines.
Fatigue damages of each segment along the arc length of each mooring line are calculated. It is found that the worst damages of each mooring lines occur at the fairlead location which is the arch length of 0 m. Figure 18b shows the damages due to each bin from the bin 1 to 50 at the fairlead of the mooring line ML1. It is seen that the most damages are contributed by the bins from 21 to 25 and 46 to 50. These are due to the higher sea states for those bins than other bins, although low probabilities are presented as shown in Figure 18a.
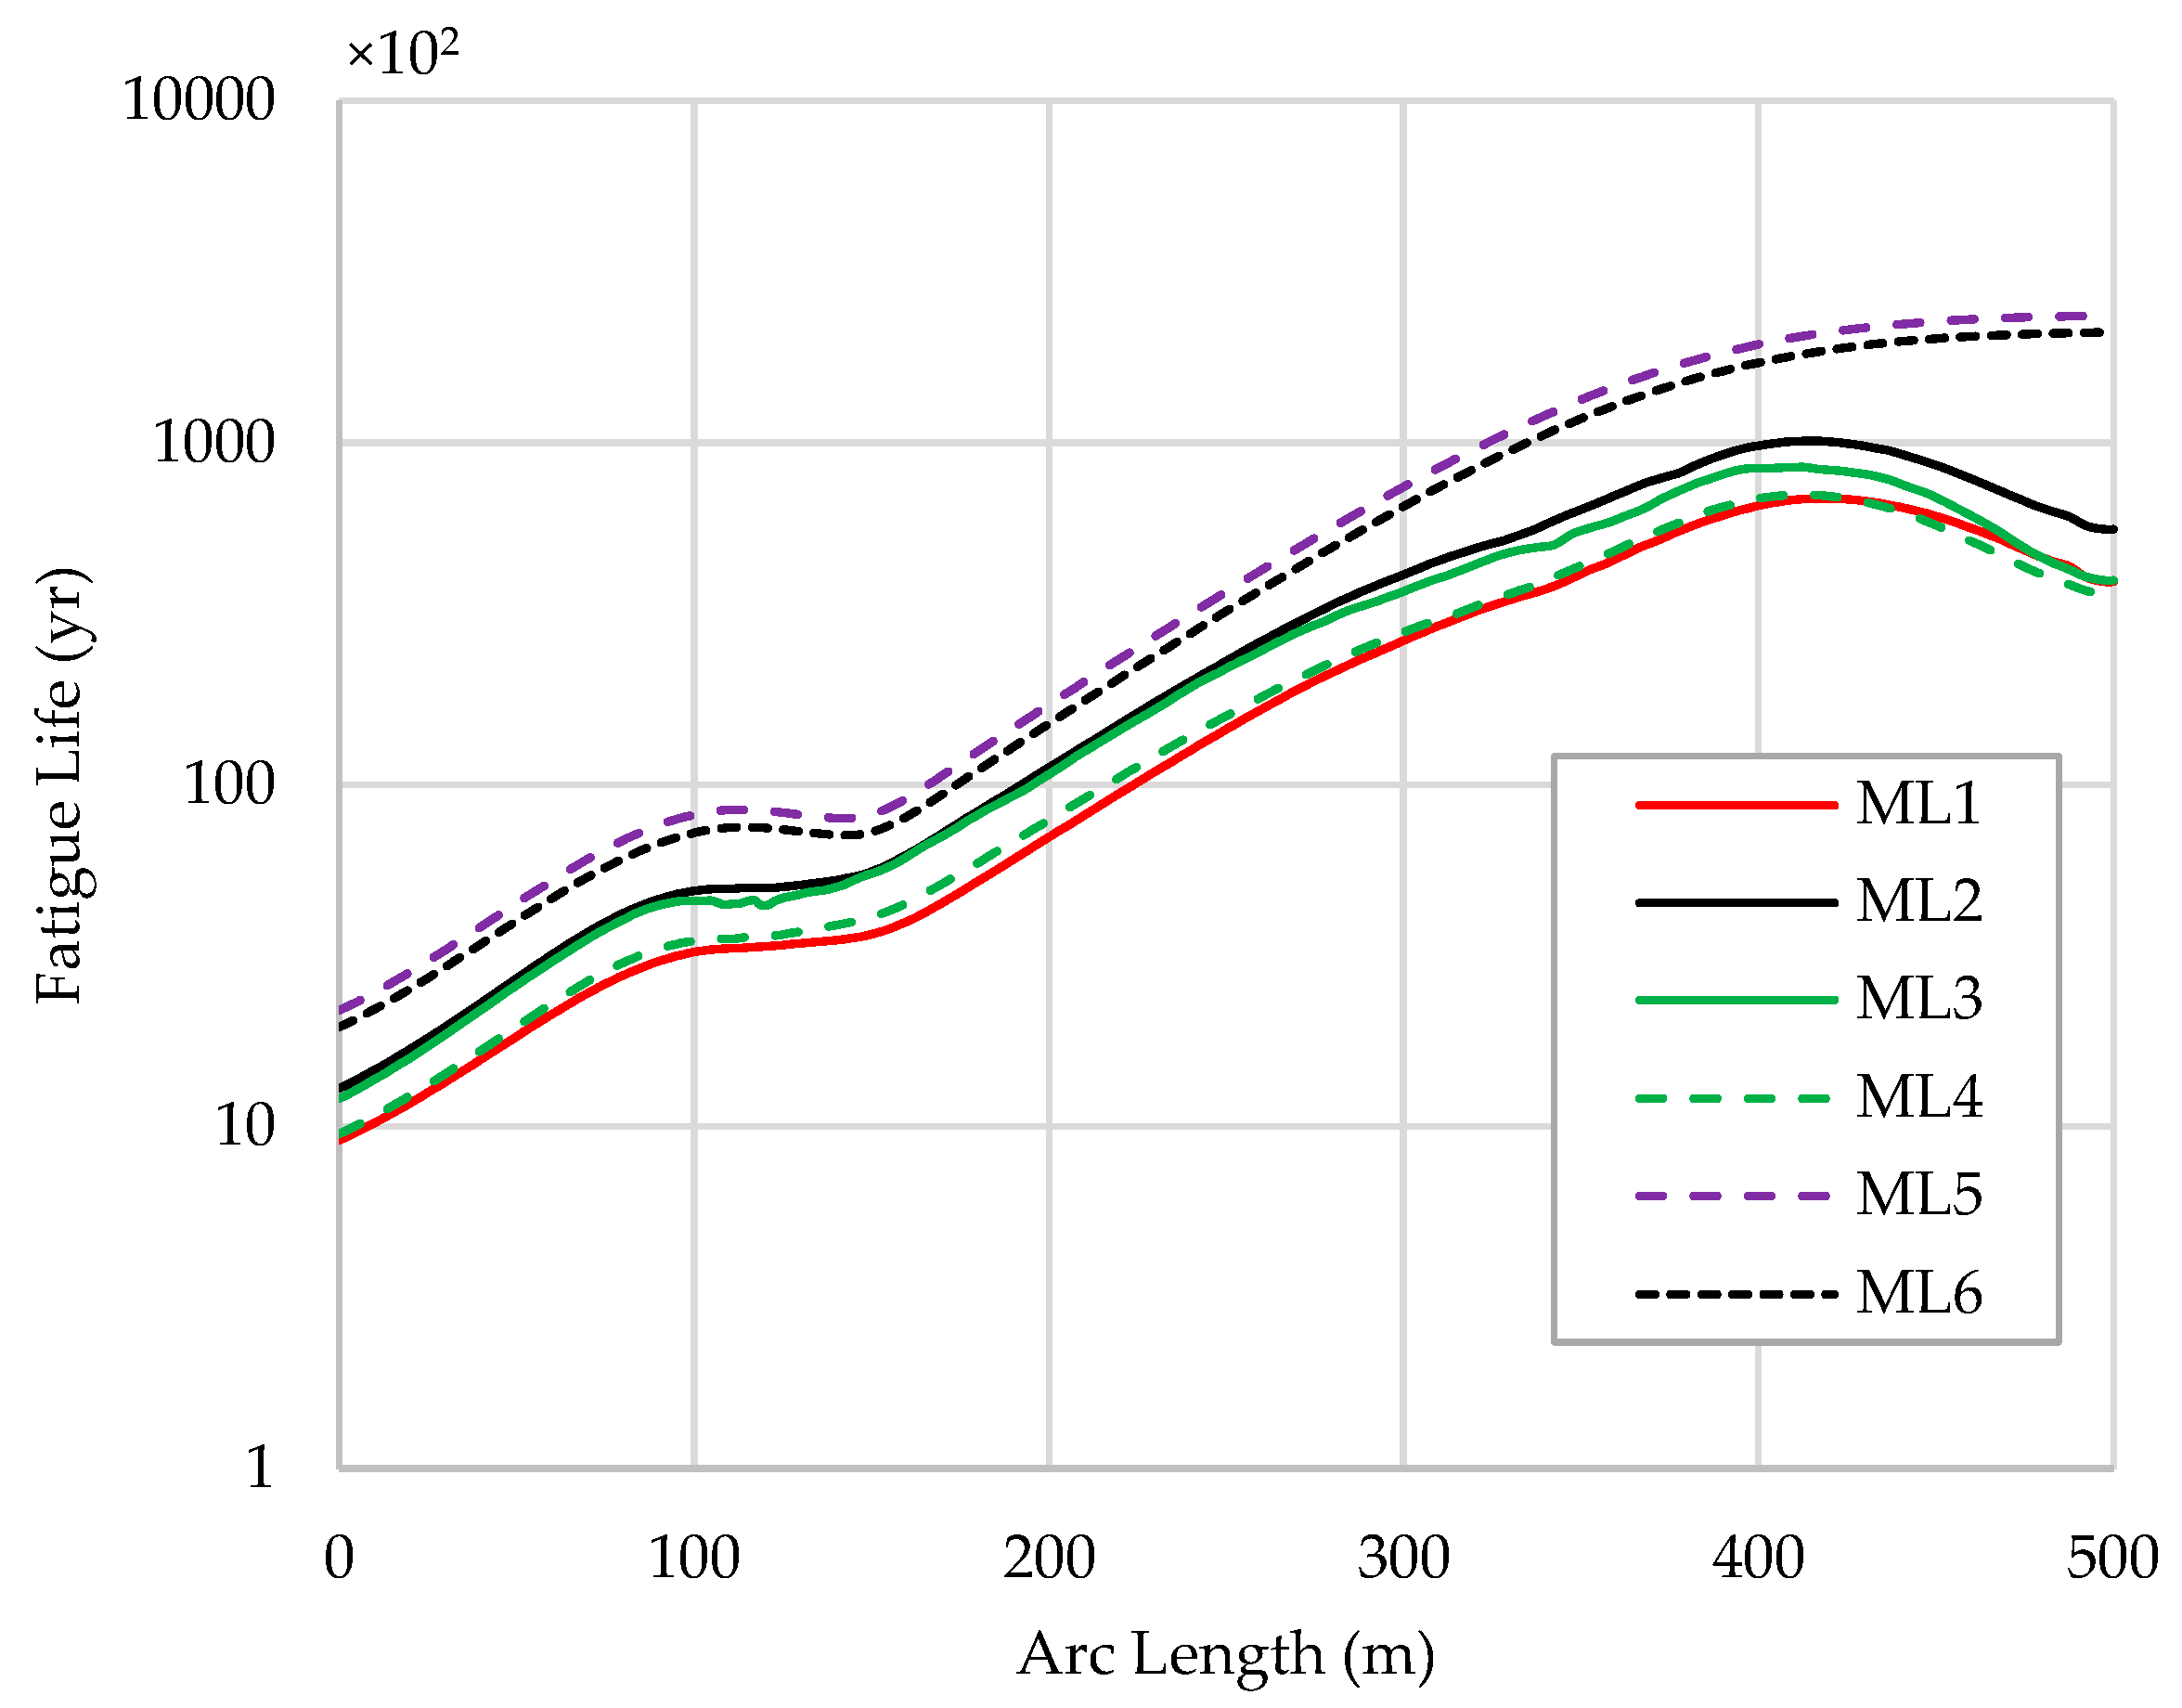
Each mooring line fatigue life from the fairlead to the anchor point is plotted in Figure 19, where the vertical axis is in Log scale. The life increases as the arc length increases, which may be due to the lower dynamic effects from the mooring buoy. There are some reductions on each line near the touch-down points between the arch length of 100 m and 200 m.
Table 11 summarize the minimum fatigue life of each line. Among the mooring lines, north-east (ML1, ML 2) and south-east (ML3, ML4) groups of the line present lower life than the west group lines of ML 5 and ML6. The lowest fatigue life is found on the mooring line ML1. These are resulted due to the directionalities (−67.5 deg and +67.5 deg) of the waves and currents of the bins. The fatigue life is in the range from 912 to 2182. The lowest value exceeds the allowable minimum of 200 years, considering the service life of 20 years and fatigue FoS of 10. This confirms that the mooring design complies with the fatigue design criteria in ABS [36,37,38] and API RP 2SK [34]. At last, it should be emphasized that in the present analysis, an appropriate stress concentration factor is not taken into consideration, especially on the fairlead. Thus, this effect to the fairlead point may be studied in the future.
3.4. Mooring Buoy Structure Strength Analysis
3.4.1. Global Strength Analysis
The mooring buoy consists of two major structure components of the turntable and buoyant hull. The turntable is supported on the top of the buoy by a series of bearings which allow the WEC system to weathervane around the buoy. The buoyant hull is fitted with a skirt at the bottom whose primary purpose is to act as a protective barrier for the mooring fairleads. The buoyant hull consists of a stiffened plate structure designed in accordance with ABS Rules [36,37]. Details of the buoy structure components and scantling results are omitted in this paper.
The global FEA analysis focuses on the overall structural integrity of the buoy hull. Buoy components are modeled as shell elements of 345 MPa steel. The global model is a coarse structural model, in that it models large structural members, such as girder webs, and plating, but not girder flanges or minor stiffening, such as brackets. For the verification, the extreme load case is analyzed. Hawser loads, hydrostatic loads and inertia loads are modeled. Appurtenances and secondary structures, such as brackets, are excluded in the model.
For global analysis, the mooring buoy loads are taken at the bearing ring reaction loads for the hawser load applied to the turntable. As the turntable is free to rotate, the reactions at the bearing supports are then applied to the mooring buoy. The mooring connection points on the hull are modelled as translation fixed constraints. No loads or constraints are applied to the buoy bumper skirt.
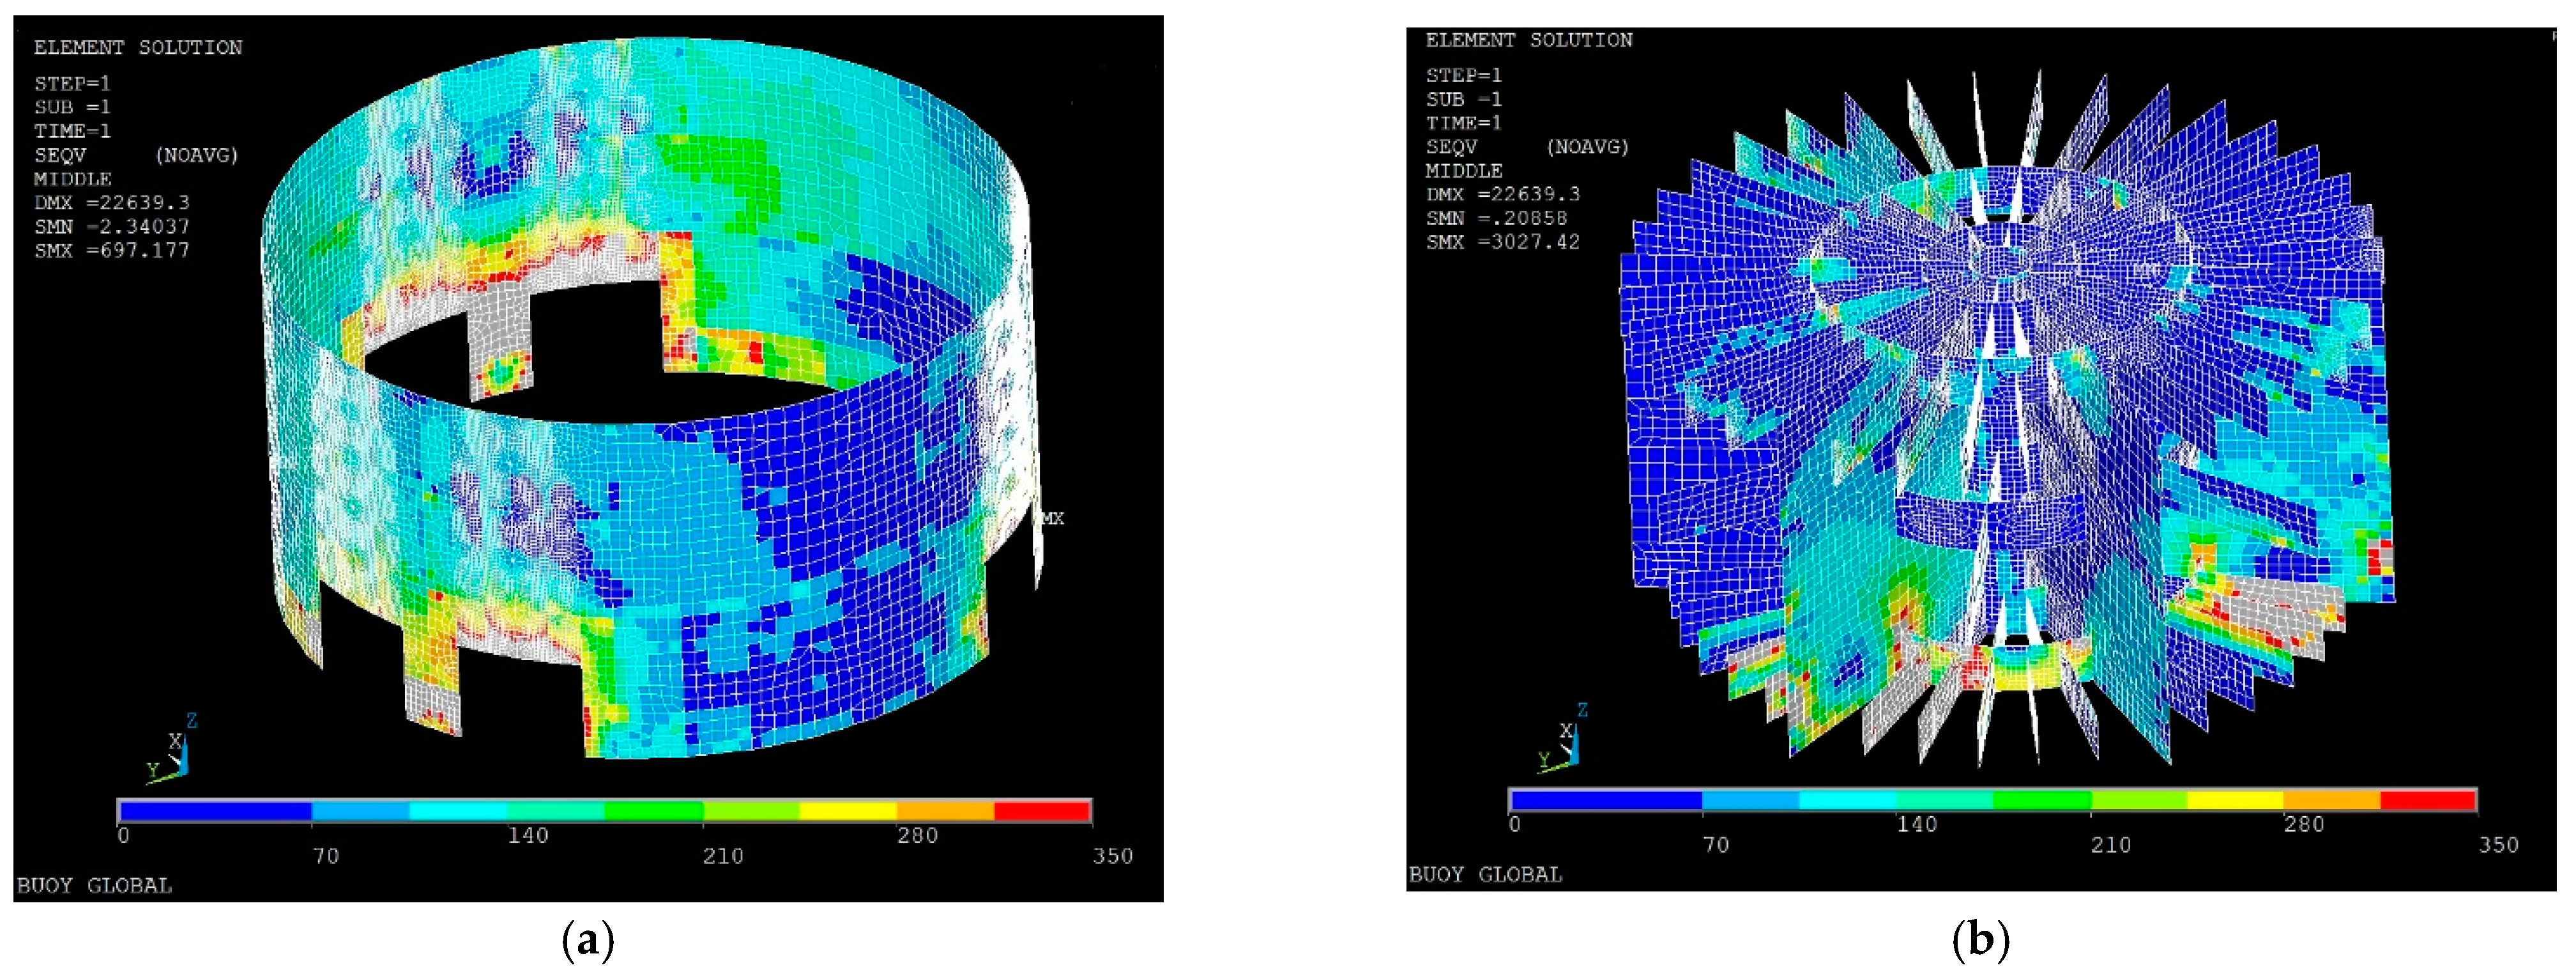
Figure 20 illustrates the FEA outputs of the side shell pate, internal structure and under the deck structure. High stresses occur in the way of the mooring connections. The local model, which is more refined, does not show those high stresses and will be discussed more in the next section. The deck and underdeck designs are confirmed for the overall strength of the buoy structures. Again, some localized high stresses appear but these stresses will be reduced with additional local design and analysis of the refined local model.
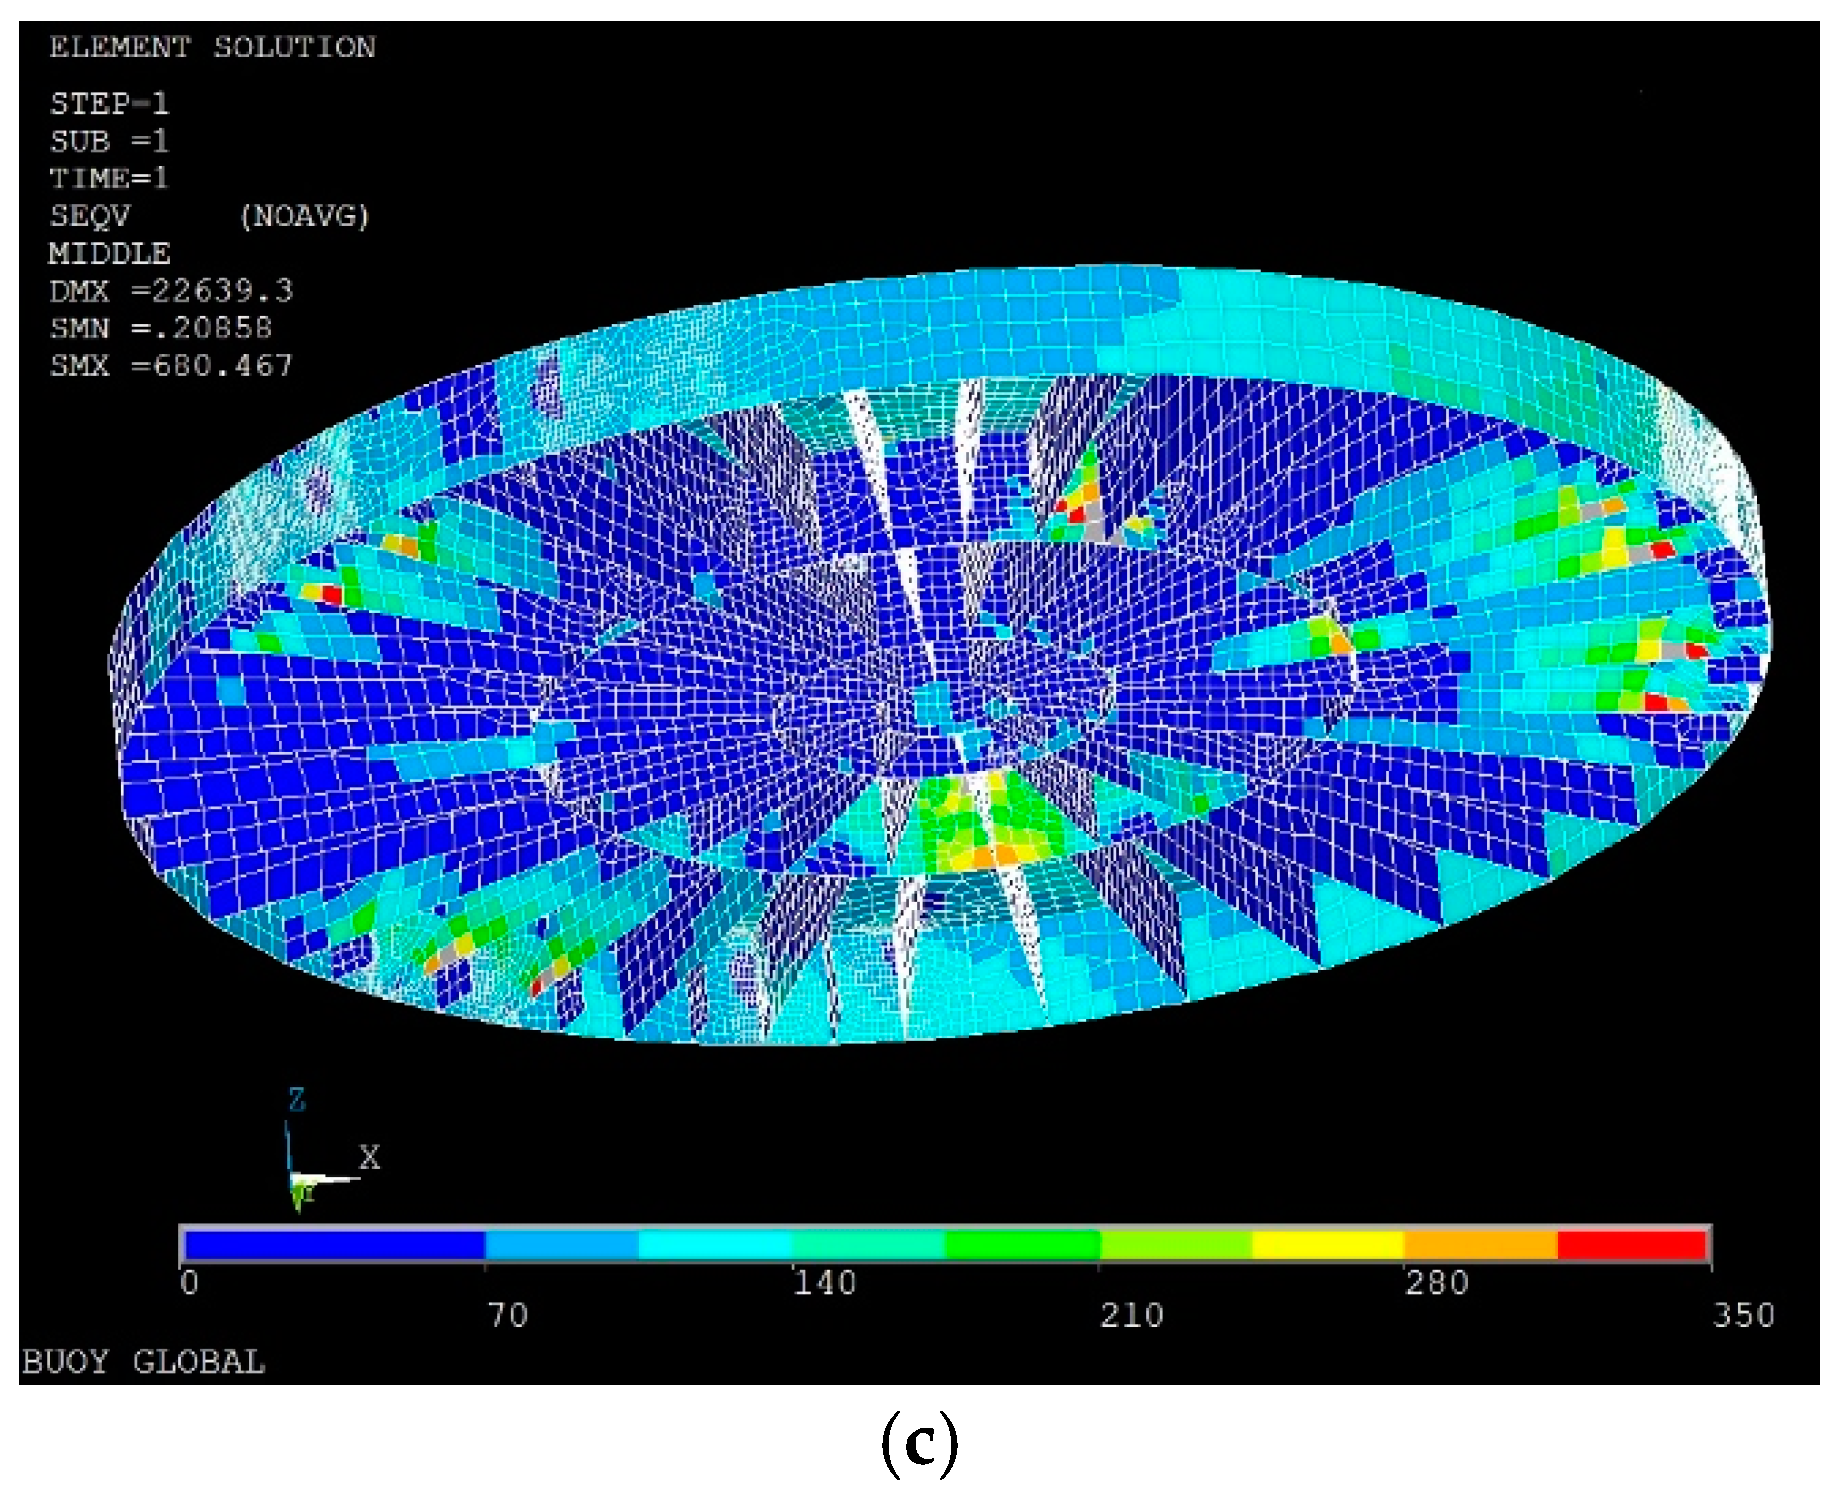
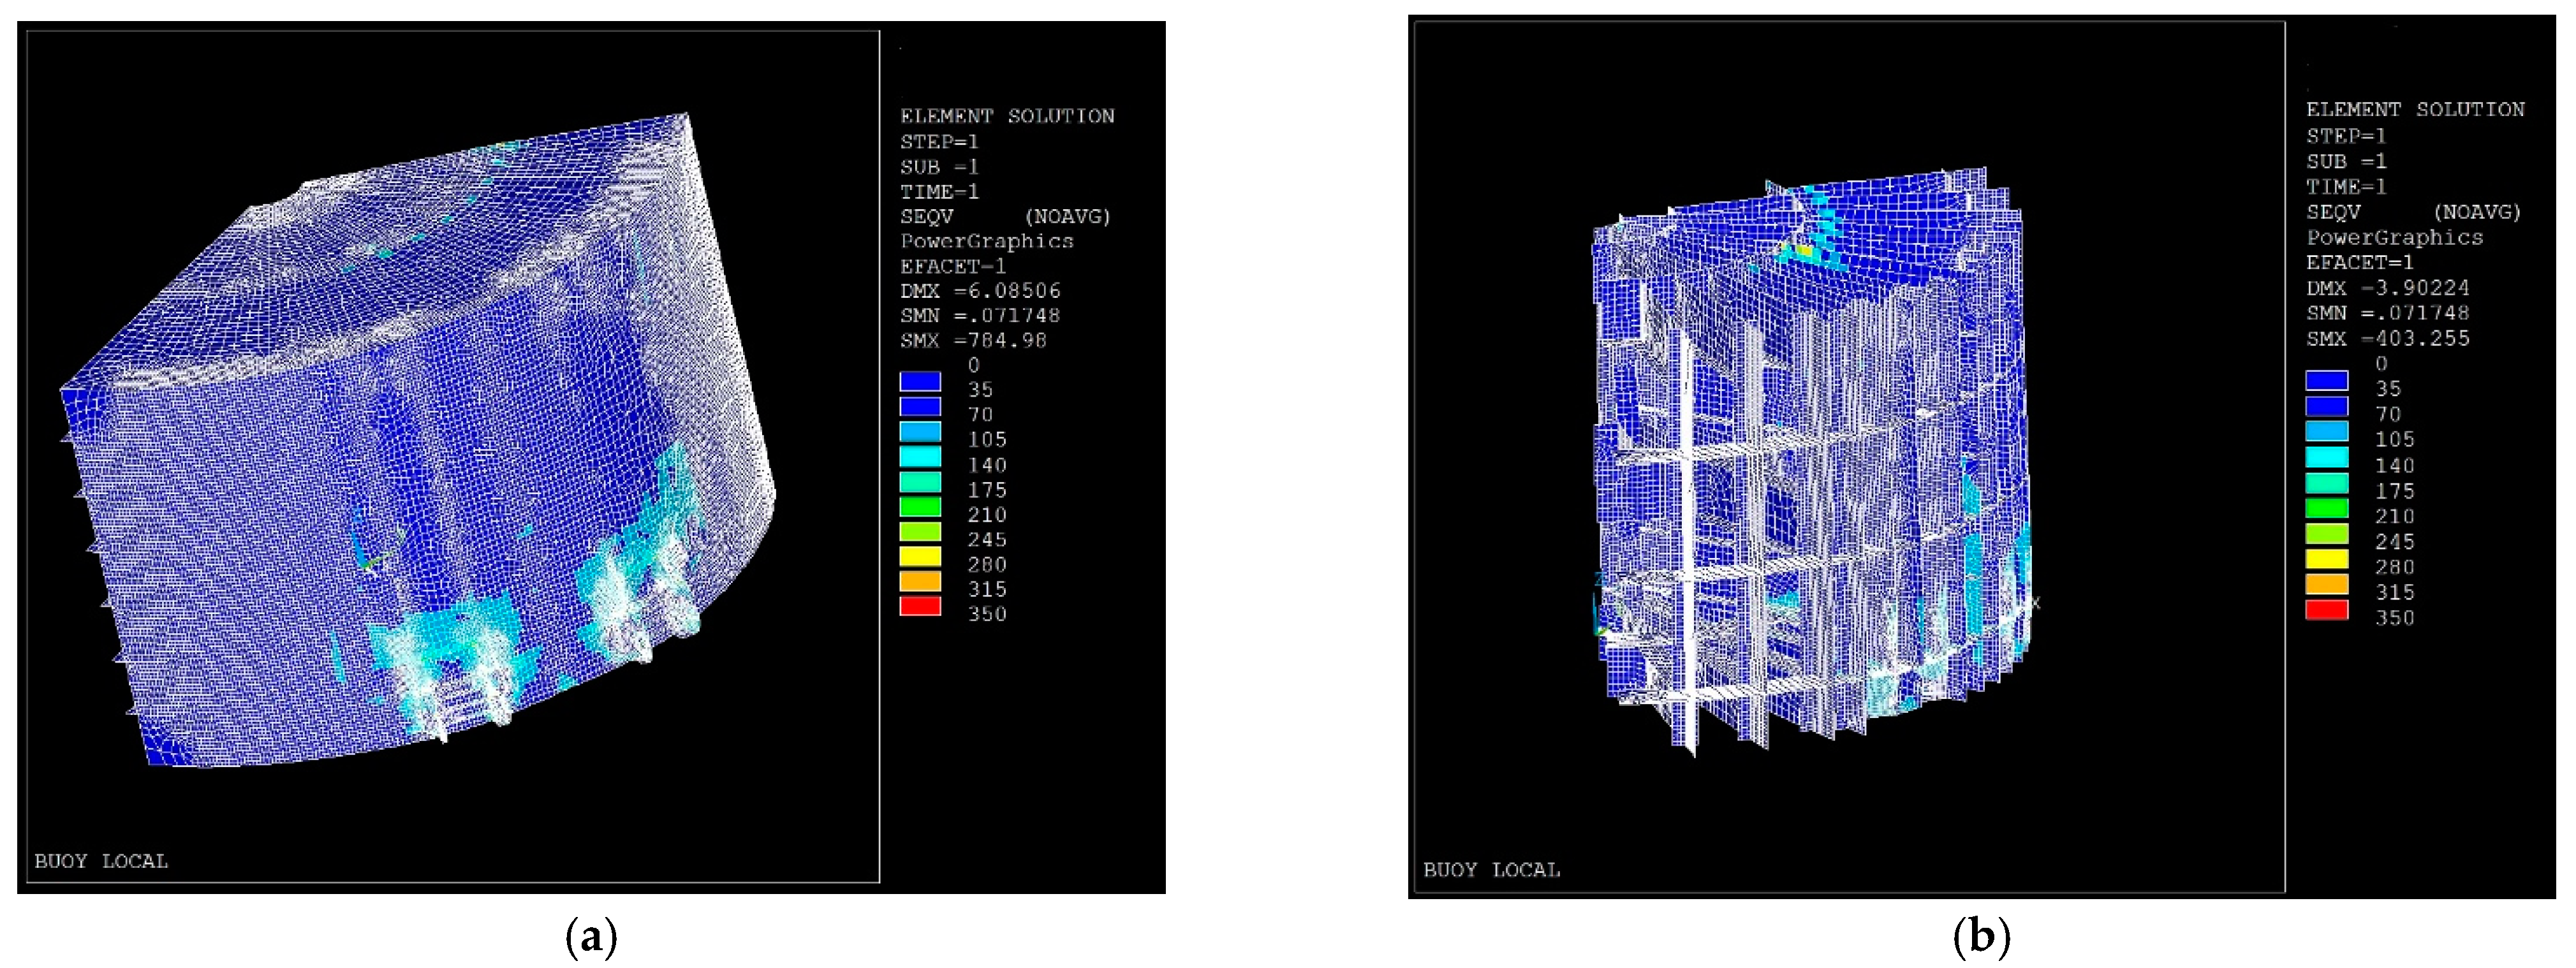
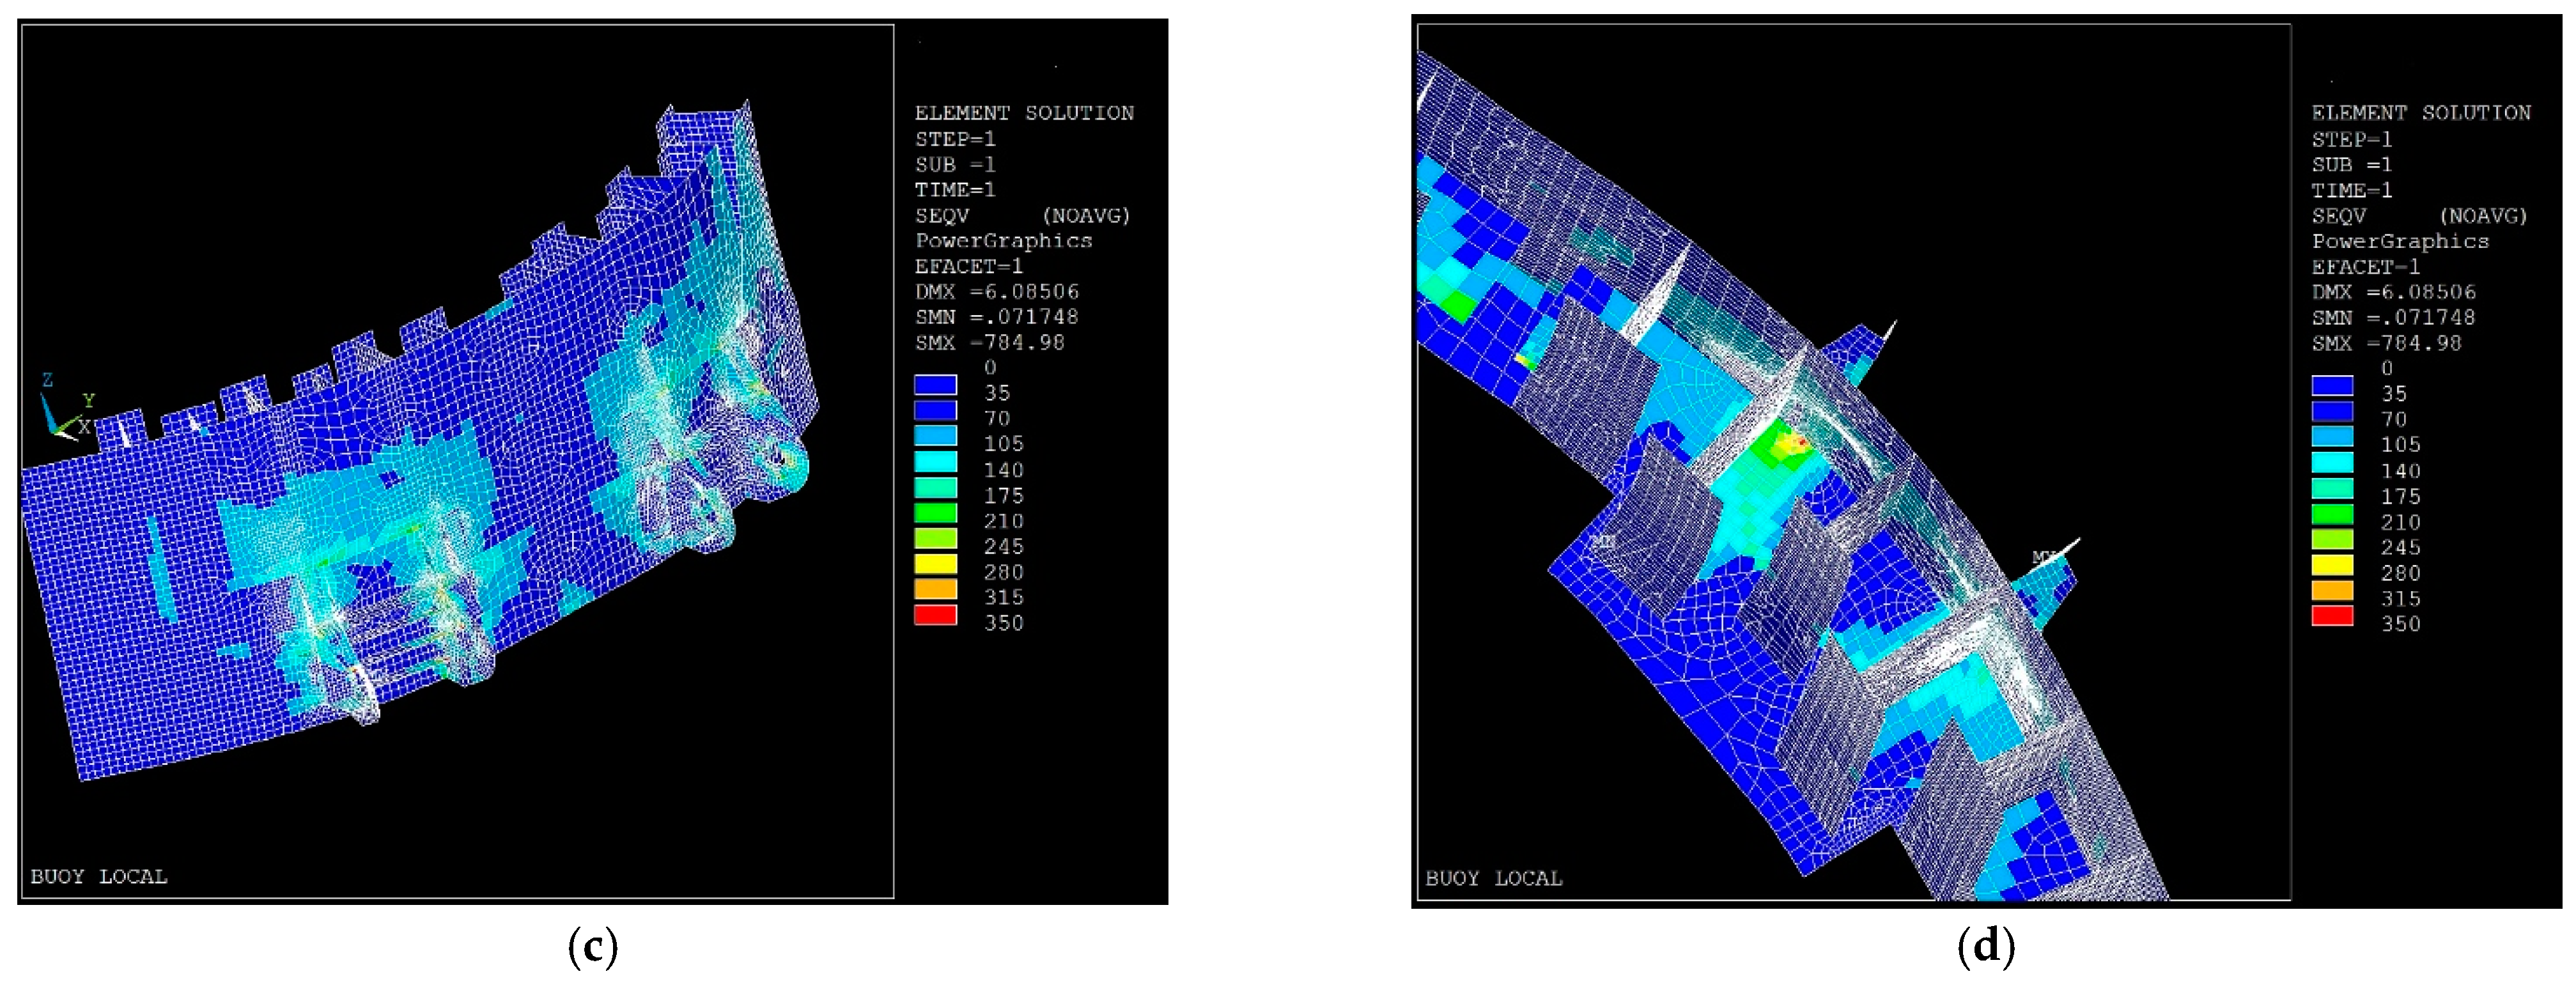
3.4.2. Local Strength Analysis
Local strength analysis of the mooring buoy was conducted to the local model refined, based on the global strength analysis results. Vertical structures, thicker insert plates at the bottom and sides shell and for the ring stiffener near the mooring brackets are added. The local model also contains more details, including flanges, than the coarse global model. For the local model, constraints are assigned at the center core and at the bearing ring on deck. The maximum mooring load of the mooring group derived from the mooring analysis is divided into even loads at both pairs of mooring brackets in the local model.
Figure 21 presents the FEA local strength analysis results of the side shell plate, internal structure, mooring bracket and bracket internal structure. It is shown that the high stresses appearing in the global analysis results (Figure 20) disappear. However, there are a few high stress points, located predominantly in the structure around the mooring brackets in Figure 21c, d. However, it is believed that with further engineering redesign those highly localized stresses can be reduced.
4. Summary and Conclusions
A mooring buoy system is designed to moor a floating WEC platform which is connected to the buoy with hawsers. The WEC platform can rotate freely around the buoy in response to the prevailing environment directions. The mooring buoy consists of the key components of turn table with main bearings, cylindrical buoy hull with skirt and fairleads. The buoy can also accommodate the power cable to transfer the electricity from the platform to shore. The mooring lines are tied to the keel of the buoy, but the turntable supported by the main bearings on the buoy hull deck allows the WEC platform weathervane. The hawsers and import power cable from the platform are tied to the connectors on the turn table. The mooring buoy is moored with six chain lines of a group of two, whereas the platform is connected to the buoy with two synthetic hawsers.
The WEC platform with a rated power of 1.0 MW can be configured depending on the sea states of the operating or storm conditions. The mooring strength analysis considers the storm configuration, while the mooring fatigue analysis uses the platform with the operating mode configuration.
Simulations with the uncoupled and coupled models were conducted in the time domain, under the sea states of 50 year extreme and 100 year survival conditions. The coupled model includes all the components of the WEC platform, mooring buoy, mooring lines, hawsers and power cables so that fully coupled effects to the mooring systems are captured in the results. The uncoupled model considers the mooring buoy and lines. Key observations with the uncoupled and coupled system simulations are as follows:
- There are strong coupling effects to the buoy surge and pith motions whereas the heave coupling effects are small.
- Buoy motion spectral peaks are aligned with the wave spectral peaks except the pitch. This indicates that pitch motion coupled is related to its own resonance frequency and hawser tension.
- The buoy trajectories (watch circles) are mostly confined along the platform direction for the uncoupled while they are scattered widely in the lateral direction in the coupled case.
- A proper separation between the buoy and platform is maintained during the storm so that a clashing to the buoy can likely be prevented.
- Tensions on the most loaded lines increase in the coupled model. The increase rate from the uncoupled is about 5.3% for the extreme and 7.7% for the survival conditions.
- Hawser tensions increase with higher sea states and are greater about 8.3% at the survival than the extreme seas.
- There are considerable tension changes in the slack mooring lines due to the wave seed changes, whereas the tensions on the loaded lines show small variations between seeds.
Mooring line strength and fatigue designs were validated with ABS and API requirements. It is confirmed that the mooring line strength FoSs comply with the irrespective requirements for the extreme and survival seas. Minimum fatigue life of the mooring lines is estimated to be sufficiently long and exceeds the allowable minimum FoS of 20. In addition, global and local structural designs of the mooring buoy were undertaken and confirmed the structural design compliances against ABS requirements. The analysis and design validation results can conclude that the mooring buoy system developed can be used for station-keeping of the buoy itself and WEC platform during the power production and storm events. However, a further optimization to the mooring buoy, mooring lines and buoy structures may be suggested in the future.
Author Contributions
Conceptualization, S.Y.B.; methodology, S.Y.B. and S.A.S.; software, S.Y.B. and S.A.S.; validation, S.Y.B. and S.A.S.; formal analysis, S.Y.B.; investigation, S.Y.B. and S.A.S.; resources, S.Y.B.; data curation, S.Y.B.; writing—original draft preparation, S.Y.B.; writing—review and editing, S.A.S.; visualization, S.Y.B. and S.A.S.; supervision, S.Y.B.; project administration, S.A.S.; funding acquisition, S.Y.B. Both authors have read and agreed to the published version of the manuscript.
Funding
This work was funded by the Korea Institute of Energy Technology Evaluation and Planning (KETEP) (No. 20163010071690).
Institutional Review Board Statement
Not applicable.
Informed Consent Statement
Not applicable.
Data Availability Statement
Not applicable.
Conflicts of Interest
The authors declare no conflict of interest.
References
- Titah-Benbouzid, H.; Benbouzid, M. An Up-to-date technologies review and evaluation of wave energy converters. IREE 2015, 10, 52. [Google Scholar] [CrossRef]
- Uihlein, A.; Magagna, D. Wave and tidal current energy—A review of the current state of research beyond technology. Renew. Sustain. Energy Rev. 2016, 58, 1070–1081. [Google Scholar] [CrossRef]
- Davidson, J.V.; Ringwood, J.V. Mathematical modelling of mooring systems for wave energy converters—A Review. Energies 2017, 10, 666. [Google Scholar] [CrossRef] [Green Version]
- Qiao, D.; Haider, R.; Yan, J.; Ning, D.; Li, B. Review of wave energy converter and design of mooring system. Sustainability 2020, 12, 8251. [Google Scholar] [CrossRef]
- Ortiz, J.P.; Bailey, H.; Buckham, B.; Crawford, C. Surrogate based design of a mooring system for a self-reacting point absorber. In Proceedings of the 25th International Offshore and Polar Engineering Conference, Kona, HI, USA, 21–26 June 2015; pp. 21–26. [Google Scholar]
- Beatty, S.J.; Hiles, C.; Nicoll, R.S.; Adamson, J.E.; Buckham, B.J. Design synthesis of a wave energy converter. In Volume 4: Ocean Engineering; Ocean Renewable Energy; Ocean Space Utilization, Parts A and B; ASMEDC: Honolulu, HI, USA, 2009; pp. 891–900. [Google Scholar]
- Swift, M.R.; Dewhurst, T.; Baldwin, K.; Wosnik, M. Design of a mooring system for an inertia tube wave energy collector. In Proceedings of the IEEE Oceans, Oceans 2014, St. John’s, NL, Canada, 14–19 September 2014; pp. 1–5. [Google Scholar] [CrossRef]
- Vicente, P.C.; Falcão, A.F.O.; Justino, P.A.P. Optimization of mooring configuration parameters of floating wave energy converters. In Volume 5: Ocean Space Utilization; Ocean Renewable Energy; ASMEDC: Rotterdam, The Netherlands, 2011; pp. 759–765. [Google Scholar]
- Harnois, V. Analysis of Highly Dynamic Mooring Systems: Peak Mooring Loads in Realistic Sea Conditions. Ph.D. Thesis, University of Exeter, Exeter, UK, 2014. [Google Scholar]
- PB3 PowerBuoy®. Available online: https://oceanpowertechnologies.com/pb3-powerbuoy/ (accessed on 14 July 2021).
- Vicente, P.C.; Falcão, A.F.; Justino, P.A. Nonlinear dynamics of a tightly moored point-absorber wave energy converter. Ocean Eng. 2013, 59, 20–36. [Google Scholar] [CrossRef] [Green Version]
- Pelamis Wave Power: EMEC: European Marine Energy Centre. Available online: http://www.emec.org.uk/about-us/wave-clients/pelamis-wave-power/ (accessed on 14 July 2021).
- Friis-Madsen, E.; Sørensen, H.; Parmeggiani, S. The development of a 1.5 MW Wave Dragon North Sea demonstrator. In Proceedings of the 4th International Conference on Ocean Energy, Dublin, Ireland, 17–19 October 2012; pp. 17–19. [Google Scholar]
- Parmeggiani, S.; Muliawan, M.J.; Gao, Z.; Moan, T.; Friis-Madsen, E. Comparison of mooring loads in survivability mode on the Wave Dragon wave energy converter obtained by a numerical model and experimental data. In Volume 7: Ocean Space Utilization; Ocean Renewable Energy; American Society of Mechanical Engineers: Rio de Janeiro, Brazil, 2012; pp. 341–350. [Google Scholar]
- Pecher, A.; Kofoed, J.P.; Larsen, T. Design specifications for the Hanstholm WEPTOS wave energy converter. Energies 2012, 5, 1001–1017. [Google Scholar] [CrossRef]
- Pecher, A.; Kofoed, J.P.; Larsen, T.; Marchalot, T. Experimental study of the WEPTOS wave energy converter. In Volume 7: Ocean Space Utilization; Ocean Renewable Energy; American Society of Mechanical Engineers: Rio de Janeiro, Brazil, 2012; pp. 525–534. [Google Scholar]
- Pecher, A.; Foglia, A.; Kofoed, J. Comparison and sensitivity investigations of a CALM and SALM type mooring system for wave energy converters. JMSE 2014, 2, 93–122. [Google Scholar] [CrossRef]
- Boo, S.Y.; Kim, K.-H.; Lee, K.; Park, S.; Choi, J.-S.; Hong, K. Design challenges of a hybrid platform with multiple wind turbine and wave energy converters. In Proceedings of the 21st Offshore Symposium, Texas Section of the Society of Naval Architects and Marine Engineers, Houston, TX, USA, 16 February 2016. [Google Scholar]
- Thomsen, J.B.; Ferri, F.; Kofoed, J.P. Validation of a tool for the initial dynamic design of mooring systems for large floating wave energy converters. JMSE 2017, 5, 45. [Google Scholar] [CrossRef] [Green Version]
- Soulard, T.; Babarit, A.; Borgarino, B.; Wyns, M.; Harismendy, M. C-HyP: A Combined wind and wave energy platform with balanced contributions. In Proceedings of the ASME 2013 32nd International Conference on Ocean, Offshore and Arctic Engineering OMAE2013, Nantes, France, 9–14 June 2013. [Google Scholar]
- Muliawan, M.J.; Karimirad, M.; Gao, Z.; Moan, T. Extreme responses of a combined spar-type floating wind turbine and floating wave energy converter (STC) system with survival modes. Ocean Eng. 2013, 65, 71–82. [Google Scholar] [CrossRef]
- Ren, N.; Gao, Z.; Moan, T. Long-term stochastic dynamic analysis of a combined floating spar-type wind turbine and wave energy converter (STC) system for mooring fatigue damage and power prediction. In Volume 9A: Ocean Renewable Energy; American Society of Mechanical Engineers: San Francisco, CA, USA, 2014. [Google Scholar]
- Cozijn, J.L.; Bunnik, T.H.J. Coupled mooring analysis for a deep water CALM buoy. In Proceedings of the 23rd International Conference on Offshore Mechanics and Arctic Engineering, Vancouver, BC, Canada, 20–25 June 2004; Volume 1, pp. 663–673. [Google Scholar]
- Cozijn, H.; Uittenbogaard, R.; Brake, E. Heave, roll and pitch damping of a deepwater CALM buoy with a skirt. In Proceedings of the 15th International Offshore and Polar Engineering Conference, Seoul, Korea, 19–24 June 2005; pp. 338–395. [Google Scholar]
- Ryu, S.; Duggal, A.S.; Heyl, C.N.; Liu, Y. Prediction of deepwater oil offloading buoy response and experimental validation. Int. J. Offshore Polar Eng. 2006, 16, 3. [Google Scholar]
- Song, H.; Chang, G.-W.; Hou, T.; Zhang, J. Dynamic analysis of CALM buoy-based steel offloading line system. In Proceedings of the 19th Offshore Symposium, Texas Section of the Society of Naval Architects and Marine Engineers, Houston, TX, USA, 6 February 2014. [Google Scholar]
- Boo, S.Y.; Kim, H.; Shelley, S.A.; Kim, D. Preliminary design and analysis of mooring buoy for an arrayed WEC platform. In Proceedings of the 23rd Offshore Symposium, Texas Section of the Society of Naval Architects and Marine Engineers, Houston, TX, USA, 14 February 2018. [Google Scholar]
- Yin, J.; Guo, S.; Gentine, P.; Sullivan, S.; Gu, L.; He, S.; Chen, J.; Liu, P. Does the hook structure constrain future flood intensification under anthropogenic climate warming? Water Resour. Res. 2021, 57. [Google Scholar] [CrossRef]
- Ko, H.S.; Kim, S.; Bae, Y.H. Study on optimum power take-off torque of an asymmetric wave energy converter in western sea of Jeju Island. Energies 2021, 14, 1449. [Google Scholar] [CrossRef]
- Poguluri, S.K.; Cho, I.-H.; Bae, Y.H. A Study of the hydrodynamic performance of a pitch-type wave energy converter–Rotor. Energies 2019, 12, 842. [Google Scholar] [CrossRef] [Green Version]
- Ha, Y.J.; Park, J.Y.; Shin, S.H.; Bae, Y.H. Evaluation of generating power in low wave height for asymmetric rotor using frequency domain analysis. J. Korean Soc. Mar. Env. Energy 2019, 22, 4–253. (In Korean) [Google Scholar] [CrossRef]
- Park, J.Y.; Nam, B.W.; Shin, S.H.; Park, I.B.; Won, Y.U.; Oh, Y.J.; Chan, R.; Cho, S.J. An experimental study on the wave response of arrayed-buoy wave energy converter changing platform included angle. In Proceedings of the Korean Society of Marine Environment & Safety, Spring Conference, Jeju, Korea, 24 May 2018; pp. 76–81. (In Korean). [Google Scholar]
- Park, J.Y.; Ha, Y.J.; Shin, H.S.; Chan, R. Evaluation of the static stability for the arrayed-buoy wave energy converter under wave and current conditions. In Proceedings of the Korean Society of Marine Environment & Energy, Fall Conference, Busan, Korea, 15 October 2019; pp. 15–20. (In Korean). [Google Scholar]
- American Petroleum Institute (API). API RP 2SK: Recommended Practice for Design and Analysis of Stationkeeping Systems for Floating Structures, 2nd ed.; API: Washington, DC, USA, 2005. [Google Scholar]
- American Petroleum Institute (API). API RP 2SM: Design, Manufacture, Installation, and Maintenance of Synthetic Fiber Ropes for Offshore Mooring, 2nd ed.; API: Washington, DC, USA, 2014. [Google Scholar]
- American Bureau of Shipping (ABS). ABS FPI: Rules for Building and Classing Floating Production Installations; American Bureau of Shipping: Houston, TX, USA, 2014. [Google Scholar]
- American Bureau of Shipping (ABS). ABS Guidance: ABS Guidance Note on the Application of Fiber Rope for Offshore Mooring; American Bureau of Shipping: Houston, TX, USA, 2011. [Google Scholar]
- American Bureau of Shipping (ABS). ABS SPM: ABS Rules for Building and Classing Single Point Moorings; American Bureau of Shipping: Houston, TX, USA, 2014. [Google Scholar]
- OrcaFlex—Dynamic Analysis Software for Offshore Marine Systems. Available online: https://www.orcina.com/orcaflex/ (accessed on 14 July 2021).
- Hsu, W.T. Dynamic Modeling and Extreme Tension Analysis of Mooring System for a Floating Offshore Wind Turbine. Ph.D. Thesis, University of Maine, Orono, ME, USA, 2017. [Google Scholar]
- Harnois, V.; Thies, P.R.; Johanning, L. On peak mooring loads and the influence of environmental conditions for marine energy converters. J. Mar. Sci. Eng. 2016, 4, 29. [Google Scholar] [CrossRef] [Green Version]
- Det Norske Veritas. Offshore Standard—Position Mooring; DNV OS-E301; Det Norske Veritas: Høvik, Norway, 2013. [Google Scholar]
Figure 1.
Layout of arrayed WEC platform and mooring buoy system configurations.

Figure 2.
Mooring buoy hull options: (a) option A; (b) option B.

Figure 3.
Arrayed WEC platform configurations: (a) power production configuration with a side hull section angle of 150 deg. during the operating sea states; (b) storm sea configuration with a side hull section angle of 90 deg.
Figure 3.
Arrayed WEC platform configurations: (a) power production configuration with a side hull section angle of 150 deg. during the operating sea states; (b) storm sea configuration with a side hull section angle of 90 deg.

Figure 4.
Numerical modeling: (a) coordinate system and heading definition; (b) perspective view of a numerical model for a coupled mooring analysis.
Figure 4.
Numerical modeling: (a) coordinate system and heading definition; (b) perspective view of a numerical model for a coupled mooring analysis.

Figure 5.
Mooring buoy restoring force curves in surge and sway directions.

Figure 6.
Mooring buoy decay time histories after the buoy system viscous damping, calibrated with the wave basin test results: (a) surge; (b) heave; (c) roll; and (d) pitch.
Figure 6.
Mooring buoy decay time histories after the buoy system viscous damping, calibrated with the wave basin test results: (a) surge; (b) heave; (c) roll; and (d) pitch.

Figure 7.
Mooring buoy motion and mooring line ML5 tension RAOs from white noise waves under a heading of 0 deg. for the uncoupled and coupled cases: (a) surge; (b) heave; (c) pitch; and (d) tension of ML5.
Figure 7.
Mooring buoy motion and mooring line ML5 tension RAOs from white noise waves under a heading of 0 deg. for the uncoupled and coupled cases: (a) surge; (b) heave; (c) pitch; and (d) tension of ML5.

Figure 8.
Mooring buoy motions for the uncoupled and coupled cases for 50 yr and heading 0 deg (Whisker = max and min, marker = mean): (a) pretention option A; (b) pretention option B.
Figure 8.
Mooring buoy motions for the uncoupled and coupled cases for 50 yr and heading 0 deg (Whisker = max and min, marker = mean): (a) pretention option A; (b) pretention option B.

Figure 9.
Yaw angle of mooring buoy and turntable: 50 y, heading 0 deg., coupled.

Figure 10.
Watch circles of mooring buoy and WEC platform under heading 0 deg.: (a) 50 y; (b) 100 y.
Figure 10.
Watch circles of mooring buoy and WEC platform under heading 0 deg.: (a) 50 y; (b) 100 y.

Figure 11.
Distance between the mooring buoy and WEC platform: (a) minimum distances for the various headings under the 50 and 100 y storms; (b) definition of distance between two structures.
Figure 11.
Distance between the mooring buoy and WEC platform: (a) minimum distances for the various headings under the 50 and 100 y storms; (b) definition of distance between two structures.

Figure 12.
Spectral densities of mooring buoy motions and hawser tensions for 50 y, heading 0 deg.: (a) buoy surge; (b) buoy heave; (c) buoy pitch; (d) Hawser tensions for coupled case.
Figure 12.
Spectral densities of mooring buoy motions and hawser tensions for 50 y, heading 0 deg.: (a) buoy surge; (b) buoy heave; (c) buoy pitch; (d) Hawser tensions for coupled case.

Figure 13.
Buoy mooring line tensions and FoSs for 0 deg. heading: (a) tensions for 50 y; (b) tension FoSs for 50 y; (c) tensions for 100 y; (d) tension FoSs for 100 y.
Figure 13.
Buoy mooring line tensions and FoSs for 0 deg. heading: (a) tensions for 50 y; (b) tension FoSs for 50 y; (c) tensions for 100 y; (d) tension FoSs for 100 y.

Figure 14.
Platform hawser tensions for 50 and 100 y, heading 0 deg.: (a) tensions; (b) tension FoS.
Figure 14.
Platform hawser tensions for 50 and 100 y, heading 0 deg.: (a) tensions; (b) tension FoS.

Figure 15.
Buoy mooring line tension variations due to change of wave seeds for coupled case and heading 0 deg.: (a) 50 y; (b) 100 y.
Figure 15.
Buoy mooring line tension variations due to change of wave seeds for coupled case and heading 0 deg.: (a) 50 y; (b) 100 y.

Figure 16.
Anchor line length on seabed of the mooring buoy under storm seas: (a) 50 y; (b) 100 y.

Figure 17.
Anchor line TDP footprints for 50 y, heading 0 deg.: (a) ML2 slack line; (b) ML5 taut line.
Figure 17.
Anchor line TDP footprints for 50 y, heading 0 deg.: (a) ML2 slack line; (b) ML5 taut line.

Figure 18.
Fatigue bins and mooring line fatigue damages: (a) Condensed fatigue bins of 50; (b) mooring line ML1 fatigue damages per year due to the bins at the fairlead of arc length 0 m.
Figure 18.
Fatigue bins and mooring line fatigue damages: (a) Condensed fatigue bins of 50; (b) mooring line ML1 fatigue damages per year due to the bins at the fairlead of arc length 0 m.

Figure 19.
Mooring fatigue life along the arc length for ML1 to ML6. Arc length 0 m and 500 m indicate the fairlead and anchor point locations, respectively.
Figure 19.
Mooring fatigue life along the arc length for ML1 to ML6. Arc length 0 m and 500 m indicate the fairlead and anchor point locations, respectively.

Figure 20.
Mooring buoy structure global FEA results: (a) shell plating; (b) internal structure; (c) deck and underdeck structure near turntable bearing.
Figure 20.
Mooring buoy structure global FEA results: (a) shell plating; (b) internal structure; (c) deck and underdeck structure near turntable bearing.


Figure 21.
Mooring buoy structure local FEA results: (a) Shell and deck; (b) Internal structure; (c) Mooring brackets; (d) Mooring brackets internal structure.
Figure 21.
Mooring buoy structure local FEA results: (a) Shell and deck; (b) Internal structure; (c) Mooring brackets; (d) Mooring brackets internal structure.


Table 1.
Metocean Conditions.
| Design Conditions | Hs (m) | Tp (s) | Gamma | Current at Surface/Mud (m/s) | Wind (m/s) |
|---|---|---|---|---|---|
| Operating | 2.0 | 6.65 | 2.2 | 0.40/0.34 | 6.0 |
| Extreme, 50 y | 9.72 | 13.98 | 2.2 | 1.07/0.92 | 41.24 |
| Survival, 100 y | 11.32 | 15.10 | 3.0 | 1.14/0.98 | 45.99 |
Table 2.
Mooring line safety factors (WEC platform connected).
| Design Conditions | Mooring Conditions | Platform-Buoy | Analysis Method | FoS |
|---|---|---|---|---|
| extreme, 50 y | intact | connected | dynamic | 1.67 |
| one broken line at equilibrium position | connected | dynamic | 1.25 | |
| one broken line (transient) | connected | dynamic | 1.05 | |
| survival, 100 y | intact | connected | dynamic | 1.05 |
| fatigue | intact | connected | dynamic | 10.0 |
Table 3.
Mooring hawser safety factors (WEC platform connected).
| Design Conditions | Hawser Conditions | Platform-Buoy | Analysis Method | FoS |
|---|---|---|---|---|
| extreme, 50 y | intact | connected | dynamic | 1.67 |
| survival, 100 y | intact | connected | dynamic | 1.05 |
Table 4.
Single point mooring line safety factors (WEC platform unconnected).
| Design Conditions | Mooring Conditions | Platform-Buoy | Analysis Method | FoS |
|---|---|---|---|---|
| survival, 100 y | intact | unconnected | dynamic | 2.5 |
Table 5.
Mooring buoy structure safety factors (Buoy-WEC platform connected).
| Design Conditions | Mooring Conditions | FoS |
|---|---|---|
| extreme, 50 y | intact | 1.67 |
| survival, 100 y | intact | 1.25 |
Table 6.
Weathervaning mooring buoy details.
| Items | Unit | Values |
|---|---|---|
| displacement | tonnes | 462.7 |
| height overall | m | 6 |
| draft | m | 4 |
| hull diameter | m | 12 |
| moonpool diameter | m | 1 |
| skirt diameter | m | 16 |
| center of gravity above keel | m | 2.18 |
Table 7.
Mooring and hawser line properties.
| Items | Unit | Mooring Line | Hawser |
|---|---|---|---|
| type | - | R4 studless | Synthetic rope |
| diameter | mm | 111 | 227 |
| weight in air | kg/m | 246 | 35 |
| MBL | kN | 11856 | 17261 |
| axial stiffness | kN | 10.5×10⁵ | 3.53×10⁵ (1), 4.15×10⁵ (2), 5.39×10⁵ (3) |
| length | m | 500 | 50 |
| no. of lines | - | 6 | 2 |
(1) Cycling between 10 and 30% MBL; (2) cycling between 20 and 30% MBL; (3) cycling between 40 and 50% MBL.
Table 8.
WEC platform particulars.
| Item | Unit | Value |
|---|---|---|
| total power rate | MW | 1.0 |
| displacement | tonnes | 2800 |
| draft | m | 5.8 |
| hull section (fore + sides) length (each) | m | 172.0 |
| platform height | m | 8.8 |
| hull section angle | deg | 150 or 90 |
| number of WECs | - | 20 |
Table 9.
Natural frequency of mooring buoy system for uncoupled case.
| Motions | Model Test (Hz) | Simulation (Hz)/(s) | Difference (%) |
|---|---|---|---|
| surge | 0.0363 | 0.0345/28.98 | −5.0 |
| sway | 0.0367 | 0.0345/28.98 | −5.9 |
| heave | 0.138 | 0.142/7.04 | 2.5 |
| roll | 0.130 | 0.140/7.14 | 8.0 |
| pitch | 0.134 | 0.140/7.14 | 4.0 |
Table 10.
Viscous damping coefficients of mooring buoy system.
| Suge | Sway | Heave | Roll | Pitch |
|---|---|---|---|---|
| kN/(m/s) | kN/(m/s) | kN/(m/s) | kNm/(rad/s) | kNm/(rad/s) |
| 3.9 | 3.8 | 204.9 | 1267.0 | 1285.0 |
Table 11.
Mooring line fatigue life (years).
| ML1 | ML2 | ML3 | ML4 | ML5 | ML6 |
|---|---|---|---|---|---|
| 912 | 1293 | 1210 | 953 | 2182 | 1957 |
Publisher’s Note: MDPI stays neutral with regard to jurisdictional claims in published maps and institutional affiliations. |
© 2021 by the authors. Licensee MDPI, Basel, Switzerland. This article is an open access article distributed under the terms and conditions of the Creative Commons Attribution (CC BY) license (https://creativecommons.org/licenses/by/4.0/).
Share and Cite
MDPI and ACS Style
Boo, S.Y.; Shelley, S.A. Design and Analysis of a Mooring Buoy for a Floating Arrayed WEC Platform. Processes 2021, 9, 1390. https://0-doi-org.brum.beds.ac.uk/10.3390/pr9081390
AMA Style
Boo SY, Shelley SA. Design and Analysis of a Mooring Buoy for a Floating Arrayed WEC Platform. Processes. 2021; 9(8):1390. https://0-doi-org.brum.beds.ac.uk/10.3390/pr9081390
Chicago/Turabian StyleBoo, Sung Youn, and Steffen Allan Shelley. 2021. "Design and Analysis of a Mooring Buoy for a Floating Arrayed WEC Platform" Processes 9, no. 8: 1390. https://0-doi-org.brum.beds.ac.uk/10.3390/pr9081390
Note that from the first issue of 2016, this journal uses article numbers instead of page numbers. See further details here.