
Reactive Chromatography Applied to Ethyl Levulinate Synthesis: A Proof of Concept


Chemical Science Department, University of Naples Federico II, Via Cinthia, 80126 Naples, Italy
*
Author to whom correspondence should be addressed.
Processes 2021, 9(9), 1684; https://0-doi-org.brum.beds.ac.uk/10.3390/pr9091684
Submission received: 23 August 2021
/
Revised: 13 September 2021
/
Accepted: 15 September 2021
/
Published: 20 September 2021
(This article belongs to the Special Issue Process Intensification in Chemical Reaction Engineering)
Abstract
:Levulinic acid (LA) has been highlighted as one of the most promising platform chemicals, providing a wide range of possible derivatizations to value-added chemicals as the ethyl levulinate obtained through an acid catalyzed esterification reaction with ethanol that has found application in the bio-fuel market. Being a reversible reaction, the main drawback is the production of water that does not allow full conversion of levulinic acid. The aim of this work was to prove that the chromatographic reactor technology, in which the solid material of the packed bed acts both as stationary phase and catalyst, is surely a valid option to overcome such an issue by overcoming the thermodynamic equilibrium. The experiments were conducted in a fixed-bed chromatographic reactor, packed with Dowex 50WX-8 as ion exchange resin. Different operational conditions were varied (e.g., temperature and flow rate), pulsing levulinic acid to the ethanol stream, to investigate the main effects on the final conversion and separation efficiency of the system. The effects were described qualitatively, demonstrating that working at sufficiently low flow rates, LA was completely converted, while at moderate flow rates, only a partial conversion was achieved. The system worked properly even at room temperature (303 K), where LA was completely converted, an encouraging result as esterification reactions are normally performed at higher temperatures.
1. Introduction
Levulinic acid (LA), also known as 4-oxopentanoic acid or γ-ketovaleric acid, is a highly versatile molecule that can be obtained from lignocellulosic biomass. The great interest around LA is due to its structure, composed of two high functionality groups (keto- and carboxylic- group) that furnish a wide range of possible derivatizations to value-added chemicals [1]. For all of these reasons, LA has been highlighted as one of the most promising platform chemicals, after screening approximately 300 substances [2]. Among the large number of utilizable chemicals derived from LA, levulinate esters potentially have the largest markets, especially from a biofuel perspective. Ethyl levulinate (EL) is gaining attention since it provides a better blending option with fuel, likewise other higher alcohols (i.e., butyl levulinate). The advantage of EL is due to the use of ethanol (EtOH) as the reactant in excess used in the esterification reaction, which is traditionally obtained from renewable resources with lower total costs, such as methanol and butanol [3]. Other applications of EL include its use as an additive for perfume formulations, as a plasticizer in biodegradable plastic polymers, and as an additive in de-icer formulations [4]. Homogeneous catalysts, such as sulfuric, chloridric, and phosphoric acid, are historically employed, but there are some drawbacks about the separation and recovery from the reaction medium [5,6,7]. Hence, heterogeneous catalysts are now the favorite [8,9,10]. Not long ago, Fernandes et al. [11] published an interesting paper in which the performance of zeolites, sulphated metal oxides, and a commercial cationic exchange resin, amberlyst-15, were compared, finding that ion exchange resins are surely good candidates. Very recently, Amberlyst-15 and Amberlite IR-120 were proven to be very active heterogeneous catalysts, showing no signs of deactivation after 100 h of reuse [12,13].
When scaling up the process from a batch to continuous operation, packed bed was demonstrated to be a reasonable choice [13]. The main drawback of the mentioned technology in using packed bed systems is the low rate of conversion due to the formation of water, which keeps the system at the thermodynamical conversion degree.
Different technologies could be used to overcome the mentioned problem, namely reactive chromatography (RC) and reactive distillation (RD). The main difference between RC and RD is based on the principle of separation. RC is an adsorptive separation process, where the components are separated based on their different affinities towards the adsorbent, while RD exploits the difference in boiling points of the components of the reaction. In the esterification reaction of levulinic acid with ethanol, water cannot be removed by RD as it is characterized by a higher boiling point than ethyl levulinate but lower than levulinic acid. For this reason, it is not possible to conduct this type of reaction in RD mode.
Reactive chromatography could solve this issue, as it is an operation unit that combines chemical reaction and chromatographic separation, allowing the intensification of the esterification process. In the field of process intensification, chromatographic reactors have gained more and more attention for their advantages related to a conversion increase through equilibrium shift and the reduced by-product formation. Indeed, the obtained reaction product is separated through the adsorption on the resin and in accordance with the adsorptive separation process principle, the difference in affinity between the sorbent and reaction products is the main reason for efficient separation [14].
Good performance shown by Amberlyst-15 as a catalyst, along with the adsorption capacity of the resin, suggest that LA esterification with ethanol could be conducted in a chromatographic reactor in which there is potential for catalysis and separation to be carried out in a single reactor. As is well known, cation exchange resins find employment as packing materials for ion exchange chromatography columns, in which the negatively charged analytes interact with the positive portion of the stationary phase and get separated depending on how strong the interaction is.
To support this, the studies of Mazzotti [15], Rodrigues [16], Vu et al. [17], and Russo et al. [18] used ion exchange resins for reactive chromatography experiments, conducting reactions such as acetic acid esterification and acetals synthesis, ethyl lactate production and xylene isomerization/separation, or esters hydrolysis.
Since Dowex 50WX-8 showed a good performance in similar systems, and as no applications of this concept appeared in the literature for the ethyl levulinate synthesis from LA, this work aimed to fill this gap, aiming to investigate how the different operation conditions affect the final conversion of the system.
2. Materials and Methods
2.1. Materials
The following reagents were procured from well-known companies and used without any further purification: levulinic acid (99 wt%) and ethyl levulinate (99 wt%) were supplied by Sigma Aldrich, ethanol (99 wt%) supplied by Carlo Erba Reagents. Dowex 50WX-8 ion exchange resin (by Acros Organics) was used as a solid acid catalyst. The main properties of the resin are reported in Table 1 and were taken from the material data sheet of the catalyst itself.
2.2. Methods
2.2.1. Chromatographic Reactor Setup
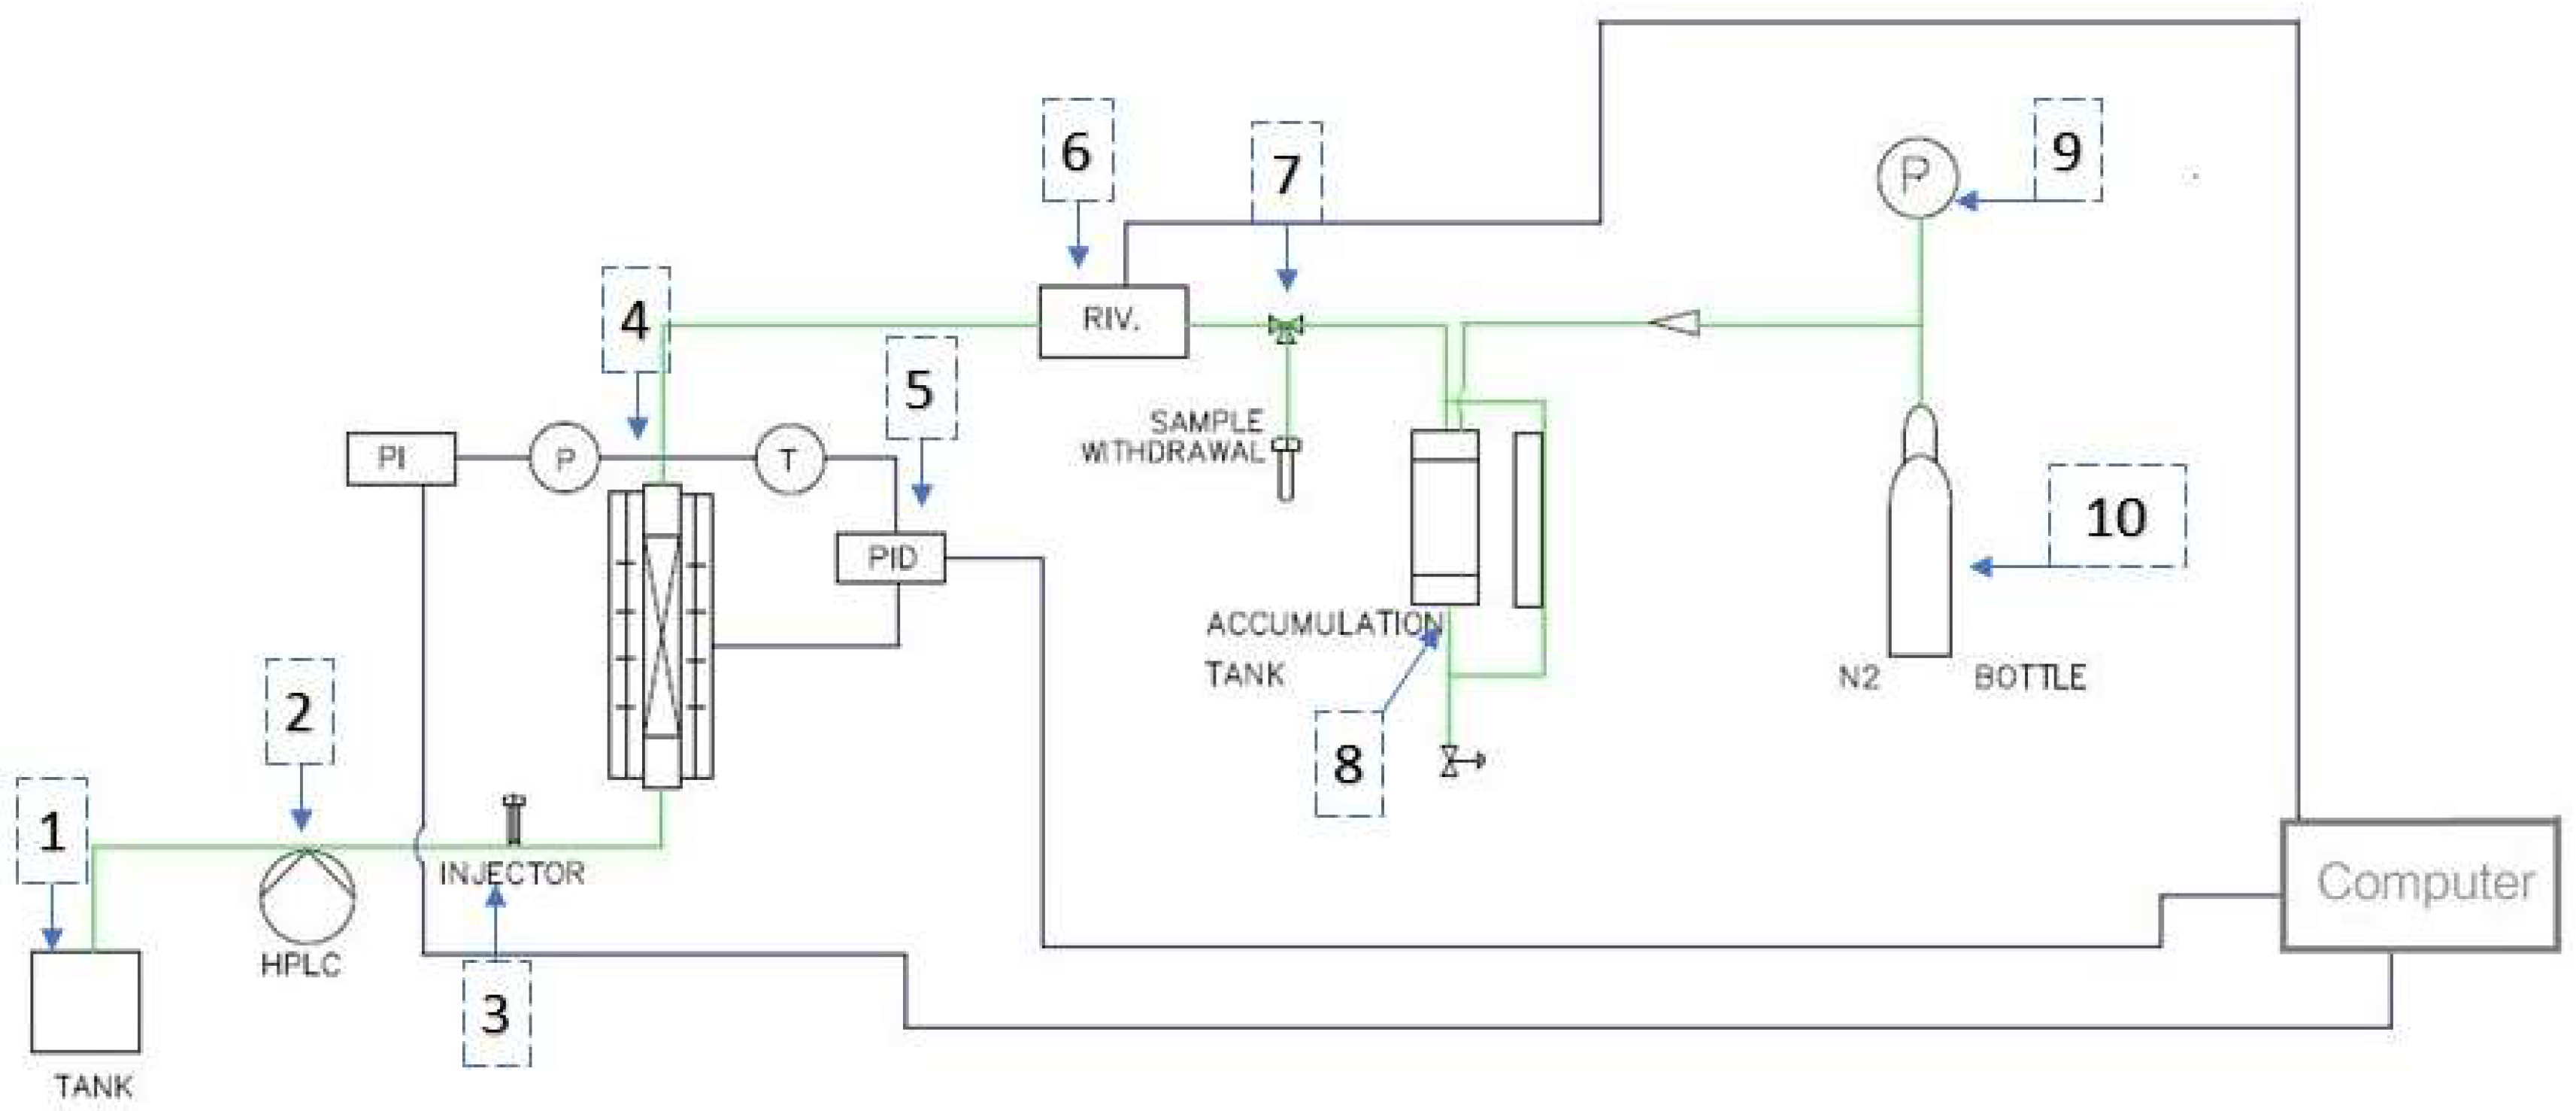
The setup for the chromatographic reactor is shown in Figure 1. Ethanol is stored in the tank (1) and pumped into the system by an HPLC pump (2) that allows for flow rate settings and pressure drop readings. The ethanol flux passes through a Rheodyne injector valve (3), where an injector combined with a 20 μL loop pulses the other reactant (LA) into the ethanol stream. The stream is then sent to the chromatographic reactor (4), consisting of a steel tube of 0.3 m length and 0.0078 m diameter jacketed with a heater regulated by a PID system (5). An online detector (Reach Device RD4, (6)) reveals the presence of solutes in the ethanol flux through UV (250 nm and 280 nm), IR, and conductivity detectors. A pin valve (7) is placed after the detector, for samples withdrawal. The accumulation tank (8) is provided with a pin valve for decumulation of the liquid stream. The pressure in the chromatographic reactor system is applied through a reductor (9) linked to a N2 bottle (10). Packing of the tubular reactor (supplied by Phenomenex) was obtained after drying the resin and calculating the amount needed, considering the degree of swelling of the catalyst particle. About 6.5 g of Dowex 50WX8 was necessary to fill the tubular reactor. Ethanol was then streamed continuously for 6 h with a flow of 1.0 cm3/min into the reactor to let the resin swell and pack the tube completely.
The performance of the chromatographic reactor was evaluated with tests in which levulinic acid was pulsed into a stream of ethanol and data were collected from the online detector. To determine if the resin successfully separated the components of the system, tests pulsing EL were conducted and a comparison between the UV (250 nm) spectra was made. The summary of the experimental conditions is illustrated in Table 2.
Each experiment was repeated three times to estimate the error on the experiment reproducibility. The average value was about 2.5% and the peaks shown in the next section were obtained as average values, for each test performed.
2.2.2. Take-up Test
When resins like Dowex 50WX8 are put in contact with reactants/reagents, they are subjected to a process known as take-up. This occurs because when resins adsorb solvents, especially polar ones like water (H2O) or alcohols, there is a strong osmotic pressure difference between the liquid inside the pores and the solvent bulk. To decrease this difference, the resin takes up more solvent to dilute ion concentration into its pores.
Take-up tests were prepared to investigate how our reactive system affected the catalyst. Furthermore, evaluation of the swelling phenomenon is fundamental when a resin is to be used as a packing material for a reactor to avoid complete plugging of the system.
Since both the reagents (LA, EtOH) and the products (EL, water) are simultaneously in contact with the resin during the esterification process, 10 cm3 of binary solutions of all the chemical species present in the system (LA/EtOH, LA/EL, LA/H2O, EtOH/EL, EtOH/H2O, EL/H2O) with different molar fractions (0.8, 0.5, 0.2) were prepared and put in contact with ~1.5 g of dried Dowex 50WX8. The solutions were mixed from time to time with a rod to improve contact between the chemical species and the resin. The resin mass was weighed before and after 45 min of every take-up test. Known the density of the binary mixes, the value of the swelling phenomenon was calculated as:
where α is the swelling percentage and and are the volumes of the swelled and dry resin, respectively.
3. Results and Discussion
3.1. Dowex 50WX8 Take-up Tests
Table 3 displays the results of all the take-up tests that were completed. The value of α was then calculated as the average value of all the swelling coefficients determined during the take-up tests, with this being α = 51.1 ± 5.6%.
The resin volume in our reactive system was estimated to increase up to 1.5 times its original value.
As revealed, EL showed a lower take-up, probably due to both the relatively bigger dimensions and hindrance compared to the other molecules, which led to lower access to the catalyst pores and a lower affinity to the resin structure. The reported data will surely be of utmost importance when quantitatively modeling the reactive chromatography results.
3.2. Reactive Chromatography Results
Effect of the Stream Flow Rate
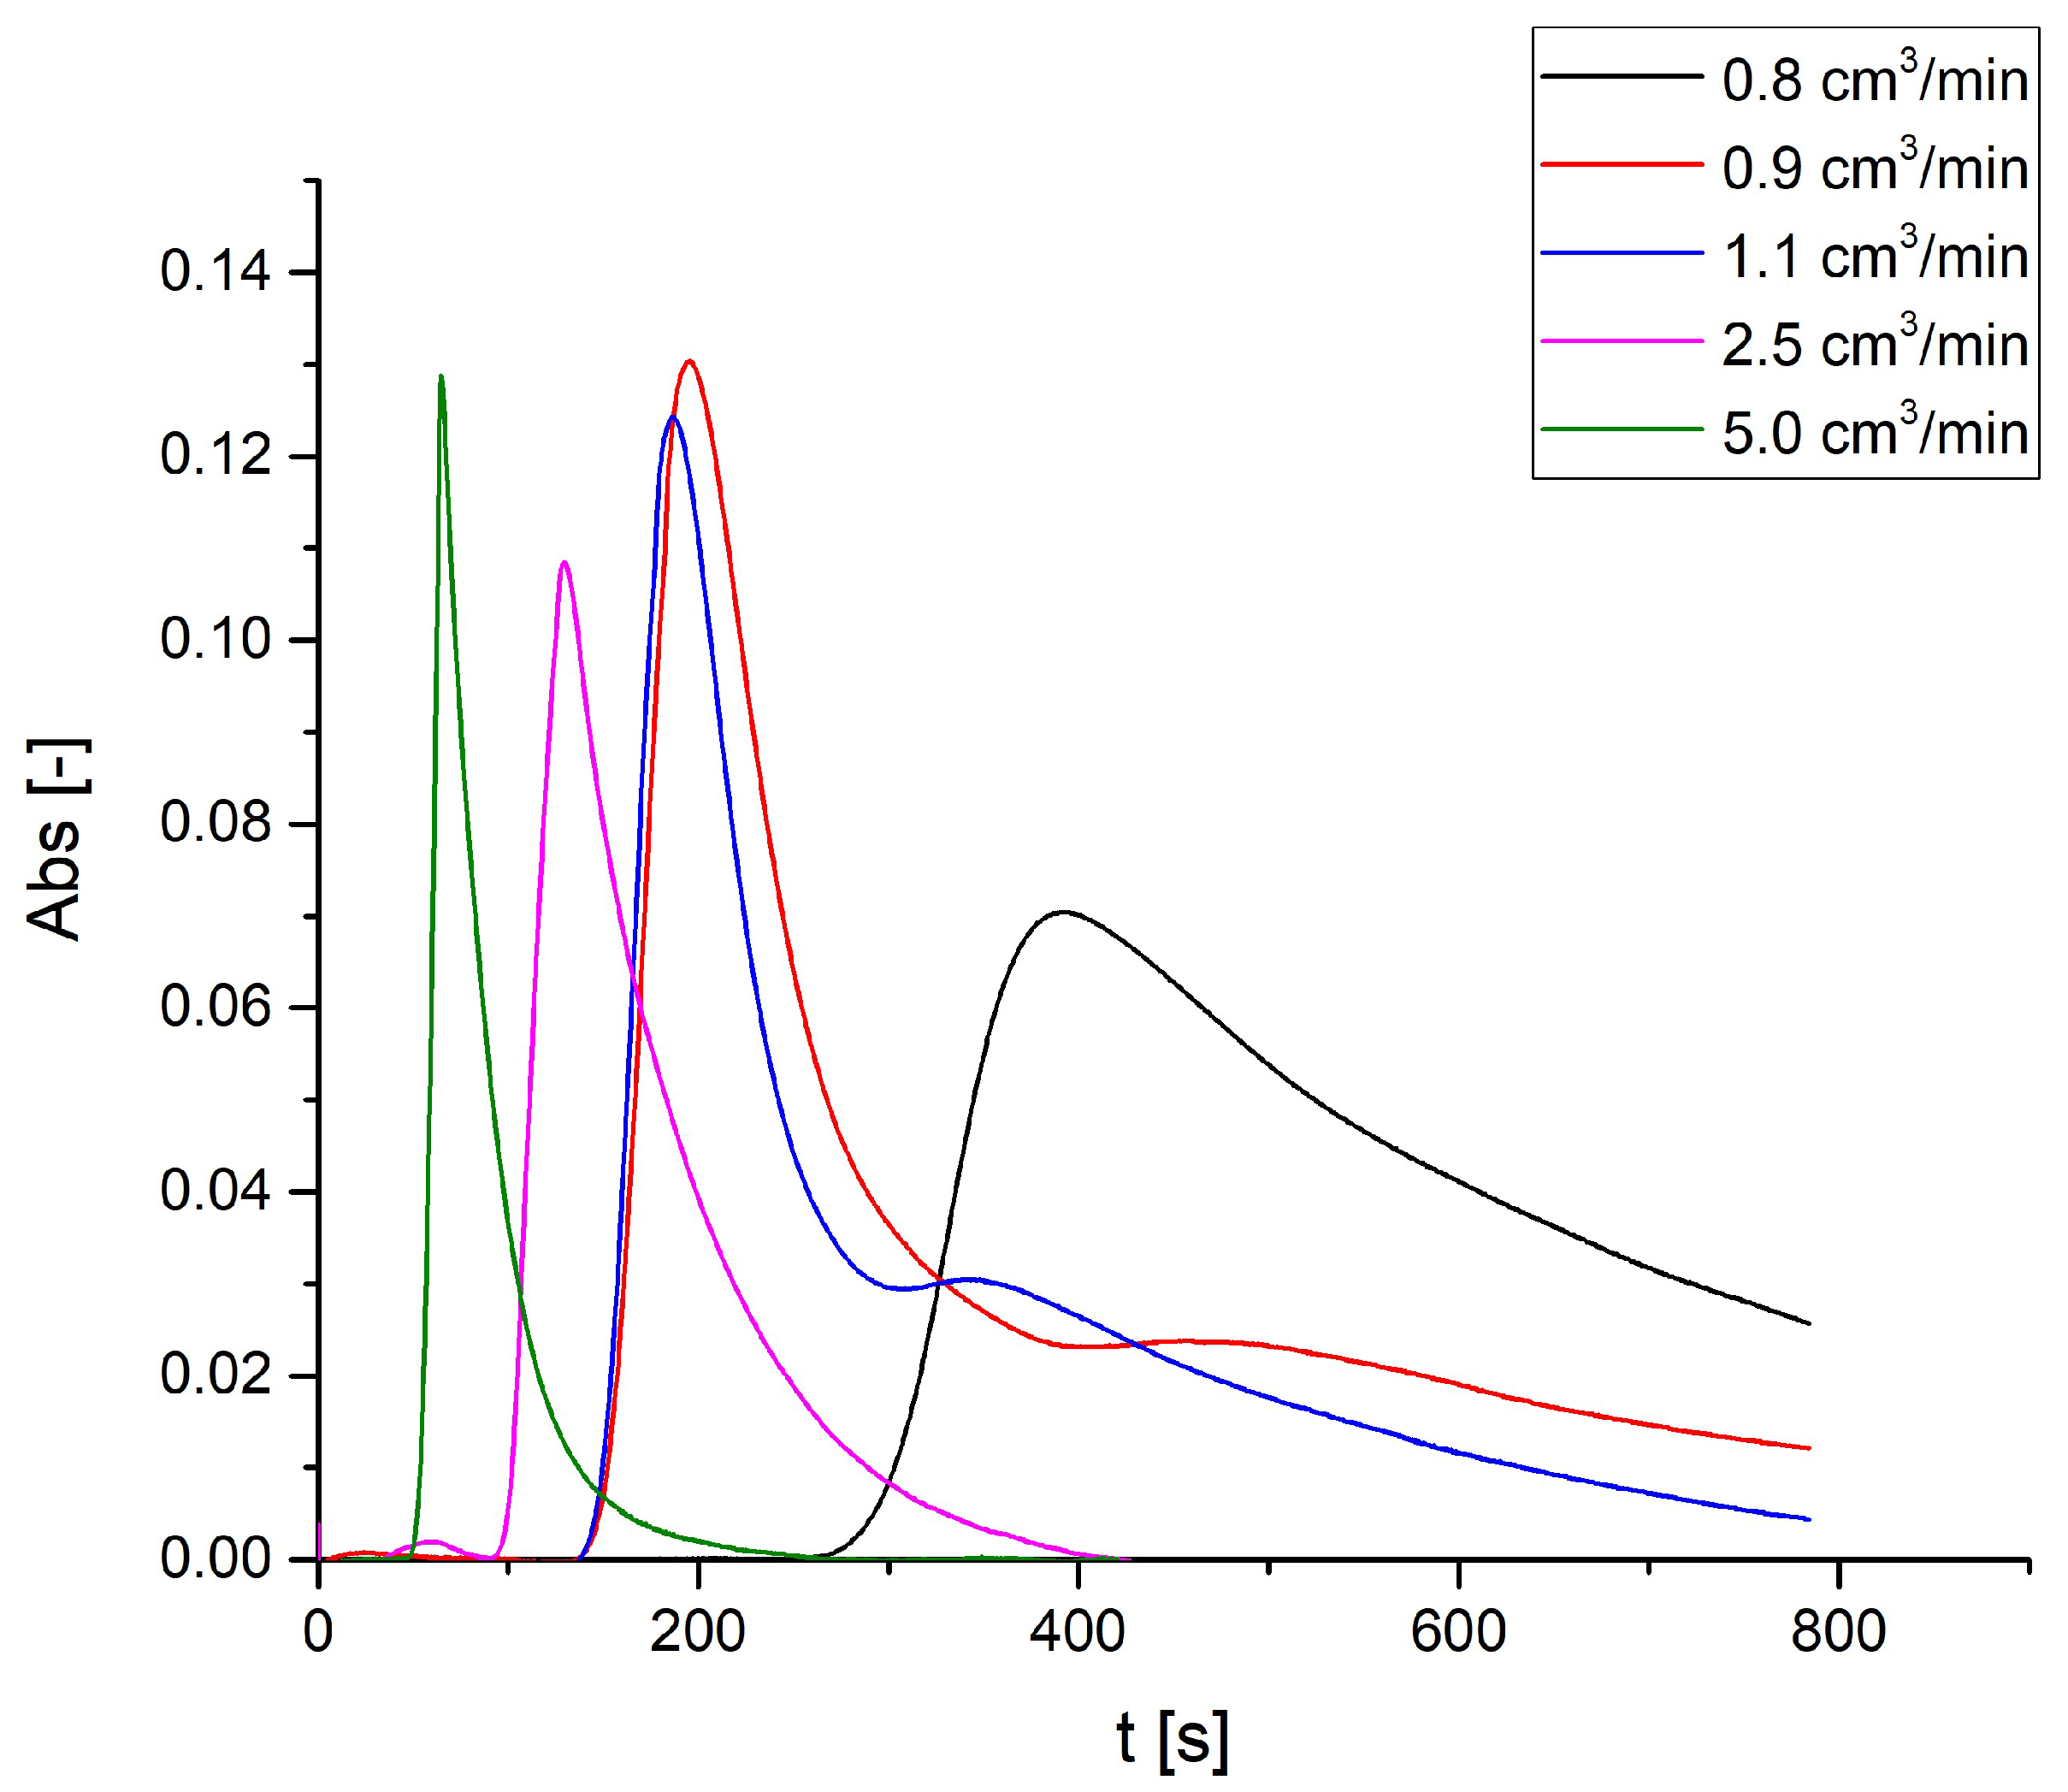
The first set of experiments consisted of pulsing LA at 303 K at different flow rates. The UV spectra results are reported in Figure 2.
As shown in the figure, the LA retention time decreased when the flow rate increased. This is what we expected because at higher flow rates, the time required to flow through the reactor is lower. In more detail, looking at the curve shape at the intermediate flow rate (0.9 and 1.1 cm3/min tests), the formation of a second peak can be noted. Instead, the test at 0.8 cm3/min flow rate shows a single, broad peak detected at a retention time similar to the second peak shown in the two tests at intermediate flow rates.
An explanation of this behavior can be ascribed to the time of interaction of the reagents with the resin that makes the reaction happen.
At lower flow rates, 0.8 cm3/min, the entire quantity of LA pulsed into the reactor had enough time to interact with Dowex 50WX8 and it was totally converted, resulting in a single EL peak at the detection point.
At intermediate flow rate values, LA was only partially converted, and both the carboxylic acid and the ester were detected by the UV analyzer with detection times that were in line with their affinity values.
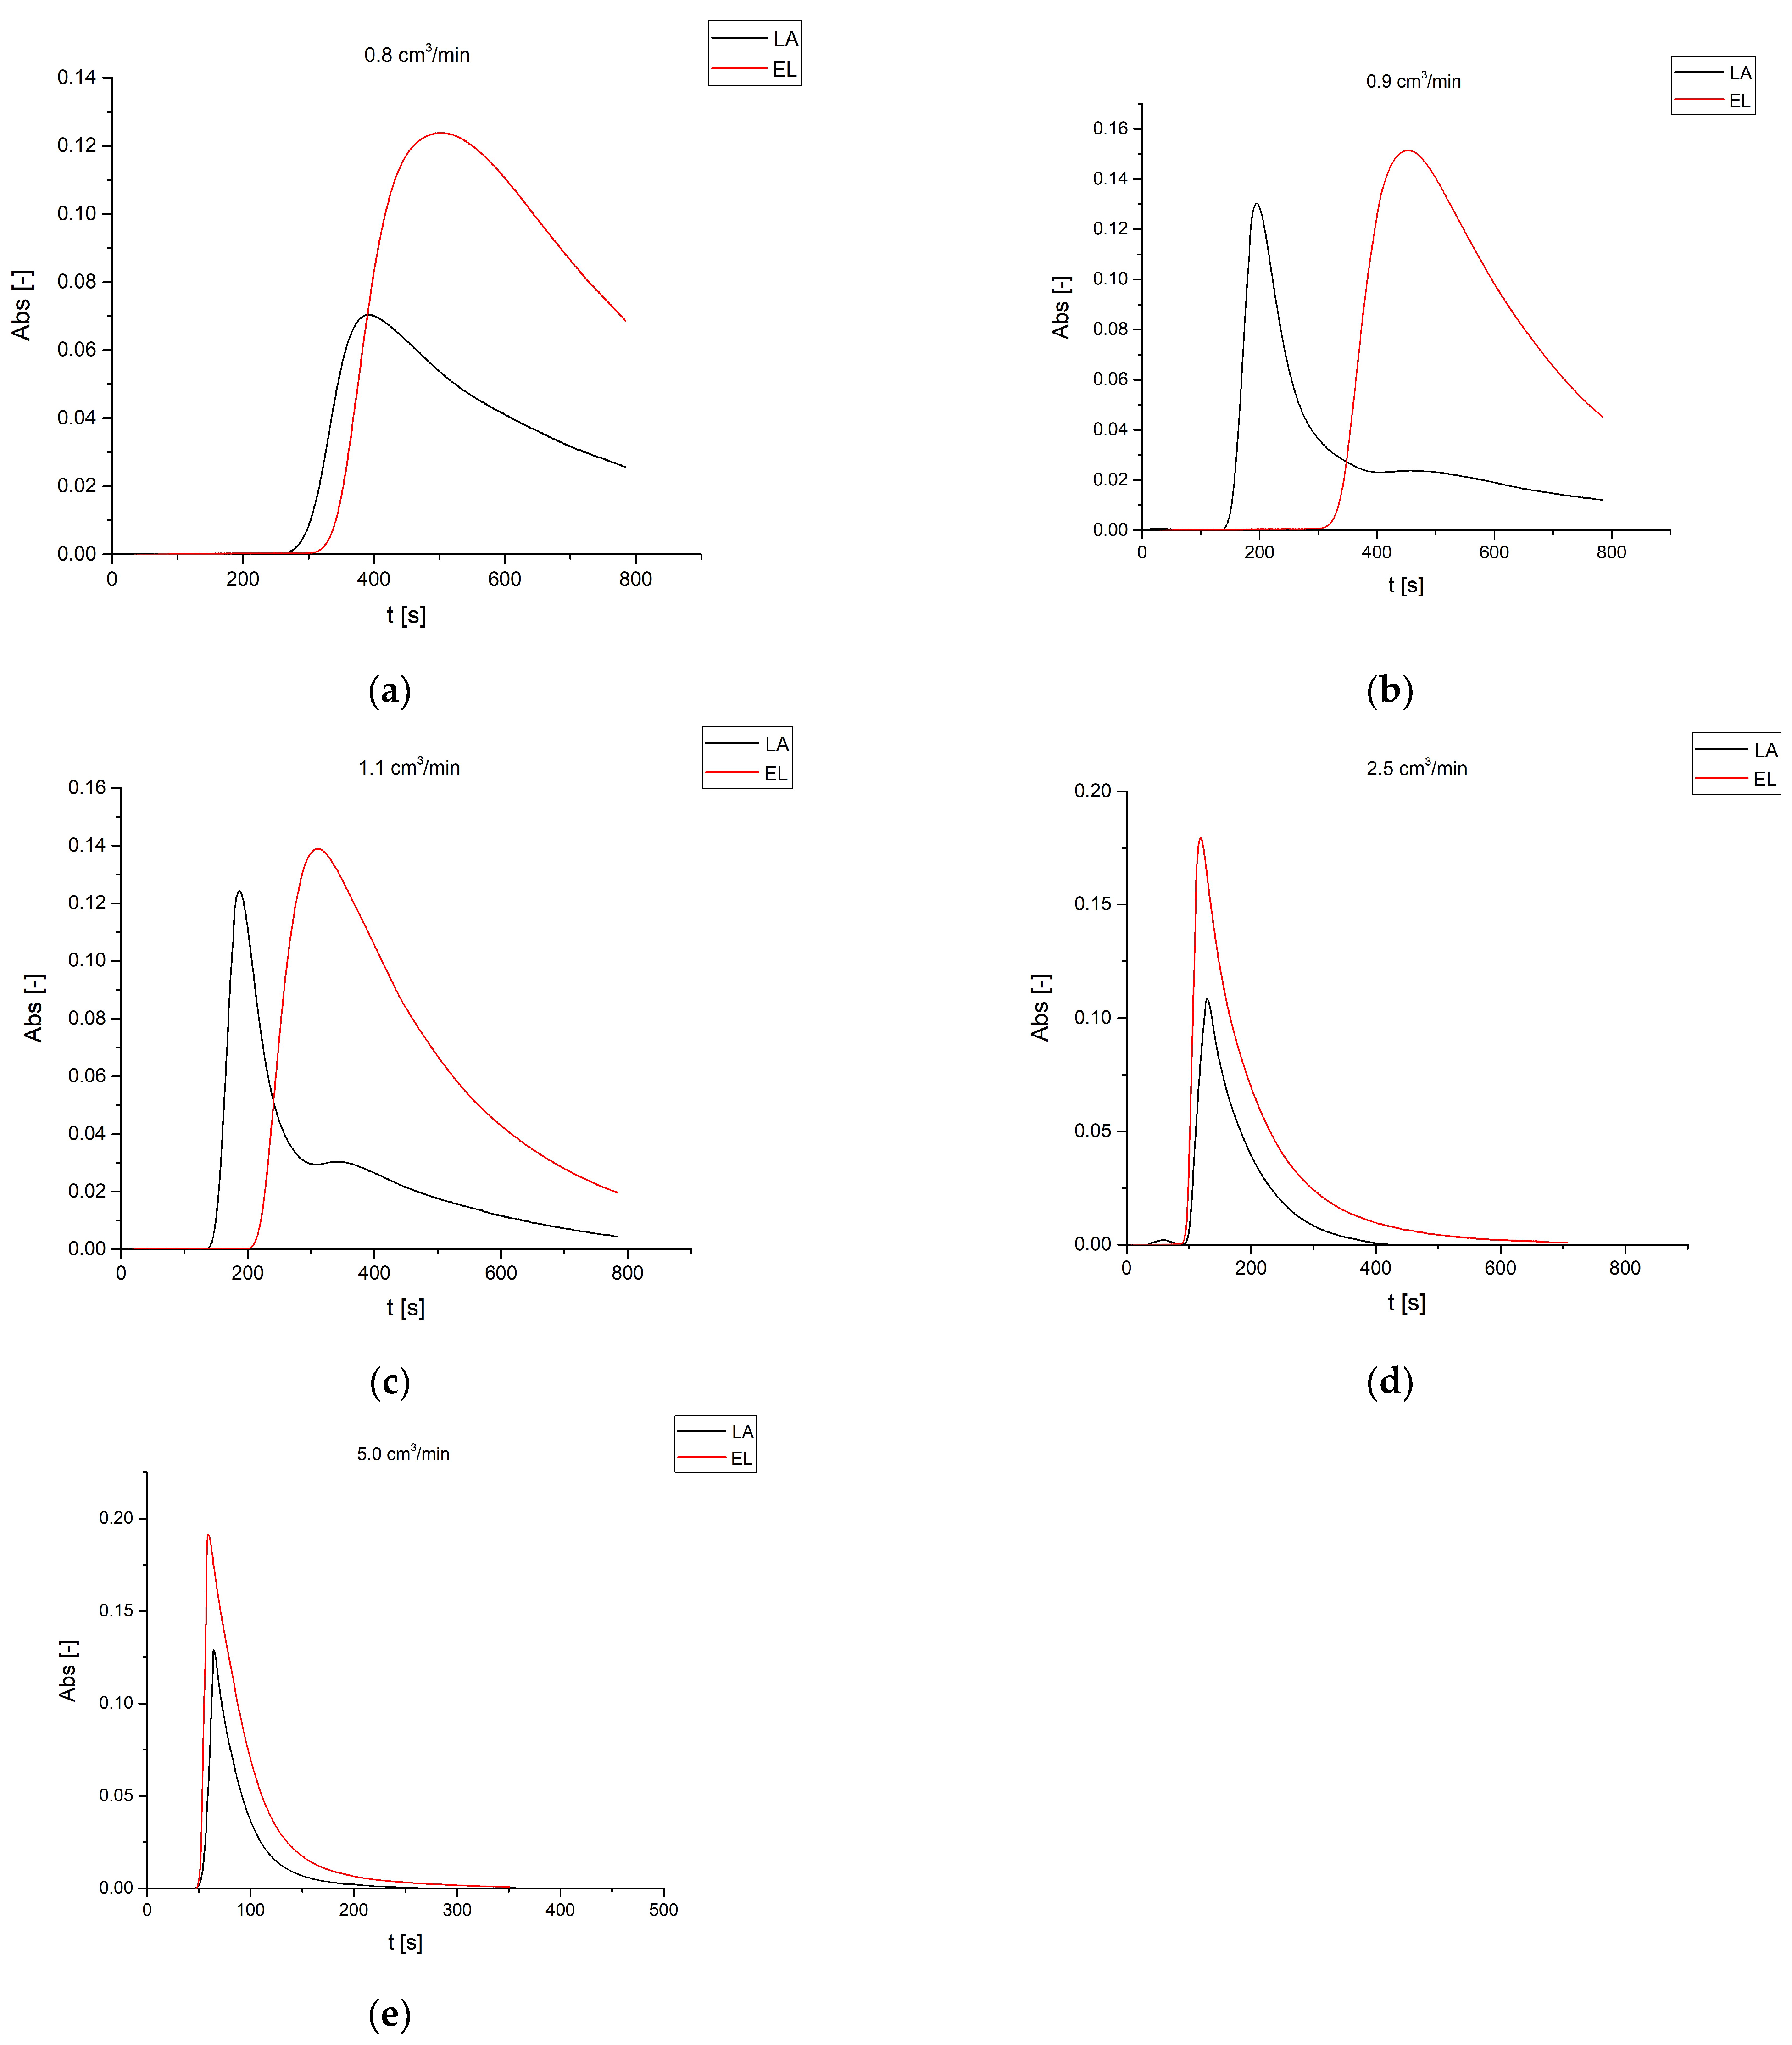
To confirm this hypothesis, a solution of EL 6 M in ethanol was pulsed into the chromatographic reactor at the same operative conditions and the UV spectra were compared with the corresponding LA spectra.
At high flow rates, like 5.0 and 2.5 cm3/min, the LA did not have the time to interact with the resin and, thus, the UV analyzer only detected one peak and the chemical species exited the reactor at the same time. Thus, Dowex 50WX8 performed a good separation of the product and the reagent, allowing theoretical recovery of the pure product from the reactor outlet.
The UV spectra in Figure 3 confirm the previous hypothesis: if the fluid flow is slow enough, LA can be converted to EL completely (0.8 cm3/min), otherwise only a fraction of it will react with ethanol forming EL.
To confirm this, through peak deconvolution, it was also possible to approximately determine LA conversion to EL at intermediate flow rates. LA conversion values were 58% and 87% for the tests with 1.1 and 0.9 cm3/min flow rate, respectively.
3.3. Effect of the Reactor Temperature
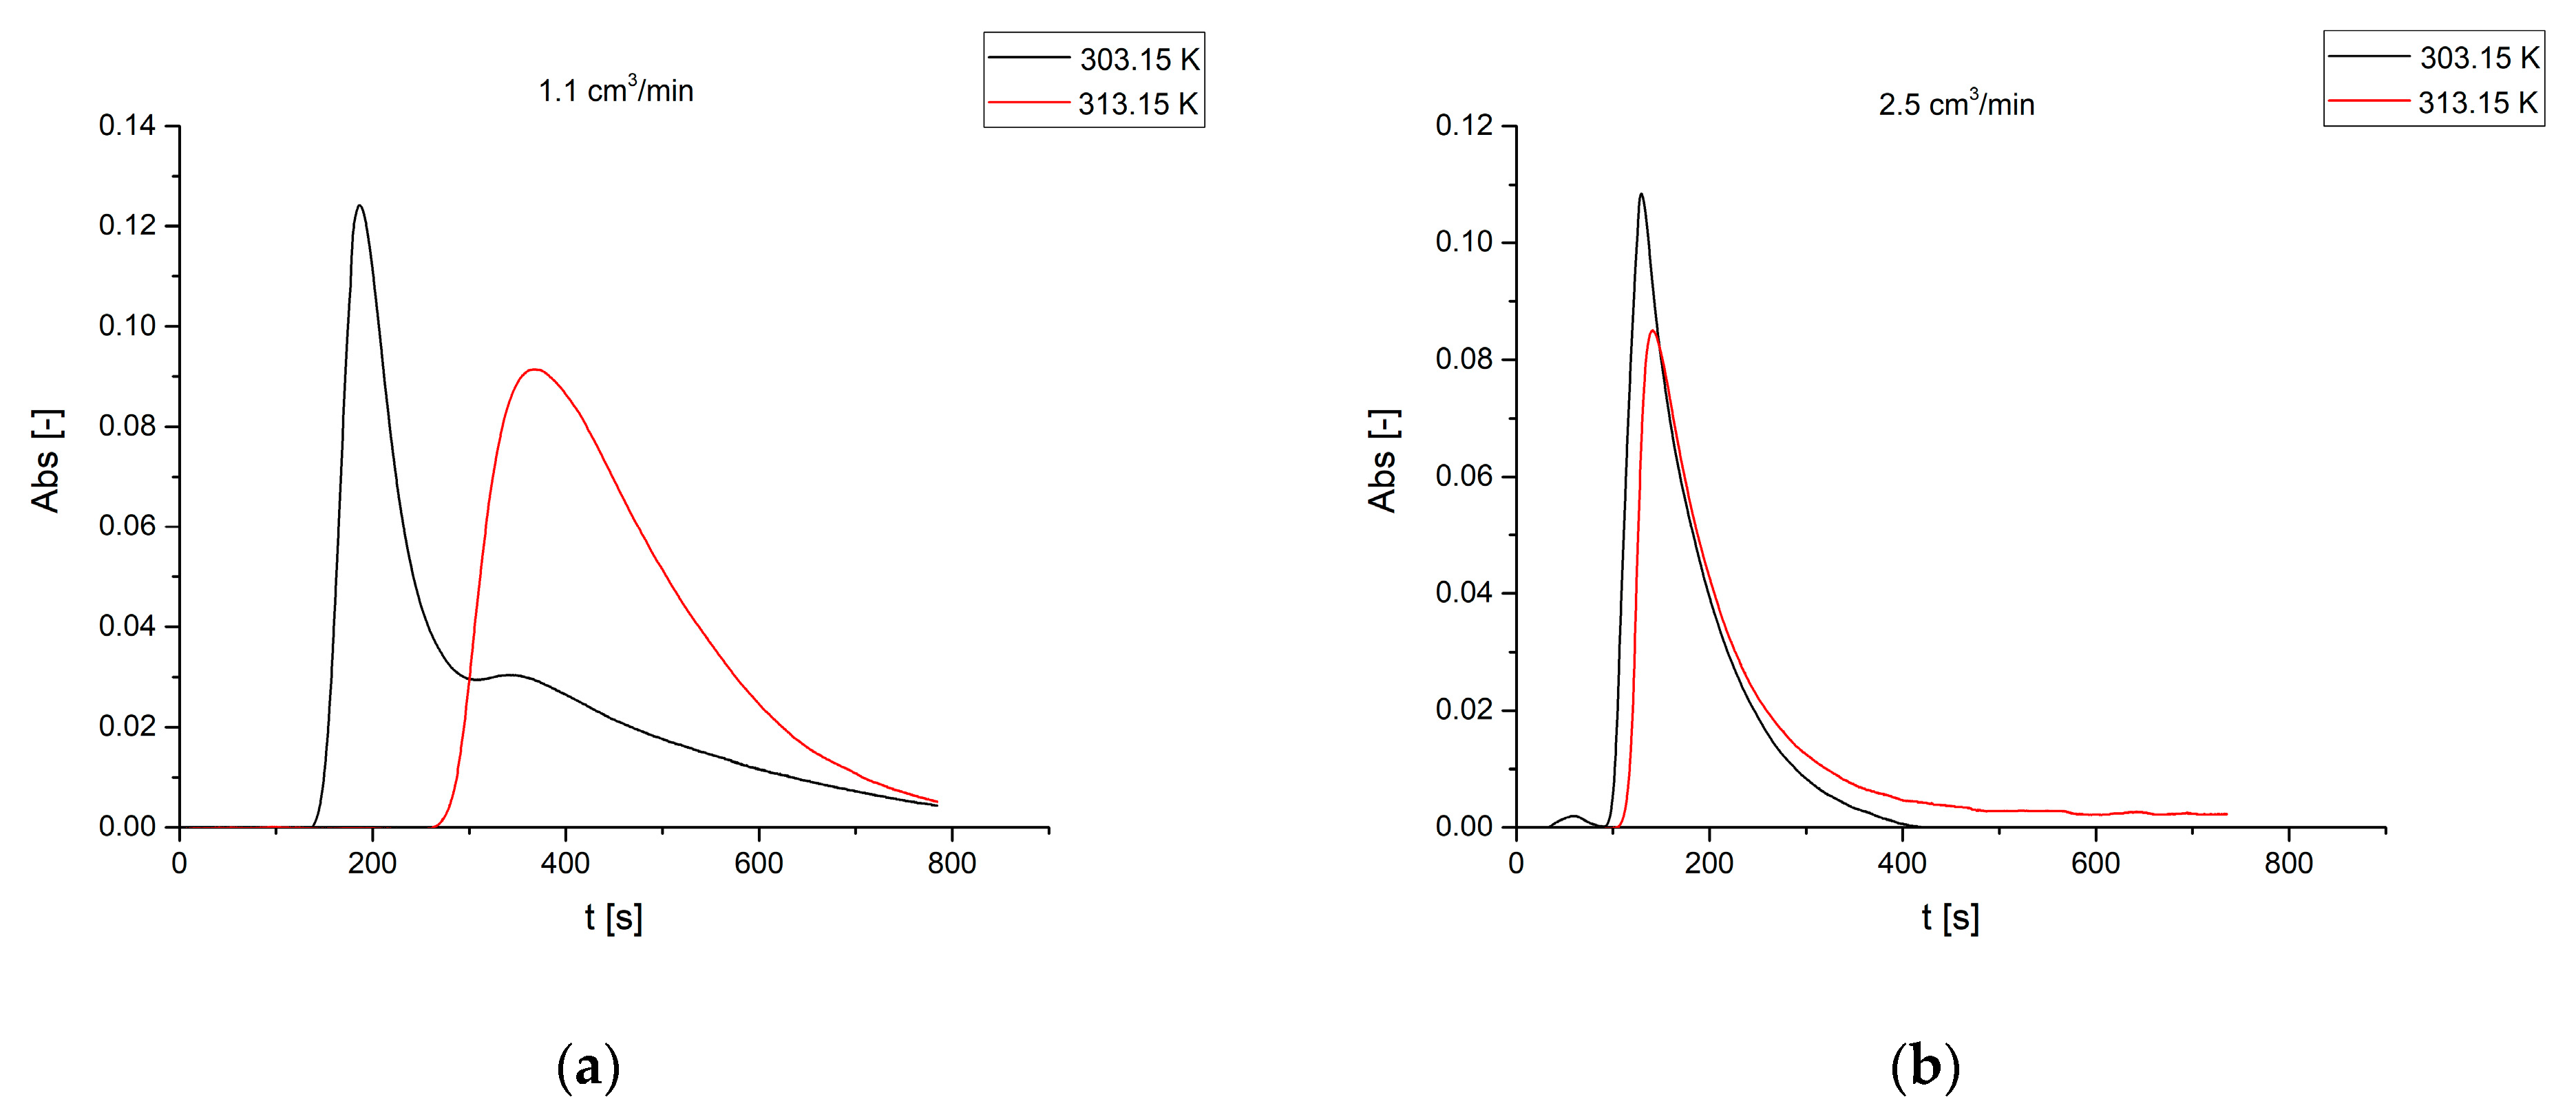
The effect of temperature was evaluated performing tests at 313 K, in particular, data were collected from pulsing LA at 1.1 and 2.5 cm3/min flow rates. In Figure 4, a comparison of the experiments at the same flow rates and different temperatures are shown.
At 2.5 cm3/min flow rate, as expected, the rise in temperature did not make a significant difference since LA had no time to interact with the resin. At 1.1 cm3/min flow rate, it can be noted that the conversion to EL was complete. The reaction kinetics were positively affected by higher temperatures, obtaining complete conversion of the carboxylic acid at higher flow rates.
Since we obtained two opposite outcomes (0 and 100% conversion), further tests were conducted to pinpoint the flow rate values that would give partial LA conversion at the same temperature, so that it could be verified that good separation would occur.
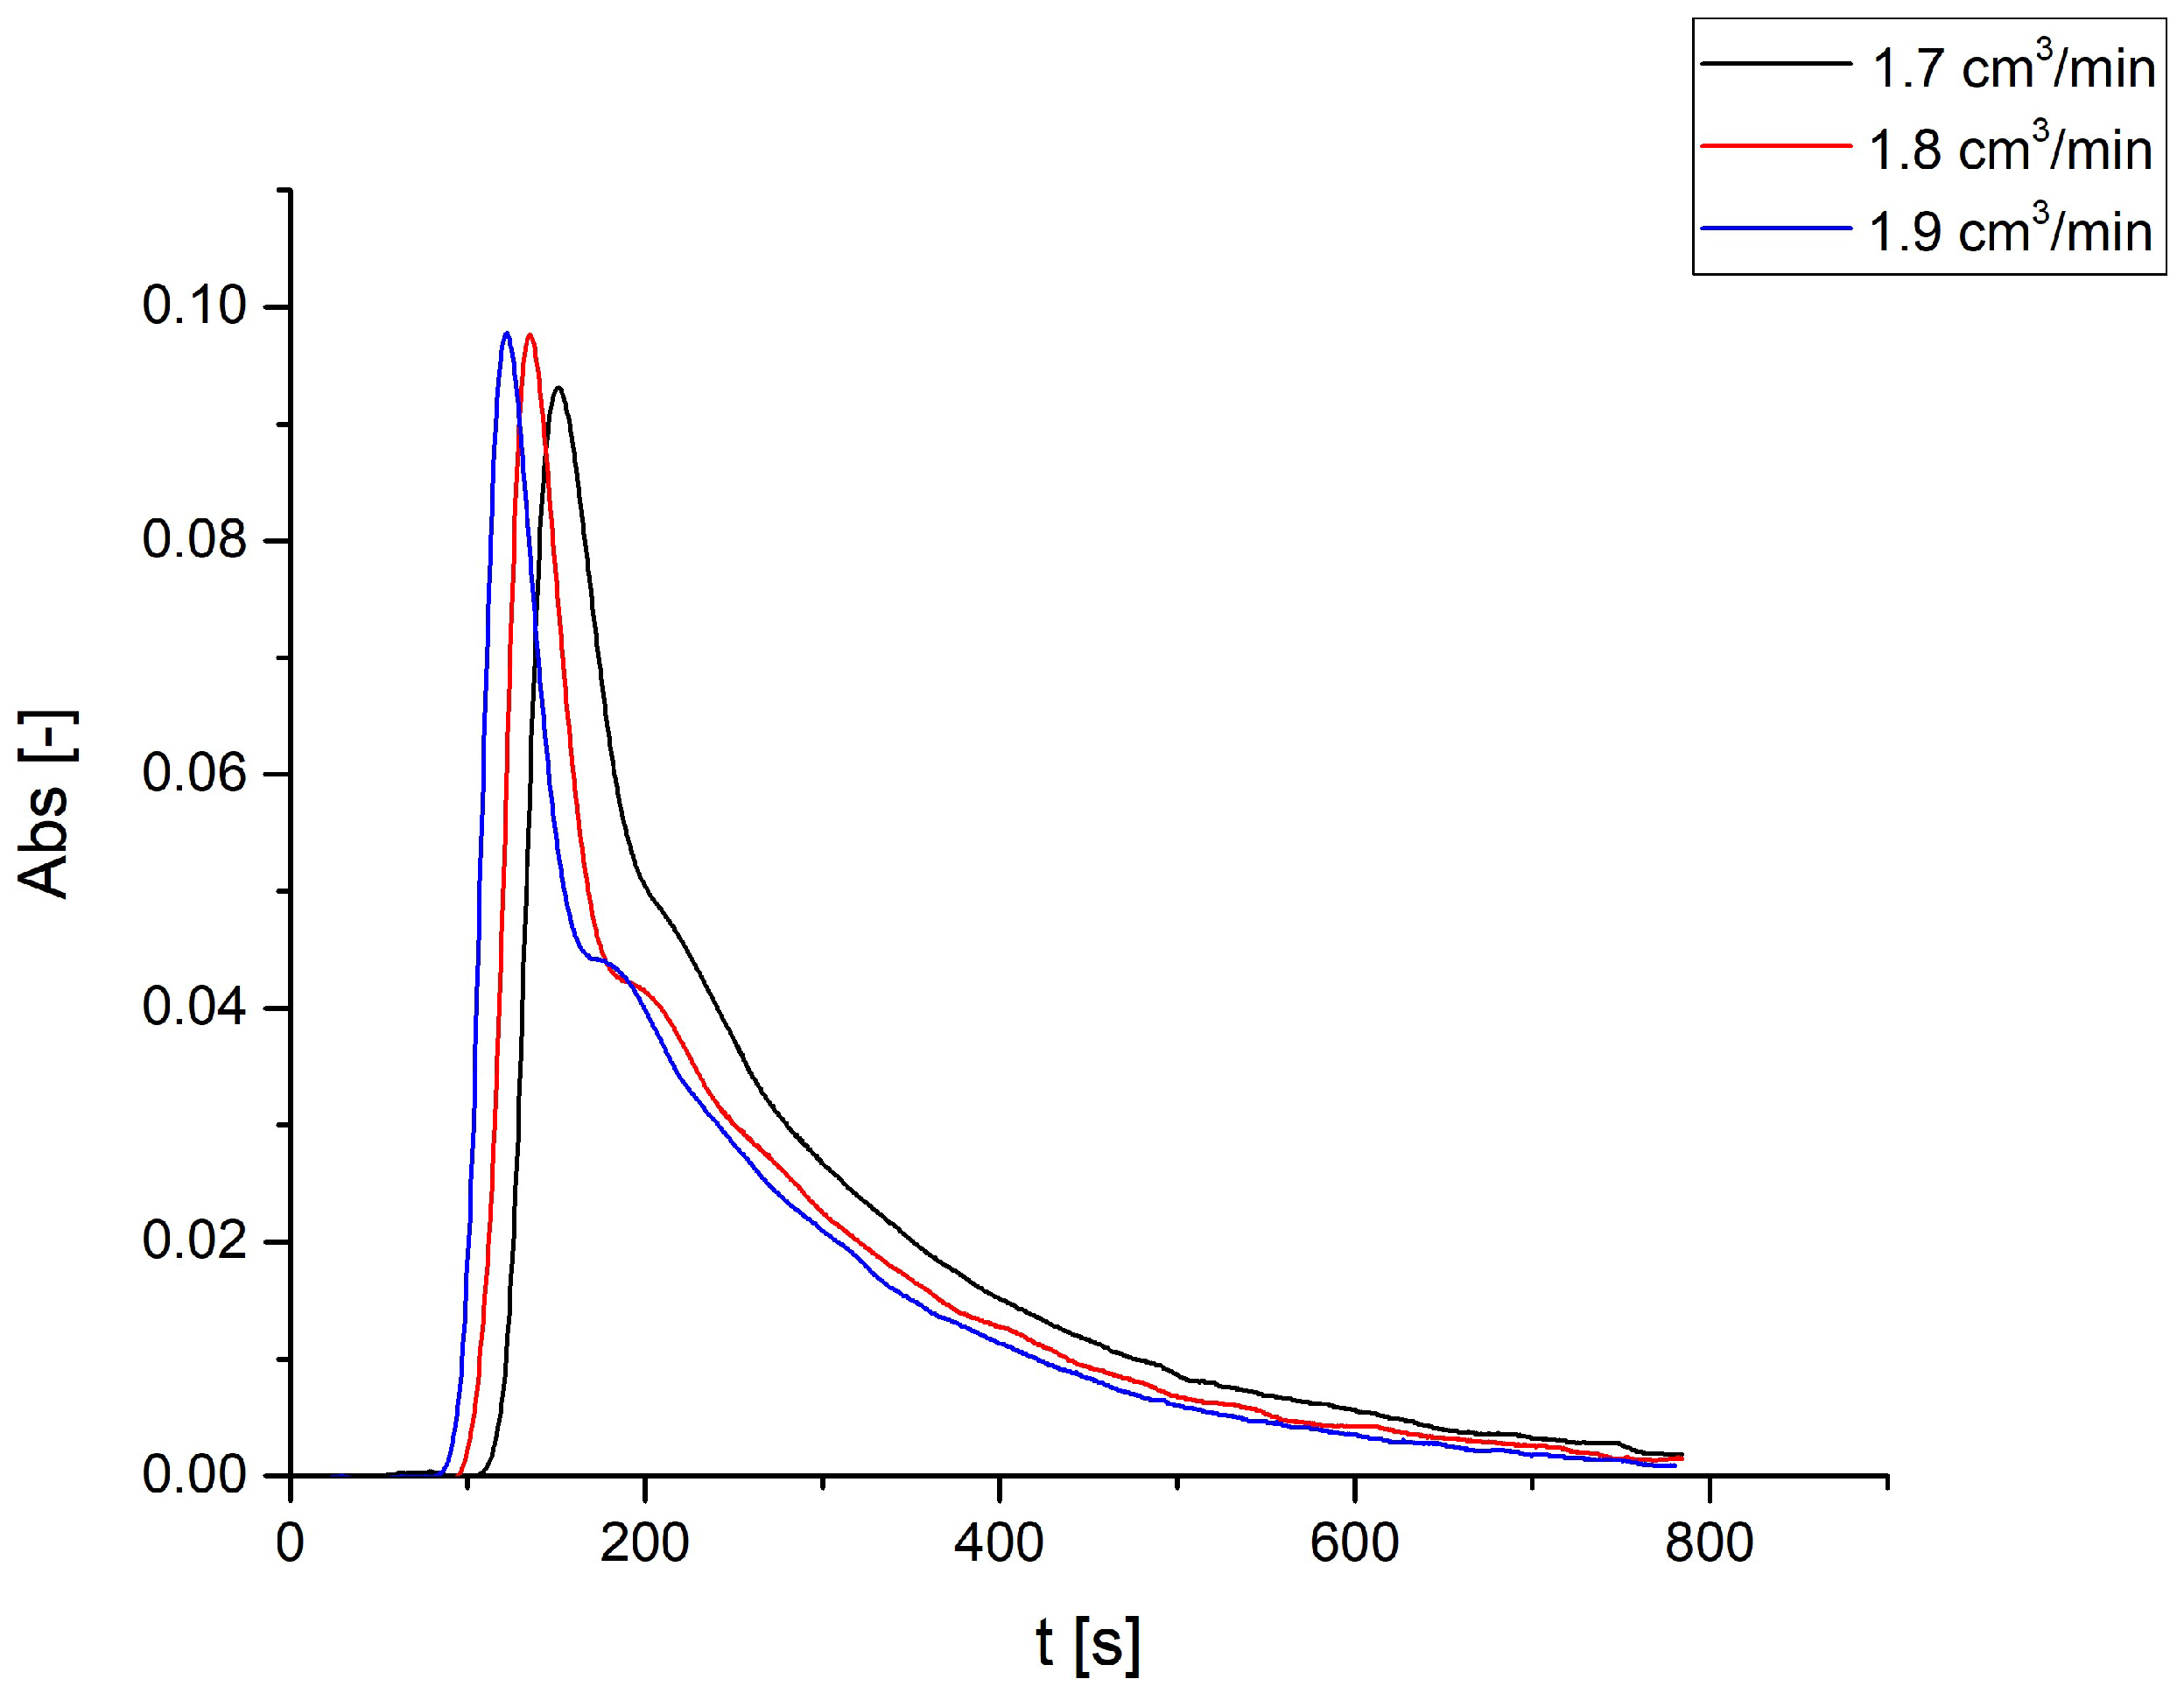
Figure 5 shows the results of test at 313 K and 1.7, 1.8, and 1.9 cm3/min flow rates.
All three tests displayed the formation of two peaks, one was attributed to LA and the other, which was somewhat embedded into the first, to EL.
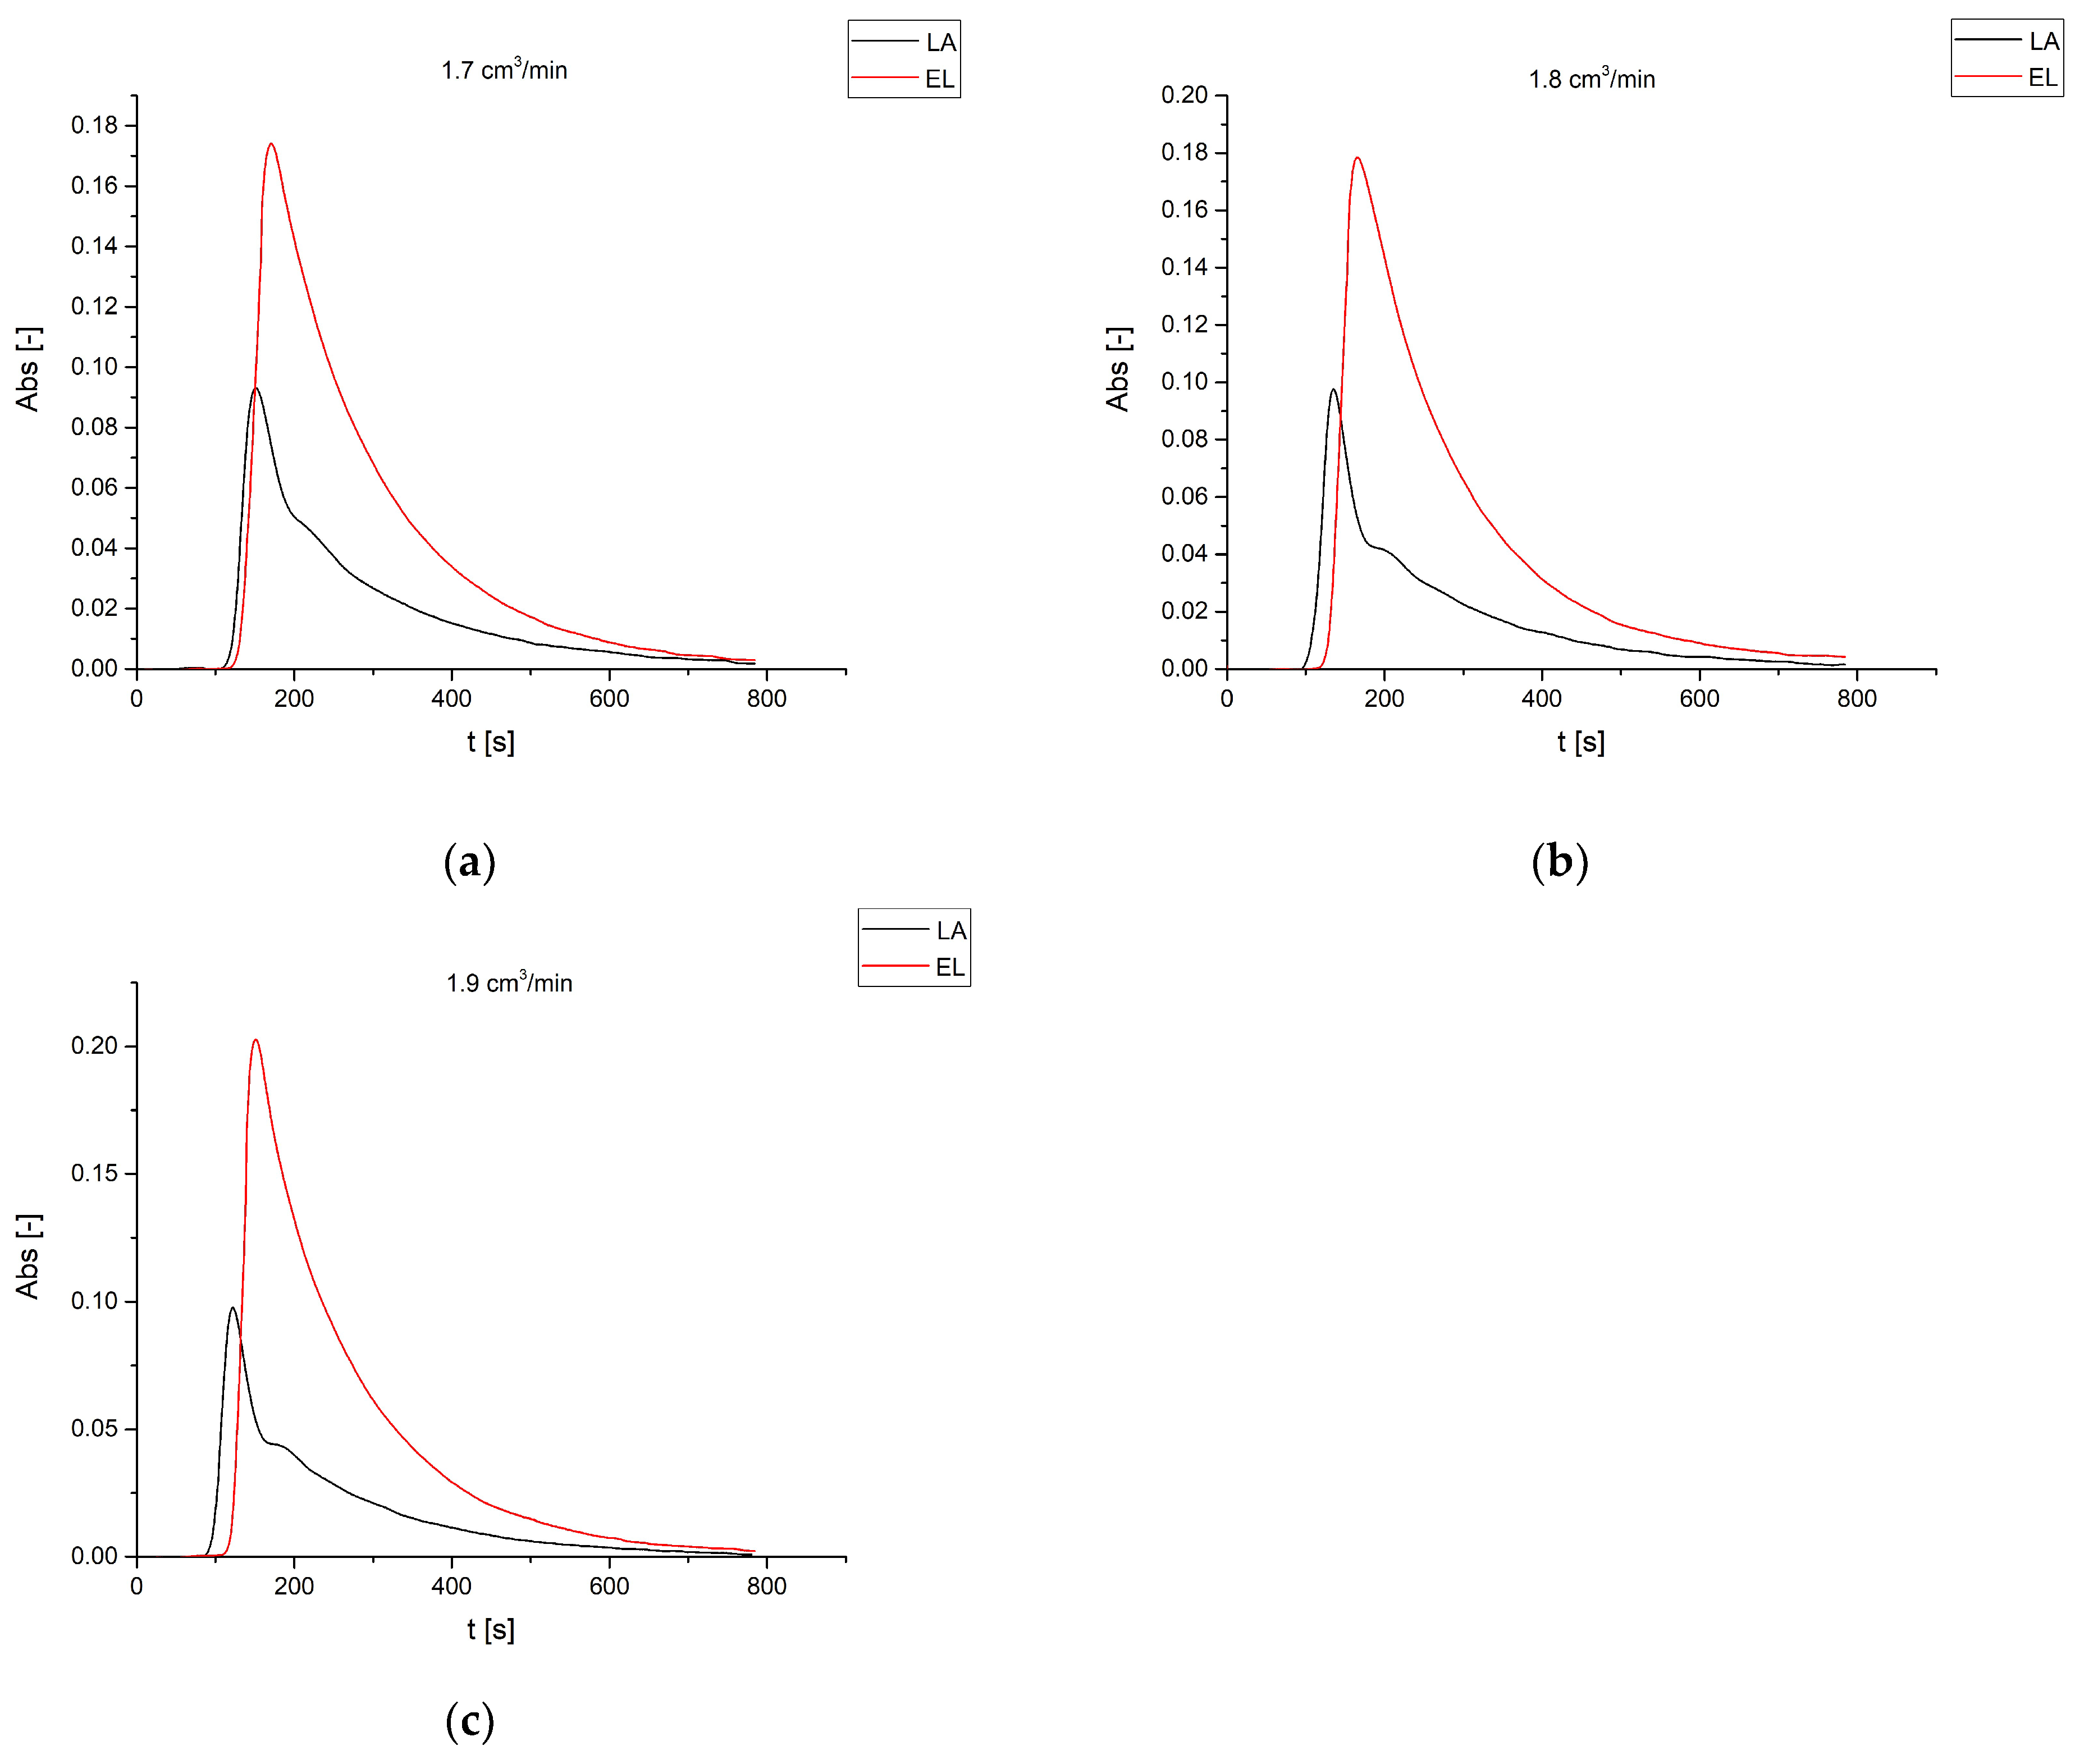
To prove that the conversion was not complete and that there was the presence of both LA and EL, a solution of EL 6 M was prepared and injected under the same operative conditions. In Figure 6, the results are shown and the correspondence confirms that the second peak in the LA injections spectra can be attributed to EL formation.
Through peak deconvolution, the approximate LA conversion was determined. The conversion values were not much different for the tests at 1.7, 1.8, and 1.9 cm3/min flow rate (65%, 67%, and 68% respectively) and, given the difficulty in peaks fitting due to the EL peaks being broad, these values are only indicative.
From these data, it was possible to confirm that the separation of EL from LA occurred at these operative conditions and that the range of conversion values was narrower than the one obtained with tests at 303 K and 0.9 and 1.1 cm3/min flow rates.
Another set of experiments was carried out raising up the temperature to 323 K to further evaluate the performance of our chromatographic reactor setup. This time, no second peak appeared in any of our tests at different flow rates (1.8, 2, 2.5, and 5 cm3/min) when LA 6 M pulses were sent through the resin-packed tubular reactor (Figure 7). If this was to be expected for the higher flow rates based on previous collected data, the nature of the single peaks at the lower flow rates remained to be demonstrated.
EL 6 M injections at the same temperature and flow rate values demonstrated that at lower flow rates LA was completely converted to EL.
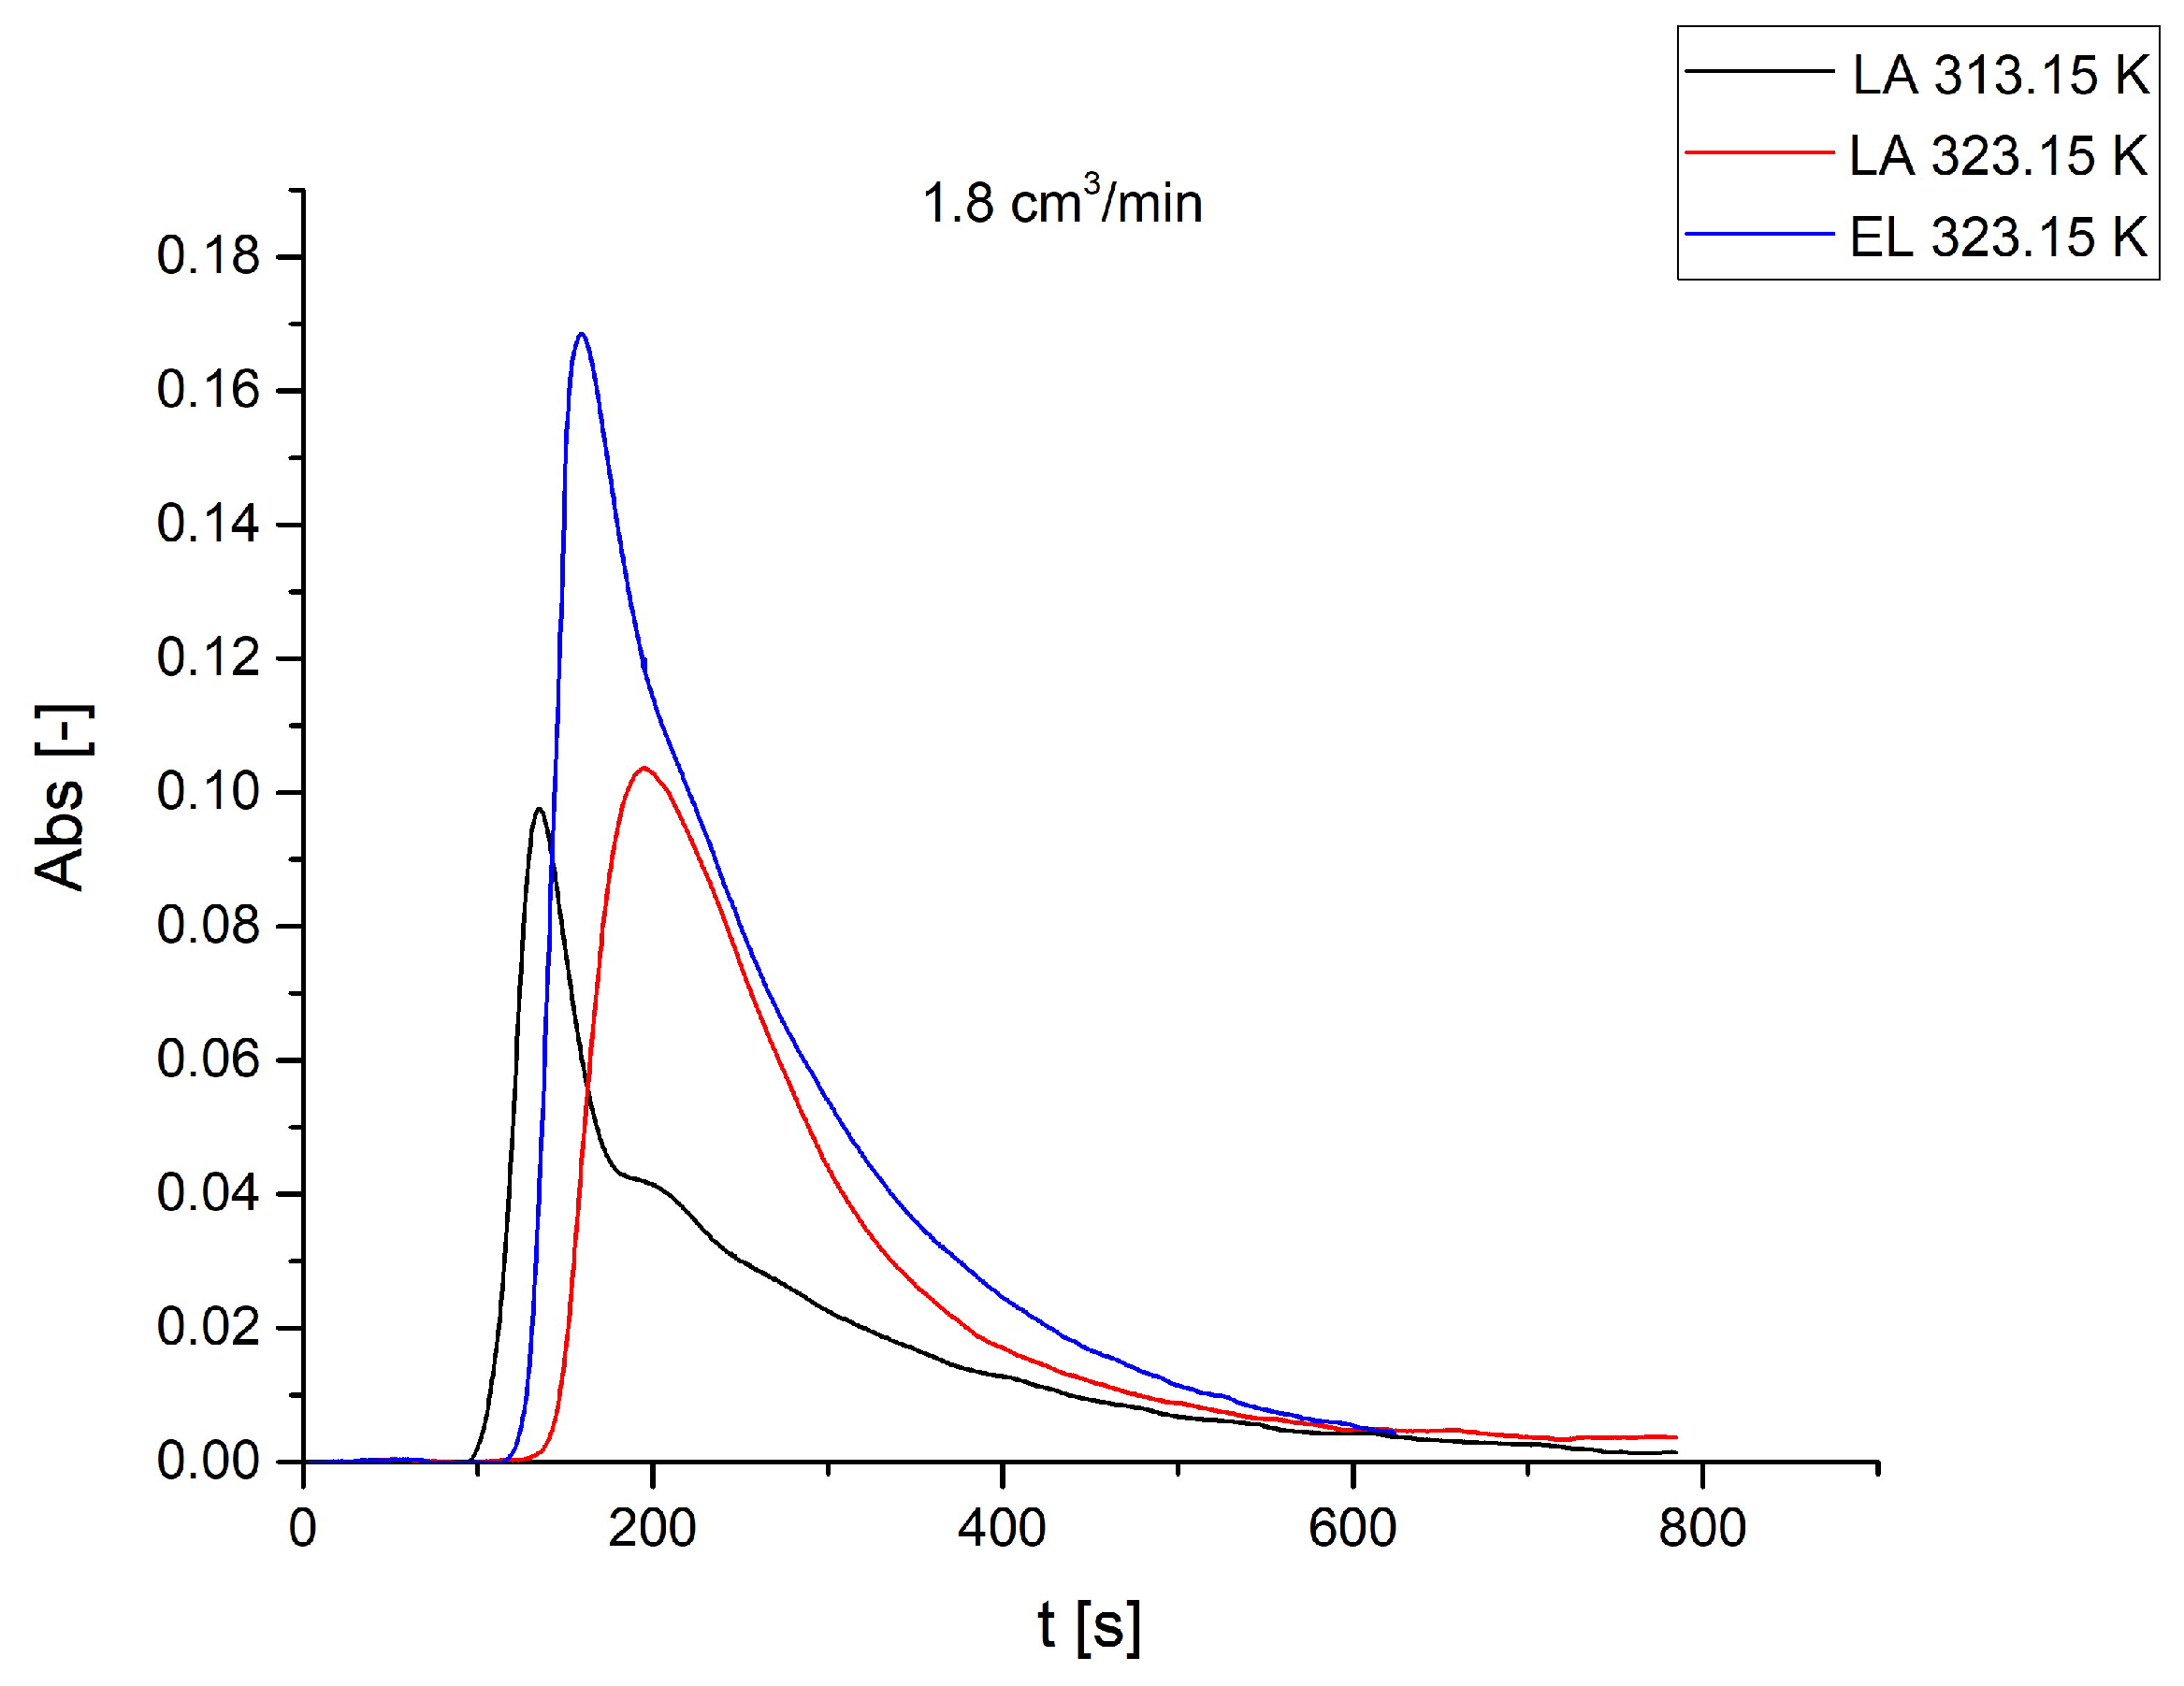
Further proof for the injection test at 1.8 cm3/min (Figure 8) was given by the LA injection test with the same flow rate at lower temperature—the EL peak of that spectrum perfectly corresponded to the only peak in the LA injection spectrum at 323 K.
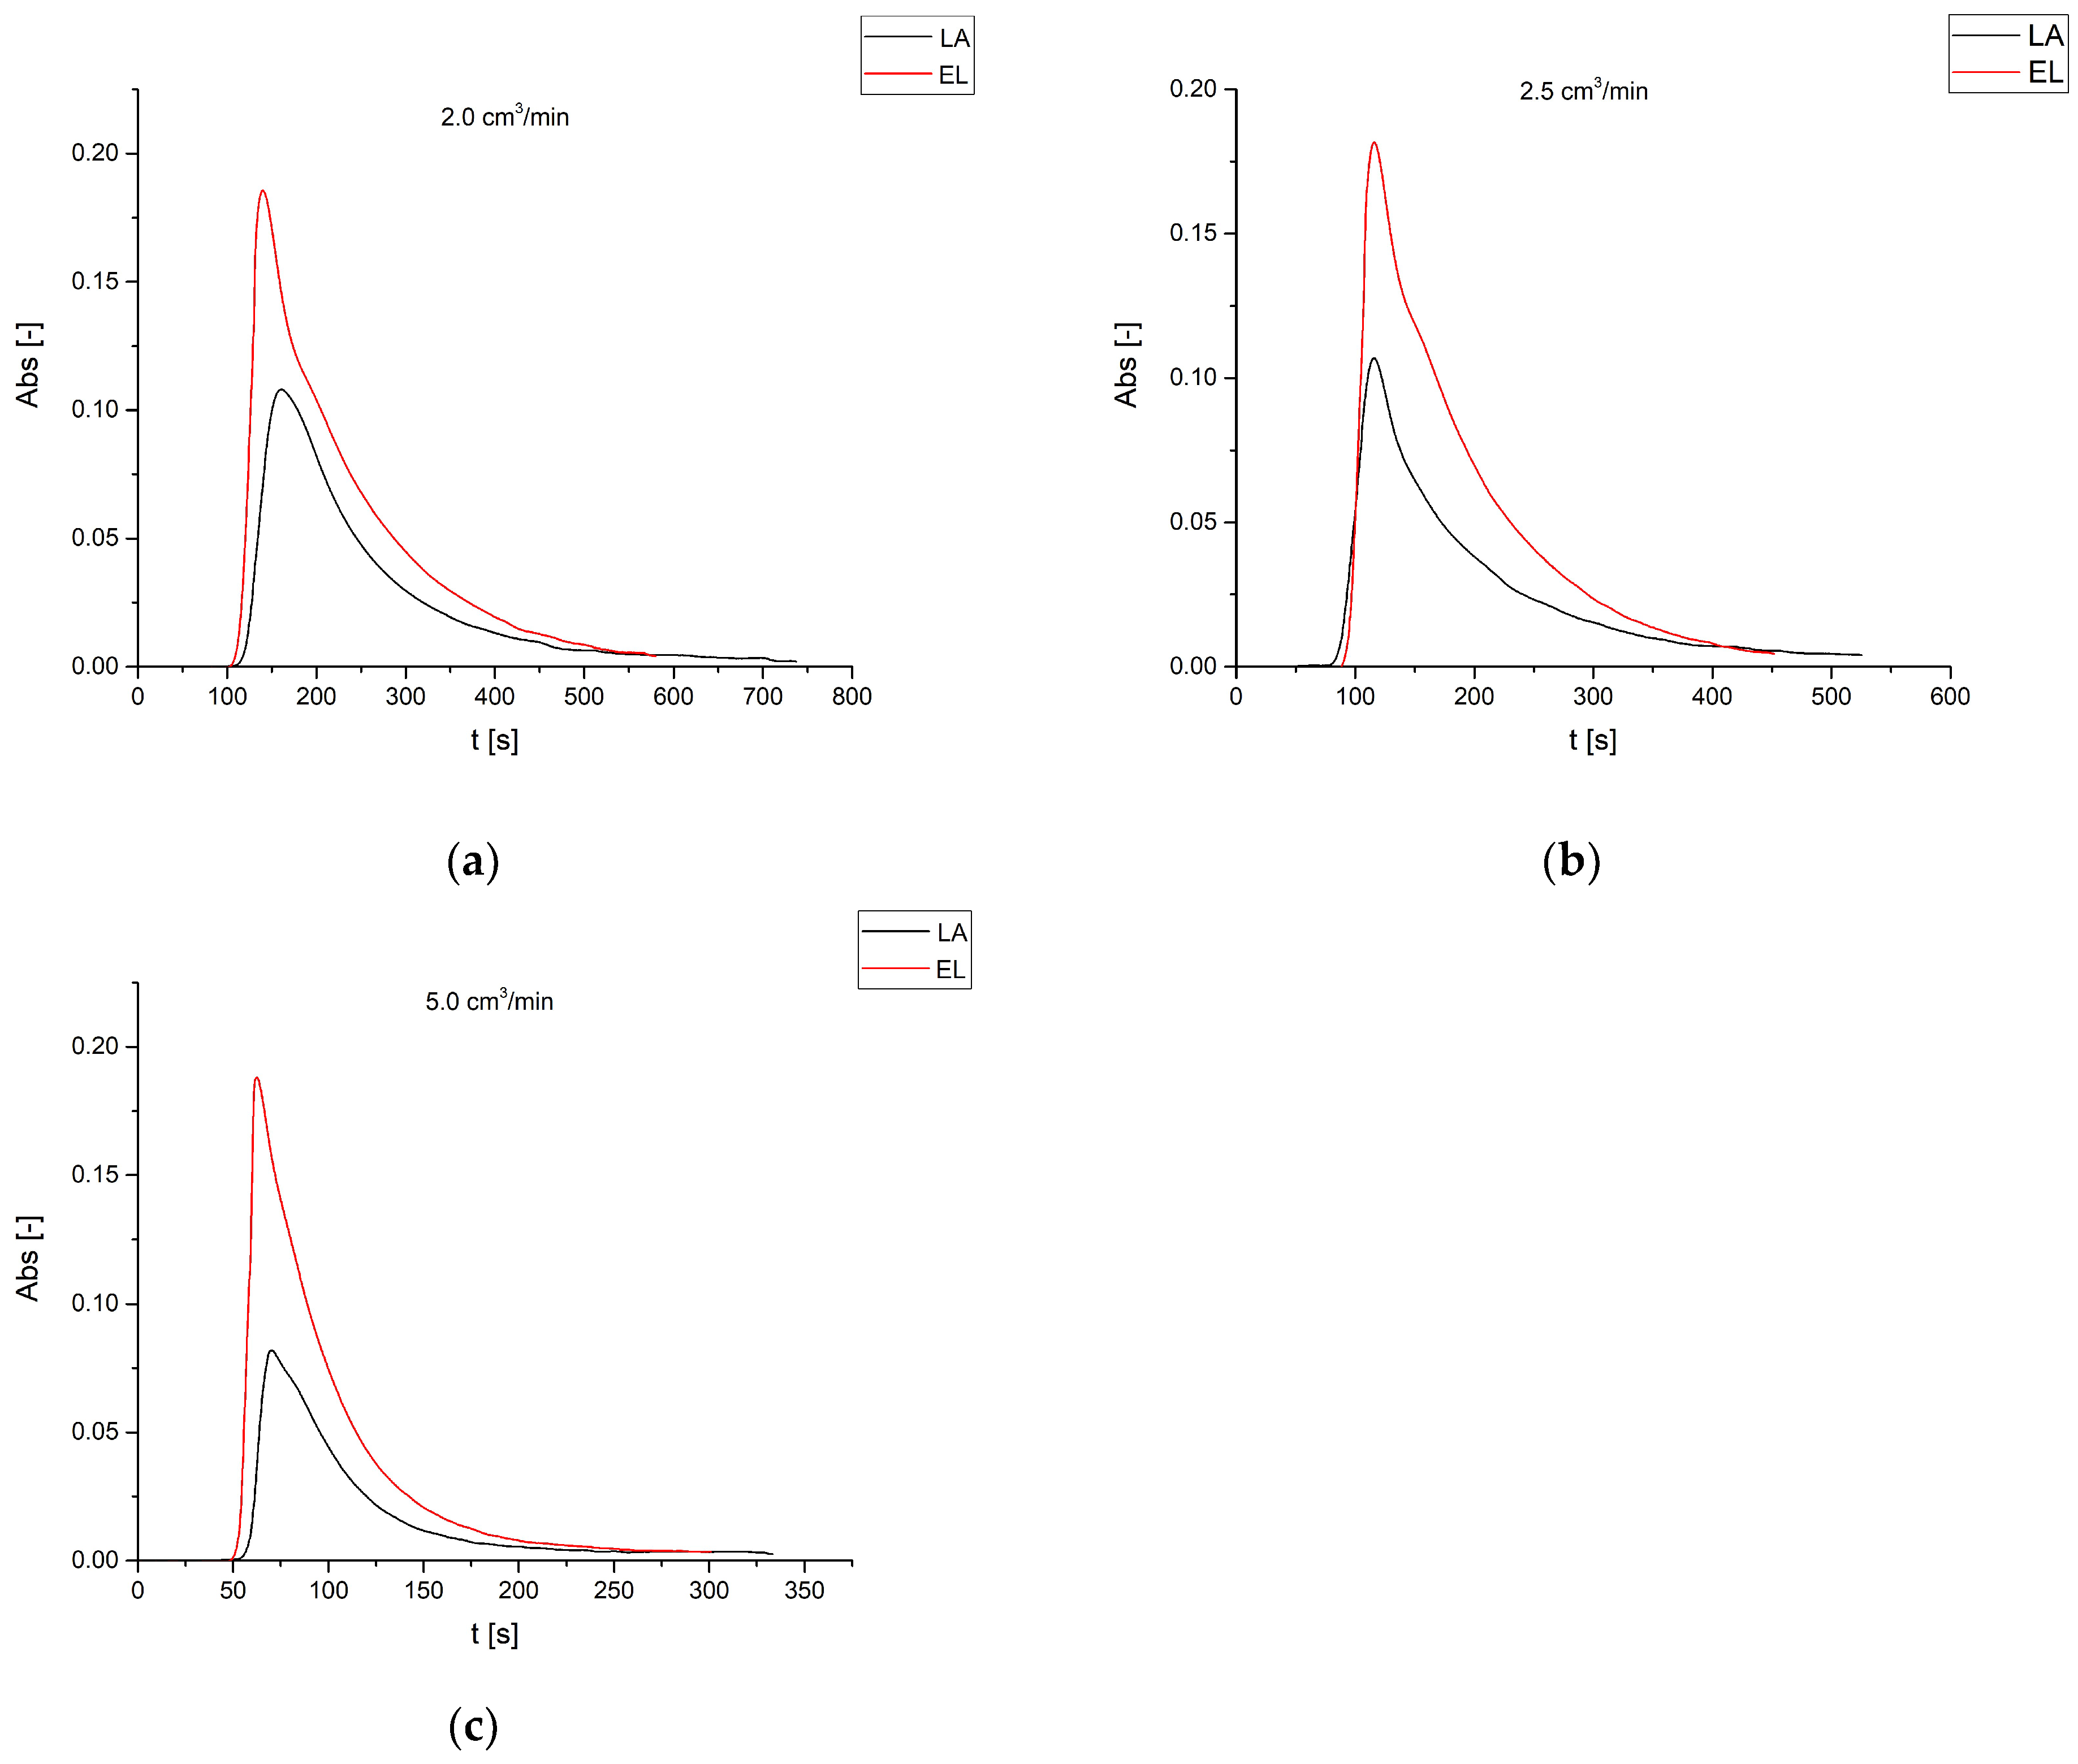
At 323 K, the reaction kinetics and the quantity of catalysts that completely packed the column allowed for complete conversion of LA to EL with flow rate values that gave the organic acid enough time to interact with the ion-exchange resin (Figure 9).
Water produced by the esterification reaction was mostly kept inside the solid. This should not have affected LA conversion largely, but too much water adsorbed in the resin could in fact reduce the quantity of EL obtained at the reactor outlet due to the EL hydrolysis taking place.
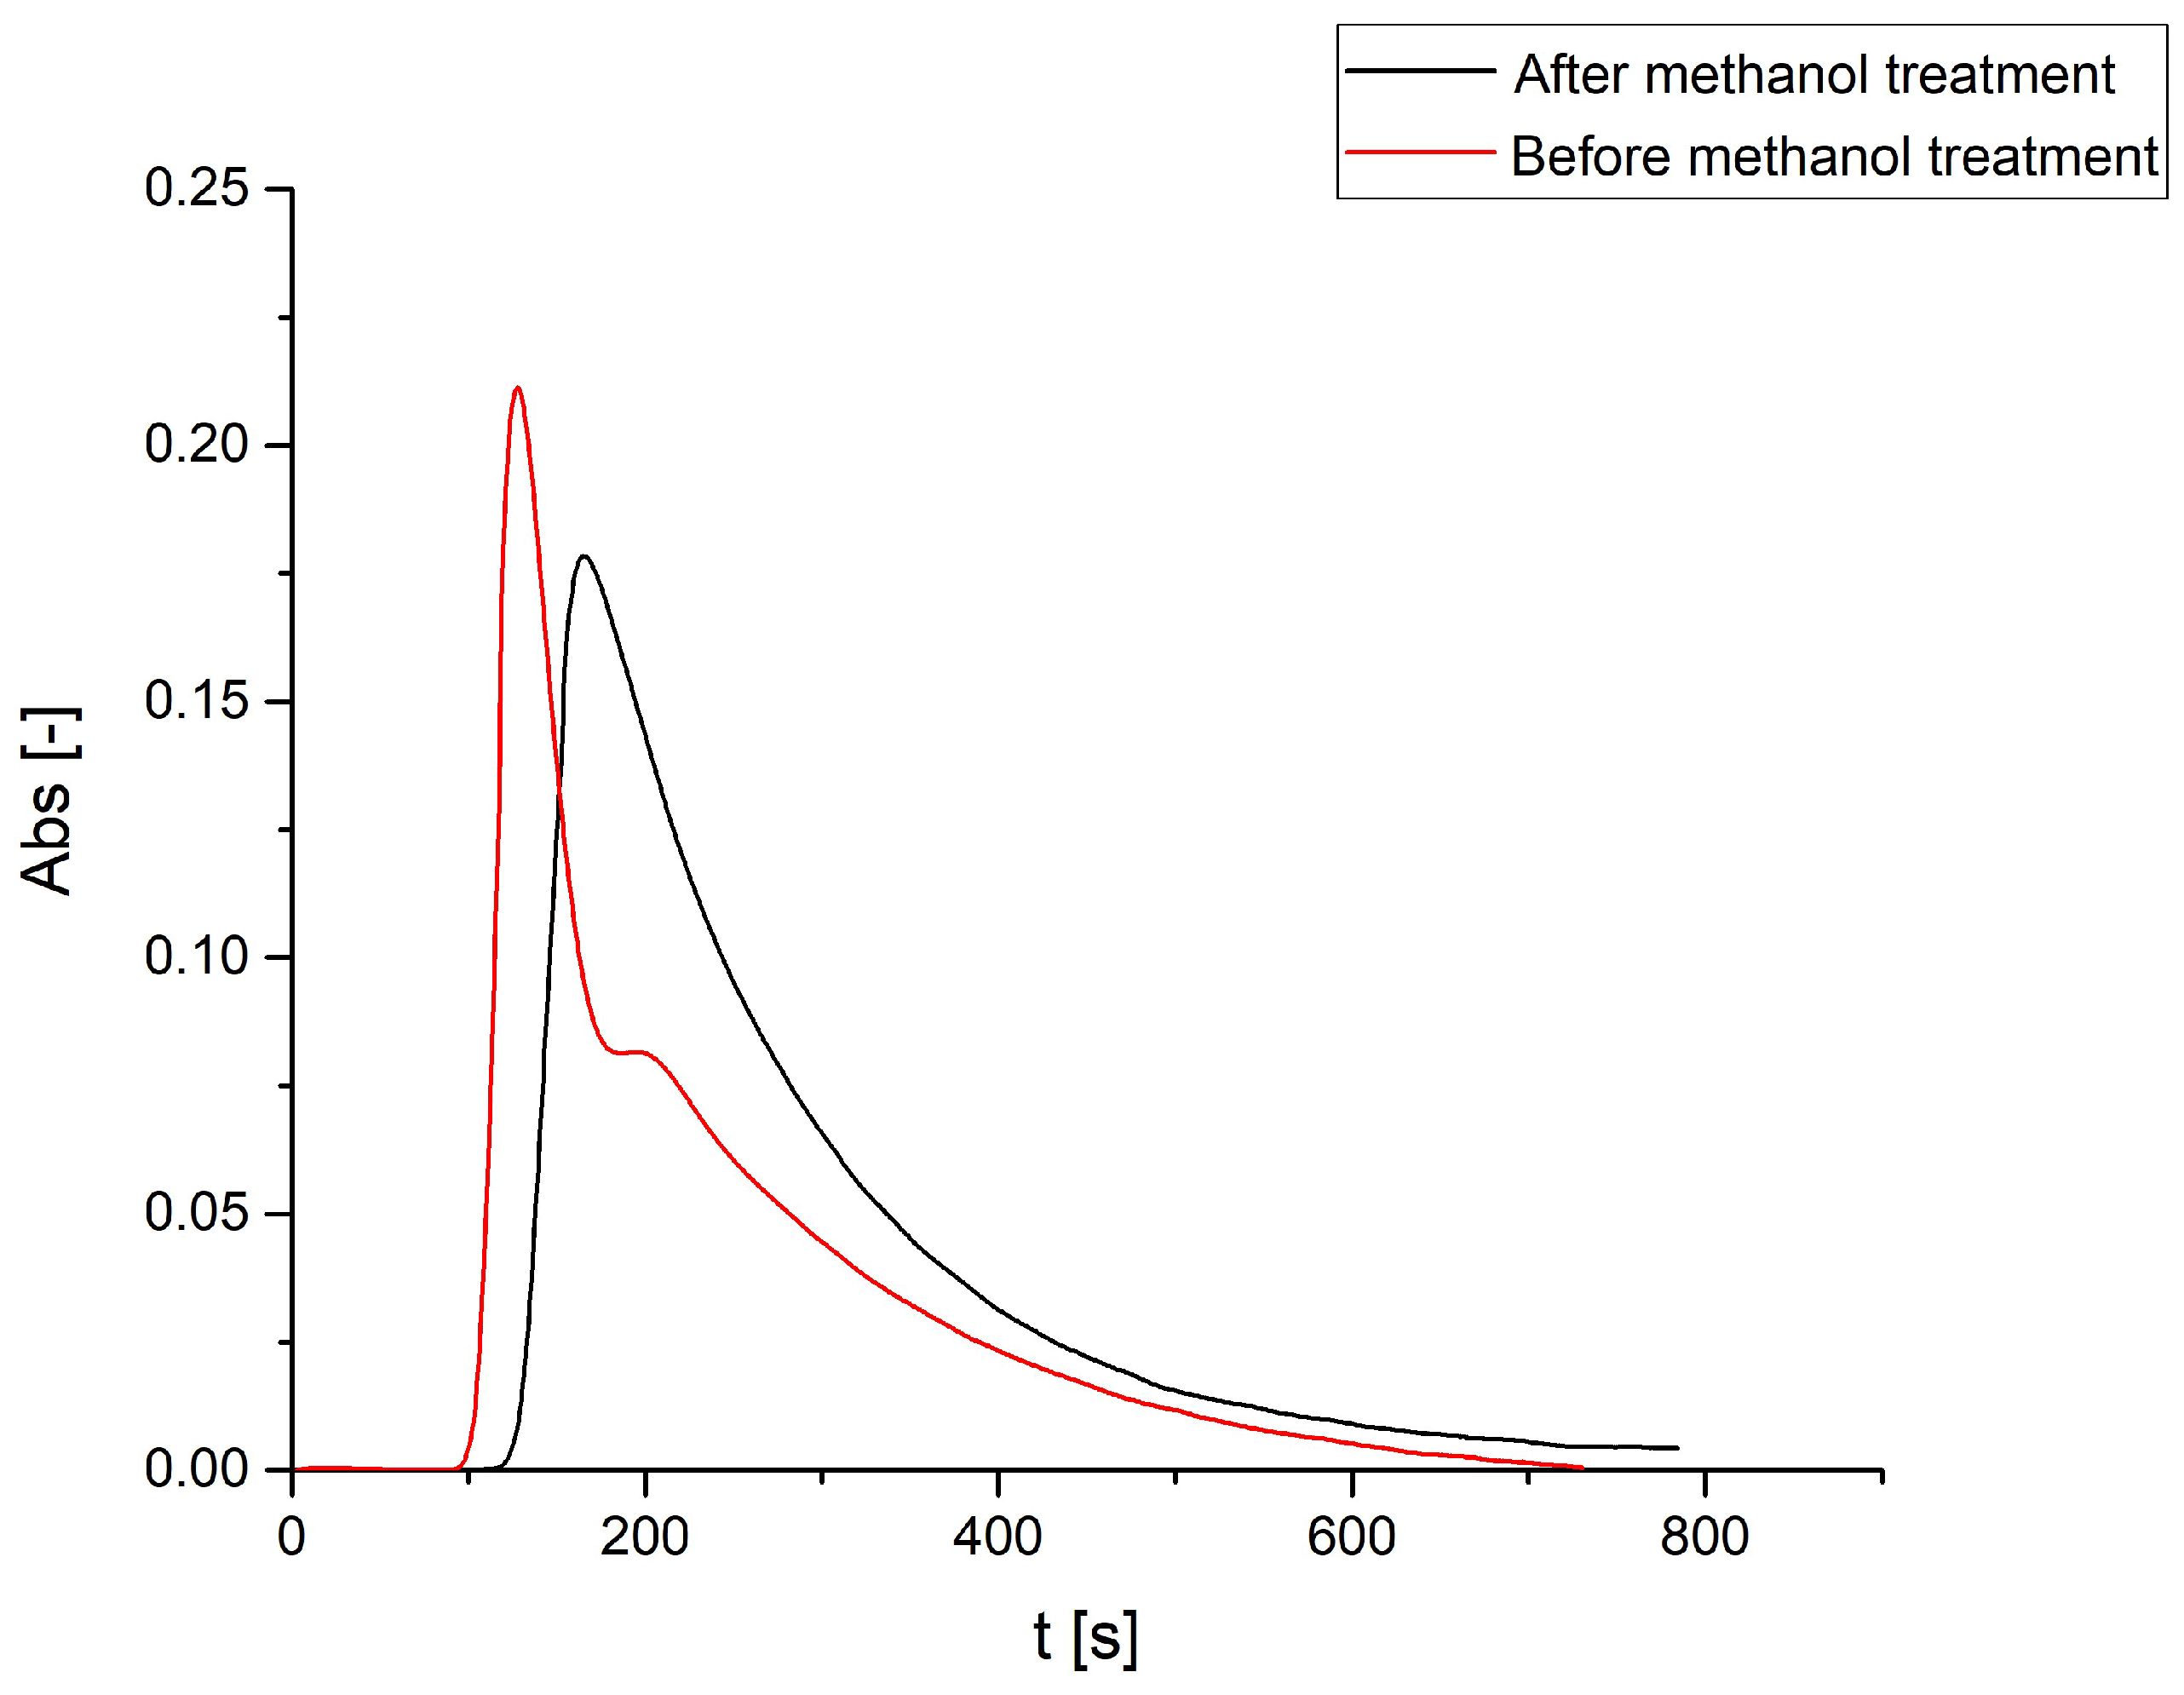
After many tests run with the chromatographic reactor setup, the resin showed that it was indeed starting to accumulate water. EL pulses started showing two peaks in the UV analyzer, which would only be explained by the presence of water in the system reacting with the ester and forming LA.
To remove water from the Dowex 50WX8 resin, a 0.05 cm3/min flow of methanol was sent through the packed reactor for 24 h. The result of this treatment can be seen in the UV spectra in Figure 10.
From the UV spectra, it can be highlighted that methanol successfully removed water from the packed column since EL injections post-treatment did not result in LA formation.
The LA conversions achieved by the chromatographic reactor setup at the different operative conditions employed are summarized in Table 4.
As revealed, the trends are rather logical, as conversion decreases by increasing the flowrate, as lower residence times are achieved. The quantification of the data reported in this paper can give a real impact in the optimization of the chromatographic reactor operation conditions.
4. Conclusions
The possibility of conducting LA esterification with ethanol for production of EL in a chromatographic reactor setup was successfully verified using Dowex 50WX8, demonstrating that, in some cases, it is possible to achieve full LA conversion.
A tubular reactor was packed with Dowex 50WX8 to build a chromatographic reactor setup. Tests at different temperatures and flow rates were done to evaluate the catalytic and the separation efficiency of the resin itself.
The chromatographic separation method proved to work for LA esterification, as with sufficiently low flow rates, the LA pulses were completely converted to EL, while with moderate flow rates, the partially unconverted LA was well separated from the ester. At flow rates higher than 2.5 cm3/min, LA did not have time to interact with the resin surface. At temperatures near to room temperature (303 K), LA was completely converted to EL. This is a very encouraging result considering that this is not possible in a batch system due to the thermodynamic equilibrium. It was also proved that if the resin should trap too much water, as a by-product of the esterification, it is possible to clean it with a methanol treatment.
This promising reactive setup could be further investigated with a fluid-dynamic characterization and the development of a model that could describe the qualitative data obtained with the chromatographic reactor. Certainly, a higher experimental effort must be conducted to separately retrieve information about the kinetics of the reaction, a point that will be surely investigated in our future works.
Author Contributions
Conceptualization, V.R. and M.D.S.; methodology, V.R.; software, V.R. and R.T.; validation, C.R., C.L.P. and V.R.; formal analysis, V.R. and R.T.; investigation, C.R. and C.L.P.; data curation, C.L.P. and C.R.; writing—original draft preparation, C.R. and V.R.; writing—review and editing, V.R., R.T. and M.D.S.; supervision, V.R. and M.D.S.; project administration, V.R.; funding acquisition, M.D.S. All authors have read and agreed to the published version of the manuscript.
Funding
This research received no external funding.
Institutional Review Board Statement
Not applicable.
Informed Consent Statement
Not applicable.
Data Availability Statement
Data sharing not applicable.
Acknowledgments
Raffaele Morlando is cordially acknowledged for the support in the realization of the chromatographic reactor experimental setup.
Conflicts of Interest
The authors declare no conflict of interest.
Abbreviations
| LA | Levulinic acid |
| EL | Ethyl levulinate |
| EtOH | Ethanol |
| H2O | Water |
| List of symbols | |
| T | Temperature [K] |
| t | Time [s] |
| Volume of dried resin [cm3] | |
| Volume of swelled resin [cm3] | |
| Swelling coefficient [%] | |
References
- Liu, C.; Lu, X.; Yu, Z.; Xiong, J.; Bai, H.; Zhang, R. Production of levulinic acid from cellulose and cellulosic biomass in different catalytic systems. Catalysts 2020, 10, 1–22. [Google Scholar] [CrossRef]
- Bozell, J.J.; Petersen, G.R. Technology development for the production of biobased products from biorefinery carbohydrates—the US Department of Energy’s “Top 10” revisited. Green Chem. 2010, 12, 539. [Google Scholar] [CrossRef]
- Leal Silva, J.; Grekin, R.; Mariano, A.; Filho, R. Making Levulinic Acid and Ethyl Levulinate Economically Viable: A Worldwide Technoeconomic and Environmental Assessment of Possible Routes. Energy Technol. 2017, 6, 613–639. [Google Scholar] [CrossRef]
- Joshi, H.; Moser, B.R.; Toler, J.; Smith, W.F.; Walker, T. Ethyl levulinate: A potential bio-based diluent for biodiesel which improves cold flow properties. Biomass Bioenergy 2011, 35, 3262–3266. [Google Scholar] [CrossRef]
- Brown, D.W.; Floyd, A.J.; Kinsman, R.G.; Roshan-ali, Y. Dehydration Reactions of Fructose in Non-aqueous Media. J. Chem. Technol. Biotechnol. 1982, 32, 920–924. [Google Scholar] [CrossRef]
- Deuss, P.J.; Barta, K.; De Vries, J.G. Homogeneous catalysis for the conversion of biomass and biomass-derived platform chemicals. Catal. Sci. Technol. 2014, 4, 1174–1196. [Google Scholar] [CrossRef] [Green Version]
- Schuette, H.A.; Cowley, M.A. Levulinic acid. II. the vapor pressures of its alkyl esters (C1--C6. J. Am. Chem. Soc. 1931, 53, 3485–3489. [Google Scholar] [CrossRef]
- Nandiwale, K.Y.; Sonar, S.K.; Niphadkar, P.S.; Joshi, P.N.; Deshpande, S.S.; Patil, V.S.; Bokade, V.V. Catalytic upgrading of renewable levulinic acid to ethyl levulinate biodiesel using dodecatungstophosphoric acid supported on desilicated H-ZSM-5 as catalyst. Appl. Catal. A Gen. 2013, 460–461, 90–98. [Google Scholar] [CrossRef]
- Pasquale, G.; Vázquez, P.; Romanelli, G.; Baronetti, G. Catalytic upgrading of levulinic acid to ethyl levulinate using reusable silica-included Wells-Dawson heteropolyacid as catalyst. Catal. Commun. 2012, 18, 115–120. [Google Scholar] [CrossRef]
- Badgujar, K.C.; Badgujar, V.C.; Bhanage, B.M. A review on catalytic synthesis of energy rich fuel additive levulinate compounds from biomass derived levulinic acid. Fuel Process. Technol. 2020, 197, 106213. [Google Scholar] [CrossRef]
- Fernandes, D.R.; Rocha, A.S.; Mai, E.F.; Mota, C.J.A.; Teixeira da Silva, V. Levulinic acid esterification with ethanol to ethyl levulinate production over solid acid catalysts. Appl. Catal. A Gen. 2012, 425–426, 199–204. [Google Scholar] [CrossRef]
- Russo, V.; Rossano, C.; Salucci, E.; Tesser, R.; Salmi, T.; Di Serio, M. Intraparticle diffusion model to determine the intrinsic kinetics of ethyl levulinate synthesis promoted by Amberlyst-15. Chem. Eng. Sci. 2020, 228, 115974. [Google Scholar] [CrossRef]
- Russo, V.; Tesser, R.; Rossano, C.; Cogliano, T.; Vitiello, R.; Leveneur, S.; Di Serio, M. Kinetic study of Amberlite IR120 catalyzed acid esterification of levulinic acid with ethanol: From batch to continuous operation. Chem. Eng. J. 2020, 401, 126126. [Google Scholar] [CrossRef]
- Srivastava, N.; Kuddus, M. Use of Ion-Exchange Resin in Reactive Separation. In Applications of Ion Exchange Materials in Chemical and Food Industries; Inamuddin, T.A., Rangreez, M., Asiri, A., Eds.; Springer International Publishing: Cham, Switzerland, 2019; pp. 125–137. ISBN 978-3-030-06085-5. [Google Scholar]
- Mazzotti, M.; Kruglov, A.; Neri, B.; Gelosa, D.; Morbidelli, M. A continuous chromatographic reactor: SMBR. Chem. Eng. Sci. 1996, 51, 1827–1836. [Google Scholar] [CrossRef]
- Rodrigues, A.E.; Pereira, C.S.M.; Santos, J.C. Chromatographic Reactors. Chem. Eng. Technol. 2012, 35, 1171–1183. [Google Scholar] [CrossRef]
- Vu, T.D.; Seidel-Morgenstern, A. Quantifying temperature and flow rate effects on the performance of a fixed-bed chromatographic reactor. J. Chromatogr. A 2011, 1218, 8097–8109. [Google Scholar] [CrossRef] [PubMed]
- Russo, V.; Tesser, R.; Rossano, C.; Vitiello, R.; Turco, R.; Salmi, T.; Di Serio, M. Chromatographic reactor modelling. Chem. Eng. J. 2019, 377, 119692. [Google Scholar] [CrossRef]
Figure 1.
Chromatographic reactor setup scheme. (1) Tank; (2) HPLC pump; (3) injector; (4) chromatographic reactor; (5) PID; (6) online detector; (7) sample withdrawal valve; (8) accumulation tank; (9) reductor; (10) N2 bottle.
Figure 1.
Chromatographic reactor setup scheme. (1) Tank; (2) HPLC pump; (3) injector; (4) chromatographic reactor; (5) PID; (6) online detector; (7) sample withdrawal valve; (8) accumulation tank; (9) reductor; (10) N2 bottle.

Figure 2.
UV spectra of LA 6 M injected in the chromatographic reactor working at 303 K and at different flow rates.
Figure 2.
UV spectra of LA 6 M injected in the chromatographic reactor working at 303 K and at different flow rates.

Figure 3.
UV spectra of LA and EL 6 M at 303 K and different flow rates. (a) 0.8 cm3/min. (b) 0.9 cm3/min. (c) 1.1 cm3/min. (d) 2.5 cm3/min. (e) 5.0 cm3/min.
Figure 3.
UV spectra of LA and EL 6 M at 303 K and different flow rates. (a) 0.8 cm3/min. (b) 0.9 cm3/min. (c) 1.1 cm3/min. (d) 2.5 cm3/min. (e) 5.0 cm3/min.

Figure 4.
UV spectra for LA 6 M injections at 1.1 cm3/min (a) and 2.5 cm3/min (b) flow rate at different temperatures.
Figure 4.
UV spectra for LA 6 M injections at 1.1 cm3/min (a) and 2.5 cm3/min (b) flow rate at different temperatures.

Figure 5.
UV spectra of LA 6 M pulses at 313 K and different flow rates.

Figure 6.
UV spectra of LA and EL 6 M at 313.15 K at different flow rates. (a): 1.7 cm3/min. (b): 1.8 cm3/min. (c): 1.9 cm3/min.
Figure 6.
UV spectra of LA and EL 6 M at 313.15 K at different flow rates. (a): 1.7 cm3/min. (b): 1.8 cm3/min. (c): 1.9 cm3/min.

Figure 7.
UV spectra of LA 6 M injections at 323 K and different flow rates.

Figure 8.
UV spectra of LA and EL 6 M at 313 and 323 K at 1.8 cm3/min flow rate.

Figure 9.
UV spectra of LA and EL 6 M at 323 K at different flow rates. (a) 2.0 cm3/min. (b) 2.5 cm3/min. (c) 5.0 cm3/min.
Figure 9.
UV spectra of LA and EL 6 M at 323 K at different flow rates. (a) 2.0 cm3/min. (b) 2.5 cm3/min. (c) 5.0 cm3/min.

Figure 10.
Efficiency of methanol treatment for water removal.


Table 1.
Physical properties of the used Dowex 50WX-8 catalyst.
| Catalyst | Particle Size [μm] | Crosslinking Degree [%] | Ionic Form | Total Exchange Capacity [meq/cm3] | Density [g/cm3] | Water Retention Capacity [%] | Max. Operative Temperature [°C] |
|---|---|---|---|---|---|---|---|
| Dowex 50WX8 | 150–300 | 8 | H+ | 1.7 | 0.8 | 50–56 | 120 |
Table 2.
Experimental conditions for the chromatographic reactor runs.
| Test | cLA [mol/L] | cEL [mol/L] | T [K] | Q [cm3/min] | P [bar] | ΔP [kg/cm2] |
|---|---|---|---|---|---|---|
| C1 | 6 | - | 303 | 0.8 | 2 | 9 |
| C2 | 6 | - | 303 | 0.9 | 2 | 10 |
| C3 | 6 | - | 303 | 1.1 | 2 | 13 |
| C4 | 6 | - | 303 | 2.5 | 2 | 30 |
| C5 | 6 | - | 303 | 5 | 2 | 54 |
| C6 | - | 6 | 303 | 0.8 | 2 | 9 |
| C7 | - | 6 | 303 | 0.9 | 2 | 10 |
| C8 | - | 6 | 303 | 1.1 | 2 | 13 |
| C9 | - | 6 | 303 | 2.5 | 2 | 30 |
| C10 | - | 6 | 303 | 5 | 2 | 54 |
| C11 | 6 | - | 313 | 1.1 | 2 | 13 |
| C12 | 6 | - | 313 | 1.7 | 2 | 21 |
| C13 | 6 | - | 313 | 1.8 | 2 | 23 |
| C14 | 6 | - | 313 | 1.9 | 2 | 24 |
| C15 | 6 | - | 313 | 2.5 | 2 | 30 |
| C16 | - | 6 | 313 | 1.1 | 2 | 13 |
| C17 | - | 6 | 313 | 1.7 | 2 | 21 |
| C18 | - | 6 | 313 | 1.8 | 2 | 23 |
| C19 | - | 6 | 313 | 1.9 | 2 | 24 |
| C20 | - | 6 | 313 | 2.5 | 2 | 30 |
| C21 | 6 | - | 323 | 1.8 | 2 | 23 |
| C22 | 6 | - | 323 | 2.0 | 2 | 26 |
| C23 | 6 | - | 323 | 2.5 | 2 | 30 |
| C24 | 6 | - | 323 | 5.0 | 2 | 54 |
| C25 | - | 6 | 323 | 1.8 | 2 | 23 |
| C26 | - | 6 | 323 | 2.0 | 2 | 26 |
| C27 | - | 6 | 323 | 2.5 | 2 | 30 |
| C28 | - | 6 | 323 | 5.0 | 2 | 54 |
Table 3.
Swelling percentage of Dowex 50WX8 when put in contact with different molar ratios of the components of our reactive system.
Table 3.
Swelling percentage of Dowex 50WX8 when put in contact with different molar ratios of the components of our reactive system.
| Molar Fractions [–] | α [%] | |||
|---|---|---|---|---|
| LA | EtOH | EL | H2O | |
| 1 | - | - | - | 51.6 |
| - | 1 | - | - | 58.5 |
| - | - | 1 | - | 45.7 |
| - | - | - | 1 | 57.5 |
| 0.8 | 0.2 | - | - | 45.7 |
| 0.5 | 0.5 | - | - | 49.0 |
| 0.2 | 0.8 | - | - | 52.8 |
| 0.8 | - | 0.2 | - | 45.1 |
| 0.5 | - | 0.5 | - | 36.1 |
| 0.2 | - | 0.8 | - | 45.1 |
| 0.8 | - | - | 0.2 | 49.2 |
| 0.5 | - | - | 0.5 | 51.0 |
| 0.2 | - | - | 0.8 | 56.2 |
| - | 0.8 | 0.2 | - | 52.1 |
| - | 0.5 | 0.5 | - | 44.2 |
| - | 0.2 | 0.8 | - | 47.7 |
| - | 0.8 | - | 0.2 | 54.9 |
| - | 0.5 | - | 0.5 | 52.8 |
| - | 0.2 | - | 0.8 | 57.9 |
| - | - | 0.8 | 0.2 | 45.1 |
| - | - | 0.5 | 0.5 | 50.6 |
| - | - | 0.2 | 0.8 | 57.4 |
Table 4.
LA conversions achieved at different operative conditions during the chromatographic reactor tests with LA 6 M pulses.
Table 4.
LA conversions achieved at different operative conditions during the chromatographic reactor tests with LA 6 M pulses.
| Test | T [K] | Q [cm3/min] | XLA [%] * |
|---|---|---|---|
| C1 | 303 | 0.8 | 100 |
| C2 | 303 | 0.9 | 87 |
| C3 | 303 | 1.1 | 58 |
| C4 | 303 | 2.5 | 0 |
| C5 | 303 | 5.0 | 0 |
| C11 | 313 | 1.1 | 100 |
| C12 | 313 | 1.7 | 65 |
| C13 | 313 | 1.8 | 67 |
| C14 | 313 | 1.9 | 68 |
| C15 | 313 | 2.5 | 0 |
| C21 | 323 | 1.8 | 100 |
| C22 | 323 | 2.0 | 100 |
| C23 | 323 | 2.5 | 0 |
| C24 | 323 | 5.0 | 0 |
* XLA values were determined by comparison with EL 6 M injections and with peak deconvolution.
Publisher’s Note: MDPI stays neutral with regard to jurisdictional claims in published maps and institutional affiliations. |
© 2021 by the authors. Licensee MDPI, Basel, Switzerland. This article is an open access article distributed under the terms and conditions of the Creative Commons Attribution (CC BY) license (https://creativecommons.org/licenses/by/4.0/).
Share and Cite
MDPI and ACS Style
Rossano, C.; Pizzo, C.L.; Tesser, R.; Di Serio, M.; Russo, V. Reactive Chromatography Applied to Ethyl Levulinate Synthesis: A Proof of Concept. Processes 2021, 9, 1684. https://0-doi-org.brum.beds.ac.uk/10.3390/pr9091684
AMA Style
Rossano C, Pizzo CL, Tesser R, Di Serio M, Russo V. Reactive Chromatography Applied to Ethyl Levulinate Synthesis: A Proof of Concept. Processes. 2021; 9(9):1684. https://0-doi-org.brum.beds.ac.uk/10.3390/pr9091684
Chicago/Turabian StyleRossano, Carmelina, Claudio Luigi Pizzo, Riccardo Tesser, Martino Di Serio, and Vincenzo Russo. 2021. "Reactive Chromatography Applied to Ethyl Levulinate Synthesis: A Proof of Concept" Processes 9, no. 9: 1684. https://0-doi-org.brum.beds.ac.uk/10.3390/pr9091684
Note that from the first issue of 2016, this journal uses article numbers instead of page numbers. See further details here.