
Effects of Tartary Buckwheat Bran Flour on Dough Properties and Quality of Steamed Bread


Henan Institute of Science and Technology, School of Food Science, Xinxiang 453003, China
*
Author to whom correspondence should be addressed.
Foods 2021, 10(9), 2052; https://0-doi-org.brum.beds.ac.uk/10.3390/foods10092052
Submission received: 5 August 2021
/
Revised: 23 August 2021
/
Accepted: 27 August 2021
/
Published: 31 August 2021
(This article belongs to the Special Issue Whole Grain Foods, Noodles and Steamed Bread)
Abstract
:Steamed bread is a traditional staple food of China. Replacing wheat flour (WF) with Tartary buckwheat is expected to improve the nutritional value of steamed bread. In this study, Tartary buckwheat flour (TBF), Tartary buckwheat bran flour (TBBF), and Tartary buckwheat core flour (TBCF) were prepared, their composition and physicochemical properties were compared. It was found that TBBF had higher protein and rutin contents, so its antioxidant activity and dough rheological properties were obviously superior to those of TBF and TBCF. When TBBF was mixed with WF, its weight proportion in the blend (Wbran) had a significant effect on the dough rheological properties. When Wbran was 30%, the dough had the optimal mixing tolerance, and when Wbran exceeded 30%, it caused dilution effect, weakening the gluten network. With the increase of Wbran, the color of the steamed bread developed by the TBBF–WF blend gradually darkened and yellowed, the specific volume declined, and its hardness, gumminess, and chewiness ascended gradually. The appropriate addition of TBBF (Wbran = 10% and 30%) was beneficial to cell diameter and volume of steamed bread, but the further rise of Wbran would destroy its gas retention ability. The predicted glycemic index (pGI) of steamed bread declined significantly with the increasing Wbran.
1. Introduction
Tartary buckwheat (Fagopyrum tataricum L.), a dicotyledonous crop of the Polygonaceae family, is widely distributed in China, Russia, South Korea, Japan, Europe, and other regions [1,2]. For its high nutritional and medicinal value, it has received a lot of attention as a health food [3,4]. Compared with other cereals such as wheat, rice and corn, Tartary buckwheat is not only rich in protein, lipid, starch, dietary fiber, minerals, and vitamins, but also abundant in polyphenols represented by rutin, which play a positive role in the prevention and treatment of chronic and age-related diseases, such as hypertension, hyperlipidemia, hyperglycemia, and cardiovascular diseases [5,6,7]. Tartary buckwheat bran (TBB) is the main co-product of Tartary buckwheat processing, which is rich in rutin and has a variety of biological activities [8,9]. Yet, at present TBB is mainly used as animal feed, resulting in great waste; thus, its comprehensive development needs to be carried out urgently. The current research on TBB is mainly focused on the separation, purification, identification and bioactivities of polyphenols in TBB [10,11,12], but there are few studies on the application of TBB in the development of staple foods.
Steamed bread is a traditional staple food in China, accounting for 30% of the country’s wheat consumption [13]. With the development of mechanization and industrialization, steamed bread production technology is gradually enhanced, and the variety of products is increasing, which is favored by consumers. Although commercial steamed bread is mainly made with refined wheat flour (WF) with good sensory quality and cooking quality, the use of WF leads to problems such as excess of major nutrients and lack of micronutrients, which reduces the overall nutritional value of steamed bread [14,15]. TBB possesses a variety of functional ingredients. Replacing WF with TBB can not only meet the needs of consumers for healthy diet, but also provide theoretical reference for the development of functional staple foods. In view of this, the chemical composition and physicochemical properties of Tartary buckwheat flour (TBF), Tartary buckwheat bran flour (TBBF), and Tartary buckwheat core flour (TBCF) were compared. On this basis, the processing characteristics of TBBF–WF flour blend were systematically investigated, and the effect of the weight proportion of TBBF in the blend (Wbran) on the appearance, texture and starch digestion of steamed bread were clarified.
2. Materials and Methods
2.1. Materials and Chemicals
Tartary buckwheat (variety, Jinqiao 2) was purchased from the Institute of Crop Science, Shanxi Agricultural University (Taiyuan, China). WF was the product of China Oil & Foodstuffs Corporation (Beijing, China). The dry yeast was from Angel Yeast Co., Ltd. (Yichang, China). Rutin, 1,1-diphenyl-2-picrylhydrazyl (DPPH) and 2,2′-azinobis(3-ethylbenzothiazoline-6-sulfonic acid) diammonium salt (ABTS) were bought from Sigma-Aldrich (St. Louis, MO, USA). The other chemicals were of analytical grade.
2.2. Preparation of TBF, TBBF and TBCF
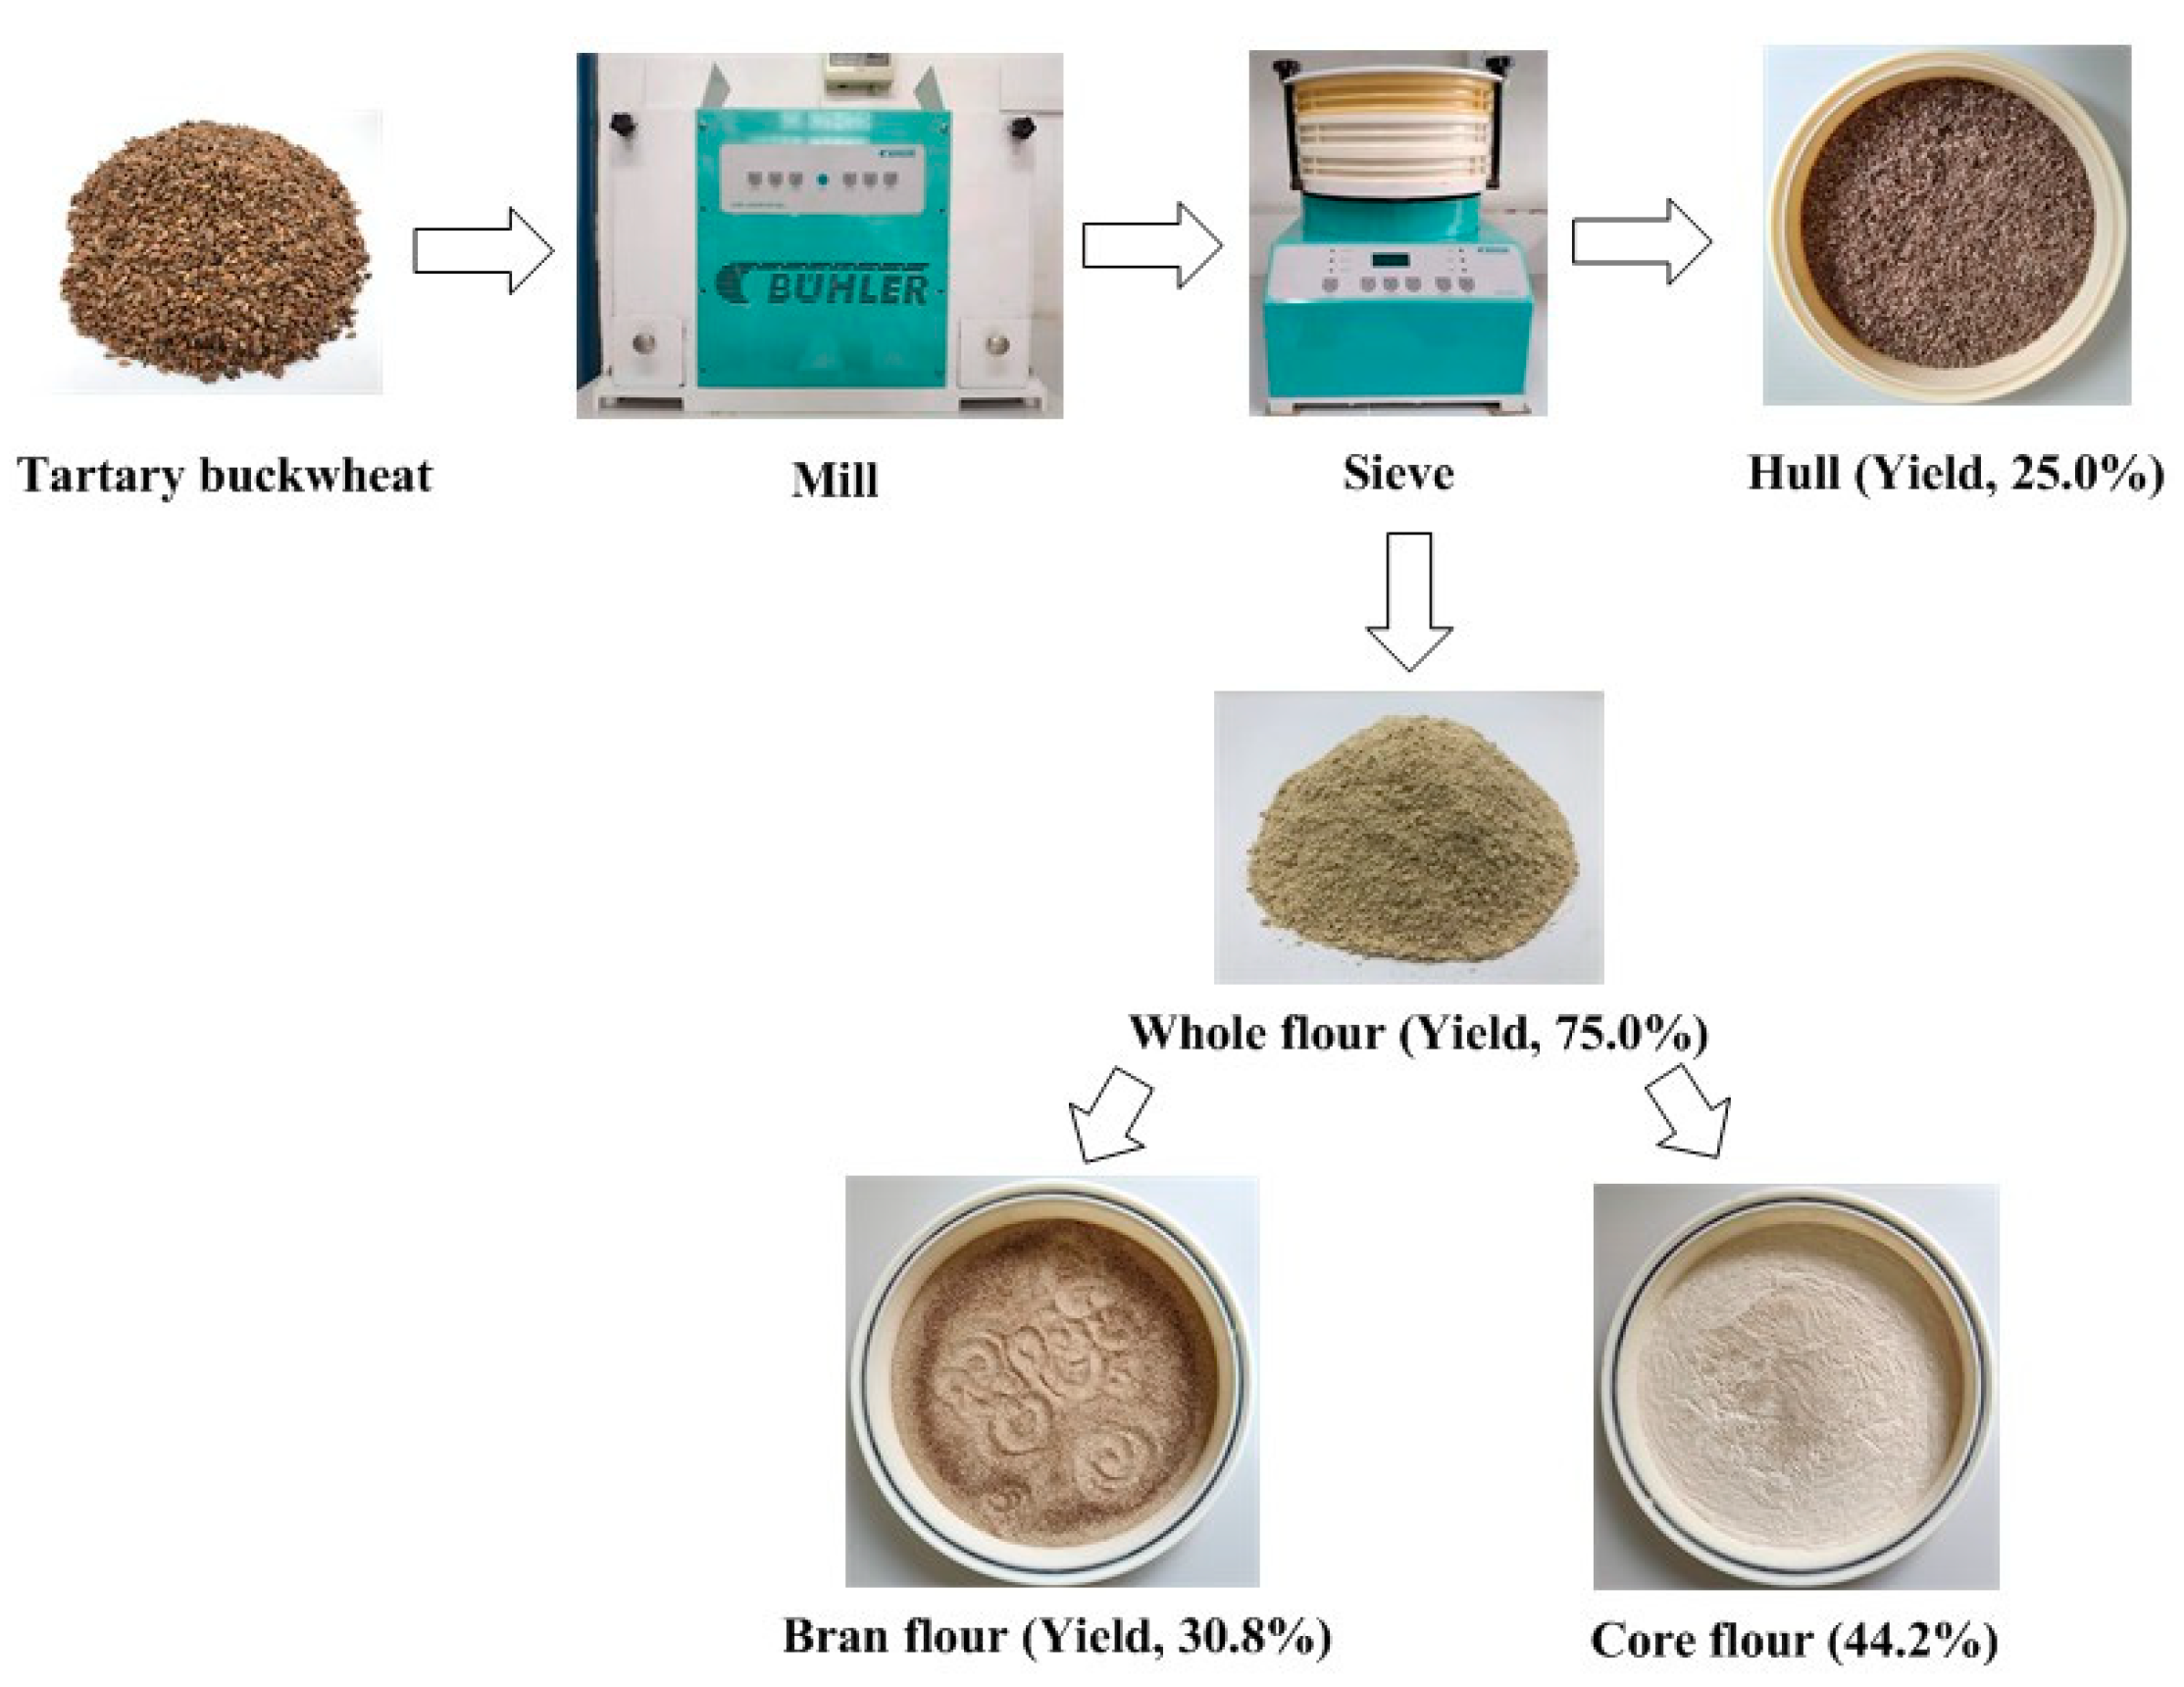
As shown in Figure 1, the cleaned Tartary buckwheat seeds were ground with a Bühler ALMB laboratory mill (Wuxi, China), then sifted at the speed of 300 rpm for 200s by a Bühler ALMC sieve shaking machine (Wuxi, China) with 26GG and 7XX sieves. The material on the 26GG sieve (-/26GG) was Tartary buckwheat hull, and the material under the 26GG sieve (26GG/-) was TBF. TBF could be further screened into TBBF (26GG/7XX) and TBCF (7XX/-). TBF, TBBF, and TBCF were crushed by a grinder, sifted through 100 mesh and preserved for the following experiments.
2.3. Routine Composition Determination
The routine composition determination of TBF, TBBF, and TBCF was carried out according to Chinese national standard methods. The moisture content was measured by the oven-drying method (GB 5009.3-2016). The mineral content was determined based on the dry ashing method with a muffle furnace (GB 5009.4-2016). The measurement of protein content was performed on a Kjeldahl apparatus (GB 5009.5-2016). The lipid was extracted by ethyl ether in a Soxhlet apparatus and determined according to GB 5009.6-2016. The starch content was measured using the polarimetric method (GB/T 20194-2018). The above results were expressed on a wet basis.
2.4. Determination of Rutin Content
The sample (3 g) was extracted with 180 mL of 80% ethanol at 80 °C for 7 h, and then filtered. The supernatant was diluted to 250 mL for HPLC analysis. HPLC measurement was performed on an Agilent 1260 HPLC system (Santa Clara, CA, USA) with an Agilent ZORBAX SB-C18 column (4.6 × 150 mm, 5 μm particle size). The mobile phase consisted of methanol and water (6:4, v/v) with the flow rate of 1.0 mL/min. The injection volume was 10 μL while the detection wavelength was set at 265 nm. The column temperature was set at 30 °C. The chromatographic data were recorded and processed by Agilent OpenLAB ChemStation software (Santa Clara, CA, USA). The rutin content was determined based the external standard method [16].
2.5. Determination of Fatty Acid Composition
According to the method of Ji et al. [17], the sample (5 g) was extracted with 150 mL of n-hexane at 60 °C for 5 h, and then filtered. The filtrate was concentrated under vacuum at 45 °C to remove n-hexane. Then, the methylation of residue was achieved with BF3-methanol reagent for GC measurement. GC analysis was performed on an Agilent 7890B gas chromatograph (Santa Clara, CA, USA) equipped with a flame ionization detector. The sample solution (1 μL) was separated by a HP-88 capillary column (100 m × 0.25 mm i.d. × 0.20 μm f.t.) with the split ratio of 50:1. High purity nitrogen was used as the carrier gas with a flow rate of 1 mL/min. Column temperature program was 140 °C (5 min) isotherm, then increased to 240 °C at the rate of 4 °C/min and was held for 10 min. The temperatures of injector and detector were 260 °C and 280 °C, respectively. The fatty acid composition was determined by comparing with standard fatty acid methyl esters.
2.6. Determination of Amino Acid Composition
According to the method of Ji et al. [17], 40 mg of sample was defatted with n-hexane and petroleum ether and moved into the hydrolysis tube. Then, 10 mL of 6 mol/L hydrochloric acid and 3-4 drops of freshly distilled phenol were added. The hydrolysis tube was filled with nitrogen and tightly covered, heated in an oven at 110 °C for 22 h. After hydrolysis, the suspension was filtered, and the tube was washed several times with ultra-pure water. The obtained hydrolysate was diluted to 50 mL with ultrapure water. Then, 1 mL of the above solution was dried under vacuum at 40 °C. The residue was re-dissolved in 1 mL ultra-pure water and dried again. This process was repeated twice. Finally, the residue was re-dissolved with 1 mL PBS (pH 2.2) and passed through the 0.22-μm filter membrane. Its amino acid composition was determined by an amino acid analyzer (Sykam, Eresing, Germany). The results were expressed as the percentage of each amino acid in the weight of the raw material.
2.7. Evaluation of Antioxidant Activity
The sample (3 g) was extracted with 180 mL of 80% ethanol at 80 °C for 7 h, and then filtered. The filtrate was concentrated at 40 °C under vacuum and lyophilized by an Alpha 1–4 freezer dryer (Christ, Osterode, Germany), and the extract was collected for the DPPH and ABTS radical scavenging assay.
The DPPH scavenging activity of the sample was evaluated by the method of Ngamsuk et al. [18], 2 mL of the sample ethanol solution at different concentrations and 2 mL of 2 × 10⁻⁴ mol/L DPPH ethanol solution were mixed and incubated for 0.5 h at 25 °C. Then, the absorbance of sample solution at 517 nm (Asample) was read. The control was a mixture of 2.0 mL DPPH solution and 2.0 mL ethanol, and its absorbance at 517 nm (Acontrol) was also measured. The DPPH radical scavenging activity could be calculated based on the following formula:
The ABTS scavenging activity of the sample was evaluated by the method of Fogarasi et al. [19]. First, 100 mL of 7 mM ABTS solution and 1.75 mL of 2.45 mM potassium persulfate solution was mixed, and incubated at 25 °C for 12 h. The above mixture was diluted with PBS (0.05 M, pH7.4) until its absorbance at 734 nm was 0.70 ± 0.02, which was collected as the ABTS test solution. 0.15 mL of the sample ethanol solution at different concentrations and 2.85 mL of ABTS test solution were mixed and incubated for 10 min at 25 °C. Then, its absorbance at 734 nm (Asample) was read. The absorbance of the mixture of 0.15 mL ethanol and 2.85 mL ABTS test solution at 734 nm was also measured as Acontrol. The ABTS radical scavenging activity could be calculated based on the following formula:
2.8. Determination of Water Absorption Index and Water Solubility Index
According to the method of Heo et al. [20], the water absorption index (WAI) and water solubility index (WSI) of TBF, TBBF, and TBCF were evaluated. The sample (1.5 g) was put into a 50 mL centrifuge tube, mixed with 20 mL distilled water, and oscillated violently until it was completely dispersed to form a suspension system. The mixture was incubated at 30 °C for 30 min, oscillating continuously, and then centrifuged at 6000 rpm for 15 min. Finally, the supernatant was poured into an aluminum box and dried at 105 °C to constant weight. The WAI and WSI could be calculated based on the following equations:
where m0, m1 and m2 are the sample mass, the solid mass in the supernatant and the precipitation mass in the centrifuge tube, respectively.
2.9. Determination of Dough Rheological Properties
The dough rheological properties of TBF, TBBF, TBCF, and TBBF-WF flour blend (Wbran = 0, 10, 30, 50, 70, and 90%) were measured by a Mixolab 2 apparatus (Chopin, Paris, France) based on the “Chopin+” protocol. The dough weight was set at 75 g, and the amount of water added was corrected based on 14% moisture content, which made the dough produce the torque of 1.1 ± 0.5 Nm at the mixing speed of 80 rpm. The protocol was run for a total of 45 min, including three stages: (1) Constant temperature stage, the dough was mixed at the speed of 80 rpm at 30 °C for 8 min; (2) Heating stage, the dough was heated to 90 °C at a rate of 4 °C/min in 15 min and kept for 7 min; (3) Cooling stage, the dough was cooled to 50 °C at a rate of 4 °C/min in 10 min and held for 5 min.
2.10. Preparation of Steamed Bread
The steamed bread containing TBBF-WF flour blend (Wbran = 0, 10, 30, 50, 70, and 90%) were prepared according to Chinese Standard GB/T 35991-2018. Dry yeast (1 g, 1%) was dissolved in water (38 °C). Then, 100 g of flour and the yeast solution was mixed in a K5SS blender (Whirlpool, Benton Harbor, MI, USA) for 7 min until the dough was formed. The dough was incubated in a Shengheng FJX-13 fermentation tank (Guangzhou, China) for 1 h at 37 °C and 85% RH. The obtained dough was rolled 10 times by a Fuxing DMT-10B dough sheeter with 5-mm roller gap (Longkou, China). The treated dough was divided into two pieces. Each piece was shaped by hand to yield a smooth dough ball, placed in a steamer and proofed for 0.5 h at 37 °C and 85% RH. The dough pieces were steamed for 25 min and cooled for 60 min for the following measurements.
2.11. Quality Evaluation of Steamed Bread
The color of steamed bread was determined using a CR-400 colorimeter (Konica-Minolta, Osaka, Japan) using the L*, a*, and b* color scale. Its volume was measured using rapeseed displacement. Then, the corresponding specific volume was calculated by dividing volume by weight. The textural properties of steamed bread were evaluated based on the TPA mode by a TA-XT Plus texture analyzer (Stable Micro Systems, Surrey, UK) equipped with a P/36R probe. The pretest speed, test speed and post-test speed of probe were 3.0 mm/s, 1.0 mm/s, and 1.0 mm/s, respectively. The compression strain was set at 30% while the auto trigger force was 5.0 g. The data were recorded and processed by Exponent 6.1 software. The image of steamed bread slice was analyzed by a C-Cell imaging system (Calibre Control International Ltd., Warrington, UK), which could provide the detailed structural information, such as slice area, cell diameter, cell volume and so on.
2.12. In Vitro Digestion Method
The in vitro digestion of steamed bread was performed on a NutriScan GI20 glycemic index analyzer at 37 °C. The freeze-dried and crushed steamed bread containing 50 mg starch was mixed with 2 mL simulated saliva solution, and the peristaltic movement of oral digestion was simulated by a rotor. After 5 min, 5 mL simulated gastric solution was added to the above solution and reacted for 1.5 h. After the pH value of the solution was adjusted, it was mixed with 5 mL simulated intestinal fluid and hydrolyzed for 4 h. The released glucose was monitored by the built-in glucose analyzer, and the predicted glycemic index (pGI) was calculated automatically [21].
2.13. Statistical Analysis
The experimental results were expressed as the average ± standard deviation (n = 3). The statistical comparison was based on the Tukey method with a confidence level of 95% using the SPSS 18 software package (SPSS Inc., Chicago, IL, USA).
3. Results and Discussion
3.1. Chemical Composition
As shown in Table 1, there were significant differences in the chemical compositions of TBF, TBCF, and TBBF (p < 0.05). The moisture content and starch content of TBBF were lower than those of TBF and TBCF, while its mineral, protein, lipid, and rutin contents were much higher than those of TBF and TBCF. As a flavonoid, rutin has many health-promoting functions, such as antioxidant, anti-inflammatory, anti-tumor, and antiviral activities, among others [22,23]. The rutin content of TBBF was as high as 3.27%, which was higher than that of common cereal flour. The lipid content of TBBF was also superior to that of TBF, which was more than 3 times that of TBCF, and its fatty acid composition was consistent with that of TBF and TBCF. It was rich in unsaturated fatty acids such as oleic acid (C18:1), linoleic acid (C18:2), linolenic acid (C18:3), and its total unsaturated fatty acid composition was more than 81% (Table 2), which is beneficial for reducing blood lipids, prevent atherosclerosis, and maintaining cognitive ability [24]. Similarly, due to the high protein content of TBBF, the content of various amino acids in TBBF was significantly higher than that in TBF and TBCF. And it was rich in the essential amino acids such as lysine, threonine, and valine (Table 3).
3.2. Antioxidant Activities
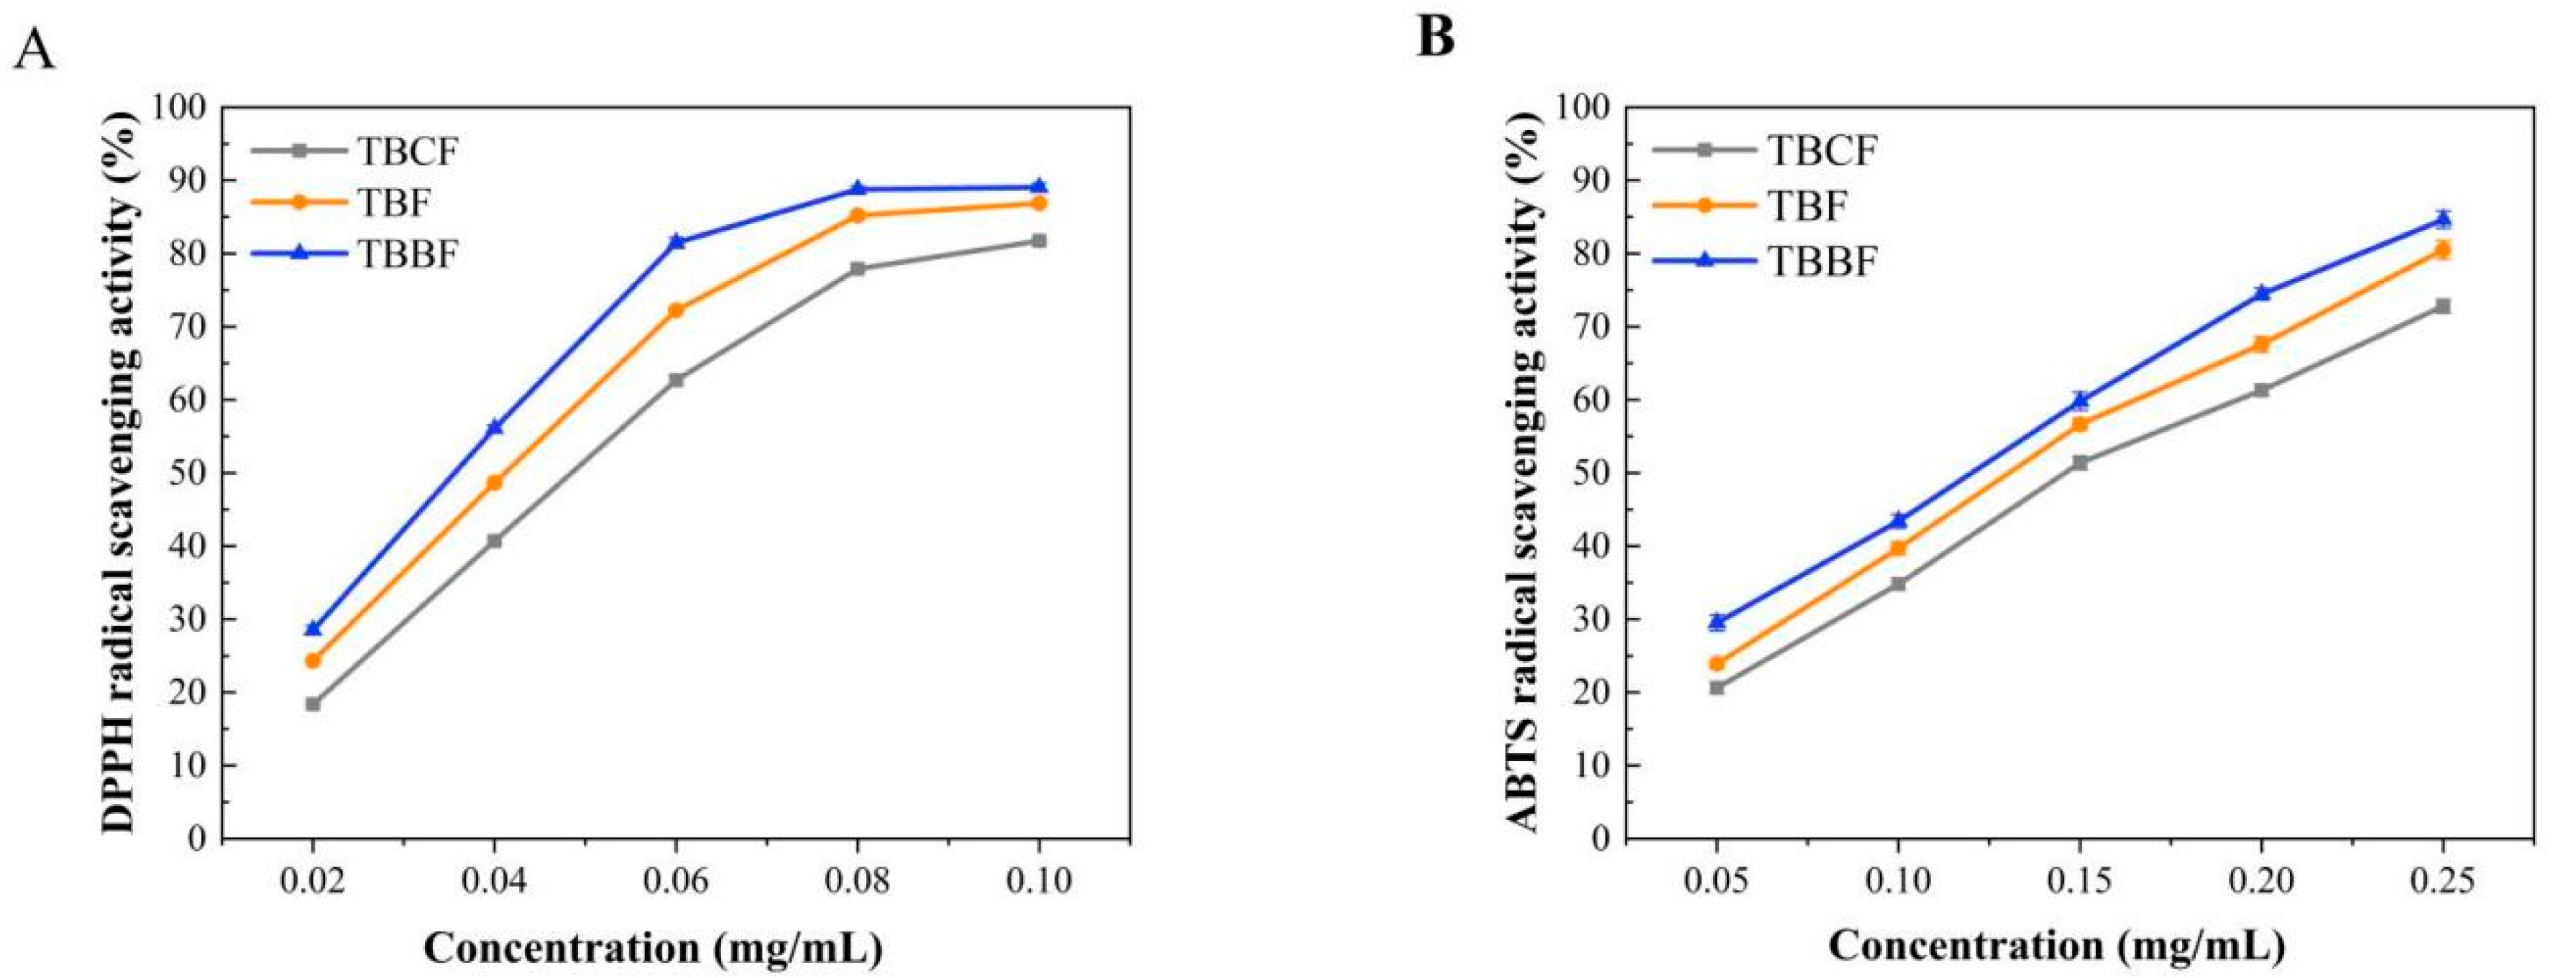
Reactive oxygen species (reactive oxygen species, ROS) are mainly produced from the mitochondrial respiratory chain in cells under oxidative stress, which play an important role in a variety of physiological and pathological processes [25]. Many reports confirm that under normal circumstances, the ROS in the organism always maintains a very low level of balance, but the level of ROS in mitochondria in many diseases such as cardiovascular disease, diabetes, tumor, and inflammation is much higher than that in normal cells, and plant-derived antioxidants can effectively maintain the balance of ROS, and reduce oxidative stress and age-related diseases [26,27]. DPPH and ABTS are both relatively stable synthetic free radicals. When antioxidants are present, the color of their solutions will gradually fade, and the activity of antioxidants can be reflected according to the change of absorbance at 517 and 734 nm. In this study, the DPPH and ABTS radical scavenging capacities of the extracts of TBF, TBCF, and TBBF were systematically evaluated (Figure 2). All the extracts exhibited strong DPPH and ABTS scavenging activities in a concentration-dependent manner. At the same concentration, there were significant differences in scavenging performance (p < 0.05), their activities followed this order: TBBF > TBF > TBCF. The high antioxidant activity of TBBF should be attributed to its high rutin content.
3.3. Dough Properties
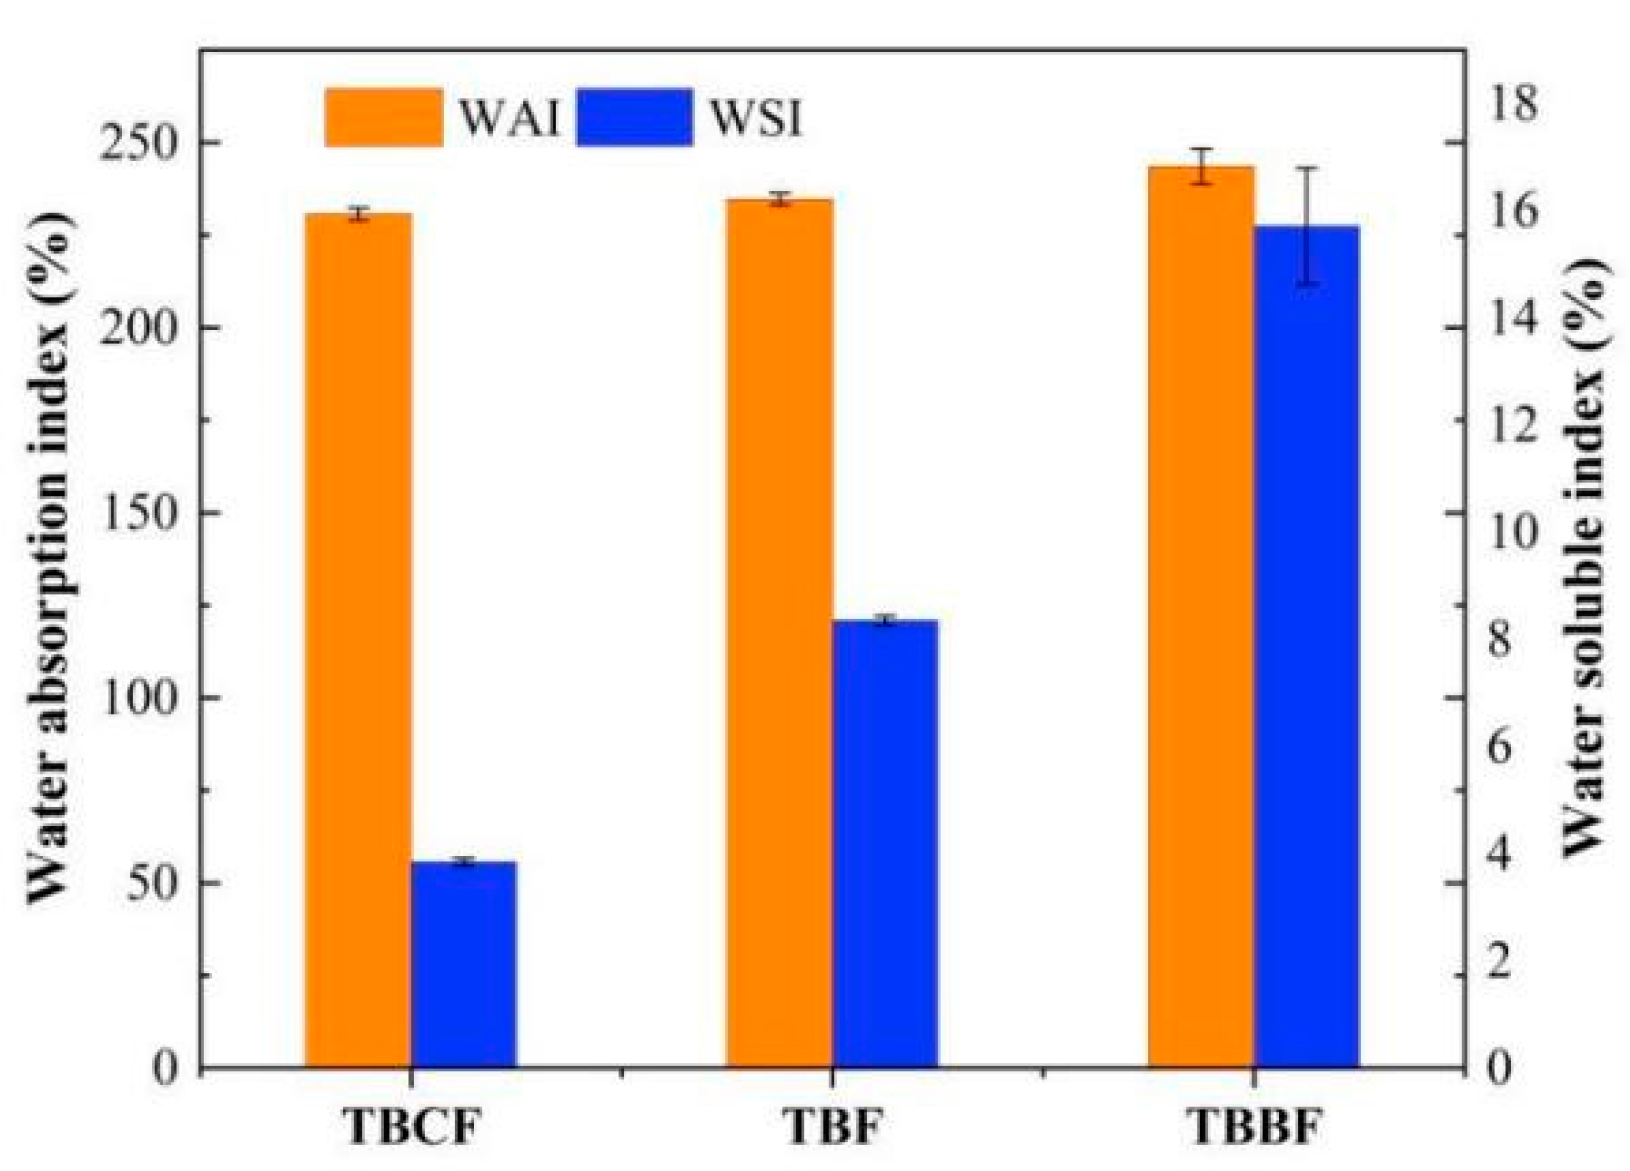
WAI represents the water-holding capacity of the sample, while WSI reflects the solubility of the sample in water [28]. It could be observed from Figure 3 that there is no significant difference in WAI among the samples, but there was a significant difference in their WSI (p < 0.05) with the order of TBBF > TBCF > TBF. The outstanding performance of TBBF might be attributed to its high protein content.
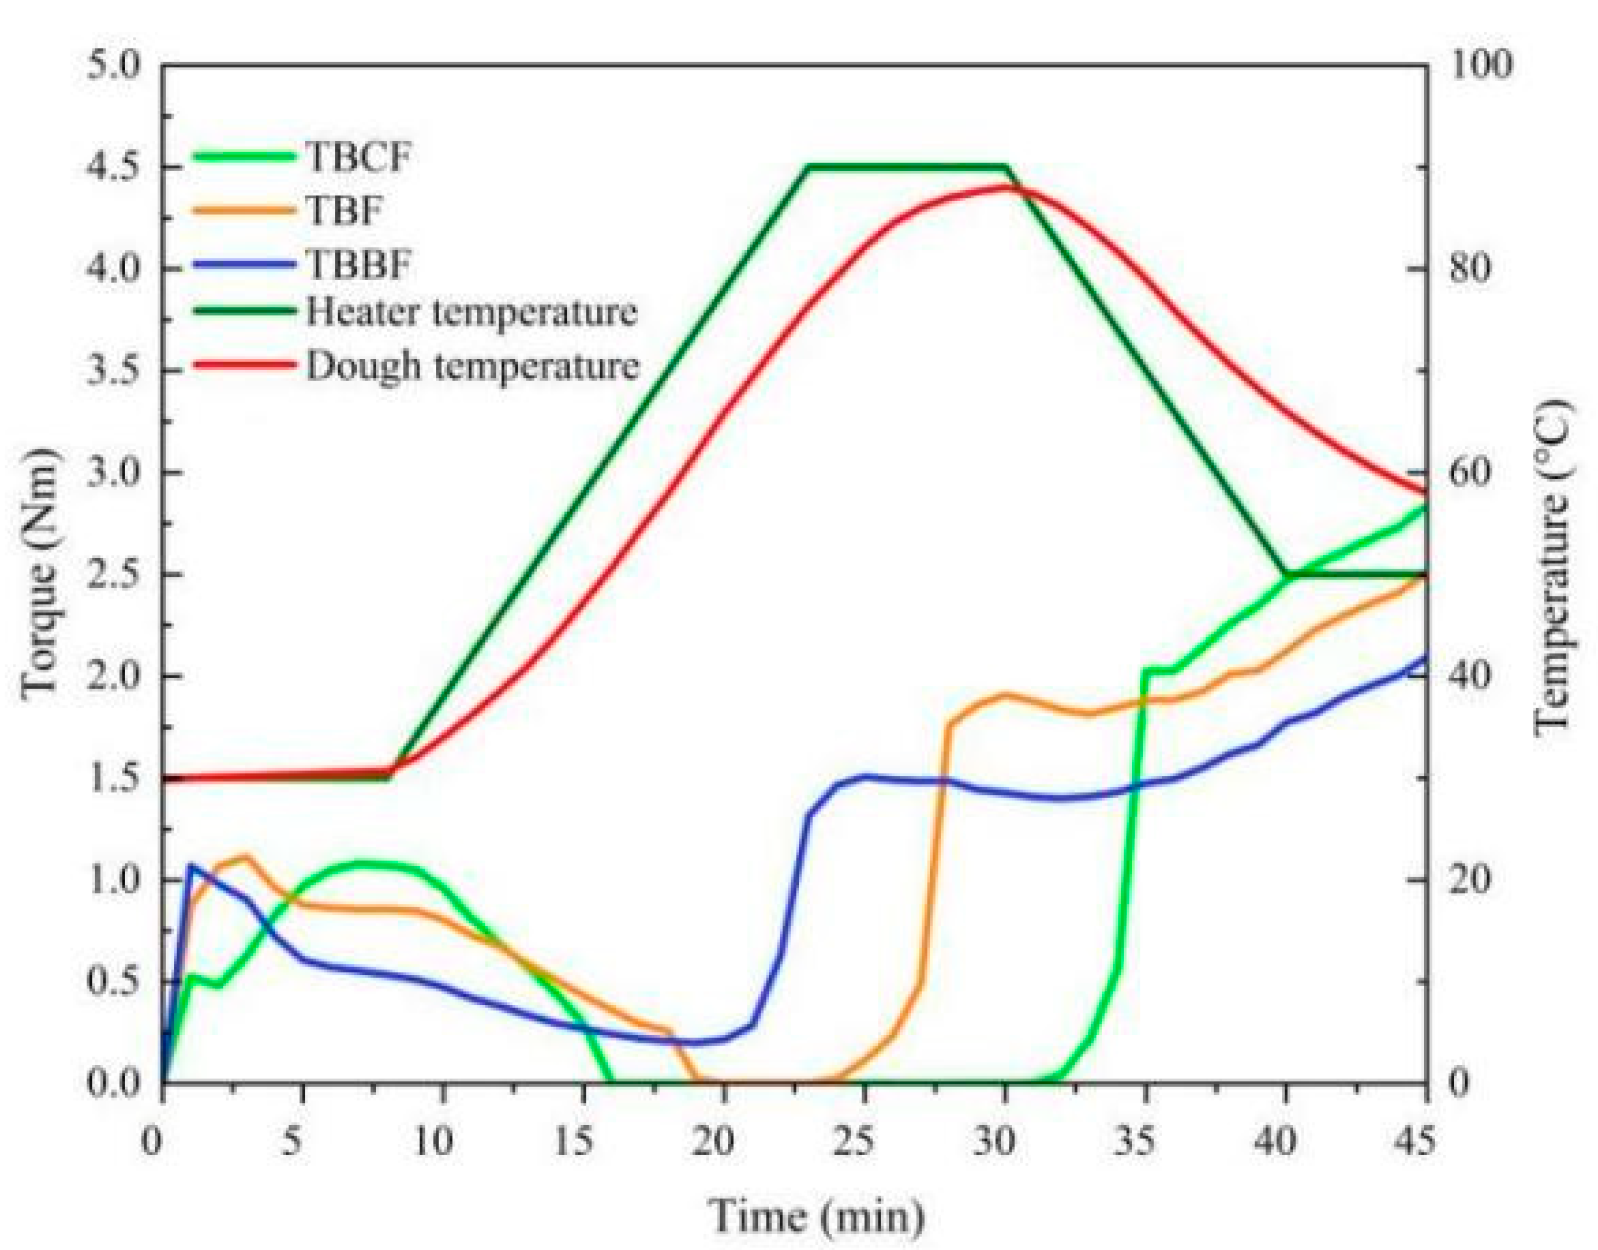
The dough properties of TBF, TBCF, and TBBF were measured with the Mixolab® protocol. As shown in Figure 4 and Table 4, different samples had different dough torque curves. At the initial stage, the dough formation time of TBBF was significantly lower than that of TBF and TBCF, which could be due to the fact that its high protein content could accelerate dough formation. During the heating process, the torque C2 values of TBF and TBCF were 0, suggesting that their protein weakening degrees were very large, and the dilution effect caused by them reduced the viscosity of the dough. The hardness and stickiness of the gelatinized dough of TBBF was higher than that of TBCF and less than that of TBF since its torque C3 (Peak viscosity of gelatinization) was between TBF and TBCF. When the temperature decreased, the torque C5 of TBBF was obviously lower than that of TBF and TBCF, confirming that its starch retrogradation was not easy to occur.
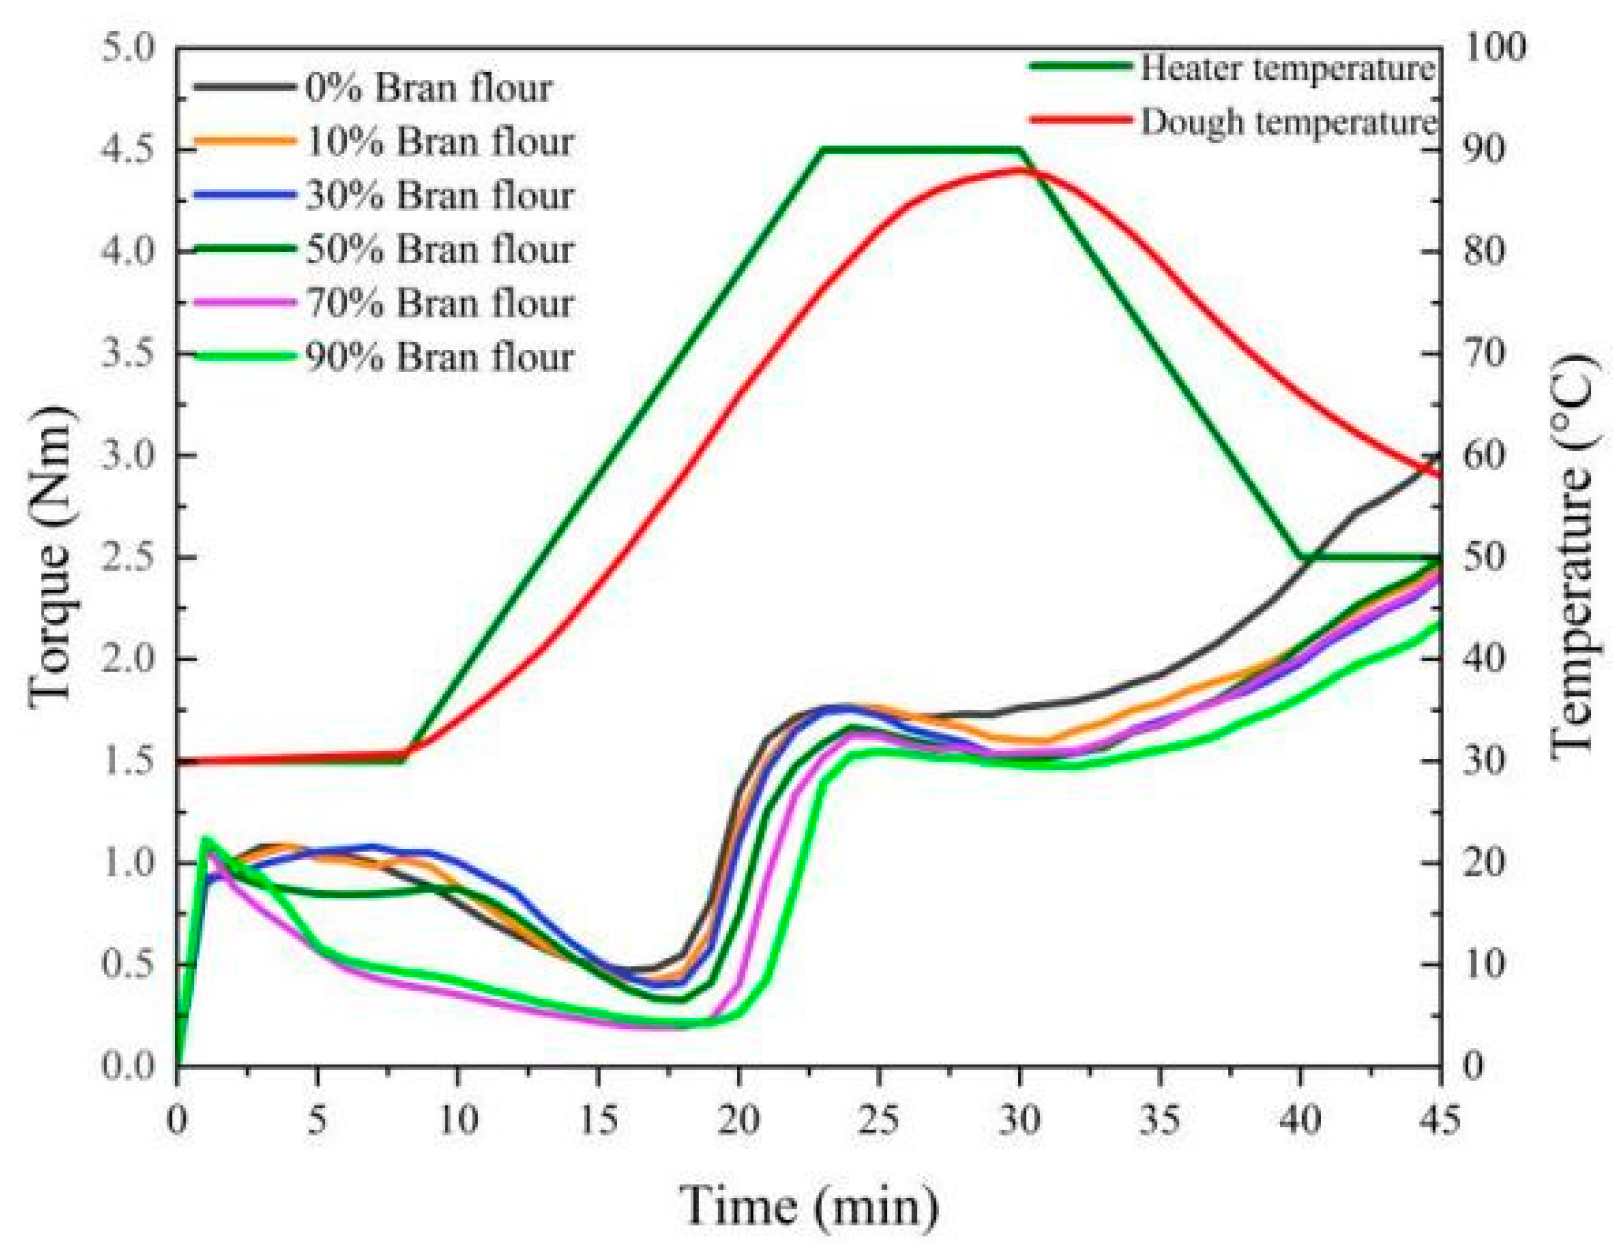
TBBF was rich in rutin and protein, so it possessed excellent antioxidant activity and dough rheological properties, so it can be used in the development of functional staple foods. Herein, the dough rheological properties of TBBF–-WF flour blend were investigated systematically. The ratio of TBBF in the blend (Wbran) had a significant effect on the torque curve and parameters of dough (Figure 5 and Table 5). With the increase of Wbran, the water absorption of dough decreased gradually, which may be due to the fact that the water absorption of TBBF was slightly lower than that of WF. When Wbran increased from 0% to 30%, the development time and stability time of the dough increased significantly, and reached the maximum at 30%, confirming that the dough had the best endurance to mixing. When Wbran was more than 30%, the development time and stability time of the dough decreased greatly, and the dough properties decreased sharply. With the addition of TBBF, the protein weakening degree (C2) also decreased rapidly, indicating that TBBF caused the dilution effect of dough and weakened the gluten network. In addition, when Wbran increased from 0% to 30%, there was no significant difference in C3. When it increased from 50% to 90%, C3 decreased significantly, suggesting that the hardness and stickiness of the dough decreased gradually after gelatinization. C3-C2 (Gelatinization degree) and β (Gelatinization rate) reached the maximum when Wbran was 70%, at this time, the gelatinization performance was the highest, and the gelatinization speed was the fastest. The dough developed at Wbran = 90% exhibited the highest thermal stability and resistance to starch retrogradation since it had the smallest C3-C4 and C5-C4 values.
3.4. Steamed Bread
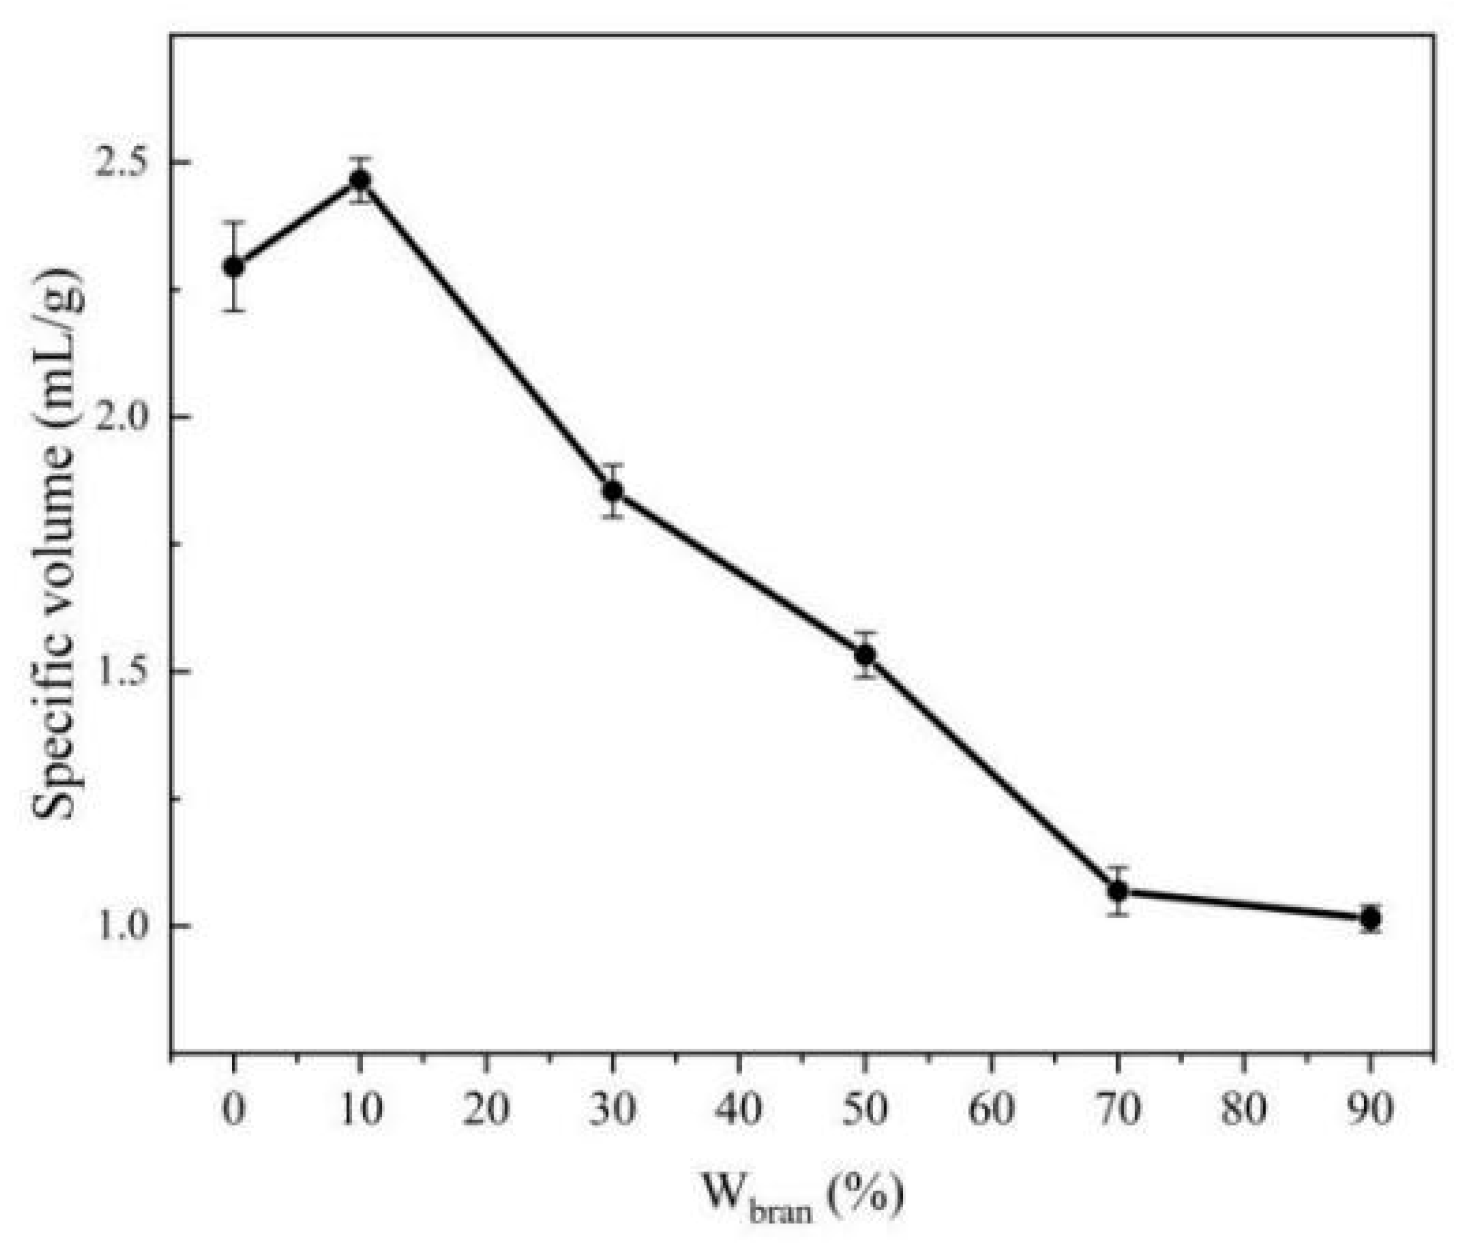
The color and specific volume of steamed bread is an indispensable part that determines the sensory quality of steamed bread, which directly affects the acceptance of consumers [29]. The effect of Wbran on the color difference of steamed bread was investigated (Table 6). With the increase of Wbran, L* decreased significantly, and the values of a* and b* increased at first and then decreased, indicating that the color of the steamed bread gradually darkened and yellowed, which could be related to the yellowish green of TBBF itself. Figure 6 demonstrated the effect of Wbran on the specific volume of steamed bread. With the increase of Wbran, the specific volume of steamed bread declined gradually. For the steamed breads developed at Wbran = 70% and 90%, their specific volumes had no difference (p > 0.05), which was close to 1. It may be due to the dilution effect of TBBF on gluten protein, which hindered the formation of gluten network, resulting in the decrease of dough expansion and the reduction of steamed bread volume during fermentation.
Chewiness and hardness are the important indexes to reflect the quality of steamed bread. The chewiness, hardness, and gumminess of steamed bread are negatively correlated with the quality of steamed bread, while the resilience and springiness are positively correlated with the quality of steamed bread [13]. Table 7 exhibited the effect of Wbran on the texture of steamed bread. With the addition of TBBF, the hardness, gumminess, and chewiness of steamed bread gradually increased, while the springiness increased at first and then decreased, and there was no significant change after the addition of 50% TBBF. This may be due to the dilution of gluten concentration in dough caused by TBBF, which destroyed the gluten network to a certain extent, and the structure of steamed bread was not fluffy enough, leading to the increase of hardness and chewiness and decrease of springiness of steamed bread. The change trend of cohesiveness and resilience was similar, the addition of TBBF had no significant change at 0% and 10%, but cohesiveness and resilience reduced with the increase of Wbran, and there was no significant change when Wbran exceeded 50%. This may be due to the fact that the addition of TBBF affected the formation of gluten network structure, resulting in incomplete gluten network structure formed after dough fermentation, and it was difficult to return to its original state after compression deformation, so the cohesiveness and resilience descended.
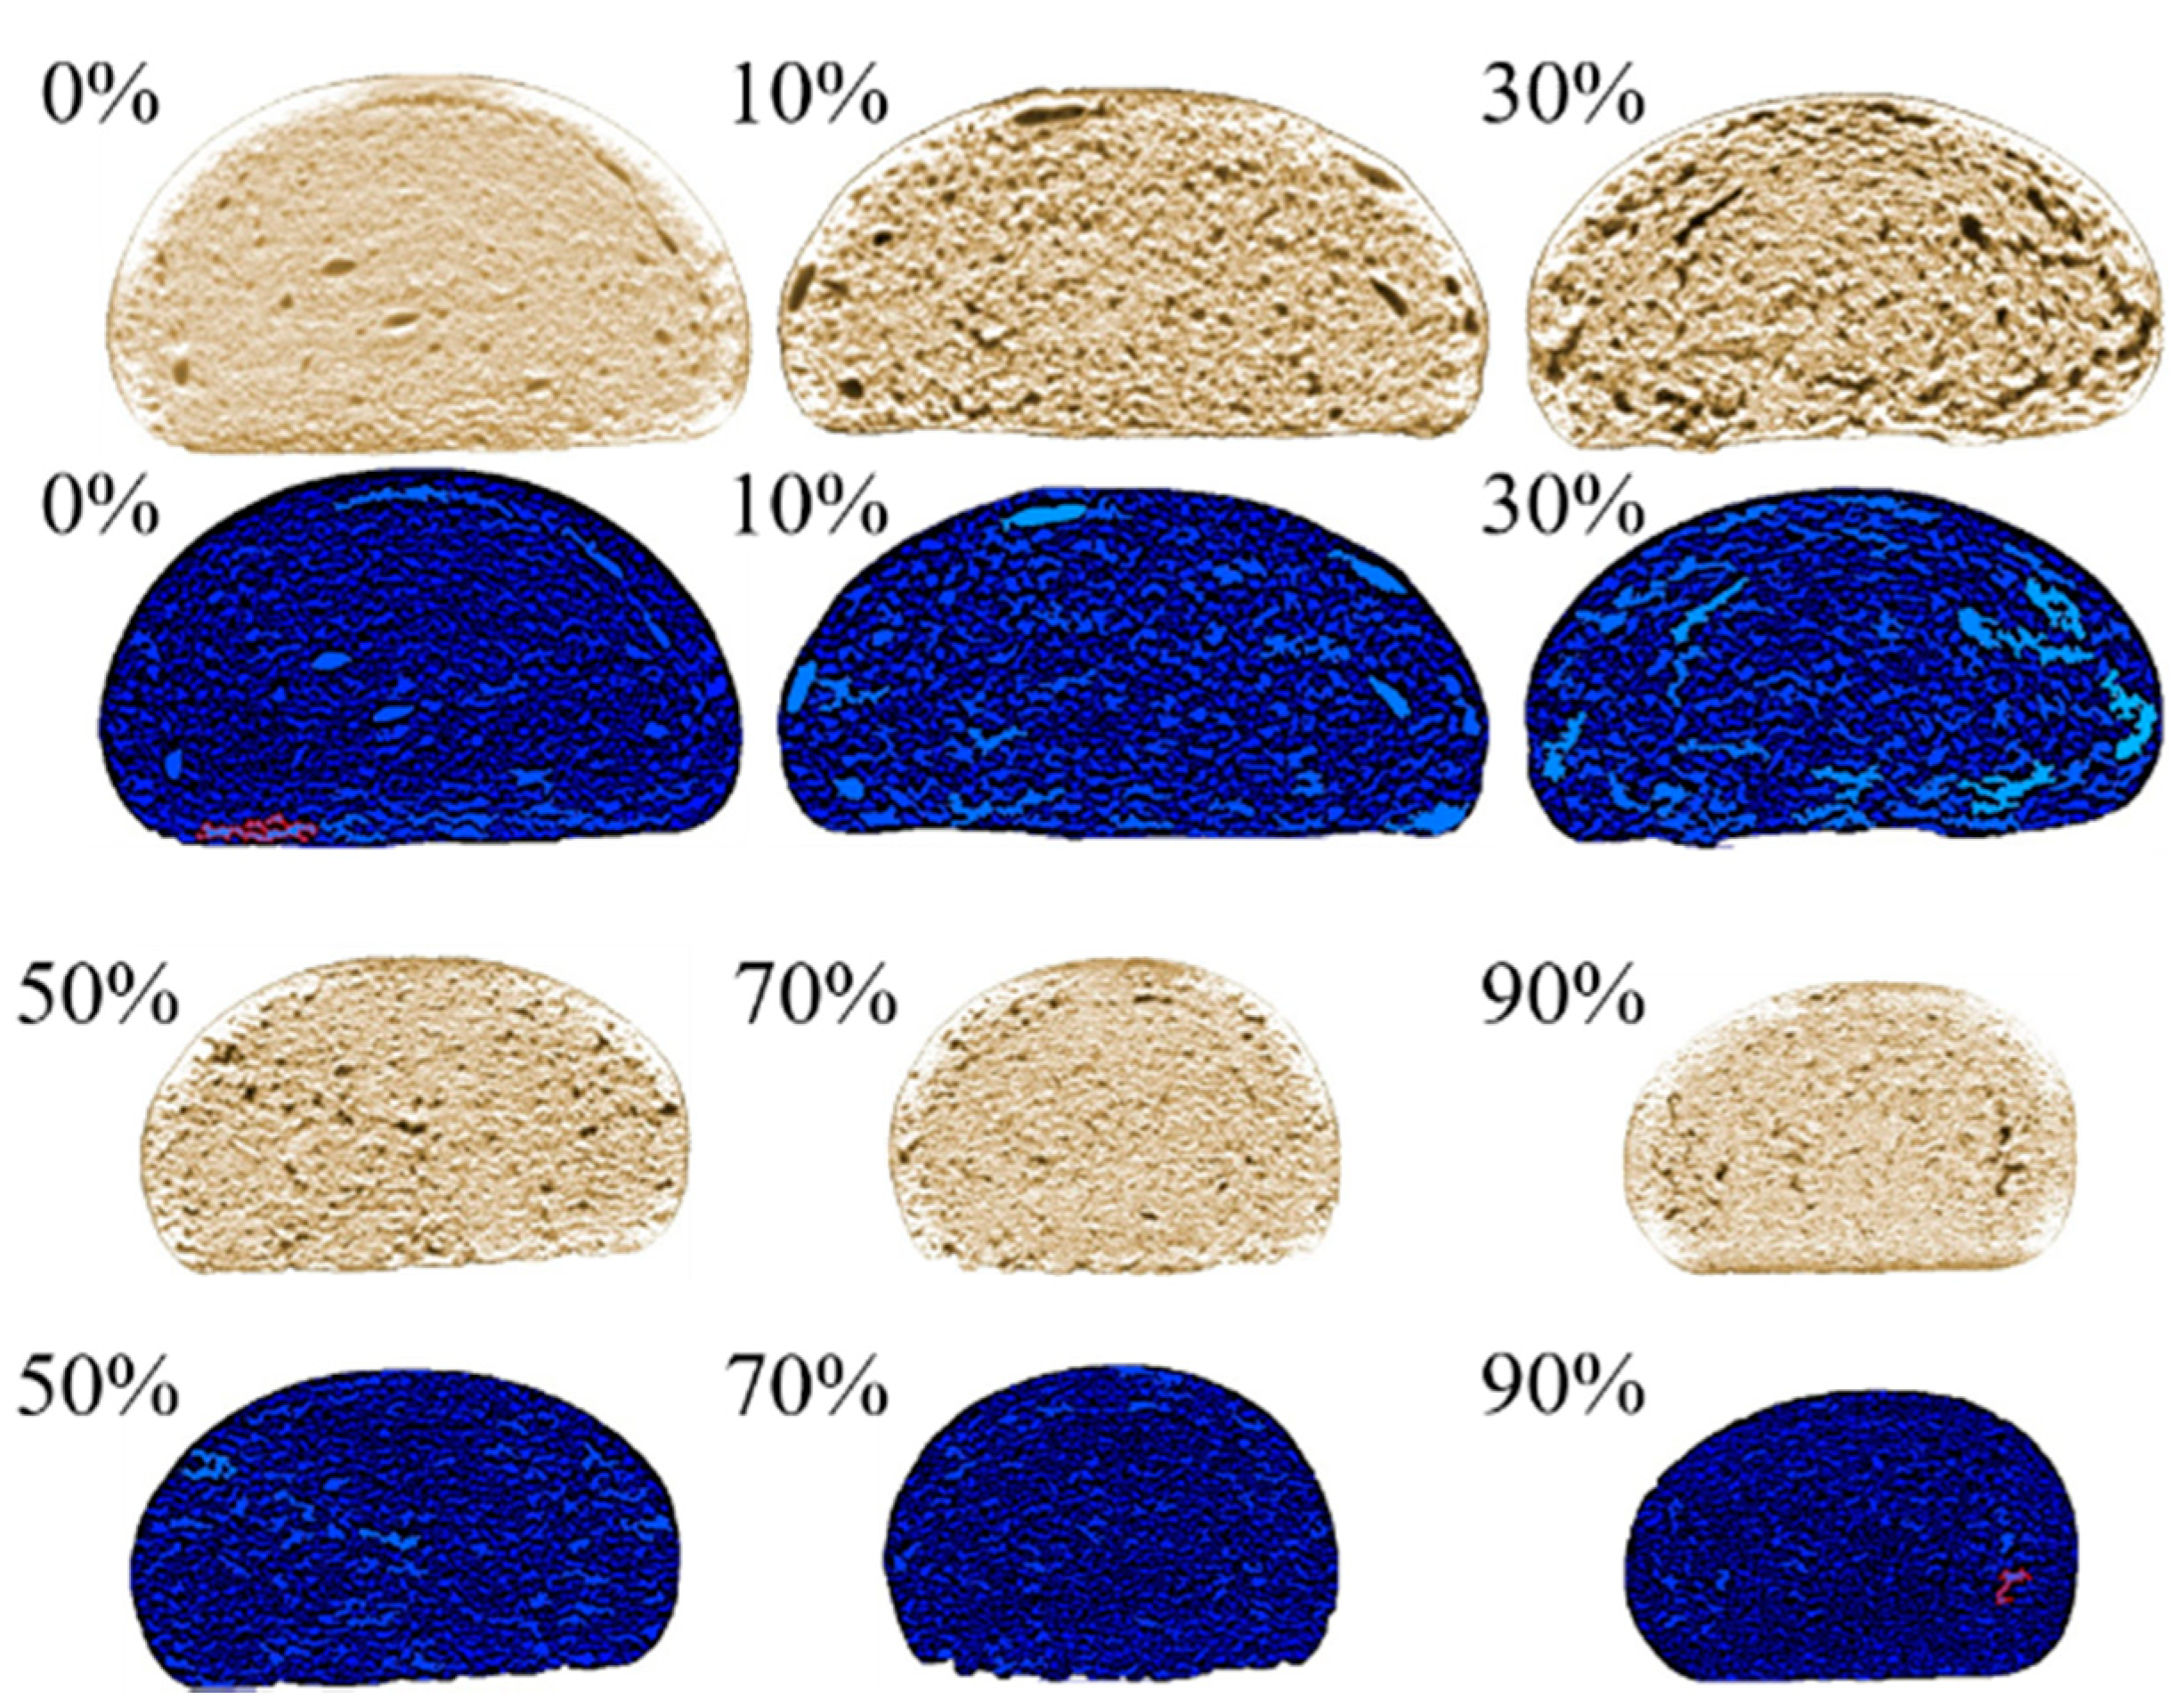
C-Cell image analyzer is a quality control system of fermented flour products based on computer recognition technology. Through image processing of sample slices, it can obtain the characteristic parameters of cells and slices, and comprehensively evaluate the internal texture structure of products [30]. Figure 7 shows the C-Cell images of steamed bread with different Wbran values, the corresponding parameters were summarized in Table 8. With the increase of Wbran, the slice area, brightness, and cell area of steamed bread decreased, cell contrast, cell number, cell elongation, and cell density decreased at first and then increased, while cell diameter, wall thickness, cell volume, and coarse cell volume increased at first and then decreased. The addition of TBBF at the level of 10% and 30% could reduce the texture of steamed bread. When Wbran ≥ 50%, the air-holding property of the dough decreased during the fermentation process, leading to a tighter tissue and a sandy interior of the steamed bread. After 10%, the addition of TBBF could make the cell wall thinner, improve cell contrast, and weaken the gloss of steamed bread.
3.5. pGI
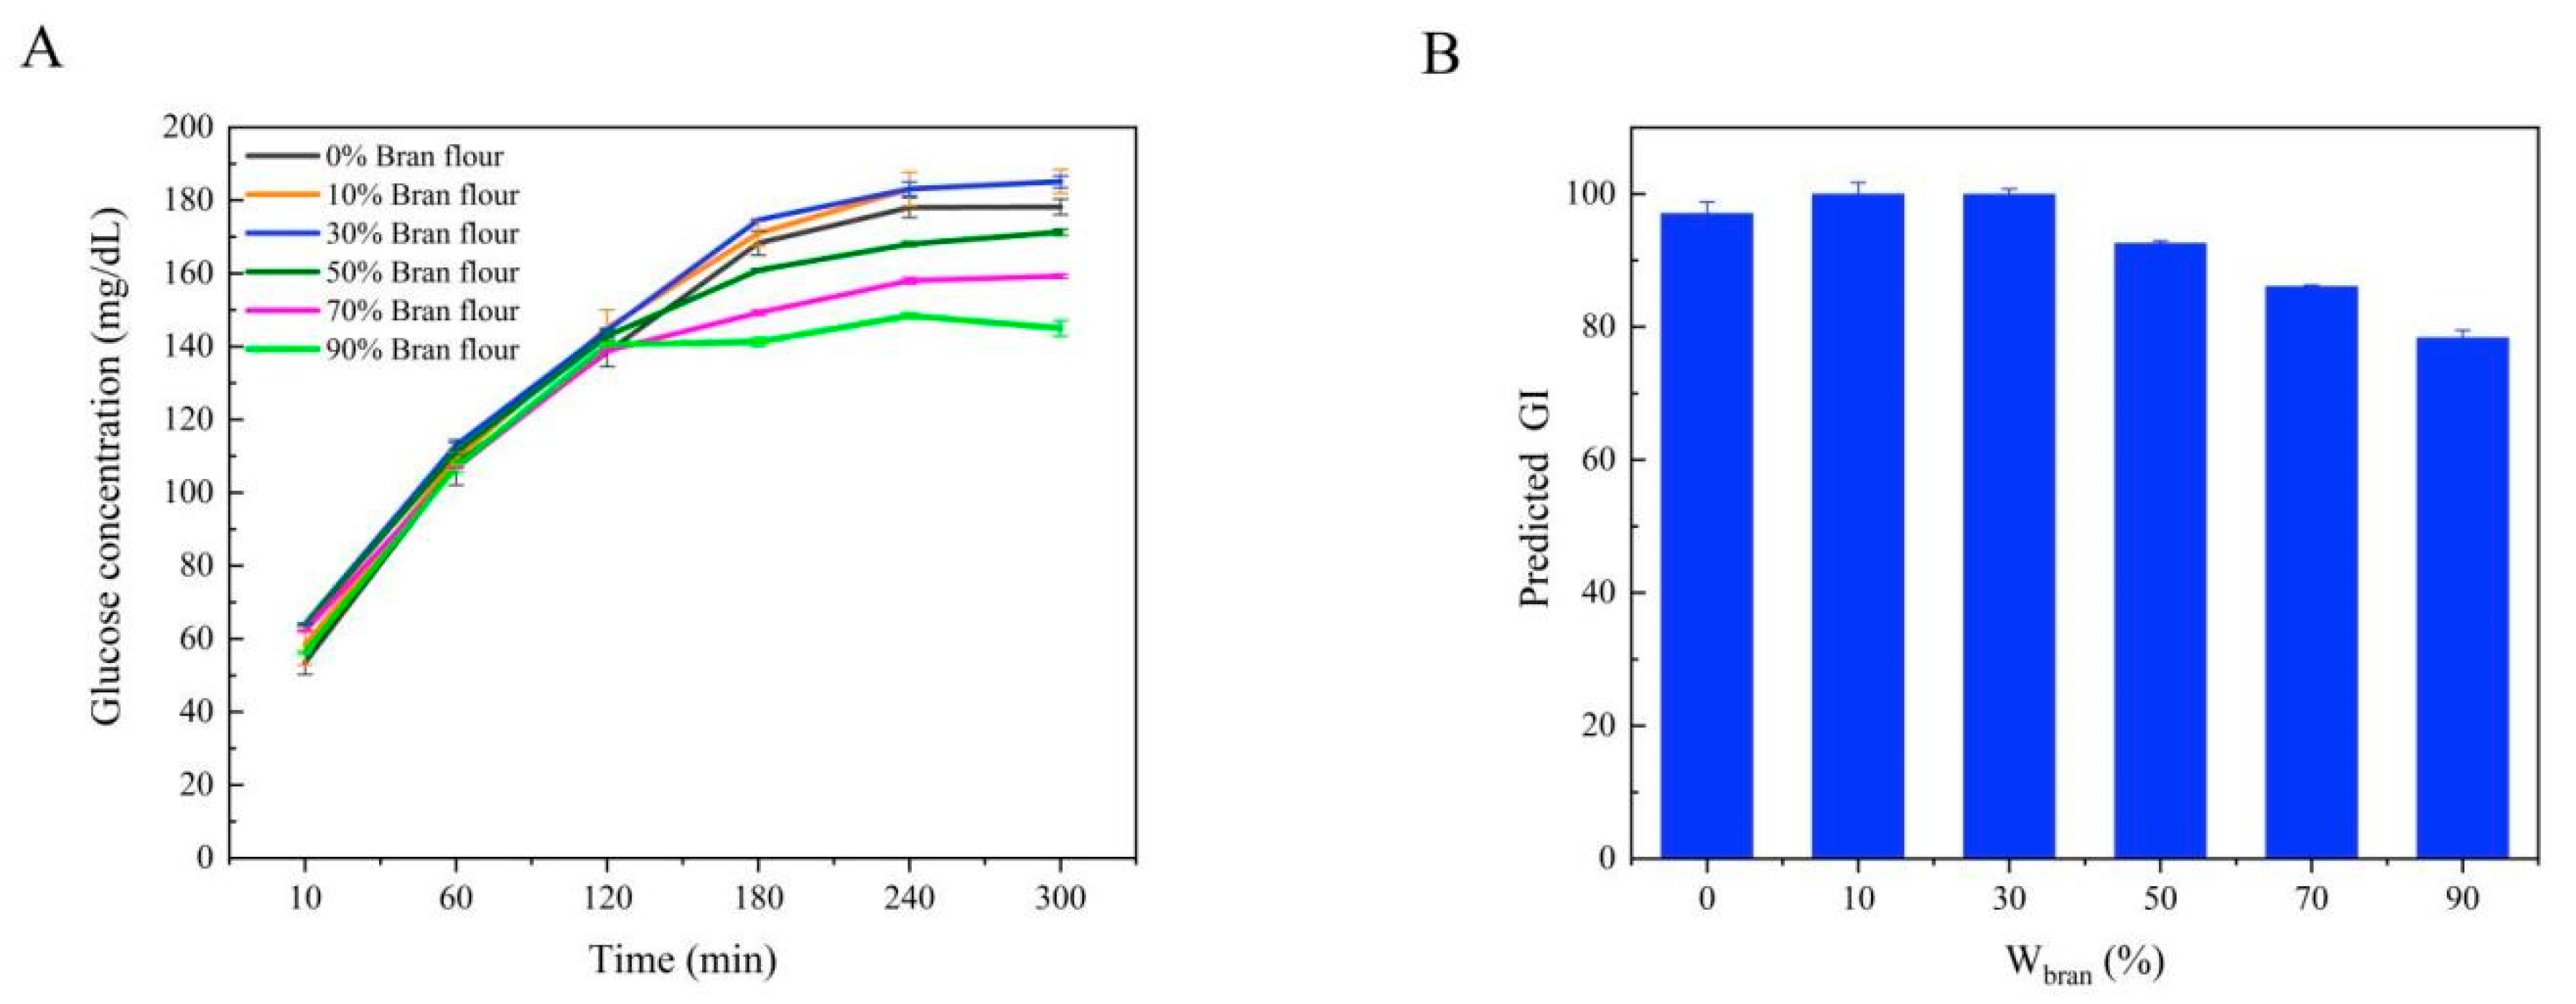
The glycemic index (GI) of food is used to reflect the effect of carbohydrates in food on blood glucose concentration [31]. Foods with high GI can be digested quickly and have a high absorption rate after entering the gastrointestinal tract, resulting in a rapid rise in blood glucose concentration. Foods with low GI stay in the gastrointestinal tract for a long time and have a low absorption rate, which leads to a slow rise in blood glucose concentration. Studies have shown that low-GI foods can improve blood glucose control in patients with diabetes and play a positive role in the prevention of cardiovascular diseases [32]. However, the determination of GI value is more complicated, and the NutriScan GI20 glycemic index analyzer can real-time track the hydrolysis of starch during simulated digestion of food and convert the results into the predicted GI value (pGI). The effect of Wbran on starch hydrolysis during steamed bread digestion is shown in Figure 8A.
With the progress of digestion, the starch hydrolysis of steamed bread with Wbran of 0%, 10% and 30% was carried out quickly before 180 min and stabilized after 180 min. The starch hydrolysis of steamed bread developed at Wbran = 50, 70 and 90% also increased rapidly before 120 min, and the growth rate was slow and stable after 120 min. At 300 min, the starch hydrolysis of steamed bread developed at Wbran = 90% was the lowest. Based on the whole digestion process, the pGI values of steamed breads with different Wbran values could be obtained (Figure 8B). With the increase of Wbran, the pGI value of steamed bread decreased gradually. The mechanism of low starch digestion of the steamed bread developed by TBBF–WF blend may be attributed to the following reasons: (1) TBBF is rich in polyphenols represented by rutin, which interact with starch to form the complex that can reduce the digestibility of starch; on the other hand, polyphenols can also combine with digestive enzymes such as α-amylase and α-glucosidase to further reduce the hydrolysis rate of starch; (2) TBBF is rich in lipids, and the starch-lipid complex formed can resist the effect of digestive enzymes and retard the hydrolysis of starch; (3) TBBF is rich in proteins, which can wrap starch to a certain extent. The protein attached to the surface of starch granules can hinder the contact between digestive enzymes and starch and delay starch hydrolysis.
4. Conclusions
In this study, TBF, TBCF, and TBBF were prepared by mechanical grinding combined with sieving, and their chemical composition, antioxidant activity, and dough rheological properties were compared. It was found that TBBF was rich in rutin and protein, so its antioxidant performance and dough rheological properties were the best, and it could be mixed with WF for steamed bread production. Also, the dough developed at Wbran = 30% had the best kneading resistance. When Wbran was more than 30%, it would cause dilution effect and weaken the dough rheological properties. With the increase of Wbran, the color of steamed bread darkened and yellowed, the specific volume gradually decreased, its hardness, adhesion and chewiness gradually increased, while the pGI value of steamed bread decreased significantly. Our results indicate that TBBF is a new food source with antioxidant and hypoglycemic activities, which can be used in the development of new functional staple foods.
Author Contributions
Conceptualization, B.L.; methodology, S.Z., S.C. and B.L.; software, S.G. and B.L.; validation, S.Z., S.C. and S.G.; formal analysis, S.Z. and S.G.; investigation, B.L.; resources, H.M., C.L. and B.L.; data curation, S.C.; writing—original draft preparation, S.Z. and B.L.; writing—review and editing, B.L. and H.M.; visualization, S.Z. and S.C.; supervision, B.L.; project administration, B.L.; funding acquisition, B.L. and C.L. All authors have read and agreed to the published version of the manuscript.
Funding
This research was supported by the National Natural Science Foundation of China (grant number, 31771941 and 32072180), Natural Science Foundation of Henan Province of China (grant number, 212300410005) and the Key Scientific Research Project of Colleges and Universities in Henan Province of China (grant number, 20zx016), Zhongyuan high level talents special support plan (grant number, 204200510010).
Data Availability Statement
The data that support the findings of this study are available on request from the corresponding author. The data are not publicly available due to privacy or ethical restrictions.
Conflicts of Interest
The authors declare no conflict of interest.
References
- Fabjan, N.; Rode, J.; Košir, I.J.; Wang, Z.; Zhang, Z.; Kreft, I. Tartary buckwheat (Fagopyrum tataricum Gaertn.) as a source of dietary rutin and quercitrin. J. Agric. Food Chem. 2003, 51, 6452–6455. [Google Scholar] [CrossRef] [PubMed]
- Luthar, Z.; Golob, A.; Germ, M.; Vombergar, B.; Kreft, I. Tartary buckwheat in human nutrition. Plants 2021, 10, 700. [Google Scholar] [CrossRef] [PubMed]
- Zhu, F. Chemical composition and health effects of Tartary buckwheat. Food Chem. 2016, 203, 231–245. [Google Scholar] [CrossRef]
- Ruan, J.; Zhou, Y.; Yan, J.; Zhou, M.; Woo, S.H.; Weng, W.; Cheng, J.; Zhang, K. Tartary buckwheat: An under-utilized edible and medicinal herb for food and nutritional security. Food Rev. Int. 2020, 1–15. [Google Scholar] [CrossRef]
- Glavac, N.K.; Stojilkovski, K.; Kreft, S.; Park, C.H.; Kreft, I. Determination of fagopyrins, rutin, and quercetin in Tartary buckwheat products. LWT Food Sci. Technol. 2017, 79, 423–427. [Google Scholar] [CrossRef]
- Lee, C.C.; Shen, S.R.; Lai, Y.J.; Wu, S.C. Rutin and quercetin, bioactive compounds from tartary buckwheat, prevent liver inflammatory injury. Food Funct. 2013, 4, 794–802. [Google Scholar] [CrossRef]
- Yang, X.; Lv, Y.P. Purification, characterization, and DNA damage protection of active components from tartary buckwheat (Fagopyrum tataricum) hull. Food Sci. Biotechnol. 2015, 24, 1959–1966. [Google Scholar] [CrossRef]
- Cho, Y.J.; Bae, I.Y.; Inglett, G.E.; Lee, S. Utilization of tartary buckwheat bran as a source of rutin and its effect on the rheological and antioxidant properties of wheat-based products. Ind. Crop. Prod. 2014, 61, 211–216. [Google Scholar] [CrossRef]
- Ge, R.H.; Wang, H. Nutrient components and bioactive compounds in tartary buckwheat bran and flour as affected by thermal processing. Int. J. Food Prop. 2020, 23, 127–137. [Google Scholar] [CrossRef] [Green Version]
- Wang, L.J.; Yang, X.S.; Qin, P.Y.; Shan, F.; Ren, G.X. Flavonoid composition, antibacterial and antioxidant properties of tartary buckwheat bran extract. Ind. Crop. Prod. 2013, 49, 312–317. [Google Scholar] [CrossRef]
- Li, B.C.; Li, Y.Q.; Hu, Q.B. Antioxidant activity of flavonoids from tartary buckwheat bran. Toxicol. Environ. Chem. 2016, 98, 429–438. [Google Scholar] [CrossRef]
- Liu, B.; Zhu, Y. Extraction of flavonoids from flavonoid-rich parts in tartary buckwheat and identification of the main flavonoids. J. Food Eng. 2007, 78, 584–587. [Google Scholar] [CrossRef]
- Li, X.N.; Wang, C.Y.; Krishnan, P.G. Effects of corn distillers dried grains on dough properties and quality of Chinese steamed bread. Food Sci. Nutr. 2020, 8, 3999–4008. [Google Scholar] [CrossRef]
- Rose, D.J.; Inglett, G.E.; Liu, S.X. Utilization of corn (Zea mays) bran and corn fiber in the production of food components. J. Sci. Food Agric. 2010, 90, 915–924. [Google Scholar] [CrossRef]
- Liu, S.X.; Singh, M.; Inglett, G. Effect of incorporation of distillers’ dried grain with solubles (DDGS) on quality of cornbread. LWT Food Sci. Technol. 2011, 44, 713–718. [Google Scholar] [CrossRef]
- Germ, M.; Árvay, J.; Vollmannová, A.; Tóth, T.; Golob, A.; Luthar, Z.; Kreft, I. The temperature threshold for the transformation of rutin to quercetin in Tartary buckwheat dough. Food Chem. 2019, 283, 28–31. [Google Scholar] [CrossRef]
- Ji, J.M.; Liu, Y.L.; Shi, L.K.; Wang, N.N.; Wang, X.D. Effect of roasting treatment on the chemical composition of sesame oil. LWT Food Sci. Technol. 2019, 101, 191–200. [Google Scholar] [CrossRef]
- Ngamsuk, S.; Huang, T.C.; Hsu, J.L. Determination of phenolic compounds, procyanidins, and antioxidant activity in processed Coffea arabica L. Leaves. Foods 2019, 8, 389. [Google Scholar] [CrossRef] [PubMed] [Green Version]
- Fogarasi, A.L.; Kun, S.; Tanko, G.; Stefanovits-Banyai, E.; Hegyesne-Vecseri, B. A comparative assessment of antioxidant properties, total phenolic content of einkorn, wheat, barley and their malts. Food Chem. 2015, 167, 1–6. [Google Scholar] [CrossRef] [PubMed]
- Heo, S.; Lee, S.M.; Shim, J.H.; Yoo, S.H.; Lee, S. Effect of dry- and wet-milled rice flours on the quality attributes of gluten-free dough and noodles. J. Food Eng. 2013, 116, 213–217. [Google Scholar] [CrossRef]
- Chandel, G.; Premi, V.; Vishwakarma, A.K.; Kaliyari, A.; Shrivastava, P.; Sahu, V.K.; Sahu, G.R. In vitro identification of low glycemic index (GI) white rice using nutriscan GI analyzer. Adv. Life Sci. 2016, 5, 11090–11098. [Google Scholar]
- Imani, A.; Maleki, N.; Bohlouli, S.; Kouhsoltani, M.; Sharifi, S.; Dizaj, S.M. Molecular mechanisms of anticancer effect of rutin. Phytother. Res. 2021, 35, 2500–2513. [Google Scholar] [CrossRef]
- Ganeshpurkar, A.; Saluja, A.K. The pharmacological potential of rutin. Saudi. Pharm. J. 2017, 25, 149–164. [Google Scholar] [CrossRef] [PubMed] [Green Version]
- Kim, S.L.; Kim, S.K.; Park, C.H. Introduction and nutritional evaluation of buckwheat sprouts as a new vegetable. Food Res. Int. 2004, 37, 319–327. [Google Scholar] [CrossRef]
- Kowaltowski, A.J.; de Souza-Pinto, N.C.; Castilho, R.F.; Vercesi, A.E. Mitochondria and reactive oxygen species. Free Radical. Biol. Med. 2009, 47, 333–343. [Google Scholar] [CrossRef] [PubMed]
- Kovacic, P.; Somanathan, R. Cell signaling and receptors with resorcinols and flavonoids: Redox, reactive oxygen species, and physiological effects. J. Recept. Sig. Transd. 2013, 18, 1789–1796. [Google Scholar] [CrossRef]
- Shokoohinia, Y.; Rashidi, M.; Hosseinzadeh, L.; Jelodarian, Z. Quercetin-3-O-beta-D-glucopyranoside, a dietary flavonoid, protects PC12 cells from H2O2-induced cytotoxicity through inhibition of reactive oxygen species. Food Chem. 2015, 167, 162–167. [Google Scholar] [CrossRef]
- Oikonomou, N.A.; Krokida, M.K. Water absorption index and water solubility index prediction for extruded food products. Int. J. Food Prop. 2012, 15, 157–168. [Google Scholar] [CrossRef]
- Pourafshar, S.; Rosentrater, K.A.; Krishnan, P.G. Changes in chemical and physical properties of Latin American wheat flour based tortillas substituted with different levels of distillers dried grains with solubles (DDGS). J. Food. Sci. Technol. 2015, 52, 5243–5249. [Google Scholar] [CrossRef] [Green Version]
- O’Shea, N.; Rossle, C.; Arendt, E.; Gallagher, E. Modelling the effects of orange pomace using response surface design for gluten-free bread baking. Food Chem. 2015, 166, 223–230. [Google Scholar] [CrossRef]
- Reshmi, S.K.; Sudha, M.L.; Shashirekha, M.N. Starch digestibility and predicted glycemic index in the bread fortified with pomelo (Citrus maxima) fruit segments. Food Chem. 2017, 237, 957–965. [Google Scholar] [CrossRef] [PubMed]
- Tian, J.H.; Chen, J.C.; Ye, X.Q.; Chen, S.G. Health benefits of the potato affected by domestic cooking: A review. Food Chem. 2016, 202, 165–175. [Google Scholar] [CrossRef] [PubMed]
Figure 1.
Preparation of whole flour, core flour, and bran flour of Tartary buckwheat.

Figure 2.
DPPH (A) and ABTS (B) radical scavenging activities of TBF, TBCF, and TBBF (TBF: Tartary buckwheat flour; TBCF: Tartary buckwheat core flour; TBBF: Tartary buckwheat bran flour).
Figure 2.
DPPH (A) and ABTS (B) radical scavenging activities of TBF, TBCF, and TBBF (TBF: Tartary buckwheat flour; TBCF: Tartary buckwheat core flour; TBBF: Tartary buckwheat bran flour).

Figure 3.
Water absorption index (WAI) and Water soluble index (WSI) of TBF, TBCF and TBBF (TBF: Tartary buckwheat flour; TBCF: Tartary buckwheat core flour; TBBF: Tartary buckwheat bran flour).
Figure 3.
Water absorption index (WAI) and Water soluble index (WSI) of TBF, TBCF and TBBF (TBF: Tartary buckwheat flour; TBCF: Tartary buckwheat core flour; TBBF: Tartary buckwheat bran flour).

Figure 4.
Mixolab profiles of TBF, TBCF and TBBF (TBF: Tartary buckwheat flour; TBCF: Tartary buckwheat core flour; TBBF: Tartary buckwheat bran flour).
Figure 4.
Mixolab profiles of TBF, TBCF and TBBF (TBF: Tartary buckwheat flour; TBCF: Tartary buckwheat core flour; TBBF: Tartary buckwheat bran flour).

Figure 5.
Effect of Wbran on the mixolab curves of mixed dough (TBF: Tartary buckwheat flour; TBCF: Tartary buckwheat core flour; TBBF: Tartary buckwheat bran flour; Wbran: the weight proportion of TBBF in the blend four).
Figure 5.
Effect of Wbran on the mixolab curves of mixed dough (TBF: Tartary buckwheat flour; TBCF: Tartary buckwheat core flour; TBBF: Tartary buckwheat bran flour; Wbran: the weight proportion of TBBF in the blend four).

Figure 6.
Effect of Wbran on the specific volume of steamed bread (Wbran: the weight proportion of TBBF in the blend four).
Figure 6.
Effect of Wbran on the specific volume of steamed bread (Wbran: the weight proportion of TBBF in the blend four).

Figure 7.
Effect of Wbran on the raw and cell images of steamed bread slices (Wbran: the weight proportion of TBBF in the blend four).
Figure 7.
Effect of Wbran on the raw and cell images of steamed bread slices (Wbran: the weight proportion of TBBF in the blend four).

Figure 8.
Effect of Wbran on the starch hydrolysis (A) and predicted GI value (B) of steamed bread (Wbran: the weight proportion of TBBF in the blend four).
Figure 8.
Effect of Wbran on the starch hydrolysis (A) and predicted GI value (B) of steamed bread (Wbran: the weight proportion of TBBF in the blend four).


Table 1.
Chemical composition of TBF, TBCF, and TBBF.
| TBF | TBCF | TBBF | |
|---|---|---|---|
| Water (%) | 9.96 ± 0.02 b | 10.78 ± 0.03 a | 9.55 ± 0.03 c |
| Mineral (%) | 1.79 ± 0.01 b | 0.93 ± 0.01 c | 2.96 ± 0.01 a |
| Lipid (%) | 2.62 ± 0.02 b | 1.15 ± 0.01 c | 4.76 ± 0.02 a |
| Starch (%) | 68.28 ± 0.11 b | 81.94 ± 0.15 a | 49.32 ± 0.10 c |
| Protein (%) | 14.64 ± 0.27 b | 8.07 ± 0.06 c | 23.33 ± 0.14 a |
| Rutin (%) | 1.33 ± 0.01 b | 0.04 ± 0.01 c | 3.27 ± 0.36 a |
Different superscript lowercase letters in the same row mean significantly differences (p < 0.05); TBF, TBCF, and TBBF represent Tartary buckwheat flour, Tartary buckwheat core flour and Tartary buckwheat bran flour, respectively.
Table 2.
Fatty acid composition (%) of TBF, TBCF, and TBBF.
| TBF | TBCF | TBBF | |
|---|---|---|---|
| C16:0 | 21.29 ± 7.46 a | 13.92 ± 0.06 a | 14.11 ± 0.18 a |
| C16:1 | 0.13 ± 0.03 b | 0.09 ± 0.01 c | 0.18 ± 0.00 a |
| C18:0 | 2.04 ± 0.20 b | 2.47 ± 0.03 a | 2.11 ± 0.04 b |
| C18:1 | 35.68 ± 3.39 b | 40.83 ± 0.85 a | 38.53 ± 0.03 ab |
| C18:2 | 34.73 ± 3.27 a | 36.25 ± 0.84 a | 38.34 ± 0.19 a |
| C18:3 | 3.60 ± 0.37 a | 3.68 ± 0.06 a | 3.98 ± 0.02 a |
| C20:0 | 1.30 ± 0.13 a | 1.42 ± 0.01 a | 1.42 ± 0.01 a |
| C22:0 | 1.23 ± 0.13 a | 1.36 ± 0.03 a | 1.33 ± 0.01 a |
Different superscript lowercase letters in the same row mean significantly differences (p < 0.05); TBF, TBBF and TBCF represent Tartary buckwheat flour, Tartary buckwheat bran flour and Tartary buckwheat core flour, respectively.
Table 3.
Amino acid composition (%) of TBF, TBCF, and TBBF.
| TBF | TBCF | TBBF | |
|---|---|---|---|
| Asp | 0.95 ± 0.28 b | 0.55 ± 0.10 c | 1.82 ± 0.14 a |
| Thr | 0.38 ± 0.12 b | 0.23 ± 0.04 b | 0.70 ± 0.07 a |
| Ser | 0.52 ± 0.16 b | 0.30 ± 0.06 c | 0.99 ± 0.06 a |
| Glu | 1.88 ± 0.60 b | 0.96 ± 0.15 c | 3.71 ± 0.29 a |
| Gly | 0.61 ± 0.18 b | 0.34 ± 0.06 c | 1.14 ± 0.11 a |
| Ala | 0.45 ± 0.14 b | 0.28 ± 0.06 b | 0.80 ± 0.08 a |
| Cys | 0.09 ± 0.03 a | 0.03 ± 0.01 b | 0.11 ± 0.01 a |
| Val | 0.55 ± 0.16 b | 0.33 ± 0.05 c | 0.99 ± 0.09 a |
| Met | 0.17 ± 0.04 b | 0.10 ± 0.01 b | 0.33 ± 0.05 a |
| Ile | 0.40 ± 0.11 b | 0.25 ± 0.05 b | 0.71 ± 0.09 a |
| Leu | 0.64 ± 0.20 b | 0.41 ± 0.08 b | 1.17 ± 0.08 a |
| Tyr | 0.38 ± 0.12 b | 0.17 ± 0.04 c | 0.63 ± 0.07 a |
| Phe | 0.52 ± 0.17 b | 0.30 ± 0.03 b | 0.90 ± 0.08 a |
| His | 0.40 ± 0.10 b | 0.22 ± 0.04 c | 0.77 ± 0.07 a |
| Lys | 0.57 ± 0.18 b | 0.34 ± 0.05 b | 1.04 ± 0.10 a |
| Arg | 1.01 ± 0.31 b | 0.46 ± 0.08 c | 2.00 ± 0.15 a |
| Pro | 0.37 ± 0.09 b | 0.26 ± 0.02 b | 0.77 ± 0.10 a |
Different superscript lowercase letters in the same row mean significantly differences (p < 0.05); TBF, TBCF and TBBF represent Tartary buckwheat flour, Tartary buckwheat core flour and Tartary buckwheat bran flour, respectively.
Table 4.
Parameters values of Mixolab curves of all samples.
| TBF | TBCF | TBBF | |
|---|---|---|---|
| Water absorption (%) | 56.9 ± 0.3 b | 64.0 ± 0.1 a | 55.0 ± 0.1 c |
| Development time (min) | 2.843 ± 0.090 b | 6.807 ± 0.552 a | 0.920 ± 0.053 c |
| Thermal stability (min) | 2.300 ± 0.100 b | 5.500 ± 0.100 a | 2.433 ± 0.153 b |
| C1 (Nm) | 1.102 ± 0.033 a | 1.094 ± 0.022 a | 1.099 ± 0.035 a |
| C2 (Nm) | 0.000 ± 0.000 b | 0.000 ± 0.000 b | 0.200 ± 0.001 a |
| C3 (Nm) | 1.838 ± 0.055 b | 2.069 ± 0.132 a | 1.482 ± 0.033 c |
| C4 (Nm) | 1.711 ± 0.036 b | 1.891 ± 0.124 a | 1.389 ± 0.007 c |
| C5 (Nm) | 2.531 ± 0.072 b | 2.832 ± 0.045 a | 2.070 ± 0.036 c |
| C3-C2 (Nm) | 1.838 ± 0.055 b | 2.069 ± 0.132 a | 1.282 ± 0.034 c |
| C3-C4 (Nm) | 0.127 ± 0.064 a | 0.178 ± 0.071 a | 0.089 ± 0.033 a |
| C5-C4 (Nm) | 0.821 ± 0.075 a | 0.941 ± 0.086 a | 0.677 ± 0.036 b |
| α (Nm/min) | −0.007 ± 0.002 a | −0.110 ± 0.010 c | −0.039 ± 0.006 b |
| β (Nm/min) | 0.005 ± 0.001 c | 0.008 ± 0.002 b | 0.603 ± 0.082 a |
| γ (Nm/min) | 0.017 ± 0.021 a | 0.395 ± 0.482 a | −0.020 ± 0.010 a |
Different superscript lowercase letters in the same row mean significantly differences (p < 0.05); TBF, TBCF and TBBF represent Tartary buckwheat flour, Tartary buckwheat core flour and Tartary buckwheat bran flour, respectively.
Table 5.
Effect of Wbran on parameters values of Mixolab curves of mixed dough.
| Wbran (%) | 0 | 10 | 30 | 50 | 70 | 90 |
|---|---|---|---|---|---|---|
| Water absorption (%) | 59.3 ± 0.2 a | 58.7 ± 0.1b | 57.3 ± 0.3 c | 54.8 ± 0.2 f | 55.4 ± 0.1 e | 55.9 ± 0.2 d |
| Development time (min) | 3.290 ± 0.082 c | 3.550 ± 0.130 b | 6.990 ± 0.225 a | 0.833 ± 0.015 d | 0.860 ± 0.026 d | 0.967 ± 0.015 d |
| Thermal stability (min) | 6.567 ± 0.289 c | 7.933 ± 0.321 b | 10.067 ± 0.513 a | 1.467 ± 0.058 de | 1.067 ± 0.058 e | 1.900 ± 0.346 d |
| C1 (N·m) | 1.091 ± 0.011 b | 1.097 ± 0.021 ab | 1.064 ± 0.029 b | 1.100 ± 0.032 ab | 1.098 ± 0.009 ab | 1.138 ± 0.017 a |
| C2 (N·m) | 0.465 ± 0.010 a | 0.423 ± 0.006 b | 0.388 ± 0.010 c | 0.325 ± 0.005 d | 0.192 ± 0.002 f | 0.210 ± 0.002 e |
| C3 (N·m) | 1.758 ± 0.023 a | 1.787 ± 0.019 a | 1.767 ± 0.009 a | 1.683 ± 0.005 b | 1.635 ± 0.009 c | 1.525 ± 0.035 d |
| C4 (N·m) | 1.670 ± 0.060 a | 1.617 ± 0.034 a | 1.491 ± 0.012 b | 1.485 ± 0.010 b | 1.502 ± 0.007 b | 1.447 ± 0.022 b |
| C5 (N·m) | 2.937 ± 0.089 a | 2.532 ± 0.061 b | 2.379 ± 0.056 c | 2.513 ± 0.006 b | 2.401 ± 0.027 c | 2.158 ± 0.040 d |
| C3-C2 (N·m) | 1.293 ± 0.014 c | 1.364 ± 0.013 b | 1.379 ± 0.004 b | 1.358 ± 0.001 b | 1.443 ± 0.011 a | 1.315 ± 0.034 c |
| C3-C4 (N·m) | 0.089 ± 0.038 d | 0.170 ± 0.018 bc | 0.275 ± 0.012 a | 0.198 ± 0.014 b | 0.133 ± 0.014 c | 0.078 ± 0.015 d |
| C5-C4 (N·m) | 1.268 ± 0.053 a | 0.915 ± 0.027 c | 0.888 ± 0.048 c | 1.029 ± 0.015 b | 0.899 ± 0.021 c | 0.711 ± 0.019 d |
| α (N·m/min) | −0.070 ± 0.007 b | −0.099 ± 0.002 c | −0.126 ± 0.011 d | −0.100 ± 0.005 c | −0.027 ± 0.006 a | −0.031 ± 0.003 a |
| β (N·m/min) | 0.463 ± 0.039 b | 0.221 ± 0.030 e | 0.349 ± 0.014 cd | 0.303 ± 0.021 de | 0.613 ± 0.067 a | 0.403 ± 0.090 bc |
| γ (N·m/min) | −0.020 ± 0.016 a | −0.021 ± 0.006 a | −0.025 ± 0.010 a | −0.010 ± 0.007 a | −0.023 ± 0.006 a | 0.007 ± 0.034 a |
Different superscript lowercase letters in the same row mean significantly differences (p < 0.05); TBF, TBCF and TBBF represent Tartary buckwheat flour, Tartary buckwheat core flour and Tartary buckwheat bran flour, respectively. Wbran is the weight proportion of TBBF in the blend four.
Table 6.
Effect of Wbran on the color difference of steamed bread.
| Wbran (%) | L* | a* | b* |
|---|---|---|---|
| 0 | 81.88 ± 0.46 a | −0.65 ± 0.02 f | 17.17 ± 0.20 c |
| 10 | 59.81 ± 0.16 b | 2.47 ± 0.07 e | 23.71 ± 0.33 a |
| 30 | 47.82 ± 0.48 c | 5.53 ± 0.04 a | 20.98 ± 0.23 b |
| 50 | 42.19 ± 0.23 d | 5.00 ± 0.08 b | 14.82 ± 0.18 d |
| 70 | 39.51 ± 0.22 e | 4.40 ± 0.03 c | 11.47 ± 0.16 e |
| 90 | 38.49 ± 0.11 f | 3.66 ± 0.13 d | 8.94 ± 0.09 f |
Different superscript lowercase letters in the same column mean significantly differences (p < 0.05); Wbran is the weight proportion of TBBF in the blend four.
Table 7.
Effect of Wbran on parameters values of Mixolab curves of mixed dough.
| Wbran (%) | Hardness | Springiness | Cohesiveness | Gumminess | Chewiness | Resilience |
|---|---|---|---|---|---|---|
| 0 | 1651 ± 59 e | 0.945 ± 0.006 b | 0.846 ± 0.014 a | 1398 ± 41 e | 1321 ± 48 e | 0.558 ± 0.014 a |
| 10 | 1680 ± 42 e | 0.970 ± 0.026 a | 0.842 ± 0.014 a | 1415 ± 58 e | 1374 ± 92 e | 0.548 ± 0.014 a |
| 30 | 3554 ± 98 d | 0.904 ± 0.002 c | 0.808 ± 0.012 b | 2871 ± 43 d | 2596 ± 40 d | 0.485 ± 0.013 b |
| 50 | 8367 ± 378 c | 0.871 ± 0.008 d | 0.782 ± 0.002 c | 6542 ± 279 c | 5696 ± 290 c | 0.458 ± 0.003 c |
| 70 | 11116 ± 632 b | 0.872 ± 0.015 d | 0.783 ± 0.018 c | 8693 ± 294 b | 7577 ± 176 b | 0.448 ± 0.020 c |
| 90 | 19691 ± 752 a | 0.854 ± 0.008 d | 0.761 ± 0.018 c | 14192 ± 1441 a | 12116 ± 1228 a | 0.438 ± 0.017 c |
Different superscript lowercase letters in the same column mean significantly differences (p < 0.05); Wbran is the weight proportion of TBBF in the blend four.
Table 8.
Effect of Wbran on parameters values of Mixolab curves of mixed dough.
| Wbran (%) | 0 | 10 | 30 | 50 | 70 | 90 |
| Slice area | 2819 ± 65 a | 2817 ± 40 a | 2258 ± 61 b | 1992 ± 13 c | 1918 ± 40 cd | 1842 ± 12 d |
| Brightness | 102.270 ± 7.079 a | 51.311 ± 0.884 b | 33.501 ± 3.704 c | 31.803 ± 1.568 c | 27.839 ± 0.484 c | 27.015 ± 1.515 c |
| Cell contrast | 0.796 ± 0.013 a | 0.622 ± 0.005 f | 0.649 ± 0.013 e | 0.688 ± 0.012 d | 0.722 ± 0.010 c | 0.766 ± 0.010 b |
| Number of cells | 1991 ± 148 a | 1558 ± 20 d | 1645 ± 26 cd | 1766 ± 88 bc | 1857 ± 71 ab | 1972 ± 41 a |
| Area of cells | 46.220 ± 0.978 a | 49.379 ± 0.150 b | 46.076 ± 1.039 b | 44.121 ± 0.439 c | 43.031 ± 0.343 c | 41.613 ± 0.334 d |
| Wall thickness | 0.447 ± 0.006 b | 0.485 ± 0.004 a | 0.450 ± 0.004 b | 0.420 ± 0.006 c | 0.406 ± 0.006 d | 0.395 ± 0.006 e |
| Cell diameter | 1.389 ± 0.050 b | 1.800 ± 0.043 a | 1.416 ± 0.057 b | 1.234 ± 0.077 c | 1.117 ± 0.036 d | 1.019 ± 0.025 e |
| Cell volume | 3.558 ± 0.205 cd | 6.984 ± 0.215 a | 5.164 ± 0.308 b | 4.034 ± 0.385 c | 3.378 ± 0.227 d | 2.747 ± 0.235 e |
| Coarse cell volume | 6.507 ± 1.157 b | 10.364 ± 0.493 a | 9.445 ± 0.626 a | 6.804 ± 0.752 b | 5.323 ± 0.147 c | 4.194 ± 0.302 c |
| Cell elongation | 1.618 ± 0.014 a | 1.532 ± 0.009 b | 1.556 ± 0.020 b | 1.564 ± 0.010 b | 1.607 ± 0.049 a | 1.643 ± 0.019 a |
| Cell density | 0.706 ± 0.046 d | 0.553 ± 0.010 e | 0.729 ± 0.014 d | 0.887 ± 0.048 c | 0.968 ± 0.018 b | 1.071 ± 0.029 a |
Different superscript lowercase letters in the same row mean significantly differences (p < 0.05); Wbran is the weight proportion of TBBF in the blend four.
Publisher’s Note: MDPI stays neutral with regard to jurisdictional claims in published maps and institutional affiliations. |
© 2021 by the authors. Licensee MDPI, Basel, Switzerland. This article is an open access article distributed under the terms and conditions of the Creative Commons Attribution (CC BY) license (https://creativecommons.org/licenses/by/4.0/).
Share and Cite
MDPI and ACS Style
Zhang, S.; Chen, S.; Geng, S.; Liu, C.; Ma, H.; Liu, B. Effects of Tartary Buckwheat Bran Flour on Dough Properties and Quality of Steamed Bread. Foods 2021, 10, 2052. https://0-doi-org.brum.beds.ac.uk/10.3390/foods10092052
AMA Style
Zhang S, Chen S, Geng S, Liu C, Ma H, Liu B. Effects of Tartary Buckwheat Bran Flour on Dough Properties and Quality of Steamed Bread. Foods. 2021; 10(9):2052. https://0-doi-org.brum.beds.ac.uk/10.3390/foods10092052
Chicago/Turabian StyleZhang, Sheng, Si Chen, Sheng Geng, Changzhong Liu, Hanjun Ma, and Benguo Liu. 2021. "Effects of Tartary Buckwheat Bran Flour on Dough Properties and Quality of Steamed Bread" Foods 10, no. 9: 2052. https://0-doi-org.brum.beds.ac.uk/10.3390/foods10092052
Note that from the first issue of 2016, this journal uses article numbers instead of page numbers. See further details here.