
Consumption of Tritordeum Bread Reduces Immunogenic Gluten Intake without Altering the Gut Microbiota

 , , , , , , and
Abstract
:1. Introduction
2. Materials and Methods
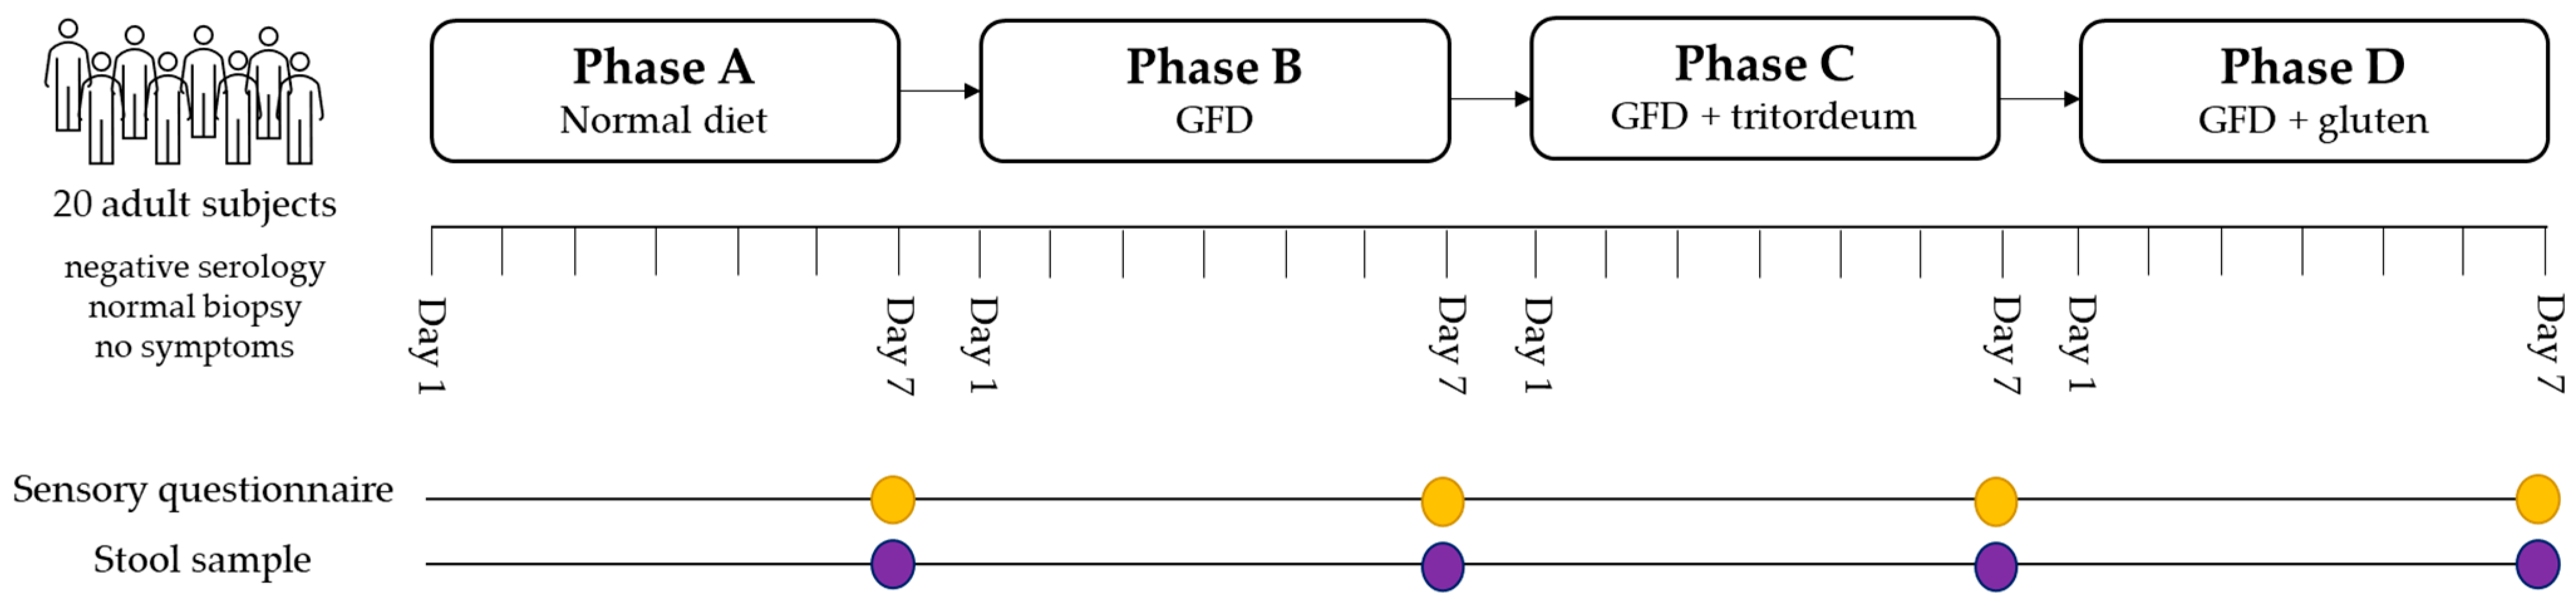
2.1. Design and Study Population
2.2. Phases of the Study
2.3. Preparation and Supplying of Bread Types
2.4. Protein Extraction and Digestion
2.5. Liquid Chromatography and Mass Spectrometer Analysis
2.6. Proteomic Data Analysis
2.7. Collection and DNA Extraction of Stool Samples
2.8. NGS and Bioinformatic Analysis of the Gut Microbiota
2.9. Statistical Analysis
3. Results
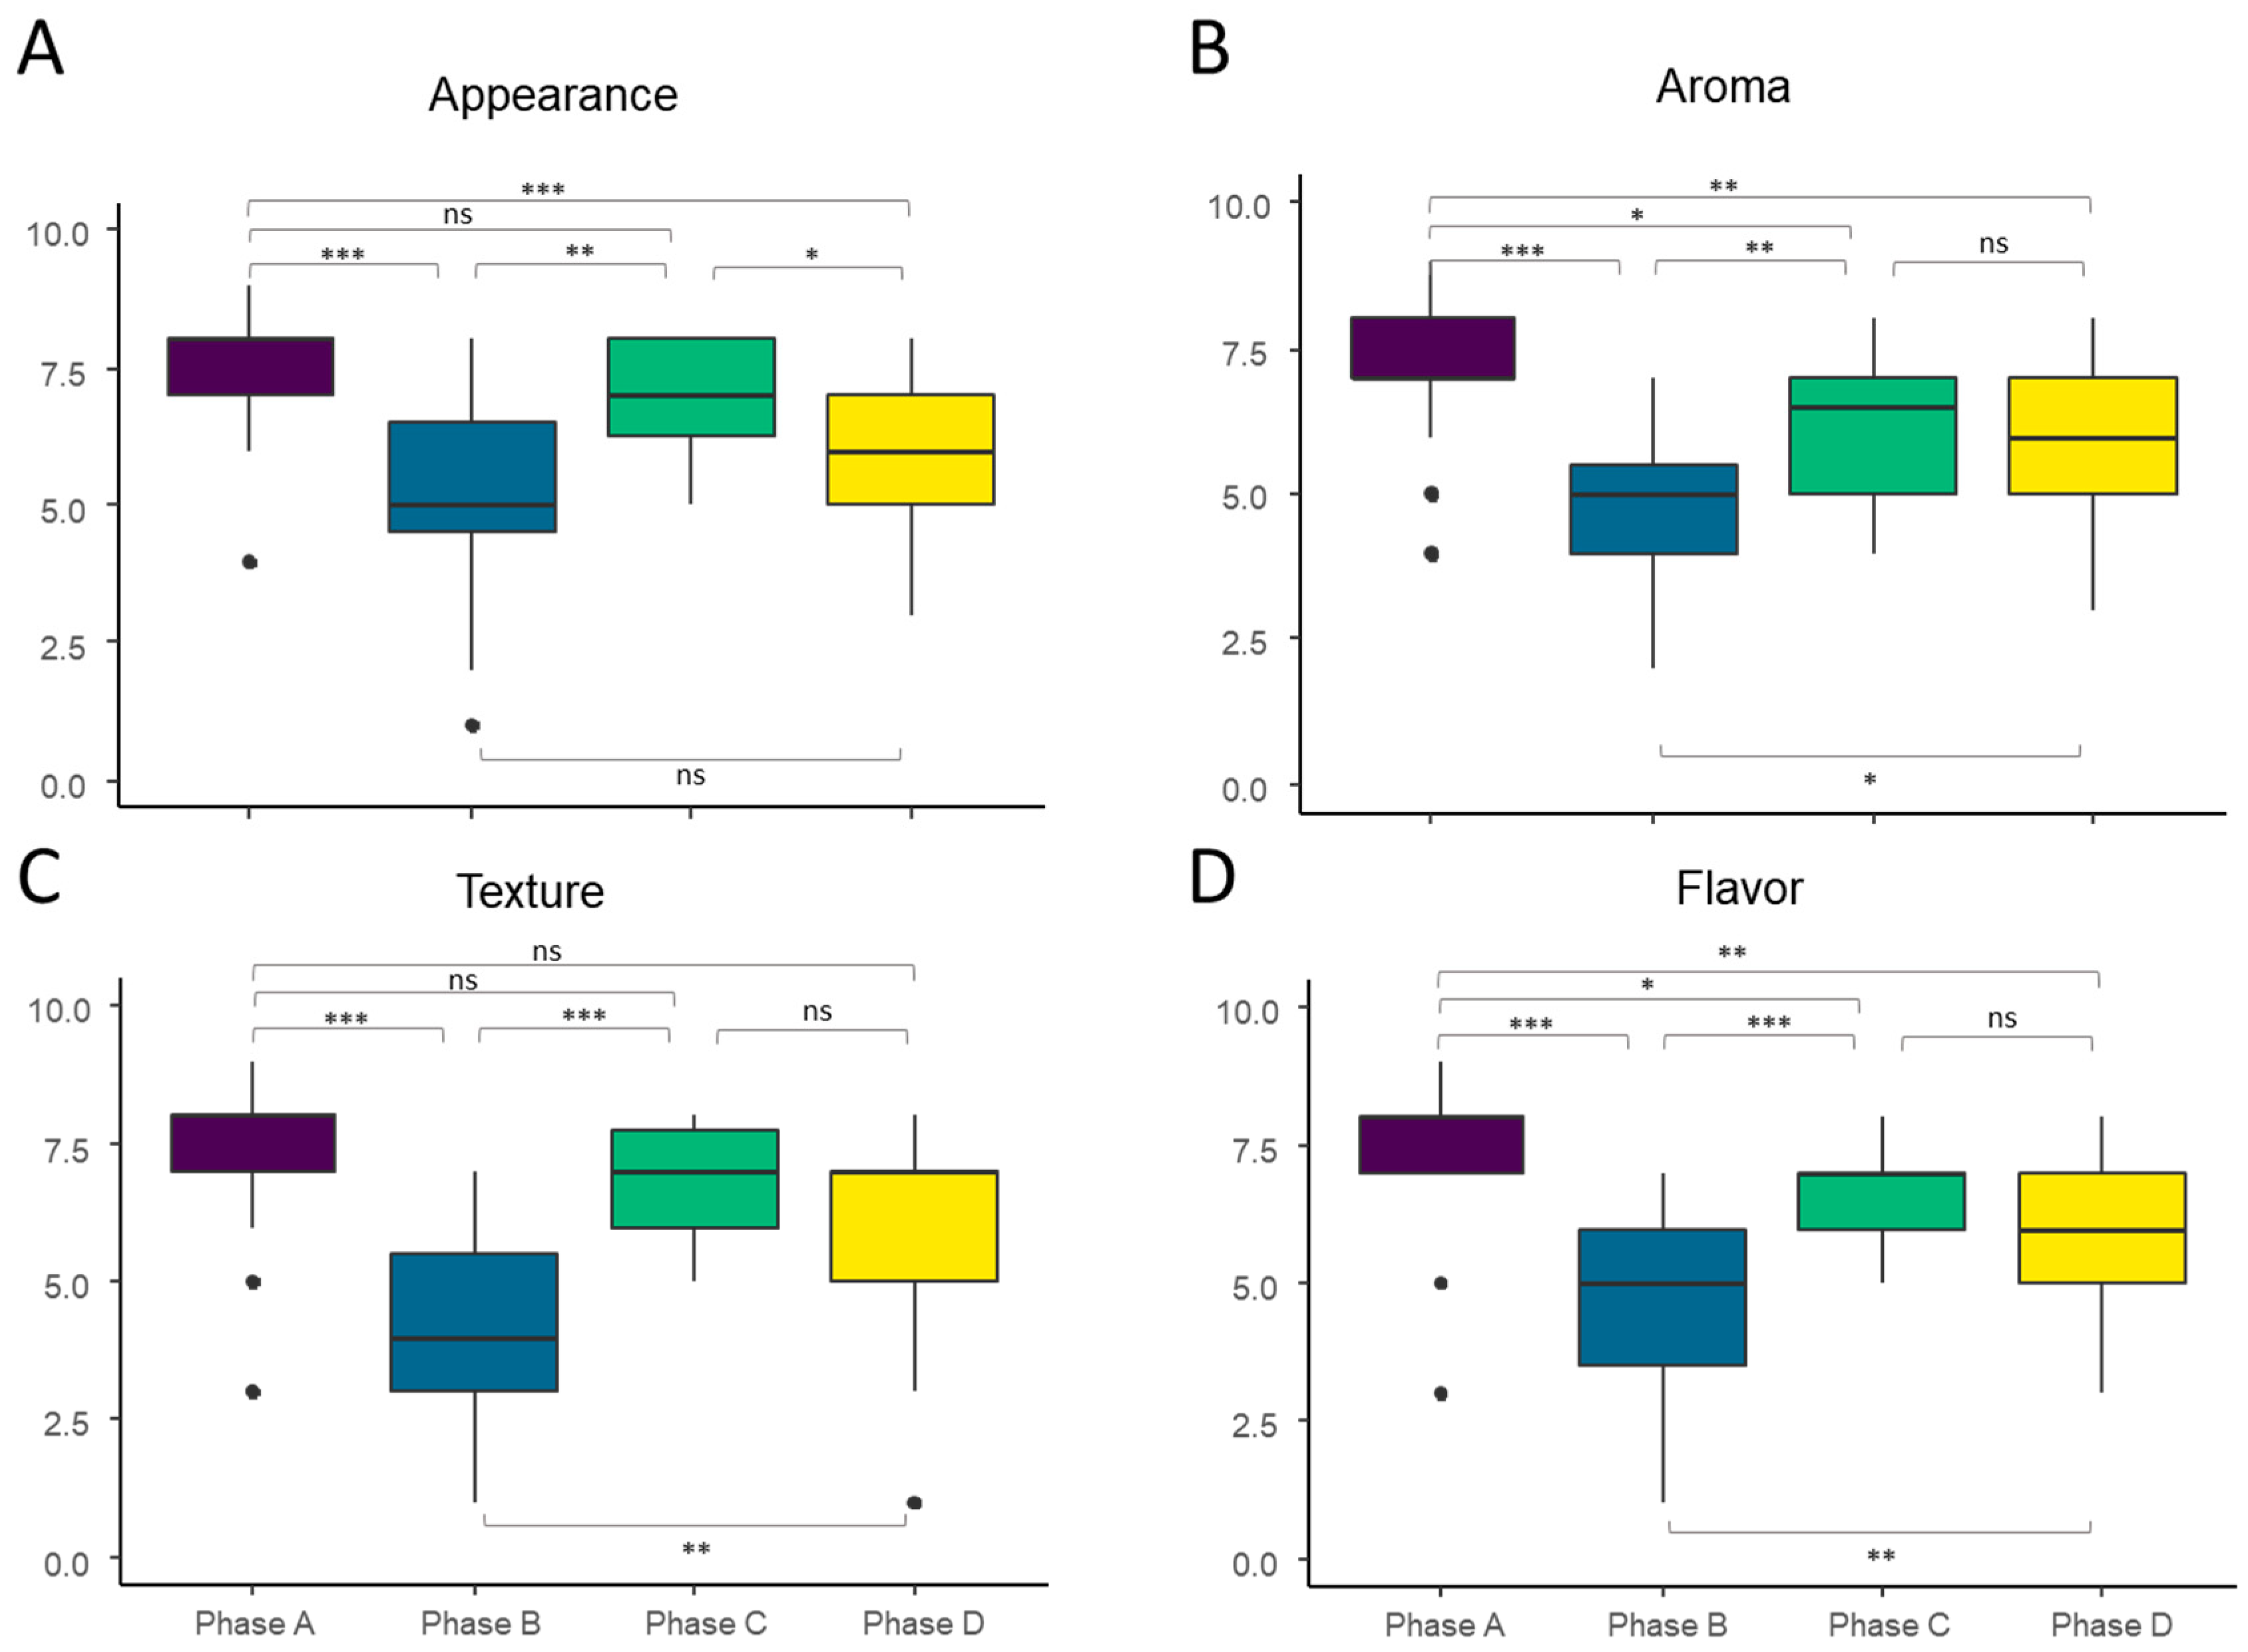
3.1. Questionnaires
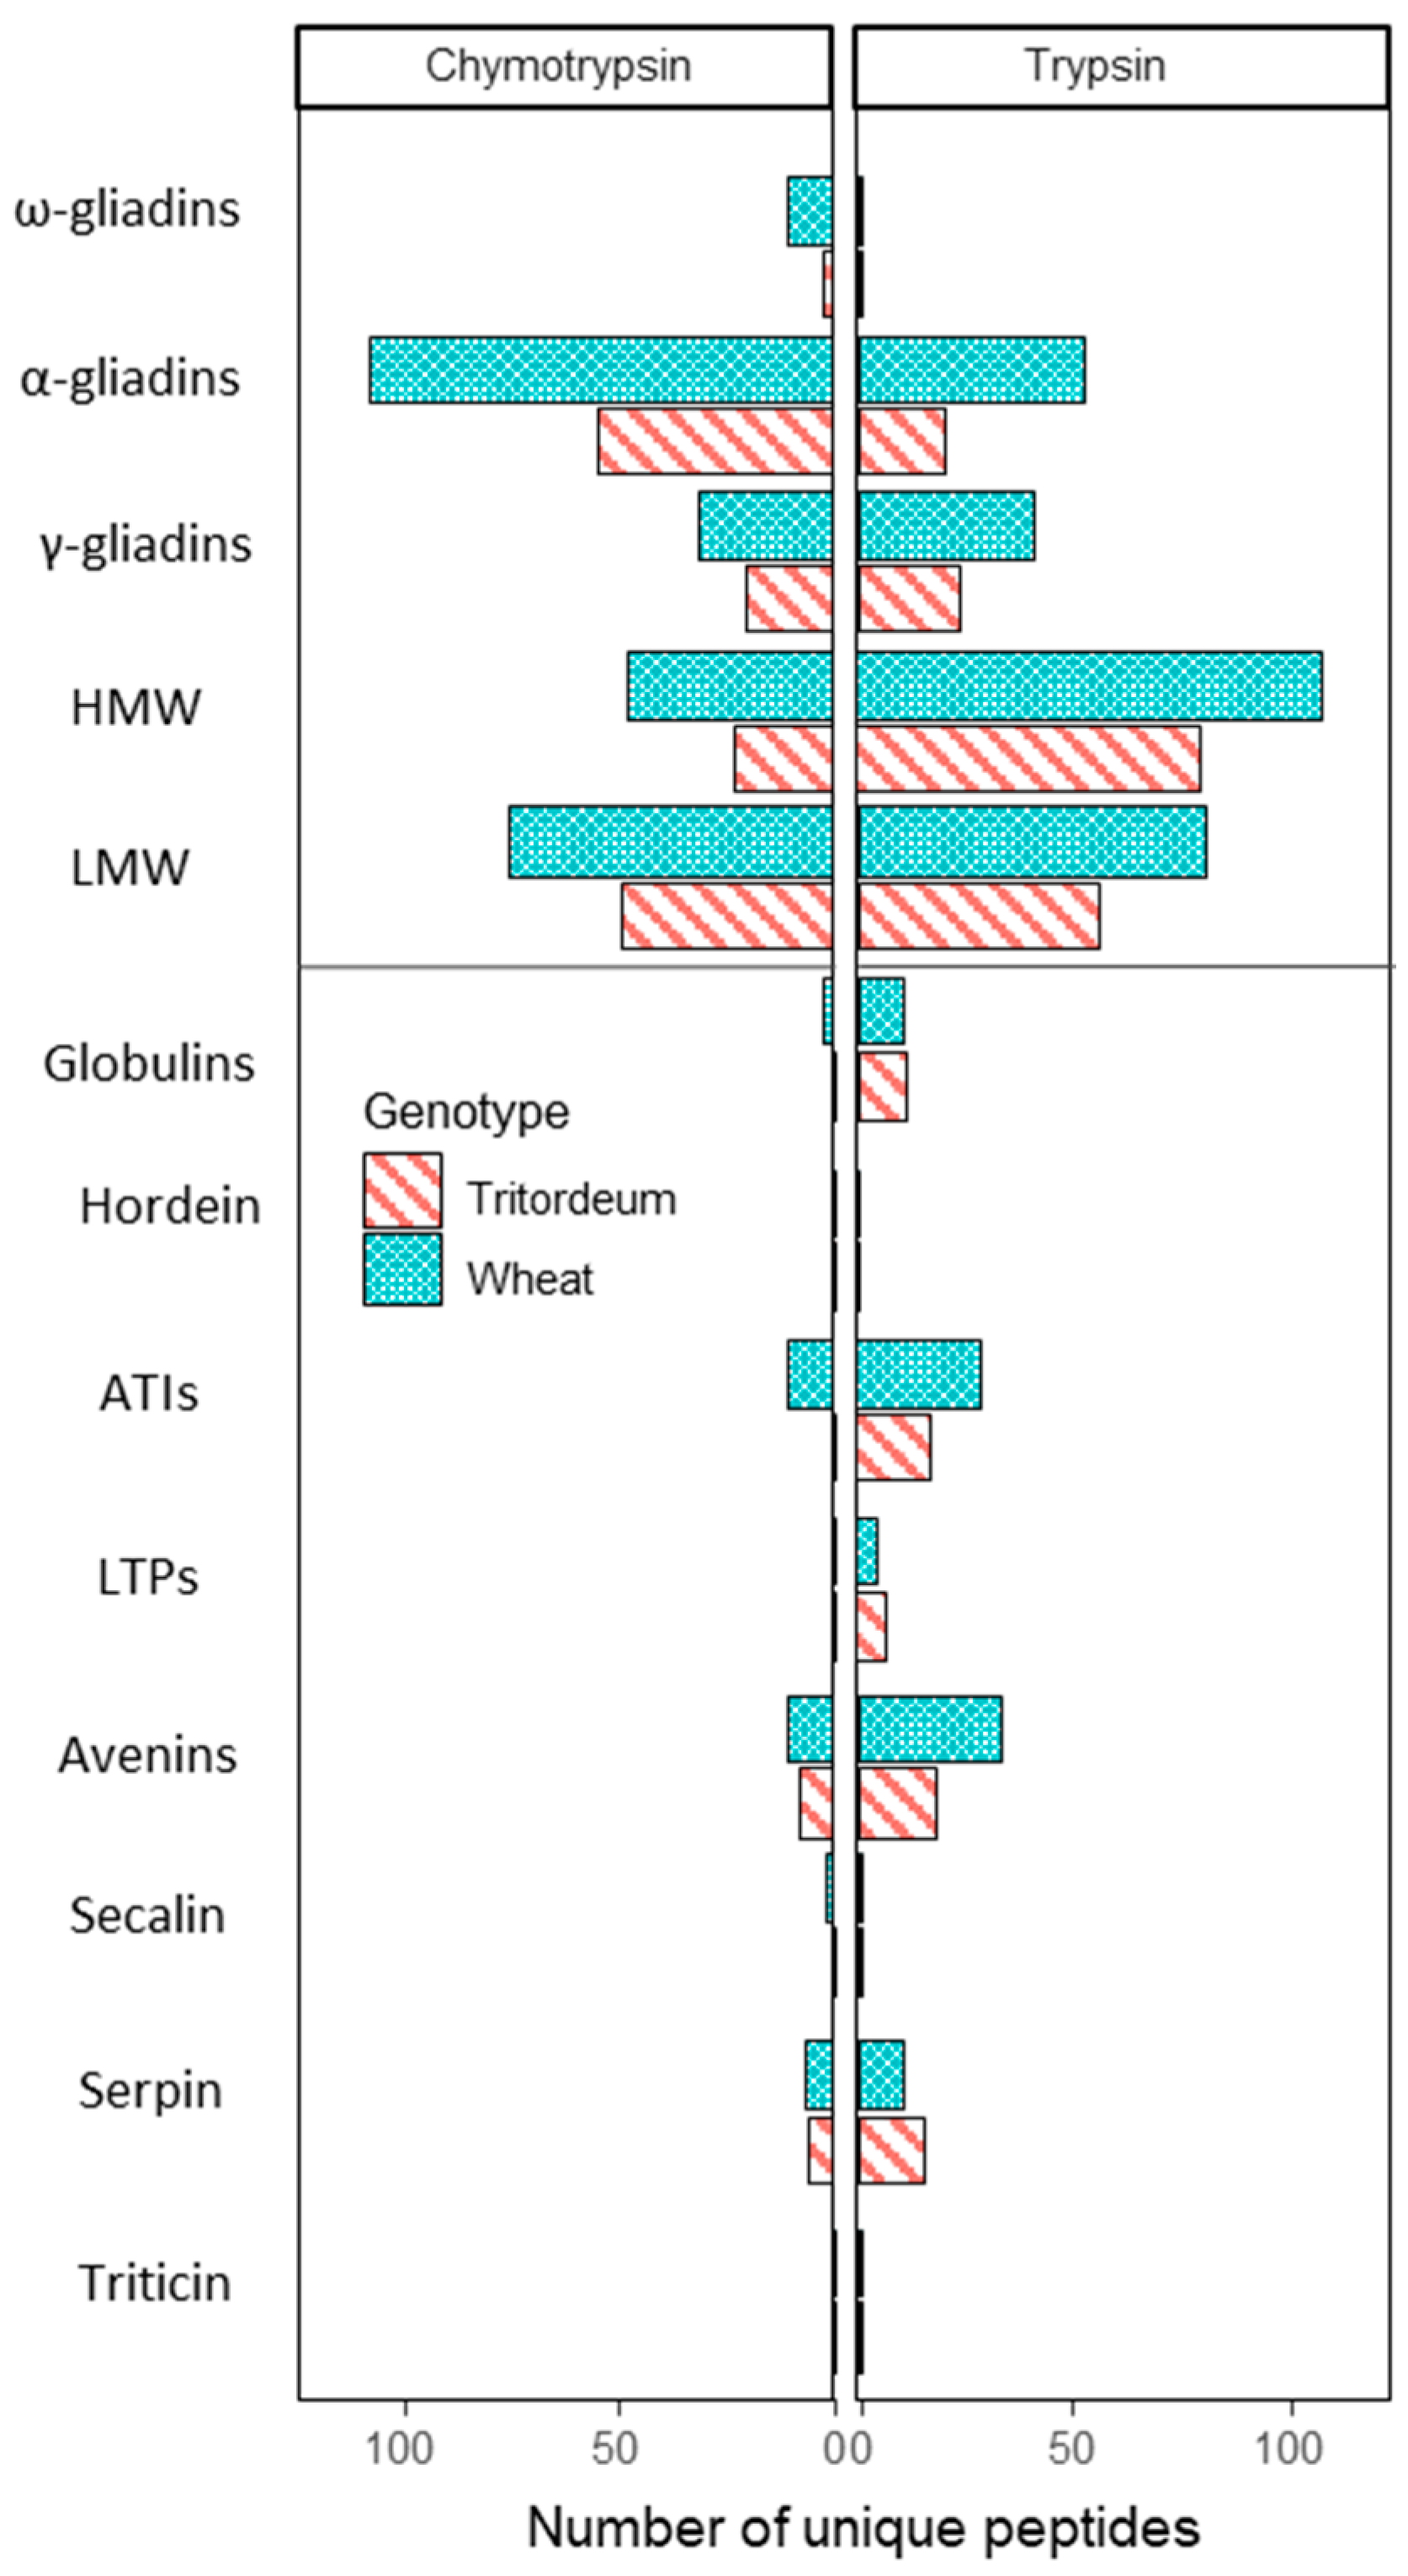
3.2. Proteomic Data Analysis from Wheat and Tritordeum White Flours
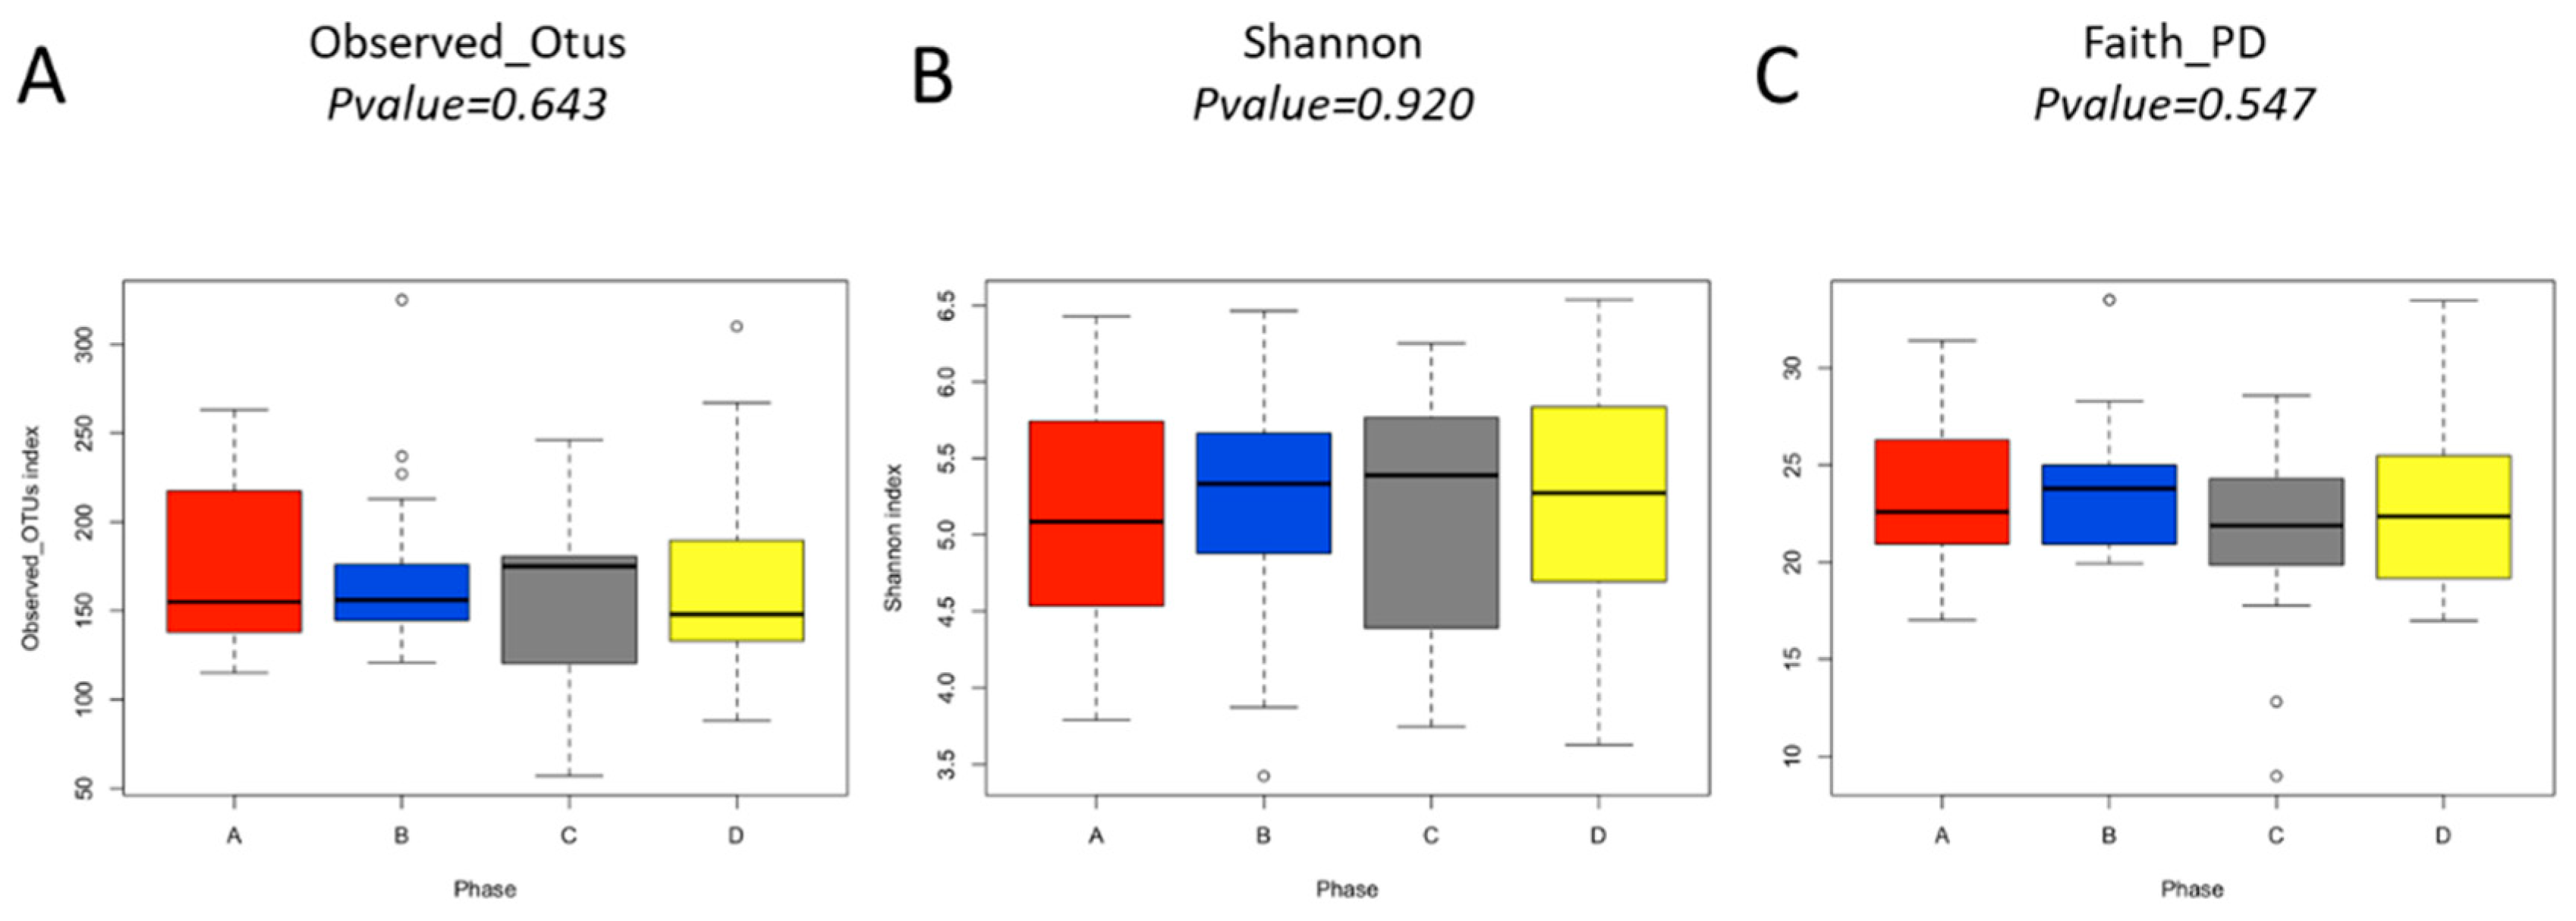
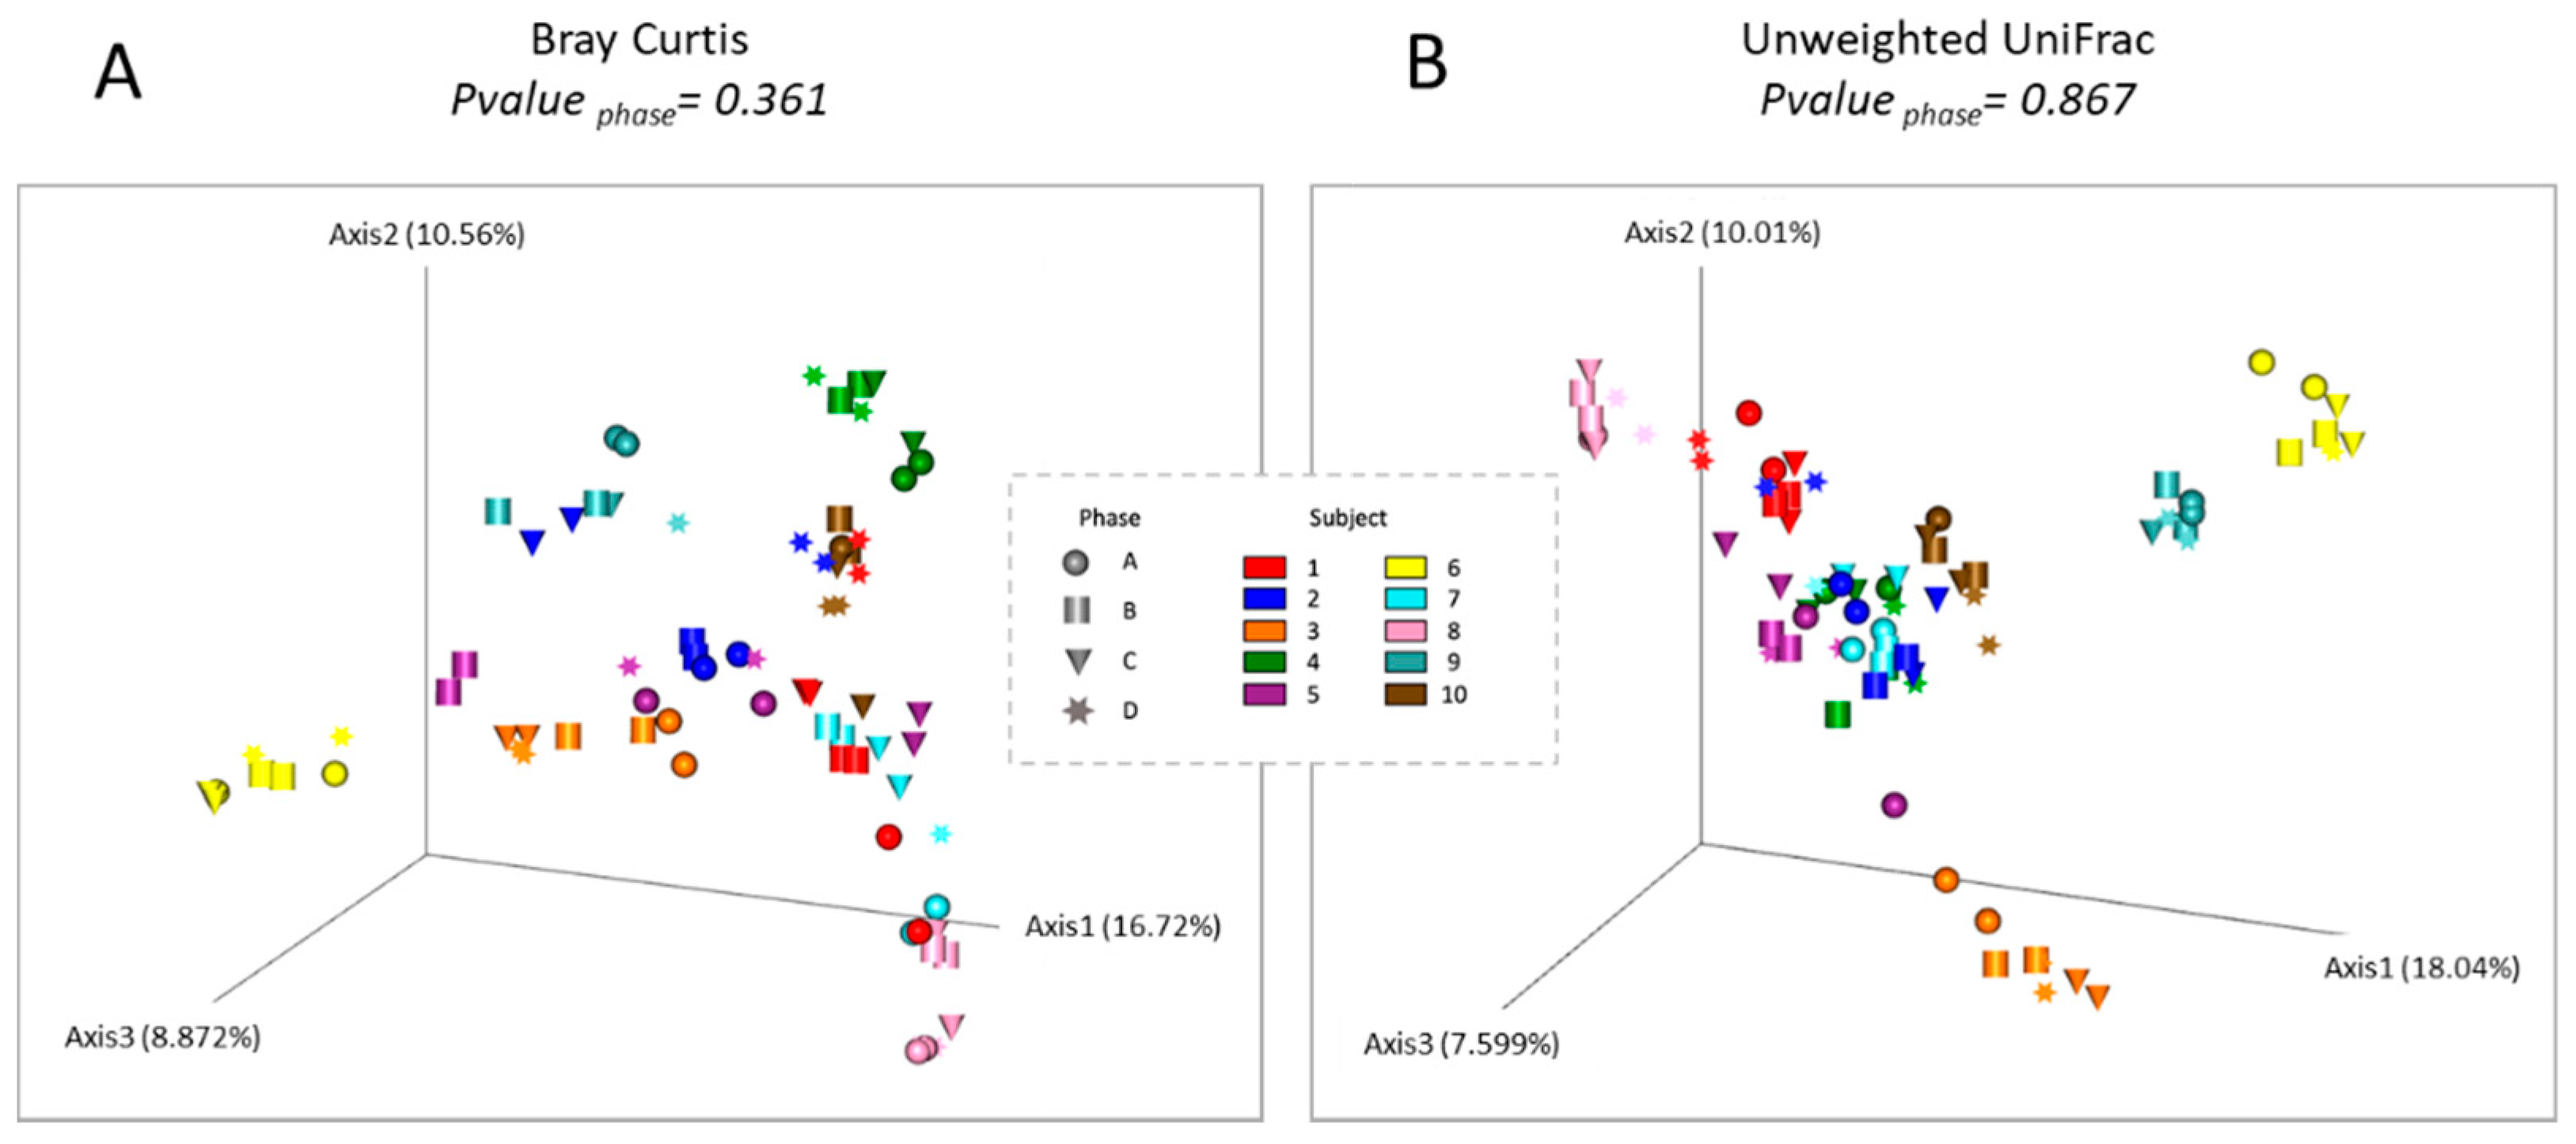
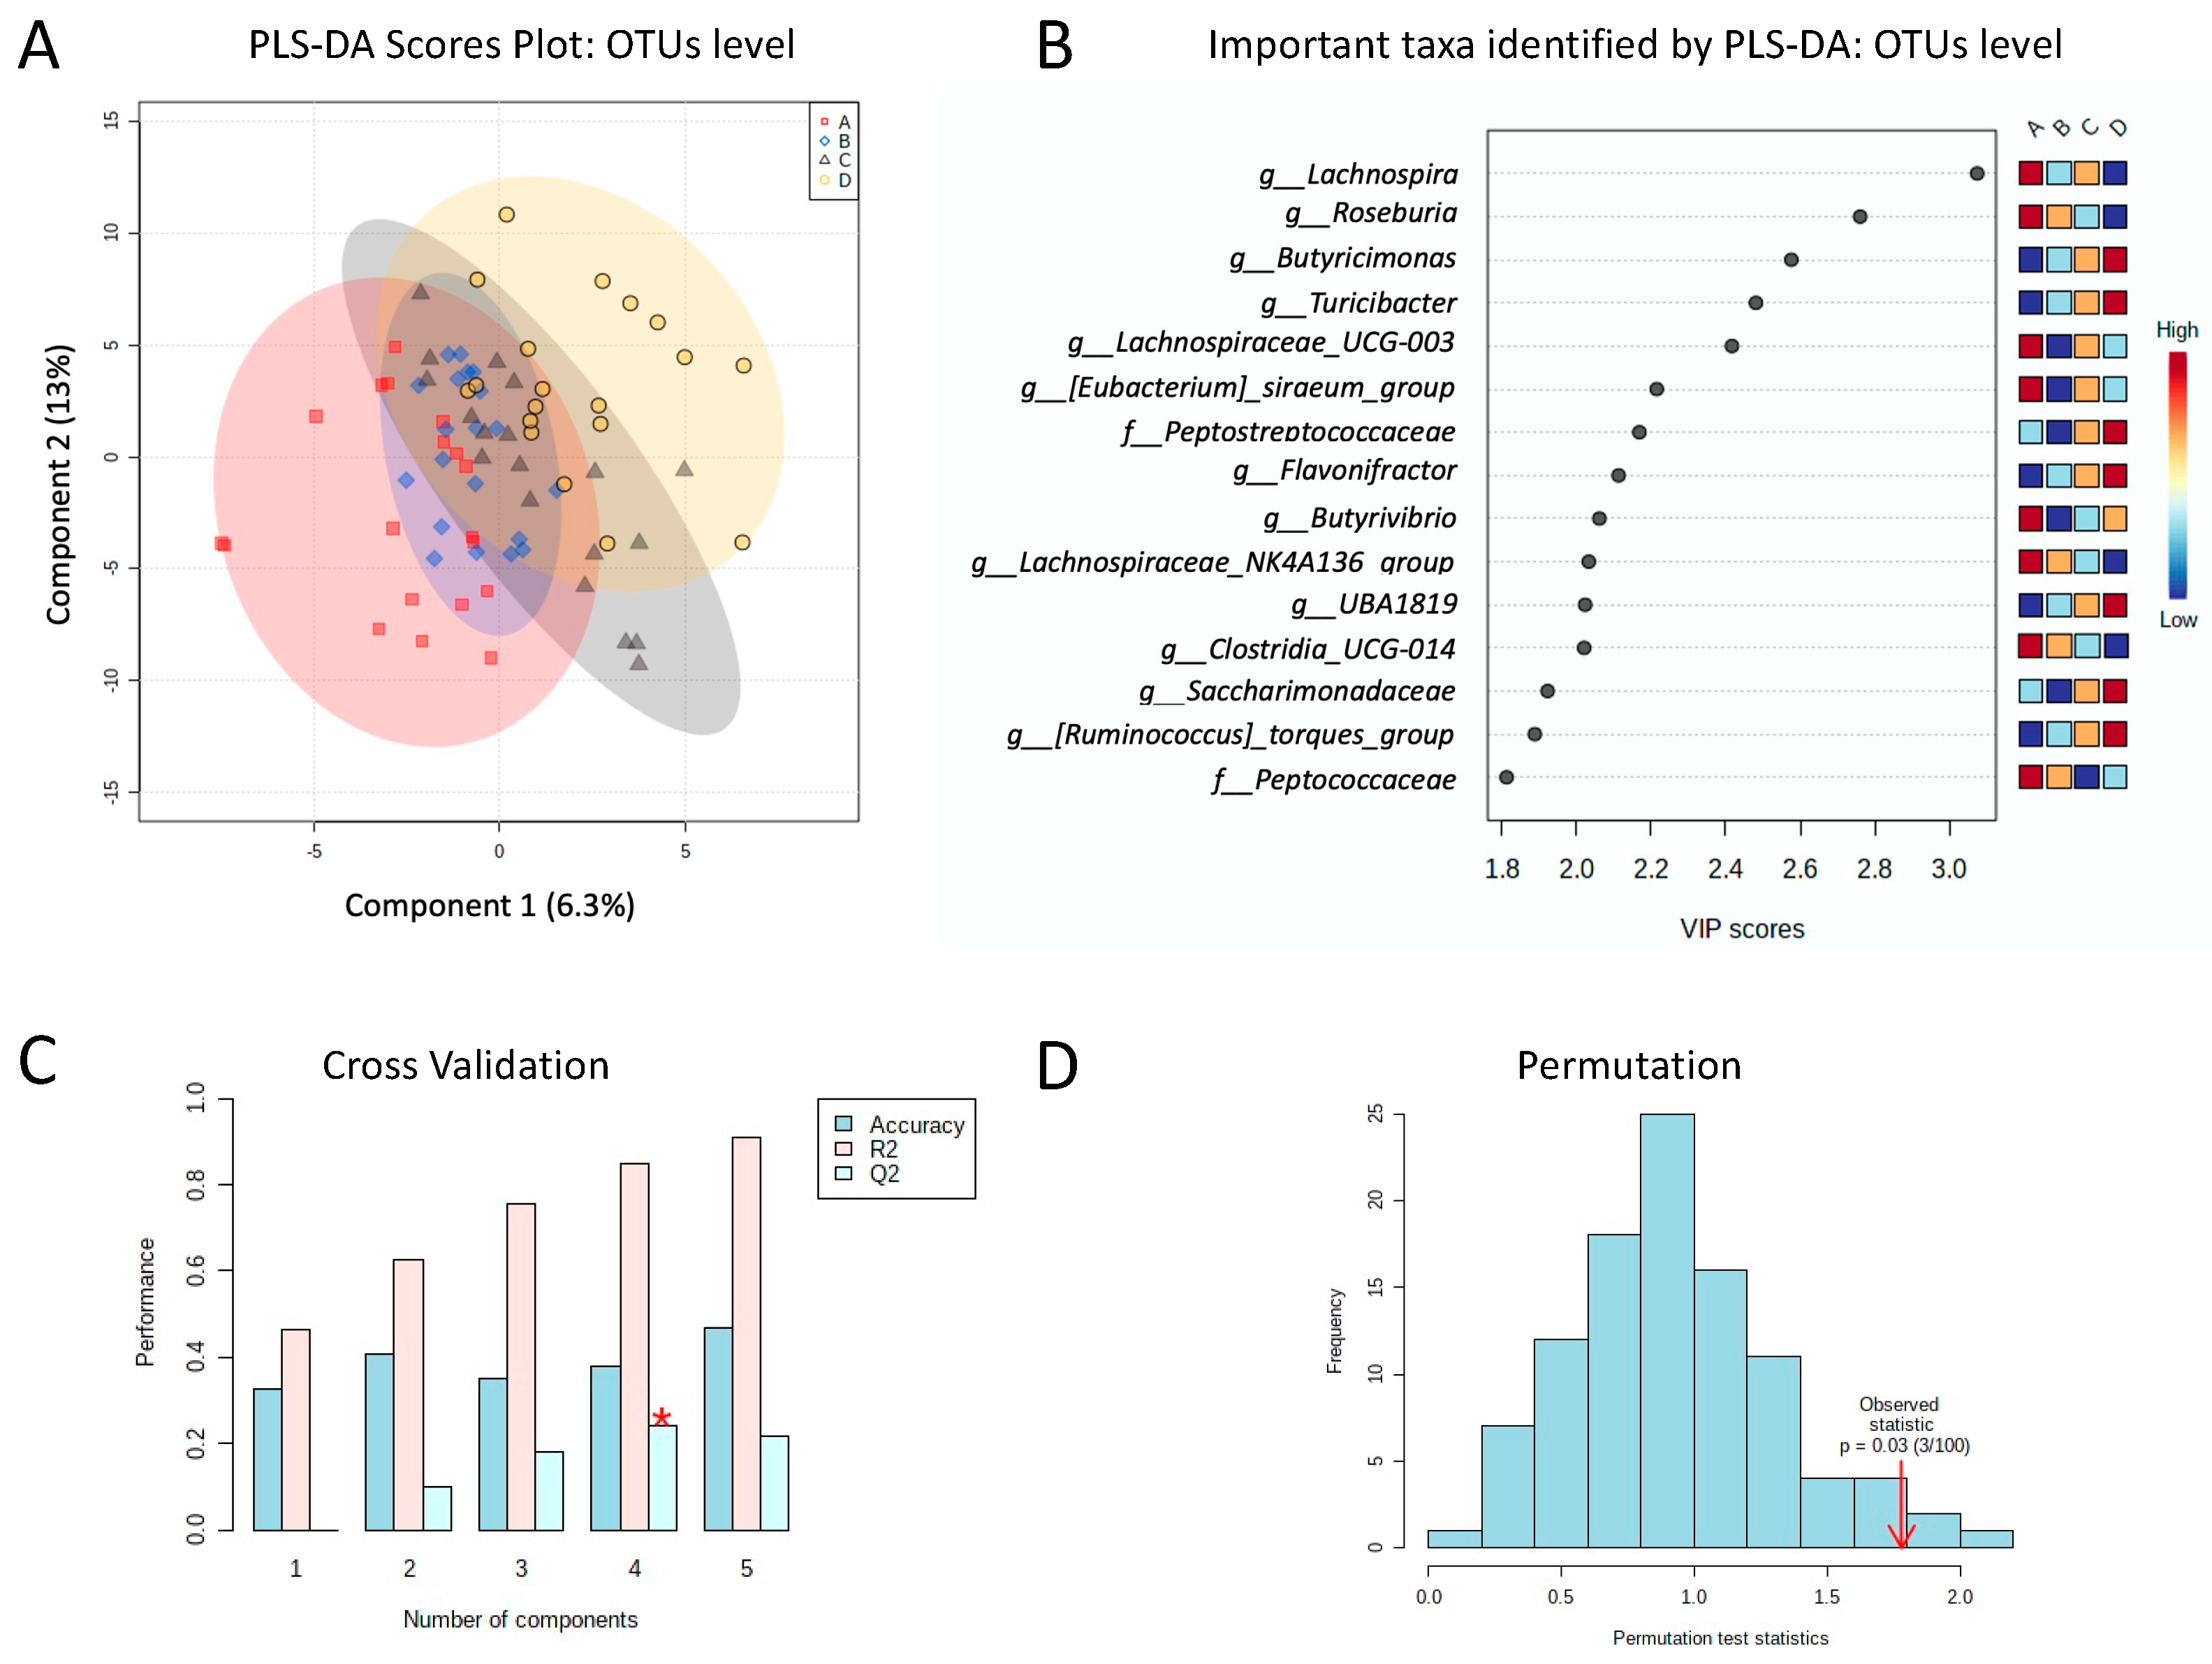
3.3. Diversity of Analysis of the Gut Microbiota
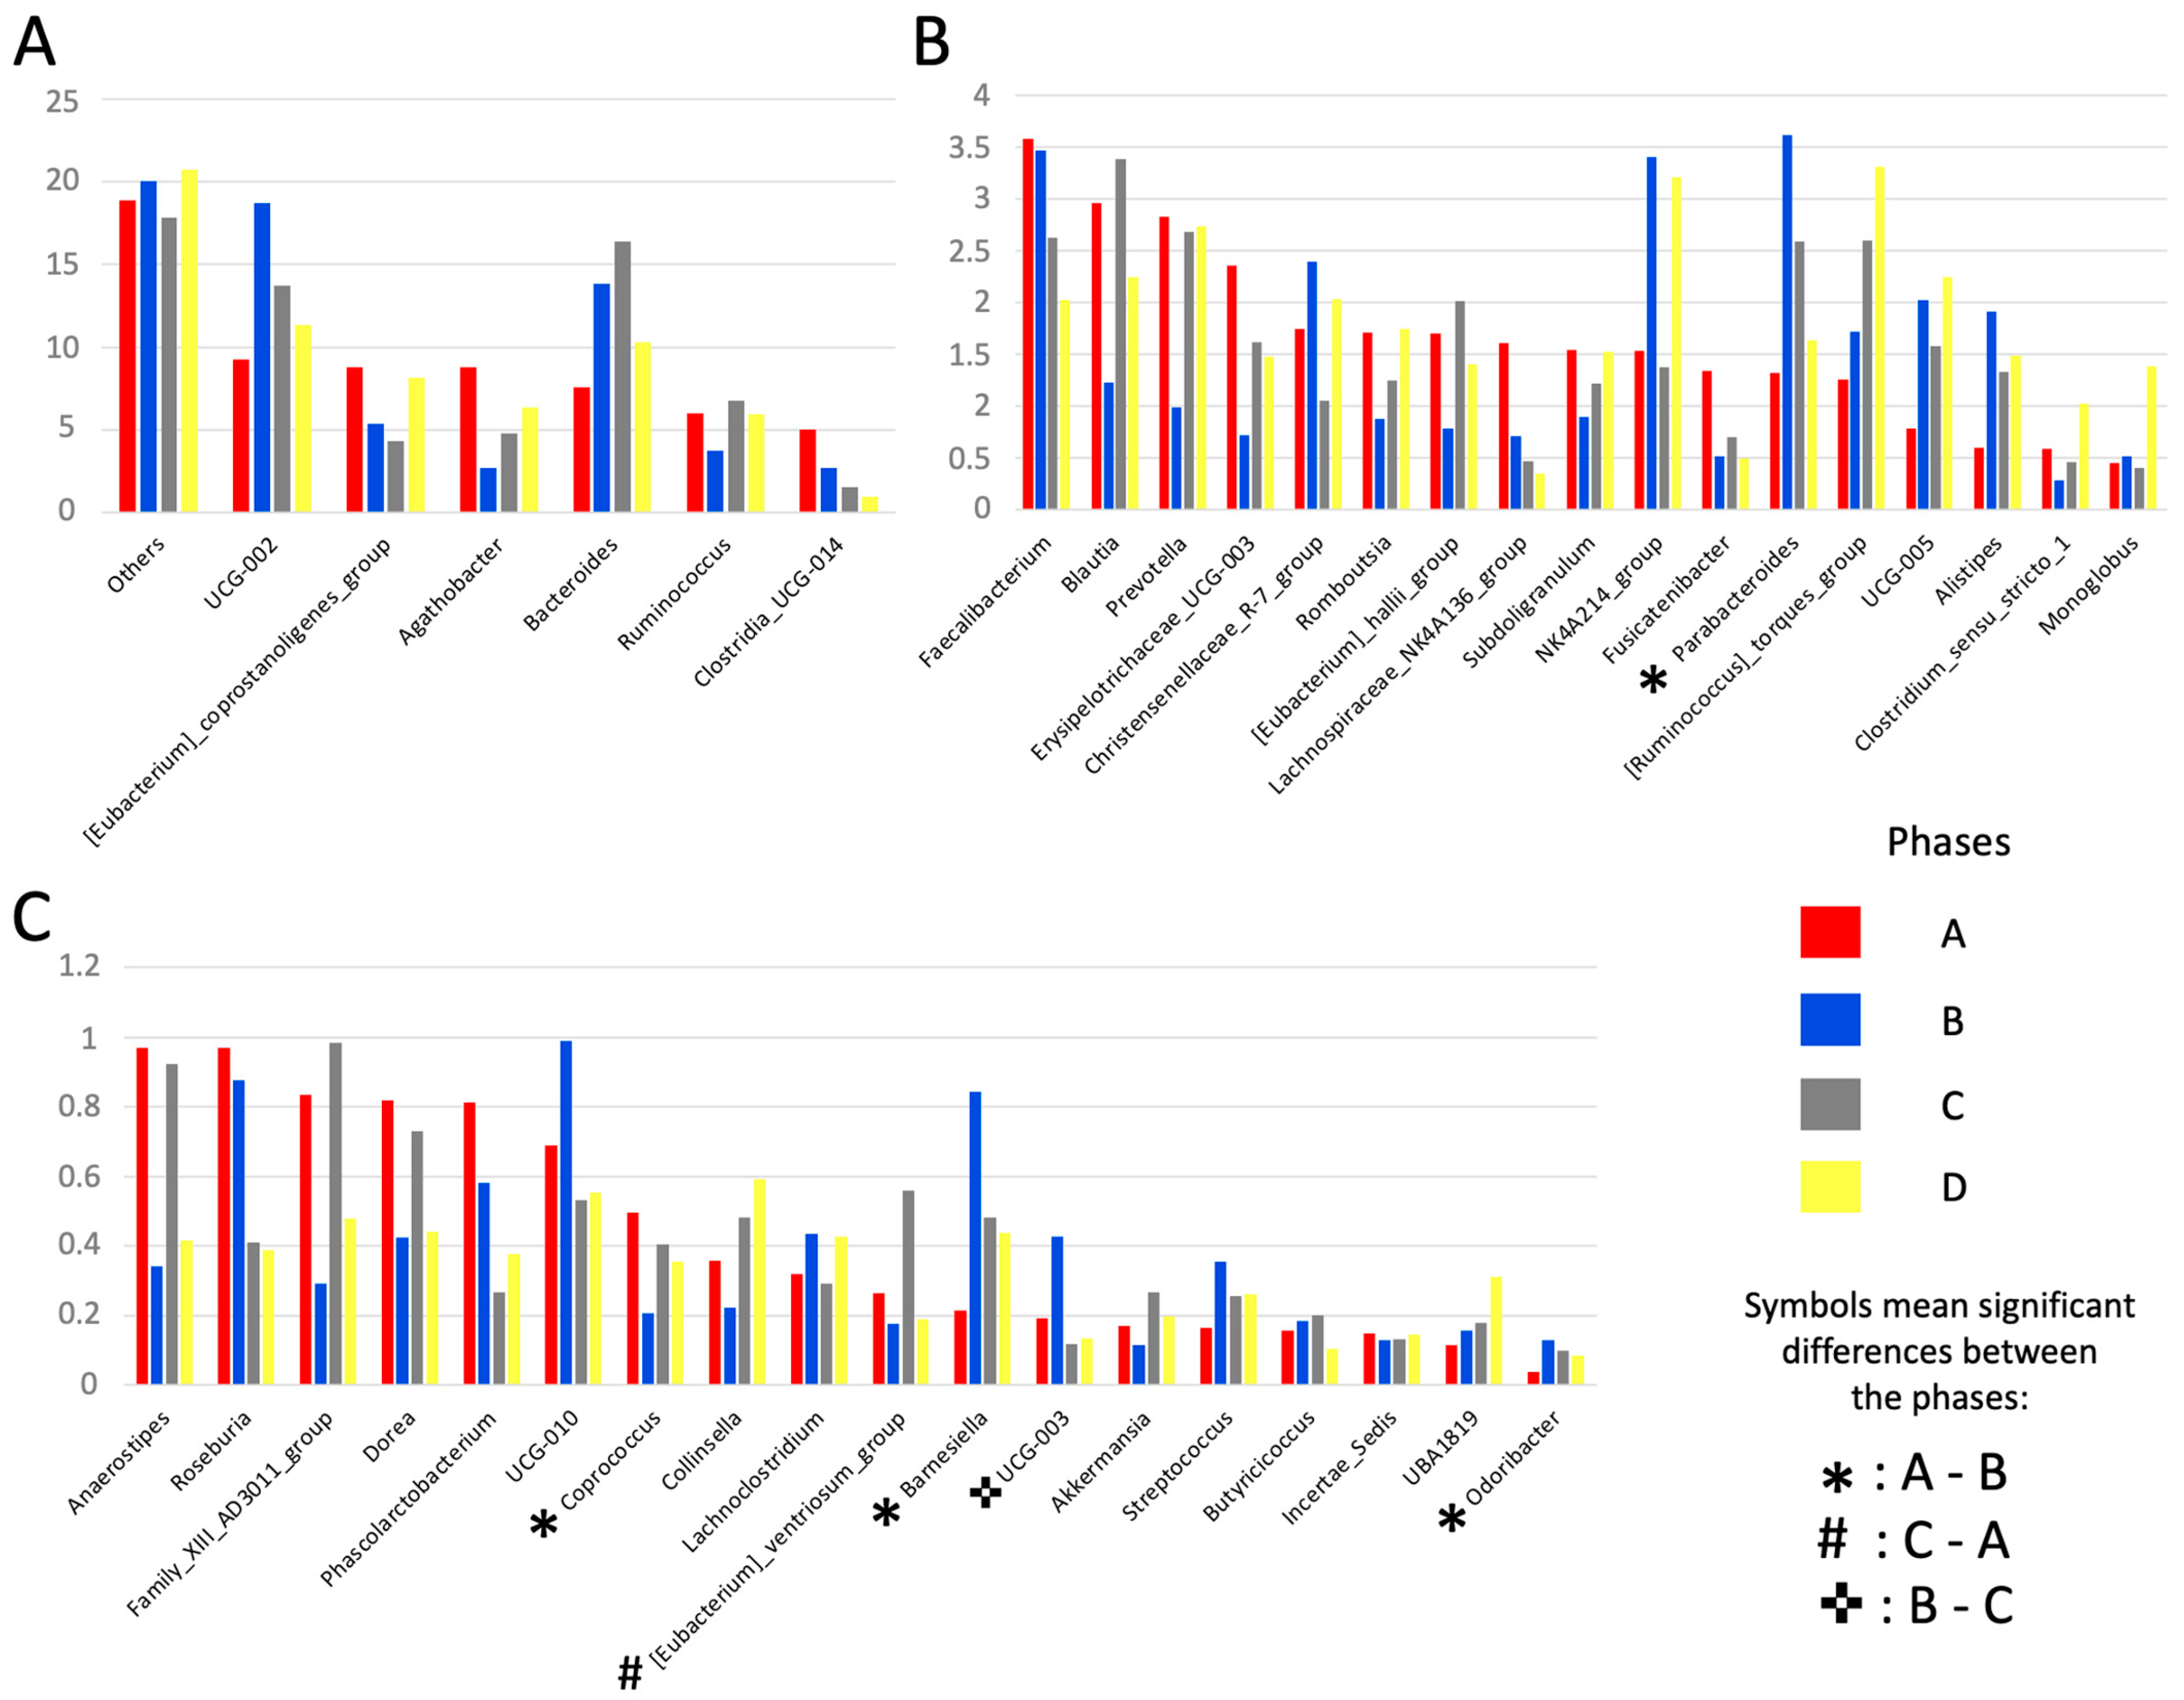
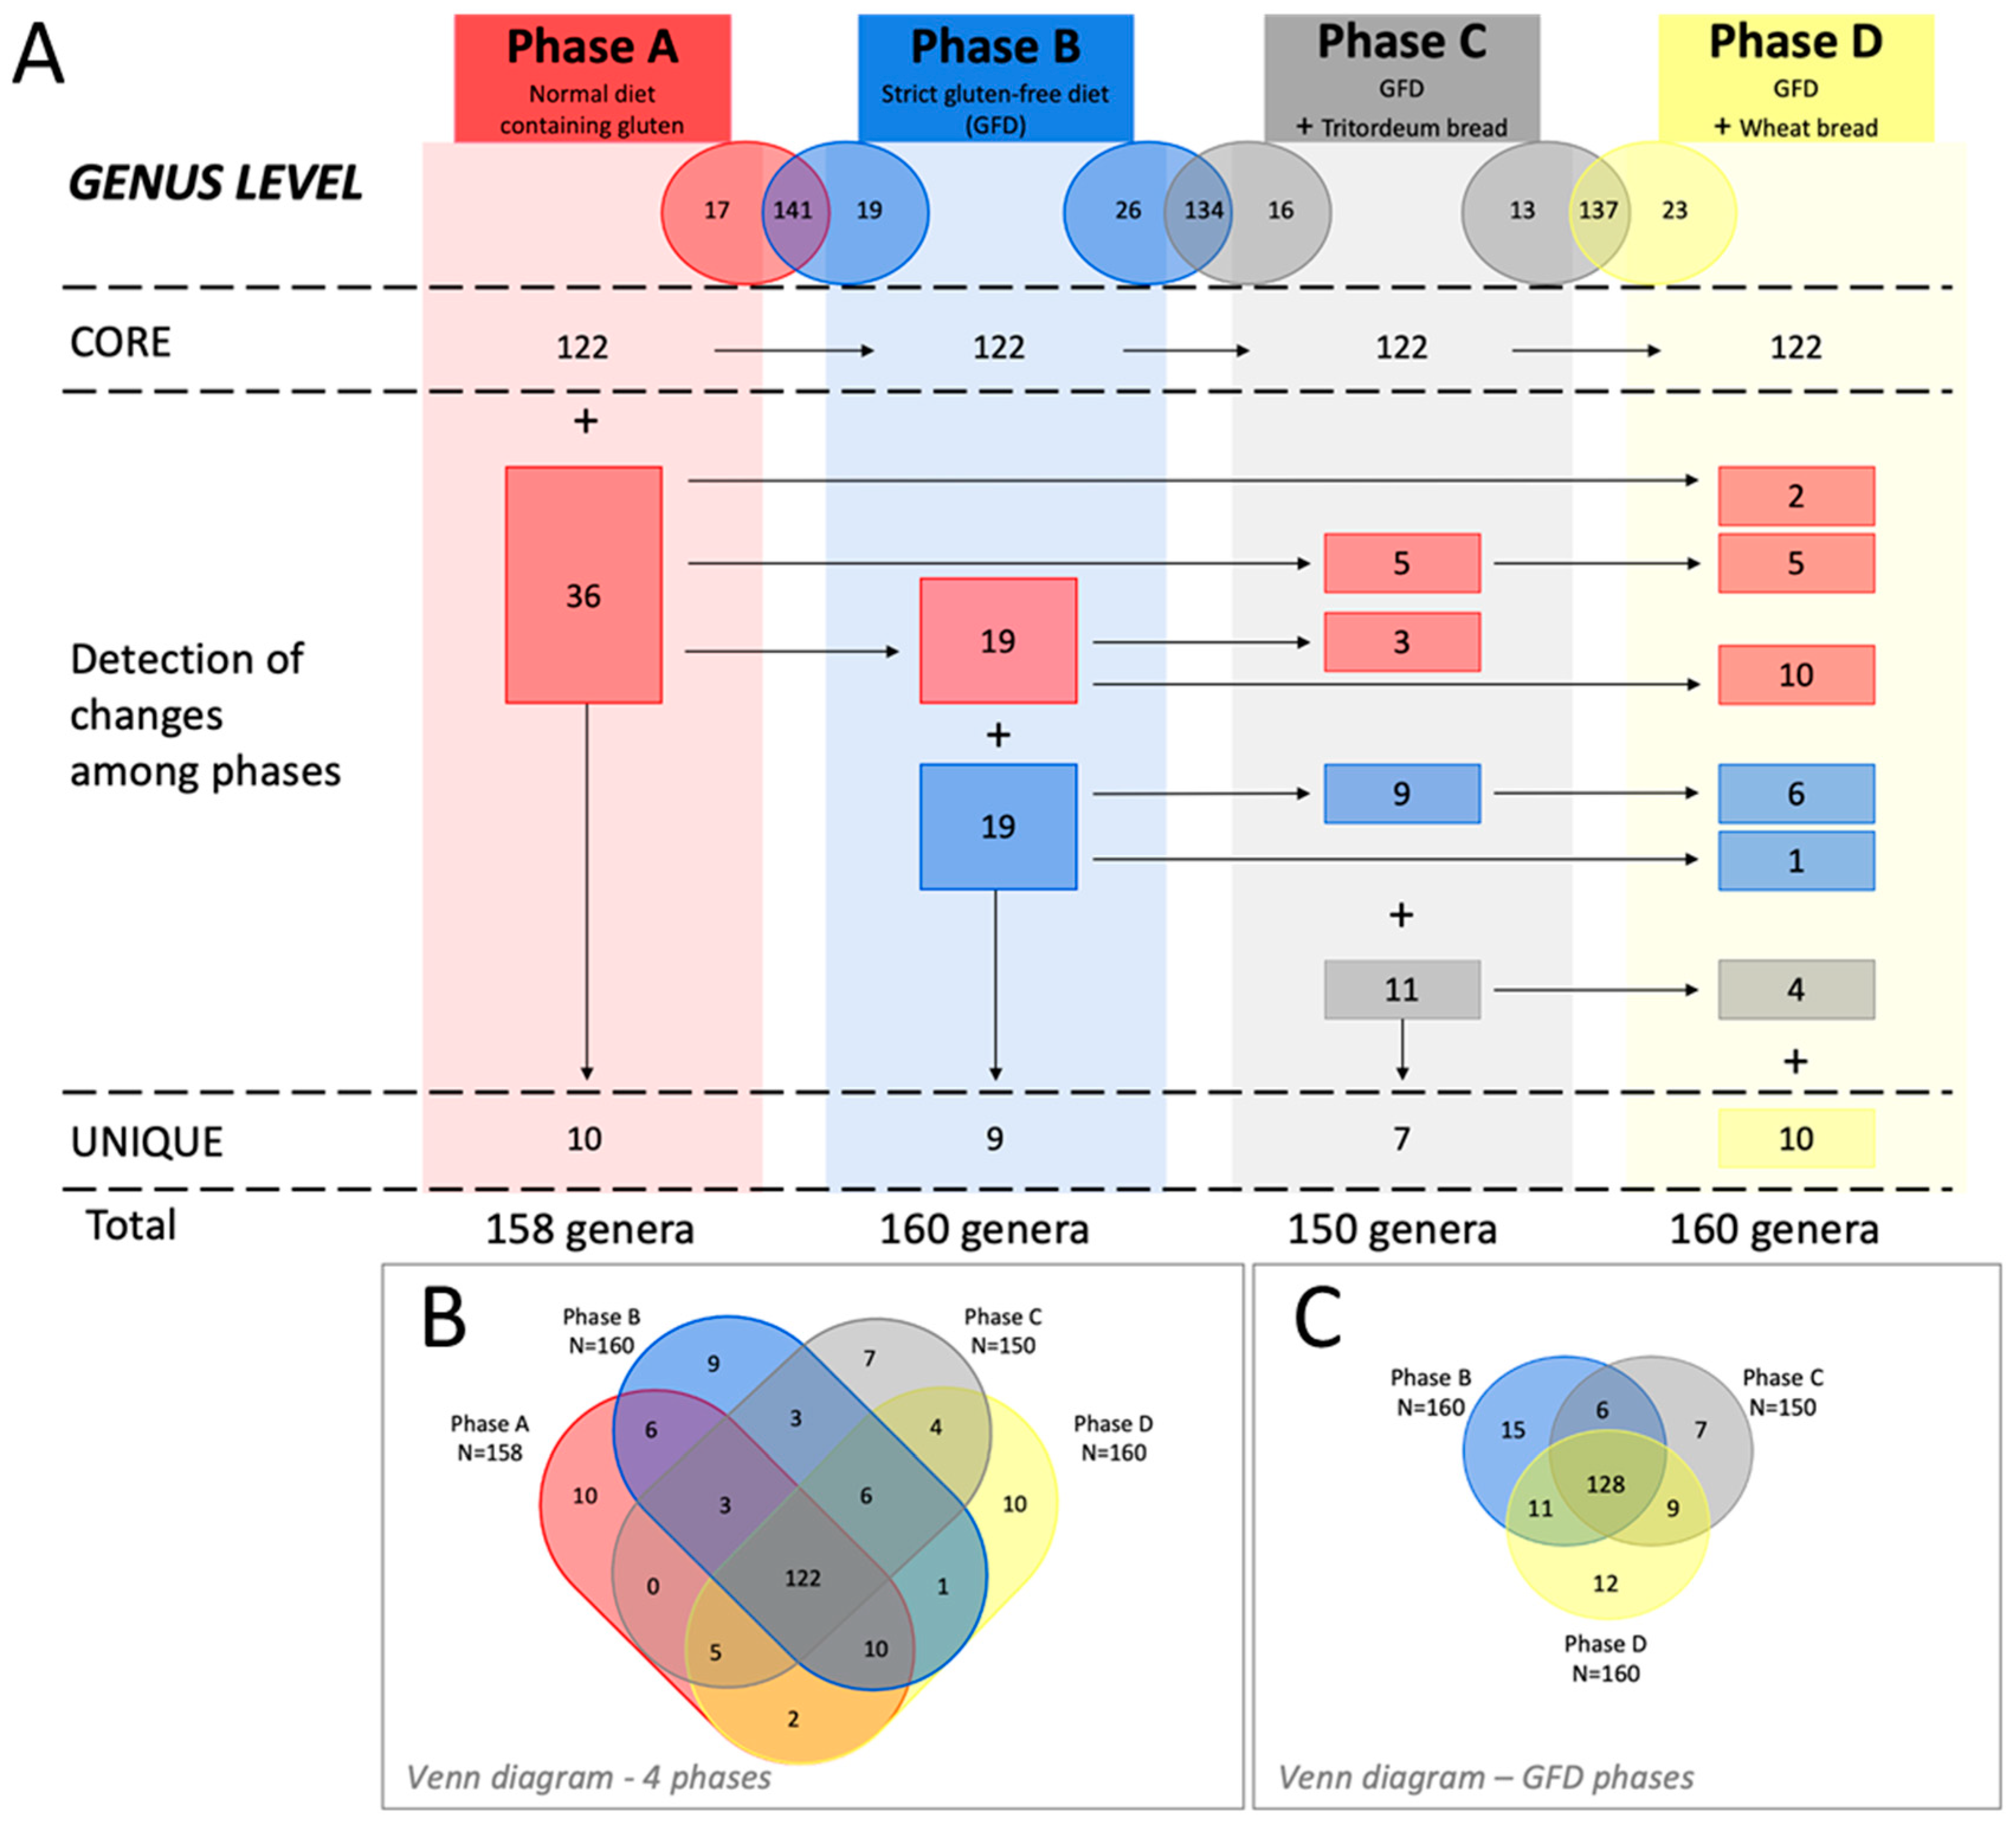
3.4. Relative Abundance and Changes in the Gut Microbiota
4. Discussion
5. Conclusions
Supplementary Materials
Author Contributions
Funding
Institutional Review Board Statement
Informed Consent Statement
Data Availability Statement
Acknowledgments
Conflicts of Interest
References
- Shewry, P.R. Wheat. J. Exp. Bot. 2009, 60, 1537–1553. [Google Scholar] [CrossRef] [PubMed]
- García-Molina, M.D.; Giménez, M.J.; Sánchez-León, S.; Barro, F. Gluten free wheat: Are we there? Nutrients 2019, 11, 487. [Google Scholar] [CrossRef] [Green Version]
- Shewry, P.R.; Halford, N.G. Cereal seed storage proteins: Structures, properties and role in grain utilization. J. Exp. Bot. 2002, 53, 947–958. [Google Scholar] [CrossRef] [PubMed] [Green Version]
- Dupont, F.M.; Vensel, W.H.; Tanaka, C.K.; Hurkman, W.J.; Altenbach, S.B. Deciphering the complexities of the wheat flour proteome using quantitative two-dimensional electrophoresis, three proteases and tandem mass spectrometry. Proteome Sci. 2011, 9, 10. [Google Scholar] [CrossRef] [PubMed] [Green Version]
- Haro, C.; Villatoro, M.; Vaquero, L.; Pastor, J.; Giménez, M.J.; Ozuna, C.V.; Sánchez-León, S.; García-Molina, M.D.; Segura, V.; Comino, I.; et al. The Dietary Intervention of Transgenic Low-Gliadin Wheat Bread in Patients with Non-Celiac Gluten Sensitivity (NCGS) Showed No Differences with Gluten Free Diet (GFD) but Provides Better Gut Microbiota Profile. Nutrients 2018, 10, 1964. [Google Scholar] [CrossRef] [Green Version]
- Juhász, A.; Belova, T.; Florides, C.G.; Maulis, C.; Fischer, I.; Gell, G.; Birinyi, Z.; Ong, J.; Keeble-Gagnère, G.; Maharajan, A. Genome mapping of seed-borne allergens and immunoresponsive proteins in wheat. Sci. Adv. 2018, 4, eaar8602. [Google Scholar] [CrossRef] [Green Version]
- Larré, C.; Lupi, R.; Gombaud, G.; Brossard, C.; Branlard, G.; Moneret-Vautrin, D.A.; Rogniaux, H.; Denery-Papini, S. Assessment of allergenicity of diploid and hexaploid wheat genotypes: Identification of allergens in the albumin/globulin fraction. J. Proteom. 2011, 74, 1279–1289. [Google Scholar] [CrossRef] [PubMed]
- Catassi, C.; Gatti, S.; Fasano, A. The new epidemiology of celiac disease. J. Pediatr. Gastroenterol. Nutr. 2014, 59, 7–9. [Google Scholar] [CrossRef] [Green Version]
- Mustalahti, K.; Catassi, C.; Reunanen, A.; Fabiani, E.; Heier, M.; McMillan, S.; Murray, L.; Metzger, M.-H.; Gasparin, M.; Bravi, E. The prevalence of celiac disease in Europe: Results of a centralized, international mass screening project. Ann. Med. 2010, 42, 587–595. [Google Scholar] [CrossRef]
- Sollid, L.M.; Tye-Din, J.A.; Qiao, S.-W.; Anderson, R.P.; Gianfrani, C.; Koning, F. Update 2020: Nomenclature and listing of celiac disease–relevant gluten epitopes recognized by CD4+ T cells. Immunogenetics 2020, 72, 85–88. [Google Scholar] [CrossRef]
- Tye-Din, J.A.; Stewart, J.A.; Dromey, J.A.; Beissbarth, T.; van Heel, D.A.; Tatham, A.; Henderson, K.; Mannering, S.I.; Gianfrani, C.; Jewell, D.P. Comprehensive, quantitative mapping of T cell epitopes in gluten in celiac disease. Sci. Transl. Med. 2010, 2, 41ra51. [Google Scholar] [CrossRef] [PubMed]
- Catassi, C.; Bai, J.C.; Bonaz, B.; Bouma, G.; Calabrò, A.; Carroccio, A.; Castillejo, G.; Ciacci, C.; Cristofori, F.; Dolinsek, J. Non-celiac gluten sensitivity: The new frontier of gluten related disorders. Nutrients 2013, 5, 3839–3853. [Google Scholar] [CrossRef] [PubMed]
- Vaquero, L.; Comino, I.; Vivas, S.; Rodríguez-Martín, L.; Giménez, M.J.; Pastor, J.; Sousa, C.; Barro, F. Tritordeum: A novel cereal for food processing with good acceptability and significant reduction in gluten immunogenic peptides in comparison with wheat. J. Sci. Food Agric. 2018, 98, 2201–2209. [Google Scholar] [CrossRef]
- Junker, Y.; Zeissig, S.; Kim, S.J.; Barisani, D.; Wieser, H.; Leffler, D.A.; Zevallos, V.; Libermann, T.A.; Dillon, S.; Freitag, T.L.; et al. Wheat amylase trypsin inhibitors drive intestinal inflammation via activation of toll-like receptor 4. J. Exp. Med. 2012, 209, 2395–2408. [Google Scholar] [CrossRef]
- Koumbi, L.; Giouleme, O.; Vassilopoulou, E. Non-Celiac Gluten Sensitivity and Irritable Bowel Disease: Looking for the Culprits. Curr. Dev. Nutr. 2020, 4, nzaa176. [Google Scholar] [CrossRef] [PubMed]
- Aljada, B.; Zohni, A.; El-Matary, W. The Gluten-Free Diet for Celiac Disease and Beyond. Nutrients 2021, 13, 3993. [Google Scholar] [CrossRef]
- Biesiekierski, J.R.; Newnham, E.D.; Irving, P.M.; Barrett, J.S.; Haines, M.; Doecke, J.D.; Shepherd, S.J.; Muir, J.G.; Gibson, P.R. Gluten causes gastrointestinal symptoms in subjects without celiac disease: A double-blind randomized placebo-controlled trial. Am. J. Gastroenterol. 2011, 106, 508–514; quiz 515. [Google Scholar] [CrossRef]
- Xhakollari, V.; Canavari, M.; Osman, M. Why people follow a gluten-free diet? An application of health behaviour models. Appetite 2021, 161, 105136. [Google Scholar] [CrossRef]
- Brenan, M. Gallup News Service: Nutrition and Food; The Gallup Organization: Washington, DC, USA, 2018. [Google Scholar]
- Di Giammarco, G.; Marinelli, D. We are what we eat. J. Thorac. Cardiovasc. Surg. 2019, 157, 1080–1081. [Google Scholar] [CrossRef] [Green Version]
- De Palma, G.; Nadal, I.; Collado, M.C.; Sanz, Y. Effects of a gluten-free diet on gut microbiota and immune function in healthy adult human subjects. Br. J. Nutr. 2009, 102, 1154–1160. [Google Scholar] [CrossRef] [Green Version]
- Duncan, S.H.; Belenguer, A.; Holtrop, G.; Johnstone, A.M.; Flint, H.J.; Lobley, G.E. Reduced dietary intake of carbohydrates by obese subjects results in decreased concentrations of butyrate and butyrate-producing bacteria in feces. Appl. Environ. Microbiol. 2007, 73, 1073–1078. [Google Scholar] [CrossRef] [PubMed] [Green Version]
- Flint, H.J.; Bayer, E.A.; Rincon, M.T.; Lamed, R.; White, B.A. Polysaccharide utilization by gut bacteria: Potential for new insights from genomic analysis. Nat. Rev. Microbiol. 2008, 6, 121–131. [Google Scholar] [CrossRef]
- Barboza, M.; Sela, D.A.; Pirim, C.; LoCascio, R.G.; Freeman, S.L.; German, J.B.; Mills, D.A.; Lebrilla, C.B. Glycoprofiling bifidobacterial consumption of galacto-oligosaccharides by mass spectrometry reveals strain-specific, preferential consumption of glycans. Appl. Environ. Microbiol. 2009, 75, 7319–7325. [Google Scholar] [CrossRef] [PubMed] [Green Version]
- Moschen, A.R.; Wieser, V.; Tilg, H. Dietary factors: Major regulators of the Gut’s microbiota. Gut Liver 2012, 6, 411–416. [Google Scholar] [CrossRef] [Green Version]
- Martín, A.; Alvarez, J.B.; Martín, L.M.; Barro, F.; Ballesteros, J. The development of tritordeum: A novel cereal for food processing. J. Cereal Sci. 1999, 30, 85–95. [Google Scholar] [CrossRef]
- Ávila, C.M.; Rodríguez-suárez, C.; Atienza, S.G. Tritordeum: Creating a new crop species—the successful use of plant genetic resources. Plants 2021, 10, 1029. [Google Scholar] [CrossRef]
- Sánchez-león, S.; Haro, C.; Villatoro, M.; Vaquero, L.; Comino, I.; González-amigo, A.B.; Vivas, S.; Pastor, J.; Sousa, C.; Landa, B.; et al. Tritordeum breads are well tolerated with preference over gluten-free breads in non-celiac wheat-sensitive patients and its consumption induce changes in gut bacteria. J. Sci. Food Agric. 2021, 101, 3508–3517. [Google Scholar] [CrossRef]
- Russo, F.; Riezzo, G.; Linsalata, M.; Orlando, A.; Tutino, V.; Prospero, L.; D’Attoma, B.; Giannelli, G. Managing Symptom Profile of IBS-D Patients with Tritordeum-Based Foods: Results from a Pilot Study. Front. Nutr. 2022, 9, 797192. [Google Scholar] [CrossRef]
- Hansen, L.B.S.; Roager, H.M.; Søndertoft, N.B.; Gøbel, R.J.; Kristensen, M.; Vallès-Colomer, M.; Vieira-Silva, S.; Ibrügger, S.; Lind, M.V.; Mærkedahl, R.B.; et al. A low-gluten diet induces changes in the intestinal microbiome of healthy Danish adults. Nat. Commun. 2018, 9, 4630. [Google Scholar] [CrossRef] [Green Version]
- Santos-Marcos, J.A.; Rangel-Zuñiga, O.A.; Jimenez-Lucena, R.; Quintana-Navarro, G.M.; Garcia-Carpintero, S.; Malagon, M.M.; Landa, B.B.; Tena-Sempere, M.; Perez-Martinez, P.; Lopez-Miranda, J.; et al. Influence of gender and menopausal status on gut microbiota. Maturitas 2018, 116, 43–53. [Google Scholar] [CrossRef]
- Caporaso, J.G.; Kuczynski, J.; Stombaugh, J.; Bittinger, K.; Bushman, F.D.; Costello, E.K.; Fierer, N.; Peña, A.G.; Goodrich, J.K.; Gordon, J.I.; et al. QIIME allows analysis of high-throughput community sequencing data. Nat. Methods 2010, 7, 335–336. [Google Scholar] [CrossRef] [Green Version]
- Bolyen, E.; Rideout, J.R.; Dillon, M.R.; Bokulich, N.A.; Abnet, C.C.; Al-Ghalith, G.A.; Alexander, H.; Alm, E.J.; Arumugam, M.; Asnicar, F.; et al. Reproducible, interactive, scalable and extensible microbiome data science using QIIME 2. Nat. Biotechnol. 2019, 37, 852–857. [Google Scholar] [CrossRef]
- Qiime2 View Website. Available online: https://view.qiime2.org/ (accessed on 10 October 2021).
- Callahan, B.J.; McMurdie, P.J.; Rosen, M.J.; Han, A.W.; Johnson, A.J.A.; Holmes, S.P. DADA2: High-resolution sample inference from Illumina amplicon data. Nat. Methods 2016, 13, 581–583. [Google Scholar] [CrossRef] [PubMed] [Green Version]
- Rideout, J.R.; He, Y.; Navas-Molina, J.A.; Walters, W.A.; Ursell, L.K.; Gibbons, S.M.; Chase, J.; McDonald, D.; Gonzalez, A.; Robbins-Pianka, A.; et al. Subsampled open-reference clustering creates consistent, comprehensive OTU definitions and scales to billions of sequences. PeerJ 2014, 2, e545. [Google Scholar] [CrossRef] [Green Version]
- Quast, C.; Pruesse, E.; Yilmaz, P.; Gerken, J.; Schweer, T.; Yarza, P.; Peplies, J.; Glöckner, F.O. The SILVA ribosomal RNA gene database project: Improved data processing and web-based tools. Nucleic Acids Res. 2013, 41, D590–D596. [Google Scholar] [CrossRef] [PubMed]
- Rognes, T.; Flouri, T.; Nichols, B.; Quince, C.; Mahé, F. VSEARCH: A versatile open source tool for metagenomics. PeerJ 2016, 4, e2584. [Google Scholar] [CrossRef]
- Benjamini, Y.; Hochberg, Y. Controlling the False Discovery Rate: A Practical and Powerful Approach to Multiple Testing. J. R. Stat. Soc. Ser. B 1995, 57, 289–300. [Google Scholar] [CrossRef]
- Chong, J.; Wishart, D.S.; Xia, J. Using MetaboAnalyst 4.0 for Comprehensive and Integrative Metabolomics Data Analysis. Curr. Protoc. Bioinform. 2019, 68, e86. [Google Scholar] [CrossRef]
- Sollid, L.M.; Qiao, S.W.; Anderson, R.P.; Gianfrani, C.; Koning, F. Nomenclature and listing of celiac disease relevant gluten T-cell epitopes restricted by HLA-DQ molecules. Immunogenetics 2012, 64, 455–460. [Google Scholar] [CrossRef] [Green Version]
- Maiuri, L.; Ciacci, C.; Ricciardelli, I.; Vacca, L.; Raia, V.; Auricchio, S.; Picard, J.; Osman, M.; Quaratino, S.; Londei, M. Association between innate response to gliadin and activation of pathogenic T cells in coeliac disease. Lancet 2003, 362, 30–37. [Google Scholar] [CrossRef]
- Kahlenberg, F.; Sanchez, D.; Lachmann, I.; Tuckova, L.; Tlaskalova, H.; Méndez, E.; Mothes, T. Monoclonal antibody R5 for detection of putatively coeliac-toxic gliadin peptides. Eur. Food Res. Technol. 2006, 222, 78–82. [Google Scholar] [CrossRef]
- Amnuaycheewa, P.; Niemann, L.; Goodman, R.E.; Baumert, J.L.; Taylor, S.L. Challenges in Gluten Analysis: A Comparison of Four Commercial Sandwich ELISA Kits. Foods 2022, 11, 706. [Google Scholar] [CrossRef] [PubMed]
- Morón, B.; Bethune, M.T.; Comino, I.; Manyani, H.; Ferragud, M.; López, M.C.; Cebolla, A.; Khosla, C.; Sousa, C. Toward the assessment of food toxicity for celiac patients: Characterization of monoclonal antibodies to a main immunogenic gluten peptide. PLoS ONE 2008, 3, e2294. [Google Scholar] [CrossRef] [Green Version]
- Morón, B.; Cebolla, Á.; Manyani, H.; Álvarez-Maqueda, M.; Megías, M.; Thomas, M.D.C.; López, M.C.; Sousa, C. Sensitive detection of cereal fractions that are toxic to celiac disease patients by using monoclonal antibodies to a main immunogenic wheat peptide. Am. J. Clin. Nutr. 2008, 87, 405–414. [Google Scholar] [CrossRef] [Green Version]
- Matsuo, H.; Kohno, K.; Morita, E. Molecular cloning, recombinant expression and IgE-binding epitope of ω-5 gliadin, a major allergen in wheat-dependent exercise-induced anaphylaxis. FEBS J. 2005, 272, 4431–4438. [Google Scholar] [CrossRef] [PubMed]
- Matsuo, H.; Yokooji, T.; Taogoshi, T. Common food allergens and their IgE-binding epitopes. Allergol. Int. 2015, 64, 332–343. [Google Scholar] [CrossRef] [Green Version]
- Niland, B.; Cash, B.D. Health Benefits and Adverse Effects of a Gluten-Free Diet in Non-Celiac Disease Patients. Gastroenterol. Hepatol. 2018, 14, 82–91. [Google Scholar]
- Melini, V.; Melini, F. Gluten-Free Diet: Gaps and Needs for a Healthier Diet. Nutrients 2019, 11, 170. [Google Scholar] [CrossRef] [Green Version]
- Caio, G.; Lungaro, L.; Segata, N.; Guarino, M.; Zoli, G.; Volta, U.; De Giorgio, R. Effect of Gluten-Free Diet on Gut Microbiota Composition in Patients with Celiac Disease and Non-Celiac Gluten/Wheat Sensitivity. Nutrients 2020, 12, 1832. [Google Scholar] [CrossRef]
- Ravcheev, D.A.; Thiele, I. Comparative Genomic Analysis of the Human Gut Microbiome Reveals a Broad Distribution of Metabolic Pathways for the Degradation of Host-Synthetized Mucin Glycans and Utilization of Mucin-Derived Monosaccharides. Front. Genet. 2017, 8, 111. [Google Scholar] [CrossRef] [Green Version]
- Desai, M.S.; Seekatz, A.M.; Koropatkin, N.M.; Kamada, N.; Hickey, C.A.; Wolter, M.; Pudlo, N.A.; Kitamoto, S.; Terrapon, N.; Muller, A.; et al. A Dietary Fiber-Deprived Gut Microbiota Degrades the Colonic Mucus Barrier and Enhances Pathogen Susceptibility. Cell 2016, 167, 1339–1353.e21. [Google Scholar] [CrossRef] [Green Version]
- Bodkhe, R.; Shetty, S.A.; Dhotre, D.P.; Verma, A.K.; Bhatia, K.; Mishra, A.; Kaur, G.; Pande, P.; Bangarusamy, D.K.; Santosh, B.P.; et al. Comparison of Small Gut and Whole Gut Microbiota of First-Degree Relatives With Adult Celiac Disease Patients and Controls. Front. Microbiol. 2019, 10, 164. [Google Scholar] [CrossRef]
- Bibbò, S.; Abbondio, M.; Sau, R.; Tanca, A.; Pira, G.; Errigo, A.; Manetti, R.; Pes, G.M.; Dore, M.P.; Uzzau, S. Fecal Microbiota Signatures in Celiac Disease Patients With Poly-Autoimmunity. Front. Cell. Infect. Microbiol. 2020, 10, 349. [Google Scholar] [CrossRef] [PubMed]
- Pérez-Burillo, S.; Hinojosa-Nogueira, D.; Pastoriza, S.; Rufián-Henares, J.A. Plant extracts as natural modulators of gut microbiota community structure and functionality. Heliyon 2020, 6, e05474. [Google Scholar] [CrossRef] [PubMed]
- Vacca, M.; Celano, G.; Calabrese, F.M.; Portincasa, P.; Gobbetti, M.; De Angelis, M. The Controversial Role of Human Gut Lachnospiraceae. Microorganisms 2020, 8, 573. [Google Scholar] [CrossRef] [PubMed]
- Bonder, M.J.; Tigchelaar, E.F.; Cai, X.; Trynka, G.; Cenit, M.C.; Hrdlickova, B.; Zhong, H.; Vatanen, T.; Gevers, D.; Wijmenga, C.; et al. The influence of a short-term gluten-free diet on the human gut microbiome. Genome Med. 2016, 8, 45. [Google Scholar] [CrossRef] [PubMed]


| Number of Events | ||||
|---|---|---|---|---|
| Chymotrypsin | Trypsin | |||
| Perfect Match | Wheat | Tritordeum | Wheat | Tritordeum |
| CD epitopes | 49 | 14 | 64 | 24 |
| p31–43 | 6 | 2 | 0 | 0 |
| G12 | 22 | 4 | 3 | 1 |
| A1 | 31 | 8 | 1 | 1 |
| R5 | 27 | 8 | 8 | 2 |
| IgE recognition sites | 61 | 33 | 195 | 116 |
| 1 mismatch | ||||
| CD epitopes | 47 | 15 | 73 | 33 |
| p31–43 | 9 | 5 | 0 | 0 |
| G12 | 112 | 31 | 52 | 22 |
| A1 | 93 | 26 | 16 | 9 |
| R5 | 156 | 64 | 71 | 31 |
| IgE recognition sites | 377 | 176 | 536 | 280 |
Publisher’s Note: MDPI stays neutral with regard to jurisdictional claims in published maps and institutional affiliations. |
© 2022 by the authors. Licensee MDPI, Basel, Switzerland. This article is an open access article distributed under the terms and conditions of the Creative Commons Attribution (CC BY) license (https://creativecommons.org/licenses/by/4.0/).
Share and Cite
Haro, C.; Guzmán-López, M.H.; Marín-Sanz, M.; Sánchez-León, S.; Vaquero, L.; Pastor, J.; Comino, I.; Sousa, C.; Vivas, S.; Landa, B.B.; et al. Consumption of Tritordeum Bread Reduces Immunogenic Gluten Intake without Altering the Gut Microbiota. Foods 2022, 11, 1439. https://0-doi-org.brum.beds.ac.uk/10.3390/foods11101439
Haro C, Guzmán-López MH, Marín-Sanz M, Sánchez-León S, Vaquero L, Pastor J, Comino I, Sousa C, Vivas S, Landa BB, et al. Consumption of Tritordeum Bread Reduces Immunogenic Gluten Intake without Altering the Gut Microbiota. Foods. 2022; 11(10):1439. https://0-doi-org.brum.beds.ac.uk/10.3390/foods11101439
Chicago/Turabian StyleHaro, Carmen, María H. Guzmán-López, Miriam Marín-Sanz, Susana Sánchez-León, Luis Vaquero, Jorge Pastor, Isabel Comino, Carolina Sousa, Santiago Vivas, Blanca B. Landa, and et al. 2022. "Consumption of Tritordeum Bread Reduces Immunogenic Gluten Intake without Altering the Gut Microbiota" Foods 11, no. 10: 1439. https://0-doi-org.brum.beds.ac.uk/10.3390/foods11101439