
Gas–Liquid Mass Transfer around a Rising Bubble: Combined Effect of Rheology and Surfactant


Toulouse Biotechnology Institute, Université de Toulouse, CNRS, INRAE, INSA, 135 Avenue de Rangueil, 31077 Toulouse, France
*
Authors to whom correspondence should be addressed.
Fluids 2021, 6(2), 84; https://0-doi-org.brum.beds.ac.uk/10.3390/fluids6020084
Submission received: 20 January 2021
/
Revised: 9 February 2021
/
Accepted: 10 February 2021
/
Published: 15 February 2021
(This article belongs to the Special Issue Flow and Heat Transfer Intensification in Chemical Engineering)
Abstract
:The influence of viscosity and surface tension on oxygen transfer was investigated using planar laser-induced fluorescence with inhibition (PLIF-I). The surface tension and the viscosity were modified using Triton X-100 and polyacrylamide, respectively. Changes in the hydrodynamic parameters of millimetric bubbles were identified, and transfer parameters were calculated. The results revealed a decrease in the mass transferred in the presence of a contaminant. For modified viscosity, the decrease in mass transferred was allowed for by current correlations, but the presence of surfactant led to a sharp decrease in the liquid side mass transfer coefficient, which became even lower when polymer was added. An explanation for the gap between classical correlations and experimental values of kL is discussed, and a hypothesis of the existence of an accumulation of contaminant in the diffusion layer is proposed. This led to the possibility of a decrease in the diffusion coefficient and oxygen saturation concentration in the liquid film, explaining the discrepancy between models and experience. Adapted values of DO2 and [O2] * in this layer were estimated. This original study unravels the complexity of mass transfer from an air bubble in a complex medium.
1. Introduction
Gas–liquid columns are applied extensively in systems involving a mass transfer, e.g., in chemical and biological processes [1,2,3,4,5]. Among these applications is gas–liquid mass transfer that is particularly important in wastewater treatment plants, where oxygen is transferred into the water to keep the bacteria responsible for degradation of the pollutants alive [6,7]. Usually, this oxygen is provided via bubbly flow and is, thus, a key step for the performance of the process [6]. As a result, many studies have been carried out on both the hydrodynamic and the mass transfer aspects of gas/liquid contactors. In the 1990s, research was first conducted using the global point of view of contactors [8,9,10,11] with global oxygen probes and gas hold-up. Then, to complement these studies, local phenomena and their physical effects on hydrodynamics [12,13,14,15,16] and mass transfer were investigated [17,18,19,20,21]. At the same time, experimental data acquired at the scales of different contactors, such as bubble columns, agitated tanks, or airlift contactors, led to the development of increasingly accurate analytical or numerical models. However, physicochemical phenomena occurring during the gas/liquid transfer are not yet fully understood because they are highly dependent on the nature of the liquid media. The presence of surfactants, amphiphilic molecules present in large amounts in wastewater, has been identified as an inhibitor of mass transfer [22,23]. This inhibition can occur for many reasons. Alves et al. [24] highlighted modification of the shapes and velocities of bubbles, leading to a decrease in the mass transferred when surfactants were added to water. However, the modification does not affect hydrodynamics alone, and the work of Caskey and Barlage [25] showed a decrease in the gas–liquid mass transfer coefficient of CO2 in the presence of surfactant on a plane interface, linked to a decrease in surface tension. A study by Painmanakul [21] focused on gas/liquid transfer in a liquid medium containing surfactants, highlighting the influence of physicochemical properties on the interfacial area by increasing the bubble size and the gas hold-up. Painmanakul and Hébrard [26] underlined the direct link between physicochemical properties of the liquid phase and the liquid side mass transfer coefficient, kL, from bubbles. The effect of surfactant on mass transfer was also studied by Gomez-Diaz et al. and Rosso et al. [27,28] and attributed to the accumulation of surfactant at the interface, leading to a “barrier effect”. A study by Sardeing et al. [29] supported the direct effect of surface recovery of surfactants on the liquid side mass transfer coefficient, kL. They designed a model for predicting this coefficient, based on two values of kL, with and without surfactant. A few years later, the work of Hébrard et al. [11] revealed the direct link between the liquid side mass transfer coefficient kL and the diffusion coefficient of oxygen, DO2, in the presence of surfactants.
For a better understanding of local effects during mass transfer from the bubble to the water, a few techniques for directly visualizing mass transfer were developed in the last decade. Among them are techniques using redox dyes [30,31,32,33,34,35,36,37,38] or laser-induced fluorescence (LIF). LIF methods using a pH-sensitive fluorescent dye [39,40,41,42,43] can be implemented to visualize CO2 transfer, not only in pure water, but also in water contaminated with a surfactant [44,45] or having had its viscosity modified with glycerol [46]. This technique can also be applied to the visualization of oxygen transfer by means of fluorescence induced by laser with inhibition (PLIF-I), using a fluorescent dye quenched by the presence of oxygen (LIF-I) [47], from plane interfaces [48,49,50], from Taylor bubbles [51,52,53,54], or from free moving bubbles. (PLIF-I) was used by Bork et al. [55] and Francois et al. [56] to visualize oxygen transfer into water from millimetric bubbles. This technique was also coupled with particle image velocimetry (PIV) measurements, to simultaneously approach mass transfer and velocity of the liquid [57]. In the work of Jimenez [58], the PLIF-I technique was used to study the influence of a nonionic surfactant (caprylic acid monoglyceride) on oxygen transfer by providing information about the hydrodynamic parameters of the bubbles studied, such as velocity and equivalent diameter, as well as the liquid side mass transfer coefficient and the diffusion coefficient of oxygen. They demonstrated that, at a concentration lower than the critical micellar concentration (CMC), the bubble undergoes a sharp decrease in velocity and mass transfer coefficient. A slight decrease in diffusion coefficient was also observed. However, it has been clearly demonstrated that the physical dimensionless numbers generally used to model mass transfer, such as Schmidt and Reynolds numbers, are not sufficient to explain the decrease of oxygen transfer to the water in presence of surfactants. As a result, a discrepancy was observed between the theoretical kL proposed by Frössling and Higbie [59,60] and experimental values. Recently, a study by Xu et al. [61] used the PLIF-I technique to study the mass transfer coefficient and diffusion of oxygen in polymer solutions (Newtonian and non-Newtonian fluids). This study highlighted a similar decrease in mass transfer in the presence of polymer. A slight decrease in diffusion coefficient was observed, which was explained by the increase in the viscosity of the solution.
The present study proposes to apply PLIF-I to visualize and quantify the oxygen mass transfer from millimetric bubbles rising in different complex media at rest: a nonionic surfactant, Triton X-100, and a solution containing both Triton X-100 and the non-Newtonian polymer PAAm (polyacrylamide) in the same concentration as the one used by Xu et al. [61]. To the best of our knowledge, this is the first time that a complex medium, combining a change in viscosity and a change in surface tension, is studied in terms of oxygen mass transfer, with a local approach.
2. Materials and Methods
2.1. Experimental Set-Up
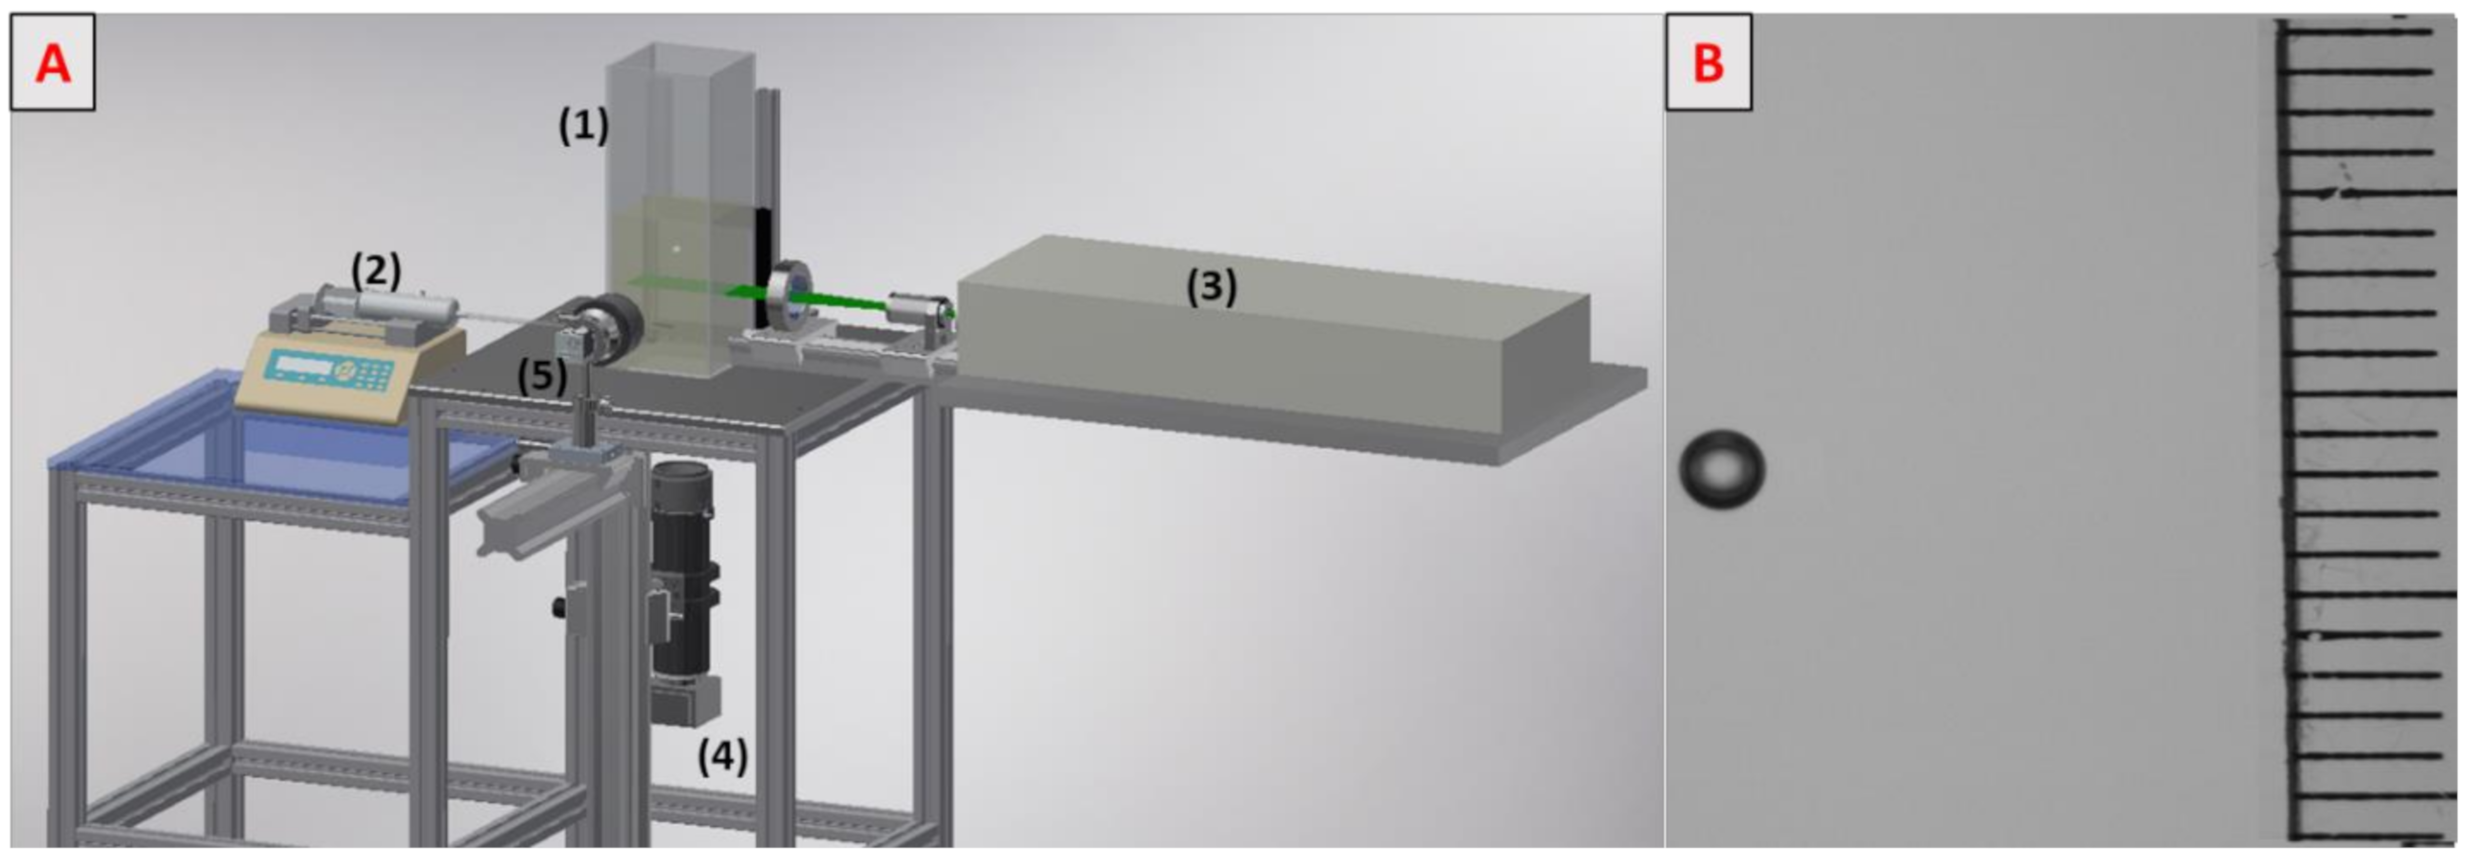
The experimental set-up is depicted in Figure 1A. The 30 × 10 × 10 cm3 column (1) was filled with 1.5 L of the solution under study. The liquid was deoxygenized with nitrogen before each measurement, and the oxygen concentration was verified with an oxygen probe (HACH, HQ40D). A single millimetric bubble was generated with a syringe pump (HARVARD Apparatus PHD 22/2000 programmable) (2) and injected through a 75 µm diameter needle. To excite fluorescence, a horizontal laser sheet was generated by an Nd:YAG laser (3) (DANTEC Dynamics, Denmark, Dualpower 200–15, 15 Hz, 2 × 200 mJ). A charge-coupled device camera (4) (DANTEC Dynamics, Denmark, Flowsense CM, 12 bit, 15 Hz, 2048 × 2048) was located at the bottom of the column and focused on the laser sheet. A microlens (105 nm f/8, Canon, Tokyo, Japan) with an extension tube was applied to obtain a visualization window of 10.6 mm × 10.6 mm. A 570 nm high-pass filter was also placed in front of the lens to block the laser light and to record only light emitted by fluorescence.
A high-speed camera (5) (Photon SA3, 8 bits, 2000 fps, 1024 × 1024) was placed in front of the bubble to record its shape, size, and velocity. Each experiment was run six times in order to ensure the repeatability of measurements. The liquid temperature was 294 ± 1 K.
2.2. Material
The water used in each case was ultra-pure water having a conductivity of 0.054 mS/cm. The fluorophore used for this study was a ruthenium complex (C36H24Cl2N6Ru.xH2O, Sigma-Aldrich, St. Louis, MO, USA, CAS: 207802-45-7). The surface-active agent of interest was Triton X-100 (Sigma-Aldrich, St. Louis, MO, USA, CAS: 9002-93-1) at a concentration of 0.02 g/L, i.e., lower than the CMC (around 150 mg/L at 293 K). The polymer used was polyacrylamide-co-acrylic acid (PAAm, Sigma-Aldrich, St. Louis, MO, USA, CAS: 62649-23-4) at a concentration of 0.1% (w/w). It was mixed with the solution of Triton X-100 to understand possible interactions in a medium when surface tension and viscosity are changed simultaneously. For all experiments, perfect solubilization of surfactant and polymer was observed in the water. A characterization of the mass transfer and the hydrodynamic parameters of a solution with PAAm 0.1% (w/w) without surfactant can be found in Xu et al. [61]. The principal results are recalled here.
2.3. Determination of Hydrodynamic Parameters
The velocities and sizes of bubbles were determined by means of the high-speed camera. An example of the images obtained is given in Figure 1B. The camera was calibrated so as to obtain 19.6 ± 0.08 µm/pixel, and the width (a) and length (b) of the bubble were, thus, deduced. The equivalent diameter was calculated using Equation (1).
deq = (a2 × b)1/3.
The speed of the camera was 2000 frames per second, and the number of images recorded during the time the bubble was in the window which allowed its velocity to be deduced.
Surface tensions were measured using the Noüy ring method, with a manual tensiometer (KRÜSS, K6). Viscosities of fluids were measured with a rheometer (HAKKE MARS III, Thermo Fisher Scientific, Waltham, MA, USA). Because PAAm is a polymer leading to a non-Newtonian fluid, its viscosity was measured for a large range of shear rates, between 10−3 and 103 Pa·s. Figure 2 shows the results obtained by Xu et al. [61] when measuring the viscosity of a solution of 0.1% by weight of PAAm. Viscosity measurements in presence of Triton X-100 at the study concentration were found to be the same as for water (1 mPa·s). Thus, it was assumed that the presence of Triton X-100 did not affect the rheology of the medium at the concentration used. For our operating conditions, the shear rate was estimated according to the velocity of the bubble and its equivalent diameter, using Equation (2). This is the characteristic shear rate near the equator of a spherical bubble [62]. Since eccentricities found for bubbles containing PAAm were 1.04 and 1.03, they were assimilated to spherical bubbles.
γ = U/deq.
2.4. Determination of Transfer Parameters
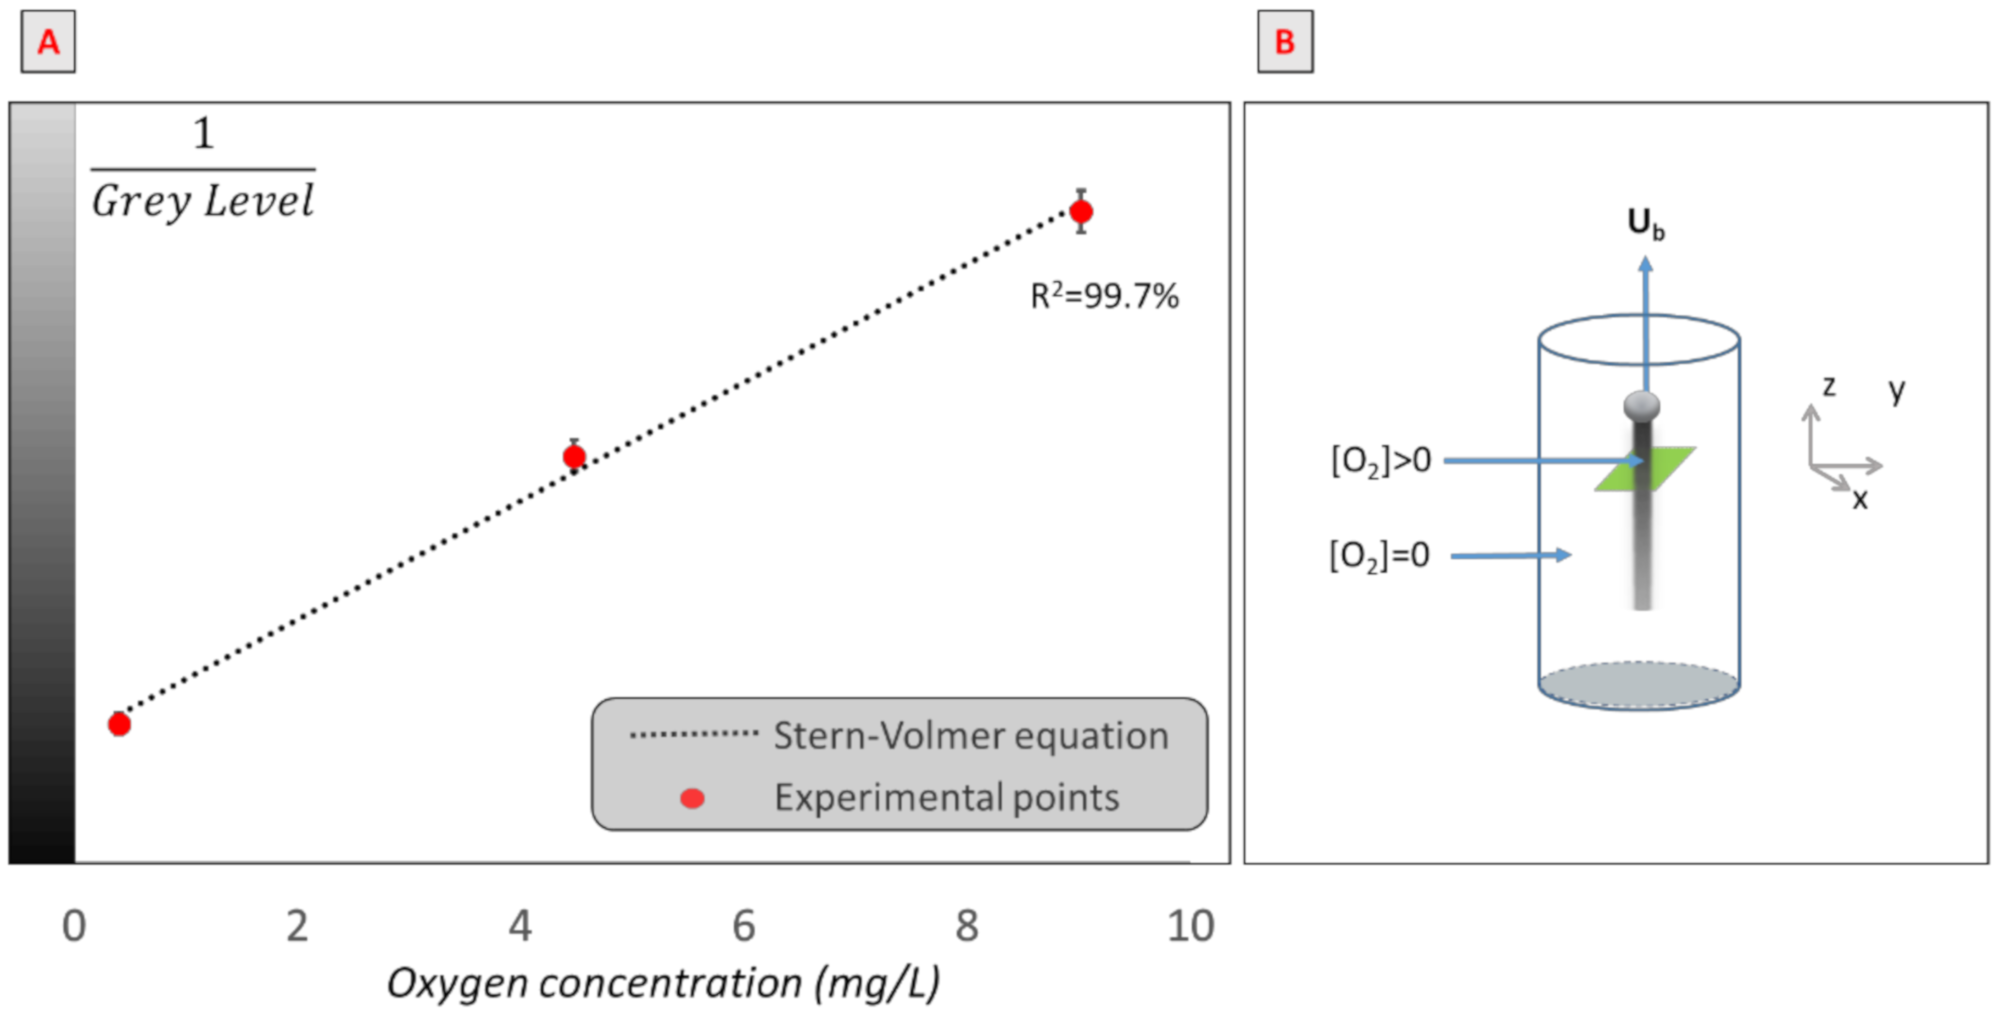
The mass transfer in the bubble wake was quantified using the PLIF-I technique. The basic aim of the PLIF-I experiment was to establish the relationship between the gray level and the oxygen concentration, as the fluorescence of the ruthenium complex used is quenched in presence of oxygen following Stern and Volmer’s equation [63],
1/G = 1/G0 + Ksv/G0[O2].
Note that, in this equation, G is the gray level in the presence of oxygen, G0 is the gray level without oxygen, Ksv is the Stern–Volmer constant (L/mg), and [O2] (mg/L) is the oxygen concentration. Thus, the calibration curve was established for each experiment, using an optical oxygen probe (HACH, HQ40D), for oxygen concentrations between 0 and 9 mg/L. An example of a calibration curve obtained is presented in Figure 3A.
Then, to calculate the mass transfer coefficient and diffusion coefficient, the assumption was made that, far from the bubble rear, there was no convection and, hence, no transfer in the z-direction (Figure 3B). François et al. [56] showed that, considering that the liquid velocity is negligible, after a certain distance, there is no diffusion of oxygen in the z-direction because there is no concentration gradient. As a result, the mass of oxygen is constant in the (x,y) plane. Then, FO2, the mass flow rate, can be approximated using Equation (4), where mO2 is the total amount of oxygen transferred in a plane perpendicular to the wake (mg·m−1).
FO2 = dmO2/dt.
This assumption needs to be verified in each case, and it was developed in the case of solutions containing polymer and surfactant since it is the first time these measurements have been carried out in this kind of medium. Experimentally, it is assumed that convection is negligible if mO2 is constant with time. Furthermore, we determined a threshold criterion for exploiting images with a low signal. We assumed that the quality of the signal was sufficient if the signal/noise ratio was above 10, according to Equation (5).
where I and I0 are the maximal and minimal intensities, respectively, and σn is the standard deviation of the background noise.
(I − I0)/σn > 10,
Once these criteria were verified after a sufficient length in the bubble wake, the mass transferred in a horizontal plane was considered constant and, hence, the change in the size of this spot structure would be due only to molecular diffusion of oxygen. In previous studies by Francois et al. [56], Dietrich et al. [64] and Jimenez et al. [65], it was observed that, for quasi-spherical bubbles, the diffusion spot was circular and presented a Gaussian profile. As a result, the diffusion spot could be fitted by Equation (6), where the concentration [O2] in each pixel xp, yp is estimated as
[O2] (x,y) = Aexp ((−(xp − X)2 + (yp − Y)2)/B + C).
Parameters were found by fitting the equation with the raw image using the fminsearch solver (Matlab R2017a). Note that A and B are parameters, and (X, Y) is the center of the spot. The parameter C, representing the background, was removed for further calculations.
Once the image was processed, it was possible to calculate the flux transferred by the bubble using Equation (7).
where x and y are horizontal coordinates. Then, the mass transfer coefficient could be calculated using Equation (8) as long as the surface area of the bubble was deduced from the equivalent diameter.
FO2 = Ub × ∫∫δDspot[O2] (x,y) dxdy,
kL = FO2/(Sb([O2] * − [O2])).
Lastly, a method developed by Xu et al. [66] allowed the diffusion coefficient of oxygen to be determined assuming that the surface area of the spot Sspot increased with time according to Equation (9).
where ηD is a constant that can be fixed following the procedure described by Xu et al. [66].
Sspot = 2πDO2tηD,
3. Results
3.1. Hydrodynamic Parameters of Bubbles
The surface tension and viscosity of each medium are given in Table 1. Concerning the surface tension measured with the Nouÿ ring method, addition of Triton X-100 to the water led to a decrease in surface tension from 71.25 mN/m to 48.38 mN/m. When polymer was added to Triton X-100 and water, the surface tension decreased by 1.18 mN/m to reach 47.20 mN/m. This decrease was slight but significant considering the precision of the measurements. A similar slight decrease in surface tension with addition of PAAm was also found in a study by Xu et al. [61]. Concerning the viscosity, addition of PAAm led to a marked decrease but Triton X-100 did not affect viscosity in the operating conditions of the present experiment.
The hydrodynamic parameters of bubbles were measured and are reported in Table 1. These parameters were clearly affected by physicochemical modifications of the medium, but it should be noted that the injection needle used in Xu’s study [61] was smaller than that used in the work presented here. Thus, the smaller bubble diameter in the case of addition of PAAm was not due to the physicochemistry but to a change in the injection needle. Concerning hydrodynamic parameters, the addition of contaminant affected the velocity of the bubble. The bubble velocity was 321 mm/s in ultra-pure water, but the addition of surfactant halved this value to 142 mm/s, a velocity that decreased again to reach 118.1 mm/s when polymer was added to Triton X-100 and water.
It can, first, be seen that addition of Triton X-100 to water affected not the bubble size but its shape. The bubble, which was ellipsoidal in the case of water, with an aspect ratio of 1.4, tended to become more spherical with the surfactant, reaching an aspect ratio of 1.05. When polymer was added, in the case reported by Xu et al. [61] and in this study, the bubble generated was spherical. In the case of the present study, addition of PAAm led to bigger bubbles. Lastly, the bubble trajectories were found to be straight lines, and these values are in good agreement with the literature [67].
3.2. Visualization of Oxygen Concentration Field
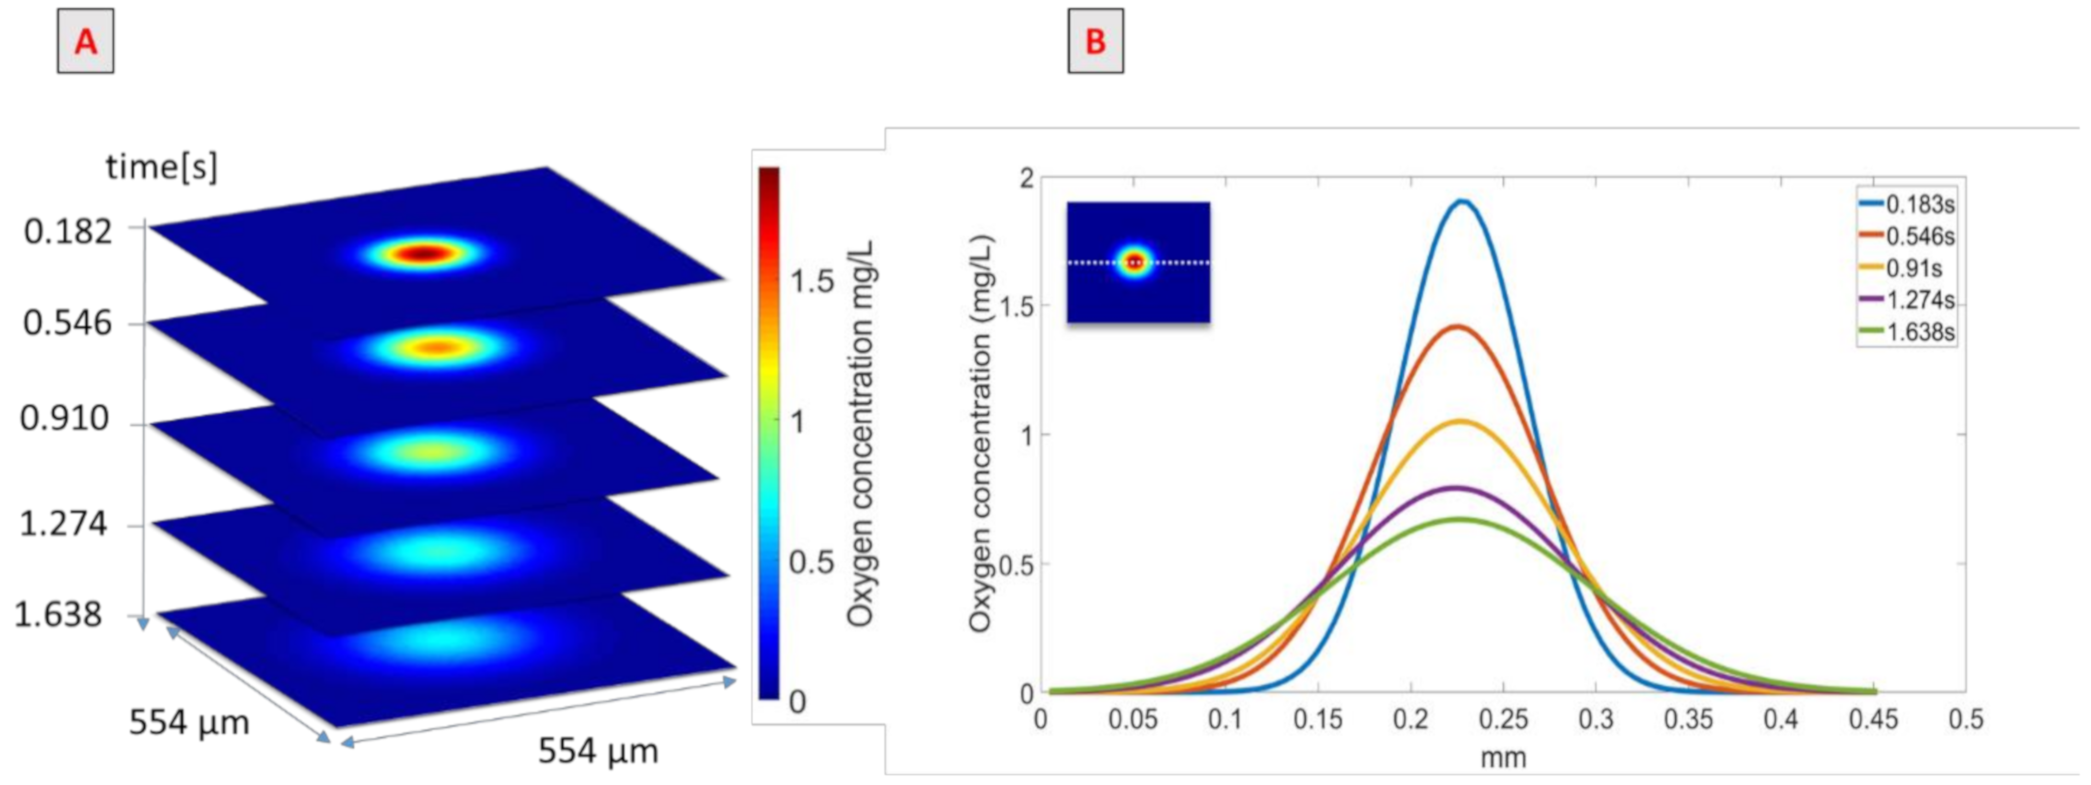
The use of the PLIF-I technique to quantify the oxygen transferred was validated for the situation when rheology and surface tension were modified simultaneously. Figure 4A presents images obtained at different times after the passage of the bubble; the spots in the centers of the images represent the oxygen transferred by the bubble. The first image was taken 0.182 s after the bubble passage, and the oxygen concentration field in the spot varied between 0 and 1.8 mg/L. The oxygen field concentration seemed to increase with time while the oxygen concentration in the center of the spot decreased.
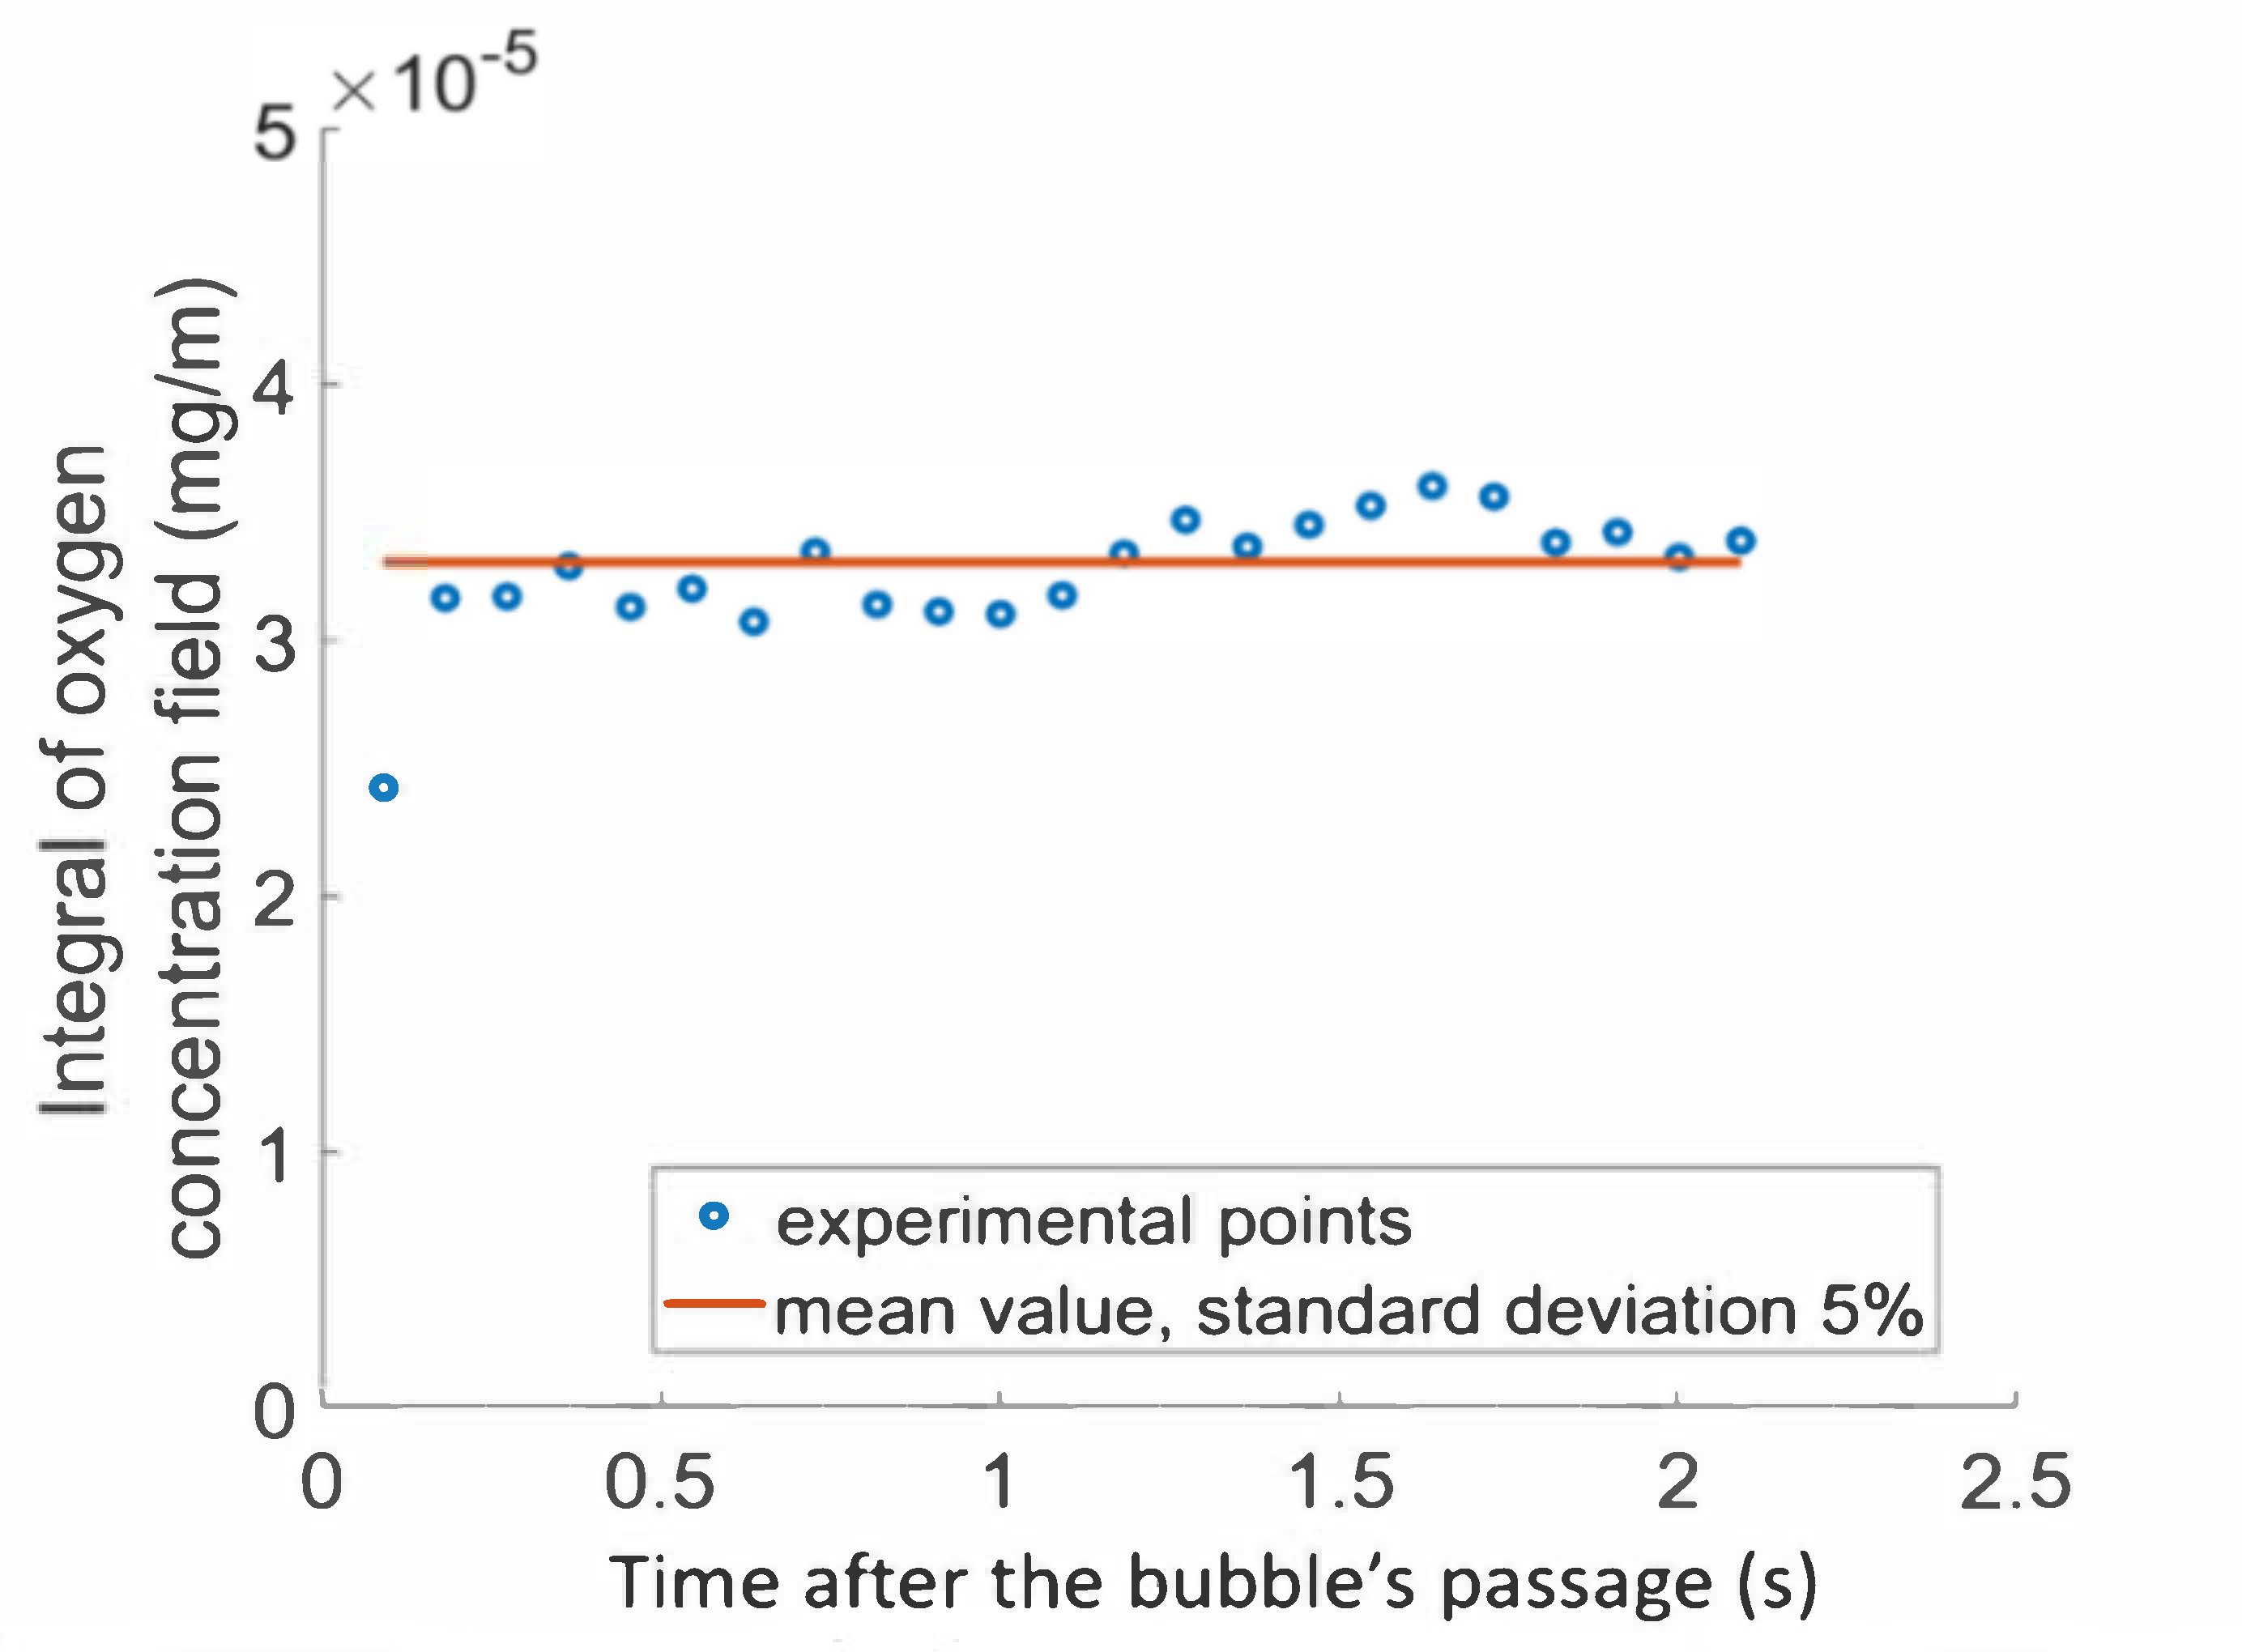
This effect is depicted in Figure 4B, which represents oxygen concentration along an x-line (shown in the insert as a dotted white line) crossing the center of the spot, at different times after the bubble’s passage. These continuous lines were obtained with the Gaussian model presented in Equation (6). Each curve had a Gaussian shape but successive curves tended to be more spread out; between 0.183 s and 1.638 s after the bubble’s passage, the maximum oxygen concentration, which was the concentration in the center of the spot, decreased from 1.8 to 0.6 mg/L and the diameter of the spot increased approximately from 0.21 mm to 0.38 mm. The integrals of these curves correspond to the amount of mass transferred in the x-line; thus, if the mass transferred is conserved between images, the integral over the surface studied has to be conserved. To verify the mass conservation assumption, the integral of each image, calculated in mg/m according to Equation (10), was determined, and the results are given in Figure 5.
Integral = ∫∫δDspot [O2] (x,y) dxdy.
The first point representing the integral after the bubble’s passage (91 ms) was lower than the remaining values as the bubble wake was convecting oxygen. From 182 ms after its passage onward, the bubble was far enough away to have no effect on the amount of oxygen in the wake, and conservation of the mass transferred in the wake was observed. The red line represents the mean value of the conservative points, equal to 3.2 × 10⁻⁵ mg/m for this experiment. The conservation of the mass transferred was, thus, confirmed with good precision for measurements taken after a time of 182 ms (standard deviation from the mean value was about 5%).
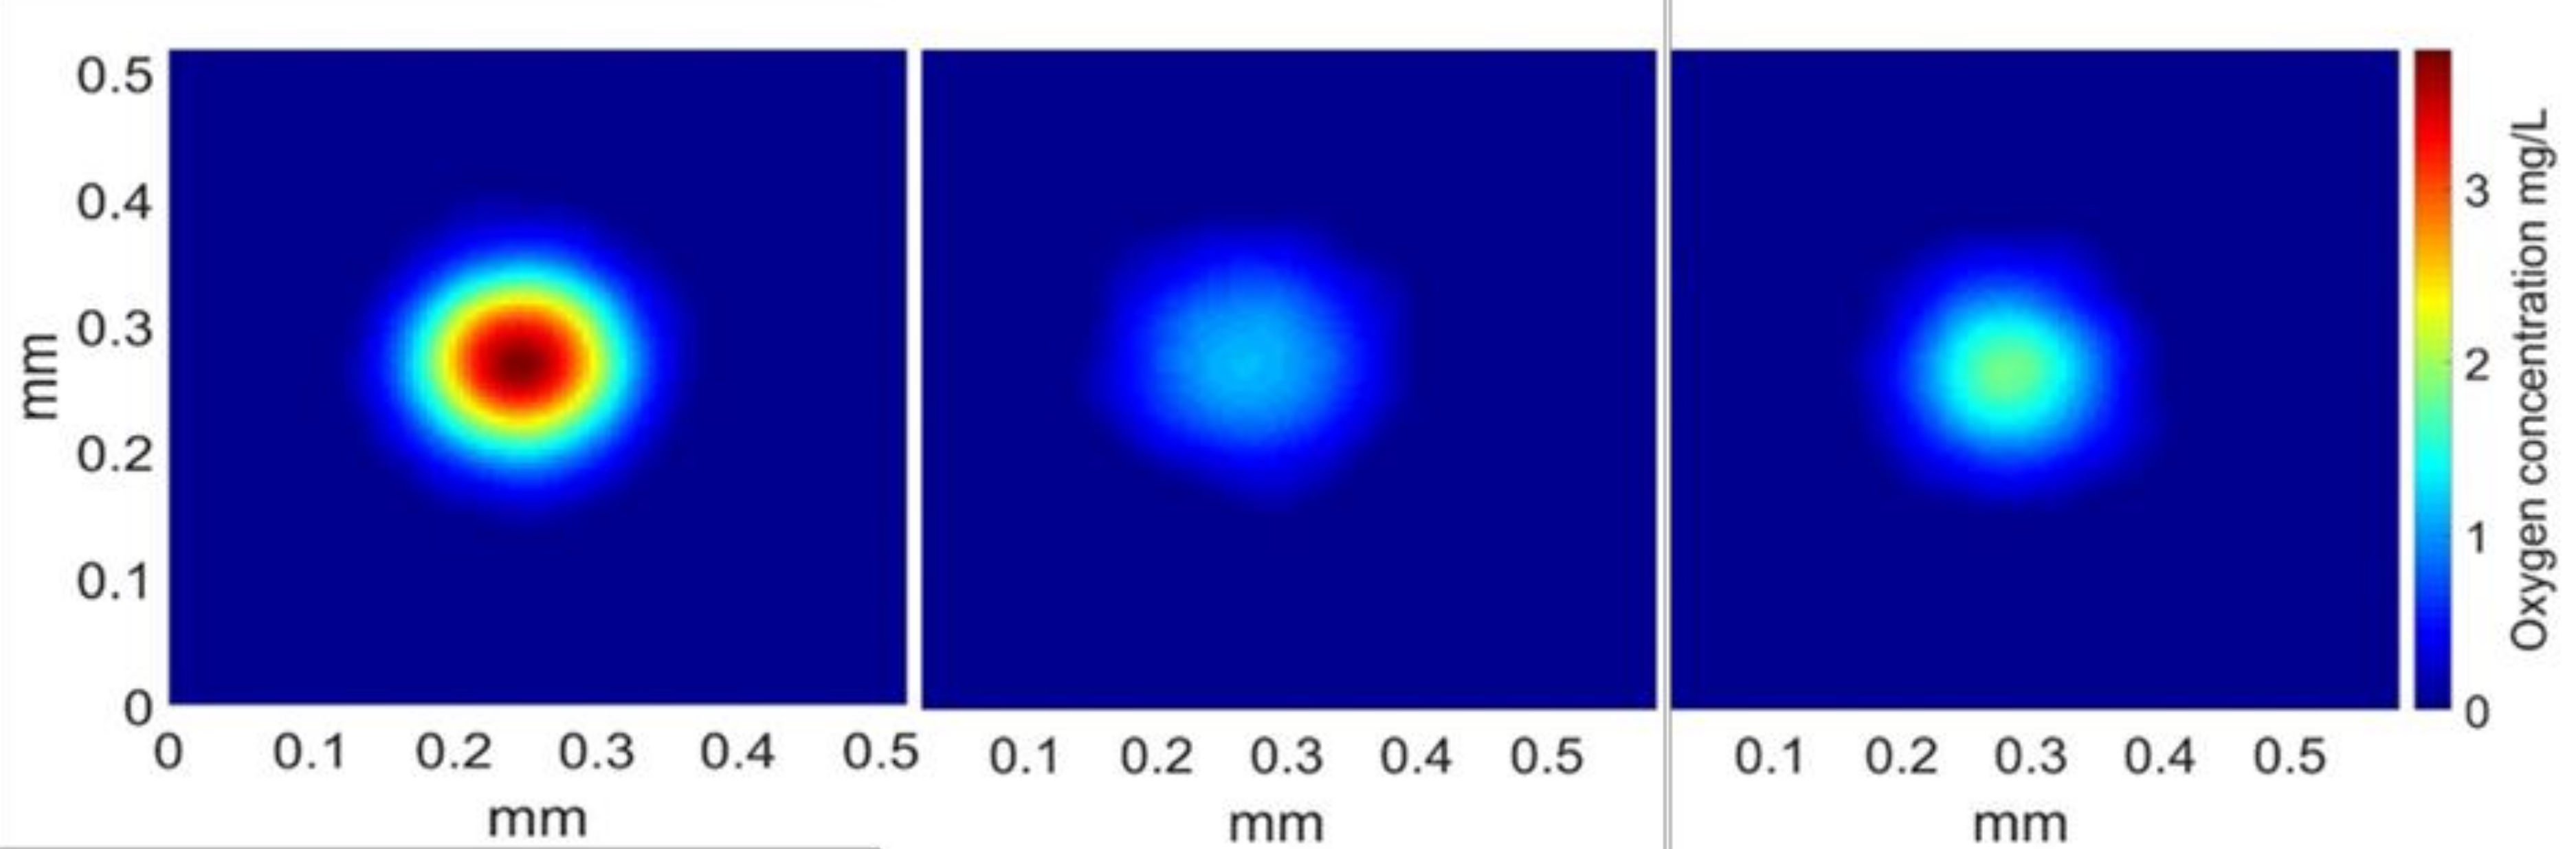
The method for calculating the mass transfer coefficient was, thus, validated for a medium containing 0.02 g/L of Triton X-100 and 0.1% (w/w) PAAm; its feasibility was validated in the case of water and surfactant by previous studies [57,58]. For comparison of the amount of mass transferred in the three different media, images 182 ms after the bubble’s passage are shown in Figure 6.
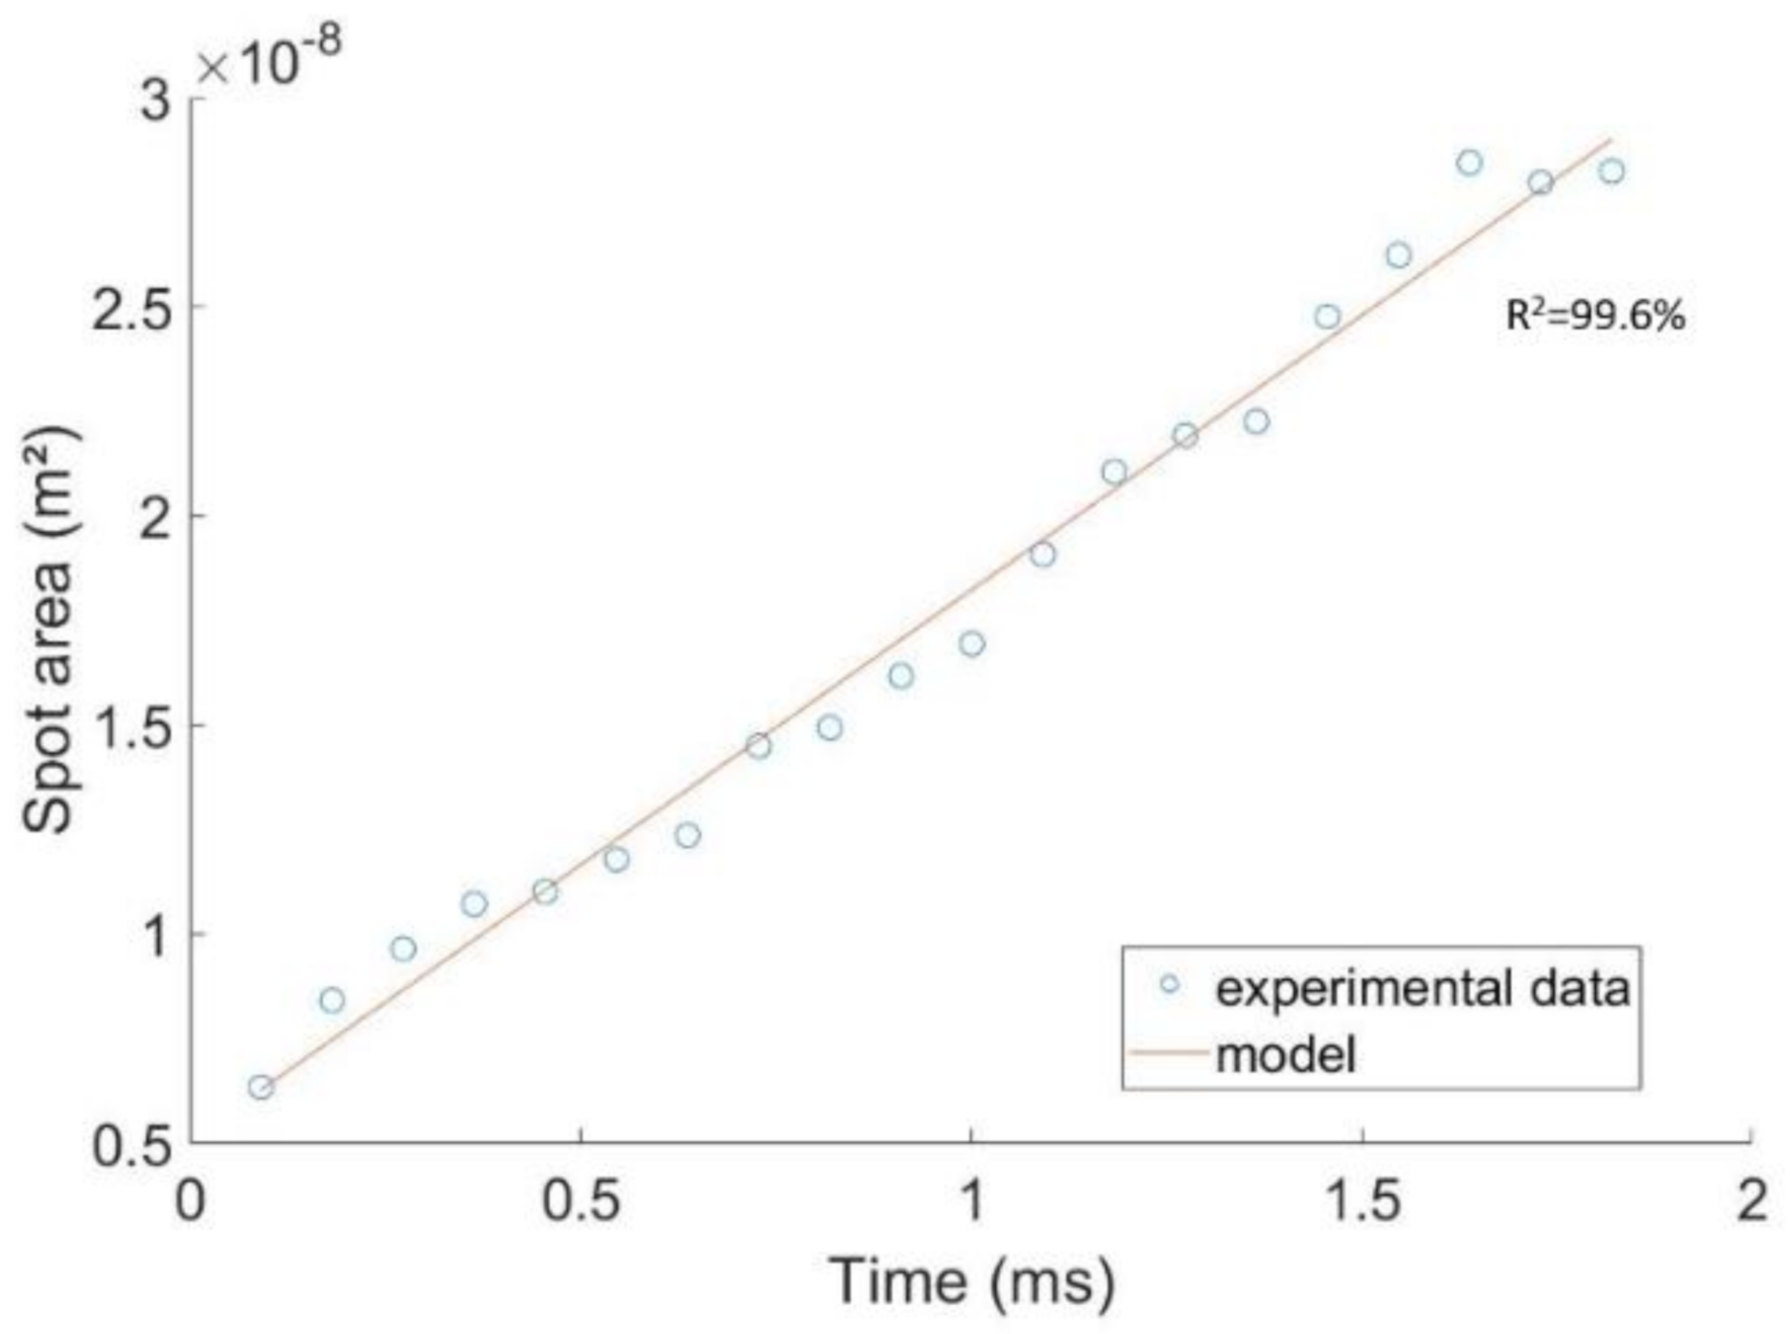
According to the spots displayed, the amount of mass transferred seemed highest in the case of water, then decreased in the presence of Triton X-100 and PAAm, and was the lowest for the bubble rising in the solution of water and surfactant. Values of the integrals were calculated and are presented in Table 2, confirming the trend displayed in Figure 6. Lastly, in order to calculate the diffusion coefficient of oxygen, the linearity of the expansion of the mass transfer spot with time needed to be verified. It was verified for the whole experiment, and Figure 7 presents this linearity in the case of water with polymer and surfactants, as the diffusion coefficient has never previously been calculated in this kind of medium with the PLIF-I technique.
The area of the spot was calculated and is reported versus time, between 0.182 s and 2 s. Blue circles represent experimental points and the red line is a linear model determined from the experimental points, which fit the curve at 99.6%. The linearity of expansion of the spot area with time was, thus, verified. On the basis of this assumption, the mass transfer coefficient was calculated using Equation (8).
4. Discussion
4.1. Comparison with Models
Values calculated for integrals, mass transfer, and diffusion coefficients are summed up in Table 2. It is interesting to note, first, that the mass transfer coefficient decreased when surfactant was added to the solution. It decreased even more when PAAm 0.1% (w/w) was added to this solution. However, when spots were compared in terms of integrals, in other words, the total masses transferred (see Figure 6 and Table 2), it was observed that the mass transferred in the water containing the PAAm 0.1% (w/w) and Triton X-100 was higher than the mass transferred in the water containing only Triton X-100. It is important to underline that the velocity of a bubble in water containing Triton X-100 was higher, while the size of the bubble was smaller. When these parameters were taken into account (see Equations (7) and (8)), the mass transfer coefficient calculated was higher with just surfactant in the water than with surfactant and PAAm.
The experimental values obtained for the mass transfer coefficient could be compared with two models describing two extreme cases. The first is the Higbie model [60], usually used for bubbles of large diameter, associated with a mobile interface, and the second is the Frössling model [59], describing small bubbles with a rigid interface. These two models are given by Equation (11) for Higbie and Equation (12) for Frössling, and the values calculated are presented in Table 3.
kLHigbie = DO2/deq × (1.13Re0.5Sc0.5).
kLFrössling = DO2/deq × (2 + 0.66Re0.5Sc0.33).
For the case of transfer in pure water, as expected, the experimental value of the mass transfer coefficient was between the two extreme cases. The bubble was not contaminated; therefore, the value should be higher than the kL predicted by Frössling. However, for Higbie’s model, the bubble was too small to be considered as a clean bubble according to the definition. Concerning the value for the transfer of oxygen in a solution of water containing 0.1% of PAAm presented in Xu et al. [61], the decrease in mass transfer coefficient was represented by models and the experimental value still lay between the two extreme cases. However, concerning values for the solution containing the surfactant, the mass transfer coefficient kL was overestimated for each correlation. Such a result was also observed in the work of Jimenez [58] for transfer in a solution of caprylic acid monoglyceride in water. The overestimation of the mass transfer coefficient was also found for the solution containing Triton X-100 and PAAm. However, probably due to the change in viscosity, the mass transfer coefficients predicted were lower and closer to the experimental values. From these results, we can conclude that the decrease in mass transfer coefficient was still predictable by the current dimensionless Reynolds and Schmidt numbers when only viscosity changes, because hydrodynamic parameters were strongly modified and taken into account by the models. However, if these models were applied to solutions containing surfactant, they led to an overestimation.
Another point of discussion from these results concerns the thickness of the diffusion layer. The double film theory proposed by Lewis and Whitman [68] defined the thickness of the liquid film as in Equation (13). Later, a model proposed by Moore [69] calculated the thickness of the film with the Péclet number according to Equation (14).
δdf = DO2/kL.
δPe = deqPe−0.5.
The calculation of these two theoretical thicknesses is presented in Table 3. First, it can be seen that the diffusion layer thickness predicted with Moore’s [69] model, using Equation (14), was almost the same for all the media, between 2.9 µm and 4.8 µm. This layer was the thinnest for the bubble rising in water, increased in presence of the surfactant, and increased more when surfactant and polymer were both in solution, to reach a value of 4.6 µm.
Concerning the diffusion layer thickness predicted with the double layer model using Equation (13), the value for a bubble rising in pure water was on the order of magnitude of that predicted by the Péclet number. However, for the solution containing 0.1% PAAm, it was about four times the value predicted for water. The thickness of the layer of solutions containing surfactants with and without polymer was more than five times that predicted for the water with the same model and for the same solution with Moore’s [69] model. It was assumed that the calculation of the layer thickness using Lewis and Whitman’s theory in the presence of contaminant was overestimated.
To sum up, the comparison of experimental results with models revealed an overestimation of the mass transfer coefficient with the Frössling model or an overestimation of the thickness of the layer with the double layer theory model.
4.2. Physicochemical Modifications in the Vicinity of the Interface
These overestimations can be explained by modifications of the hydrodynamics. It was shown by Weiner et al. [70] that the flow around the bubble is strongly affected by the presence of surfactants. These authors observed a change in the trailing vortex, in which oxygen is transported only via diffusion. Such a change can strongly affect the mass transfer coefficient.
Here, we propose that the presence of surfactant affects not only the hydrodynamics but also the physicochemical properties in the vicinity of the interface. It is important to keep in mind that one of the properties of surfactants is to accumulate at interfaces. This accumulation could lead to a higher concentration close to the bubble, in the liquid film.
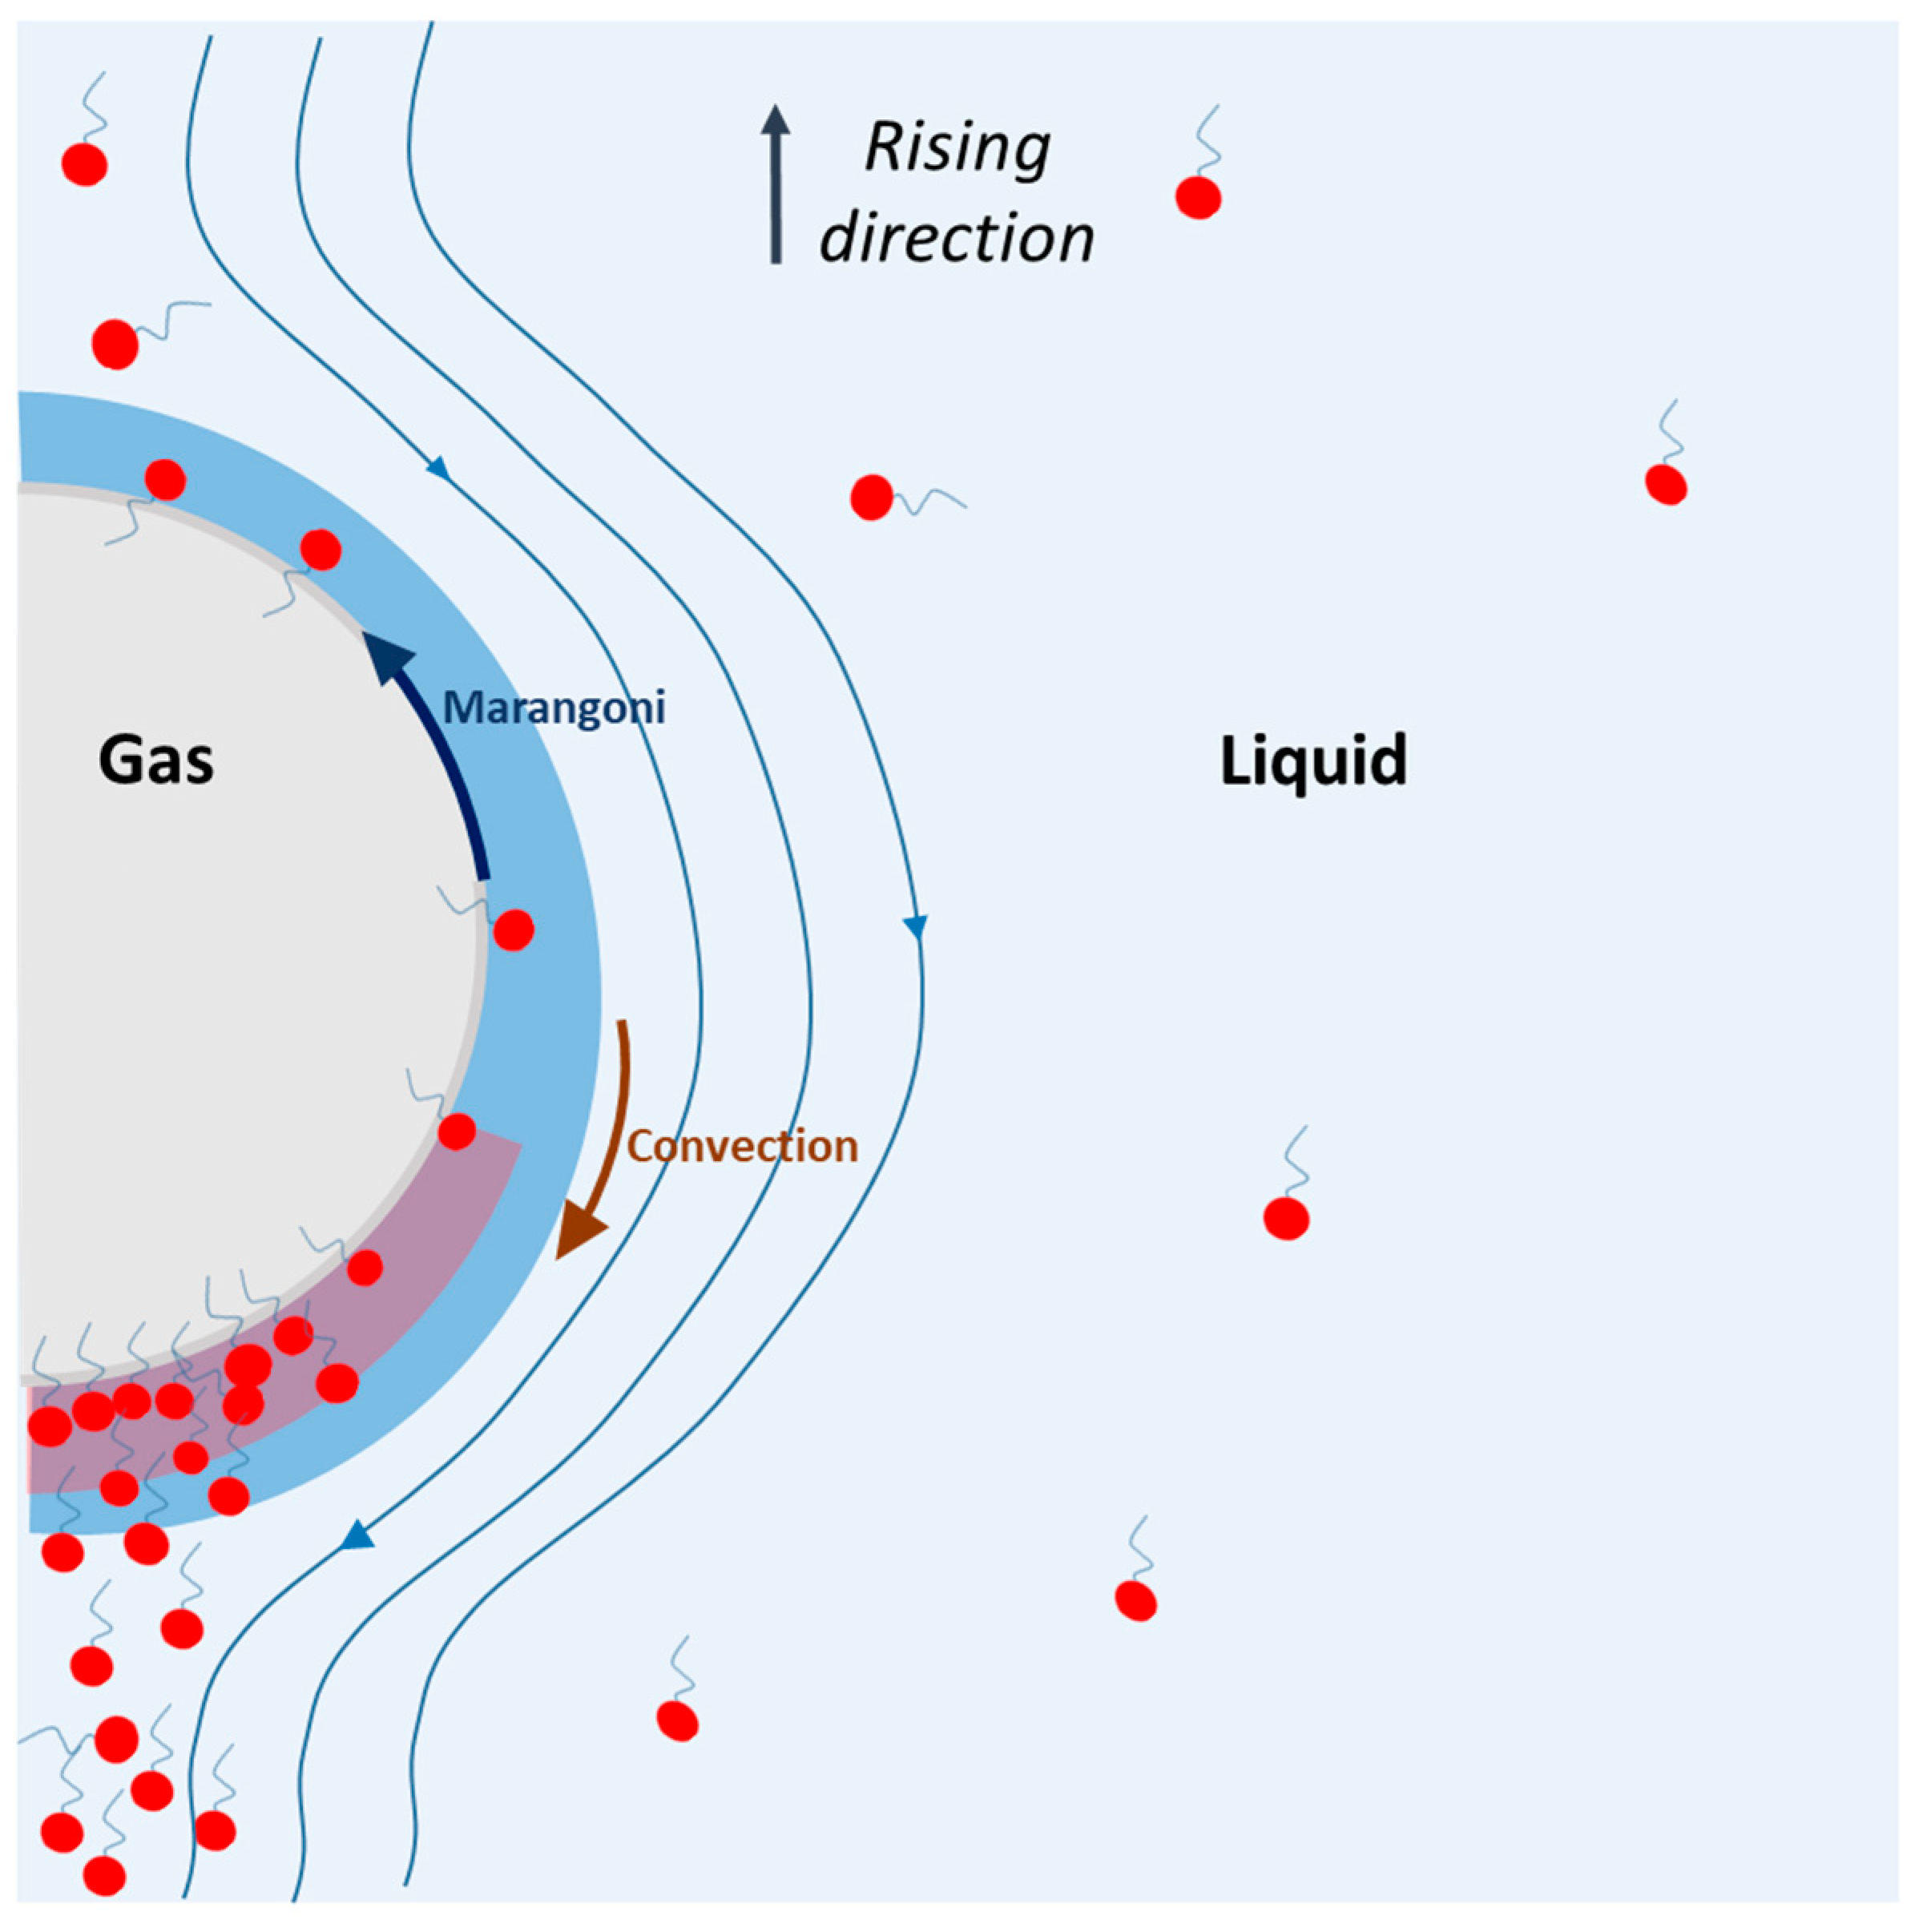
The physical phenomenon that can explain these overestimations is presented in Figure 8. In this figure, a single bubble is rising in a solution containing surfactants. During the rise, the surfactants are adsorbed on the bubble, on the interface, and they feel two opposite forces: (i) convection, which sweeps surfactants toward the rear of the bubble, and (ii) Marangoni stress, which tends to bring surfactants toward the nose of the bubble to avoid a surface tension gradient. The assumption is that, due to the convection, which exceeds the Marangoni stress, surfactants are first adsorbed at the nose of the bubble, and then swept toward the rear. Since the nose of the bubble is surfactant-free, new surfactant molecules are adsorbed and swept, and an accumulation of surfactant appears at the rear of the bubble, in the diffusion layer. The result of this higher concentration can lead to two phenomena: a decrease in the diffusion coefficient of oxygen and a change in the saturation concentration of oxygen [O2] *. These two assumptions are discussed below.
4.2.1. Estimation of a Modified Diffusion Coefficient for Oxygen
First, we can wonder whether the diffusion coefficient in the liquid film is the same as the one calculated in the bulk, far from the bubble and, thus, if the diffusion coefficient in the Schmidt number used to predict kL is overestimated when water is contaminated. Hereafter, this modified diffusion coefficient is estimated using the theoretical values determined with Equation (13). The values of diffusion coefficient inside the layer were estimated by modifying the coefficient until the two thicknesses of the diffusion layers, predicted by Equations (13) and (14), reached exactly the same value. It is important to keep in mind that this calculation is not intended to give a precise diffusion coefficient but just to estimate its range of magnitude, according to the model described previously.
The diffusion coefficient in the layer thus estimated is presented in Table 4. This diffusion coefficient in the layer was also calculated in the case of polymer because the assumption that there is an accumulation of polymer close to the interface cannot be excluded even if it would be very much smaller than in the case of surfactants. It is possible to assume that this decrease in the diffusion coefficient needs to be taken into account in the calculation of the theoretical mass transfer coefficient. As shown in Table 4, the diffusion coefficient estimated in the diffusion layer is half that in the bulk. In a solution containing surfactant, it is estimated to be divided by a factor of at least five. Therefore, the value of the theoretical mass transfer coefficient was also estimated with the diffusion coefficient in the diffusion layer. With these new values, presented in Table 4, the experimental values found for mass transfer coefficient were between the two theoretical values.
4.2.2. Estimation of a Modified Value of Oxygen Saturation [O2] *
Another point of discussion is the value of the oxygen saturation. If the diffusion layer reached a high concentration, the saturation concentration of oxygen in this layer could decrease. Thus, the value of the experimental mass transfer coefficient calculated from Equation (8) would underestimate this experimental mass transfer coefficient. In the same way as for the diffusion coefficient in the previous part, a modified value of oxygen saturation concentration was estimated here. The objective was to modify the value of oxygen saturation concentration until the calculation of experimental mass transfer reached the same value as the mass transfer coefficient predicted by the Frössling model. Results are presented in Table 5. They show that, to reach the value predicted by Frössling, the oxygen saturation value should be 6.59 mg/L in the layer instead of the 9.18 mg/L measured in the bulk for the solution with only Triton X-100. For the solution with PAAm and Triton X-100, it should be 7.61 mg/L instead of 9.15 mg/L.
It is obvious that, if the higher concentration appears in the double layer as was assumed here, the two effects, on diffusion coefficient and oxygen saturation, would both be involved and isolated calculations could not be made. The aim of this discussion was to highlight some effects and give an order of magnitude for them. Measurements close to the diffusion layer would be very interesting for a better prediction of the mass transfer coefficient in the presence of contaminants and, as the calculated thicknesses of layers are in the range of possible visualization by microscopy, this opens up the promising perspective of building an accurate model for predicting mass transfer in the future.
5. Conclusions
The effect of surfactant and polymer on mass transfer from a single bubble rising in a liquid was studied. It was demonstrated that the addition of surfactants and polymers decreases the velocity of bubbles, and a combination of the two leads to an even greater decrease. Moreover, although little change was noticed in the size of the bubble when Triton X-100 was added, the bubble tended to become more spherical. This effect was also highlighted when polymer was added to the mixture of surfactant and water, but with an increase in the size of the bubble. These hydrodynamic changes have an impact on the mass transferred in the liquid. The liquid side mass transfer coefficient was reduced from 4.9 × 10⁻⁴ m/s in the case of water to 0.76 × 10⁻⁴ m/s when surfactant was added, and addition of PAAm 0.1% in the latter solution caused the mass transfer coefficient kL to decrease to 0.62 × 10⁻⁴ m/s. A part of this decrease in mass transfer coefficient can be explained by changes in the hydrodynamic parameters of the bubble, but correlations used in the literature to predict the mass transfer coefficient kL by taking hydrodynamic parameters and physicochemical parameters of the bulk into account were not sufficient and led to an overestimation of the mass transfer coefficient. To explain the overestimation and the sharp decrease in mass transfer coefficient, it is proposed that an accumulation of contaminants in the diffusion layer may lead to a higher concentration of surfactant and to physicochemical modifications, such as decreases in diffusion coefficient and oxygen saturation. However, in order to propose a model, some information about the thickness of the diffusion layer, the concentration of contaminant, and the associated diffusion coefficient and oxygen saturation concentration found experimentally is required.
Author Contributions
Conceptualization, N.D. and G.H.; methodology, C.L.M.; F.X. and G.L.; software, F.X. and G.L.; validation, C.L.M.; F.X. and G.L.; formal analysis, F.X. and G.L.; investigation, F.X.; resources, F.X.; data curation, F.X. and G.L.; writing—original draft preparation, G.L.; writing—review and editing, G.L.; N.D. and G.H.; visualization, C.L.M., F.X. and G.L.; supervision, N.D. and G.H.; project administration, N.D.; funding acquisition, N.D. All authors have read and agreed to the published version of the manuscript.
Funding
This research was funded by the French National Research Agency (ANR), project MAMOTHS ANR-17-CE06-001.
Conflicts of Interest
The authors declare no conflict of interest.
Nomenclature
| Notation | |
| a | Width of bubble (mm) |
| A | Parameter representing the Gaussian distribution of the oxygen field concentration (mg/L or mg/m3) |
| b | Length of bubble (mm) |
| B | Parameter representing the Gaussian distribution of the oxygen field concentration (pixel²) |
| CMC | Critical micellar concentration |
| C | Parameter representing the background noise of the image (-) |
| deq | Equivalent diameter of bubbles (mm or m) |
| DO2 | Diffusion coefficient of oxygen (m2/s) |
| FO2 | Flux of oxygen transferred (mg/s) |
| G | Gray level of image in presence of oxygen |
| G0 | Gray level of image without oxygen |
| I | Maximum signal intensity |
| I0 | Minimum signal intensity |
| kL | Mass transfer coefficient of oxygen in the liquid side (m/s) |
| kLF | Mass transfer coefficient of oxygen in the liquid side predicted by the Frössling correlation (m/s) |
| Ksv | Stern–Volmer constant (L/mg) |
| mO2 | Total amount of oxygen transferred in a plane perpendicular to the wake (mg·m−1) |
| [O2] | Oxygen concentration in the liquid (mg/L or mg/m3) |
| [O2] * | Oxygen concentration when the liquid is saturated with oxygen (mg/L or mg/m3) |
| Sb | Surface area of the bubble (mm2 or m2) |
| Sspot | Area of the diffusion spot (mm2 or m2) |
| Ub | Velocity of the bubble (m/s or mm/s) |
| xp | Number of the line of the image (pixel) |
| x | Horizontal position (m) |
| X | Number of the line in the center of the spot (pixel) |
| yp | Number of the column of the image (pixel) |
| y | Vertical position (m) |
| Y | Number of the column in the center of the spot (pixel) |
| Greek letters | |
| γ | Shear rate (s−1) |
| δdf | Thickness of the diffusion layer estimated with the double film theory (µm) |
| δdf | Thickness of the diffusion layer estimated with Péclet number (µm) |
| η | Viscosity (Pa·s) |
| ηD | Fixed parameter for determination of the diffusion coefficient (-). |
| σ | Surface tension (mN/m) |
| σn | Standard deviation of the background noise |
| ρ | Density (kg/m3) |
| Dimensionless numbers | |
| Pe | Péclet number (Pe = deq × Ub/D) |
| Re | Reynolds number (Re = Ub × deq×ρ/η) |
| Sc | Schmidt number (Sc = η/(ρ × D)) |
| Sh | Sherwood number (Sh = kL × deq/D) |
References
- Charpentier, J.-C. Considérations générales sur les contacteurs gaz-liquide Problèmes fondamentaux et appliqués de métrologie qui se posent. Place de nos recherches. Houille Blanche 1978, 315–317. [Google Scholar] [CrossRef] [Green Version]
- Canado, A.; Tournois, M.; Pages, M.; Roustan, M.; Remus-Borel, W.; Dietrich, N.; Violleau, F.; Hébrard, G. Sudden Decrease of the Dissolved Ozone Concentration in Sprays: A Mass Transfer Phenomenon? Ind. Eng. Chem. Res. 2020, 59, 14914–14924. [Google Scholar] [CrossRef]
- Hreiz, R.; Sialve, B.; Morchain, J.; Escudié, R.; Steyer, J.-P.; Guiraud, P. Experimental and Numerical Investigation of Hydrodynamics in Raceway Reactors Used for Algaculture. Chem. Eng. J. 2014, 250, 230–239. [Google Scholar] [CrossRef]
- Tatin, R.; Moura, L.; Dietrich, N.; Baig, S.; Hébrard, G. Physical Absorption of Volatile Organic Compounds by Spraying Emulsion in a Spray Tower: Experiments and Modelling. Chem. Eng. Res. Des. 2015, 104, 409–415. [Google Scholar] [CrossRef]
- Benizri, D.; Dietrich, N.; Labeyrie, P.; Hébrard, G. A Compact, Economic Scrubber to Improve Farm Biogas Upgrading Systems. Sep. Purif. Technol. 2019, 219, 169–179. [Google Scholar] [CrossRef] [Green Version]
- Roustan, M. Transferts Gaz-Liquide dans les Procédés de Traitement des Eaux et des Effluents Gazeux; Tec & Doc Lavoisier: Paris, France, 2003. [Google Scholar]
- Jimenez, M.; Dietrich, N.; Grace, J.R.; Hébrard, G. Oxygen Mass Transfer and Hydrodynamic Behaviour in Wastewater: Determination of Local Impact of Surfactants by Visualization Techniques. Water Res. 2014, 58, 111–121. [Google Scholar] [CrossRef]
- Bouaifi, M.; Hebrard, G.; Bastoul, D.; Roustan, M. A Comparative Study of Gas Hold-up, Bubble Size, Interfacial Area and Mass Transfer Coefficients in Stirred Gas–Liquid Reactors and Bubble Columns. Chem. Eng. Process. Process Intensif. 2001, 40, 97–111. [Google Scholar] [CrossRef]
- Cockx, A.; Roustan, M.; Line, A.; Hébrard, G. Modeling of Mass-Transfer Coefficient K-L in Bubble-Columns. Chem. Eng. Res. Des. 1995, 73, 627–631. [Google Scholar]
- Djebbar, R.; Roustan, M.; Line, A. Numerical Computations of Turbulent Gas-Liquid Dispersion in Mechanically Agitated Vessels. Chem. Eng. Res. Des. 1996, 74, 492–498. [Google Scholar]
- Hebrard, G.; Zeng, J.; Loubiere, K. Effect of Surfactants on Liquid Side Mass Transfer Coefficients: A New Insight. Chem. Eng. J. 2009, 148, 132–138. [Google Scholar] [CrossRef] [Green Version]
- Dietrich, N.; Poncin, S.; Pheulpin, S.; Huai, Z.L. Passage of a Bubble through a Liquid-Liquid Interface. AIChE J. 2008, 54, 594–600. [Google Scholar]
- Dietrich, N.; Poncin, S.; Li, H. Dynamical Deformation of a Flat Liquid–Liquid Interface. Exp. Fluids 2011, 50, 1293–1303. [Google Scholar] [CrossRef]
- Xie, X.; Dietrich, N.; Fillaudeau, L.; Le Men, C.; Schmitz, P.; Liné, A. Local Hydrodynamics Investigation within a Dynamic Filtration Unit under Laminar Flow. Chem. Eng. Res. Des. 2018, 132, 954–965. [Google Scholar] [CrossRef]
- Xie, X.; Le Men, C.; Dietrich, N.; Schmitz, P.; Fillaudeau, L. Local Hydrodynamic Investigation by PIV and CFD within a Dynamic Filtration Unit under Laminar Flow. Sep. Purif. Technol. 2018, 198, 38–51. [Google Scholar] [CrossRef]
- Bouayed, N.; Cavalier, A.; Lafforgue, C.; Dietrich, N.; Lee, C.-H.; Guigui, C. Hydrodynamics Characterization of the Impact of Free-Moving Particles in an Air-Lift Membrane Bioreactor. Ind. Eng. Chem. Res. 2020, 59, 7943–7954. [Google Scholar] [CrossRef]
- Couvert, A.; Bastoul, D.; Roustan, M.; Line, A.; Chatellier, P. Prediction of Liquid Velocity and Gas Hold-up in Rectangular Air-Lift Reactors of Different Scales. Chem. Eng. Process. Process Intensif. 2001, 40, 113–119. [Google Scholar] [CrossRef]
- Dani, A.; Guiraud, P.; Cockx, A. Local Measurement of Oxygen Transfer around a Single Bubble by Planar Laser-Induced Fluorescence. Chem. Eng. Sci. 2007, 62, 7245–7252. [Google Scholar] [CrossRef]
- Jamnongwong, M.; Loubiere, K.; Dietrich, N.; Hébrard, G. Experimental Study of Oxygen Diffusion Coefficients in Clean Water Containing Salt, Glucose or Surfactant: Consequences on the Liquid-Side Mass Transfer Coefficients. Chem. Eng. J. 2010, 165, 758–768. [Google Scholar] [CrossRef] [Green Version]
- Loubière, K.; Hébrard, G.; Guiraud, P. Dynamics of Bubble Growth and Detachment from Rigid and Flexible Orifices. Can. J. Chem. Eng. 2003, 81, 499–507. [Google Scholar] [CrossRef] [Green Version]
- Painmanakul, P. Analyse Locale Du Transfert de Matière Associé à La Formation de Bulles Générées Par Différents Types d’orifices Dans Différentes Phases Liquides Newtoniennes: Étude Expérimentale et Modélisation. Ph.D. Thesis, Institut National des Sciences Appliquées de Toulouse, Toulouse, France, 2005. [Google Scholar]
- Ahmia, A.C.; Idouhar, M.; Wongwailikit, K.; Dietrich, N.; Hébrard, G. Impact of Cellulose and Surfactants on Mass Transfer of Bubble Columns. Chem. Eng. Technol. 2019, 42, 2465–2475. [Google Scholar] [CrossRef]
- Nekoeian, S.; Aghajani, M.; Alavi, S.M.; Sotoudeh, F. Effect of Surfactants on Mass Transfer Coefficients in Bubble Column Contactors: An Interpretative Critical Review Study. Rev. Chem. Eng. 2019. [Google Scholar] [CrossRef]
- Alves, S.S.; Orvalho, S.P.; Vasconcelos, J.M.T. Effect of Bubble Contamination on Rise Velocity and Mass Transfer. Chem. Eng. Sci. 2005, 60, 1–9. [Google Scholar] [CrossRef]
- Caskey, J.A.; Barlage, W.B. A Study of the Effects of Soluble Surfactants on Gas Absorption Using Liquid Laminar Jets. J. Colloid Interface Sci. 1972, 41, 52–62. [Google Scholar] [CrossRef]
- Painmanakul, P.; Hébrard, G. Effect of Different Contaminants on the α-Factor: Local Experimental Method and Modeling. Chem. Eng. Res. Des. 2008, 86, 1207–1215. [Google Scholar] [CrossRef]
- Gómez-Díaz, D.; Navaza, J.M.; Sanjurjo, B. Mass-Transfer Enhancement or Reduction by Surfactant Presence at a Gas−Liquid Interface. Ind. Eng. Chem. Res. 2009, 48, 2671–2677. [Google Scholar] [CrossRef]
- Rosso, D.; Huo, D.L.; Stenstrom, M.K. Effects of Interfacial Surfactant Contamination on Bubble Gas Transfer. Chem. Eng. Sci. 2006, 61, 5500–5514. [Google Scholar] [CrossRef] [Green Version]
- Sardeing, R.; Painmanakul, P.; Hébrard, G. Effect of Surfactants on Liquid-Side Mass Transfer Coefficients in Gas–Liquid Systems: A First Step to Modeling. Chem. Eng. Sci. 2006, 61, 6249–6260. [Google Scholar] [CrossRef]
- Dietrich, N.; Loubière, K.; Jimenez, M.; Hébrard, G.; Gourdon, C. A New Direct Technique for Visualizing and Measuring Gas–Liquid Mass Transfer around Bubbles Moving in a Straight Millimetric Square Channel. Chem. Eng. Sci. 2013, 100, 172–182. [Google Scholar] [CrossRef] [Green Version]
- Dietrich, N.; Hebrard, G. Visualisation of Gas-Liquid Mass Transfer around a Rising Bubble in a Quiescent Liquid Using an Oxygen Sensitive Dye. Heat Mass Transf. 2018, 54, 2163–2171. [Google Scholar] [CrossRef]
- Yang, L.; Loubière, K.; Dietrich, N.; Le Men, C.; Gourdon, C.; Hébrard, G. Local Investigations on the Gas-Liquid Mass Transfer around Taylor Bubbles Flowing in a Meandering Millimetric Square Channel. Chem. Eng. Sci. 2017, 165, 192–203. [Google Scholar] [CrossRef] [Green Version]
- Yang, L.; Dietrich, N.; Hébrard, G.; Loubière, K.; Gourdon, C. Optical Methods to Investigate the Enhancement Factor of an Oxygen-Sensitive Colorimetric Reaction Using Microreactors. AIChE J. 2017, 63, 2272–2284. [Google Scholar] [CrossRef] [Green Version]
- Yang, L.; Dietrich, N.; Loubière, K.; Gourdon, C.; Hébrard, G. Visualization and Characterization of Gas–Liquid Mass Transfer around a Taylor Bubble Right after the Formation Stage in Microreactors. Chem. Eng. Sci. 2016, 143, 364–368. [Google Scholar] [CrossRef] [Green Version]
- Kherbeche, A.; Milnes, J.; Jimenez, M.; Dietrich, N.; Hébrard, G.; Lekhlif, B. Multi-Scale Analysis of the Influence of Physicochemical Parameters on the Hydrodynamic and Gas–Liquid Mass Transfer in Gas/Liquid/Solid Reactors. Chem. Eng. Sci. 2013, 100, 515–528. [Google Scholar] [CrossRef]
- Kherbeche, A.; Mei, M.; Thoraval, M.-J.; Hébrard, G.; Dietrich, N. Hydrodynamics and Gas-Liquid Mass Transfer around a Confined Sliding Bubble. Chem. Eng. J. 2020, 386, 121461. [Google Scholar] [CrossRef]
- Mei, M.; Felis, F.; Hébrard, G.; Dietrich, N.; Loubière, K. Hydrodynamics of Gas–Liquid Slug Flows in a Long In-Plane Spiral Shaped Milli-Reactor. Theor. Found. Chem. Eng. 2020, 54, 25–47. [Google Scholar] [CrossRef]
- Mei, M.; Hébrard, G.; Dietrich, N.; Loubière, K. Gas-Liquid Mass Transfer around Taylor Bubbles Flowing in a Long, in-Plane, Spiral-Shaped Milli-Reactor. Chem. Eng. Sci. 2020, 222, 115717. [Google Scholar] [CrossRef]
- Hiby, J.W.; Braun, D.; Eickel, K.H. Eine Fluoreszenzmethode Zur Untersuchung Des Stoffübergangs Bei Der Gasabsorption Im Rieselfilm. Chem. Ing. Tech. 1967, 39, 297–301. [Google Scholar] [CrossRef]
- Kong, G.; Buist, K.A.; Peters, E.A.J.F.; Kuipers, J.A.M. Dual Emission LIF Technique for PH and Concentration Field Measurement around a Rising Bubble. Exp. Therm. Fluid Sci. 2018, 93, 186–194. [Google Scholar] [CrossRef]
- Someya, S.; Bando, S.; Song, Y.; Chen, B.; Nishio, M. DeLIF Measurement of PH Distribution around Dissolving CO2 Droplet in High Pressure Vessel. Int. J. Heat Mass Transf. 2005, 48, 2508–2515. [Google Scholar] [CrossRef]
- Stöhr, M.; Schanze, J.; Khalili, A. Visualization of Gas–Liquid Mass Transfer and Wake Structure of Rising Bubbles Using PH-Sensitive PLIF. Exp. Fluids 2009, 47, 135–143. [Google Scholar] [CrossRef] [Green Version]
- Valiorgue, P.; Souzy, N.; Hajem, M.E.; Hadid, H.B.; Simoëns, S. Concentration Measurement in the Wake of a Free Rising Bubble Using Planar Laser-Induced Fluorescence (PLIF) with a Calibration Taking into Account Fluorescence Extinction Variations. Exp. Fluids 2013, 54, 1501. [Google Scholar] [CrossRef]
- Huang, J.; Saito, T. Influences of Gas–Liquid Interface Contamination on Bubble Motions, Bubble Wakes, and Instantaneous Mass Transfer. Chem. Eng. Sci. 2017, 157, 182–199. [Google Scholar] [CrossRef]
- Lacassagne, T.; Simoëns, S.; El Hajem, M.; Champagne, J.-Y. Ratiometric, Single-Dye, PH-Sensitive Inhibited Laser-Induced Fluorescence for the Characterization of Mixing and Mass Transfer. ExFl 2018, 59, 21. [Google Scholar] [CrossRef]
- Kováts, P.; Thévenin, D.; Zähringer, K. Influence of Viscosity and Surface Tension on Bubble Dynamics and Mass Transfer in a Model Bubble Column. Int. J. Multiph. Flow 2020, 123, 103174. [Google Scholar] [CrossRef]
- Vaughn, W.M.; Weber, G. Oxygen Quenching of Pyrenebutyric Acid Fluorescence in Water. Dynamic Probe of the Microenvironment. Biochemistry 1970, 9, 464–473. [Google Scholar] [CrossRef] [PubMed]
- Wolff, L.M.; Liu, Z.-C.; Hanratty, T.J. A Fluorescence Technique to Measure Concentration Gradients near an Interface; ASCE: Reston, VA, USA, 1991; pp. 210–218. [Google Scholar]
- Wolff, L.M.; Hanratty, T.J. Instantaneous Concentration Profiles of Oxygen Accompanying Absorption in a Stratified Flow. Exp. Fluids 1994, 16, 385–392. [Google Scholar] [CrossRef]
- Woodrow, P.T.; Duke, S.R. Laser-Induced Fluorescence Studies of Oxygen Transfer Across Unsheared Flat and Wavy Air−Water Interfaces. Ind. Eng. Chem. Res. 2001, 40, 1985–1995. [Google Scholar] [CrossRef]
- Butler, C.; Lalanne, B.; Sandmann, K.; Cid, E.; Billet, A.-M. Mass Transfer in Taylor Flow: Transfer Rate Modelling from Measurements at the Slug and Film Scale. Int. J. Multiph. Flow 2018, 105, 185–201. [Google Scholar] [CrossRef] [Green Version]
- Butler, C.; Cid, E.; Billet, A.-M. Modelling of Mass Transfer in Taylor Flow: Investigation with the PLIF-I Technique. Chem. Eng. Res. Des. 2016, 115 Pt B, 292–302. [Google Scholar] [CrossRef] [Green Version]
- Roudet, M.; Billet, A.-M.; Cazin, S.; Risso, F.; Roig, V. Experimental Investigation of Interfacial Mass Transfer Mechanisms for a Confined High-Reynolds-Number Bubble Rising in a Thin Gap. AIChE J. 2017, 63, 2394–2408. [Google Scholar] [CrossRef] [Green Version]
- Roudet, M.; Loubiere, K.; Gourdon, C.; Cabassud, M. Hydrodynamic and Mass Transfer in Inertial Gas–Liquid Flow Regimes through Straight and Meandering Millimetric Square Channels. Chem. Eng. Sci. 2011, 66, 2974–2990. [Google Scholar] [CrossRef] [Green Version]
- Bork, O.; Schlueter, M.; Raebiger, N. The Impact of Local Phenomena on Mass Transfer in Gas-Liquid Systems. Can. J. Chem. Eng. 2005, 83, 658–666. [Google Scholar] [CrossRef]
- Francois, J.; Dietrich, N.; Guiraud, P.; Cockx, A. Direct Measurement of Mass Transfer around a Single Bubble by Micro-PLIFI. Chem. Eng. Sci. 2011, in press, corrected proof. [Google Scholar] [CrossRef]
- Kück, U.D.; Schlüter, M.; Räbiger, N. Local Measurement of Mass Transfer Rate of a Single Bubble with and without a Chemical Reaction. J. Chem. Eng. Jpn. 2012, 45, 708–712. [Google Scholar] [CrossRef]
- Jimenez, M. Etude Du Transfert de Matière Gaz/Liquide En Milieux Complexes: Quantification Du Transfert d’oxygène Par Techniques Optiques. Ph.D. Thesis, INSA, Toulouse, France, 2013. [Google Scholar]
- Frössling, N. Uber Die Verdunstung Fallender Tropfen. Beitr Geophys. Gerlands 1938, 52, 170–216. [Google Scholar]
- Higbie, R. The Rate of Absorption of a Pure Gas into Still Liquid during Short Periods of Exposure; New York: New York, NY, USA, 1935. [Google Scholar]
- Xu, F.; Cockx, A.; Hébrard, G.; Dietrich, N. Mass Transfer and Diffusion of a Single Bubble Rising in Polymer Solutions. Ind. Eng. Chem. Res. 2018, 57, 15181–15194. [Google Scholar] [CrossRef]
- Frank, X.; Charpentier, J.-C.; Ma, Y.; Midoux, N.; Li, H. A Multiscale Approach for Modeling Bubbles Rising in Non-Newtonian Fluids. Ind. Eng. Chem. Res. 2011, 51, 2084–2093. [Google Scholar] [CrossRef]
- Stern, O.; Volmer, M. On the quenching-time of fluorescence. Phys. Z 1919, 20, 183–188. [Google Scholar]
- Dietrich, N.; Francois, J.; Jimenez, M.; Cockx, A.; Guiraud, P.; Hébrard, G. Fast Measurements of the Gas-Liquid Diffusion Coefficient in the Gaussian Wake of a Spherical Bubble. Chem. Eng. Technol. 2015, 38, 941–946. [Google Scholar] [CrossRef]
- Jimenez, M.; Dietrich, N.; Hébrard, G. Mass Transfer in the Wake of Non-Spherical Air Bubbles Quantified by Quenching of Fluorescence. Chem. Eng. Sci. 2013, 100, 160–171. [Google Scholar] [CrossRef]
- Xu, F.; Jimenez, M.; Dietrich, N.; Hébrard, G. Fast Determination of Gas-Liquid Diffusion Coefficient by an Innovative Double Approach. Chem. Eng. Sci. 2017, 170, 68–76. [Google Scholar] [CrossRef]
- Clift, R.; Grace, J.R.; Weber, M.E.; Weber, M.F. Bubbles, Drops, and Particles; Academic Press: Cambridge, MA, USA, 1978. [Google Scholar]
- Lewis, W.; Whitman, W. Principle of Gas Absorption. Ind. Eng. Chem. 1924, 16, 1215–1220. [Google Scholar] [CrossRef]
- Moore, D. The Boundary Layer on a Spherical Gas Bubble. J. Fluid Mech. 1963, 16, 161–176. [Google Scholar] [CrossRef]
- Weiner, A.; Timmermann, J.; Pesci, C.; Grewe, J.; Hoffmann, M.; Schlüter, M.; Bothe, D. Experimental and Numerical Investigation of Reactive Species Transport around a Small Rising Bubble. Chem. Eng. Sci. X 2019, 1, 100007. [Google Scholar] [CrossRef]
Figure 1.
(A) Experimental set-up. (B) Visualization of a bubble rising in water containing 0.02 g/L of Triton X-100 in solution.
Figure 1.
(A) Experimental set-up. (B) Visualization of a bubble rising in water containing 0.02 g/L of Triton X-100 in solution.

Figure 2.
Viscosity of a solution of 0.1% (w/w) PAAm (polyacrylamide) in water, according to the shear rate.
Figure 2.
Viscosity of a solution of 0.1% (w/w) PAAm (polyacrylamide) in water, according to the shear rate.

Figure 3.
(A) Example of calibration curve: inverse of gray level of images obtained versus oxygen concentration in a solution of water and ruthenium (III). (B) Schematic representation of the bubble rising in its domain.
Figure 3.
(A) Example of calibration curve: inverse of gray level of images obtained versus oxygen concentration in a solution of water and ruthenium (III). (B) Schematic representation of the bubble rising in its domain.

Figure 4.
(A) Images obtained after the bubble’s passage in the PAAm/TritonX-100 mixture in water. (B) Representation of oxygen concentration along an x-line.
Figure 4.
(A) Images obtained after the bubble’s passage in the PAAm/TritonX-100 mixture in water. (B) Representation of oxygen concentration along an x-line.

Figure 5.
Integral of the oxygen concentration field according to the time after the bubble’s passage in solution of PAAm and Triton X-100.
Figure 5.
Integral of the oxygen concentration field according to the time after the bubble’s passage in solution of PAAm and Triton X-100.

Figure 6.
Representation of the oxygen concentration in a plane perpendicular to the bubble wake, 182 ms after the bubble’s passage. Medium from left to right: water, water + Triton X-100, and water + Triton X-100 + PAAm.
Figure 6.
Representation of the oxygen concentration in a plane perpendicular to the bubble wake, 182 ms after the bubble’s passage. Medium from left to right: water, water + Triton X-100, and water + Triton X-100 + PAAm.

Figure 7.
Area of the spot as a function of time after the bubble’s passage in a solution containing PAAm and Triton X-100.
Figure 7.
Area of the spot as a function of time after the bubble’s passage in a solution containing PAAm and Triton X-100.

Figure 8.
Representation of physical phenomenon occurring during the rising of a bubble in surfactant solution, according to the theory presented in this study.
Figure 8.
Representation of physical phenomenon occurring during the rising of a bubble in surfactant solution, according to the theory presented in this study.


Table 1.
Physical properties of fluids and hydrodynamic parameters of bubbles.
| σ (mN/m) | ρ (kg/m3) | η (Pa·s) | deq (mm) | Ub (mm/s) | χ (-) | |
|---|---|---|---|---|---|---|
| Water | 71.25 ± 0.16 | 998.00 ± 0.09 | 1 ± 0.001 × 10⁻³ | 1.27 ± 0.04 | 321 ± 2 | 1.4 |
| PAAm 0.1% in water [61] | 69.80 | 998.00 | 13γ−0.35 | 1.00 ± 0.04 | 81 ± 1 | 1.04 |
| Triton X-100 0.02 g/L in water | 48.38 ± 0.26 | 997.63 ± 0.04 | 1.001 ± 0.001 × 10⁻³ | 1.25 ± 0.04 | 142 ± 1 | 1.05 |
| PAAm 0.1% and Triton X-100 0.02 g/L in water | 47.20 ± 0.25 | 997.92 ± 0.05 | 13γ−0.35 | 1.44 ± 0.04 | 118 ± 1 | 1.03 |
Table 2.
Transfer parameters for different media.
| Integral (10−5 mg/m) | kL (10−4 m/s) | DO2 (10−9 m2/s) | Re (-) | Sc (-) | Sh (-) | |
|---|---|---|---|---|---|---|
| Water | 7.0 ± 0.2 | 4.9 ± 0.07 | 2.13 ± 0.06 | 407 | 470 | 290 |
| PAAm 0.1% in water [61] | 3.48 | 1.06 ± 0.09 | 1.88 ± 0.02 | 30 | 1490 | 60 |
| Triton X-100 0.02 g/L in water | 2.41 ± 0.13 | 0.76 ± 0.02 | 1.82 ± 0.14 | 177 | 550 | 50 |
| PAAm 0.1% and Triton X-100 0.02 g/L in water | 3.1 ± 0.2 | 0.62 ± 0.02 | 1.75 ± 0.13 | 68 | 1580 | 50 |
Table 3.
Results for experimental kL, theoretical kL, and diffusion layer thickness.
| kL (10−4 m/s) | kLFrössling (10−4 m/s) | kLHigbie (10−4 m/s) | δdf (µm) | δPe (µm) | |
|---|---|---|---|---|---|
| Water | 4.91 ± 0.07 | 1.73 | 8.32 | 4.3 | 2.9 |
| PAAm 0.1% in water [61] | 1.06 ± 0.09 | 0.79 | 4.40 | 17.7 | 4.8 |
| Triton X-100 0.02 g/L in water | 0.76 ± 0.02 | 1.06 | 5.13 | 23.9 | 4.0 |
| PAAm 0.1% and Triton X-100 0.02 g/L in water | 0.62 ± 0.02 | 0.74 | 4.27 | 28.2 | 4.6 |
Table 4.
Diffusion coefficient estimated in the diffusion layer and corrected theoretical kL.
| kL Experimental (10−4 m/s) | DO2 in the Diffusion Layer (10−10 m2/s) | kLFrössling Modified (10−4 m/s) | kLHigbie Modified (10−4 m/s) | |
|---|---|---|---|---|
| PAAm 0.1% in water [61] | 1.06 ± 0.09 | 5.1 | 0.21 | 2.29 |
| Triton X-100 0.02 g/L in water | 0.76 ± 0.02 | 3.04 | 0.18 | 2.1 |
| PAAm 0.1% and Triton X-100 0.02 g/L in water | 0.62 ± 0.02 | 2.84 | 0.12 | 1.74 |
Table 5.
Modification of the value of oxygen saturation.
| kL Experimental (10−4 m/s) | kLFrössling (10−4 m/s) | [O2] * Experimental (mg/L) | [O2] * Modified (mg/L) | |
|---|---|---|---|---|
| Triton X-100 0.02 g/L in water | 0.76 ± 0.02 | 1.06 | 9.18 ± 0.02 | 6.59 |
| PAAm 0.1% and Triton X-100 0.02 g/L in water | 0.62 ± 0.02 | 0.74 | 9.15 ± 0.02 | 7.61 |
Publisher’s Note: MDPI stays neutral with regard to jurisdictional claims in published maps and institutional affiliations. |
© 2021 by the authors. Licensee MDPI, Basel, Switzerland. This article is an open access article distributed under the terms and conditions of the Creative Commons Attribution (CC BY) license (http://creativecommons.org/licenses/by/4.0/).
Share and Cite
MDPI and ACS Style
Lebrun, G.; Xu, F.; Le Men, C.; Hébrard, G.; Dietrich, N. Gas–Liquid Mass Transfer around a Rising Bubble: Combined Effect of Rheology and Surfactant. Fluids 2021, 6, 84. https://0-doi-org.brum.beds.ac.uk/10.3390/fluids6020084
AMA Style
Lebrun G, Xu F, Le Men C, Hébrard G, Dietrich N. Gas–Liquid Mass Transfer around a Rising Bubble: Combined Effect of Rheology and Surfactant. Fluids. 2021; 6(2):84. https://0-doi-org.brum.beds.ac.uk/10.3390/fluids6020084
Chicago/Turabian StyleLebrun, Gaelle, Feishi Xu, Claude Le Men, Gilles Hébrard, and Nicolas Dietrich. 2021. "Gas–Liquid Mass Transfer around a Rising Bubble: Combined Effect of Rheology and Surfactant" Fluids 6, no. 2: 84. https://0-doi-org.brum.beds.ac.uk/10.3390/fluids6020084