
Fluidic-Oscillator-Based Pulsed Jet Actuators for Flow Separation Control

Institute of Aeronautics and Astronautics, Technische Universität Berlin, Marchstraße 12, 10587 Berlin, Germany
*
Author to whom correspondence should be addressed.
Fluids 2021, 6(4), 166; https://0-doi-org.brum.beds.ac.uk/10.3390/fluids6040166
Submission received: 10 March 2021
/
Revised: 12 April 2021
/
Accepted: 15 April 2021
/
Published: 20 April 2021
(This article belongs to the Special Issue Fluidic Oscillators-Devices and Applications)
Abstract
:The control of flow separation on aerodynamic surfaces remains a fundamental goal for future air transportation. On airplane wings and control surfaces, the effects of flow separation include decreased lift, increased drag, and enhanced flow unsteadiness and noise, all of which are detrimental to flight performance, fuel consumption, and environmental emissions. Many types of actuators have been designed in the past to counter the negative effects of flow separation, from passive vortex generators to active methods like synthetic jets, plasma actuators, or sweeping jets. At the Chair of Aerodynamics at TU Berlin, significant success has been achieved through the use of pulsed jet actuators (PJA) which operate by ejecting a given amount of fluid at a specified frequency through a slit-shape slot on the test surface, thereby increasing entrainment and momentum in a separating boundary layer and thus delaying flow separation. Earlier PJAs were implemented using fast-switching solenoid valves to regulate the jet amplitude and frequency. In recent years, the mechanical valves have been replaced by fluidic oscillators (FO) in an attempt to generate the desired control authority without any moving parts, thus paving the way for future industrial applications. In the present article, we present in-depth flow and design analysis which affect the operation of such FO-based PJAs. We start by reviewing current knowledge on the mechanism of flow separation control with PJAs before embarking on a detailed analysis of single-stage FO-based PJAs. In particular, we show that there is a fundamental regime where the oscillation frequency is mainly driven by the feedback loop length. Additionally, there are higher-order regimes where the oscillation frequency is significantly increased. The parameters that influence the oscillation in the different regimes are discussed and a strategy to incorporate this new knowledge into the design of future actuators is proposed.
1. Introduction
The objective of flow separation control is to enhance the effectiveness and efficiency of aerodynamic systems that are naturally limited by boundary-layer separation. The many types of actuators that have been devised over the years may be classified in numerous ways [1]. Among fluidic actuators, three main control strategies are usually followed: boundary-layer suction removes low-momentum fluid from the near-wall region and thereby increases the boundary-layer’s resistance to separation [2], continuous blowing energizes the near-wall flow to limit separation or increase circulation [3], and unsteady forcing attempts to influence naturally-occurring flow instabilities to either delay or suppress flow separation [4,5].
In recent years, based on the demonstrated success of unsteady forcing [6], several types of unsteady actuators have been introduced by the flow-control community. Prominent examples are synthetic jet actuators, which operate by generating a train of vortices by alternating suction and ejection without any net mass flux [7], as well as sweeping jet actuators that use fluidic oscillators (FO) to generate a spatially oscillating jet of a given frequency and velocity [8].
The present paper is concerned with another type of unsteady fluidic actuator, the pulsed jet actuator (PJA), which operates by injecting a given amount of fluid at a specified frequency through a slit-shape slot. Such actuators were successfully used in several wind-tunnel experiments [9,10] and flight tests [11] for the open and closed-loop control of flow separation. While the first PJAs used fast switching solenoid valves to generate the unsteady actuation, further work demonstrated the potential of using fluidic oscillators as a switching mechanism for PJAs (FO-PJAs) without the use of moving parts. In the 1960s, different fluidic oscillators based on fluidic bistable amplifiers were introduced. A fluidic oscillator with a single feedback loop (“Spyropoulus” feedback loop) was presented in [12] and was proposed as a pneumatic replacement for clock pulse generators for digital computers. This concept was later patented in [13]. In the patent description it was suggested, among other things, that the device could be used for boundary layer control. Another fluidic oscillator with two separate feedback loops (“Warren” feedback loop) has been patented in 1964 [14]. These two concepts have been the basis for multiple fluidic oscillators over the last decades. The potential of fluidic oscillators for flow control has been demonstrated in [15]. A more recent review of fluidic oscillator development and application for flow control was published in [16]. Based on the results presented in [17], the ongoing development led, among other things, to the actuator that was presented in [18]. The latter concept combines steady suction and oscillatory blowing, thus increasing the efficiency of the actuator. Furthermore, a no-moving-part hybrid-synthetic jet actuator based on the Spyropoulus fluidic oscillator concept was adapted to generate alternately suction and blowing at the exit nozzles in [19]. An oscillator geometry similar to the sweeping jet actuators is connected to a fluidic diverter in [20]. The diverter part has no feedback loop connection, similar to the Spyropoulus concept. By combining the two elements, a kind of duty cycle modulation can be created and thus promises a high efficiency potential. Another fluidic oscillator concept based on the fluidic bistable amplifier was presented in [21]. This oscillator replaces the feedback loop with a Helmholtz resonator tube connected to one control port while the other port is open into the atmosphere. The advantage of this concept is the independence of the switching frequency and the jet velocity, whereby the actuator performance can be customized to a target flow control application. Additionally in [21], a secondary experiment using the proposed actuator with a modified outlet was conducted. Through this modification and a combination of a multitude of such actuators side by side, alternately suction and blowing on a wing model was achieved. All the modified actuators based on the Spyropoulus concept take advantage of the influence of pressure differences at both sides of the power jet on the jet deflection and switching. A recently presented concept similar to the Spyropoulus oscillator was investigated in [22] and later patented in [23]. With this concept, the typical control ports are completely omitted and the outlet channels are connected by an acoustic feedback loop. Another concept with frequency and mass flow independence was presented in [24] where a two-stage FO-PJA was used to increase the performance of a two-element high-lift configuration and in [25] the same actuator concept was tested for active drag reduction on a complex outer wing model. The two-stage active flow control (AFC) system consisted of an outlet stage and a driver stage. The latter was implemented with a fluid oscillator. Furthermore, the two-stage actuator design was adapted and optimized to control the flow separation at the pylon-wing junction of a real-scale model [26,27]. Later on, single-stage FO-PJAs were also used to control the three-dimensional (3D) flow separation on a vertical tail model [28,29,30].
The aforementioned references have shown that the most important parameters that govern the effectiveness of flow separation control with PJAs are forcing frequency and velocity ratio [31]. However, although the control authority of FO-PJAs has been investigated in the past [32] and a preliminary investigation of their switching characteristics has been provided in [33], an in-depth analysis of their internal switching mechanism is still missing. In the aforementioned studies, it has been shown that the switching frequency may suddenly drop at a specific value of the mass flow. The parameters that influence the switching frequency and in particular the reason for the frequency drop have not yet been investigated. Hence, the objective of the present paper is to examine in detail the internal fluid-dynamic properties of single-stage FO-PJAs, and particularly the parameters that influence their switching frequency. This will be done by a combined experimental and numerical investigation on a family of generic actuator geometries. We also discuss how to use this new knowledge in the design process of single-stage FO-PJAs by providing some basic guidelines for the design of the feedback loop and the sizing of the outlet nozzles. Additionally, based on the investigations into the mechanisms responsible for the different frequency characteristics, the special behavior of the FO-PJA geometry may also be exploited in future applications. Hence we provide parameters to increase or reduce the mass flow range in which high-frequency switching occurs. In addition, non-dimensional equations for calculating the various frequency ranges will be beneficial in future FO-PJA design processes.
2. Flow Physics of Active Separation Control with PJAs
2.1. PJA Working Principle
In this section, the mechanism of active separation control by means of pulsed blowing will be explained briefly. The basic idea of separation control with PJA is to inject high momentum fluid into a separated flow where the momentum is low in order to transfer momentum between the high and low speed regions of the flow and by that reattach the flow to the surface [31]. The pulsed jet flow control mechanism is driven by complex three-dimensional vortex structures [34,35], which are generated by the starting vortex ring of the pulsed jets injected in the main flow [36]. The reattachment process with a pulsed jet is sketched in Figure 1. Note that this sketch is a simplified two-dimensional (2D) version of a 3D process and only gives an insight into the PJA working principle by illustrating the effect of one period of forcing. In practice, the flow control mechanism is a periodic process.
A planar starting jet (Figure 1, picture 2, green arrow) with a sufficiently high velocity ratio (in relation to the surrounding velocity field) will induce a vortex ring [36,37]. Depending on the orientation of the pulsed jet and the cross-flow the vortex ring will be deformed [38,39]. In the two-dimensional plane perpendicular to the slit-shape orifice, the vortex ring appears like a pair of counter-rotating vortices [34] (Figure 1, red and blue arrows). The upstream vortex brings high momentum fluid (Figure 1, magenta arrow) through the mixing layer to the wall while the downstream vortex transports low momentum fluid (Figure 1, yellow arrow) away from the surface. This also lowers the static pressure near the wall and supports the flow reattachment. Furthermore, when the jet inclination angle is sufficiently low, the trailing jet behind the vortices stays attached to the surface through coanda effect (Figure 1, picture 3, green arrow), thus entraining additional surrounding fluid and lowering the local static pressure [5]. Hence, the flow reattachment process works well when the actuator outlet is placed close to the mean separation line [34].
2.2. Main Design Parameters of PJA
With the information on the working principles of PJAs and the knowledge on flow separation characteristics, fundamental parameters for designing PJA systems can be defined. The control mechanism is based on a starting vortex with a trailing coanda jet as described above. When the flow is reattached, a constantly blowing actuator would be effective as long as the coanda effect is strong enough to keep the flow attached. However, the required power and mass flow for effective separation control is typically an order of magnitude smaller with oscillatory blowing than with constant blowing [4,17]. Thus, constant blowing will not be the most efficient solution when it comes to application. Furthermore, it was shown in [5] that once the flow is reattached to the surface, hysteresis can be taken advantage of. Pulsed blowing at a specific frequency thus takes advantage of the flow inertia by turning off blowing until the flow starts separating again.
Due to the variety of possible AFC applications, the optimal excitation frequency can be diverse. The correct frequency range must therefore be determined in advance. With flow separation, the neutral stability of the shear layer is a decisive factor in determining the optimal excitation frequency [6]. The most effective reduced frequency is , where is the excitation frequency, and is the distance between excitation location and the trailing edge of the surface [5]. Moreover, it was noted that the optimum can also be found at higher frequencies. Nevertheless, the optimal excitation frequency for pulsed blowing applied on the flap of a high-lift configuration was found within the range of as well [9]. With pulsed blowing at a specific frequency, the periods where the flow separates are minimized and the AFC system will be effective. Higher frequencies could have negative impact on efficacy in some situations [17]. There is a minimum period of time between the start of excitation and complete reattachment [5]. In particular, if pulsed blowing with too high frequency is applied, the vortex pair can no longer be formed in the short period or the starting jet from the next period constantly breaks the previous created vortex pair [38]. If no stable vortex rings are generated and the pulsing frequency is several orders of magnitude higher than the natural flow separation shedding frequency, the PJA jet can be considered quasi-stationary again.
The necessity of matching the excitation to the frequency of the separating flow in a certain range makes the actuation frequency one of the most important parameters when it comes to PJA design. The other fundamental parameter is the jet velocity since the strength of the entrainment [40] (and thus the coanda effect) and the vortex formation depends on a high jet velocity ratio [37]. There are many other parameters to consider like signal quality of the pulsed jet, span-wise jet uniformity, or pressure loss through the PJA system. The signal quality for example can be described with parameters like duty-cycle, modulation, crest-factor, and form-factor and can be compared to an ideal pulse-wave. Nevertheless these parameters are secondary and the main objective of an FO-PJA is to generate a pulsed jet of a given velocity at a specific frequency. In Section 3, we will propose a generic design aimed at investigating the switching properties of such actuators.
2.3. Example of FO-PJAs Used in Practice
As mentioned in the introduction, FO-PJAs have been used in various flow control applications. In the following, an example for AFC and the specific challenges with single-stage FO-PJAs are briefly discussed.
Experiments on the performance enhancement of a vertical tail plane (VTP) model using alternately pulsed blowing were carried out with multiple single-stage FO-PJAs. A sketch of the wind-tunnel model is shown in Figure 2. The implementation of several actuator segments (Figure 2 (left), marked in gray) was necessary because the influence of partial actuation on the 3D flow separation was investigated. Therefore, each actuator segment consisted of an FO-PJA with multiple outlets. A detailed view of one FO-PJA segment is shown in Figure 2 (right). The green area represents the part through which the compressed air is flowing and the green arrows represent the pulsed jets (described in Figure 1, also with green arrows) at a specific period. Due to geometrical limitations and the required flow control parameters (frequency and outlet velocity respectively momentum flow rate), the actuator geometry had to be folded. Results of wind-tunnel experiments with this configuration of FO-PJA are provided in [28,29,30].
The main difficulty in the design process of the complex FO-PJA system is to build an actuator that will fit into a specific aerodynamic geometry of a given size while simultaneously fulfilling the required flow control parameters. The shape and size of these FO-PJAs determine the outlet jet characteristics. Therefore, the aim of the present study is to investigate the influence of the geometric parameters on the actuator output, and specifically the pulsing frequency. The influence of three-dimensional folding of the FO-PJA geometry will be discussed in Section 5.
3. Experimental and Numerical Setup
For the experimental and numerical investigations, a family of generic fluidic oscillators based on a bistable switch [41] was designed. Stereo-lithography 3D printing was used to manufacture different variants derived from a reference oscillator presented in Section 3.1. For each design variant of the oscillator geometry, a variation in length and diameter of the feedback loops and different sizes of the outlet nozzle were investigated. The main goal of this study is the investigation of fundamental parameters which affect the primary design objectives, switching frequency and outlet velocity. The differences in design (2D and 3D) have no major impact on the primary design goals (see Section 5). Furthermore, the 2D FO-PJA offers more flexibility in varying feedback loop parameters. It was therefore selected as a reference geometry for this study.
The experimental methodology is presented in Section 3.2. Additionally, a geometry with a fixed feedback loop and a throttled outlet was chosen for the numerical simulations described in Section 3.3.
3.1. Utilized Fluidic Oscillator Geometry
The generic FO-PJA geometry shown in Figure 3 may be classified with the taxonomic tree with classification based on the number of active devices proposed in [42]. The FO-PJA device used in this study is based on a single amplifier with a bistable switching characteristic using external feedback loops. Based on this classification, the working principle can now be briefly explained.
Pressured air is led through the plenum to the power jet. Since the geometry is based on a bistable switch the power jet will be deflected in one direction to the left or right side of the splitter. A large proportion of the fluid will be led to the outlet nozzle while a smaller fraction of fluid will flow into the feedback loop to be reinjected at the corresponding control port. Thereby, the power jet will be deflected into the other settling chamber and a similar mechanism occurs there. When the power jet gets deflected again, one oscillation has passed.
The mass flow ejected through the outlet nozzle delivers the control authority to the outside flow while natural oscillation of the fluidic oscillator defines the actuation frequency. Note the primary and secondary attachment walls separated from each other by the separation edge in the detailed view (Figure 3 right), as these parameters are significant for the switching frequency, as we will see later in the analysis. This specific geometry was initially designed to reduce the pressure at the control ports required for switching by fixing the location of separation.
Several variations of this nominal geometry where considered. The design variants are shown in Figure 4 with the reference FO-PJA labeled as Ref. These variations of the nominal geometry were performed to investigate the effect of geometrical changes that may occur when the actuator is designed to fit into a given aerodynamic model. The main dimensions of the geometry variants are shown in Table 1.
The geometrical change of the feedback ratio is marked in red in Figure 4 (geometry labeled as FR) and basically modifies the ratio between the cross-section area of the pipe leading to the outlet nozzle and the pipe of the feedback loop inlet. All other parts remain the same. The feedback ratio in the Ref case is while in the FR case it is . The second approach in geometrical change was expanding the height of the settling chambers in z-direction, marked in magenta, and referenced as Z case. The third geometrical variation was a 3D scaling of the complete FO-PJA shown in green and labeled as S case. Note that while scaling down the geometry the outlet nozzles remain the same to be able to use the same throttling device (shown in Figure 5) during the experiments.
3.2. Experimental Methodology
The investigations were conducted on an actuator test bench. A pressure reducer valve in combination with a 1000 L/min maximum flow rate version of the FESTO proportional flow control valve (VPCF) was used to ensure a constant pressured air supply into each actuator. The absolute accuracy of the VPCF (-6-L-8-G38-6-V1-E-EX2) device translates to an uncertainty of for the mass flow rate. The manufacturer specifies a repetition accuracy of which corresponds to a maximum repetition error of (≈0.1 g/s) in our application.
For the determination of dominant frequencies and Mach numbers in different parts of the geometry, several pressure taps were incorporated into the oscillator devices. The outlet Mach number was calculated using the total pressure measured in the plenum, the static pressure at the outlet and the total temperature in the plenum, assuming an isentropic process. The pressure measurement ports are marked in red: four ports are placed in the plenum and five within the oscillator circuit (see Figure 6). Four KULITE XTL-190M-3.5BARA absolute pressure transducers are used in the experiments: one sensor is connected to all ports placed in the plenum, which are combined through a multiple distributor with silicone tubes of equal length (30 mm each), one to the feedback loop, one to the port in the power jet nozzle, and one is connected to the port in the settling chamber for oscillation frequency analysis. The connection between each sensor and the respective pressure tap (except for those in plenum) was made by a 25 mm long aluminum tube. These short and straight tubes were chosen to ensure low attenuation of the pressure signal for accurate frequency measurement. The other ports are physically there in order to maintain the greatest possible symmetry but are closed during the measurements.
In order to investigate different sizes of outlet nozzles, a wedge-shaped device was used to throttle the outlet nozzles of the FO-PJA during the experiments. The device was mounted on a linear traverse, thus the throttling could be varied. As we will see in Section 4, it is not just the size of the outlet nozzle that is important. Rather, the ratio of the outlet nozzle to the power jet nozzle is significant, since this determines the outlet jet velocity at a certain mass flow. Therefore, the throttling ratio is defined as the contraction ratio of the FO-PJA device:
with the cross-section area of the power jet nozzle and the cross-section area of the unblocked part of one outlet nozzle . A low throttling ratio means that the outlet nozzle is barely blocked (which simulates a large PJA outlet).
Additionally to the variation of throttling ratio, the feedback loop geometry was changed during the experiments. On the one hand, the length of the feedback loop was varied by using tubes of different lengths. On the other hand the volume of the feedback loop was varied by using tubes of different diameter as shown in Figure 5 on the right side. For normalization an equivalent power jet diameter defined as:
was used and the non-dimensional feedback loop length and diameter were calculated as:
with the feedback loop length (see Figure 6) and the feedback loop diameter . To evaluate the results, the non-dimensional feedback loop volume is given by:
Note that an investigation on the physical mechanism and the scaling laws for fluidic oscillators was performed in [43]. However, in that study the feedback loop was designed in a different way, thus making the results inapplicable to the FO-PJAs used here.
For the experimental evaluation, the measurement chain was optimized and uncertainties were minimized. For the quantification of the measurement uncertainty, the repeatability of the set mass flow rate and the resulting dominant frequencies generated by the FO-PJA device were investigated. The repeatability of the setup was initially checked with the reference geometry on the first four days of the 12 day measurement campaign. For that a mass flow sweep ( g/s) at 6 different throttling ratios was performed 10 times per day. When validating the repeatability, the hysteresis of the switching frequency with increasing or decreasing mass flow rate was considered. The repetition error from different days was in the range of the error from a single day measurement, from which we concluded that the error was not caused by the external conditions. Therefore, from day four the repeatability for each setup was checked on a single day. The measurements were repeated 10 times for every geometrical variation, resulting in g/s for the mass flow rate and Hz for the dominant frequency.
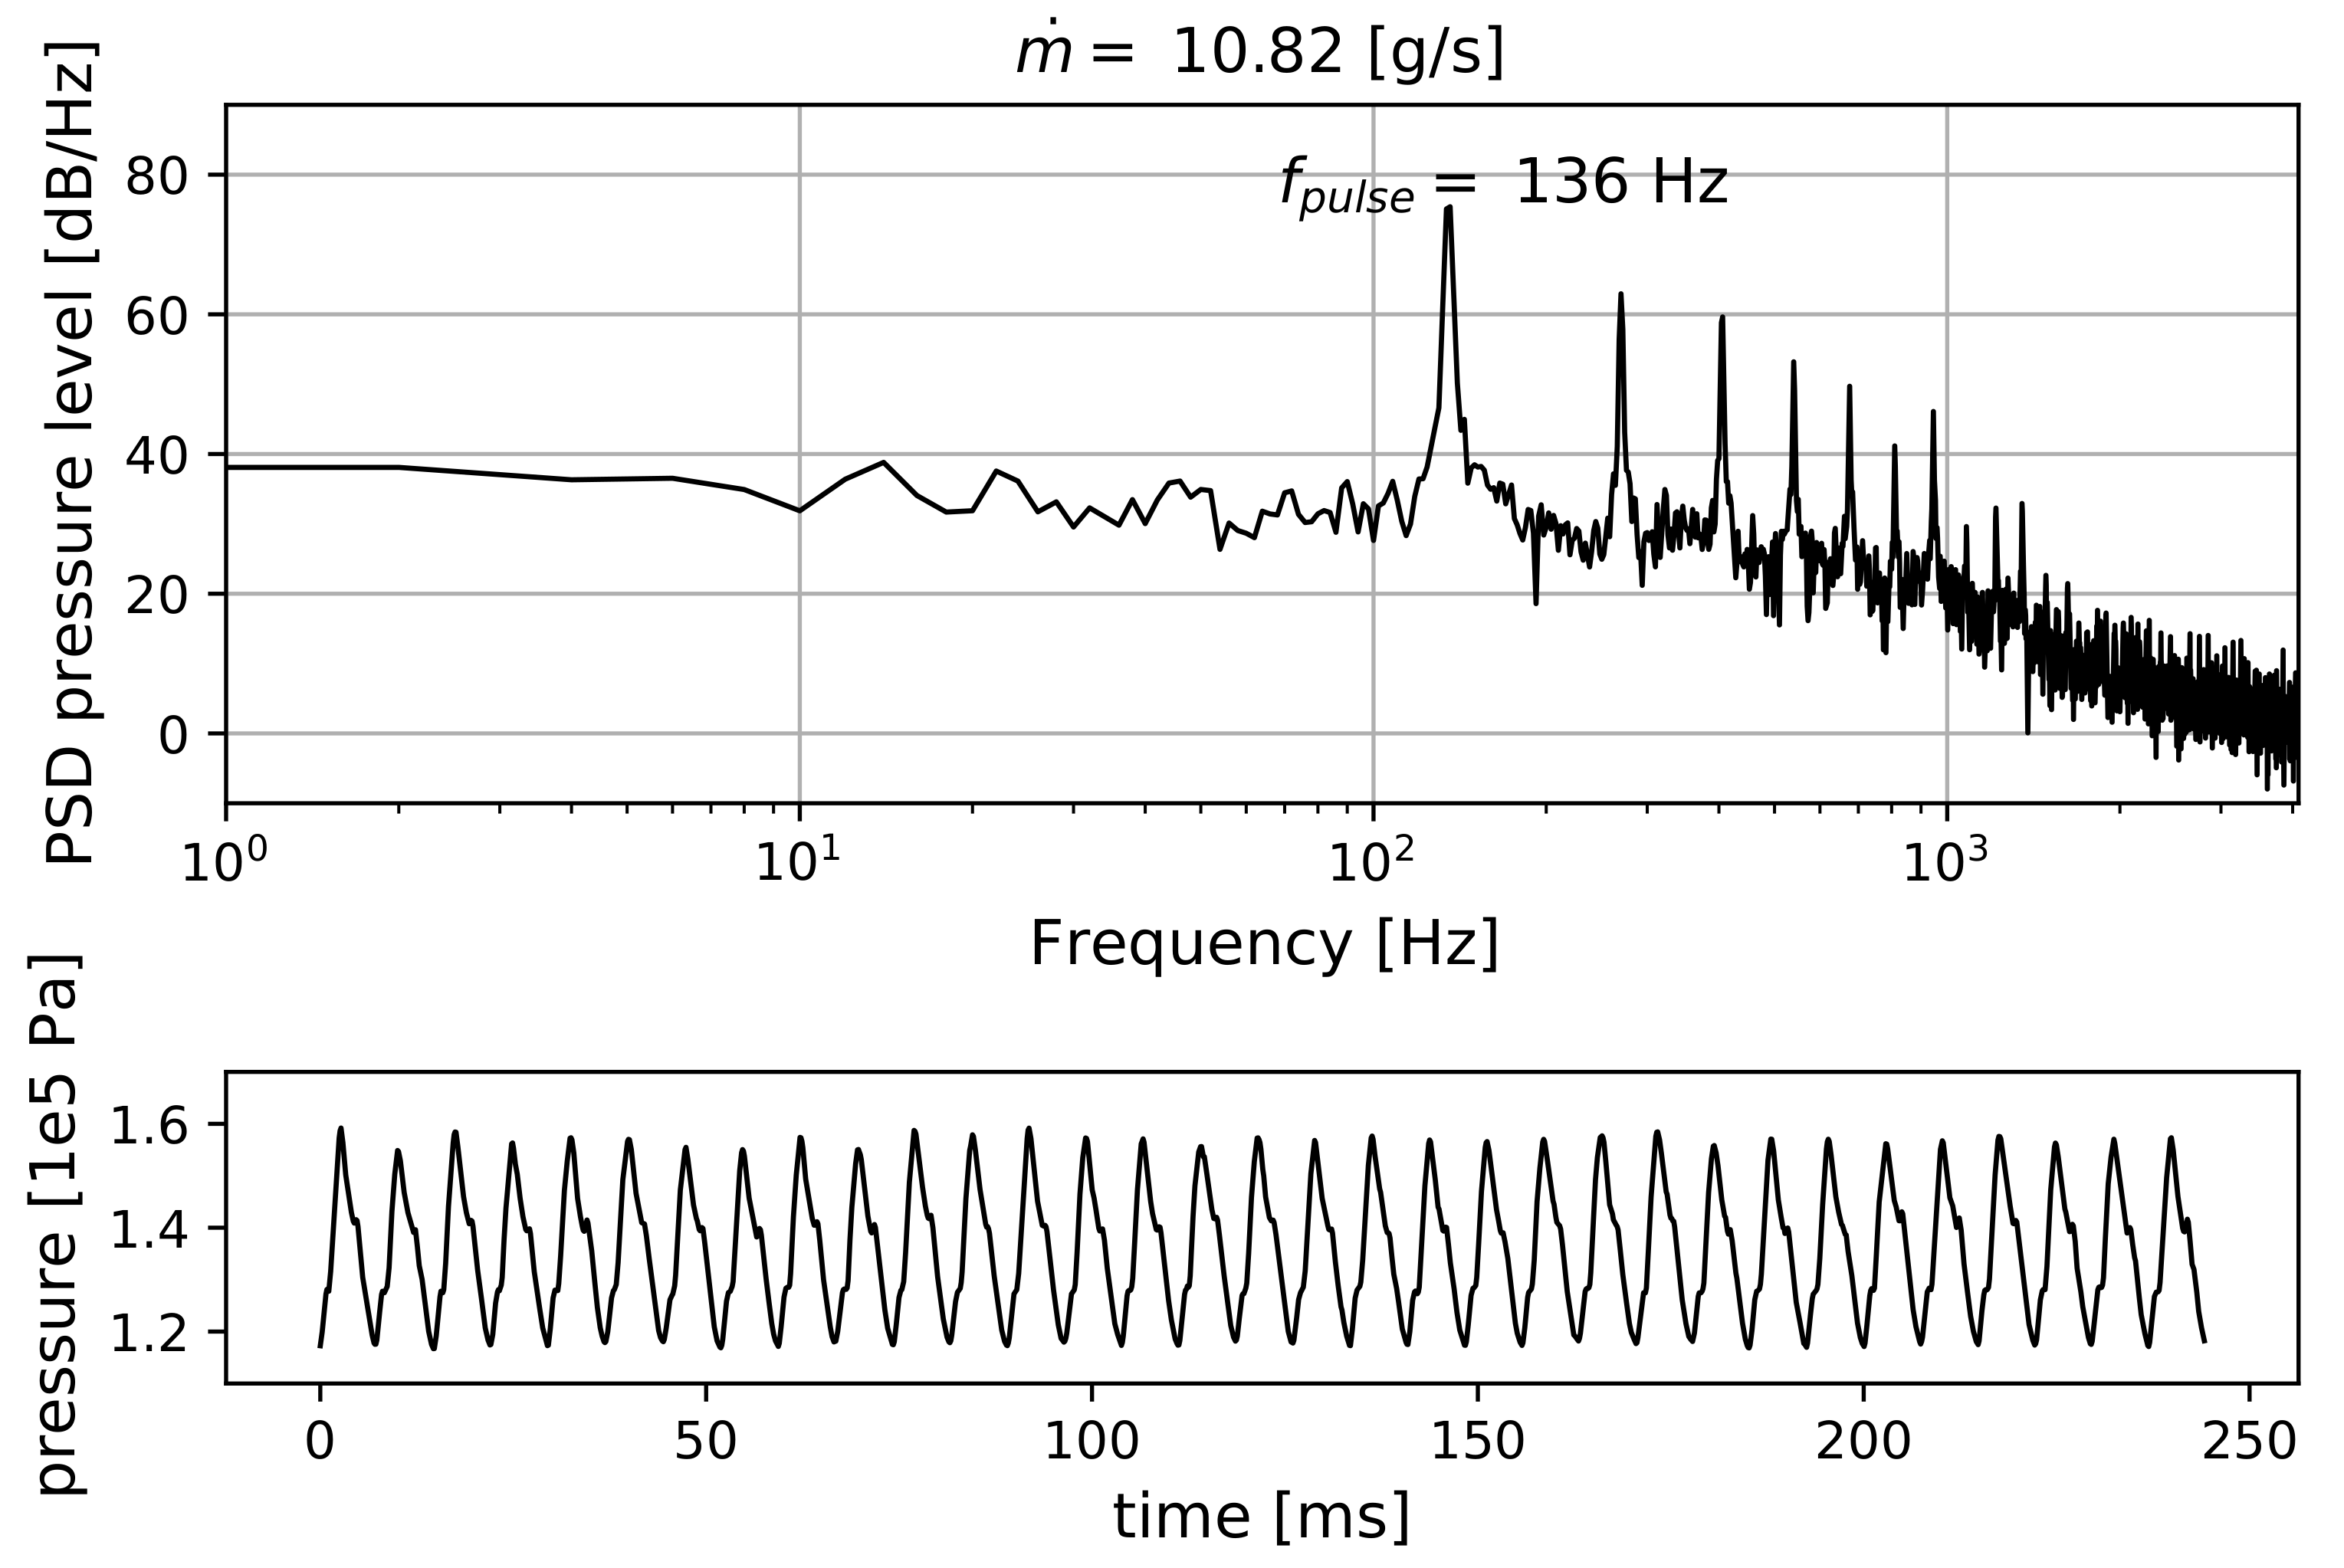
The pressure signals from the calibrated KULITE absolute pressure transducers connected to the ports given in Figure 6 were amplified and captured by a BMCM USB-AD16f data acquisition system at a sampling rate of Hz. For the KULITE pressure transducers a non-linearity of FSO-BFSL and a repeatability of FSO is specified from the manufacturer. The combination of the sensors with the BMCM measurement system yields a pressure error of less than 22 Pa. Since the pressure values and the measured mass flow rates are used for outlet velocity calculation (see Equation (6)) the combined maximum error for the outlet velocity is ( m/s). The power spectral density (PSD) of the measured pressure signal was used to determine the dominant frequency of the FO-PJA for the set mass flow rate (example in Figure 7). The measured frequency was defined as dominant when there was an explicit peak in the PSD with a value larger than 50 dB/Hz.
In addition to the frequency, another primary design objective is the jet velocity . It is calculated as follows:
with the mass flow controlled and measured by the festo VPCF and the mach number corrected jet density calculated according to the principle described in [25]. To apply this principle, the pressure inside the oscillator, the pressure at the outlet, the total temperature in the plenum, and the mass flow rate were measured.
Since the specific characteristics of the FO-PJA family will be investigated, it makes sense to use dimensionless quantities for the primary design objectives in addition to the absolute values. Instead of the frequency, the FO-PJA Strouhal number () will be used to represent the oscillation and the jet Mach number ( instead of the jet velocity.
Note that the oscillator’s Strouhal number is not the same as the Strouhal number defined in Section 2.2 with the outside flow quantities.
3.3. CFD Methodology
In supplement to the experimental database, numerical simulations were carried out using the OpenFoam® computational fluid dynamics (CFD) package. Figure 8 shows the scaled computational domain and indicates the positions of the boundary patches. The numerical mesh was built with the OpenFoam® utility snappyHexMesh. To ensure an undisturbed propagation of the oscillator outlet jet, the distance between the oscillator outlet nozzle and the outlet plane of the domain was set to , where is the length of the oscillator outlet nozzle, as depicted in Figure 8.
The flow channels of the fluidic oscillator and the adjacent outlet patch were specified as no slip walls, assuming a zero fluid velocity relative to the boundary. Table 2 lists the boundary conditions of the numerical simulations at design conditions. At the inlet patch, a mass flow rate of g/s and a temperature of K was set. A static ambient pressure of Pa was predefined at the outlet patch. For the initial conditions in each simulation the velocity inside the FO-PJA geometry was set to m/s and the pressure was set to 101325 Pa. The unsteady Reynolds-averaged Navier–Stokes equations (URANS) were solved using sonicFoam, a transient solver for transonic and turbulent flow of a compressible gas. Previous numerical investigations of similar fluidic oscillators indicated that the Spalart–Allmaras one-equation turbulence model shows a good agreement between CFD and experiment [33]. It was thus chosen in this work. The walls were generated with one layer of boundary layer cells, where the nutLowReWallFunction was chosen to calculate the flow behavior in the near wall region. The thickness of the boundary layer cells was chosen to obtain a dimensionless wall distance of = 30 – 100, in order to use wall functions. As a result of high unsteady flow characteristics inside the oscillator, the value of varies throughout the entire geometry.
A grid independence study was performed with mesh sizes varying from 0.5 to 1 million cells. For the mesh generation a maximum refinement of level 7 was used along the entire oscillator channels. Within the mesh sensitivity study, the refinement level was not adjusted but the base grid created by blockMesh was refined equally in any direction of the three-dimensional grid. Two supply mass flow rates were chosen and the corresponding switching frequency was obtained from the simulations. During the simulation, data probes were located at the feedback loops and at the outlet nozzle to capture the characteristic frequency. The switching frequency of the power jet was used as a parameter to analyze the different meshes with respect to the grid size. For experimental validation, a fluidic oscillator in original size (as shown in Figure 3) based on the design of the reference case was built. The experimental setup for the validation was the same as described in Section 3.
Figure 9 shows the result of the grid independence study and illustrates the experimental benchmark for a mass flow rate of g/s and g/s. The experimental measured frequency is Hz for a mass flow rate of g/s and Hz for g/s. The numerically simulated oscillation frequency is within an acceptable range to the experimental results. Matching the absolute frequency values is not the only relevant parameter to describe the flow characteristics of the oscillator. It is also important to consider the frequency trend with increasing mass flow rate (shown later in Section 4). With the different mesh sizes, there are no major deviations in the switching frequency. In order to guarantee a good mesh resolution to visualize the inner flow regime, the mesh with one million cells was selected for all simulations performed in this study. A major aspect of the accuracy of the numerical simulation is the specification of the numerical schemes. An overview of the numerical schemes used in this study is shown in Table 3.
4. Results
The following section presents the experimental and numerical results of the parametric investigation, with a focus on the achievable jet velocity and switching frequency of the actuators.
In Figure 10, the correlation between mass flow rate and jet velocity is shown for the four different geometrical variants and several throttling ratios. The data points for the S geometry are limited to a mass flow rate of g/s since it was the highest achievable mass flow rate with the available supply air pressure and the small size of the power jet nozzle. For the other devices, a larger geometrical size enables a higher mass flow rate to be set. The outlet velocity limit with the chosen outlet geometry and the available supply pressure is the speed of sound Nevertheless, the trends of all actuator curves are similar. With increasing supply mass flow rate or throttling ratio, the outlet velocity increases following the continuity equation. Of course, this is not a new finding, but the context is relevant when it comes to simultaneously designing the outlet momentum and switching frequency. Depending on the application, a desired velocity ratio may be required with a limited mass flow rate. This will impact the choice of the throttling ratio (i.e., the area of the outlet nozzle) which, as will be shown below, will also influence the switching frequency. In certain applications an outlet velocity above the speed of sound could be beneficial. However, investigations on the performance of the FO-PJA with a supersonic outlet is left for future studies since it might lead to different design requirements.
The frequency characteristic of the FO-PJA device with a fixed feedback loop and an increasing supply mass flow rate is shown in Figure 11 (left). This specific geometry was used in the numerical simulations as well as the experiments. The switching process of the oscillator starts at a mass flow rate of g/s and a frequency of Hz. Increasing the mass flow rate causes a rise of the pulsing frequency up to a mass flow rate of g/s. As the mass flow rate is increased, the switching frequency suddenly drops to approximately 500 Hz. By further increasing the mass flow rate, the frequency remains nearly constant. In previous investigations with the FO-PJAs, we had already found that hysteresis occurs when the mass flow rate is first increased and then decreased again. This hysteresis can be exploited because there is always a mass flow range in which the high or low frequency switching can be set by reaching the target mass flow from a certain direction. This behavior was also found in the present experiments. However, the hysteresis was not investigated further, as the main objective of this study is to first examine the parameters that define the switching frequency and to identify the differences in internal flow physics between high and low frequency switching.
The relationship between supply mass flow rate and switching frequency is nicely reproduced by the numerical simulations. The results of the CFD and the experimental measurements slightly differ but the position of the frequency drop and the gradients before and after the drop match very well. Within the high-frequency range ( g/s), the calculated frequencies are slightly lower than the measurements and within the low-frequency range ( g/s) the calculated frequencies are slightly above the experiment. This small discrepancy may be caused by the manufacturing tolerance in 3D printing.
On the right side of Figure 11, some experimental PSD plots for different mass flow rates are shown. The color of the plots corresponds to the marked points in the frequency plot on the left side. The dominant frequency is annotated in each plot. It can be seen that the amplitude of the pressure level PSD is at about 55 dB/Hz in the high-frequency regime and at 75 dB/Hz in the lower-frequency regime. In the low-frequency regime the higher harmonics are also very present, where the second higher harmonic measures a level of about 55 dB/Hz as well. In the following, the low-frequency range will be called the fundamental frequency of the oscillator and the high oscillation frequencies will be called higher-order regime.
4.1. Fundamental Frequency Regime
The switching process of any fluidic oscillator depends on the pressure at the control ports. The power jet will attach to the wall where the pressure is lower [41]. When a pressure wave moves through the feedback loop, the pressure at the control port will increase. If the pressure at the other control port is lower the power jet will detach from the wall and move towards the lower-pressure side. This state will be stable as long as the pressure difference at the control ports is present.
When the power jet switches to the other direction, the jet must pass the splitter, whereby a pressure wave will emerge into the settling chamber and move into the feedback loop back to the control port. This means that the switching frequency depends on many factors like the prevailing speed of sound, the feedback loop length, and the pressure gradient in the feedback loop and settling chamber.
The total pressure during a switching period of the generic actuator is shown in Figure 12 in 12 time steps. The mass flow rate in this case is g/s and the dominant frequency is Hz. For a better visualization, the contour level range is set to a minimum of 1 Pa and a maximum of 1.5 Pa. In addition, some stream-tracers are shown to facilitate the interpretation of the contour plots. As specific parts of the oscillator geometry will be referenced in the following explanation, it is useful to remember the geometrical definitions as shown in Figure 3.
In the first time step (1) the power jet starts switching from the left to the right wall. In this state, the pressure in the right settling chamber starts to rise (2) and a leading pressure wave moves into the right feedback loop (3). In time step (4), the jet is attached to the primary but not the secondary attachment wall. This will cause a short pressure reduction at the feedback loop inlet which can be seen at time step (5). In (6), the jet is bent towards the feedback loop inlet again due to the attachment at the secondary attachment wall. At this point, the jet continually pushes fluid into the feedback loop, which creates a trailing pressure wave (7). In addition, at time step (7) the leading pressure wave in the right feedback loop reaches the control port. Although the pressure of this leading pressure wave is high, it is not sufficient to switch the power jet to the left wall, as there is still high pressure at the left control port (7–8). The pressure at the left control port is low in time step (9) and the trailing pressure wave reaches the control port in (10). Here it is sufficient to detach the power jet from the right primary attachment wall and switches the jet to the left wall (11–12).
The switching mechanism illustrated in Figure 12 implies that small geometric changes may have a strong effect on the switching frequency. In the following we investigate these effects experimentally.
In Figure 13, the frequency characteristic of the Ref geometry is shown for two different feedback loop length (left) and three different feedback loop diameters (right). First the feedback loop length will be discussed. The non-dimensional length corresponds to an actual length of m and to m. It can be seen that doubling the feedback loop length roughly halves the frequency. The actual frequency values match the statement that the speed of sound and feedback loop length are responsible for the switching characteristics. Even though the pressure gradient into the feedback loop and the actual speed of sound into the system are not measured, a rough estimate for the frequency response can be calculated. With the speed of sound m/s and the feedback loop length, the resulting frequency is Hz for and Hz for . These estimated values are close to the actual measured frequencies in Figure 13 (left).
On the right side of Figure 13, the feedback loop diameter is varied while the length is constant at . The diameter has an influence on the frequency response, nevertheless it is significantly smaller than the feedback length. For comparison, the feedback loop volume is given in both plots. Increasing the diameter from to reduces the frequency by Hz even though the volume increases by . In the left plot, where the feedback loop length was varied, the volume increases by and the frequency is reduced by Hz. This confirms that the length of the feedback loop is critical but not its volume. The next parameter to be discussed is the throttling ratio.
For the results shown in Figure 14, on the left side the reference geometry with the same feedback loop lengths as in Figure 13 (left) were used and the throttling ratio was varied. It can be seen that with the long feedback loop the throttling has less influence than with the short one. In both cases, increasing the throttling ratio also increases the frequency. Another interesting fact is that the curves for coincide while the outlet velocity comes close to the speed of sound. Only for smaller throttling ratios the frequency first increases with the mass flow rate and then decreases again. Nevertheless, the general influence of the throttling ratio on the frequency response of the FO-PJA is lower than the feedback loop length.
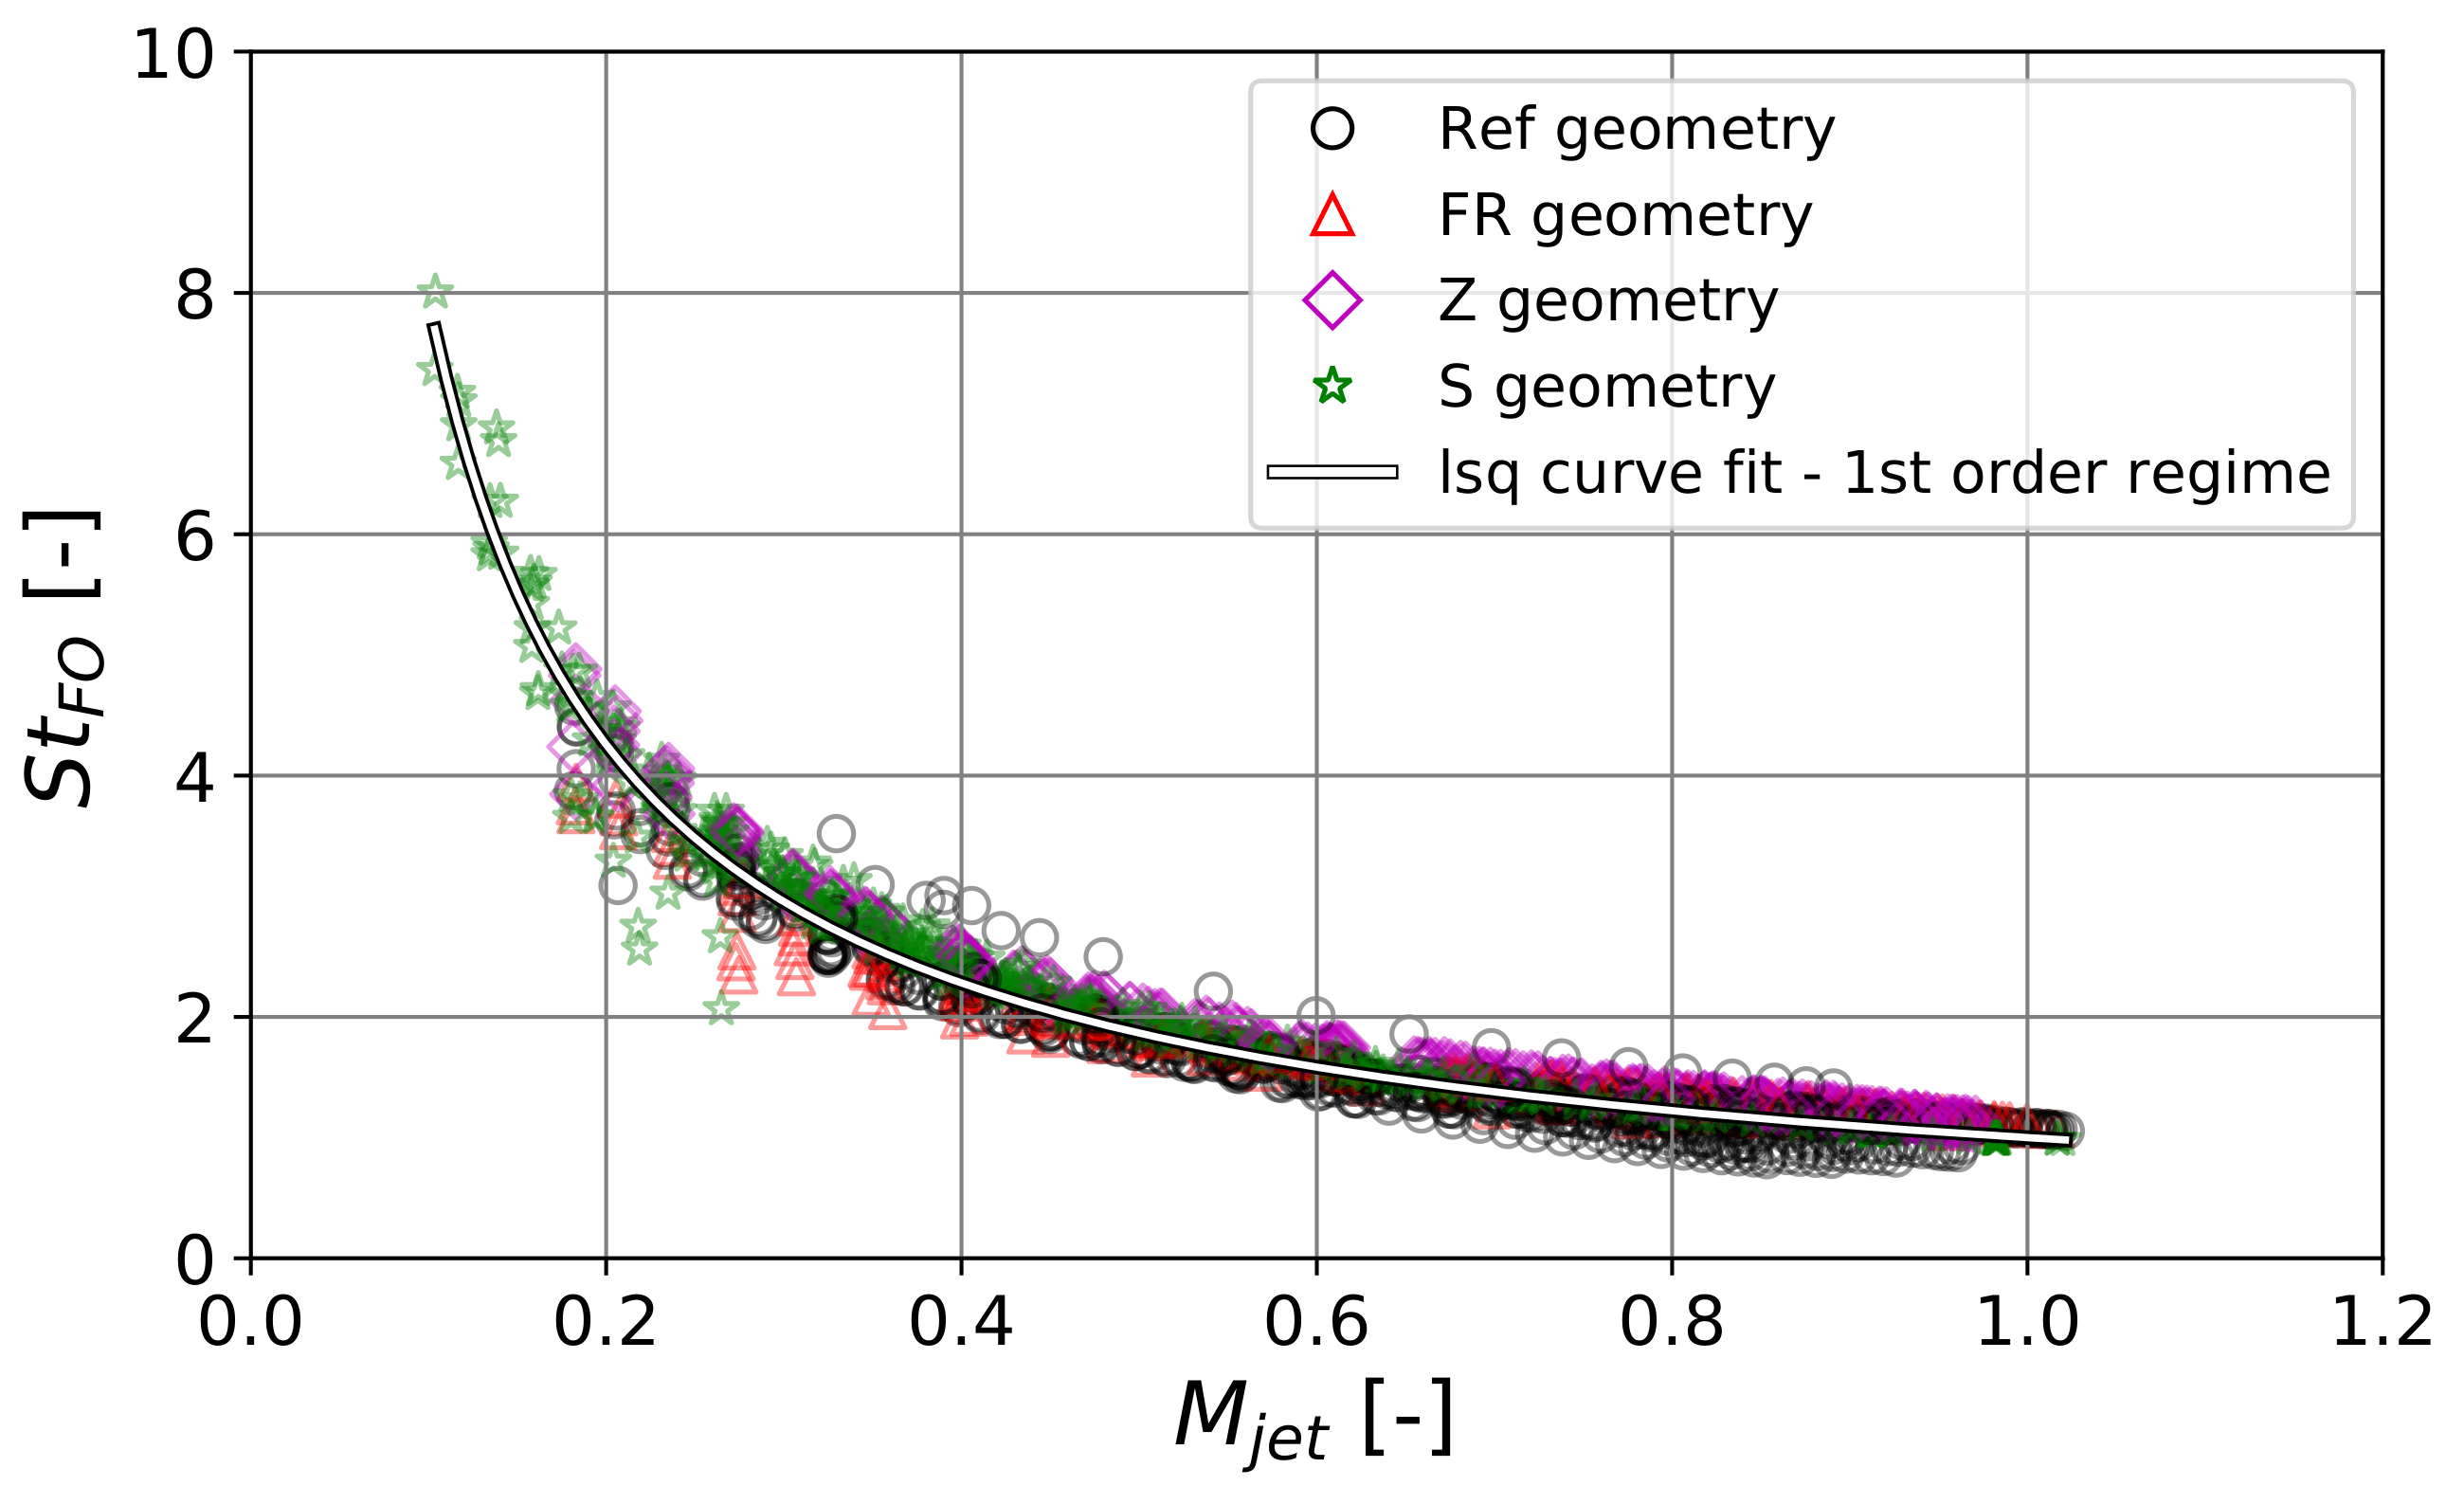
Three different FO-PJA geometries are investigated in Figure 14 (right). Like before, two feedback loop lengths are chosen with a constant diameter and throttling ratio. With regard to the long feedback loop , all three oscillators respond similar with the set mass flow rates. With the shorter feedback loop there are slight differences. The reference geometry has the lowest average frequencies over the mass flow range. The Z geometry starts at a higher frequency and matches the reference geometry at higher mass flow rates. The FR geometry starts at lower frequencies but has the highest when the mass flow rate increases. At a mass flow rate of g/s the frequency of all three devices remains constant. Overall, the geometry changes in the combination of feedback loop length and diameter have only a small influence on the switching frequency. The S geometry was not shown here because the throttling ratio did not match since the throttling device was the same, but the internal geometry was smaller. Nevertheless, the results of the S geometry are added with the results of the other geometries on the non-dimensional scatter plot shown in Figure 15.
It can be seen that all actuators combined with different feedback loop lengths, diameters, throttling ratios, and mass flow rates follow a common trend. All points are taken, and a least square fit is calculated. The Stouhal-number of the fundamental FO-PJA behavior can be estimated with:
The fundamental switching frequency that follows this non-dimensional trend will be called first-order regime.
4.2. Higher-Order Regimes
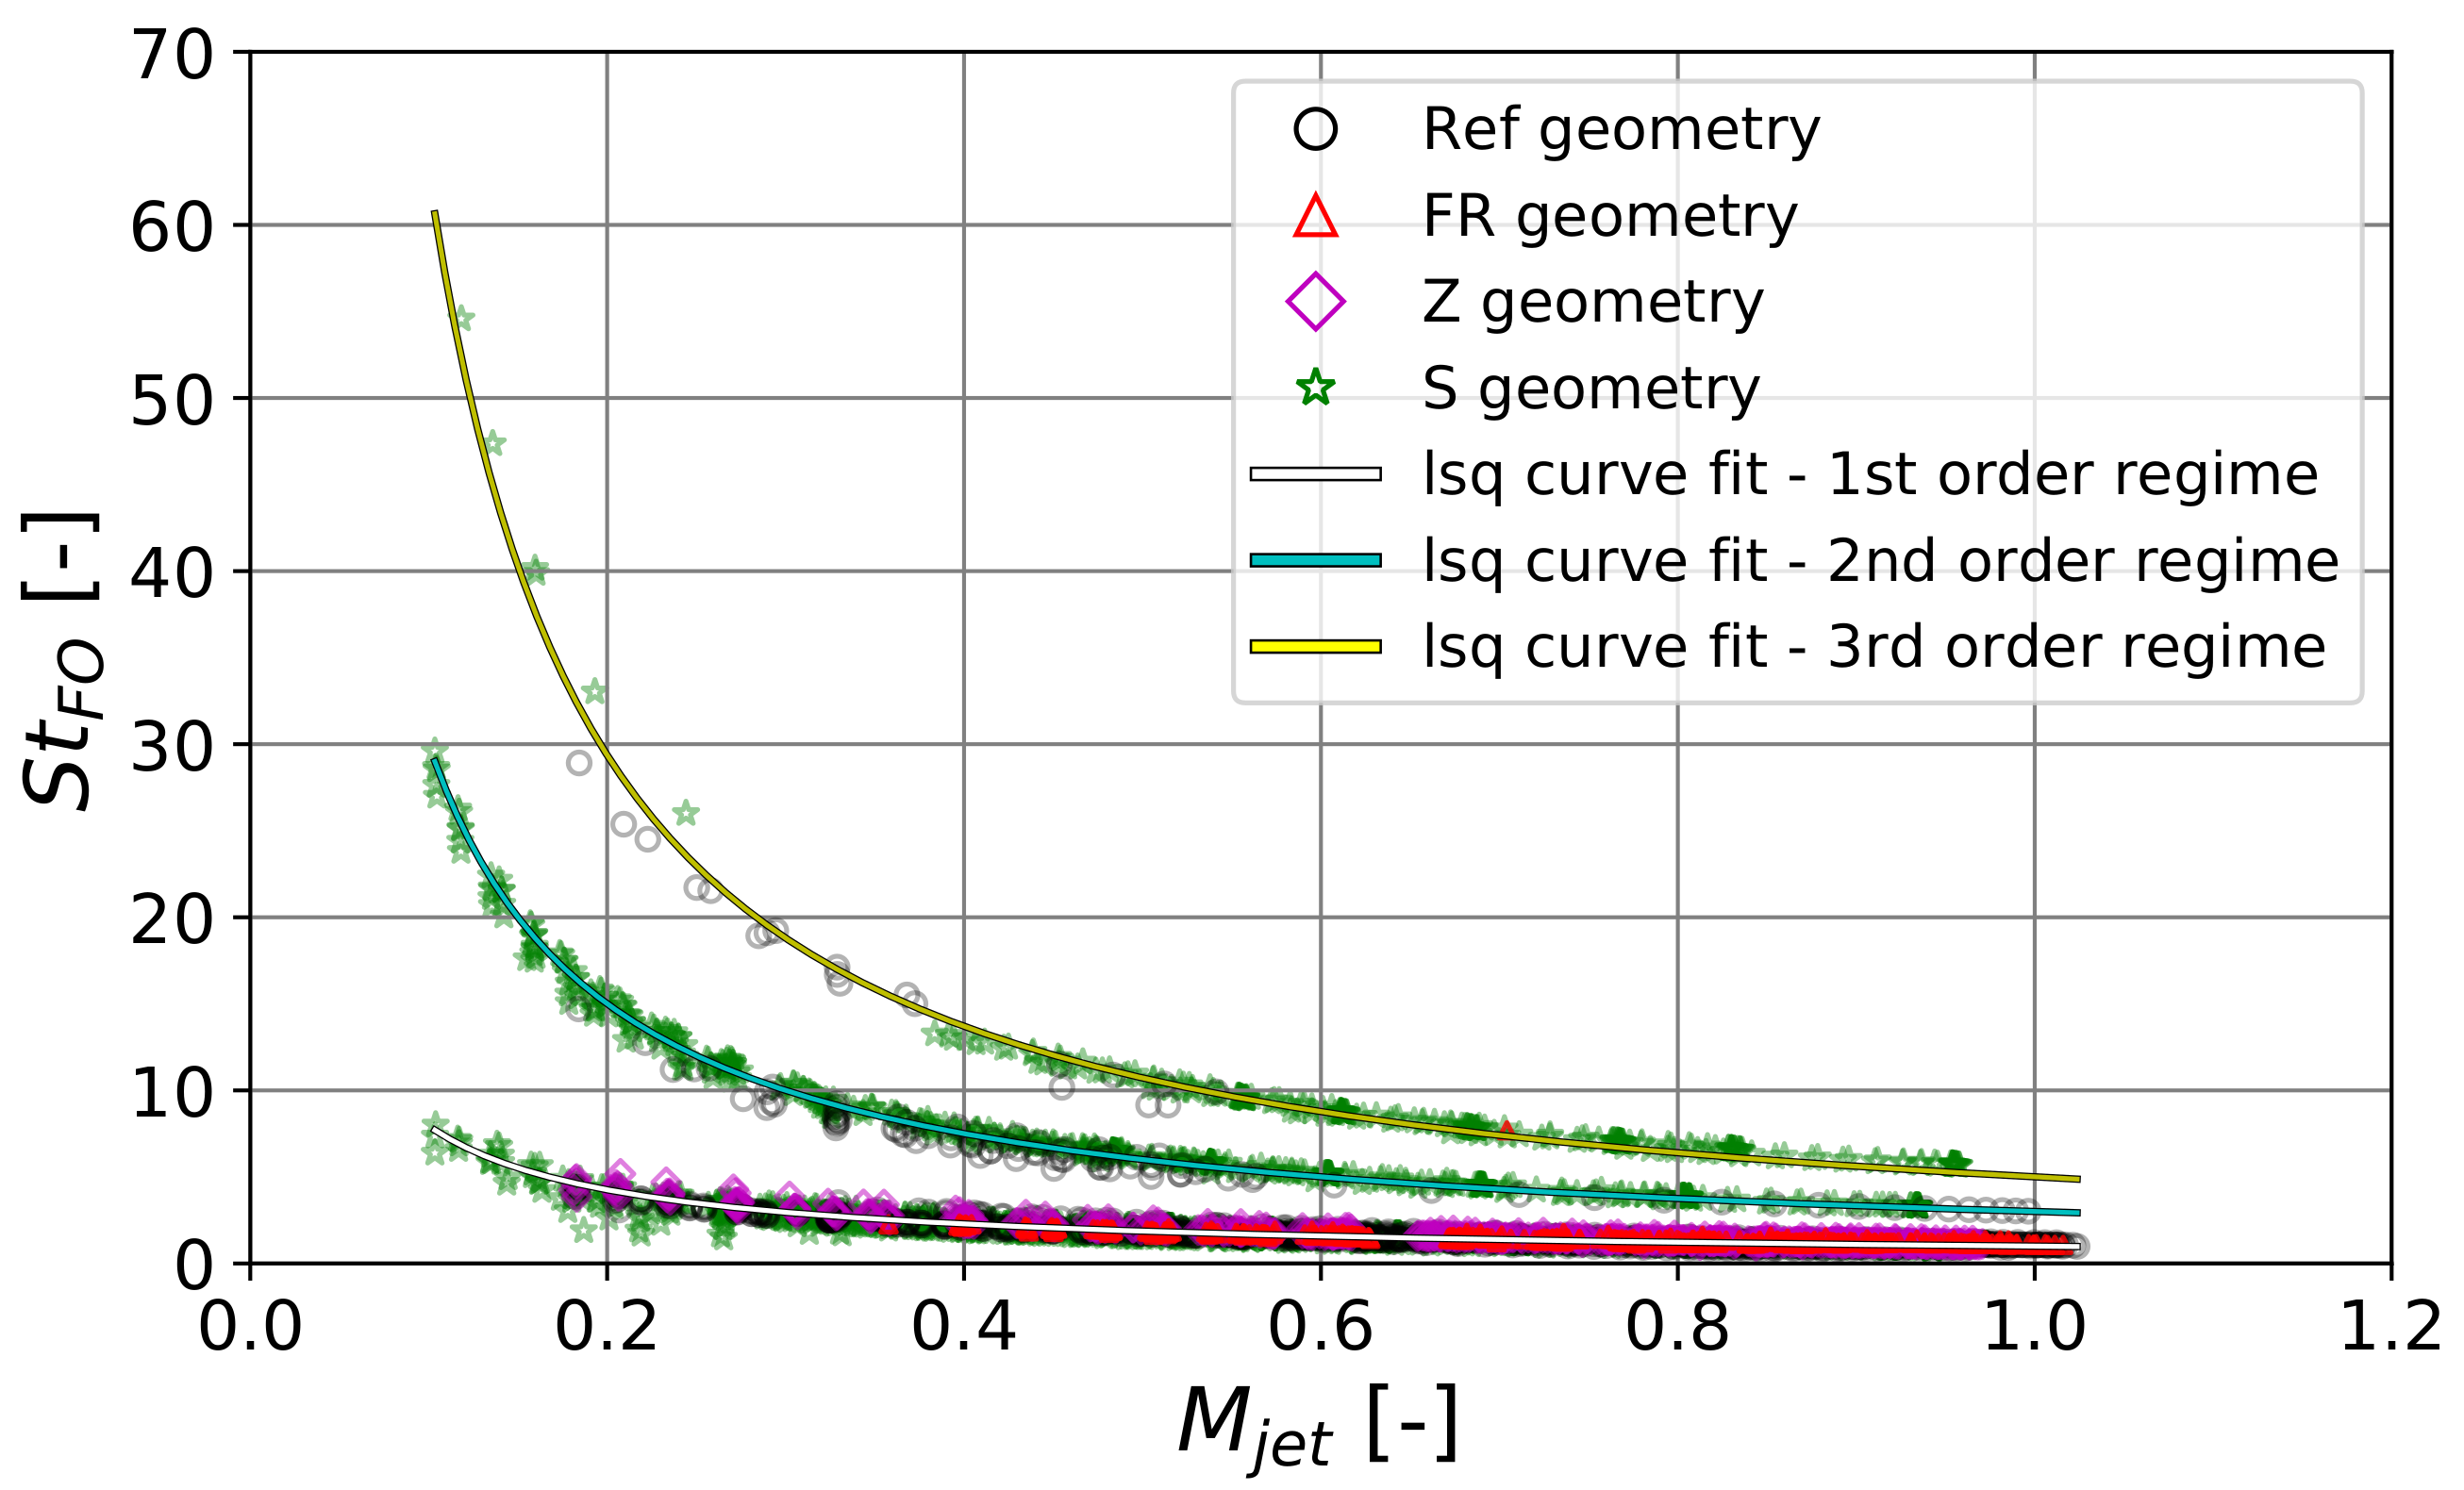
Recall Figure 11, where the mass flow range of g/s shows dominant frequencies that are significantly higher than the frequencies of g/s. The lower frequencies follow the trend of the first-order regime. As we will see in this section, the high frequencies follow specific trends as well.
When the data points from all variations (geometry, feedback length, diameter, throttling) are taken into account and the dimensionless quantities are calculated, the switching frequencies follow three different trends as shown in Figure 16.
The trend for the first-order regime (Equation (9)) was given in Section 4.1. Now, additional trends with higher frequencies can be identified. The results were taken separately and two curves for the higher-order regimes were approximated with least squares regression.
The switching frequency that follows the trend (Equation (10)) will be called second-order regime and the one that follows the trend (Equation (11)) will be called third-order regime. Both trends are referenced as higher-order regime. First, the second-order regime is investigated.
The data measured for the reference actuator with two different feedback loop lengths and variable throttling ratio are shown in Figure 17. On the left side, the feedback loop length is and the diameter is . Note that both values are low compared to the previous section where the FO-PJA frequency response was only in the first-order regime (lowest values there: and ). Here the frequency response to the increase of the mass flow rate is clearly divided in two ranges: a low-frequency range (the fundamental frequency) and a higher-frequency range (the higher-order regime). While the low frequency range is essentially constant with increasing mass flow rate, the high frequency increases at Hz per added g/s. Furthermore, it can be seen that the drop from high to low frequency occurs at a lower mass flow rate when the throttling ratio is increased.
On the right side in Figure 17 the feedback loop length is . Here, the low frequency follows the first-order trend with a frequency of Hz. In the higher-order regime the frequencies and frequency gradients are lower than on the left side. The frequency drops at lower mass flow rates from high to low values and the mass flow rates where the drop happens are closer together between the different throttling ratios.
Both plots indicate that in the first-order regime the frequency decreases with decreasing but increases in the second-order regime. Furthermore, with increasing feedback loop length, the difference between the first and second-order frequencies decreases, as well as the mass flow range where high frequencies occur.
So far, we have shown that in the first-order regime the frequency primarily is determined by the feedback loop length. The parameters feedback loop diameter, throttling ratio, and settling chamber geometry have less influence on the frequency in the measured range. We have also shown that frequencies that follow the second-order trend are generated with short feedback loops. The throttling ratio influences the position of the frequency drop and has more influence with decreasing feedback loop length.
Next, we want to find out which parameters produce frequencies in the third-order regime. Figure 18 shows data measured with two different feedback loop lengths and variable throttling ratio. On the left side the feedback loop length is and on the right side it is . In both cases the feedback loop diameter is . The throttling ratio range is . Note that while the values for diameter and throttling are small compared to the values used in the second-order regime (was and ) the values for feedback length are large (was respectively ).
Recall that when the throttling ratio is low, it means that the outlet nozzle is barely blocked (which simulates a large PJA outlet). We combine this with a small feedback diameter. Therefore, the pressure gradient at the feedback loop inlet is much higher than at the outlet and the jet will more likely flow towards the outlet.
The frequency response with increasing mass flow rate is shown in Figure 18. The trend differs from the results shown previously. Here the frequency jumps from low to high values with increasing mass flow rate. In the left plot in Figure 18, the lower frequency is at Hz which corresponds to the first-order regime. The jump from low to high frequency happens at g/s with a throttling ratio of . With lower throttling ratio the frequency jumps at g/s. The high frequency with Hz follows the trend of the second-order regime. In the right plot in Figure 18, the feedback loop length is roughly doubled to . Here two jumps happen. The oscillation starts in the first-order regime at a frequency level of Hz. At g/s the frequency jumps to Hz which is in the second-order regime for the feedback length of . Further increasing the mass flow rate induces a second jump at g/s to a frequency of Hz. This frequency follows the trend of the third-order regime.
To explain the process which causes the high-frequency regimes (second-order or third-order), a period of oscillation calculated by numerical simulation with a mass flow rate of g/s is shown in Figure 19. The first time step (1) shows the state when the power jet switches from left to right. In this time step, it can be seen that there is already a leading high-pressure wave in the right feedback loop which was generated during the last switching period. In (2), the power jet attaches to the right primary attachment wall (remember Figure 3) but not to the secondary attachment wall, which has the consequence that the jet does not turn towards the feedback loop inlet. In (3), the pressure wave from the previous switching period already reaches the control port. This pressure wave causes the power jet to detach from the primary attachment wall and a trailing pressure wave enters the feedback loop in (4). In (5), the power jet is pushed back to the left side and in (6) the next oscillation period begins.
Comparing the low-frequency switching process from Figure 12 to the high-frequency switching process shown in Figure 19, the main difference can be summarized. We have shown that in both cases there is a leading and a trailing pressure wave into the feedback loop. The time step when the leading pressure wave arrives at the control port is shown in Figure 20.
In the low-frequency case, the pressure at the left control port is higher (1.6 Pa) than the pressure at the right port (1.3 Pa), whereas in the high-frequency case the pressure at the right port is higher (1.3 Pa) than on the left (1.1 Pa). Furthermore, in the low-frequency case, the power jet is attached to the secondary attachment wall, thus following the outer wall of the settling chamber. In the high-frequency case, the jet does not attach to the secondary attachment wall, hence following the inner wall of the settling chamber.
The presence of the secondary wall attachment is significant for the switching mechanism, as it determines the length of the trailing pressure wave. When the power jet attaches to the outer wall, a long trailing pressure wave will be present in the feedback loop. This long pressure wave causes the high pressure at the opposite control port in the next oscillation period, thereby preventing the leading pressure wave to push the power jet to the other side. The consequence of this is that the switching process is delayed, and the oscillation is in the first-order regime. If the power jet adheres to the inner wall, a short trailing pressure wave will be present in the feedback loop and the oscillation will be in a higher-order regime.
5. Discussion
As explained in Section 2, the actuation frequency and the jet velocity are the most significant parameters regarding to flow separation control with pulsed jet actuation. In the past, either fast switching solenoid valves or FO-PJAs were used to generate a pulsed jet. With the previous knowledge, the design of FO-PJAs was an iterative process. Specifically, the actuator outlet nozzles were designed first, and the size and shape of the oscillator geometry was adjusted to fit a target frequency. The results presented here can now be used in the initial FO-PJA design process.
The design of an FO-PJA starts with the choice of exit velocity and switching frequency since these parameters are relevant for the flow physics of separation control. Depending on the size of the exit slot, the jet velocity translates into a specific mass flow rate. If the required frequency is low while simultaneously the mass flow rate is low, the FO-PJA must operate in the first-order regime over the complete required mass flow range. Therefore, a long feedback loop with a large diameter will be effective.
If the frequency needs to be high over a large mass flow range, an FO-PJA operating in the second- or third-order regime can be useful. By designing a relatively large outlet nozzle (small ) and a feedback loop with a small diameter, operation in a higher order regime can be selected. Depending on the length of the feedback loop, the FO-PJA oscillates in the second-order regime (short feedback) or in the third-order regime (long feedback).
In addition to the size of the feedback loop, the frequency regime may be controlled by redesigning the internal oscillator geometry. The main reason for the occurrence of the high frequencies is the flow separation of the power jet from the secondary attachment wall. There are several ways to redesign the FO-PJA shape and thereby improve the technology. Note that these are suggestions that need to be reviewed in the future. To avoid flow separation, diffuser design techniques could be applied to reshape the primary and secondary attachment walls. Another possible solution could be to swap the FO-PJA outlet and feedback inlet channels in order to be less dependent on the secondary wall attachment. Furthermore, since the power jet separation at the secondary attachment wall is more or less a 2D phenomenon, the feedback splitter could also be rotated by 90 degrees. The power jet mainly oscillates in the xy-plane (see Figure 4). If the feedback splitter would be rotated by 90 degrees, it would separate the outlet nozzle from the feedback inlet in the xy-plane. Thereby, the flow separation could have minor influence.
Another point worth discussing is the influence of three-dimensional folding of the FO-PJA geometry. In Section 3, it was alleged that the difference between a 2D plain and a 3D folded feedback loop would not significantly affect the two primary design objectives, switching frequency, and outlet velocity. Therefore, we reviewed the results from the FO-PJA geometry used in the VTP measurements (see Section 2.3). The 3D folded FO-PJA had a feedback loop length of m. The estimation using only the speed of sound and the feedback loop length yields a switching frequency of Hz. By using the non-dimensional Equation (9), a switching frequency of Hz is calculated. The actual measured frequency was Hz [28]. Furthermore the FO-PJA used in the VTP experiments also had a mass flow range where high switching frequencies ( Hz) were dominant. With the non-dimensional Equation (10), the estimated frequency would be Hz. In [28], there were also larger FO-PJAs implemented in the VTP model. The first-order frequency in that case was Hz while the second-order frequency was Hz. The feedback loop length of the used FO-PJA was m. The estimate with Equation (9) yields a first-order frequency of Hz, respectively Equation (10) yields a second-order frequency of Hz. In both cases (small and large FO-PJA) the estimation of the switching frequency is close to the measured values. Since the non-dimensional equations were created with the curve fits of the data of this two-dimensional study, but still deliver reliable frequency predictions for the 3D FO-PJAs, we conclude that the influence of feedback loop folding can be neglected in the initial FO-PJA design process. Nevertheless, feedback loop folding may influence secondary objectives such as pressure loss, signal quality, and jet uniformity, which should be investigated in the future.
6. Conclusions
In this study, the internal dynamics and the parameters influencing the frequency of pulsed jet actuators based on fluidic oscillators were investigated. It was shown that there is a fundamental regime where the oscillation frequency is mainly driven by the feedback loop length. Additionally, there are higher order regimes where the oscillation frequency is significantly increased.
The CFD investigation revealed that there are leading and trailing pressure waves in the oscillators feedback loops. The length of the trailing pressure wave determines in which frequency regime the FO-PJA oscillates. Furthermore, the presence of the secondary wall attachment is the crucial factor for the length of the trailing pressure wave. When the power jet follows the secondary attachment wall, the switching frequency is in the fundamental regime. On the other hand, the frequency is in a higher order regime when the power jet is detached from the secondary attachment wall. Since the influence of the secondary attachment wall on the frequency regime is now known, the shape of the oscillator can be adapted to the requirements of the flow control application. It remains for future studies to analyze how the secondary attachment wall and the shape of the settling chamber can be redesigned in order to obtain a desired switching characteristic.
Furthermore, the influence of various geometric parameters on the switching frequency was investigated. It was shown that in the fundamental regime the feedback loop length has the largest impact on the dominant frequency. The throttling ratio, the feedback diameter, and the settling chamber geometry have a smaller influence on the switching frequency in the range of the examined variations.
In the investigations on the higher-order regimes, we found that short and thin feedback loops will contribute to the oscillation that follows the second-order regime. Furthermore, we have seen that relatively long and thin feedback loops in combination with a very low throttling ratio favor frequencies in the third-order regime. The exact values for the transition between the frequency regimes could not be analyzed with the available data. Here, numerical simulations with an adaptive geometry may provide useful results and extend the scope of this work.
Finally, we created a non-dimensional equation for each frequency regime based on the measured characteristics that can now be used in the initial design process of FO-PJAs.
Author Contributions
Conceptualization, S.L. and J.W.; methodology, S.L. and C.E.; software, S.L. and C.E.; validation, S.L., C.E. and J.W.; formal analysis, S.L.; investigation, S.L. and C.E.; resources, J.W.; data curation, S.L.; writing—original draft preparation, S.L.; writing—review and editing, J.W.; visualization, S.L. and C.E.; supervision, J.W.; project administration, J.W. All authors have read and agreed to the published version of the manuscript.
Funding
Research funded by Bundesministerium für Wirtschaft und Energie; performed within the framework of the Federal Aviation Research Programme (LuFo V-2).
Institutional Review Board Statement
Not applicable.
Informed Consent Statement
Not applicable.
Data Availability Statement
The data presented in this study are available on request from the corresponding author.
Acknowledgments
The results presented herein have been achieved in the collaborative research project AsSaM (“Autoritätssteigerung von Steuerflächen durch aktive Maßnahmen”)—subproject FluSAS (“Fluidische Schlitzaktuatoren zur Autoritätssteigerung von Steuerflächen”). Furthermore, we would like to thank Matthias Bauer (NAVASTO GmbH) and Marcel Staats for fruitful discussions and their support.
Conflicts of Interest
The authors declare no conflict of interest. The funders had no role in the design of the study; in the collection, analyses, or interpretation of data; in the writing of the manuscript, or in the decision to publish the results
Abbreviations
The following abbreviations are used in this manuscript:
| 2D | two-dimensional |
| 3D | three-dimensional |
| AFC | active flow control |
| BMCM | company name, www.bmcm.de |
| CFD | computational fluid dynamics |
| FESTO | company name, www.festo.com |
| FO | fluidic oscillators |
| FO-PJA | fluidic oscillator based pulsed jet actuator |
| KULITE | company name, www.kulite.com |
| MDPI | Multidisciplinary Digital Publishing Institute |
| PJA | pulsed jet actuators / actuation |
| PSD | power spectral density |
| TU Berlin | Technische Universität Berlin |
| URANS | unsteady-Reynolds-averaged Navier–Stokes |
| VPCF | proportional flow control valve |
| VTP | vertical tail plane |
Nomenclature
| unblocked cross-section area of one outlet nozzle, m | |
| cross-section area of the power jet nozzle, m | |
| equivalent power jet diameter; , m | |
| non-dimensional feedback loop diameter; | |
| feedback loop diameter, m | |
| reduced frequency; | |
| excitation frequency, Hz | |
| switching frequency of the fluidic oscillator, Hz | |
| experimental measured switching frequency for CFD validation, Hz | |
| sampling frequency, Hz | |
| Full Scale, specified uncertainty percentage of the full scale range | |
| Full Scale Output–Best Fit Straight Line, specifies sensor accuracy/non-linearity | |
| feedback ratio, ratio between channel to outlet nozzle and the feedback loop inlet | |
| non-dimensional feedback loop length; | |
| feedback loop length, m | |
| distance between excitation location and trailing edge of the aerodynamic surface, m | |
| mass flow rate, kg/s | |
| jet Mach number; | |
| p | pressure, Pa |
| ideal gas constant, | |
| Strouhal number | |
| internal FO-PJA Strouhal number | |
| internal FO-PJA Strouhal number for the first-order regime | |
| internal FO-PJA Strouhal number for the second-order regime | |
| internal FO-PJA Strouhal number for the third-order regime | |
| throttling ratio; | |
| T | temperature; K |
| ambient temperature; K | |
| free-stream velocity, m/s | |
| non-dimensional feedback loop volume; | |
| outlet velocity, m/s | |
| non-dimensional wall distance | |
| difference between measured results | |
| isentropic exponent | |
| Mach number corrected jet density, kg/m | |
| confidence interval, of all values are within the specified range |
References
- Cattafesta, L.N.; Sheplak, M. Actuators for Active Flow Control. Annu. Rev. Fluid Mech. 2011, 43, 247–272. [Google Scholar] [CrossRef] [Green Version]
- Gbadebo, S.A.; Cumpsty, N.A.; Hynes, T.P. Control of three-dimensional separations in axial compressors by tailored boundary layer suction. J. Turbomach. 2008, 130, 011004. [Google Scholar] [CrossRef]
- Radespiel, R.; Burnazzi, M.; Casper, M.; Scholz, P. Active flow control for high lift with steady blowing. Aeronaut. J. 2016, 120, 171–200. [Google Scholar] [CrossRef] [Green Version]
- Seifert, A.; Darabi, A.; Wygnanski, I. Delay of Airfoil Stall by Periodic Excitation. J. Aircr. 1996, 33, 691–698. [Google Scholar] [CrossRef]
- Darabi, A.; Wygnanski, I. Active management of naturally separated flow over a solid surface. Part 1. The forced reattachment process. J. Fluid Mech. 2004, 510, 105–129. [Google Scholar] [CrossRef]
- Greenblatt, D.; Wygnanski, I.J. The control of flow separation by periodic excitation. Prog. Aerosp. Sci. 2000, 36, 487–545. [Google Scholar] [CrossRef]
- Glezer, A.; Amitay, M. Synthetic Jets. Annu. Rev. Fluid Mech. 2002, 34, 503–529. [Google Scholar] [CrossRef]
- Woszidlo, R.; Ostermann, F.; Schmidt, H.J. Fundamental Properties of Fluidic Oscillators for Flow Control Applications. AIAA J. 2019, 57, 978–992. [Google Scholar] [CrossRef]
- Petz, R.; Nitsche, W. Active Separation Control on the Flap of a Two-Dimensional Generic High-Lift Configuration. J. Aircr. 2007, 44, 865–874. [Google Scholar] [CrossRef]
- Becker, R.; King, R.; Petz, R.; Nitsche, W. Adaptive Closed-Loop Separation Control on a High-Lift Configuration Using Extremum Seeking. AIAA J. 2007, 45, 1382–1392. [Google Scholar] [CrossRef]
- Grund, T.; Nitsche, W. Wind Tunnel and Flight Tests with Active Flow Control on a S10 Glider Configuration. In Notes on Numerical Fluid Mechanics and Multidisciplinary Design; Springer: Berlin/Heidelberg, Germany, 2013; pp. 117–124. [Google Scholar] [CrossRef]
- Spyropoulos, C.E. A Sonic Oscillator. In Proceedings of the Fluid Amplification Symposium; U.S. Army Materiel Command, Harry Diamont Laboratories: Washington, DC, USA, 1964; p. 27. [Google Scholar]
- Warren, R.W. Fluid Oscillator. U.S. Patent US3016066A, 22 January 1960. [Google Scholar]
- Warren, R.W. Negative Feedback Oscillator. U.S. Patent US3158166A, 7 August 1962. [Google Scholar]
- Cerretelli, C.; Kirtley, K. Boundary Layer Separation Control with Fluidic Oscillators. J. Turbomach. 2009, 131, 041001. [Google Scholar] [CrossRef]
- Gregory, J.; Tomac, M.N. A Review of Fluidic Oscillator Development and Application for Flow Control. In Proceedings of the 43rd Fluid Dynamics Conference, San Diego, CA, USA, 24–27 June 2013. [Google Scholar] [CrossRef]
- Seifert, A.; Bachar, T.; Wygnanski, I.; Koss, D.; Shepshelovich, M. Oscillatory blowing, a tool to delay boundary layer separation. In Proceedings of the 31st Aerospace Sciences Meeting, Reno, NV, USA, 11–14 January 1993; Volume 31. [Google Scholar] [CrossRef]
- Arwatz, G.; Fono, I.; Seifert, A. Suction and Oscillatory Blowing Actuator Modeling and Validation. AIAA J. 2008, 46, 1107–1117. [Google Scholar] [CrossRef]
- Tesař, V.; Hung, C.H.; Zimmerman, W.B. No-moving-part hybrid-synthetic jet actuator. Sensors Actuators A Phys. 2006, 125, 159–169. [Google Scholar] [CrossRef] [Green Version]
- Raghu, S. Fluidic oscillators for flow control. Exp. Fluids 2013, 54. [Google Scholar] [CrossRef]
- Tesař, V.; Zhong, S.; Rasheed, F. New Fluidic-Oscillator Concept for Flow-Separation Control. AIAA J. 2013, 51, 397–405. [Google Scholar] [CrossRef]
- Desai, P. A Fluidic Oscillator Based on a New Mechanism for Microbubble Generation and Developing Microbubble Stripping for Separation Phenomena. Ph.D. Thesis, University of Sheffield, Sheffield, UK, 2018. [Google Scholar]
- Zimmerman, W.; Desai, P. Fluidic Oscilators. WO Patent 2020208250, 11 April 2020. [Google Scholar]
- Bauer, M.; Lohse, J.; Haucke, F.; Nitsche, W. High-Lift Performance Investigation of a Two-Element Configuration with a Two-Stage Actuator System. AIAA J. 2014, 52, 1307–1313. [Google Scholar] [CrossRef]
- Bauer, M.; Grund, T.; Nitsche, W. Experiments on Active Drag Reduction on a Complex Outer Wing Model. AIAA J. 2015, 53, 1774–1783. [Google Scholar] [CrossRef]
- Schlösser, P.; Bauer, M. Design of a pulsed jet actuator for separation control. CEAS Aeronaut. J. 2020, 11, 805–812. [Google Scholar] [CrossRef]
- Schloesser, P.; Soudakov, V.; Bauer, M.; Wild, J. Active Separation Control at the Pylon-Wing Junction of a Real-Scale Model. AIAA J. 2019, 57, 132–141. [Google Scholar] [CrossRef] [Green Version]
- Löffler, S.; Staats, M.; Grund, T.; Weiss, J. Increasing the Effectiveness of a Vertical Stabilizer by Combining Pulsed Jet Actuation at the Leading Edge and the Rudder Hinge Line. In Proceedings of the AIAA Aviation 2018 Forum, Atlanta, GA, USA, 25–29 June 2018. AIAA Paper 2018-2854. [Google Scholar]
- Löffler, S.; Rohlfs, L.; Staats, M.; Weiss, J. Flow Field Investigation on a Vertical Stabilizer with Pulsed Jet Actuation by means of PIV Measurements. In Proceedings of the AIAA Aviation 2019 Forum, Dallas, TX, USA, 17–21 June 2019. [Google Scholar] [CrossRef]
- Rohlfs, L.; Löffler, S.; Weiss, J. Investigating the Effect of Pulsed Jet Actuation at the Rudder Hinge Line of a Vertical Stabilizer with Phase-Locked PIV. In Proceedings of the AIAA Scitech 2020 Forum, Orlando, FL, USA, 6–10 January 2020. [Google Scholar] [CrossRef]
- Bauer, M. Design and Application of a Fluidic Actuator System for High Lift Flow Control. Ph.D. Thesis, Technische Universität Berlin, Berlin, Germany, 2015. [Google Scholar]
- Löffler, S.; Weiss, J. Benefits of Applying Pulsed Jet Actuation on a Vertical Stabilizer. In Fundamentals of High Lift for Future Civil Aircraft: Contributions to the Final Symposium of the Collaborative Research Center 880, December 17–18, 2019, Braunschweig, Germany; Radespiel, R., Semaan, R., Eds.; Springer International Publishing: Cham, Switherland, 2021; pp. 123–133. [Google Scholar] [CrossRef]
- Staats, M.; Löffler, S.; Ebert, C.; Grund, T.; Weiss, J. A Fluidic Device for Active Flow Control: Simulation vs. Experiment with Emphasis on Application. In Proceedings of the AIAA Aviation Forum, Atlanta, GA, USA, 25–29 June 2018. AIAA Paper 2018-3336. [Google Scholar]
- Hecklau, M.; Salazar, D.P.; Nitsche, W. Influence of the Actuator Jet Angle on the Reattachment Process with Pulsed Excitation. In New Results in Numerical and Experimental Fluid Mechanics VIII; Springer: Berlin/Heidelberg, Germany, 2013; Chapter 18; pp. 143–150. [Google Scholar]
- Mohammed-Taifour, A.; Weiss, J. Periodic forcing of a large turbulent separation bubble. J. Fluid Mech. 2021, 915, A24. [Google Scholar] [CrossRef]
- Steinfurth, B.; Weiss, J. Vortex rings produced by non-parallel planar starting jets. J. Fluid Mech. 2020, 903, A16. [Google Scholar] [CrossRef]
- Shariff, K.; Leonard, A. Vortex Rings. Annu. Rev. Fluid Mech. 1992, 24, 235–279. [Google Scholar] [CrossRef]
- Sau, R.; Mahesh, K. Optimization of pulsed jets in crossflow. J. Fluid Mech. 2010, 653, 365–390. [Google Scholar] [CrossRef] [Green Version]
- Kroll, H. Experimentelle Untersuchung von Ringwirbeln und Deren Interaktion mit Einer Ebenen Prallplatte bei überlagerter Querströmung. Ph.D. Thesis, Technische Universität Berlin, Berlin, Germany, 2016. [Google Scholar]
- Turner, J.S. Buoyancy Effects in Fluids. In Cambridge Monographs on Mechanics; Cambridge University Press: Cambridge, UK, 1973. [Google Scholar] [CrossRef]
- Kirshner, J.M.; Katz, S. Chapter 10—The Bistable Switch. In Design Theory of Fluidic Components; Kirshner, J.M., Katz, S., Eds.; Academic Press: Cambridge, MA, USA, 1975; pp. 382–424. [Google Scholar] [CrossRef]
- Tesař, V. Taxonomic trees of fluidic oscillators. EPJ Web of Conferences. EDP Sci. 2017, 143, 02128. [Google Scholar]
- Cerretelli, C.; Gharaibah, E. An Experimental and Numerical Investigation on Fluidic Oscillators For Flow Control. In Proceedings of the 37th AIAA Fluid Dynamics Conference and Exhibit, Miami, FL, USA, 25–28 June 2007. [Google Scholar] [CrossRef]
Figure 1.
Simplified 2D sketch of the PJA working principle.

Figure 2.
Sketch of the VTP wind-tunnel model with multiple FO-PJA elements.

Figure 3.
Definitions used for parts of an FO-PJA geometry.

Figure 4.
Family of oscillators investigated in the experiments.

Figure 5.
Variations of feedback loop and throttling.

Figure 6.
Feedback loop length and positions of pressure measurement ports.

Figure 7.
(top) Power spectral density of the pressure signal in one settling chamber in the FO-PJA and (bottom) a section of the measured time-series.
Figure 7.
(top) Power spectral density of the pressure signal in one settling chamber in the FO-PJA and (bottom) a section of the measured time-series.

Figure 8.
Computational domain and defined boundary patches.

Figure 9.
Grid independence study and experimental benchmark.

Figure 10.
Relation between mass flow rate, outlet velocity and throttling ratio for different FO-PJA devices.
Figure 10.
Relation between mass flow rate, outlet velocity and throttling ratio for different FO-PJA devices.

Figure 11.
Comparison of experimental and numerical results of FO-PJA frequency response with increasing mass flow rate (left) and corresponding PSD of most important points (right).
Figure 11.
Comparison of experimental and numerical results of FO-PJA frequency response with increasing mass flow rate (left) and corresponding PSD of most important points (right).

Figure 12.
FO-PJA switching process, fundamental regime, is the phase angle during one oscillation.

Figure 13.
Variation of feedback loop length (left) and feedback loop diameter (right) using the reference geometry with a constant throttling ratio of .
Figure 13.
Variation of feedback loop length (left) and feedback loop diameter (right) using the reference geometry with a constant throttling ratio of .

Figure 14.
Variation of throttling ratio using the reference geometry (left) and variation of settling chamber geometry with a constant throttling ratio of and feedback loop diameter (right).
Figure 14.
Variation of throttling ratio using the reference geometry (left) and variation of settling chamber geometry with a constant throttling ratio of and feedback loop diameter (right).

Figure 15.
Non-dimensional characteristic of the used FO-PJA family, first-order regime.

Figure 16.
Non-dimensional characteristic of the FO-PJA family, first-, second- and third-order regime.
Figure 16.
Non-dimensional characteristic of the FO-PJA family, first-, second- and third-order regime.

Figure 17.
Variation of throttling ratio using the reference geometry, a constant feedback loop diameter. and feedback loop length of (left) respectively (right).
Figure 17.
Variation of throttling ratio using the reference geometry, a constant feedback loop diameter. and feedback loop length of (left) respectively (right).

Figure 18.
Variation of throttling ratio using the S geometry, a constant, and feedback loop diameter and feedback loop length of (left) respectively (right).
Figure 18.
Variation of throttling ratio using the S geometry, a constant, and feedback loop diameter and feedback loop length of (left) respectively (right).

Figure 19.
FO-PJA switching process, higher-order regime, is the phase angle during one oscillation.
Figure 19.
FO-PJA switching process, higher-order regime, is the phase angle during one oscillation.

Figure 20.
Comparison of the low-frequency switching (left) and high-frequency switching (right).


Table 1.
Main dimensions of the oscillator geometries.
| Ref | FR | Z | S | |
|---|---|---|---|---|
| power jet nozzle cross-section area [] | ||||
| max. settling chamber cross-section area [] | 53.67 | 53.67 | 96.27 | 23.85 |
| feedback ratio [-] | 50/50 | 80/20 | 50/50 | 50/50 |
| outlet nozzle cross-section area [] |
Table 2.
Initial and boundary conditions of the numerical simulations.
| Inlet | Outlet | Walls | |
|---|---|---|---|
| U | flowRateInletVelocity | zeroGradient | fixedValue |
| massFlowRate constant | value uniform | ||
| 0.002 [kg/s] | [m/s] | ||
| p | zeroGradient | fixedValue | zeroGradient |
| value uniform 101325 [Pa] | |||
| T | fixedValue | zeroGradient | zeroGradient |
| value uniform 293 [K] | |||
| fixedValue | zeroGradient | nutLowReWallFunction | |
| value uniform 0.0011 [m/s] |
Table 3.
Numerical schemes and methods used for the simulations.
| Schemes/Methods | Specification |
|---|---|
| ddtSchemes | Euler |
| gradSchemes | Gauss linear |
| divSchemes | Gauss lienear |
| Gauss limitedLinear 1 | |
| laplacianSchemes | Gauss linear corrected |
| interpolationSchemes | linear |
| snGradSchemes | corrected |
| wallDist | meshWave |
Publisher’s Note: MDPI stays neutral with regard to jurisdictional claims in published maps and institutional affiliations. |
© 2021 by the authors. Licensee MDPI, Basel, Switzerland. This article is an open access article distributed under the terms and conditions of the Creative Commons Attribution (CC BY) license (https://creativecommons.org/licenses/by/4.0/).
Share and Cite
MDPI and ACS Style
Löffler, S.; Ebert, C.; Weiss, J. Fluidic-Oscillator-Based Pulsed Jet Actuators for Flow Separation Control. Fluids 2021, 6, 166. https://0-doi-org.brum.beds.ac.uk/10.3390/fluids6040166
AMA Style
Löffler S, Ebert C, Weiss J. Fluidic-Oscillator-Based Pulsed Jet Actuators for Flow Separation Control. Fluids. 2021; 6(4):166. https://0-doi-org.brum.beds.ac.uk/10.3390/fluids6040166
Chicago/Turabian StyleLöffler, Stephan, Carola Ebert, and Julien Weiss. 2021. "Fluidic-Oscillator-Based Pulsed Jet Actuators for Flow Separation Control" Fluids 6, no. 4: 166. https://0-doi-org.brum.beds.ac.uk/10.3390/fluids6040166