
Free Stream Behavior of Hydrogen Released from a Fluidic Oscillating Nozzle
by
 , , , ,
Anja Fink
1,* ,
,
Oliver Nett
1,
Simon Schmidt
2,
Oliver Krüger
2,
Thomas Ebert
3,
Alexander Trottner
1 and
Bojan Jander
1 1
Chair of Powertrain Technologies, Technische Universität Berlin, Carnotstr. 1A, 10587 Berlin, Germany
2
FDX Fluid Dynamix GmbH, Rohrdamm 88, 13629 Berlin, Germany
3
KEYOU GmbH, Arnulfstraße 60, 80335 München, Germany
*
Author to whom correspondence should be addressed.
Fluids 2021, 6(7), 245; https://0-doi-org.brum.beds.ac.uk/10.3390/fluids6070245
Submission received: 28 April 2021
/
Revised: 15 June 2021
/
Accepted: 22 June 2021
/
Published: 5 July 2021
(This article belongs to the Special Issue Fluidic Oscillators-Devices and Applications)
Abstract
:The H2 internal combustion engine (ICE) is a key technology for complete decarbonization of the transport sector. To match or exceed the power density of conventional combustion engines, H2 direct injection (DI) is essential. Therefore, new injector concepts that meet the requirements of a H2 operation have to be developed. The macroscopic free stream behavior of H2 released from an innovative fluidic oscillating nozzle is investigated and compared with that of a conventional multi-hole nozzle. This work consists of H2 flow measurements and injection tests in a constant volume chamber using the Schlieren method and is accompanied by a LES simulation. The results show that an oscillating H2 free stream has a higher penetration velocity than the individual jets of a multi-hole nozzle. This behavior can be used to inject H2 far into the combustion chamber in the vertical direction while the piston is still near bottom dead center. As soon as the oscillation of the H2 free stream starts, the spray angle increases and therefore H2 is also distributed in the horizontal direction. In this phase of the injection process, spray angles comparable to those of a multi-hole nozzle are achieved. This behavior has a positive effect on H2 homogenization, which is desirable for the combustion process.
1. Introduction
It is no longer just passenger cars and light commercial vehicles that are subject to ever stricter CO2 limits. In the heavy commercial vehicle sector as well, CO2 emissions have now become a global political issue. Negotiators from EU member states, the European Parliament, and the EU Commission have agreed on the first climate protection standards based on 2019 values: 15% less CO2 by 2025 and 30% less by 2030. Manufacturers who do not comply with these requirements are faced with severe penalties [1]. Additionally, the EU has agreed on a proposal for a regulation setting CO2 emission standards for new heavy-duty vehicles [2]. Accordingly, a heavy-duty vehicle is considered emission free if it has no internal combustion engine or emits less than 1 gCO2/kWh (or less than 1 g/km). This results in three major technology approaches that fulfill this criterion: battery-electric drive concepts, fuel-cell drives, and hydrogen combustion engines. Due to its favorable total cost of ownership (TCO) balance [3], its high robustness over an entire working life, and its high power density, the hydrogen combustion engine offers a promising solution.
The performance of hydrogen combustion engines with intake manifold injection is limited due to the effect of air displacement by the injected fuel. This pushes conventional turbocharging systems to their limits, especially for lean combustion concepts. Furthermore, the injection of highly flammable hydrogen outside the combustion chamber poses the risk of backfiring, especially in the upper load range [4]. The high specific output required for heavy-duty, long-distance transport applications can only be achieved by direct-injecting systems.
The development of an injector concept for direct-injecting hydrogen combustion processes requires a compromise between functional and design criteria, some of which interact strongly. With regard to the vehicle range, a low- or medium-pressure concept with system pressures below 50 bar is a sensible approach without taking energy-intensive hydrogen post-compression into account. Assuming that injection starts after the intake valves have closed, there is a relatively narrow time window available for fuel injection. This results in a further increase in the effective injector flow cross section, which is already large in hydrogen injectors. At these high flow rates, outward-opening nozzles prove to be advantageous. With regard to sealing, large cone angles are needed, which is disadvantageous in terms of jet penetration behavior and mixture formation if no additional nozzle caps or masking is used. The design of innovative nozzle geometries is the key to achieving the required high mixture homogenization. One possibility is the OsciJet nozzle, which is designed for high oscillation frequencies of more than 4 kHz. It oscillates several times per injection process. Therefore, the mixing of hydrogen and fresh gas should be maximized [5,6].
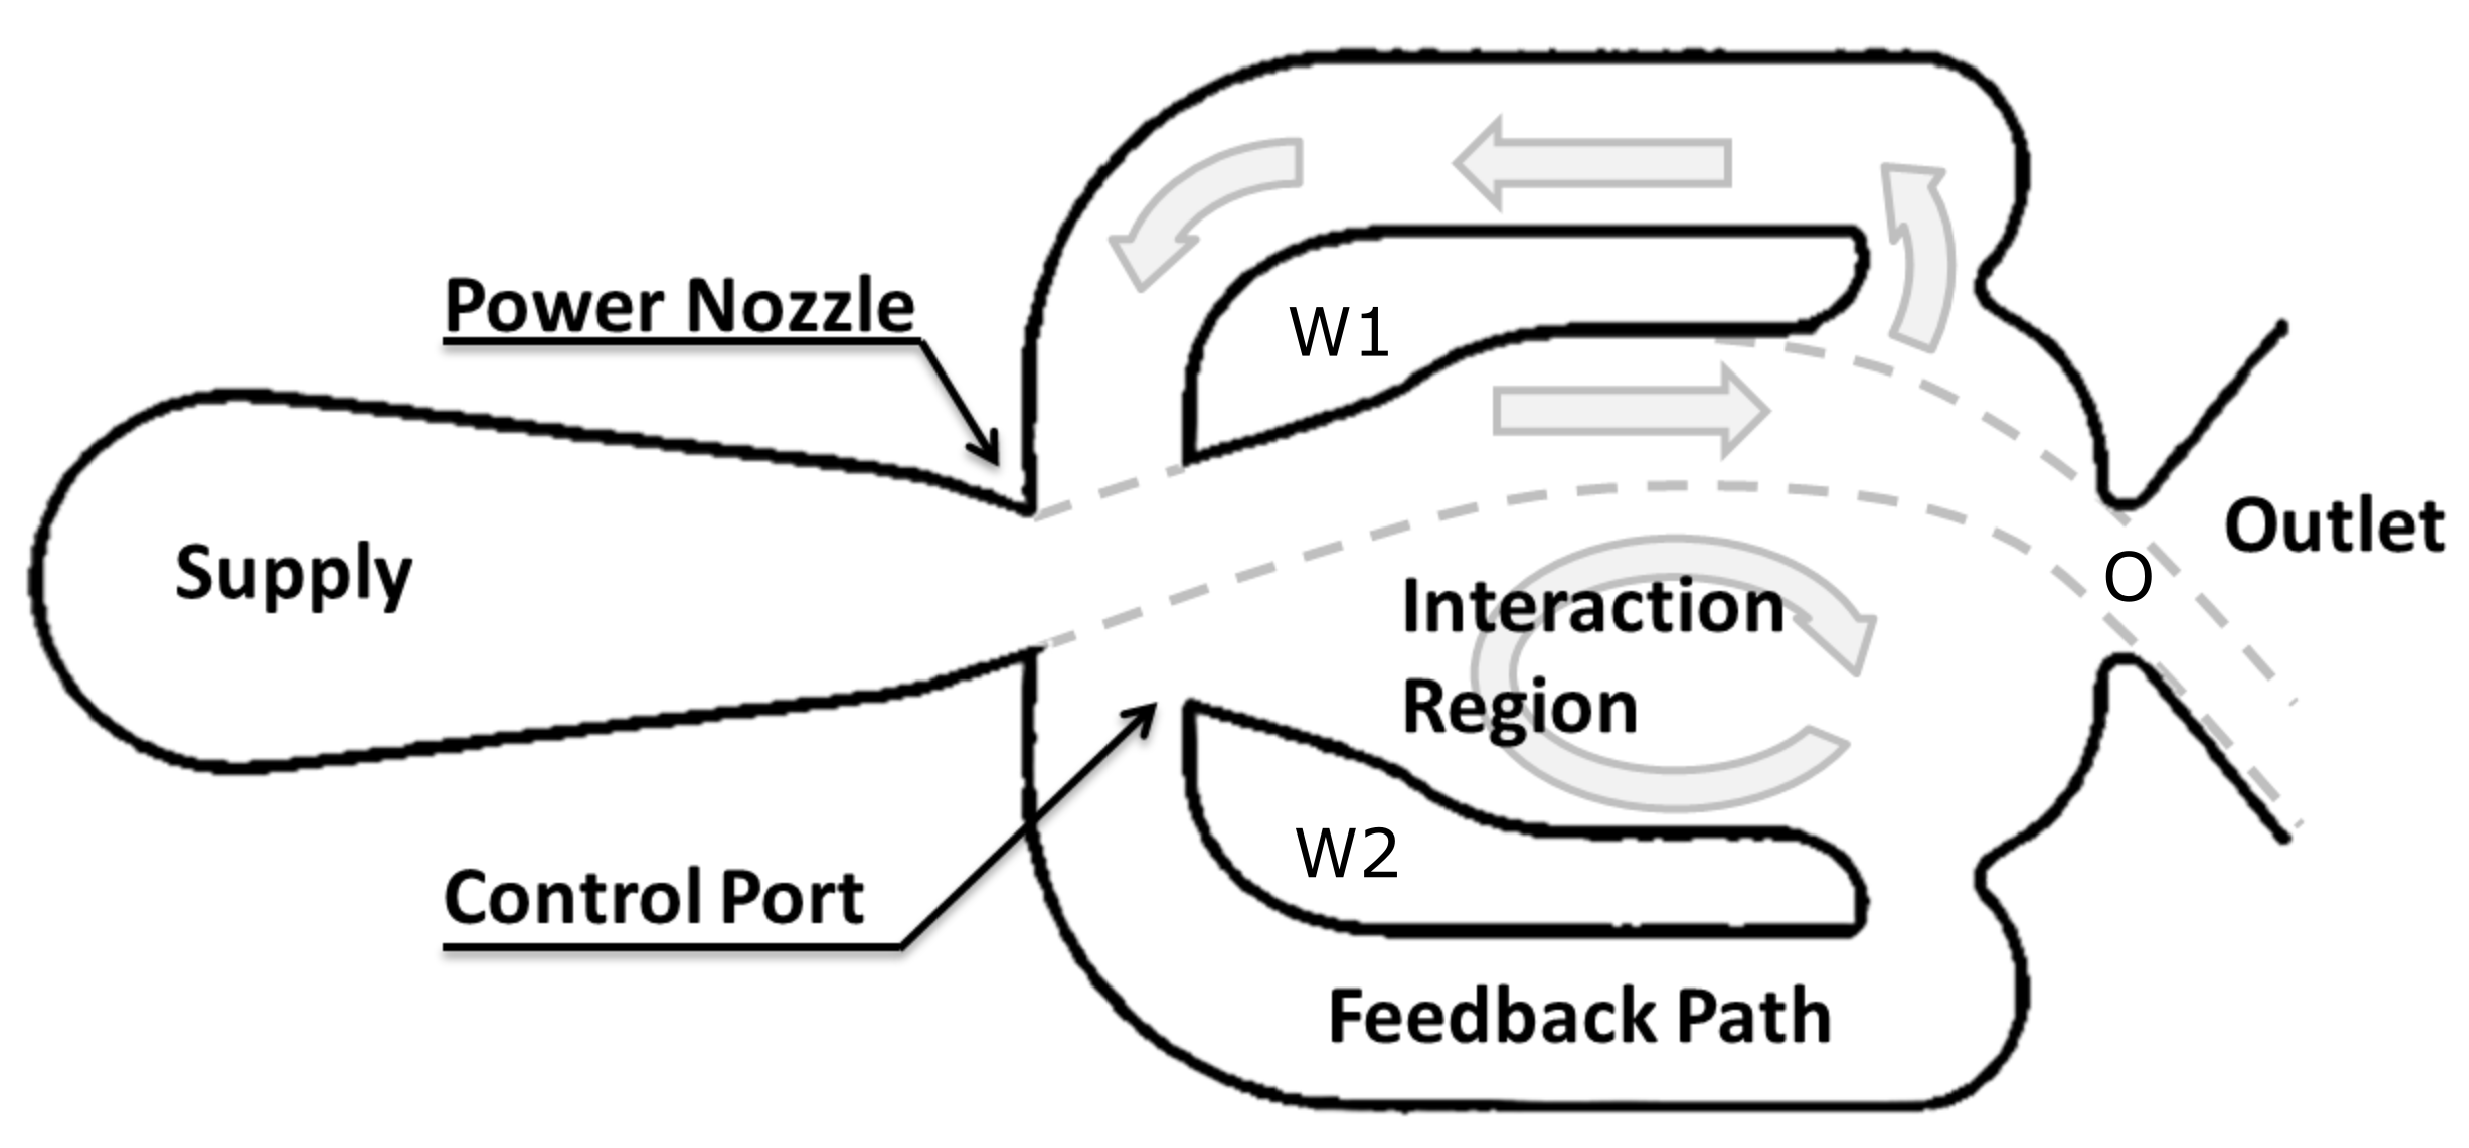
Despite being a development of the 1960 [7,8], fluidic devices (or fluidics) can provide solutions for many modern engineering problems. Initially, these passive devices were used as robust control systems for missiles [9] and in manufacturing machinery [10]. In recent years, fluidics have been rediscovered for commercial applications. For example, they are used in windshield wipers [11], in active flow control [12,13,14], in biochemistry for the generation of microbubbles [15,16], and even as diesel injectors for small gasturbines [17]. Most of these applications benefit from the jet dynamics and the robustness of the devices. The robustness stems from the fact that fluidic oscillators contain no moving parts and are therefore virtually maintenance free. Furthermore, they are not affected by harsh environmental conditions such as temperature radiation or shock. Even though there are several different types of fluidic devices, the main ones used in these applications are fluidic oscillators. Figure 1 shows a standard feedback-type sweeping jet fluidic oscillator.
The functioning of the devices can be broken up into four steps:
- After the startup of the system, a hydrodynamic instability in the interaction region causes the jet to attach to one of the walls W1 or W2 due to the Coanda effect.
- The jet is split into a main portion that exits the chamber through the outlet O and a smaller portion that loops back to the inlet.
- When reaching the inlet, this jet causes the main jet to detach from one wall and to fill the resulting recirculation bubble.
- The jet attaches to the opposite wall, and the cycle starts over.
2. Materials and Methods
2.1. Experimental Setup
The present scientific contribution includes investigations using an optically accessible pressure chamber equipped with a prototype injector with interchangeable nozzles. The jet penetration behavior of the OsciJet nozzle is compared with that of a 6-hole nozzle. After the description of the measurement principle, the experimental setup, and the presentation of the developed evaluation routine, the results are discussed in detail with regard to the application in an internal combustion engine.
The prototypes were designed for the same flow rate by selecting equal total cross-sectional areas at the nozzle outlet. Nevertheless, deviations in the mass flow can occur due to flow processes within the nozzle that influence the jet penetration behavior. For this reason, the optical investigations were preceded by a measurement of the steady-state mass flow using a Coriolis flowmeter at various injection pressures up to 6 bar (supercritical injection into the environment).
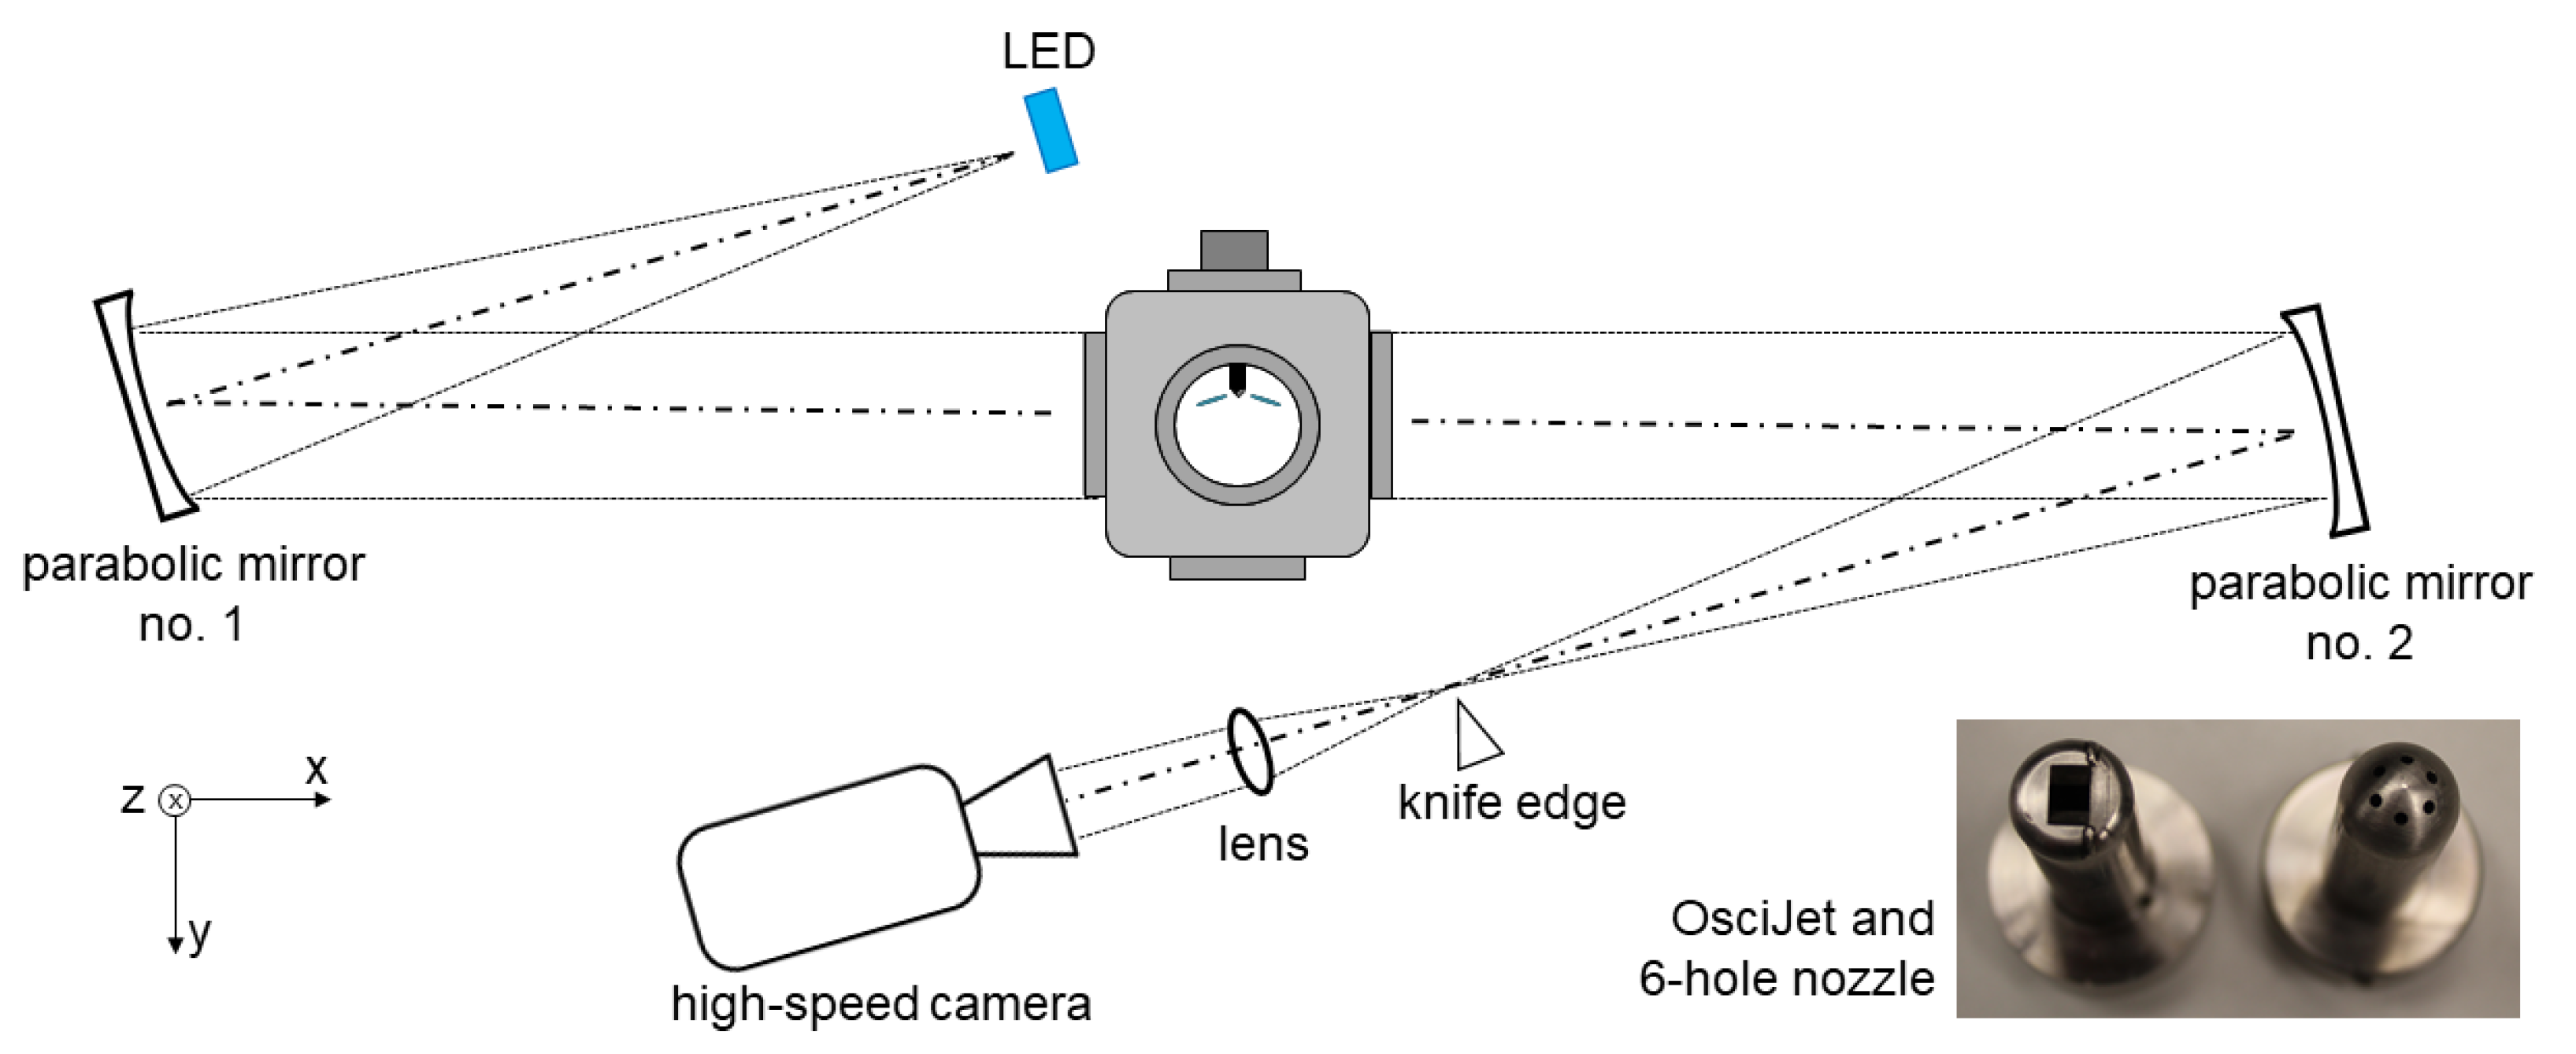
In order to investigate the jet penetration behavior of the selected nozzles, injection tests with hydrogen into quiescent nitrogen were performed in a pressure chamber with an optical access of 70 mm diameter. A high-speed Schlieren system was used to visualize the gaseous fuel jets (Figure 2). Two parabolic mirrors with a diameter of 152.4 mm and a focal length of about 1219.2 mm were used to collimate and focus the light. A high-power LED from Luminus Devices (CBT-120) served as the light source. The design of an LED driver circuit (modified on the basis of [23]) enables intermittent control of the LED in overload with a current up to 150 A at a pulse duration of 2.3 µs. This allows for very high light intensities to be achieved during image acquisition. Imaging was performed using a Vision Research Phantom v1610 high-speed camera with an acquisition rate of 21 kHz and an exposure time of 2 µs at a resolution of 896 × 896 pixels. The solenoid injection valve was controlled via a development control unit from IAV GmbH [24,25], which also output the trigger signal for the camera and the LED.
In all cases, the optical investigation of the selected nozzles was carried out at injection pressures of 8 bar and 30 bar with variation of the back pressure. The images were compared on the basis of macroscopic parameters. The change in penetration depth over time allows the spray velocity to be calculated, which enables conclusions to be drawn about the air capture in the cylinder vertical axis. This is especially important in the case of early start of injection when the piston is near BDC. The spray angle provides information about the air capture in the view plane (x-y, cumulated over z) and thus about the degree of homogenization in the combustion chamber.
The macroscopic spray parameters were calculated by a Matlab® evaluation routine. By choosing appropriate intensity thresholds, the spray contour was isolated from the background in each captured frame. In this way, one binary matrix per image was created, from which the parameters of interest could be determined (Figure 3). The spray cone angle was detected dynamically in the range of the first 50% of the penetration depth.
2.2. Numerical Simulation
The experimental investigation using Schlieren measurements provides a detailed visual insight into the hydrogen propagation in the pressure chamber. However the results only allow for the quantification of the velocity in the view plane. Therefore, the measurements were accompanied by a Large Eddy Simulation (LES) that enables the calculation of the spatial and temporal velocity and the concentration field of the jet. These are key parameters to obtain a detailed picture of the flow dynamics of the injected hydrogen and the surrounding gas.
2.2.1. Governing Equations
The non-reactive mixing of the gaseous flow is described by the compressible Navier–Stokes equations. The conservation of continuity, momentum, and energy is given as follows:
where , and are the density, velocity vector, pressure, total enthalpy, and thermal diffusivity of the mixture, respectively. The total enthalpy is the sum of specific enthalpy and kinetic energy:
The viscous stress tensor is defined as follows:
where is the dynamic viscosity computed for each species by Sutherland’s law.
The transport of the species mass fraction of the mixture is given as follows:
A unity Schmidt number is assumed for all species, such that the mass diffusivity . Two species, hydrogen () and nitrogen (), are considered where the inert species is nitrogen. The system of equations is closed by an equation of state for an ideal gas:
where T and R are the temperature and specific gas constant, respectively.
2.2.2. Numerical Methodology
The investigated flow is fully turbulent. Since direct numerical simulation of all turbulent scales is not feasible, a turbulence model is needed to appropriately account for the unresolved dynamics. A suitable choice for retaining large-scale turbulence is LES. To this end, Equations (1) and (4) were Favre-averaged and all scales below the grid resolution were lumped into a sub-grid scale tensor that added additional diffusivity to the system to account for the unresolved dynamics. Since is generally unknown, it needs to be modelled. Here, we employed the one-equation eddy diffusivity model [26], which relates to the sub-grid scale kinetic energy that is solved by an additional transport equation.
The system of equations is discretized using a finite volume method. Time integration is implicit and of second order. All divergence terms were discretized using second-order central schemes, except for those involving where a limited scheme was used to ensure boundedness of the species fraction. The gradients were computed using least squares. The resulting discretized system was solved using the reactingFoam solver in OpenFoam v7.
2.2.3. Computational Setup
The computational domain consisted of a cuboid that represents a part of the pressure chamber. The region of interest was a uniformly refined cartesian grid and extended over −15 mm 15 mm, −18 mm 18 mm, and 0 mm 65 mm. The nozzle outlet was located in the centre of the plane with dimensions of −2mm 2 mm and −1.25 mm 1.25 mm. An illustration of the mesh superposed with the simulated jet is shown in Figure 4.
Due to large computational costs of performing LES, only the flow inside the pressure chamber was computed. A simulation of the complete system, including the OsciJet nozzle, would largely increase the number of cells in the domain since the unstable flow dynamics inside the nozzle require accurately resolved boundary layers and relatively fine meshes inside and upstream of the mixing chamber to properly resolve shear layer gradients. A thorough numerical analysis of the internal flow of a fluidic oscillator is given in [27].
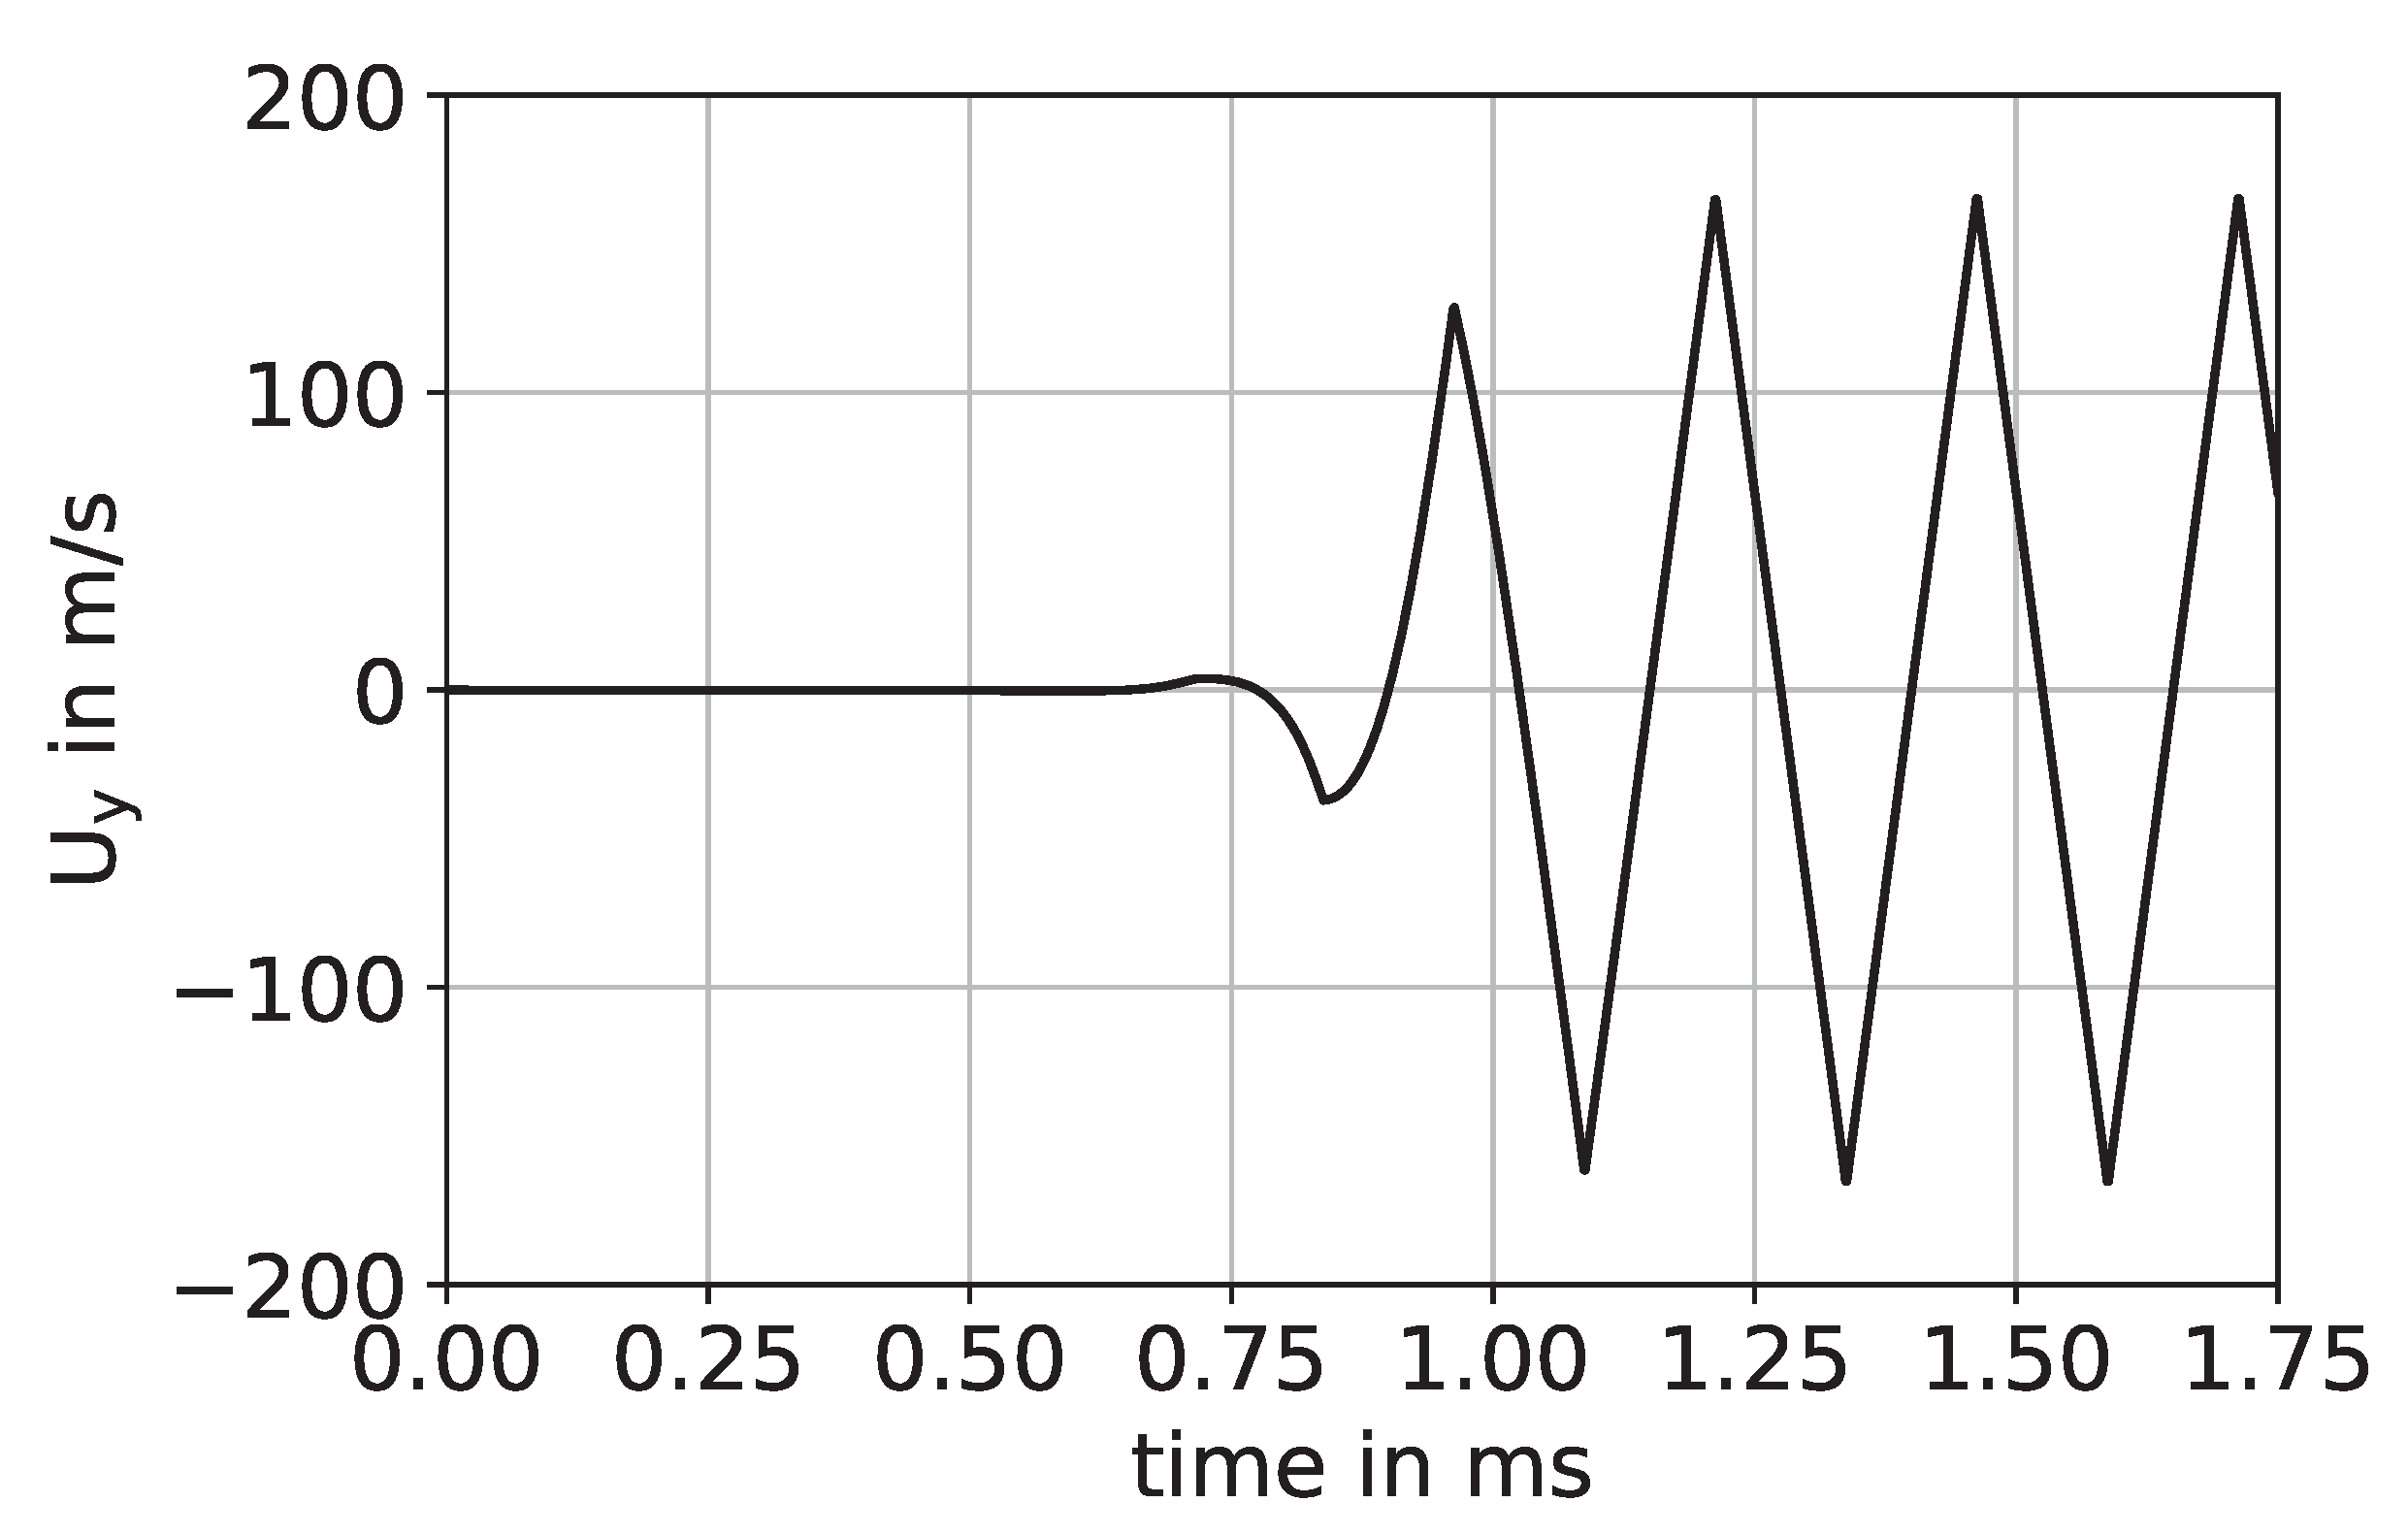
Instead, the behavior of the nozzle was modelled as a periodic oscillation imposed at the nozzle outlet boundary condition. The outlet velocity and temporal oscillation were obtained from preceding unsteady Reynolds-averaged Navier–Stokes simulations of the internal flow of the nozzle with the experimentally measured mass flow (pressure ratio , = 8 bar). The mean axial velocity ( 370 /) at the nozzle outlet as well as the oscillation frequency () and angle () were extracted from these simulations and were used to construct a synthetic time-varying inflow condition for the simulation. To account for the non-oscillating jet in the initial part of the injection cycle, the oscillation was only switched on for 850 µs, which is in line with the Schlieren images provided in Figure 9. Additionally, the inflow velocity was perturbed by isotropic turbulence with a turbulence intensity of to reflect the turbulent motion, produced by the nozzle. To this end, the unperturbed nozzle outlet condition is formulated as
where and . The resulting Reynolds number based on U and the hydraulic diameter of the nozzle outlet is . The temporal evolution of is shown in Figure 5.
The remainder of the plane, surrounding the nozzle outlet, is equipped with a second inlet condition to impose a slight co-flow with a normal velocity of . This choice of boundary condition alleviates the need to model the domain upstream of the nozzle and is less restrictive than imposing a wall boundary. Furthermore, preceding simulations have shown that this choice of boundary condition is numerically more robust, compared to opening-type conditions. The lateral and downstream boundaries of the domain are equipped with non-reflecting outlet conditions and an imposed absolute pressure of 3 bar. While pressure waves do reflect at the walls of the chamber in the experiment, the significantly smaller computational domain cannot account for realistic modelling of these reflections, given the limited domain size. Therefore, the choice of non-reflecting boundaries is to some extent a compromise between model accuracy and computational efficiency. The imposed species fractions are at the nozzle outlet and for all other boundaries. The temperature is 293 K on all boundaries. The flow domain was initialized using 0 /, and .
The simulation was performed with a grid resolution of 0.125 mm in the region of interest, resulting in a total of approximately 37 million cells. The simulation ran until 1750 µs with a variable time step to maintain a maximum Courant number .
3. Results
3.1. Experimental Results
Table 1 lists the recorded mass flow in the steady-state case as well as the average spray velocity of both nozzles determined by optical measurements. Since both nozzles are perfused supercritically in all tests, the mass flow depends solely on the gas state in the feed line and thus remains constant when the back pressures varies.
The comparison of the two nozzles shows small deviations in their mass flow despite equal total orifice cross sections. This may be due to internal nozzle effects such as flow seperation within the 6-hole nozzle that do not occur in the OsciJet nozzle because of the modified hole geometry. For example, the measured mass flow rate of the 6-hole nozzle is 7.3% lower than the value of the OsciJet nozzle at 30 bar injection pressure and 7.0% lower at 8 bar injection pressure.
As the pressure ratio decreases, the average spray velocity for both nozzles decreases as expected. The comparison shows that the spray from the OsciJet nozzle penetrates the pressure chamber significantly faster. On the one hand, this can be explained by the higher mass flow rate of the OsciJet nozzle. On the other hand, compared with the six individual spray jets of the multi-hole nozzle, the large cross-sectional area of the OsciJet nozzle leads to a higher momentum of the hydrogen jet. Due to the geometry of the 6-hole nozzle, there is a significantly larger jet expansion directly at the start of the injection. This can be clearly seen when looking at the spray cone angle in Figure 6 below. After a stationary flow condition has been established in the nozzle, it reaches a constant value of about 75°, independent of the pressure ratio.
By contrast, significantly lower spray angles occur with the OsciJet nozzle during the spray development at the beginning of the injection, as can also be seen in Figure 6. Nevertheless, increased values for the spray angle can be observed at the initial phase of the injection due to the widened spray tip (see Figure 7 left). The large flow cross section causes a strong pressure drop in the hydrogen supply line after the solenoid valve is opened. This causes a loss of momentum in the spray, which subsequently spreads laterally due to the density in the pressure chamber and forms the widened spray tip. Due to the following pressure increase in the feed line and the increasing penetration length, the influence of the front spray contour on the angle calculation decreases.
After about 0.5 to 1 ms, depending on the pressure ratio, the spray angle of the OsciJet nozzle increases significantly. This is due to the onset of oscillation (Figure 7, right). The widening caused by the oscillation shows a clear dependence on the pressure ratio for 10. To illustrate this, Figure 8 shows the spray pattern of the OsciJet nozzle at different pressure ratios when exceeding the visible range. At 6, a widening can be seen especially in the lower part of the jet. The relatively small differences in the spray angle that can be observed in Figure 6 are caused by the fact that the evaluation is performed only in the range of the first 50% of the penetration depth. As the pressure ratio decreases further (Figure 8, right), the oscillating motion becomes much more pronounced, resulting in spray widening in the immediate vicinity of the nozzle. This is also indicated by the high spray angle values in Figure 6 when leaving the visible area (tagged by markers).
Even for advanced injection duration (from approx. 2 ms onwards), larger spray angles occur with decreasing pressure ratio. The decreasing spray impulse resulting from the reduction in the pressure ratio seems to increase the tendency to oscillate. Another effect could be a stagnation of hydrogen in the pressure chamber due to the lack of spray impulse. This is caused by the high hydrogen input into the small pressure chamber volume.
In contrast to the preceeding findings, the effect of the spray cone widening with decreasing pressure ratio is not observable at 10 and 30 (see Figure 6). This could be explained by two reasons. On the one hand, the oscillating motion is less pronounced for high pressure ratios. Therefore, the spray angle is more dependent from the geometry of the nozzle. On the other hand, the increased back pressure ( 10, = 3 ) appears to cause the spray to constrict. With decreased back pressure ( 30, = 1 bar), the hydrogen can diffuse more easily into the chamber, which also might explain the larger spray angle.
For low injection pressures, the oscillating movement caused by the OsciJet nozzle at around 3 ms after start of injection (SOI) results in larger spray angles in direct comparison to the 6-hole nozzle.
If the penetration behavior of the two nozzles is considered in the context of a potential practical application, it can be assumed that the 6-hole nozzle achieves better homogenization due to its lower spray impulse and larger spray angle at the start of the injection.
By contrast, the high momentum of the OsciJet nozzle results in a very dense injection jet at the beginning. This can be used to initially inject the fuel as far as possible into the combustion chamber, right up to the piston. As the piston moves upward and the working gas is compressed, the pressure ratio decreases, under the assumption of a constant injection pressure. This intensifies the oscillating motion and thus promotes the coverage of the combustion chamber periphery. This behavior, if properly designed, can be used to inject the hydrogen into those areas of the combustion chamber that have not yet been fully covered.
3.2. Simulation
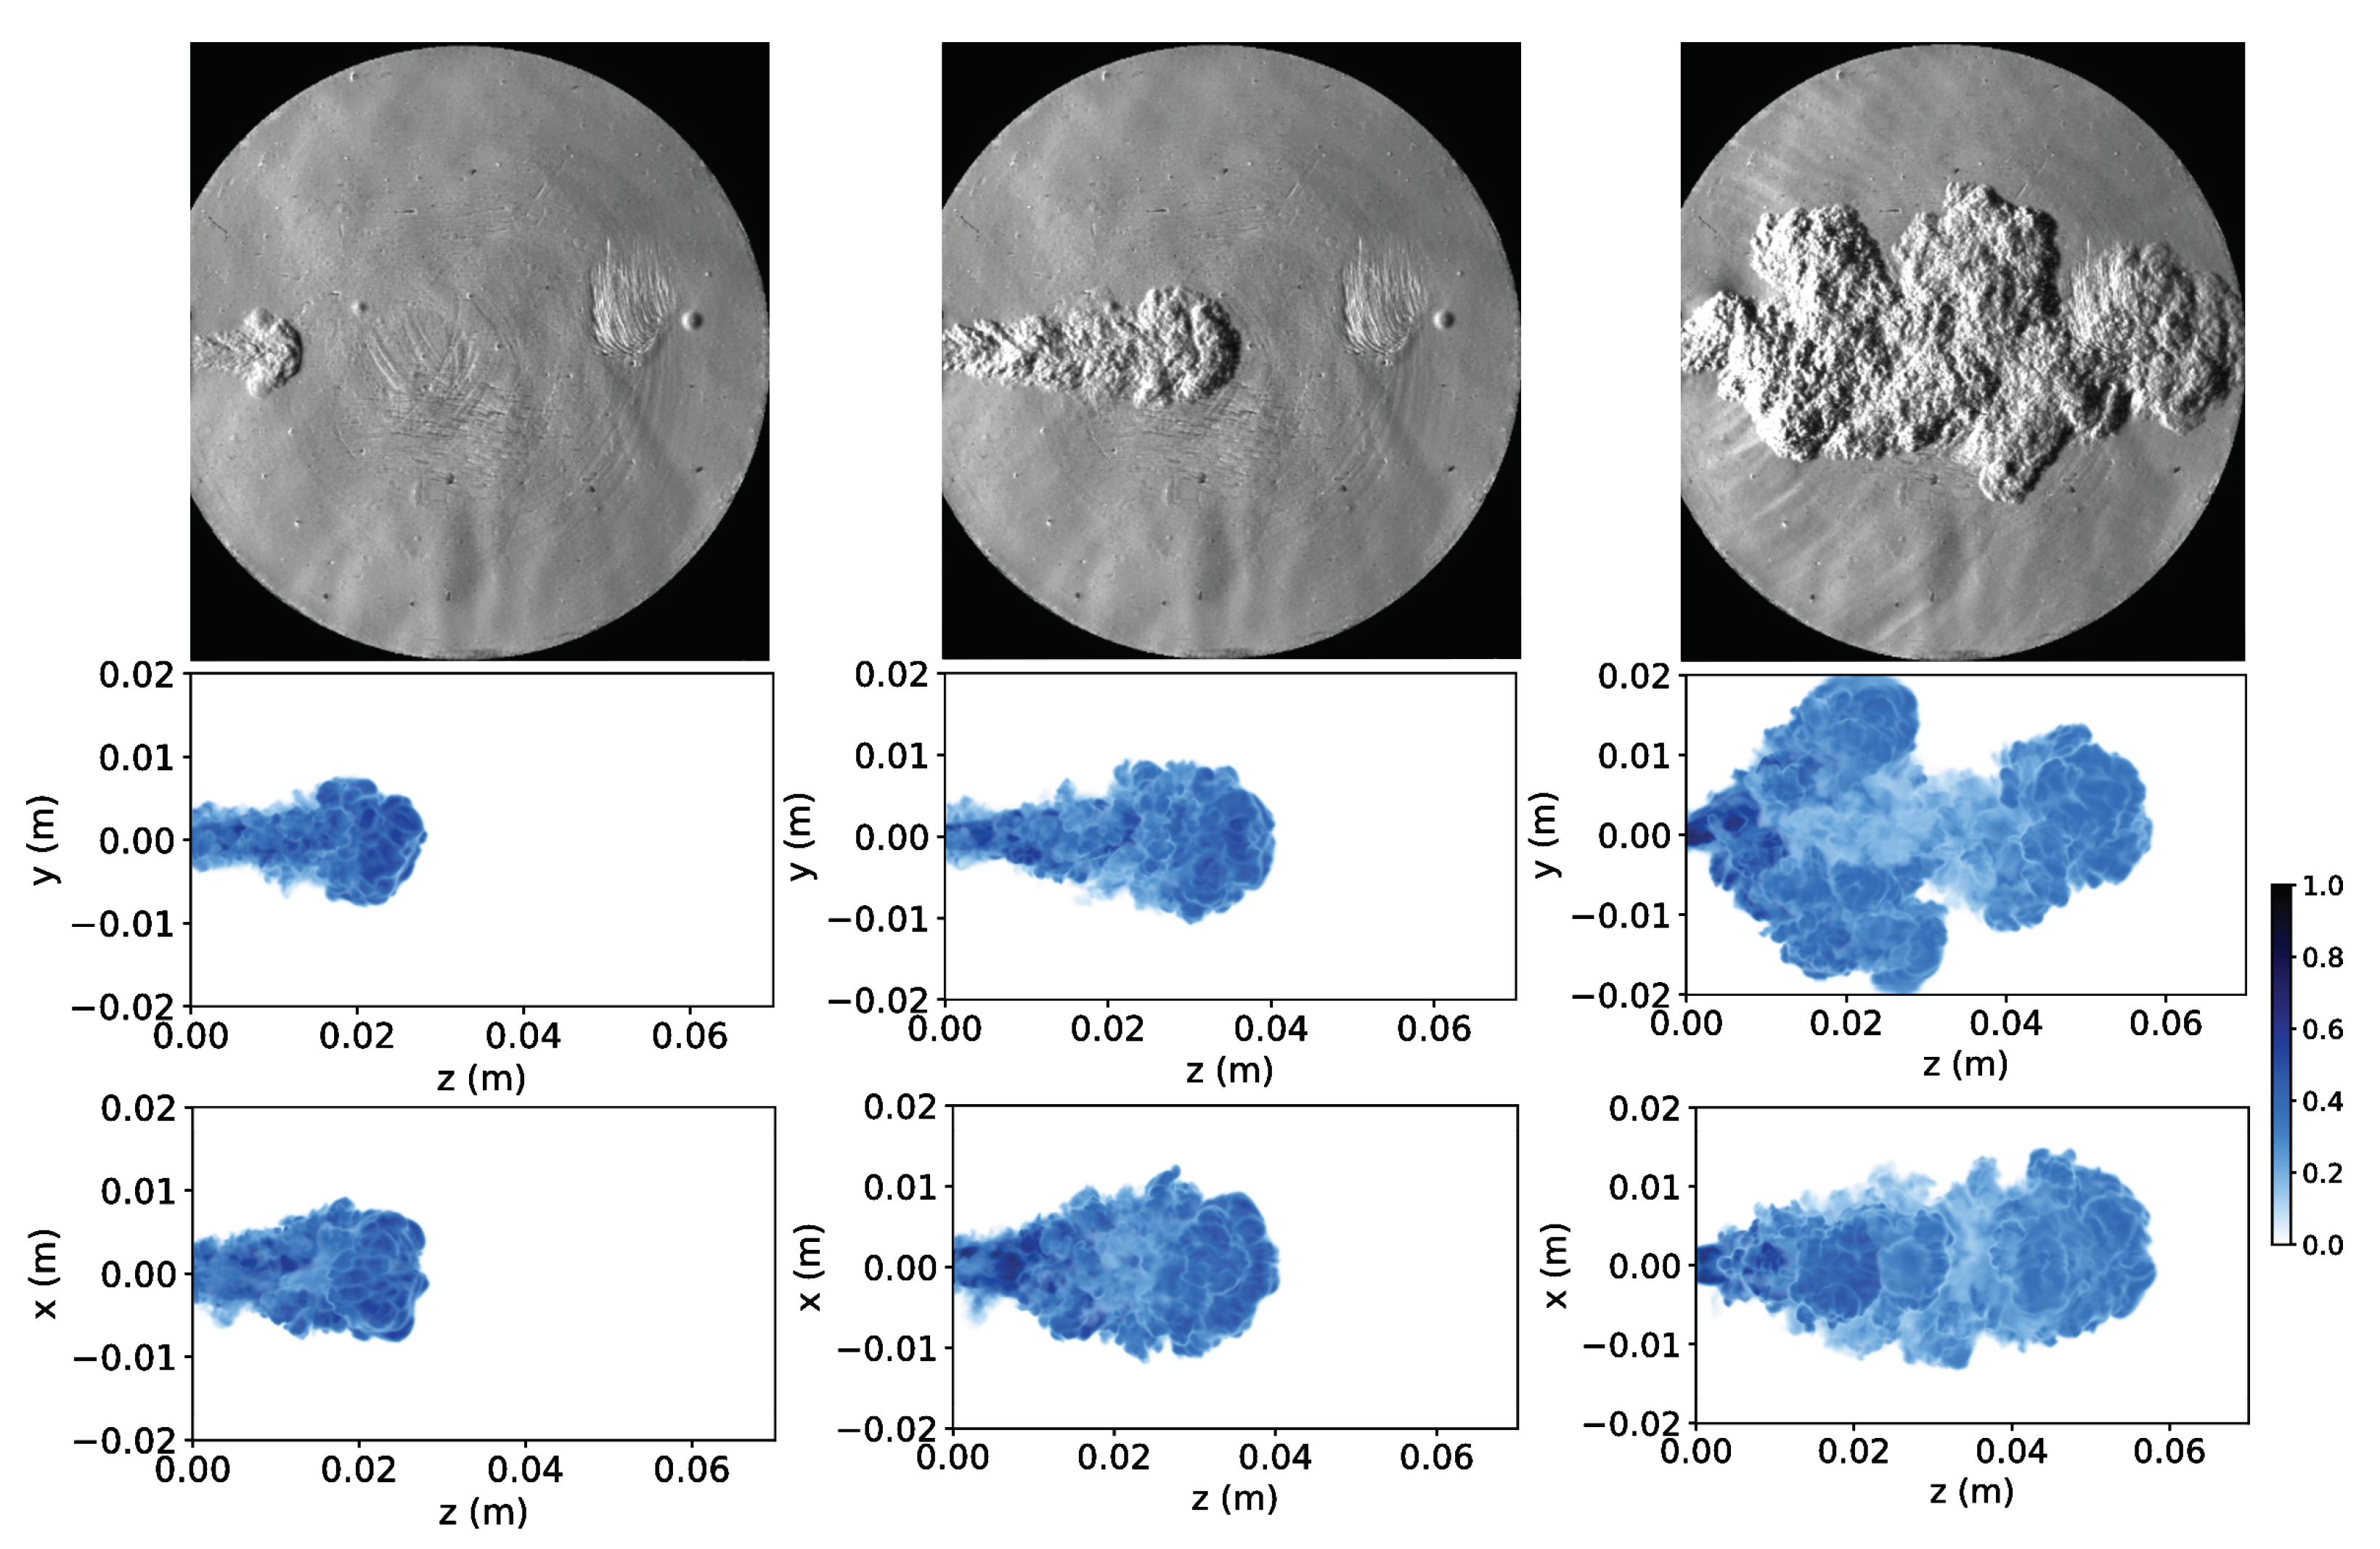
An overview of the simulated hydrogen distribution in the pressure chamber is shown in Figure 9, where the H2 mass fraction is shown and compared to the experimental Schlieren images. The maximum value of the x-axis in the plots corresponds to the diameter of the visible area of the Schlieren images (70 mm). As can be seen, the overall dynamics visible in the experimental data is well captured by the LES. However, it is as well visible that the jet penetration depth in the simulation at early times is notably larger than in the experiment, which can also be seen in Figure 10a. This is likely caused by the influence of the valve used in the experimental setup that results in a time-varying mass flow, which is not accounted for by the simulation. Furthermore, for 1750 µs in the simulation, it can be seen that the initial non-oscillating jet plume appears separated from the oscillating bulk fluid, while in the experiment, the jet remains more compact. This indicates that the onset of the oscillation in the experiment is more gradual than assumed in the simulation, resulting in a more homogeneous hydrogen distribution. Looking at the cross plane m, the simulation shows that the width of the jet in this plane remains rather unaffected by the onset of oscillation for 850 µs.
A more detailed picture of the penetration depth and width is given in Figure 10a, where the temporal evolution of these parameters is shown. All values are computed by assuming a jet contour of . As is already evident from the volume fraction plots in Figure 9, the jet width in the x direction remains relatively constant for 500 µs. In contrast, the onset of oscillation of the jet causes a growth of the y-width that becomes apparent for 1250 µs and causes it to become approximately twice as large as the x-width in proximity of the nozzle exit. The stream-wise penetration depth of the jet increases continuously.
However, a rapid slow-down of the jet tip is seen in Figure 10b. which is possibly attributed to the large diffusivity of hydrogen. The injection velocity is almost instantly reduced to approximately 50 / and then continues to degrade to approximately 10 /.
The mixing of the jet with the surrounding gas is shown in Figure 11, where the mixing quality is quantified by computing the spatial unmixedness [28]. Based on the time-averaged mass fraction field , it is computed as follows:
where is the total variance of . We only consider the region since the transient statistics for positions further downstream are not sufficiently converged. As can be seen, the oscillation significantly improves the downstream mixture of the gases, compared to the static jet by up to a factor of 6.
4. Conclusions
In this work, the jet penetration behavior of an oscillating nozzle was compared with that of a multi-hole nozzle using injection tests of hydrogen into a quiescent nitrogen atmosphere. The results show the potential of the innovative nozzle geometry with regard to a practical application in H2-DI combustion engines with early injection.
The numerical simulation of the hydrogen injection has shown that the basic dynamics of the flow are correctly captured by means of a LES in combination with a modelled OsciJet nozzle. In particular, the penetration depth for 850 µs 1750 µs is in good correspondence with the Schlieren measurements. The remaining discrepancies, especially at the beginning of the injection are rooted in differences between the experimental setup and the numerical model of the nozzle (i.e., a non-constant mass flow rate and slower onset of oscillation). The simulation shows that the oscillation produced by the OsciJet nozzle is able to notably increase the mixture of the hydrogen with the ambient gas.
For further evaluation of the homogenization performance, investigations under conditions typically found in a combustion chamber are necessary. Subjects to be considered include different types of charge-motion and map-dependent injection strategies. For this purpose, the 3D CFD model will be extended and validated on the basis of the acquired measurement data.
In addition to further investigations on the homogenization capability in the combustion chamber, practical parameters of the potential OsciJet injector have to also be investigated and optimized. Here, the relatively large volume downstream of the injector valve is of particular importance. In its current design, the OsciJet nozzle is characterized by a dead volume of around 250 to 300 mm3. Compared with conventional, outward-opening injectors with blow caps, this volume is 10 to 20% larger. Various concepts for minimizing the dead volume, including innovative closure mechanisms, are currently under discussion and will be investigated in further projects.
Author Contributions
Conceptualization, T.E. and B.J.; methodology, A.F., O.N. and S.S.; software, A.F. and S.S.; validation, A.F., O.N. and S.S.; formal analysis, A.F., O.N. and S.S.; investigation, A.F., O.N. and S.S.; resources, A.F., O.N., S.S. and O.K.; data curation, A.F., O.N. and S.S.; writing—original draft preparation, A.F., O.N., A.T. and S.S.; writing—review and editing, A.F., O.N., S.S., O.K., T.E., A.T. and B.J.; supervision, O.K., T.E. and B.J.; project administration, B.J. All authors have read and agreed to the published version of the manuscript.
Funding
This research received no external funding.
Institutional Review Board Statement
Not applicable.
Informed Consent Statement
Not applicable.
Data Availability Statement
Not applicable.
Conflicts of Interest
The authors declare no conflict of interest.
Abbreviations
The following abbreviations are used in this manuscript:
| BDC | Bottom dead centre |
| CFD | Computational fluid dynamics |
| DI | Direct injection |
| ICE | Internal combustion engine |
| LED | Light emitting diode |
| LES | Large eddy simulation |
| SOI | Start of injection |
References
- EMCEL Welche Strafen folgen aus den CO2-Emissionsnormen für schwere Nutzfahrzeuge? Available online: https://emcel.com/de/co2-emissionsnormen-schwere-nutzfahrzeuge (accessed on 30 June 2021).
- The European Commission. Proposal for a Regulation of the European Parliament and of the Council Setting CO2 Emission Performance Standards for New Heavy-Duty Vehicles; The European Commission: Brussels, Belgium, 2018. [Google Scholar]
- Munshi, S.; Garner, G.; Theissl, H.; Hofer, F.; Raser, B. Total Cost of Ownership (TCO) Analysis for HeavyDuty Hydrogen Fueled Powertrains; Technical Report. Westport Fuel Systems, AVL List GmbH, 2021. Available online: https://bit.ly/3dt5DDD (accessed on 30 June 2021).
- Koch, D.; Ebert, T.; Sousa, A. Transformation vom Diesel zum H2-Hoch-AGR-Magerkonzept. ATZheavy Duty 2020, 13, 32–41. [Google Scholar] [CrossRef]
- Lacarelle, A.; Paschereit, C.O. Increasing the passive scalar mixing quality of jets in crossflow with fluidics actuators. J. Eng. Gas Turbines Power 2012, 134, 021503. [Google Scholar] [CrossRef]
- Bobusch, B.C.; Berndt, P.; Paschereit, C.O.; Klein, R. Investigation of fluidic devices for mixing enhancement for the shockless explosion combustion process. In Active Flow and Combustion Control 2014; Springer: Berlin/Heidelberg, Germany, 2015; pp. 281–297. [Google Scholar]
- Spyropoulos, C.E. A sonic oscillator(Operational principles and characteristics of sonic oscillator- pneumatic clock pulse generator). In Proceedings of the Fluid Amplification Symposium, Washington, DC, USA, 26–28 May 1964; Volume 3, pp. 27–52. [Google Scholar]
- Warren, R.W. Fluid Oscillator. U.S. Patent US3016066A, 9 January 1962. [Google Scholar]
- Campagnuolo, C.J.; Lee, H.C. Review of Some Fluid Oscillators; Technical Report; Harry Diamond Labs: Adelphi, MD, USA, 1969. [Google Scholar]
- Weathers, T.M. NASA Contributions to Fluidic Systems. J. Spacecr. Rocket. 1973, 10, 417–418. [Google Scholar] [CrossRef]
- Stouffer, R.D. Fluidic Washer Systems for Vehicles. U.S. Patent US5749525A, 12 May 1998. [Google Scholar]
- Raghu, S. Fluidic oscillators for flow control. Exp. Fluids 2013, 54, 1455. [Google Scholar] [CrossRef]
- Woszidlo, R.; Wygnanski, I. Parameters governing separation control with sweeping jet actuators. In Proceedings of the 29th AIAA Applied Aerodynamics Conference, Honolulu, HI, USA, 27–30 June 2011; p. 3172. [Google Scholar]
- Cerretelli, C.; Kirtley, K. Boundary layer separation control with fluidic oscillators. J. Turbomach. 2009, 131, 1–9. [Google Scholar] [CrossRef]
- Tesař, V. Microbubble generation by fluidics. Part I: Development of the oscillator. In Proceedings of the Colloquium Fluid Dynamics, Prague, Czech Republic, 24–26 October 2012. [Google Scholar]
- Gilmour, D.; Zimmerman, W. Microbubble intensification of bioprocessing. Adv. Microb. Physiol. 2020, 77, 1. [Google Scholar]
- Ćosić, B.; Waßmer, D.; Genin, F. Integration of Fluidic Nozzles in the New Low Emission Dual Fuel Combustion System for MGT Gas Turbines. Fluids 2021, 6, 129. [Google Scholar] [CrossRef]
- Gregory, J.; Tomac, M.N. A review of fluidic oscillator development and application for flow control. In Proceedings of the 43rd AIAA Fluid Dynamics Conference, San Diego, CA, USA, 24–27 June 2013; p. 2474. [Google Scholar]
- Tesarř, V. Pressure-Driven Microfluidics. In Proceeding of the Engineering Mechanics, Svratka, Czech Republic, 12–15 May 2008. [Google Scholar]
- Tesarř, V. Taxonomic trees of fluidic oscillators. EPJ Web Conf. 2017, 143, 02128. [Google Scholar] [CrossRef] [Green Version]
- Foster, K.; Parker, G.A. Fluidics: Components and Circuits; John Wiley & Sons: Hoboken, NJ, USA, 1970. [Google Scholar]
- Bobusch, B.C. Fluidic Devices for Realizing the Shockless Explosion Combustion Process. Ph.D. Thesis, Technische Universität Berlin, Berlin, Germany, 2015. [Google Scholar] [CrossRef]
- Willert, C.; Stasicki, B.; Klinner, J.; Moessner, S. Pulsed operation of high-power light emitting diodes for imaging flow velocimetry. Meas. Sci. Technol. 2010, 21, 075402. [Google Scholar] [CrossRef] [Green Version]
- Predelli, O.; Kracke, T.; Schmidt, W.; Meyerleitet, S. FI2RE. Mtz-Mot. Z. 2004, 65, 36–42. [Google Scholar] [CrossRef]
- Steuer, J.; Mladek, M.; Dengler, C.; Mayer, W.; Kracke, T.; Jakubek, P.; Brune, A.; Rick, R. Flexibles Motorsteuerungssystem für die Entwicklung innovativer Brennverfahren. ATZelektronik 2009, 4, 36–41. [Google Scholar] [CrossRef]
- Yoshizawa, A. Statistical theory for compressible turbulent shear flows, with the application to subgrid modeling. Phys. Fluids 1986, 29, 2152–2164. [Google Scholar] [CrossRef]
- Krüger, O.; Bobusch, B.C.; Woszidlo, R.; Paschereit, C.O. Numerical modeling and validation of the flow in a fluidic oscillator. In Proceedings of the 21st AIAA Computational Fluid Dynamics Conference, San Diego, CA, USA, 24–27 June 2013; p. 3087. [Google Scholar]
- Danckwerts, P. The definition and measurement of some characteristics of mixtures. Appl. Sci. Res. Sect. A 1952, 3, 279–296. [Google Scholar] [CrossRef]
Figure 1.
Fluidic oscillator.

Figure 2.
Schematic drawing of the schlieren system and nozzles used.

Figure 3.
Frame before injection (left), frame of penetrating spray (center), and created binary matrix (right). To determine the individual angles, a linear slope is calculated by the method of least squares using the outer contour of the spray. The penetration depth can be calculated directly from the ratio of pixels to millimeters.

Figure 4.
Schematic illustration of the computational mesh superposed with a volumetric rendering of the jet. Shown is the density field .
Figure 4.
Schematic illustration of the computational mesh superposed with a volumetric rendering of the jet. Shown is the density field .

Figure 5.
Temporal evolution of the velocity of the superposed oscillation on the nozzle inflow boundary, representing the OsciJet nozzle.
Figure 5.
Temporal evolution of the velocity of the superposed oscillation on the nozzle inflow boundary, representing the OsciJet nozzle.

Figure 6.
Comparison of spray angles of the two nozzles.

Figure 7.
Spray penetration of the OsciJet nozzle ( 2.67).

Figure 8.
Comparison of spray images of the OsciJet nozzle when exceeding the visible range at different pressure ratios ; left: 10, center: 6, right: 2.67.
Figure 8.
Comparison of spray images of the OsciJet nozzle when exceeding the visible range at different pressure ratios ; left: 10, center: 6, right: 2.67.

Figure 9.
H2 mass fraction as volumetric rendering, projected on the respective cross planes (middle row) and (bottom row) for 450 µs, 850 µs and 1750 µs (from left to right). The respective Schlieren images, showing the plane, are displayed in the top row and are scaled similarly to the simulation plots.

Figure 10.
Temporal evolution of the penetration depth and jet width (a) and jet tip velocity (b). The dashed, vertical line marks the onset of oscillation.
Figure 10.
Temporal evolution of the penetration depth and jet width (a) and jet tip velocity (b). The dashed, vertical line marks the onset of oscillation.

Figure 11.
Stream-wise evolution of the spatial unmixedness M(z) (a) and the quotient M(z)static/M(z)osci (b).
Figure 11.
Stream-wise evolution of the spatial unmixedness M(z) (a) and the quotient M(z)static/M(z)osci (b).


Table 1.
Pressure boundary conditions and result variables for the investigated nozzle configurations ( = pressure ratio (injection pressure/chamber back pressure)).
Table 1.
Pressure boundary conditions and result variables for the investigated nozzle configurations ( = pressure ratio (injection pressure/chamber back pressure)).
| Pressure Boundary Condition | Mass Flow in g/s | Average Spray Velocity in m/s | ||||
|---|---|---|---|---|---|---|
| in bar | in bar | 6-hole | OsciJet | 6-hole | OsciJet | |
| 30 | 1 | 30.00 | 6.21 | 6.70 | 45.60 | 83.82 |
| 3 | 10.00 | 35.74 | 63.64 | |||
| 5 | 6.00 | 30.70 | 55.91 | |||
| 8 | 2 | 4.00 | 1.60 | 1.72 | 23.87 | 48.38 |
| 3 | 2.67 | 23.66 | 35.91 | |||
Publisher’s Note: MDPI stays neutral with regard to jurisdictional claims in published maps and institutional affiliations. |
© 2021 by the authors. Licensee MDPI, Basel, Switzerland. This article is an open access article distributed under the terms and conditions of the Creative Commons Attribution (CC BY) license (https://creativecommons.org/licenses/by/4.0/).
Share and Cite
MDPI and ACS Style
Fink, A.; Nett, O.; Schmidt, S.; Krüger, O.; Ebert, T.; Trottner, A.; Jander, B. Free Stream Behavior of Hydrogen Released from a Fluidic Oscillating Nozzle. Fluids 2021, 6, 245. https://0-doi-org.brum.beds.ac.uk/10.3390/fluids6070245
AMA Style
Fink A, Nett O, Schmidt S, Krüger O, Ebert T, Trottner A, Jander B. Free Stream Behavior of Hydrogen Released from a Fluidic Oscillating Nozzle. Fluids. 2021; 6(7):245. https://0-doi-org.brum.beds.ac.uk/10.3390/fluids6070245
Chicago/Turabian StyleFink, Anja, Oliver Nett, Simon Schmidt, Oliver Krüger, Thomas Ebert, Alexander Trottner, and Bojan Jander. 2021. "Free Stream Behavior of Hydrogen Released from a Fluidic Oscillating Nozzle" Fluids 6, no. 7: 245. https://0-doi-org.brum.beds.ac.uk/10.3390/fluids6070245