Article

Determination of Phenolic Compounds in Blue Corn Flour (Zea mays L.) Produced and/or Metabolized by Colletotrichum gloeosporioides in a Fermentation Process

by
Guadalupe Villarreal-Rodríguez
1,
Jesús Escajeda-García
1,
Nubia Amaya-Olivas
2,
David Chávez-Flores
1,
David Neder-Suárez
1,
Juan G. Ayala Soto
1,
Armando Quintero-Ramos
1,
Teresita Ruíz-Anchondo
2 and
León Hernández-Ochoa
1,*
1
Departamento de Investigacióny Posgrado, Facultad de Ciencias Químicas, Universidad Autónoma de Chihuahua (UACH), Circuito Universitario s/n, Campus II, Chihuahua 31125, Mexico
2
Facultad de Ciencias Agrotecnológicas, Universidad Autónoma de Chihuahua, Av. Pascual Orozco s/n, Campus I, Santo Niño, Chihuahua 31350, Mexico
*
Author to whom correspondence should be addressed.
Submission received: 12 February 2022 / Revised: 8 March 2022 / Accepted: 31 March 2022 / Published: 24 May 2022
(This article belongs to the Section Fermentation for Food and Beverages)

Abstract

:
Phenolic compounds are secondary metabolites produced by plants, and their study has been increased in recent years due to their ability to improve human health. The aim of this work was the determination of phenolic compounds presents in blue corn flour before and after a fermentation process, where different proportions were used of blue corn (Zea mays L.) flour and Czapek Dox culture medium (90 mL of culture medium with 10 g of blue corn flour, 80 mL of culture medium with 20 g of blue corn flour and 70 mL of culture medium with 30 g of blue corn flour) and were fermented at 3 different times (20, 25 and 30 days) with the Colletotrichum gloeosporioides fungus. A determination of the phenolic compounds was carried out with five standard solutions, which were cyanidin 3-glucoside (CYA), pelargonidin 3-glucoside (PEL), chlorogenic acid (CLA), quercetin (QRC) and cinnamic acid (CA). The obtained results showed the presence of CA and PEL. The most abundant phenolic compound in the fermented samples was CLA over the naturally occurring compounds in blue corn, which are CYA and PEL. QRC was the phenolic compound with the lowest concentration in blue corn flour samples fermented with Colletotrichum gloeosporioides.

1. Introduction

Plant-based foods such as fruits, vegetables and cereals provide us with two different types of metabolites: the primary ones, which provide us with essential nutrients such as carbohydrates, minerals, lipids, vitamins and proteins that help to fulfill functions vital in the human body [1], and then, there are the secondary ones, like phytochemicals; they are known to play an important role in the adaptation of plants with the environment [2], but they also represent an important source of active pharmaceutical products [3]. In plants, these compounds are commonly synthesized as defense agents against physiological and environmental stimulators [4,5,6]; within phytochemicals are phenolic compounds, and that is why studies of these secondary metabolites have increased in recent years due to their ability to improve human health [7]. Among the cereals most consumed by humans, corn grain is the third most common, only surpassed by rice and wheat. In many countries, especially Mexico, it is the main source of carbohydrates and proteins. Corn grain is considered one of the cereals with more phenolic compounds. The importance of consuming these phenolic compounds for human health, in addition to those previously described, is the antioxidant activity they have. Diets high in antioxidants have been associated with a reduced probability of suffering from chronic degenerative diseases. In corn kernels, the predominant phenolic acid is ferulic acid, followed by p-coumaric. They have also been identified in colored corn kernels, anthocyanins, flavonols and flavanols [8]. Blue corn (Zea mays L.) owes its color to the high content of anthocyanins, which are located in a thin layer that covers the endosperm, mainly in the pericarp and aleurone layer of the grain [9]. The phenolic compounds present in blue corn, as well as other secondary metabolites, can be potentiated through a process called fermentation, which can improve the functionality of food. Fermentation has been widely applied in food, chemical and pharmaceutical industries to assist in the extraction, manufacturing and modification of bioactive compounds. [10] Microbial fermentation is an interesting biotech processing system that can improve the total phenolic content of foods by releasing their insoluble phenols and thus increasing their nutritional value. The most used microorganisms in fermentation processes are fungi, in the form of yeast, mainly, although there are records on the use of fungi filamentous in the same way [11]. There are food products with a high content of phenolic compounds, in addition to corn; an example is Chagalapoli fruit, obtained from Ardisia compressa trees, which is characterized by having a deep purple color and bittersweet flavor, within which is an endophytic fungus. It is an unknown whether this fungus can be responsible for the production and/or biotransformation of phenolic compounds of interest. In this sense, the aim of this study was to determine the contents of phenolic compounds in blue corn flour (Zea mays L.) biotransformed by Colletotrichum gloeosporioides in a fermentation process using High-Pressure Liquid Chromatography (HPLC) and the importance of the concentration obtained from these compounds in relation to their biological applications.

2. Materials and Methods

2.1. Microorganism, Culture Maintenance and Inoculum Preparation

C. gloeosporioides was isolated as endogenous fungus from a fruit called Chagalapoli (Ardissia compressa) by Alarcón-Sáenz [12] and was cultured in sterilized Potato Dextrose Agar (PDA). The culture was kept at 28 °C for 8 days and inoculated in new culture media until use. The preparation of the fungal spore suspension was performed as described by Colomé et al. [13] on a 10-day culture of C. gloeosporioides in petri dishes with PDA (20% w/v potato infusion, 0.2% w/v Dextrose and 0.2% w/v Agar); five millimeters of sterilized Tween 80 (C64H124O26) solution (1% v/v) were added and subsequently stirred manually for 2 min. One millimeter of this solution was taken and placed in a Neubauer chamber (Tiefe-Depth Profondeur 0.100mm, Superior Marienfeld, Germany), and it was observed at ×10 and ×40 in an optical microscope Zeiss Primo Star 2 (Jena, Germany), where the number of spores was counted.

2.2. Blue Corn Flour Preparation

The blue corn (Zea mays L.) kernels were cleaned to remove any object that could harm the required sterile environment and were placed in sterile flasks, being sterilized in a gas aluminum All American autoclave (Model ALL-1941X, Wisconsin Aluminum Foundry Co., Inc., Manitowoc, WI, USA) at 120 °C for 15 min and ground and weighed in sterile conditions.

2.3. Fermentation

Inoculations of the fungal spore solution were carried out in laminar flow hood UVP UV3 with a HEPA filter (UVP, LLCUltra-Violet Products Ltd., Upland, CA, USA.) previously cleaned with the UV lamp turned on for 30 min. One hundred microliters of fungal spore solution were added to each fermentation sample.
Three different proportions were mounted where the amount of culture medium and blue corn flour was varied. The fermentation times were 20, 25 and 30 days. The culture process was carried out using 3 different blue corn flour proportions (10 g, 20 g and 30 g) adjusted with Czapek Dox broth culture medium (90 mL, 80 mL and 70 mL). This methodology was modified as described by Aguilar et al. [14]. Sample code was carried out with different letters. The letters A and B represented the duplicates of the first proportion with 90 mL of culture medium Czapek Dox and 10 g of blue corn (Zea mays L.). The letters C and D represented the duplicates of the second proportion with 80 mL of culture medium Czapek Dox and 20 g of blue corn (Zea mays L.). The letters E and F represented the duplicates of the third proportion with 70 mL of culture medium Czapek Dox and 30 g of blue corn (Zea mays L.).
Controls had the same proportion of each of the samples, with the only difference that they were not inoculated with a fungal spore solution of C. gloeosporioides; rather, they were inoculated with sterile distilled water. Just one control was used for each proportion corresponding to 20, 25 and 30 days, obtaining 9 control samples. All the samples, the control group included, were fermented in a Shaker incubator Innova 4300 (New Brunswick Scientific Company, Inc., Edison, NJ, USA). The temperature was adjusted to 28 °C and 50 rpm during the required times (20, 25 and 30 days).

2.4. Phenolic Compounds Extraction: Initial and during the Fermentation Process

Phenolic compound contents were performed as described by De Wanto et al. [15]. One gram of blue corn flour was added to a 50-mL falcon tube. The samples were covered with 15 mL of ethanol (80% v/v) in duplicate and homogenized in an ultrasonic system (Branson 3800, model CX5800H, Danbury, CT, USA) for 15 min. Subsequently, the samples were centrifuged on an Eppendorf centrifuge model 5804 R (Hamburg, Germany) (to 4000 rpm during 20 min for each one). The methodology of the extraction of the phenolic compounds during the fermentation process was modified as described by De Wanto et al. [15]. The conditions were modified exclusively for the extraction of secondary metabolites produced by a microorganism in a fermentation process; after the length of time of fermentation required, the samples were added in a falcon tube with 20 mL of Ethanol Formic acid (1% v/v) homogenized in a ultrasonic system for 1 h, centrifuged on a Eppendorf centrifuge (to 4000 rpm for 20 min) and filtrated with a nylon syringe filter of 0.45 μm.

2.5. Analysis by HPLC

The identification of phenolic compounds was performed according to the method described by Salinas-Moreno et al. [16], with modifications using the HPLC equipment UltiMate 3000, with a UV–DAAD detector Diode array (Dionex Softron GmbH Part of Thermo Fisher Scientific Inc. Germering, Germany) with an Agilent Phoro Shell 120 C18 column, pore size of 2.7 μm, with two solvents under a gradient system; the solvents were A (Tri-distilled water) and B (Methanol Trifluoroacetic acid (TFA) 0.1% v/v); a linear gradient was used from 5% to 50% per 17 min, an isocratic elution per 5 min and from 50% B to 5% B for 3 min. The flow rate was 0.5 mL/min, with an injection volume of 1 μL and a run time of 25 min. The column temperature was kept at 35 °C. All the samples were filtrated with a 0.45-μm Nylon syringe filter, as described by De-Wanto et al. [15]. The patron solutions used were Quercetin (CAS Number 117-39-5), cinnamic acid (CAS number 24160-53-0), chlorogenic acid (CAS number 327-97-9), cyanidin 3-glucoside (CAS number 7084-24-4) and pelargonidin 3-glucoside (CAS number 134-04-3). The analyses of chromatogram were performed using software.

2.6. Statistical Analysis

Data were expressed as the mean ± standard deviation of three experiments; Minitab software v.17.1.0 (Minitab LLC, State College, PA, USA) was used to perform the analysis of variance.
The dependent variable corresponded to the value of the concentration of each phenolic compound present in the fermentation samples. Factor 1 (F1) was the fermentation time measured in days, and factor 2 (F2) was the proportions of blue corn flour (Zea mays L.) and culture media Czapek Dox) and the interaction (INT) of both factors.

3. Results

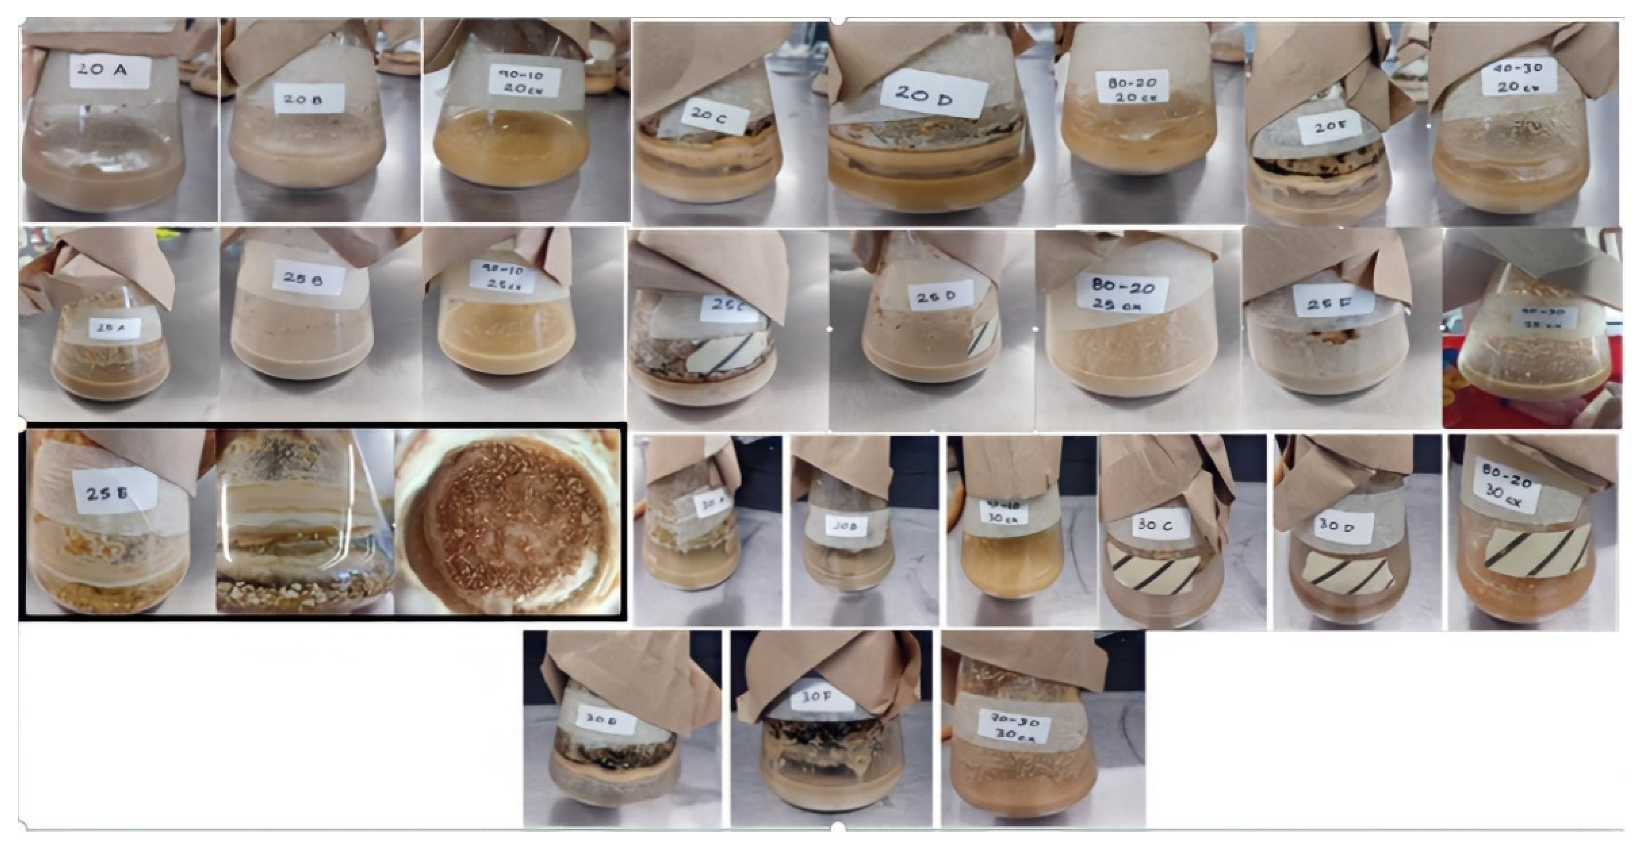
3.1. Blue Corn (Zea mays L.) Flour and Colletotrichum gloeosporioides Fermentation

A fungal spore solution concentration was calculated with the results of 1.3 × 10⁶ con/mL being the concentration obtained and wanted at the same time, so it was not necessary to make a dilution. A qualitative analysis was carried out on each of the samples obtained in the fermentation, and several visual parameters were taken into account, such as the color, appearance and presence of mycelium of Colletotrichum gloeosporioides.
Samples 20 A, 20 B, 25 A, 25 B, 25 C, 25 E and 25 F showed mycelium presence. That could have happened because those samples had less blue corn (Zea mays L.) flour than the others, which could affect the C. gloeosporioides growth, because there was not enough substrate. Samples 20 C, 20 D, 20 E and 20 F showed mycelium presence, and the relation of those samples was that the proportions were the same; that is to say that, if we increase the amount of blue corn flour to 20 and 30 g, the substrate increases too, and the mycelium appears. In the last-mentioned samples, the time was not important for the mycelium presence, but samples 30 A, 30 B, 30 C, 30 D, 30 E and 30 F showed mycelium, so, in this case, all of the proportions, even in the first one that was 90 mL of culture media and 10 g of blue corn flour, showed mycelium. That could depend on the time; that is to say that, over the 30 days of fermentation, there was enough time for C. gloeosporioides to grow up and show mycelium. Figure 1 explains the results previously described.
Sample 25 E had quite different results than the other samples, which presented very little transparent yellow supernatant, and mycelium was observed on the walls of the Erlenmeyer flask. It was present at the bottom of the flask, a very light brown mass of viscous consistency, which appeared to be a mixture of blue corn flour, culture medium in Czapek Dox broth and mycelium of C. gloeosporioides. This suggests that the fungus presented a kind of jelling with the elements present in the sample; however, there has not been found a bibliographic background that mentions the formation of gels from fermentation with filamentous fungi. So far, no antecedent of the formation or synthesis of this gel by Colletotrichum gloeosporioides has been found It is important to notice that an exhaustive search was carried out to determine the production of this gel, which can be related to the components of corn, mainly starch, or if it could be related to the fungus; however, so far, there has been no reference to this, as shown in Figure 1.

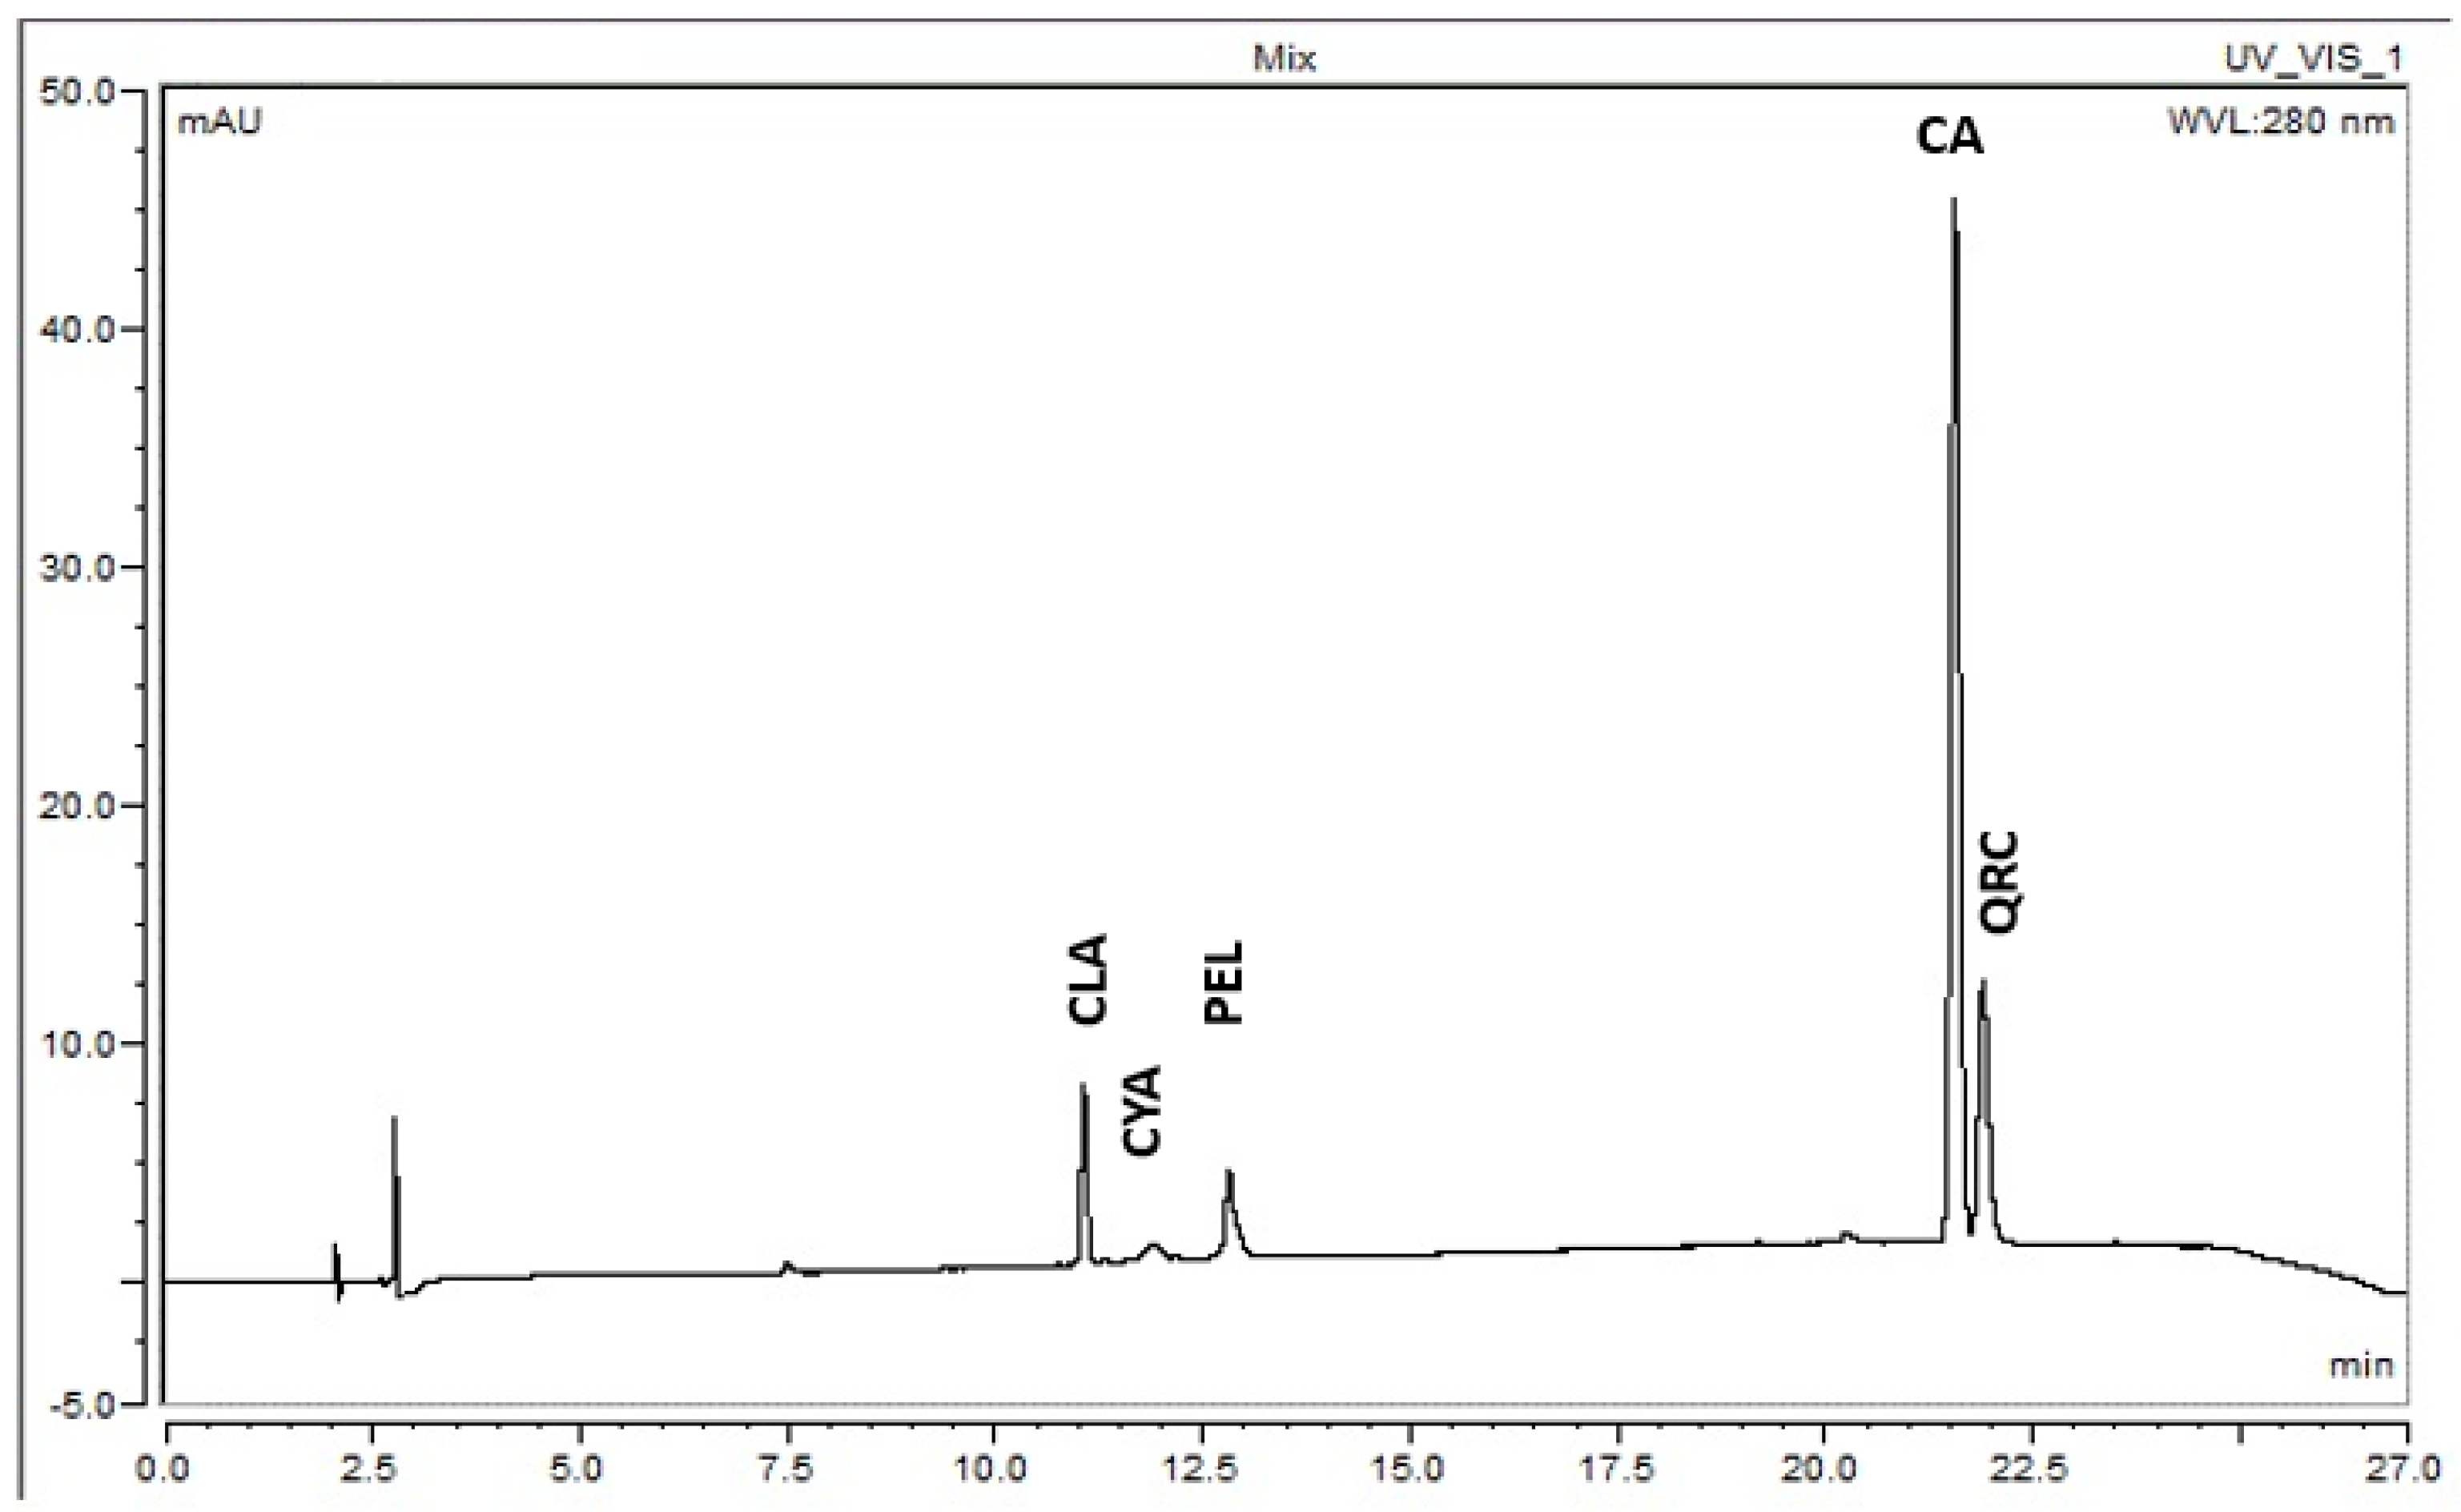
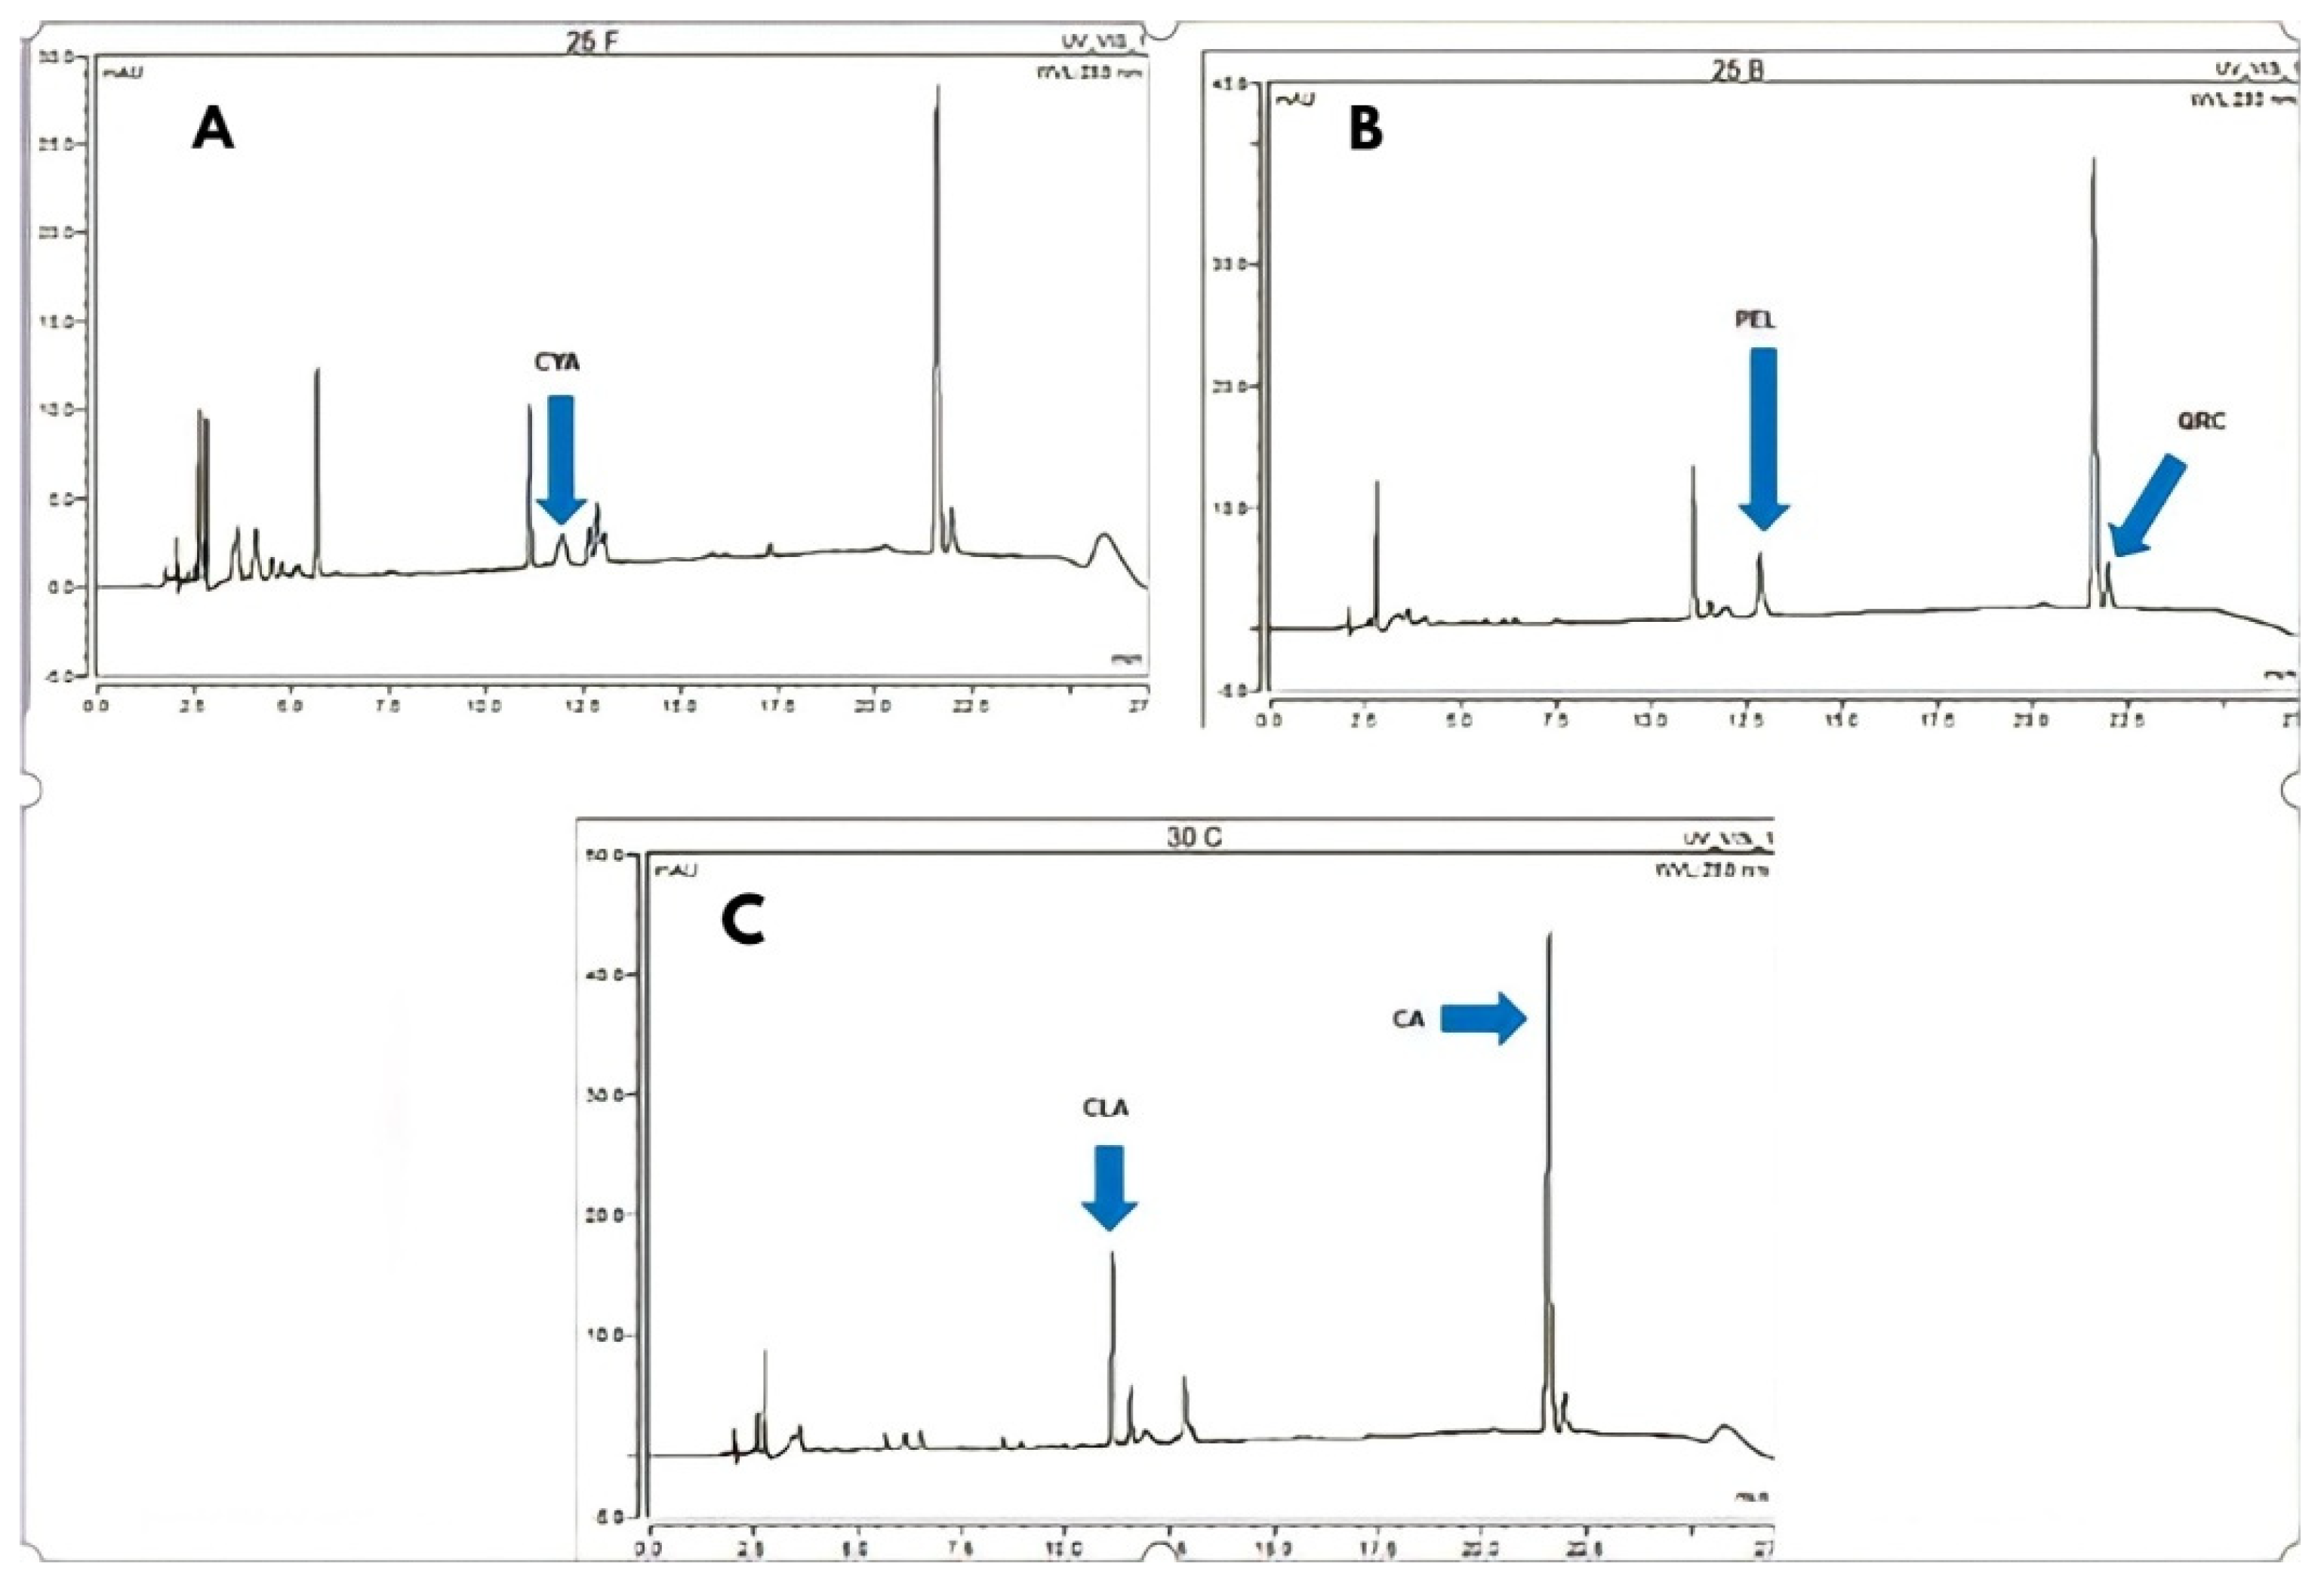
3.2. Analysis by High-Performance Liquid Chromatography (HPLC)

Each of the five phenolic compound standards that were tested were clearly eluted at different retention times (RT). The RT for CYA, CA, QRC, PEL and CLA were 11.84, 21.5, 21.85, 12.86 and 11.04 min, respectively. Salinas-Moreno et al. [17] analyzed the anthocyanidin profiles of three different blue corns, obtaining CYA and PEL as the majority peaks in the HPLC analysis.

3.2.1. Pelargonidin 3-Glucoside (PEL)

Unlike CYA, PEL was actually found on sample B of the initial extraction, whose concentration was 2.5 mg kg−1. Figure 2 shows the peak obtained in the HPLC analysis. In the first cycle of the fermentation of 20 days, sample 20 F had the most concentration of PEL at 94.11 mg kg−1. In the second cycle of fermentation (25 days), sample 25 B obtained the maximum concentration at a value of 143.15 mg kg−1 in the entire fermentation. Moreover, Figure 3 shows sample 30 C at 98.05 mg/L of PEL.

3.2.2. Cyanidin 3-Glucoside (CYA)

During the initial extraction of blue corn flour without fermenting, there was no HPLC peak obtained that corresponded to CYA, which could have happened because there was an anthocyanins degradation during the extraction due to the instability of the molecule [18]. The presence of CYA in blue corn has been investigating throughout time. Authors such Escalante-Aburto et al. [19] analyzed specific anthocyanins coming from blue corn snacks, while Abdel-Aal et al. [20] investigated anthocyanin concentrations in the blue corn kernels up to 1260 mg kg−1. In the first cycle of the fermentation, over 20 days, sample 20 A had the most concentration of CYA in that group, with 99.82 mg kg−1. In the second cycle of fermentation (25 days), sample 25 F had the most concentration, with 314.32 mg kg−1 being the maximum concentration reached of CYA in the entire fermentation. Figure 3 shows the HPLC chromatogram of sample 25 F. In the 30 days of fermentation, sample 30 C had 175.43 mg kg−1. All the sample concentrations are found in Table 1. Wang et al. [21] showed that two genotypes of strawberries (Fragaria virginiana) increased the anthocyanin content when this fruit was infected with Colletotrichum sp. In this study with blue corn flour, this information can support the increase of phenolic compounds in our fermented samples.

3.2.3. Cinnamic Acid (CA)

Kumar-Singh et al. [22] found that CA is one of the basic phenylpropanoids with antioxidant activity, produced by plants in response to stressful conditions; in this case, they used corn seeds that subjected them to a sodium chloride (NaCl) treatment to cause stress in plant growth. In plants, anthocyanidins accumulate in their glycosylated form; that is, they attach to some sugars; in which case, they are called anthocyanins. In some cases, the sugars are acylated with groups derived from acetic acid or some of the four cinnamic acids (p-coumaric, caffeic, ferulic or synapic). It has been observed that the presence of these acyl groups in the anthocyanidin molecule confers stability under extreme conditions of pH and temperature, and this demonstrates the presence of cinnamic acid in fermented blue corn flour samples (Zea mays L.) with Colletotrichum gloeosporioides [23]. As the same way as PEL, CA was found in the initial extraction samples, which had 42.89 mg kg−1 of concentration of this phenolic compound in the unfermented sample. After the 20 days of the fermentation process, sample 20 B had the most concentration of CA in that group at 116.12 mg kg−1. Moreover, sample 25 B had the most concentration of CA at 188.27 mg kg−1, and after 30 days of fermentation, sample 30 C generated the maximum concentration reach of CA (207.92 mg kg−1) in fermentation.

3.2.4. Quercetin (QRC)

QRC is typically found in plants as glycone or conjugates of carbohydrates present in a wide variety of foods; most prominent are red and yellow onion, chili, broccoli, spinach, some flowers and in wine [24]. It may not be found naturally within blue corn, since something related was not found in any bibliography. In the samples belonging to the initial extraction, no peak was identified that would correspond to the retention time of QRC but was found in the fermented samples, which allows us to suppose that Colletotrichum gloeosporioides may have been involved in the production of this flavonoid. The formation of flavonoids takes place from aromatic amino acids phenylalanine and tyrosine and, also, from acetate units. Phenylalanine and tyrosine give instead of cinnamic acid and parahydroxycinnamic acid, which, when condensed with acetate, originate the cinnamon structure of flavonoids [25]. Sample 20 D had the most concentration of QRC in that group at 28.93 mg kg−1, while sample 25 B (Figure 3) had the maximum concentration reached of QRC at 58.39 mg kg−1 during the entire fermentation. Finally, on day 30, sample C produced a quantity of 21.52 mg kg−1.

3.2.5. Chlorogenic Acid (CLA)

Chlorogenic acid has been extensively studied, as it is widely distributed in plants, is one of the main polyphenols in the human diet and has many health-promoting properties. Chlorogenic acid can be found in foods and herbs such as apples, artichokes, betels, carrots, coffee beans, eggplants, grapes, kiwi, pears, plums, potatoes, tea, tobacco leaves and tomatoes [26]. A detail of great importance is that chlorogenic acid was the most abundant phenolic compound present in fermented samples of blue corn flour and Czapek Dox culture medium with Colletotrichum gloeosporioides. Sample 20 F had the highest concentration of CLA at 307.47 mg kg−1, while the lowest concentration was obtained for sample 20 B (266.18 mg kg−1). Sample 25 B obtained 404.71 mg kg−1, and sample 25 C had the lowest concentration of CLA of the 25 at 254.15 mg kg−1. In the 30 days of fermentation, sample 30 C (Figure 3) had the highest concentration of CLA at 507.30 mg kg−1, being also the sample with the highest concentration reached in the entire fermentation process.
It is important to mention that sample 25 B obtained the highest concentrations of PEL and QRC, as well as sample 30 C reached the highest concentrations of CA and CLA in fermentation, which may indicate an affinity of C. gloeosporioides to the proportion of 80 mL of culture medium in Czapek Dox broth and 20 g of blue corn flour.
Hernandez-Quintero et al. [27] analyzed the concentrations of CYA and PEL in blue corn (Zea mays L.), and they found concentrations of 155 mg kg−1 and 14 mg kg−1, respectively, remembering that those samples were not fermented; in this case, comparing with the fermented samples where the maximum concentration of CYA was 314 mg kg−1 and 143 mg kg−1 of PEL, there was a clear potentiation by C. gloeosporioides in the CYA and PEL blue corn contents. Similar results were found by Awas et al. [28], who obtained 4330 mg kg−1 in a sample of cinnamon (Cinnamomum verum), knowing that cinnamon is a food with high content of this phenolic compound. In the initial extraction of CA, a concentration of 42.89 mg kg−1 was obtained, but in the fermented samples, there was an increase, with an average concentration of 132 mg kg−1.
Muñoz-Muñoz. [29] extracted QRC from Calendula (Calendula officinalis), obtaining a concentration range of 63–72 mg kg−1; in the case of the initial extraction samples, their presence was not seen, the reason being that QRC was not in blue corn naturally, but in the fermented samples, the maximum concentration of QRC was 58 mg kg−1; while this is a low concentration compared to the other phenolic compounds studied in this investigation, there was a potentiation of QRC by C. gloeosporioides. Turkoz et al. [30] obtained CLA from wine at a quantity of 80 mg kg−1. During the initial extraction, no peak corresponding to CLA in the HPLC analysis was found; even if, in most of the plants, CLA was produced in very low concentrations mainly for antifungal activity, the concentrations found in the fermented samples were very high. The average concentration of CLA was 308 mg kg−1, and the maximum concentration of CLA reached in the fermented samples was 507 mg kg−1.
Ziberna et al. [31] analyzed rats with ischemia–reperfusion (I-R) conditions using cranberry anthocyanin extracts, where their antioxidant activity was evaluated by measuring the intrinsic ability to scavenge free radicals and by means of the cellular antioxidant assay (CAA) in endothelial cells, in which the intracellular capacity to inhibit the formation of peroxyl radicals was quantified. The perfusion with low concentrations of cranberry anthocyanins (0.01 mg kg−1) attenuated significantly the extent of injury, as evidenced by the slowing down of LDH release, increase post-ischemic coronary flow and decrease in the incidence and duration of reperfusion arrhythmias. High concentrations (5–50 mg kg−1) showed decreased cardio protection and cardiotoxic activity, despite their radical scavenging and intracellular antioxidant capacities increased in a concentration-dependent manner. This study revealed the dependent bioactivity of the biphasic concentration of cranberry anthocyanins low I–R, resulting in strong cardio protective activity at low concentrations and cardiotoxic activity in high concentrations. The anthocyanin concentrations obtained in the fermented samples were a maximum of 314 mg kg−1 and 143 mg kg−1 (CYA and PEL, respectively), which means that these concentrations were very significant and could be helpful in applications related to Ziberna et al. [31]
According to Adisakwattana et al. [32], CA and its derivatives were studied, where they evaluated the insulin secretory activity in rat pancreas and pancreatic β cells (INS-1). Some substituents were added to the CA structure, which was shown to be the most potent insulin-secreting agent. In that study, ferulic acid (FA) (a type of cinnamic acid) at 4 mg kg−1 was found to significantly stimulate insulin secretion. The intravenous administration of FA (5 ppm) significantly decreased the plasma glucose and increased the insulin concentration in normal rats. In the fermented samples, a maximum concentration of 207 mg kg−1 was obtained, and if compared with Adisakwattana et al. [32], used to promote insulin secretion in rats, which are considered to have occurred significant amounts in the samples from the fermentation of blue corn flour with Colletotrichum gloeosporioides. Li et al. [33] determined the proapoptotic effect of high concentrations (2–4 mg kg−1) and low concentrations (0.5 mg kg−1) of QRC as result to varying degrees of attenuation of cytotoxicity from cisplatin treatment, a fairly toxic chemotherapeutic agent related to causing kidney toxicity, nausea, severe vomiting and myelosuppression. It was observed that low concentrations of QRC suppress injury induced by reactive oxygen species (ROS) that reduce the level of intracellular ROS and increase the expression of antioxidants enzymes. A maximum concentration of 58 mg kg−1 was obtained in the fermented samples, even if they were obtained in low concentrations compared to the other compounds in the blue corn flour samples with Colletotrichum gloeosporioides, as already mentioned by Li et al. [33]; this confirms that some applications adjust to the concentration obtained, no matter how low it is.
Karthikesan et al. [34] conducted a study to evaluate the effects of tetrahydrocurcumin (THC) and CLA, single and combined, about alterations in the lipids, lipoproteins and enzymes involved in the metabolism of lipids in type 2 diabetic rats. They concluded that a combined administration of chlorogenic acid (5 mg kg−1) and THC (80 mg kg−1) for 45 days can improve the lipid abnormalities in type 2 diabetes. In fermented samples of blue corn flour with Colletotrichum gloeosporioides, high concentrations were found, so they were considered important amounts in relation to the required concentrations compared to the results of Karthikesan et al. [34]. Table 2 shows all the information mentioned.

3.2.6. Analysis of Variance (ANOVA) of the Fermented Samples

In both PEL and CA, the null hypotheses of F1 and INT were not rejected, which means that neither the proportions nor the interactions between both factors influenced the concentration of phenolic compounds. Only the null hypothesis of F2 was rejected, with time being the only factor influencing the concentrations of those phenolic compounds in the fermented samples. CYA and QRC had in common that the null hypothesis was not rejected either in the F1, F2 or the interactions between both. This means that not the time, the proportions or the interactions between the two influenced the concentrations of those phenolic compounds in the fermented samples. There was a difference in CLA where the null hypotheses of F1 and F2 were rejected, showing that neither time nor proportions influenced the concentration of CLA in the fermented samples.

4. Conclusions

In the initial extraction of phenolic compounds, in unfermented blue corn flour, PEL and CA molecules could be identified; however, it can be assumed that CYA may have been degraded in the extraction process, since it is the most abundant phenolic compound in blue corn, but CYA and PEL were obtained in the samples fermented with an average of 119.90 mg kg−1 and 88.07 mg kg−1, respectively, due to the fact that the phenolic compound extraction methodology during fermentation was different and apparently more successful. The predominant phenolic compound in blue corn flour fermented with Colletotrichum gloeosporioides was CLA with an average of concentration 308.99 mg kg−1, including all samples at 20, 25 and 30 days of fermentation. The average concentration of CA in the samples fermented was 132.61 mg kg−1. CA is not considered within the phenolic compounds present in blue corn but can normally be found as a molecule associated with the glycoside of anthocyanins found in blue corn flour to provide stability to the anthocyanin structure. Despite the moderate concentration of QRC after fermentation (20.90 mg kg−1), these results indicate that it is possible to produce phenolic compounds using blue corn as the subtract in a fermentation process with Colletotrichum gloeosporioides.

Author Contributions

Conceptualization, L.H.-O.; methodology, N.A.-O., J.G.A.S., G.V.-R., J.E-G., D.C.-F. and T.R.-A.; validation, L.H.-O. and A.Q.-R.; investigation, G.V.-R., N.A.-O. and J.E.-G.; writing—review and editing, G.V.-R., J.E.-G., N.A.-O. and L.H.-O. and formal analysis, D.C.-F., T.R.-A. and D.N.-S. All authors have read and agreed to the published version of the manuscript.

Funding

This research received no external funding.

Institutional Review Board Statement

Not applicable.

Informed Consent Statement

Not applicable.

Acknowledgments

The authors wish to thank the Autonomous University of Chihuahua (UACH) for the support and infrastructure.

Conflicts of Interest

The authors declare no conflict of interest.

References

  1. Clydesdale, F.M.; Francis, F.J. Food Nutrition and Health; The AVI Publishing Company, Inc.: Westport, CT, USA, 1985. [Google Scholar]
  2. Oh, M.M.; Trick, H.N.; Rajashekar, C.B. Secondary Metabolism and Antioxidants are Involved in Environmental Adaptation and Stress Tolerance in Lettuce. J. Plant Physiol. 2009, 166, 180–191. [Google Scholar] [CrossRef] [PubMed]
  3. Yue, W.; Ming, Q.L.; Lin, B.; Rahman, K.; Zheng, C.J.; Han, T.; Qin, L.P. Medicinal Plant Cell Suspension Cultures: Pharmaceutical Applications and High-Yielding Strategies for the Desired Secondary Metabolites. Crit. Rev. Biotechnol. 2016, 36, 215–232. [Google Scholar] [CrossRef] [PubMed]
  4. Khurana, S.; Venkataraman, K.; Hollingsworth, A.; Piche, M.; Tai, T. Polyphenols: Benefits to the Cardiovascular System in Health and in Aging. Nutrients 2013, 5, 3779–3827. [Google Scholar] [CrossRef] [PubMed]
  5. Bravo, L. Polyphenols: Chemistry, Dietary Sources, Metabolism, and Nutritional Significance. Nutr. Rev. 1998, 56, 317–333. [Google Scholar] [CrossRef]
  6. Brglez Mojzer, E.; Knez Hrnčič, M.; Škerget, M.; Knez, Ž.; Bren, U. Polyphenols: Extraction Methods, Antioxidative Action, Bioavailability and Anticarcinogenic Effects. Molecules 2016, 21, 901. [Google Scholar] [CrossRef]
  7. Valdés, L.; Cuervo, A.; Salazar, N.; Ruas-Madiedo, P.; Gueimonde, M.; González, S. The Relationship between Phenolic Compounds from Diet and Microbiota: Impact on Human Health. Food Funct. 2015, 6, 2424–2439. [Google Scholar] [CrossRef]
  8. Salinas-Moreno, Y.; García-Salinas, C.; Ramírez-Díaz, J.L.; Alemán-de la Torre, I. Phenolic Compounds in Maize Grains and Its Nixtamalized Products. In Phenolic Compounds-Natural Sources, Importance and Applications; Soto-Hernandez, M., Palma-Tenango, M., Garcia-Mateos, M.R., Eds.; Publisher Intech Open: London, UK, 2017; pp. 215–232. [Google Scholar]
  9. Urias-Lugo, D.A.; Heredia, J.B.; Muy-Rangel, M.D.; Valdez-Torres, J.B.; Serna Saldívar, S.O.; Gutiérrez-Uribe, J.A. Anthocyanins and phenolic acids of hybrid and native blue maize (Zea mays L.) extracts and their antiproliferative activity in mammary 95 (MCF7), liver (HepG2), colon (Caco2 and HT29) and prostate (PC3) Cancer Cells. Plant Foods Hum. Nutr. 2015, 70, 193–199. [Google Scholar] [CrossRef]
  10. Mesfin, T.; Wassie, H.; Kassa, S. Effects of Nitrogen and Blended Fertilizers on Yield and Yield Components of tef (Eragrostis tef Trotter) in Central Highlands of Ethiopia. Int. J. Adv. Agric. Sci. Tech. 2019, 6, 15–64. [Google Scholar]
  11. Dulf, F.V. Effects of solid-state fermentation with two filamentous fungi on the total phenolic contents, flavonoids, antioxidant activities and lipid fraction of plum fruit (Prunus domestica L.) by-products. Food Chem. 2016, 209, 27–36. [Google Scholar] [CrossRef]
  12. Alarcón-Saenz, M.A. Aislamiento e Identificación de un Hongo Endófito del Fruto de Chagalapoli (Ardisia Compressa) y Su Relación en la Composición Química. Master’s Thesis, Universidad Autónoma de Chihuahua, Chihuahua, Mexico, 2017. [Google Scholar]
  13. Colomé, J.; Cano, R.; Kubinski, A.; Grady, D. Laboratory Exercises in Microbiology; West Publishing Company: St. Paul, MN, USA, 1996; pp. 283–295. [Google Scholar]
  14. Aguilar, C.N. Fungal culture systems for production of antioxidant phenolics using pecan nut shells as sole carbon source. Am. J. Agric. Biol. Sci. 2010, 5, 397–402. [Google Scholar]
  15. Dewanto, V.; Wu, K.K.; Liu, R.H. Thermal processing enhances the nutritional value of tomatoes by increasing total antioxidant activity. J. Agric. Food Chem. 2002, 50, 3010–3014. [Google Scholar] [CrossRef]
  16. Salinas-Moreno, Y.; García-Salinas, C.; Coutiño-Estrada, B.; Vidal-Martínez, V. Content and type variability of anthocyanins in blue/purple colored grains of Mexican maize populations. Rev. Fitotec. Mex. 2010, 36, 285–294. [Google Scholar]
  17. Salinas-Moreno, Y.; Pérez-Alonso, J.; Vázquez-Carrillo, G.; Aragón-Cuevas, F.; Velázquez-Cardelas, G.A. Antocianinas y actividad antioxidante en maíces (Zea mays L.) de las razas Chalqueño, Elotes Cónicos y Bolita. Agrociencia 2012, 47, 815–825. [Google Scholar]
  18. Herrera-Sotero, M.; Cruz-Hernández, C.E.; Trujillo-Carretero, C.; Rodríguez-Dorantes, M. Antioxidant and antiproliferative activity of blue corn and tortilla from native maize. Chem. Cent. J. 2017, 11, 110. [Google Scholar] [CrossRef] [Green Version]
  19. Escalante-Aburto, A.; Ponce-García, N.; Ramírez-Wong, B.; Torres-Chávez, P.I.; Figueroa-Cárdenas, J.; Gutiérrez-Dorado, R. Specific Anthocyanin Contents of Whole Blue Maize Second-Generation Snacks: An Evaluation Using Response Surface Methodology and Lime Cooking Extrusion. J. Chem. 2016, 2016, 5491693. [Google Scholar] [CrossRef] [Green Version]
  20. Abdel-Aal, E.S.; Young, C.; Rabalski, I. Anthocyanin Composition in Black, Blue, Pink, Purple and Red Cereal Grains. J. Agric. Food Chem. 2006, 54, 4696–4704. [Google Scholar] [CrossRef] [PubMed]
  21. Wang, S.Y.; Lewers, K.S. Antioxidant Capacity and Flavonoid Content in Wild Strawberries. J. Am. Soc. Hort. Sci. 2007, 132, 629–637. [Google Scholar] [CrossRef] [Green Version]
  22. Kumar-Singh, P.; Singh, R.; Singh, S. Cinnamic acid induced changes in reactive oxygen species scavenging enzymes and protein profile in maize (Zea mays L.) plants grown under salt stress. Physiol. Mol. Biol. Plants 2013, 19, 53–59. [Google Scholar] [CrossRef] [PubMed]
  23. Clifford, M.N. Chlorogenic acids and other cinnamates, nature, occurrence and dietary burden. J. Sci. Food Agric. 1999, 79, 362–372. [Google Scholar] [CrossRef]
  24. Lakhanpal, P.; Rai, D.K. Quercetin: A Versatile Flavonoid. Internet J. Med. Update 2007, 2, 22–37. [Google Scholar] [CrossRef] [Green Version]
  25. Álvarez-Castro, E.; Orallo-Cambeiro, F. Actividad biológica de los flavonoides (I) Acción frente al cáncer. Ámbito farmacéutico. Bioquímica 2003, 22, 130–140. [Google Scholar]
  26. Santana-Gálvez, J.; Cisneros-Zevallos, L.; Jacobo-Velázquez, D. Chlorogenic Acid: Recent Advances on Its Dual Role as a Food Additive and a Nutraceutical against Metabolic Syndrome. Molecules 2017, 22, 358. [Google Scholar] [CrossRef] [PubMed] [Green Version]
  27. Hernández-Quintero, J.D.; Rosales-Nolasco, A.; Molina-Macedo, A.; Miranda Piliado, A.; Willcox, M.; Hernández-Casillas, J.M.; Palacios-Rojas, N. Cuantificación De Antocianinas Mediante Espectroscopía De Infrarrojo Cercano Y Cromatografía Líquida En Maíces Pigmentados. Rev. Fitotec. Mex. 2017, 40, 219–225. [Google Scholar] [CrossRef] [Green Version]
  28. Awas, R.; Hamad, H.; Dayyih, W.A.; Mallah, E.; Hamad, M. Quality Control of Cinnamic Acid in Traditional Medicinal Plants In Jordan Using High Performance Liquid Chromatography. Int. J. Pharm. Pharm. Sci. 2014, 6, 411–418. [Google Scholar]
  29. Muñoz-Muñoz, J.A.; Morgan Machado, J.E.; Trujillo González, M. Validation of an HPLC method for quantification of total quercetin in Calendula officinalis extracts. Rev. Cuba. Farm. 2015, 49, 91–102. [Google Scholar]
  30. Türköz-Acar, E.; Celep, M.E.; Charehzaz, M.; Akyüz, G.S.; Yesilada, E. Development and Validation of a High-performance Liquid Chromatography–Diode-array Detection Method for the Determination of Eight Phenolic Constituents in Extracts of Different Wine Species. Turk J. Pharm. Sci. 2018, 15, 22–28. [Google Scholar]
  31. Ziberna, L.; Lunder, M.; Moze, S.; Vanzo, A.; Tramer, F.; Passamonti, S.; Drevensek, G. Acute Cardioprotective and Cardiotoxic Effects of Bilberry Anthocyanins in Ischemia–Reperfusion Injury: Beyond Concentration-Dependent Antioxidant Activity. Cardiovasc. Toxicol. 2010, 10, 283–294. [Google Scholar] [CrossRef]
  32. Adisakwattana, S.; Moonsan, P.; Yibchok-Anun, S. Insulin-releasing properties of a series of cinnamic acid derivatives in vitro and in vivo. J. Agric. Food Chem. 2008, 56, 7838–7844. [Google Scholar] [CrossRef]
  33. Li, N.; Sun, C.; Zhou, B.; Xing, H.; Ma, D.; Chen, D.; Weng, D. Low Concentration of Quercetin Antagonizes the Cytotoxic Effects of Anti-Neoplastic Drugs in Ovarian Cancer. PLoS ONE 2014, 9, e100314. [Google Scholar] [CrossRef]
  34. Karthikesan, K.; Pari, L.; Menon, V.P. Antihyperlipidemic effect of chlorogenic acid and tetrahydrocurcumin in rats subjected to diabetogenic agents. Chem.-Biol. Interact. 2010, 188, 643–650. [Google Scholar] [CrossRef]
Figure 1. Qualitive analysis of the samples of blue corn (Zea mays L.) flour with Colletotrichum gloeosporioides. In the black box in the figure, it shows the jellification process.
Fermentation 08 00243 g001
Figure 2. HPLC chromatogram obtained from the calibration curve in the analysis of the mixture of standards used: CYA (Cyanidin 3-glucoside), PEL (Pelargonidin 3-glucoside), CA (Cinnamic acid), QRC (Quercetin) and CLA (Chlorogenic acid).
Fermentation 08 00243 g002
Figure 3. (A): HPLC chromatographic profile of sample 25 F, which showed more concentration of CYA. (B) HPLC chromatographic profile of sample 25 B, which showed more concentration of PEL and QRC. (C) HPLC chromatographic profile of sample 30 C, which showed more concentration of CLA and CA.
Fermentation 08 00243 g003
Table 1. Phenolic compounds concentrations (mg kg−1) found in the samples of blue corn flour and C. gloeosporioides fermentation.
SampleCYA
(mg kg−1)
PEL
(mg kg−1)
CA
(mg kg−1)
QRC
(mg kg−1)
CLA
(mg kg−1)
20 A99.82 80.23113.3223.49267.47
20 B90.3287.24116.1228.52266.18
20 C86.2677.24108.2725.65275.92
20 D93.2188.98114.9628.93260.27
20 E86.1083.15110.6924.80273.33
20 F91.3294.11115.9228.15307.47
25 A110.82108.83136.8834.26325.40
25 B145.43143.15188.2758.39404.71
25 C92.04101.90112.0228.61254.15
25 D98.10110.82128.7635.76291.65
25 E99.9885.48111.1125.32260.31
25 F314.327514123.6429.29303.20
30 A76.1089.97149.1322.06258.20
30 B72.9362.11145.3422.27274.93
30 C175.4398.05207.9242.87507.30
30 D113.5473.15139.3623.80349.71
30 E170.3759.04128.2820.76342.47
30 F142.1066.65136.6221.52339.15
Table 2. Comparison of the extractions obtained in samples from the fermented samples of other authors and their biological interests.
Phenolic CompoundReferenceReference Concentration (mg/L)Biological ActivityMaximum Concentration in Fermented Samples (mg/L)Average Concentration of Fermented Samples (mg/L)
CYA
PEL
[31]Low: 0.01–1
High: 5–50
cardioprotective activity
cardiotoxic activity
314
143
180
88
CA[32]4Insulin secretion stimulation207132
QRC[33]0.5–1Suppression of injury induced by reactive oxygen species (ROS)5829
CLA[34]5Improvement of lipid abnormalities due to type 2 diabetes507308
CYA (Cyanidin 3-glucoside), PEL (Pelargonidin 3-glucoside), CA (Cinnamic acid), QRC (Quercetin) and CLA (Chlorogenic acid).
Publisher’s Note: MDPI stays neutral with regard to jurisdictional claims in published maps and institutional affiliations.

