
Impact of BMI, Physical Activity, and Sitting Time Levels on Health-Related Outcomes in a Group of Overweight and Obese Adults with and without Type 2 Diabetes

 , , , , , and
Abstract
:1. Introduction
2. Materials and Methods
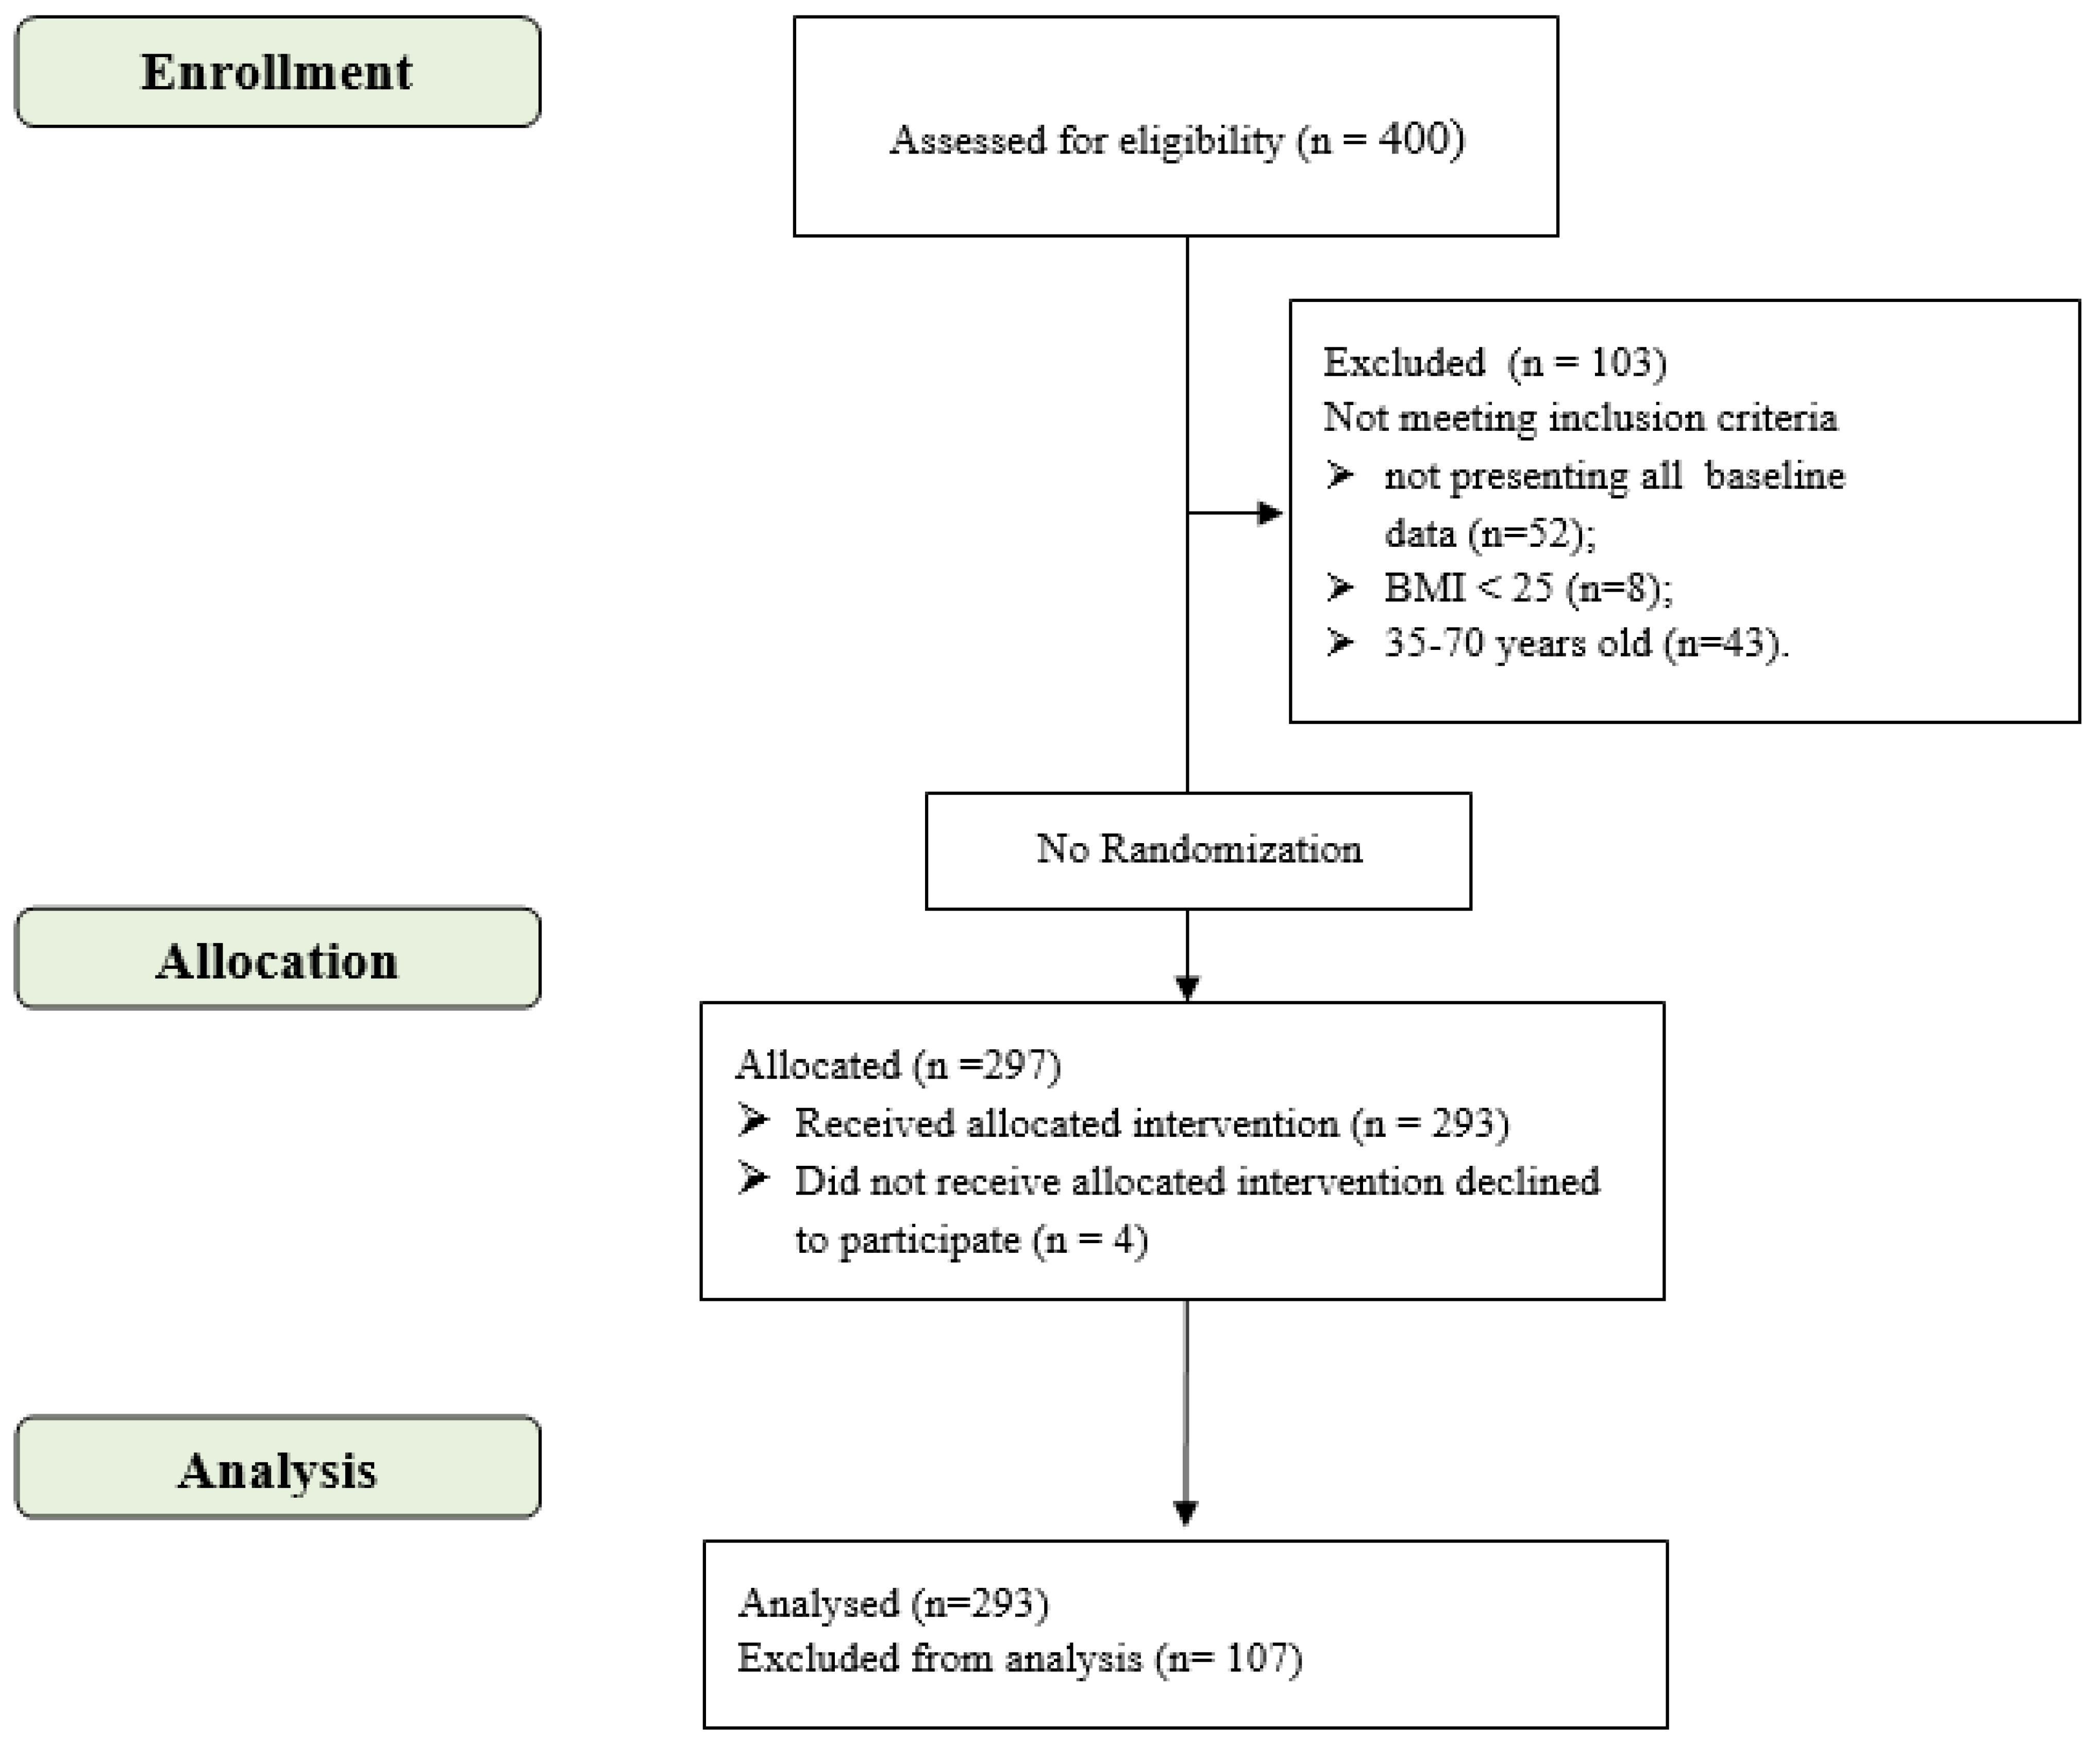
2.1. Participants
- -
- “people with overweight” (or OVER), corresponding to BMI 25–29.9 (n = 63, BMI mean = 28 ± 1.31);
- -
- “people with I degree of obesity” (or I OB), corresponding to BMI 30–34.9 (n = 131, BMI mean = 32.5 ± 1.48);
- -
- “people with II degrees (or superior) of obesity” (or II OB), corresponding to BMI > 35 (n = 99, BMI mean = 38.6 ± 3).
- -
- “low PAL”, (n = 153, mean = 2.2 ± 2.8 MET-h per week);
- -
- “moderate PAL”, (n = 108, mean = 20.4 ± 11.8 MET-h per week);
- -
- “high PAL”, (n = 32, mean = 71.4 ± 32.7 MET-h per week).
- -
- “low SIT”, corresponding to <4 h/day (n = 82, mean = 1.5 ± 1.2 h/day);
- -
- “medium SIT”, corresponding to 4–5.9 h/day (n = 63, mean = 4.6 ± 0.5 h/day);
- -
- “high SIT”, corresponding to 6–8 h/day of sitting time (n = 99, mean = 6.8 ± 0.8 h/day);
- -
- “very high SIT”, corresponding to >8 h/day of sitting time (n = 43, mean = 10.4 ± 1.5 h/day).
2.2. Intervention
2.3. Measures
2.3.1. Clinical and Anthropometric Variable Measures
2.3.2. Physical Performance Measures
2.3.3. Self-Report Questionnaire Measures
2.4. Data Analysis
2.5. Sample Size Calculation
3. Results
4. Discussion
5. Conclusions
Supplementary Materials
Author Contributions
Funding
Institutional Review Board Statement
Informed Consent Statement
Data Availability Statement
Conflicts of Interest
References
- Whipple, M.O.; Regensteiner, J.G.; Bergouignan, A. Is Being Physically Active Enough to Be Metabolically Healthy? The Key Role of Sedentary Behavior. Diabetes Care 2021, 44, 17–19. [Google Scholar] [CrossRef] [PubMed]
- Nakanishi, S.; Hirukawa, H.; Shimoda, M.; Tatsumi, F.; Kohara, K.; Obata, A.; Okauchi, S.; Katakura, Y.; Sanada, J.; Fushimi, Y.; et al. Impact of physical activity and sedentary time on glycated hemoglobin levels and body composition: Cross-sectional study using outpatient clinical data of Japanese patients with type 2 diabetes. J. Diabetes Investig. 2020, 11, 633–639. [Google Scholar] [CrossRef] [PubMed] [Green Version]
- Thivel, D.; Tremblay, A.; Genin, P.M.; Panahi, S.; Riviere, D.; Duclos, M. Physical Activity, Inactivity, and Sedentary Behaviors: Definitions and Implications in Occupational Health. Front. Public Health 2018, 6, 288. [Google Scholar] [CrossRef] [PubMed]
- World Health Organization. WHO Guidelines on Physical Activity and Sedentary Behaviour; WHO: Geneva, Switzerland, 2020.
- Tremblay, M.S.; Aubert, S.; Barnes, J.D.; Saunders, T.J.; Carson, V.; Latimer-Cheung, A.E.; Chastin, S.F.M.; Altenburg, T.M.; Chinapaw, M.J.M.; On Behalf of SBRN Terminology Consensus Project Participants. Sedentary Behavior Research Network (SBRN)—Terminology Consensus Project process and outcome. Int. J. Behav. Nutr. Phys. Act. 2017, 14, 75. [Google Scholar] [CrossRef] [PubMed] [Green Version]
- Magnon, V.; Dutheil, F.; Auxiette, C. Sedentariness: A Need for a Definition. Front. Public Health 2018, 6, 372. [Google Scholar] [CrossRef] [PubMed] [Green Version]
- Biswas, A.; Oh, P.I.; Faulkner, G.E.; Bajaj, R.R.; Silver, M.A.; Mitchell, M.S.; Alter, D.A. Sedentary time and its association with risk for disease incidence, mortality, and hospitalization in adults: A systematic review and meta-analysis. Ann. Intern. Med. 2015, 162, 123–132. [Google Scholar] [CrossRef]
- Madden, K.M.; Feldman, B.; Chase, J. Sedentary Time and Metabolic Risk in Extremely Active Older Adults. Diabetes Care 2020, 44, 194–200. [Google Scholar] [CrossRef]
- Hu, F.B.; Li, T.Y.; Colditz, G.A.; Willett, W.C.; Manson, J.E. Television Watching and Other Sedentary Behaviors in Relation to Risk of Obesity and Type 2 Diabetes Mellitus in Women. J. Am. Med. Assoc. 2003, 289, 1785–1791. [Google Scholar] [CrossRef] [Green Version]
- Ekelund, U.; Steene-Johannessen, J.; Brown, W.J.; Fagerland, M.W.; Owen, N.; Powell, K.E.; Bauman, A.; Lee, I.-M.; Ding, D.; Lancet Sedentary Behaviour Working Group; et al. Does physical activity attenuate, or even eliminate, the detrimental association of sitting time with mortality? A harmonised meta-analysis of data from more than 1 million men and women. Lancet 2016, 388, 1302–1310. [Google Scholar] [CrossRef] [Green Version]
- Shields, M.; Tremblay, M.S. Sedentary behaviour and obesity. Health Rep. 2008, 19, 19–30. [Google Scholar]
- Lee, P.H.; Macfarlane, D.J.; Lam, T.H.; Stewart, S.M. Validity of the international physical activity questionnaire short form (IPAQ-SF): A systematic review. Int. J. Behav. Nutr. Phys. Act. 2011, 8, 115. [Google Scholar] [CrossRef] [PubMed] [Green Version]
- Craig, C.L.; Marshall, A.L.; Sjöström, M.; Bauman, A.E.; Booth, M.L.; Ainsworth, B.; Pratt, M.; Ekelund, U.; Yngve, A.; Sallis, J.F.; et al. International Physical Activity Questionnaire: 12-Country Reliability and Validity. Med. Sci. Sports Exerc. 2003, 35, 1381–1395. [Google Scholar] [CrossRef] [PubMed] [Green Version]
- Van Poppel, M.N.M.; Chinapaw, M.J.M.; Mokkink, L.B.; Van Mechelen, W.; Terwee, C.B. Physical Activity Questionnaires for Adults: A systematic review of measurement properties. Sports Med. 2010, 40, 565–600. [Google Scholar] [CrossRef] [PubMed]
- Standard Italiani per la Cura dell’Obesità SIO-ADI. Available online: https://www.sio-obesita.org/wp-content/uploads/2017/09/STANDARD-OBESITA-SIO-ADI.pdf (accessed on 2 November 2021).
- Petridou, A.; Siopi, A.; Mougios, V. Exercise in the management of obesity. Metabolism 2019, 92, 163–169. [Google Scholar] [CrossRef] [PubMed] [Green Version]
- Battista, F.; Ermolao, A.; van Baak, M.A.; Beaulieu, K.; Blundell, J.E.; Busetto, L.; Carraça, E.V.; Encantado, J.; Dicker, D.; Farpour-Lambert, N.; et al. Effect of exercise on cardiometabolic health of adults with overweight or obesity: Focus on blood pressure, insulin resistance, and intrahepatic fat—A systematic review and meta-analysis. Obes. Rev. 2021, 22, e13269. [Google Scholar] [CrossRef] [PubMed]
- Henson, J.; Dunstan, D.W.; Davies, M.; Yates, T. Sedentary behaviour as a new behavioural target in the prevention and treatment of type 2 diabetes. Diabetes/Metabolism Res. Rev. 2016, 32, 213–220. [Google Scholar] [CrossRef] [PubMed] [Green Version]
- Balducci, S.; Sacchetti, M.; Haxhi, J.; Orlando, G.; D’Errico, V.; Fallucca, S.; Menini, S.; Pugliese, G. Physical exercise as therapy for type 2 diabetes mellitus. Diabetes/Metabolism Res. Rev. 2014, 30, 13–23. [Google Scholar] [CrossRef]
- Zanuso, S.; Jimenez, A.; Pugliese, G.; Corigliano, G.; Balducci, S. Exercise for the management of type 2 diabetes: A review of the evidence. Acta Diabetol. 2009, 47, 15–22. [Google Scholar] [CrossRef] [Green Version]
- Gobbo, S.; Bullo, V.; Roma, E.; Duregon, F.; Bocalini, D.S.; Rica, R.L.; Di Blasio, A.; Cugusi, L.; Vendramin, B.; Bergamo, M.; et al. Nordic Walking Promoted Weight Loss in Overweight and Obese People: A Systematic Review for Future Exercise Prescription. J. Funct. Morphol. Kinesiol. 2019, 4, 36. [Google Scholar] [CrossRef] [Green Version]
- Cugusi, L.; Cadeddu, C.; Nocco, S.; Orrù, F.; Bandino, S.; Deidda, M.; Caria, A.; Bassareo, P.P.; Piras, A.; Cabras, S.; et al. Effects of an Aquatic-Based Exercise Program to Improve Cardiometabolic Profile, Quality of Life, and Physical Activity Levels in Men with Type 2 Diabetes Mellitus. PM&R 2014, 7, 141–148. [Google Scholar] [CrossRef]
- Cadeddu, C.; Nocco, S.; Cugusi, L.; Deidda, M.; Bina, A.; Fabio, O.; Bandinu, S.; Cossu, E.; Baroni, M.G.; Mercuro, G. Effects of metformin and exercise training, alone or in association, on cardio-pulmonary performance and quality of life in insulin resistance patients. Cardiovasc. Diabetol. 2014, 13, 93. [Google Scholar] [CrossRef]
- Di Blasio, A.; Di Donato, F.; Di Santo, S.; Bucci, I.; Izzicupo, P.; Di Baldassarre, A.; Gallina, S.; Bergamin, M.; Ripari, P.; Napolitano, G. Aerobic physical exercise and negative compensation of non-exercise physical activity in post-menopause: A pilot study. J. Sports Med. Phys. Fit. 2018, 58, 1497–1508. [Google Scholar] [CrossRef]
- De Feo, P.; Fatone, C.; Burani, P.; Piana, N.; Pazzagli, C.; Battistini, D.; Capezzali, D.; Pippi, R.; Chipi, B.; Mazzeschi, C. An innovative model for changing the lifestyles of persons with obesity and/or Type 2 diabetes mellitus. J. Endocrinol. Investig. 2011, 34, e349–e354. [Google Scholar] [CrossRef]
- World Health Organization. Obesity and Overweight. Available online: http://www.who.int/news-room/fact-sheets/detail/obesity-and-overweight (accessed on 2 November 2021).
- Guidelines for Data Processing and Analysis of the International Physical Activity Questionnaire (IPAQ). Available online: https://sites.google.com/site/theipaq/scoring-protocol (accessed on 15 June 2021).
- Pippi, R.; Di Blasio, A.; Aiello, C.; Fanelli, C.; Bullo, V.; Gobbo, S.; Cugusi, L.; Bergamin, M. Effects of a Supervised Nordic Walking Program on Obese Adults with and without Type 2 Diabetes: The CURIA Mo. Centre Experience. J. Funct. Morphol. Kinesiol. 2020, 5, 62. [Google Scholar] [CrossRef] [PubMed]
- Associazione Medici Diabetologi (AMD); Società Italiana di Diabetologia (SID). Standard Italiani Per La Cura Del Diabete Mellito 2018. Available online: http://www.siditalia.it/pdf/Standard%20di%20Cura%20AMD%20-%20SID%202018_protetto2.pdf (accessed on 14 June 2021).
- Weiglein, L.; Herrick, J.; Kirk, S.; Kirk, E.P. The 1-mile walk test is a valid predictor of VO2max and is a reliable alternative fitness test to the 1.5-mile run in US Air Force males. Mil. Med. 2011, 176, 669–673. [Google Scholar] [CrossRef] [PubMed] [Green Version]
- Brzycki, M. Strength Testing—Predicting a One-Rep Max from Reps-to-Fatigue. J. Phys. Educ. Recreat. Dance 1993, 64, 88–90. [Google Scholar] [CrossRef]
- Mayorga-Vega, D.; Marbán, R.M.; Viciana, J. Criterion-Related Validity of Sit-and-Reach Tests for Estimating Hamstring and Lumbar Extensibility: A Meta-Analysis. J. Sports Sci. Med. 2014, 13, 1–14. [Google Scholar]
- Questionario Internazionale Sull’attività Fisica (IPAQ Italiano) Versione Breve. Available online: https://sites.google.com/site/theipaq/questionnaire_links (accessed on 15 June 2021).
- Mannocci, A.; Di Thiene, D.; Del Cimmuto, A.; Masala, D.; Boccia, A.; De Vito, E.; La Torre, G. International Physical Activity Questionnaire: Validation and Assessment in an Italian Sample. Ital. J. Public Health 2010, 7, 369–376. [Google Scholar] [CrossRef]
- Cohen, J. Statistical Power Analysis for the Behavioral Sciences; Routledge Academic: New York, NY, USA, 1977; p. 283. [Google Scholar]
- Shaw, K.A.; Gennat, H.C.; O’Rourke, P.; Del Mar, C. Exercise for overweight or obesity. Cochrane Database Syst. Rev. 2006, 4, CD003817. [Google Scholar] [CrossRef] [Green Version]
- Reginato, E.; Pippi, R.; Aiello, C.; Tomaro, E.S.; Ranucci, C.; Buratta, L.; Bini, V.; Marchesini, G.; De Feo, P.; Fanelli, C. Effect of Short Term Intensive Lifestyle Intervention on Hepatic Steatosis Indexes in Adults with Obesity and/or Type 2 Diabetes. J. Clin. Med. 2019, 8, 851. [Google Scholar] [CrossRef] [Green Version]
- Tomaro, E.S.; Pippi, R.; Reginato, E.; Aiello, C.; Buratta, L.; Mazzeschi, C.; Perrone, C.; Ranucci, C.; Tirimagni, A.; Russo, A.; et al. Intensive lifestyle intervention is particularly advantageous in poorly controlled type 2 diabetes. Nutr. Metab. Cardiovasc. Dis. 2017, 27, 688–694. [Google Scholar] [CrossRef]
- Balducci, S.; Haxhi, J.; Sacchetti, M.; Orlando, G.; Cardelli, P.; Vitale, M.; Mattia, L.; Iacobini, C.; Bollanti, L.; Conti, F.; et al. Relationships of Changes in Physical Activity and Sedentary Behavior with Changes in Physical Fitness and Cardiometabolic Risk Profile in Individuals with Type 2 Diabetes: The Italian Diabetes and Exercise Study 2 (IDES_2). Diabetes Care 2021, 45, 213–221. [Google Scholar] [CrossRef] [PubMed]
- Cheng, C.-C.; Hsu, C.-Y.; Liu, J.-F. Effects of dietary and exercise intervention on weight loss and body composition in obese postmenopausal women: A systematic review and meta-analysis. Menopause 2018, 25, 772–782. [Google Scholar] [CrossRef] [PubMed]
- Schwingshackl, L.; Dias, S.; Strasser, B.; Hoffmann, G. Impact of Different Training Modalities on Anthropometric and Metabolic Characteristics in Overweight/Obese Subjects: A Systematic Review and Network Meta-Analysis. PLoS ONE 2013, 8, e82853. [Google Scholar] [CrossRef] [Green Version]
- Neeland, I.J.; Ross, R.; Després, J.-P.; Matsuzawa, Y.; Yamashita, S.; Shai, I.; Seidell, J.; Magni, P.; Santos, R.D.; Arsenault, B.; et al. Visceral and ectopic fat, atherosclerosis, and cardiometabolic disease: A position statement. Lancet Diabetes Endocrinol. 2019, 7, 715–725. [Google Scholar] [CrossRef]
- Stoner, L.; Rowlands, D.; Morrison, A.; Credeur, D.; Hamlin, M.; Gaffney, K.; Lambrick, D.; Matheson, A. Efficacy of Exercise Intervention for Weight Loss in Overweight and Obese Adolescents: Meta-Analysis and Implications. Sports Med. 2016, 46, 1737–1751. [Google Scholar] [CrossRef] [Green Version]
- Dieli-Conwright, C.M.; Courneya, K.S.; Demark-Wahnefried, W.; Sami, N.; Lee, K.; Sweeney, F.C.; Stewart, C.; Buchanan, T.A.; Spicer, D.; Tripathy, D.; et al. Aerobic and resistance exercise improves physical fitness, bone health, and quality of life in overweight and obese breast cancer survivors: A randomized controlled trial. Breast Cancer Res. 2018, 20, 124. [Google Scholar] [CrossRef] [PubMed]
- Hsu, K.-J.; Chien, K.-Y.; Tsai, S.-C.; Tsai, Y.-S.; Liao, Y.-H.; Chen, J.-J.; Chen, Y.-R.; Chen, C.-N. Effects of Exercise Alone or in Combination with High-Protein Diet on Muscle Function, Aerobic Capacity, and Physical Function in Middle-Aged Obese Adults: A Randomized Controlled Trial. J. Nutr. Health Aging 2021, 25, 727–734. [Google Scholar] [CrossRef]
- Balducci, S.; Zanuso, S.; Cardelli, P.; Salvi, L.; Bazuro, A.; Pugliese, L.; Maccora, C.; Iacobini, C.; Conti, F.G.; Nicolucci, A.; et al. Effect of High- versus Low-Intensity Supervised Aerobic and Resistance Training on Modifiable Cardiovascular Risk Factors in Type 2 Diabetes; The Italian Diabetes and Exercise Study (IDES). PLoS ONE 2012, 7, e49297. [Google Scholar] [CrossRef] [PubMed] [Green Version]
- Balducci, S.; Zanuso, S.; Cardelli, P.; Salvi, L.; Mazzitelli, G.; Bazuro, A.; Iacobini, C.; Nicolucci, A.; Pugliese, G. Changes in Physical Fitness Predict Improvements in Modifiable Cardiovascular Risk Factors Independently of Body Weight Loss in Subjects with Type 2 Diabetes Participating in the Italian Diabetes and Exercise Study (IDES). Diabetes Care 2012, 35, 1347–1354. [Google Scholar] [CrossRef] [Green Version]
- Maffiuletti, N.A.; Ratel, S.; Sartorio, A.; Martin, V. The Impact of Obesity on In Vivo Human Skeletal Muscle Function. Curr. Obes. Rep. 2013, 2, 251–260. [Google Scholar] [CrossRef] [Green Version]
- Di Loreto, C.; Fanelli, C.; Lucidi, P.; Murdolo, G.; De Cicco, A.; Parlanti, N.; Santeusanio, F.; Brunetti, P.; De Feo, P. Validation of a Counseling Strategy to Promote the Adoption and the Maintenance of Physical Activity by Type 2 Diabetic Subjects. Diabetes Care 2003, 26, 404–408. [Google Scholar] [CrossRef] [PubMed] [Green Version]
- de Aguiar, J.B.; Gurgel, L.A.; Santos, A.L.B.; Arruda, S.P.M. Barriers to Physical Exercise and Associated Factors in the Pre- and Postoperative Periods of Bariatric Surgery. Obes. Surg. 2021, 31, 1696–1704. [Google Scholar] [CrossRef] [PubMed]
- Verboven, K.; Hansen, D. Critical Reappraisal of the Role and Importance of Exercise Intervention in the Treatment of Obesity in Adults. Sports Med. 2021, 51, 379–389. [Google Scholar] [CrossRef]
- Minetto, M.A.; Motta, G.; Gorji, N.E.; Lucini, D.; Biolo, G.; Pigozzi, F.; Portincasa, P.; Maffiuletti, N.A. Reproducibility and validity of the Italian version of the International Physical Activity Questionnaire in obese and diabetic patients. J. Endocrinol. Investig. 2018, 41, 343–349. [Google Scholar] [CrossRef]
- De Vos, B.C.; Runhaar, J.; Van Middelkoop, M.; Krul, M.; Bierma-Zeinstra, S.M. Long-term effects of a randomized, controlled, tailor-made weight-loss intervention in primary care on the health and lifestyle of overweight and obese women. Am. J. Clin. Nutr. 2016, 104, 33–40. [Google Scholar] [CrossRef] [Green Version]
- Hamilton, M.T.; Hamilton, D.G.; Zderic, T.W. Sedentary Behavior as a Mediator of Type 2 Diabetes. Acute Topics Sport Nutr. 2014, 60, 11–26. [Google Scholar] [CrossRef] [Green Version]
- Sjöros, T.; Vähä-Ypyä, H.; Laine, S.; Garthwaite, T.; Lahesmaa, M.; Laurila, S.M.; Latva-Rasku, A.; Savolainen, A.; Miikkulainen, A.; Löyttyniemi, E.; et al. Both sedentary time and physical activity are associated with cardiometabolic health in overweight adults in a 1 month accelerometer measurement. Sci. Rep. 2020, 10, 20578. [Google Scholar] [CrossRef]
- Powell, C.; Herring, M.; Dowd, K.; Donnelly, A.; Carson, B.P. The cross-sectional associations between objectively measured sedentary time and cardiometabolic health markers in adults—A systematic review with meta-analysis component. Obes. Rev. 2017, 19, 381–395. [Google Scholar] [CrossRef]
- Skrede, T.; Steene-Johannessen, J.; Anderssen, S.A.; Resaland, G.K.; Ekelund, U. The prospective association between objectively measured sedentary time, moderate-to-vigorous physical activity and cardiometabolic risk factors in youth: A systematic review and meta-analysis. Obes. Rev. 2018, 20, 55–74. [Google Scholar] [CrossRef] [Green Version]
- Balducci, S.; D’Errico, V.; Haxhi, J.; Sacchetti, M.; Orlando, G.; Cardelli, P.; Vitale, M.; Bollanti, L.; Conti, F.; Zanuso, S.; et al. Effect of a Behavioral Intervention Strategy on Sustained Change in Physical Activity and Sedentary Behavior in Patients with Type 2 Diabetes. J. Am. Med Assoc. 2019, 321, 880–890. [Google Scholar] [CrossRef] [PubMed] [Green Version]


| Outcomes | T0 | T1 | t | p |
|---|---|---|---|---|
| Mn ± SD | Mn ± SD | |||
| SBP | 134.31 ± 17.32 | 125.06 ± 14.95 | −5.547 | <0.001 |
| DBP | 82.71 ± 8.80 | 75.37 ± 10.74 | −7.255 | <0.001 |
| GLYC | 120.22 ± 43.44 | 110.41 ± 35.68 | −3.444 | <0.001 |
| HbA1c | 7.55 ± 10.13 | 6.25 ± 0.98 | −1.435 | 0.077 |
| COL | 200.03 ± 39.52 | 193.73 ± 39.74 | −2.598 | 0.005 |
| HDL | 47.83 ± 9.87 | 46.75 ± 10.12 | −1.584 | 0.058 |
| LDL | 121.30 ± 36.43 | 122.04 ± 34.68 | 0.264 | 0.396 |
| TRIG | 154.64 ± 92.81 | 135.02 ± 81.17 | −3.529 | <0.001 |
| WEIGHT | 95.61 ± 17.25 | 92.73 ± 16.86 | −13.478 | <0.001 |
| BMI | 33.59 ± 4.49 | 32.58 ± 4.41 | −12.518 | <0.001 |
| WC | 111.71 ± 12.02 | 107.45 ± 11.73 | −13.565 | <0.001 |
| FM% | 38.20 ± 7.63 | 36.50 ± 7.84 | −9.090 | <0.001 |
| MM | 56.11 ± 11.97 | 55.83 ± 11.60 | −1.671 | 0.048 |
| LAT | 39.04 ± 11.28 | 48.52 ± 12.25 | 22.897 | <0.001 |
| CHEST | 27.92 ± 9.95 | 38.65 ± 12.13 | 29.754 | <0.001 |
| PRESS | 155.24 ± 37.43 | 202.05 ± 45.96 | 20.290 | <0.001 |
| LEXT | 31.17 ± 11.07 | 47.31 ± 14.27 | 26.586 | <0.001 |
| VB | −8.72 ± 9.84 | −4.79 ± 10.45 | 10.623 | <0.001 |
| HB | 25.80 ± 10.54 | 29.33 ± 9.34 | 9.563 | <0.001 |
| VO2 max | 19.52 ± 9.30 | 25.93 ± 7.93 | 16.409 | <0.001 |
| MET-h per week | 16.46 ± 24.71 | 39.80 ± 27.88 | 12.372 | <0.001 |
| VIG_TOT_WEEK_MIN | 36.20 ± 126.39 | 175.54 ± 141.12 | 14.010 | <0.001 |
| VIG_ MET-h per week | 4.83 ± 16.85 | 23.41 ± 18.82 | 14.010 | <0.001 |
| MOD_TOT_WEEK_MIN | 73.63 ± 187.45 | 121.37 ± 208.41 | 3.071 | 0.001 |
| MOD_ MET-h per week | 4.91 ± 12.50 | 8.09 ± 13.89 | 3.071 | 0.001 |
| WALK_TOT_WEEK_MIN | 122.31 ± 175.35 | 151.01 ± 188.41 | 2.321 | 0.010 |
| WALK_ MET-h per week | 6.73 ± 9.64 | 8.31 ± 10.36 | 2.321 | 0.010 |
| SIT | 5.36 ± 3.17 | 5.15 ± 2.69 | −1.056 | 0.146 |
| a. Repeated-measures multivariate analysis of variance to analyze differences in all variables between T0 and T1, using BMI categories as a between factor. Data are presented as means ± SDs. Statistical significance was set for p-values ≤0.05. | |||||||||
| Outcomes | T0 | T1 | Time T0 vs. T1 | Time * BMI Category | Δ (T1–T0) Post Hoc | ||||
| Mn ± SD | Mn ± SD | F | p | Partial η2 | F | p | Partial η2 | ||
| SBP | 134.31 ± 17.32 | 125.06 ± 14.95 | 31.447 | <0.001 | 0.202 | 3.252 | 0.615 | 0.008 | N.S. |
| DBP | 82.71 ± 8.80 | 75.37 ± 10.74 | 49.821 | <0.001 | 0.287 | 3.949 | 0.022 | 0.060 | N.S. |
| GLYC | 120.22 ± 43.44 | 110.41 ± 35.68 | 13.706 | <0.001 | 0.099 | 0.160 | 0.852 | 0.003 | N.S. |
| HbA1c | 7.55 ± 10.13 | 6.25 ± 0.98 | 2.760 | 0.099 | 0.023 | 1.639 | 0.199 | 0.027 | N.S. |
| COL | 200.03 ± 39.52 | 193.73 ± 39.74 | 6.666 | 0.011 | 0.049 | 1.588 | 0.208 | 0.024 | N.S. |
| HDL | 47.83 ± 9.87 | 46.75 ± 10.12 | 2.809 | 0.96 | 0.022 | 1.238 | 0.294 | 0.019 | N.S. |
| LDL | 121.30 ± 36.43 | 122.04 ± 34.68 | 0.029 | 0.864 | 0.000 | 1.069 | 0.347 | 0.018 | N.S. |
| TRIG | 154.64 ± 92.82 | 135.02 ± 81.17 | 11.871 | 0.001 | 0.083 | 2.285 | 0.106 | 0.034 | N.S. |
| WEIGHT | 95.61 ± 17.25 | 92.73 ± 16.86 | 158.465 | <0.001 | 0.353 | 123.116 | <0.001 | 0.459 | II OB vs. OVER (p < 0.001); II OB vs. I OB (p < 0.001); I OB vs. OVER (p < 0.001) |
| BMI | 33.60 ± 4.49 | 32.58 ± 4.41 | 135.345 | <0.001 | 0.318 | 429.297 | <0.001 | 0.748 | II OB vs. OVER (p < 0.001); II OB vs. I OB (p < 0.001); I OB vs. OVER (p < 0.001) |
| WC | 111.71 ± 12.02 | 107.45 ± 11.73 | 174.209 | <0.001 | 0.389 | 127.413 | <0.001 | 0.482 | II OB vs. OVER (p < 0.001); II OB vs. I OB (p < 0.001); I OB vs. OVER (p < 0.001) |
| FM% | 38.20 ± 7.63 | 36.50 ± 7.84 | 72.460 | <0.001 | 0.201 | 36.690 | <0.001 | 0.203 | II OB vs. OVER (p < 0.001); II OB vs. I OB (p < 0.001); I OB vs. OVER (p < 0.001) |
| MM | 56.11 ± 11.97 | 55.83 ± 11.60 | 1.545 | 0.215 | 0.005 | 17.443 | <0.001 | 0.108 | II OB vs. OVER (p < 0.001); II OB vs. I OB (p < 0.001); I OB vs. OVER (p < 0.046) |
| LAT | 39.04 ± 11.28 | 48.53 ± 12.25 | 453.070 | <0.001 | 0.673 | 6.993 | 0.001 | 0.060 | II OB vs. OVER (p < 0.001) |
| CHEST | 27.92 ± 9.95 | 38.65 ± 12.14 | 769.477 | <0.001 | 0.778 | 7.308 | <0.001 | 0.063 | II OB vs. OVER (p < 0.001); II OB vs. I OB (p = 0.044) |
| PRESS | 155.24 ± 37.43 | 202.05 ± 45.96 | 360.794 | <0.001 | 0.621 | 12.104 | <0.001 | 0.099 | II OB vs. OVER (p < 0.001); II OB vs. I OB (p < 0.001) |
| LEXT | 31.17 ± 11.07 | 47.31 ± 14.27 | 621.215 | <0.001 | 0.743 | 9.548 | <0.001 | 0.082 | II OB vs. OVER (p < 0.001); II OB vs. I OB (p = 0.004) |
| VB | −8.72 ± 9.84 | −4.79 ± 10.45 | 109.377 | <0.001 | 0.279 | 1.822 | 0.164 | 0.013 | N.S. |
| HB | 25.80 ± 10.54 | 29.33 ± 9.34 | 82.575 | <0.001 | 0.226 | 3.920 | 0.021 | 0.027 | II OB vs. I OB (p = 0.019) |
| VO2 max | 19.52 ± 9.30 | 25.93 ± 7.93 | 231.054 | <0.001 | 0.443 | 14.542 | <0.001 | 0.091 | II OB vs. OVER (p < 0.001); II OB vs. I OB (p < 0.001) |
| MET-h per week | 16.46 ± 24.71 | 39.80 ± 27.88 | 136.159 | <0.001 | 0.320 | 1.113 | 0.330 | 0.008 | N.S. |
| SIT | 5.36 ± 3.17 | 5.15 ± 2.69 | 0.714 | 0.399 | 0.003 | 1.704 | 0.184 | 0.012 | N.S. |
| b. Repeated-measures multivariate analysis of variance to analyze differences in all variables between T0 and T1, using PAL categories as a between factor. Data are presented as means ± SDs. Statistical significance was set for p-values ≤0.05. | |||||||||
| Outcomes | T0 | T1 | Time T0 vs. T1 | Time * PAL Category | Δ (T1–T0) Post Hoc | ||||
| Mn ± SD | Mn ± SD | F | p | Partial η2 | F | p | Partial η2 | ||
| SBP | 134.31 ± 17.32 | 125.06 ± 14.95 | 18.319 | <0.001 | 0.129 | .395 | 0.674 | 0.006 | N.S. |
| DBP | 82.71 ± 8.80 | 75.37 ± 10.74 | 35.135 | <0.001 | 0.221 | 2.847 | 0.062 | 0.044 | N.S. |
| GLYC | 120.22 ± 43.44 | 110.41 ± 35.68 | 4.264 | 0.041 | 0.536 | 1.170 | 0.314 | 0.018 | high vs. low (p = 0.041) |
| HbA1c | 7.55 ± 10.13 | 6.25 ± 0.98 | 0.972 | 0.326 | 0.008 | 0.599 | 0.551 | 0.010 | N.S. |
| COL | 200.03 ± 39.52 | 193.73 ± 39.74 | 3.272 | 0.073 | 0.025 | 2.132 | 0.123 | 0.032 | N.S. |
| HDL | 47.83 ± 9.87 | 46.75 ± 10.12 | 0.190 | 0.663 | 0.002 | 0.227 | 0.797 | 0.004 | N.S. |
| LDL | 121.30 ± 36.43 | 122.04 ± 34.68 | 0.058 | 0.811 | 0.001 | 1.270 | 0.285 | 0.021 | N.S. |
| TRIG | 154.64 ± 92.82 | 135.02 ± 81.17 | 10.978 | 0.001 | 0.078 | 0.019 | 0.981 | 0.001 | N.S. |
| WEIGHT | 95.61 ± 17.25 | 92.73 ± 16.86 | 127.497 | <0.001 | 0.305 | 0.269 | 0.765 | 0.002 | N.S. |
| BMI | 33.60 ± 4.49 | 32.58 ± 4.41 | 107.147 | <0.001 | 0.270 | 3.100 | 0.047 | 0.021 | moderate vs. low (p = 0.046) |
| WC | 111.71 ± 12.02 | 107.45 ± 11.73 | 112.938 | <0.001 | 0.292 | 0.582 | 0.560 | 0.004 | N.S. |
| FM% | 38.20 ± 7.63 | 36.50 ± 7.84 | 63.138 | <0.001 | 0.180 | 1.120 | 0.328 | 0.008 | N.S. |
| MM | 56.11 ± 11.97 | 55.83 ± 11.60 | 0.374 | 0.542 | 0.001 | 1.141 | 0.321 | 0.008 | N.S. |
| LAT | 39.04 ± 11.28 | 48.53 ± 12.25 | 375.487 | <0.001 | 0.631 | 3.330 | 0.038 | 0.029 | high vs. moderate (p = 0.033) |
| CHEST | 27.92 ± 9.95 | 38.65 ± 12.14 | 719.275 | <0.001 | 0.767 | 4.059 | 0.019 | 0.036 | high vs. moderate (p = 0.017); high vs. low (p = 0.037) |
| PRESS | 155.24 ± 37.43 | 202.04 ± 45.96 | 334.875 | <0.001 | 0.604 | 2.492 | 0.085 | 0.022 | high vs. moderate (p = 0.014); high vs. low (p = 0.027) |
| LEXT | 31.171 ± 11.07 | 47.31 ± 14.275 | 568.074 | <0.001 | 0.725 | 4.199 | 0.016 | 0.038 | high vs. moderate (p = 0.017); high vs. low (p = 0.022) |
| VB | −8.72 ± 9.84 | −4.79 ± 10.45 | 73.522 | <0.001 | 0.206 | 3.166 | 0.830 | 0.001 | N.S. |
| HB | 25.80 ± 10.54 | 29.33 ± 9.34 | 45.052 | <0.001 | 0.137 | 2.274 | 0.105 | 0.016 | N.S. |
| VO2 max | 19.52 ± 9.30 | 25.93 ± 7.93 | 158.397 | <0.001 | 0.353 | 2.474 | 0.086 | 0.017 | N.S. |
| MET-h per week | 16.46 ± 24.71 | 39.80 ± 27.88 | 35.445 | <0.001 | 0.109 | 96.579 | <0.001 | 0.400 | high vs. moderate (p < 0.001); high vs. low (p < 0.001); moderate vs. low (p < 0.001) |
| SIT | 5.36 ± 3.17 | 5.15 ± 2.69 | 0.597 | 0.440 | 0.002 | 8.522 | <0.001 | 0.057 | high vs. low (p < 0.001); moderate vs. low (p = 0.017) |
| c. Repeated-measures multivariate analysis of variance to analyze differences in all variables between T0 and T1, using SIT categories as a between factor. Data are presented as means ± SDs. Statistical significance was set for p values ≤ 0.05. | |||||||||
| Outcomes | T0 | T1 | Time T0 vs. T1 | Time * SIT Category | Δ (T1–T0) Post Hoc | ||||
| Mn ± SD | Mn ± SD | F | p | Partial η2 | F | p | Partial η2 | ||
| SBP | 134.52 ± 17.44 | 125.31 ± 15.11 | 21.800 | <0.001 | 0.157 | 0.055 | 0.983 | 0.001 | N.S. |
| DBP | 83.1 ± 8.83 | 75.76 ± 10.71 | 45.168 | <0.001 | 0.279 | 0.717 | 0.544 | 0.018 | N.S. |
| GLYC | 121.75 ± 43.87 | 111.46 ± 36.03 | 19.283 | <0.001 | 0.140 | 0.281 | 0.839 | 0.007 | N.S. |
| HbA1c | 7.62 ± 10.38 | 6.26 ± 0.99 | 1.364 | 0.245 | 0.012 | 0.752 | 0.524 | 0.020 | N.S. |
| COL | 200.37 ± 38.86 | 193.88 ± 39.62 | 7.204 | 0.008 | 0.055 | 0.520 | 0.669 | 0.013 | N.S. |
| HDL | 47.80 ± 9.98 | 46.67 ± 10.28 | 3.451 | 0.066 | 0.028 | 0.850 | 0.469 | 0.021 | N.S. |
| LDL | 122.248 ± 36.55 | 122.719 ± 34.40 | 0.002 | 0.962 | 0.024 | 1.072 | 0.364 | 0.029 | N.S. |
| TRIG | 154.87 ± 94.23 | 136.13 ± 82.52 | 11.146 | 0.001 | 0.083 | 0.770 | 0.513 | 0.018 | N.S. |
| WEIGHT | 95.793 ± 17.28 | 92.92 ± 16.92 | 148.702 | <0.001 | 0.344 | 3.678 | 0.013 | 0.038 | low vs. high SIT (p = 0.007) |
| BMI | 33.62 ± 4.50 | 32.61 ± 4.42 | 125.817 | <0.001 | 0.308 | 2.244 | 0.083 | 0.023 | N.S. |
| WC | 111.78 ± 12.09 | 107.56 ± 11.78 | 153.989 | <0.001 | 0.366 | 1.936 | 0.124 | 0.021 | N.S. |
| FM% | 38.17 ± 7.59 | 36.46 ± 7.82 | 67.703 | <0.001 | 0.194 | 1.223 | 0.302 | 0.013 | N.S. |
| MM | 56.24 ± 11.95 | 55.96 ± 11.59 | 3.245 | 0.073 | 0.011 | 2.505 | 0.059 | 0.026 | N.S. |
| LAT | 39.19 ± 11.33 | 48.65 ± 12.27 | 430.401 | <0.001 | 0.668 | 0.735 | 0.532 | 0.010 | N.S. |
| CHEST | 27.95 ± 9.96 | 38.64 ± 12.08 | 752.288 | <0.001 | 0.779 | 1.322 | 0.268 | 0.018 | N.S. |
| PRESS | 155.59 ± 37.29 | 202.34 ± 45.99 | 340.782 | <0.001 | 0.614 | 2.106 | 0.100 | 0.029 | N.S. |
| LEXT | 31.33 ± 11.07 | 47.45 ± 14.37 | 572.982 | <0.001 | 0.733 | 0.799 | 0.496 | 0.011 | N.S. |
| VB | −8.66 ± 9.87 | −4.71 ± 10.50 | 108.815 | <0.001 | 0.283 | 1.061 | 0.366 | 0.011 | N.S. |
| HB | 25.9 ± 10.62 | 29.44 ± 9.38 | 83.961 | <0.001 | 0.233 | 0.417 | 0.741 | 0.005 | N.S. |
| VO2 max | 19.69 ± 9.24 | 25.95 ± 7.96 | 223.868 | <0.001 | 0.442 | 1.304 | 0.273 | 0.014 | N.S. |
| MET-h per week | 16.61 ± 24.88 | 39.95 ± 27.97 | 134.693 | <0.001 | 0.322 | 6.841 | <0.001 | 0.068 | low SIT vs. very high SIT (p = 0.004); low SIT vs. high SIT (p < 0.001); medium SIT vs. high SIT (p = 0.026) |
| SIT | 5.36 ± 3.17 | 5.15 ± 2.69 | 6.374 | 0.012 | 0.022 | 271.280 | <0.001 | 0.742 | low SIT vs. very high SIT (p < 0.001); low SIT vs. high SIT (p < 0.001); low SIT vs. medium SIT (p < 0.001); medium SIT vs. very high SIT (p < 0.001); medium SIT vs. high SIT (p < 0.001); high SIT vs. very high SIT vs. (p < 0.001); very high SIT vs. high SIT (p < 0.001) |
Publisher’s Note: MDPI stays neutral with regard to jurisdictional claims in published maps and institutional affiliations. |
© 2022 by the authors. Licensee MDPI, Basel, Switzerland. This article is an open access article distributed under the terms and conditions of the Creative Commons Attribution (CC BY) license (https://creativecommons.org/licenses/by/4.0/).
Share and Cite
Pippi, R.; Cugusi, L.; Bergamin, M.; Bini, V.; Fanelli, C.G.; Bullo, V.; Gobbo, S.; Di Blasio, A. Impact of BMI, Physical Activity, and Sitting Time Levels on Health-Related Outcomes in a Group of Overweight and Obese Adults with and without Type 2 Diabetes. J. Funct. Morphol. Kinesiol. 2022, 7, 12. https://0-doi-org.brum.beds.ac.uk/10.3390/jfmk7010012
Pippi R, Cugusi L, Bergamin M, Bini V, Fanelli CG, Bullo V, Gobbo S, Di Blasio A. Impact of BMI, Physical Activity, and Sitting Time Levels on Health-Related Outcomes in a Group of Overweight and Obese Adults with and without Type 2 Diabetes. Journal of Functional Morphology and Kinesiology. 2022; 7(1):12. https://0-doi-org.brum.beds.ac.uk/10.3390/jfmk7010012
Chicago/Turabian StylePippi, Roberto, Lucia Cugusi, Marco Bergamin, Vittorio Bini, Carmine Giuseppe Fanelli, Valentina Bullo, Stefano Gobbo, and Andrea Di Blasio. 2022. "Impact of BMI, Physical Activity, and Sitting Time Levels on Health-Related Outcomes in a Group of Overweight and Obese Adults with and without Type 2 Diabetes" Journal of Functional Morphology and Kinesiology 7, no. 1: 12. https://0-doi-org.brum.beds.ac.uk/10.3390/jfmk7010012