sensors-logo

Journal Browser

Journal Browser

Sensors for Air Quality Monitoring

A topical collection in Sensors (ISSN 1424-8220). This collection belongs to the section "Physical Sensors".

Viewed by 63336

Editors


E-Mail Website
Collection Editor
Atmospheric Physics Consultant, 82467 Garmisch-Partenkirchen, Germany
Interests: air quality; air pollutants; measurement techniques; meteorological influences; atmospheric data analyses
Special Issues, Collections and Topics in MDPI journals

E-Mail Website
Collection Editor
Karlsruhe Institute of Technology, 76131 Karlsruhe, Germany
Interests: environmental sensing; mobile computing; Internet of Things (IoT); human-computer-interaction (HCI); pervasive games/gamification; context and activity recognition

Topical Collection Information

Dear Colleagues,

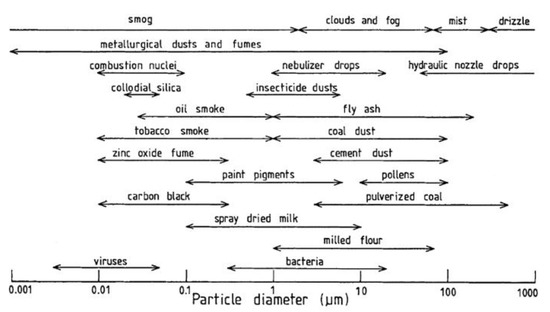
New sensors to detect air pollutants like fine dust (PM10, PM2.5), O3, NO2, or CO as well as greenhouse gases like CO2 are available and applied in different areas of atmospheric observations. These sensors are not only small, lightweight, fast, and cheap, but also relatively unstable and inaccurate. It is time to provide an overview about

- The possibilities and shortcomings of the new sensing techniques and applications;

- The methodologies to overcome their disadvantages;

- The solutions to integrate networks of these sensors into the existing, well-calibrated air-quality monitoring networks;

- The solutions to use them for air-quality monitoring; and

- Their application to new tasks such as the detection of air pollution hot spots or the evaluation of emission inventories and numerical air pollution simulations.

Further, it is necessary to extend our knowledge about harmful compounds in the atmosphere. This is possible by measurements in the atmosphere, but also at the source of emissions into the atmosphere. Emission measurements are required because some air pollutants are secondary (i.e., these compounds are formed in the atmosphere under certain meteorological conditions and together with other atmospheric compounds).

So, we ask physicists, chemists, engineers, information scientists, and corresponding researchers to send in their papers for this Special Issue.

Otherwise, the requirements to develop new sensors are defined by environmental physicians and epidemiologists and their working results originate the development of new sensors. The way is now open to detect personal air pollution exposure and maybe in the future for personal pollen and fungi exposure as a basis for new measures to improve human health. Papers from this research are very welcome.

Prof. Dr. Klaus Schäfer
Dr. Matthias Budde
Collection Editors

Manuscript Submission Information

Manuscripts should be submitted online at www.mdpi.com by registering and logging in to this website. Once you are registered, click here to go to the submission form. Manuscripts can be submitted until the deadline. All submissions that pass pre-check are peer-reviewed. Accepted papers will be published continuously in the journal (as soon as accepted) and will be listed together on the collection website. Research articles, review articles as well as short communications are invited. For planned papers, a title and short abstract (about 100 words) can be sent to the Editorial Office for announcement on this website.

Submitted manuscripts should not have been published previously, nor be under consideration for publication elsewhere (except conference proceedings papers). All manuscripts are thoroughly refereed through a single-blind peer-review process. A guide for authors and other relevant information for submission of manuscripts is available on the Instructions for Authors page. Sensors is an international peer-reviewed open access semimonthly journal published by MDPI.

Please visit the Instructions for Authors page before submitting a manuscript. The Article Processing Charge (APC) for publication in this open access journal is 2600 CHF (Swiss Francs). Submitted papers should be well formatted and use good English. Authors may use MDPI's English editing service prior to publication or during author revisions.

Keywords

  • air pollution measurements
  • air quality networks
  • new air pollutants
  • emission inventory evaluation
  • air pollution hot spots
  • air quality simulation evaluation
  • personal air pollution exposure
  • epidemiology
  • environmental medicine
Published Papers (18 papers)

2024

Jump to: 2023, 2022, 2021, 2020

13 pages, 1202 KiB  
Review
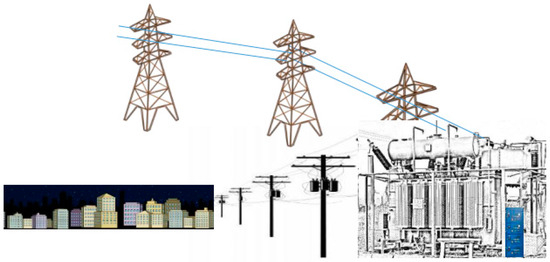
Electric Transmission and Distribution Network Air Pollution
by Saverio De Vito, Antonio Del Giudice and Girolamo Di Francia
Sensors 2024, 24(2), 587; https://0-doi-org.brum.beds.ac.uk/10.3390/s24020587 - 17 Jan 2024
Viewed by 752
Abstract
There is a consensus within the scientific community regarding the effects on the environment, health, and climate of the use of renewable energy sources, which is characterized by a rate of harmful polluting emissions that is significantly lower than that typical of fossil [...] Read more.
There is a consensus within the scientific community regarding the effects on the environment, health, and climate of the use of renewable energy sources, which is characterized by a rate of harmful polluting emissions that is significantly lower than that typical of fossil fuels. On the other hand, this transition towards the use of more sustainable energy sources will also be characterized by an increasingly widespread electrification rate. In this work, we want to discuss whether electricity distribution and transmission networks and their main components are characterized by emissions that are potentially harmful to the environment and human health during their operational life. We will see that the scientific literature on this issue is rather limited, at least until now. However, conditions are reported in which the network directly causes or at least promotes the emissions of polluting substances into the environment. For the most part, the emissions recorded, rather than their environmental or human health impacts, are studied as part of the implementation of techniques for the early determination of faults in the network. It is probable that with the increasing electrification of energy consumption, the problem reported here will become increasingly relevant. Full article
Show Figures

Figure 1

2023

Jump to: 2024, 2022, 2021, 2020

17 pages, 20644 KiB  
Article
ArtEMon: Artificial Intelligence and Internet of Things Powered Greenhouse Gas Sensing for Real-Time Emissions Monitoring
by Ali Yavari, Irfan Baig Mirza, Hamid Bagha, Harindu Korala, Hussein Dia, Paul Scifleet, Jason Sargent, Caroline Tjung and Mahnaz Shafiei
Sensors 2023, 23(18), 7971; https://0-doi-org.brum.beds.ac.uk/10.3390/s23187971 - 19 Sep 2023
Viewed by 1348
Abstract
Greenhouse gas (GHG) emissions reporting and sustainability are increasingly important for businesses around the world. Yet the lack of a single standardised method of measurement, when coupled with an inability to understand the true state of emissions in complex logistics activities, presents enormous [...] Read more.
Greenhouse gas (GHG) emissions reporting and sustainability are increasingly important for businesses around the world. Yet the lack of a single standardised method of measurement, when coupled with an inability to understand the true state of emissions in complex logistics activities, presents enormous barriers for businesses to understanding the extent of their emissions footprint. One of the traditional approaches to accurately capturing and monitoring gas emissions in logistics is through using gas sensors. However, connecting, maintaining, and operating gas sensors on moving vehicles in different road and weather conditions is a large and costly challenge. This paper presents the development and evaluation of a reliable and accurate sensing technique for GHG emissions collection (or monitoring) in real-time, employing the Internet of Things (IoT) and Artificial Intelligence (AI) to eliminate or reduce the usage of gas sensors, using reliable and cost-effective solutions. Full article
Show Figures

Figure 1

29 pages, 11069 KiB  
Article
Laboratory Comparison of Low-Cost Particulate Matter Sensors to Measure Transient Events of Pollution—Part B—Particle Number Concentrations
by Florentin Michel Jacques Bulot, Hugo Savill Russell, Mohsen Rezaei, Matthew Stanley Johnson, Steven James Ossont, Andrew Kevin Richard Morris, Philip James Basford, Natasha Hazel Celeste Easton, Hazel Louise Mitchell, Gavin Lee Foster, Matthew Loxham and Simon James Cox
Sensors 2023, 23(17), 7657; https://0-doi-org.brum.beds.ac.uk/10.3390/s23177657 - 04 Sep 2023
Viewed by 1142
Abstract
Low-cost Particulate Matter (PM) sensors offer an excellent opportunity to improve our knowledge about this type of pollution. Their size and cost, which support multi-node network deployment, along with their temporal resolution, enable them to report fine spatio-temporal resolution for a given area. [...] Read more.
Low-cost Particulate Matter (PM) sensors offer an excellent opportunity to improve our knowledge about this type of pollution. Their size and cost, which support multi-node network deployment, along with their temporal resolution, enable them to report fine spatio-temporal resolution for a given area. These sensors have known issues across performance metrics. Generally, the literature focuses on the PM mass concentration reported by these sensors, but some models of sensors also report Particle Number Concentrations (PNCs) segregated into different PM size ranges. In this study, eight units each of Alphasense OPC-R1, Plantower PMS5003 and Sensirion SPS30 have been exposed, under controlled conditions, to short-lived peaks of PM generated using two different combustion sources of PM, exposing the sensors’ to different particle size distributions to quantify and better understand the low-cost sensors performance across a range of relevant environmental ranges. The PNCs reported by the sensors were analysed to characterise sensor-reported particle size distribution, to determine whether sensor-reported PNCs can follow the transient variations of PM observed by the reference instruments and to determine the relative impact of different variables on the performances of the sensors. This study shows that the Alphasense OPC-R1 reported at least five size ranges independently from each other, that the Sensirion SPS30 reported two size ranges independently from each other and that all the size ranges reported by the Plantower PMS5003 were not independent of each other. It demonstrates that all sensors tested here could track the fine temporal variation of PNCs, that the Alphasense OPC-R1 could closely follow the variations of size distribution between the two sources of PM, and it shows that particle size distribution and composition are more impactful on sensor measurements than relative humidity. Full article
Show Figures

Figure 1

17 pages, 5454 KiB  
Article
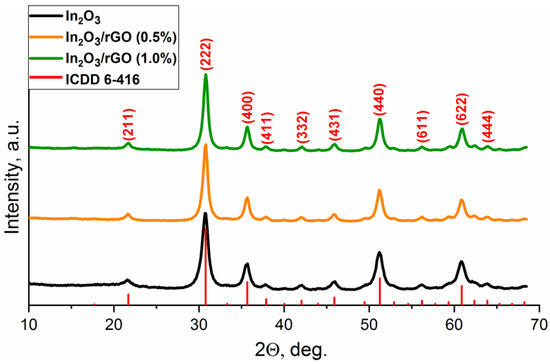
Humidity Effect on Low-Temperature NH3 Sensing Behavior of In2O3/rGO Composites under UV Activation
by Abulkosim Nasriddinov, Tatiana Shatalova, Sergey Maksimov, Xiaogan Li and Marina Rumyantseva
Sensors 2023, 23(3), 1517; https://0-doi-org.brum.beds.ac.uk/10.3390/s23031517 - 30 Jan 2023
Cited by 4 | Viewed by 1895
Abstract
The nature of the constituent components of composite materials can significantly affect the character of their interaction with the gas phase. In this work, nanocrystalline In2O3 was synthesized by the chemical precipitation method and was modified using reduced graphene oxide [...] Read more.
The nature of the constituent components of composite materials can significantly affect the character of their interaction with the gas phase. In this work, nanocrystalline In2O3 was synthesized by the chemical precipitation method and was modified using reduced graphene oxide (rGO). The obtained composites were characterized by several analysis techniques—XRD, TEM, SEM, FTIR and Raman spectroscopy, XPS, TGA, and DRIFTS. The XPS and FTIR and Raman spectroscopy results suggested the formation of interfacial contact between In2O3 and rGO. The results of the gas sensor’s properties showed that additional UV illumination led to a decrease in resistance and an increase in sensor response at room temperature. However, the presence of humidity at room temperature led to the disappearance of the response for pure In2O3, while for the composites, an inversion of the sensor response toward ammonia was observed. The main reason may have been the formation of NH4NO3 intermediates with further hydrolysis and decomposition under light illumination with the formation of nitrite and nitrate species. The presence of these species was verified by in situ DRIFT spectroscopy. Their strong electron-accepting properties lead to an increase in resistance, which possibly affected the sensor signal’s inversion. Full article
Show Figures

Figure 1

12 pages, 1827 KiB  
Article
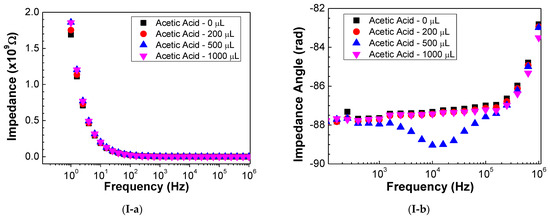
Graphene Oxide Thin Films for Detection and Quantification of Industrially Relevant Alcohols and Acetic Acid
by Pedro Catalão Moura, Thais Priscilla Pivetta, Valentina Vassilenko, Paulo António Ribeiro and Maria Raposo
Sensors 2023, 23(1), 462; https://0-doi-org.brum.beds.ac.uk/10.3390/s23010462 - 01 Jan 2023
Cited by 7 | Viewed by 1646
Abstract
Industrial environments are frequently composed of potentially toxic and hazardous compounds. Volatile organic compounds (VOCs) are one of the most concerning categories of analytes commonly existent in the indoor air of factories’ facilities. The sources of VOCs in the industrial context are abundant [...] Read more.
Industrial environments are frequently composed of potentially toxic and hazardous compounds. Volatile organic compounds (VOCs) are one of the most concerning categories of analytes commonly existent in the indoor air of factories’ facilities. The sources of VOCs in the industrial context are abundant and a vast range of human health conditions and pathologies are known to be caused by both short- and long-term exposures. Hence, accurate and rapid detection, identification, and quantification of VOCs in industrial environments are mandatory issues. This work demonstrates that graphene oxide (GO) thin films can be used to distinguish acetic acid, ethanol, isopropanol, and methanol, major analytes for the field of industrial air quality, using the electronic nose concept based on impedance spectra measurements. The data were treated by principal component analysis. The sensor consists of polyethyleneimine (PEI) and GO layer-by-layer films deposited on ceramic supports coated with gold interdigitated electrodes. The electrical characterization of this sensor in the presence of the VOCs allows the identification of acetic acid in the concentration range from 24 to 120 ppm, and of ethanol, isopropanol, and methanol in a concentration range from 18 to 90 ppm, respectively. Moreover, the results allows the quantification of acetic acid, ethanol, and isopropanol concentrations with sensitivity values of (3.03±0.12)104, (1.15±0.19)104, and (1.1±0.50)104 mL−1, respectively. The resolution of this sensor to detect the different analytes is lower than 0.04 ppm, which means it is an interesting sensor for use as an electronic nose for the detection of VOCs. Full article
Show Figures

Figure 1

2022

Jump to: 2024, 2023, 2021, 2020

29 pages, 4672 KiB  
Article
Enhanced Ambient Sensing Environment—A New Method for Calibrating Low-Cost Gas Sensors
by Hugo Savill Russell, Louise Bøge Frederickson, Szymon Kwiatkowski, Ana Paula Mendes Emygdio, Prashant Kumar, Johan Albrecht Schmidt, Ole Hertel and Matthew Stanley Johnson
Sensors 2022, 22(19), 7238; https://0-doi-org.brum.beds.ac.uk/10.3390/s22197238 - 24 Sep 2022
Cited by 8 | Viewed by 2505
Abstract
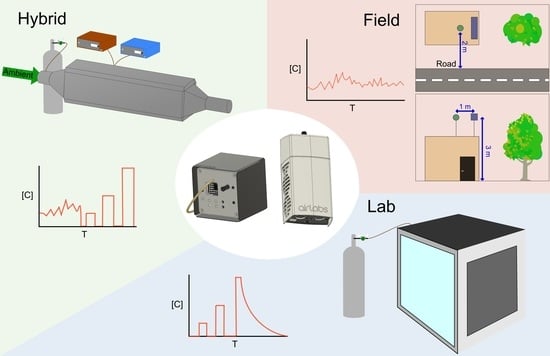
Accurate calibration of low-cost gas sensors is, at present, a time consuming and difficult process. Laboratory calibration and field calibration methods are currently used, but laboratory calibration is generally discounted due to poor transferability, and field methods requiring several weeks are standard. The [...] Read more.
Accurate calibration of low-cost gas sensors is, at present, a time consuming and difficult process. Laboratory calibration and field calibration methods are currently used, but laboratory calibration is generally discounted due to poor transferability, and field methods requiring several weeks are standard. The Enhanced Ambient Sensing Environment (EASE) method described in this article, is a hybrid of the two, combining the advantages of a laboratory calibration with the increased accuracy of a field calibration. It involves calibrating sensors inside a duct, drawing in ambient air with similar properties to the site where the sensors will operate, but with the added feature of being able to artificially increases or decrease pollutant levels, thus condensing the calibration period required. Calibration of both metal-oxide (MOx) and electrochemical (EC) gas sensors for the measurement of NO2 and O3 (0–120 ppb) were conducted in EASE, laboratory and field environments, and validated in field environments. The EC sensors performed marginally better than MOx sensors for NO2 measurement and sensor performance was similar for O3 measurement, but the EC sensor nodes had less node inter-node variability and were more robust. For both gasses and sensor types the EASE calibration outperformed the laboratory calibration, and performed similarly to or better than the field calibration, whilst requiring a fraction of the time. Full article
Show Figures

Graphical abstract

16 pages, 2252 KiB  
Article
Assessment of Individual-Level Exposure to Airborne Particulate Matter during Periods of Atmospheric Thermal Inversion
by Rok Novak, Johanna Amalia Robinson, Tjaša Kanduč, Dimosthenis Sarigiannis and David Kocman
Sensors 2022, 22(19), 7116; https://0-doi-org.brum.beds.ac.uk/10.3390/s22197116 - 20 Sep 2022
Cited by 4 | Viewed by 2491
Abstract
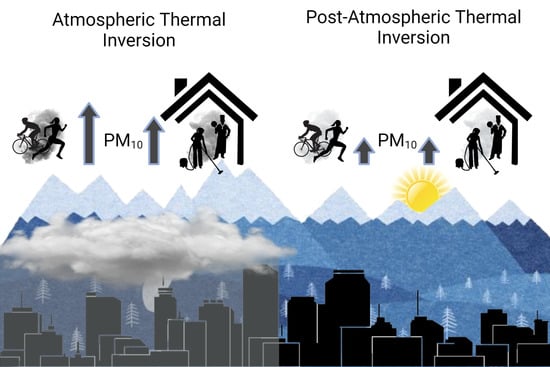
Air pollution exposure is harmful to human health and reducing it at the level of an individual requires measurements and assessments that capture the spatiotemporal variability of different microenvironments and the influence of specific activities. In this paper, activity-specific and general indoor and [...] Read more.
Air pollution exposure is harmful to human health and reducing it at the level of an individual requires measurements and assessments that capture the spatiotemporal variability of different microenvironments and the influence of specific activities. In this paper, activity-specific and general indoor and outdoor exposure during and after a period of high concentrations of particulate matter (PM), e.g., an atmospheric thermal inversion (ATI) in the Ljubljana subalpine basin, Slovenia, was assessed. To this end, personal particulate matter monitors (PPM) were used, worn by participants of the H2020 ICARUS sampling campaigns in spring 2019 who also recorded their hourly activities. ATI period(s) were determined based on data collected from two meteorological stations managed by the Slovenian Environmental Agency (SEA). Results showed that indoor and outdoor exposure to PM was significantly higher during the ATI period, and that the difference between mean indoor and outdoor exposure to PM was much higher during the ATI period (23.0 µg/m3) than after (6.5 µg/m3). Indoor activities generally were associated with smaller differences, with cooking and cleaning even having higher values in the post-ATI period. On the other hand, all outdoor activities had higher PM values during the ATI than after, with larger differences, mostly >30.0 µg/m3. Overall, this work demonstrated that an individual-level approach can provide better spatiotemporal resolution and evaluate the relative importance of specific high-exposure events, and in this way provide an ancillary tool for exposure assessments. Full article
Show Figures

Graphical abstract

24 pages, 5517 KiB  
Article
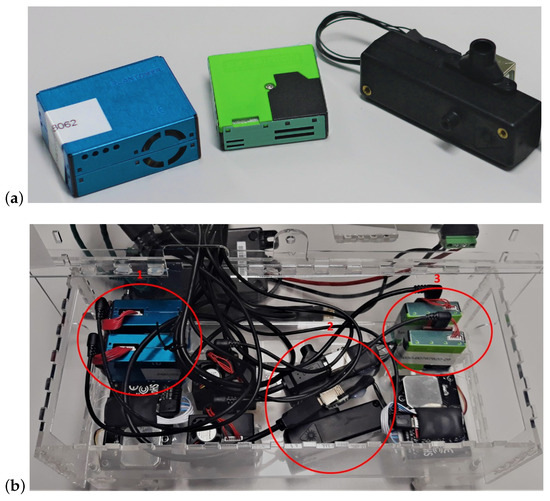
Development of Air Quality Boxes Based on Low-Cost Sensor Technology for Ambient Air Quality Monitoring
by Paul Gäbel, Christian Koller and Elke Hertig
Sensors 2022, 22(10), 3830; https://0-doi-org.brum.beds.ac.uk/10.3390/s22103830 - 18 May 2022
Cited by 7 | Viewed by 3325
Abstract
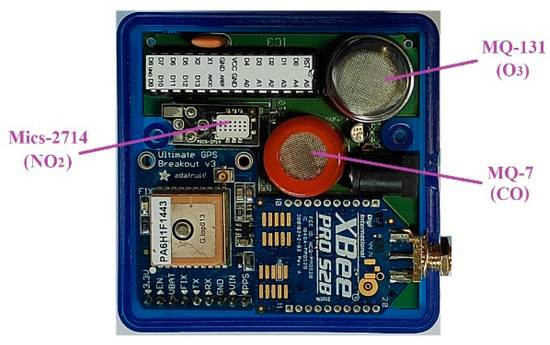
Analyses of the relationships between climate, air substances and health usually concentrate on urban environments because of increased urban temperatures, high levels of air pollution and the exposure of a large number of people compared to rural environments. Ongoing urbanization, demographic ageing and [...] Read more.
Analyses of the relationships between climate, air substances and health usually concentrate on urban environments because of increased urban temperatures, high levels of air pollution and the exposure of a large number of people compared to rural environments. Ongoing urbanization, demographic ageing and climate change lead to an increased vulnerability with respect to climate-related extremes and air pollution. However, systematic analyses of the specific local-scale characteristics of health-relevant atmospheric conditions and compositions in urban environments are still scarce because of the lack of high-resolution monitoring networks. In recent years, low-cost sensors (LCS) became available, which potentially provide the opportunity to monitor atmospheric conditions with a high spatial resolution and which allow monitoring directly at vulnerable people. In this study, we present the atmospheric exposure low-cost monitoring (AELCM) system for several air substances like ozone, nitrogen dioxide, carbon monoxide and particulate matter, as well as meteorological variables developed by our research group. The measurement equipment is calibrated using multiple linear regression and extensively tested based on a field evaluation approach at an urban background site using the high-quality measurement unit, the atmospheric exposure monitoring station (AEMS) for meteorology and air substances, of our research group. The field evaluation took place over a time span of 4 to 8 months. The electrochemical ozone sensors (SPEC DGS-O3: R2: 0.71–0.95, RMSE: 3.31–7.79 ppb) and particulate matter sensors (SPS30 PM1/PM2.5: R2: 0.96–0.97/0.90–0.94, RMSE: 0.77–1.07 µg/m3/1.27–1.96 µg/m3) showed the best performances at the urban background site, while the other sensors underperformed tremendously (SPEC DGS-NO2, SPEC DGS-CO, MQ131, MiCS-2714 and MiCS-4514). The results of our study show that meaningful local-scale measurements are possible with the former sensors deployed in an AELCM unit. Full article
Show Figures

Figure 1

2021

Jump to: 2024, 2023, 2022, 2020

18 pages, 3154 KiB  
Article
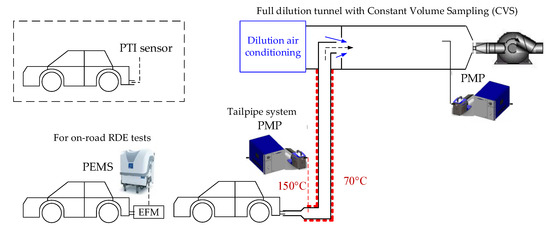
Evaluation of Solid Particle Number Sensors for Periodic Technical Inspection of Passenger Cars
by Anastasios Melas, Tommaso Selleri, Ricardo Suarez-Bertoa and Barouch Giechaskiel
Sensors 2021, 21(24), 8325; https://0-doi-org.brum.beds.ac.uk/10.3390/s21248325 - 13 Dec 2021
Cited by 12 | Viewed by 2509
Abstract
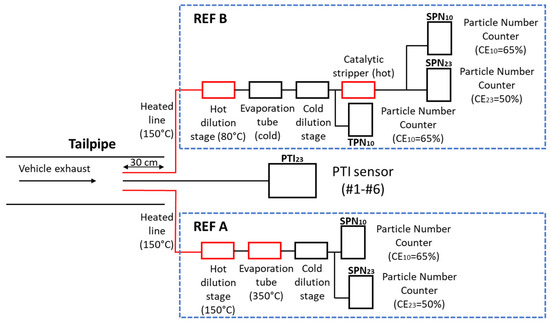
Following the increase in stringency of the European regulation limits for laboratory and real world automotive emissions, one of the main transport related aspects to improve the air quality is the mass scale in-use vehicle testing. Solid particle number (SPN) emissions have been [...] Read more.
Following the increase in stringency of the European regulation limits for laboratory and real world automotive emissions, one of the main transport related aspects to improve the air quality is the mass scale in-use vehicle testing. Solid particle number (SPN) emissions have been drastically reduced with the use of diesel and gasoline particulate filters which, however, may get damaged or even been tampered. The feasibility of on-board monitoring and remote sensing as well as of the current periodical technical inspection (PTI) for detecting malfunctioning or tampered particulate filters is under discussion. A promising methodology for detecting high emitters is SPN testing at low idling during PTI. Several European countries plan to introduce this method for diesel vehicles and the European Commission (EC) will provide some guidelines. For this scope an experimental campaign was organized by the Joint Research Centre (JRC) of the EC with the participation of different instrument manufacturers. Idle SPN concentrations of vehicles without or with a malfunctioning particulate filter were measured. The presence of particles under the current cut-off size of 23 nm as well as of volatile particles during idling are presented. Moreover, the extreme case of a well performing vehicle tested after a filter regeneration is studied. In most of the cases the different sensors used were in good agreement, the high sub-23 nm particles existence being the most challenging case due to the differences in the sensors’ efficiency below the cut-off size. Full article
Show Figures

Figure 1

16 pages, 3332 KiB  
Article
The Use of Public Data from Low-Cost Sensors for the Geospatial Analysis of Air Pollution from Solid Fuel Heating during the COVID-19 Pandemic Spring Period in Krakow, Poland
by Tomasz Danek and Mateusz Zaręba
Sensors 2021, 21(15), 5208; https://0-doi-org.brum.beds.ac.uk/10.3390/s21155208 - 31 Jul 2021
Cited by 27 | Viewed by 5077
Abstract
In this paper, we present a detailed analysis of the public data provided by low-cost sensors (LCS), which were used for spatial and temporal studies of air quality in Krakow. A PM (particulate matter) dataset was obtained in spring in 2021, during which [...] Read more.
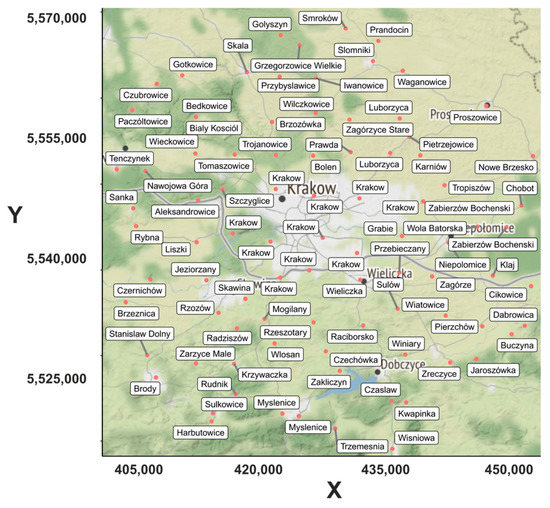
In this paper, we present a detailed analysis of the public data provided by low-cost sensors (LCS), which were used for spatial and temporal studies of air quality in Krakow. A PM (particulate matter) dataset was obtained in spring in 2021, during which a fairly strict lockdown was in force as a result of COVID-19. Therefore, we were able to separate the effect of solid fuel heating from other sources of background pollution, mainly caused by urban transport. Moreover, we analyzed the historical data of PM2.5 from 2010 to 2019 to show the effect of grassroots efforts and pro-clean-air legislation changes in Krakow. We designed a unique workflow with a time-spatial analysis of PM1, PM2.5, and PM10, and temperature data from Airly(c) sensors located in Krakow and its surroundings. Using geostatistical methods, we showed that Krakow’s neighboring cities are the main sources of air pollution from solid fuel heating in the city. Additionally, we showed that the changes in the law in Krakow significantly reduced the PM concentration as compared to neighboring municipalities without a fossil fuel prohibition law. Moreover, our research demonstrates that informative campaigns and education are important initiating factors in order to bring about cleaner air in the future. Full article
Show Figures

Figure 1

18 pages, 4325 KiB  
Article
An Approximation for Metal-Oxide Sensor Calibration for Air Quality Monitoring Using Multivariable Statistical Analysis
by Diego Sales-Lérida, Alfonso J. Bello, Alberto Sánchez-Alzola and Pedro Manuel Martínez-Jiménez
Sensors 2021, 21(14), 4781; https://0-doi-org.brum.beds.ac.uk/10.3390/s21144781 - 13 Jul 2021
Cited by 9 | Viewed by 2408
Abstract
Good air quality is essential for both human beings and the environment in general. The three most harmful air pollutants are nitrogen dioxide (NO2), ozone (O3) and particulate matter. Due to the high cost of monitoring stations, few examples [...] Read more.
Good air quality is essential for both human beings and the environment in general. The three most harmful air pollutants are nitrogen dioxide (NO2), ozone (O3) and particulate matter. Due to the high cost of monitoring stations, few examples of this type of infrastructure exist, and the use of low-cost sensors could help in air quality monitoring. The cost of metal-oxide sensors (MOS) is usually below EUR 10 and they maintain small dimensions, but their use in air quality monitoring is only valid through an exhaustive calibration process and subsequent precision analysis. We present an on-field calibration technique, based on the least squares method, to fit regression models for low-cost MOS sensors, one that has two main advantages: it can be easily applied by non-expert operators, and it can be used even with only a small amount of calibration data. In addition, the proposed method is adaptive, and the calibration can be refined as more data becomes available. We apply and evaluate the technique with a real dataset from a particular area in the south of Spain (Granada city). The evaluation results show that, despite the simplicity of the technique and the low quantity of data, the accuracy obtained with the low-cost MOS sensors is high enough to be used for air quality monitoring. Full article
Show Figures

Figure 1

18 pages, 1240 KiB  
Article
Deployment, Calibration, and Cross-Validation of Low-Cost Electrochemical Sensors for Carbon Monoxide, Nitrogen Oxides, and Ozone for an Epidemiological Study
by Christopher Zuidema, Cooper S. Schumacher, Elena Austin, Graeme Carvlin, Timothy V. Larson, Elizabeth W. Spalt, Marina Zusman, Amanda J. Gassett, Edmund Seto, Joel D. Kaufman and Lianne Sheppard
Sensors 2021, 21(12), 4214; https://0-doi-org.brum.beds.ac.uk/10.3390/s21124214 - 19 Jun 2021
Cited by 19 | Viewed by 3532
Abstract
We designed and built a network of monitors for ambient air pollution equipped with low-cost gas sensors to be used to supplement regulatory agency monitoring for exposure assessment within a large epidemiological study. This paper describes the development of a series of hourly [...] Read more.
We designed and built a network of monitors for ambient air pollution equipped with low-cost gas sensors to be used to supplement regulatory agency monitoring for exposure assessment within a large epidemiological study. This paper describes the development of a series of hourly and daily field calibration models for Alphasense sensors for carbon monoxide (CO; CO-B4), nitric oxide (NO; NO-B4), nitrogen dioxide (NO2; NO2-B43F), and oxidizing gases (OX-B431)—which refers to ozone (O3) and NO2. The monitor network was deployed in the Puget Sound region of Washington, USA, from May 2017 to March 2019. Monitors were rotated throughout the region, including at two Puget Sound Clean Air Agency monitoring sites for calibration purposes, and over 100 residences, including the homes of epidemiological study participants, with the goal of improving long-term pollutant exposure predictions at participant locations. Calibration models improved when accounting for individual sensor performance, ambient temperature and humidity, and concentrations of co-pollutants as measured by other low-cost sensors in the monitors. Predictions from the final daily models for CO and NO performed the best considering agreement with regulatory monitors in cross-validated root-mean-square error (RMSE) and R2 measures (CO: RMSE = 18 ppb, R2 = 0.97; NO: RMSE = 2 ppb, R2 = 0.97). Performance measures for NO2 and O3 were somewhat lower (NO2: RMSE = 3 ppb, R2 = 0.79; O3: RMSE = 4 ppb, R2 = 0.81). These high levels of calibration performance add confidence that low-cost sensor measurements collected at the homes of epidemiological study participants can be integrated into spatiotemporal models of pollutant concentrations, improving exposure assessment for epidemiological inference. Full article
Show Figures

Figure 1

22 pages, 1645 KiB  
Article
Developing Relative Humidity and Temperature Corrections for Low-Cost Sensors Using Machine Learning
by Ivan Vajs, Dejan Drajic, Nenad Gligoric, Ilija Radovanovic and Ivan Popovic
Sensors 2021, 21(10), 3338; https://0-doi-org.brum.beds.ac.uk/10.3390/s21103338 - 11 May 2021
Cited by 12 | Viewed by 3316
Abstract
Existing government air quality monitoring networks consist of static measurement stations, which are highly reliable and accurately measure a wide range of air pollutants, but they are very large, expensive and require significant amounts of maintenance. As a promising solution, low-cost sensors are [...] Read more.
Existing government air quality monitoring networks consist of static measurement stations, which are highly reliable and accurately measure a wide range of air pollutants, but they are very large, expensive and require significant amounts of maintenance. As a promising solution, low-cost sensors are being introduced as complementary, air quality monitoring stations. These sensors are, however, not reliable due to the lower accuracy, short life cycle and corresponding calibration issues. Recent studies have shown that low-cost sensors are affected by relative humidity and temperature. In this paper, we explore methods to additionally improve the calibration algorithms with the aim to increase the measurement accuracy considering the impact of temperature and humidity on the readings, by using machine learning. A detailed comparative analysis of linear regression, artificial neural network and random forest algorithms are presented, analyzing their performance on the measurements of CO, NO2 and PM10 particles, with promising results and an achieved R2 of 0.93–0.97, 0.82–0.94 and 0.73–0.89 dependent on the observed period of the year, respectively, for each pollutant. A comprehensive analysis and recommendations on how low-cost sensors could be used as complementary monitoring stations to the reference ones, to increase spatial and temporal measurement resolution, is provided. Full article
Show Figures

Figure 1

18 pages, 8119 KiB  
Article
Investigating a Low-Cost Dryer Designed for Low-Cost PM Sensors Measuring Ambient Air Quality
by Abdul Samad, Freddy Ernesto Melchor Mimiaga, Bernd Laquai and Ulrich Vogt
Sensors 2021, 21(3), 804; https://0-doi-org.brum.beds.ac.uk/10.3390/s21030804 - 26 Jan 2021
Cited by 20 | Viewed by 3127
Abstract
Air pollution in urban areas is a huge concern that demands an efficient air quality control to ensure health quality standards. The hotspots can be located by increasing spatial distribution of ambient air quality monitoring for which the low-cost sensors can be used. [...] Read more.
Air pollution in urban areas is a huge concern that demands an efficient air quality control to ensure health quality standards. The hotspots can be located by increasing spatial distribution of ambient air quality monitoring for which the low-cost sensors can be used. However, it is well-known that many factors influence their results. For low-cost Particulate Matter (PM) sensors, high relative humidity can have a significant impact on data quality. In order to eliminate or reduce the impact of high relative humidity on the results obtained from low-cost PM sensors, a low-cost dryer was developed and its effectiveness was investigated. For this purpose, a test chamber was designed, and low-cost PM sensors as well as professional reference devices were installed. A vaporizer regulated the humid conditions in the test chamber. The low-cost dryer heated the sample air with a manually adjustable intensity depending on the voltage. Different voltages were tested to find the optimum one with least energy consumption and maximum drying efficiency. The low-cost PM sensors with and without the low-cost dryer were compared. The experimental results verified that using the low-cost dryer reduced the influence of relative humidity on the low-cost PM sensor results. Full article
Show Figures

Figure 1

2020

Jump to: 2024, 2023, 2022, 2021

18 pages, 2226 KiB  
Article
Comparisons of Laboratory and On-Road Type-Approval Cycles with Idling Emissions. Implications for Periodical Technical Inspection (PTI) Sensors
by Barouch Giechaskiel, Tero Lähde, Ricardo Suarez-Bertoa, Victor Valverde and Michael Clairotte
Sensors 2020, 20(20), 5790; https://0-doi-org.brum.beds.ac.uk/10.3390/s20205790 - 13 Oct 2020
Cited by 15 | Viewed by 3098
Abstract
For the type approval of compression ignition (diesel) and gasoline direct injection vehicles, a particle number (PN) limit of 6 × 10¹¹ p/km is applicable. Diesel vehicles in circulation need to pass a periodical technical inspection (PTI) test, typically every two years, [...] Read more.
For the type approval of compression ignition (diesel) and gasoline direct injection vehicles, a particle number (PN) limit of 6 × 10¹¹ p/km is applicable. Diesel vehicles in circulation need to pass a periodical technical inspection (PTI) test, typically every two years, after the first four years of circulation. However, often the applicable smoke tests or on-board diagnostic (OBD) fault checks cannot identify malfunctions of the diesel particulate filters (DPFs). There are also serious concerns that a few high emitters are responsible for the majority of the emissions. For these reasons, a new PTI procedure at idle run with PN systems is under investigation. The correlations between type approval cycles and idle emissions are limited, especially for positive (spark) ignition vehicles. In this study the type approval PN emissions of 32 compression ignition and 56 spark ignition vehicles were compared to their idle PN concentrations from laboratory and on-road tests. The results confirmed that the idle test is applicable for diesel vehicles. The scatter for the spark ignition vehicles was much larger. Nevertheless, the proposed limit for diesel vehicles was also shown to be applicable for these vehicles. The technical specifications of the PTI sensors based on these findings were also discussed. Full article
Show Figures

Figure 1

19 pages, 3679 KiB  
Article
Application of Machine Learning for the in-Field Correction of a PM2.5 Low-Cost Sensor Network
by Wen-Cheng Vincent Wang, Shih-Chun Candice Lung and Chun-Hu Liu
Sensors 2020, 20(17), 5002; https://0-doi-org.brum.beds.ac.uk/10.3390/s20175002 - 03 Sep 2020
Cited by 21 | Viewed by 3814
Abstract
Many low-cost sensors (LCSs) are distributed for air monitoring without any rigorous calibrations. This work applies machine learning with PM2.5 from Taiwan monitoring stations to conduct in-field corrections on a network of 39 PM2.5 LCSs from July 2017 to December 2018. [...] Read more.
Many low-cost sensors (LCSs) are distributed for air monitoring without any rigorous calibrations. This work applies machine learning with PM2.5 from Taiwan monitoring stations to conduct in-field corrections on a network of 39 PM2.5 LCSs from July 2017 to December 2018. Three candidate models were evaluated: Multiple linear regression (MLR), support vector regression (SVR), and random forest regression (RFR). The model-corrected PM2.5 levels were compared with those of GRIMM-calibrated PM2.5. RFR was superior to MLR and SVR in its correction accuracy and computing efficiency. Compared to SVR, the root mean square errors (RMSEs) of RFR were 35% and 85% lower for the training and validation sets, respectively, and the computational speed was 35 times faster. An RFR with 300 decision trees was chosen as the optimal setting considering both the correction performance and the modeling time. An RFR with a nighttime pattern was established as the optimal correction model, and the RMSEs were 5.9 ± 2.0 μg/m3, reduced from 18.4 ± 6.5 μg/m3 before correction. This is the first work to correct LCSs at locations without monitoring stations, validated using laboratory-calibrated data. Similar models could be established in other countries to greatly enhance the usefulness of their PM2.5 sensor networks. Full article
Show Figures

Figure 1

21 pages, 3882 KiB  
Article
Wildfire Smoke Adjustment Factors for Low-Cost and Professional PM2.5 Monitors with Optical Sensors
by William W. Delp and Brett C. Singer
Sensors 2020, 20(13), 3683; https://0-doi-org.brum.beds.ac.uk/10.3390/s20133683 - 30 Jun 2020
Cited by 57 | Viewed by 13410
Abstract
Air quality monitors using low-cost optical PM2.5 sensors can track the dispersion of wildfire smoke; but quantitative hazard assessment requires a smoke-specific adjustment factor (AF). This study determined AFs for three professional-grade devices and four monitors with low-cost sensors based on measurements [...] Read more.
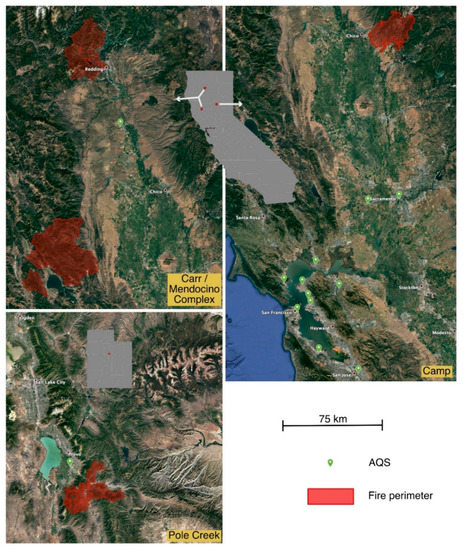
Air quality monitors using low-cost optical PM2.5 sensors can track the dispersion of wildfire smoke; but quantitative hazard assessment requires a smoke-specific adjustment factor (AF). This study determined AFs for three professional-grade devices and four monitors with low-cost sensors based on measurements inside a well-ventilated lab impacted by the 2018 Camp Fire in California (USA). Using the Thermo TEOM-FDMS as reference, AFs of professional monitors were 0.85 for Grimm mini wide-range aerosol spectrometer, 0.25 for TSI DustTrak, and 0.53 for Thermo pDR1500; AFs for low-cost monitors were 0.59 for AirVisual Pro, 0.48 for PurpleAir Indoor, 0.46 for Air Quality Egg, and 0.60 for eLichens Indoor Air Quality Pro Station. We also compared public data from 53 PurpleAir PA-II monitors to 12 nearby regulatory monitoring stations impacted by Camp Fire smoke and devices near stations impacted by the Carr and Mendocino Complex Fires in California and the Pole Creek Fire in Utah. Camp Fire AFs varied by day and location, with median (interquartile) of 0.48 (0.44–0.53). Adjusted PA-II 4-h average data were generally within ±20% of PM2.5 reported by the monitoring stations. Adjustment improved the accuracy of Air Quality Index (AQI) hazard level reporting, e.g., from 14% to 84% correct in Sacramento during the Camp Fire. Full article
Show Figures

Figure 1

16 pages, 2724 KiB  
Article
Comparing Airborne Particulate Matter Intake Dose Assessment Models Using Low-Cost Portable Sensor Data
by Rok Novak, David Kocman, Johanna Amalia Robinson, Tjaša Kanduč, Dimosthenis Sarigiannis and Milena Horvat
Sensors 2020, 20(5), 1406; https://0-doi-org.brum.beds.ac.uk/10.3390/s20051406 - 04 Mar 2020
Cited by 10 | Viewed by 3843
Abstract
Low-cost sensors can be used to improve the temporal and spatial resolution of an individual’s particulate matter (PM) intake dose assessment. In this work, personal activity monitors were used to measure heart rate (proxy for minute ventilation), and low-cost PM sensors were used [...] Read more.
Low-cost sensors can be used to improve the temporal and spatial resolution of an individual’s particulate matter (PM) intake dose assessment. In this work, personal activity monitors were used to measure heart rate (proxy for minute ventilation), and low-cost PM sensors were used to measure concentrations of PM. Intake dose was assessed as a product of PM concentration and minute ventilation, using four models with increasing complexity. The two models that use heart rate as a variable had the most consistent results and showed a good response to variations in PM concentrations and heart rate. On the other hand, the two models using generalized population data of minute ventilation expectably yielded more coarse information on the intake dose. Aggregated weekly intake doses did not vary significantly between the models (6–22%). Propagation of uncertainty was assessed for each model, however, differences in their underlying assumptions made them incomparable. The most complex minute ventilation model, with heart rate as a variable, has shown slightly lower uncertainty than the model using fewer variables. Similarly, among the non-heart rate models, the one using real-time activity data has less uncertainty. Minute ventilation models contribute the most to the overall intake dose model uncertainty, followed closely by the low-cost personal activity monitors. The lack of a common methodology to assess the intake dose and quantifying related uncertainties is evident and should be a subject of further research. Full article
Show Figures

Graphical abstract

Back to TopTop