Sex Specific Expression of Interleukin 7, 8 and 15 in Placentas of Women with Gestational Diabetes

 , and
, and
Abstract
:1. Introduction
2. Results
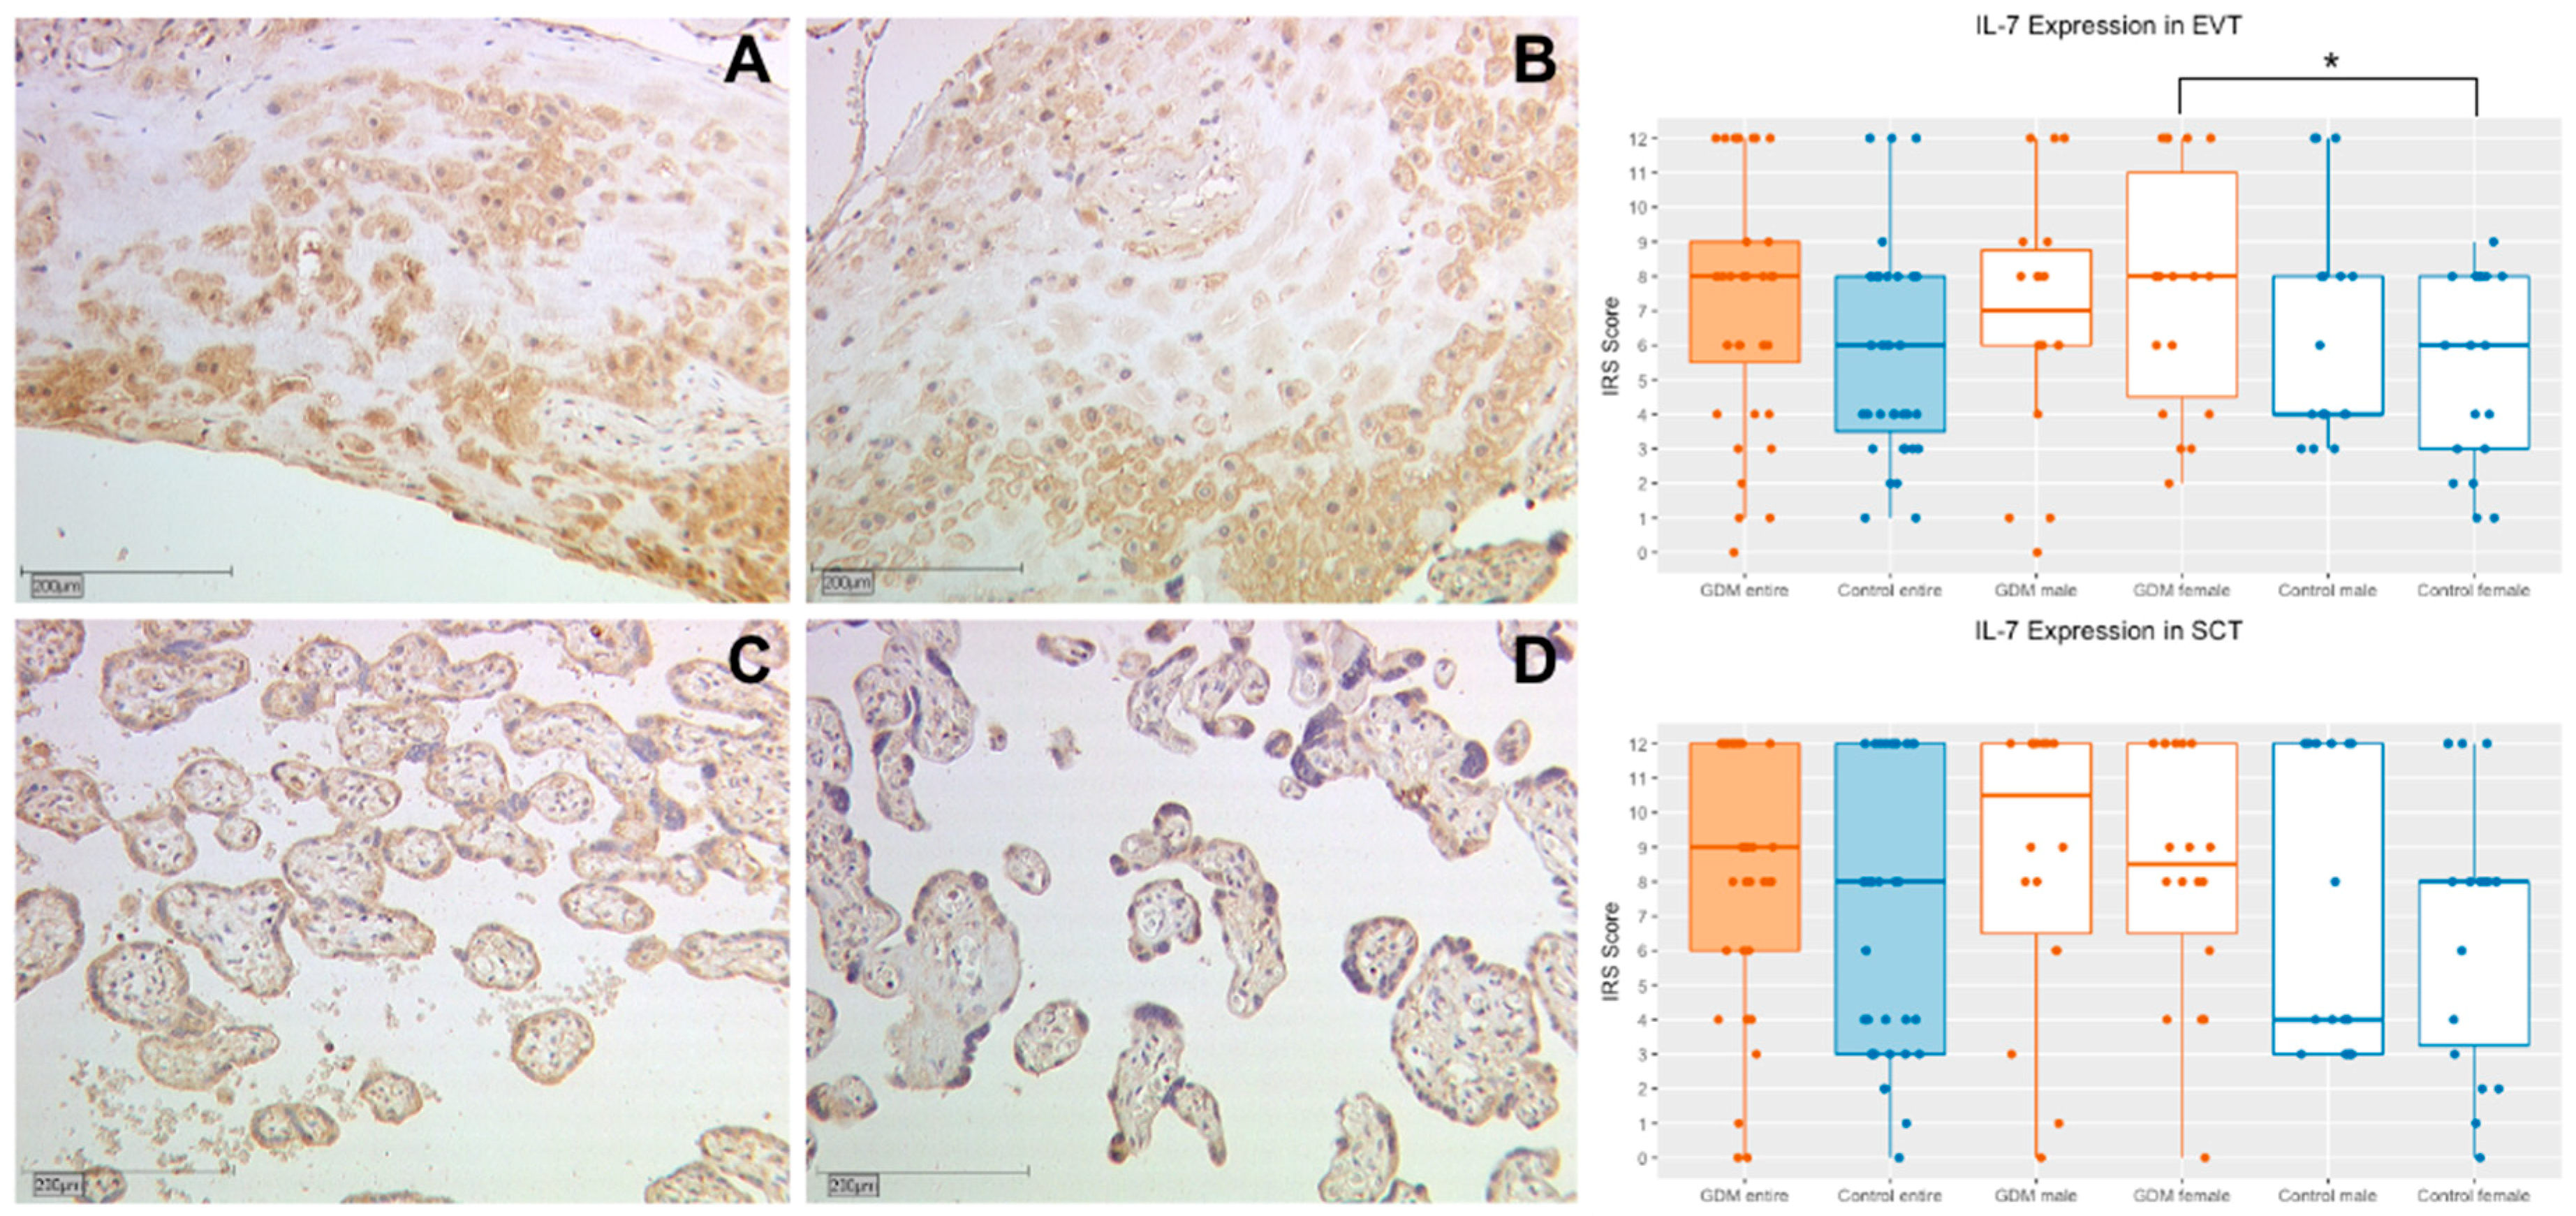
2.1. Interleukin 7
2.1.1. IL-7 Expression in Extravillous Trophoblasts (EVT)
2.1.2. IL-7 Expression in Syncytiotrophoblasts (SCT)
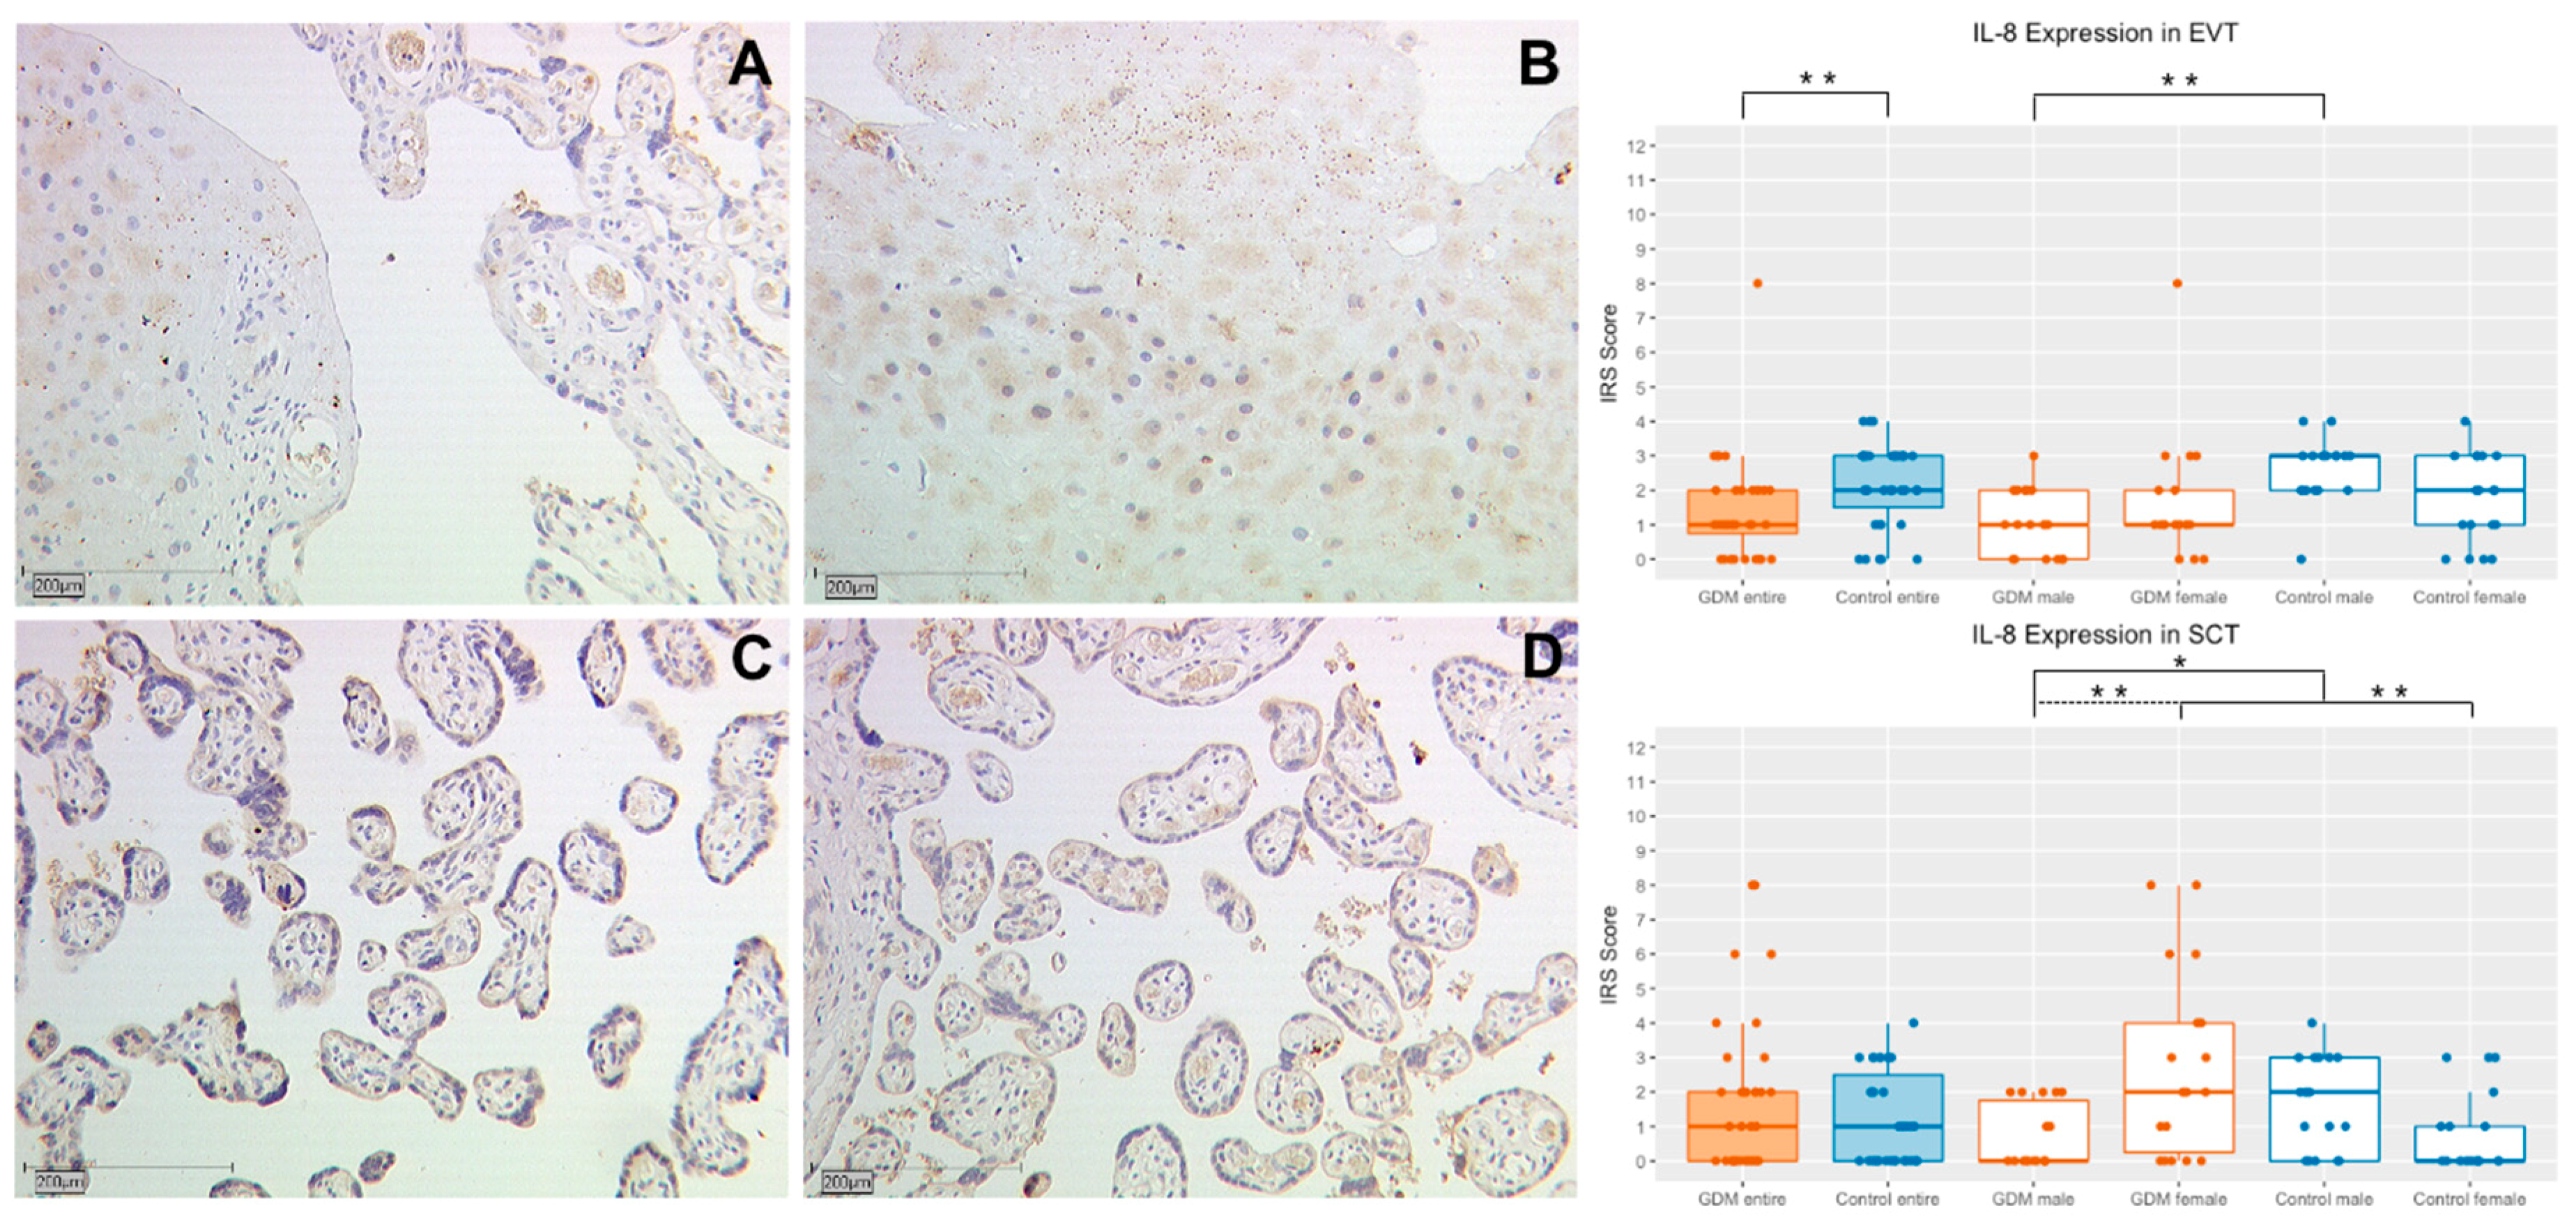
2.2. Interleukin 8
2.2.1. IL-8 Expression in Extravillous Trophoblasts (EVT)
2.2.2. IL-8 Expression in Syncytiotrophoblasts (SCT)
2.3. Interleukin 15
2.3.1. IL-15 Expression in Extravillous Trophoblasts (EVT)
2.3.2. IL-15 Expression in Syncytiotrophoblasts (SCT)
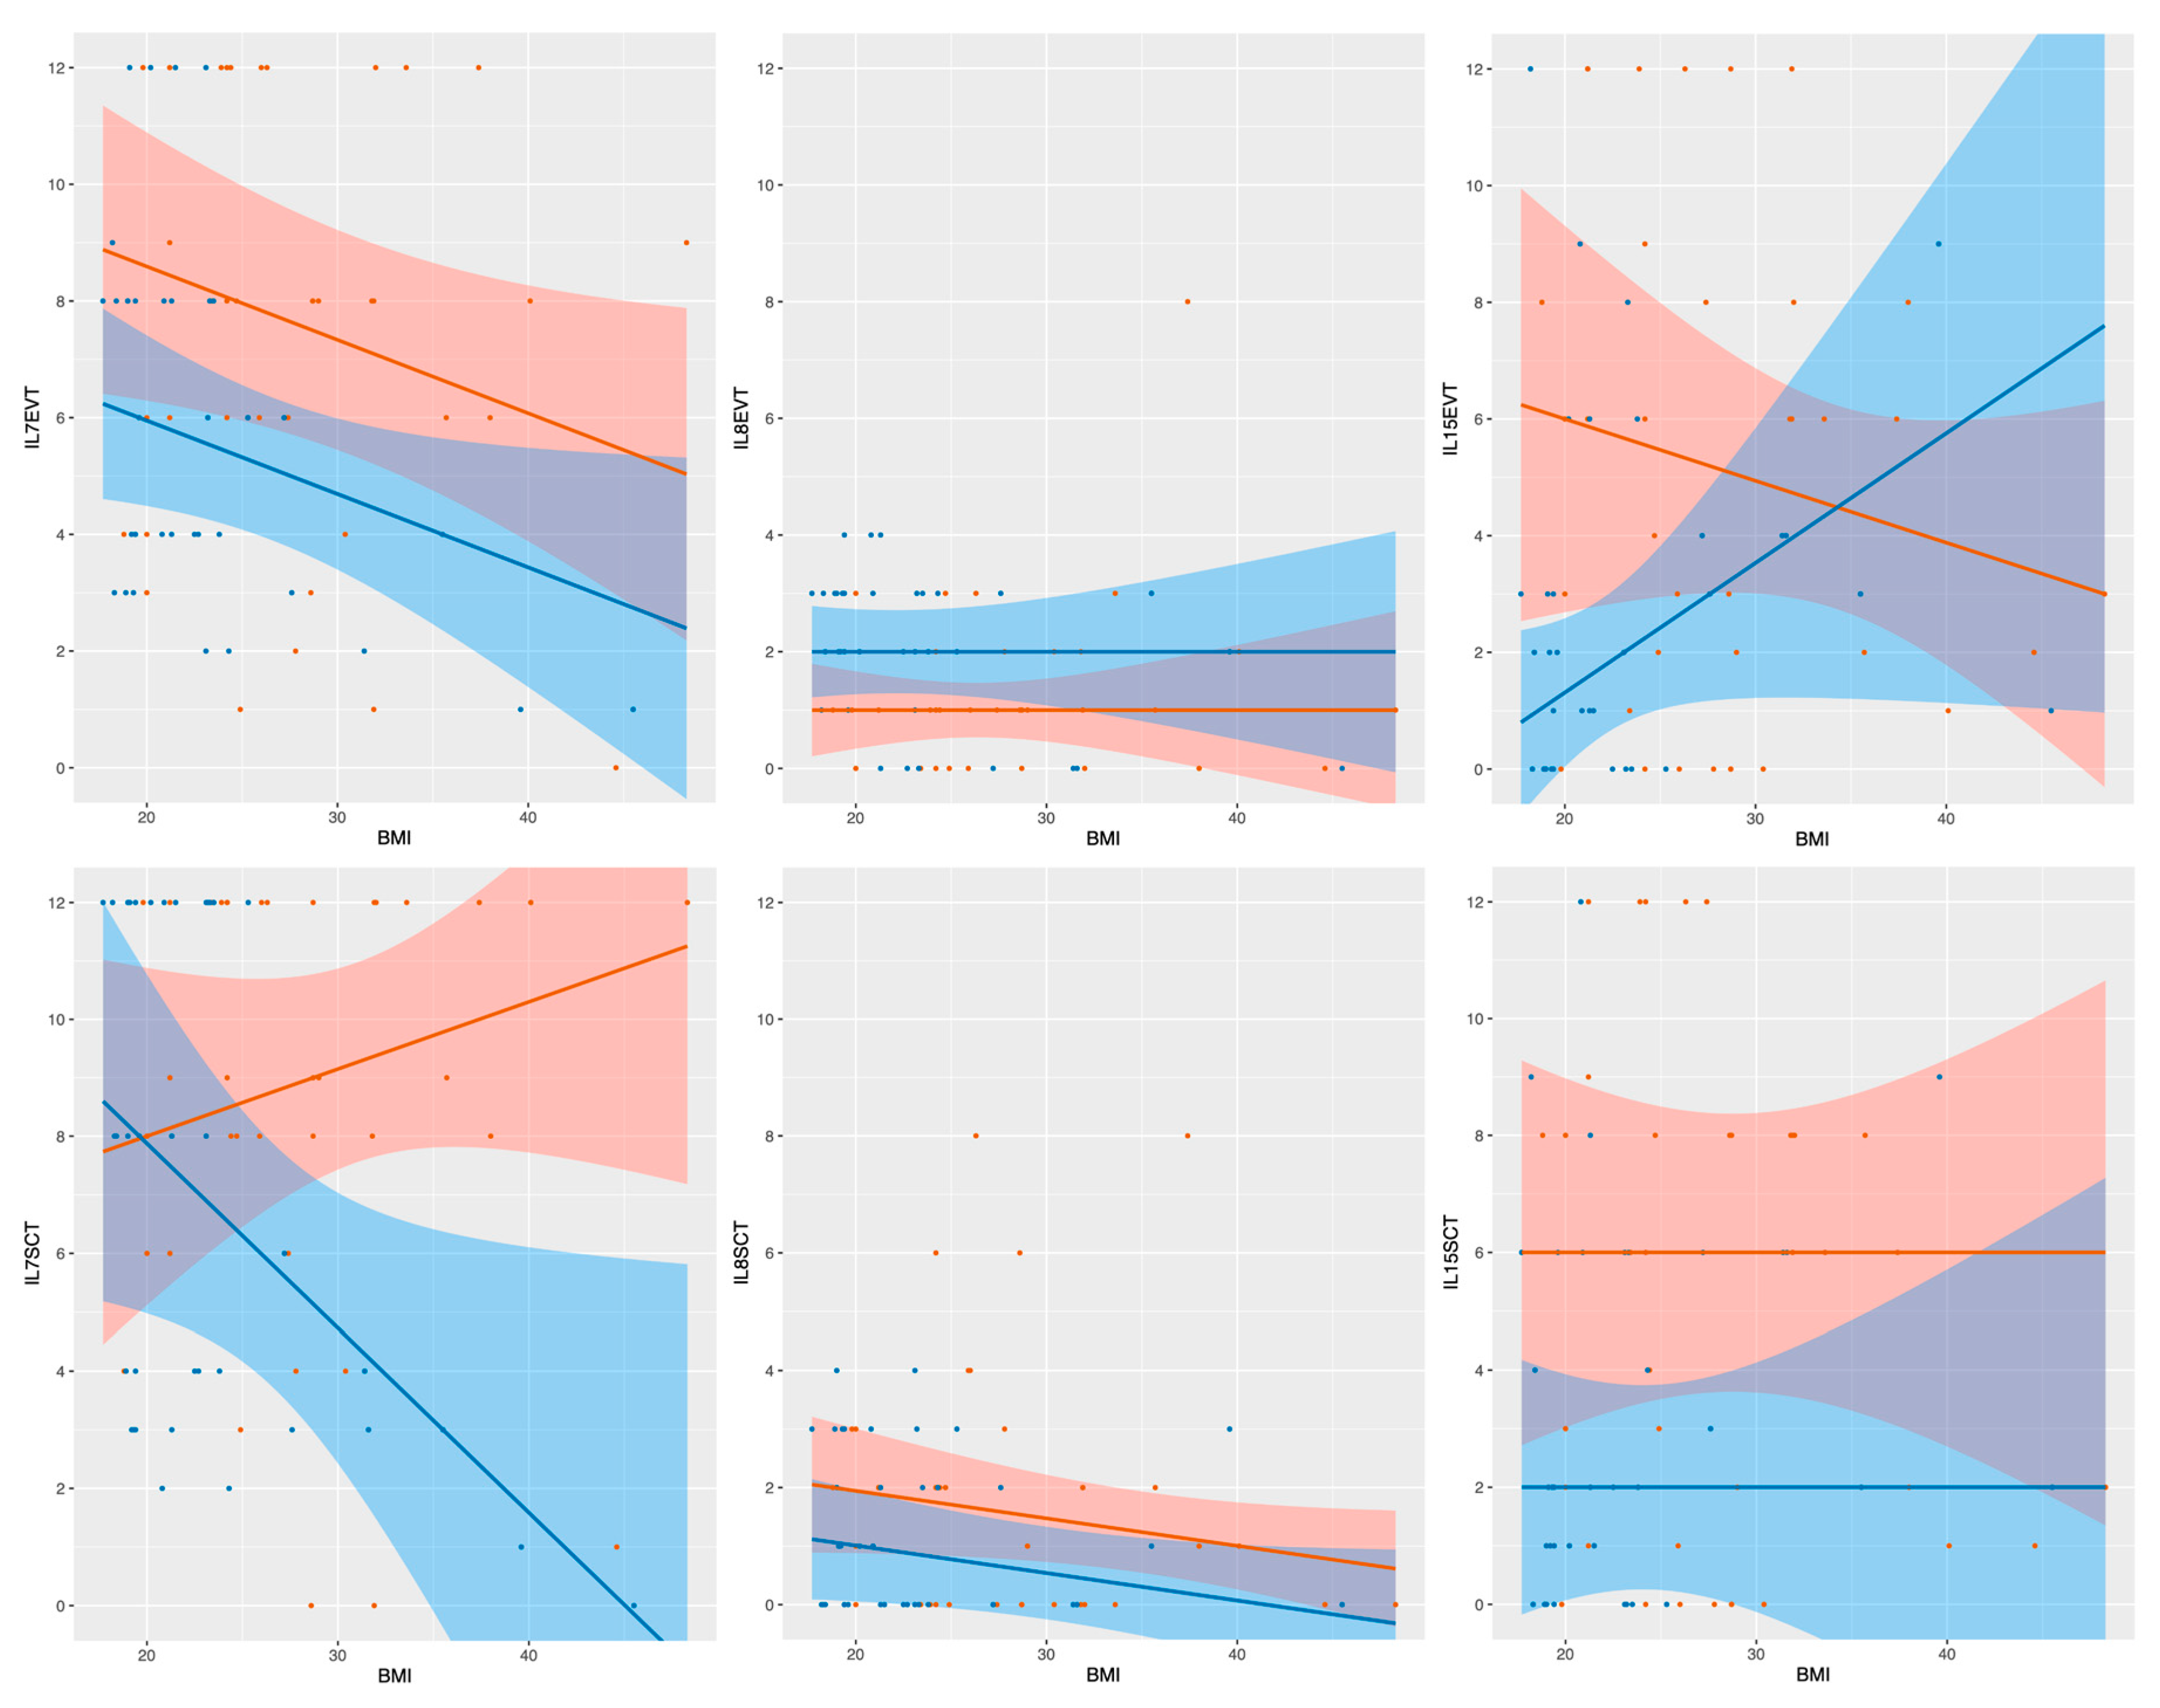
2.4. Linear Median Regression Models for Interleukin Expression Including BMI and GDM
2.5. Linear Median Regression Models for Interleukin Expression Including Birth Weight and GDM
3. Discussion
4. Materials and Methods
4.1. Tissue Samples
4.2. Immunohistochemistry
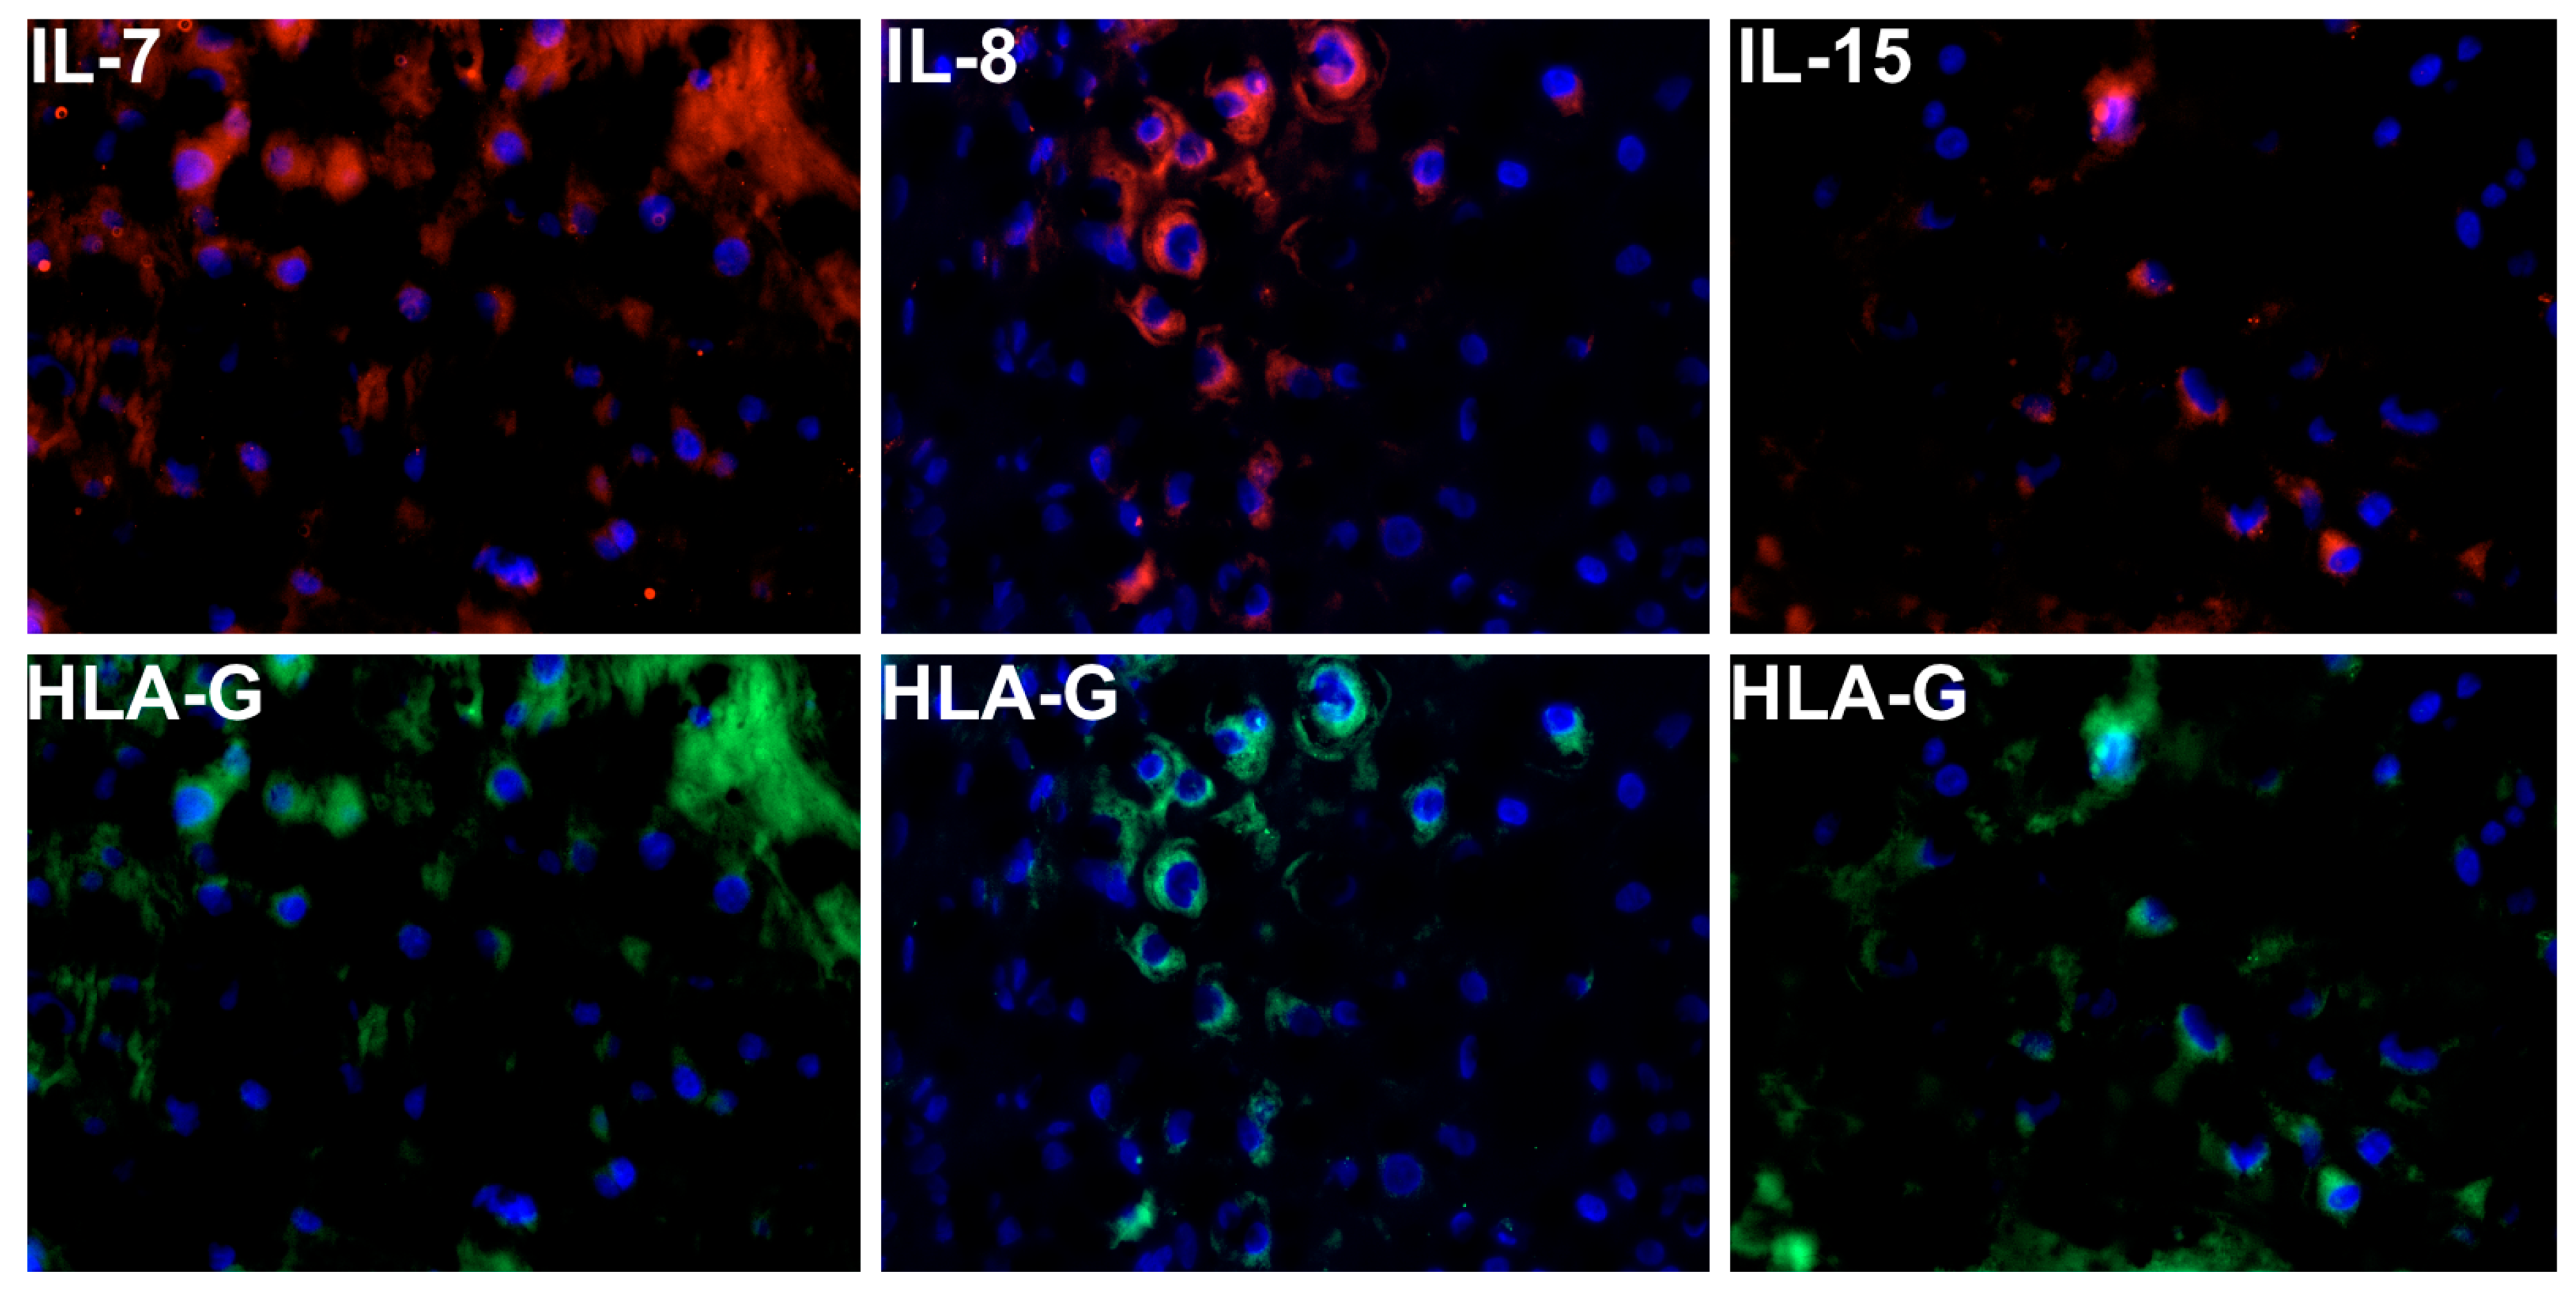
4.3. Double Immunofluorescence Staining
4.4. Statistics
Author Contributions
Funding
Acknowledgments
Conflicts of Interest
Abbreviations
| GDM | Gestational diabetes mellitus |
| IL | Interleukin |
| EVT | Extravillous trophoblast |
| SCT | Syncytiotrophoblast |
| IRS | Immunoreactive score |
| NK | Natural killer cells |
| PBS | phosphate-buffered saline |
References
- Hartling, L.; Dryden, D.M.; Guthrie, A.; Muise, M.; VanderMeer, B.; Donovan, L. Benefits and Harms of Treating Gestational Diabetes Mellitus: A Systematic Review and Meta-analysis for the U.S. Preventive Services Task Force and the National Institutes of Health Office of Medical Applications of Research. Ann. Intern. Med. 2013, 159, 123–129. [Google Scholar] [CrossRef] [Green Version]
- Ferrara, A. Increasing Prevalence of Gestational Diabetes Mellitus: A public health perspective. Diabetes Care 2007, 30, S141–S146. [Google Scholar] [CrossRef] [Green Version]
- Schäfer-Graf, U.M.; Gembruch, U.; Kainer, F.; Groten, T.; Hummel, S.; Hösli, I.; Grieshop, M.; Kaltheuner, M.; Bührer, C.; Kautzky-Willer, A.; et al. Gestational Diabetes Mellitus (GDM)–Diagnosis, Treatment and Follow-up. Guideline of the DDG and DGGG (S3 Level, AWMF Registry Number 057/008, February 2018). Geburtshilfe Frauenheilkd. 2018, 78, 1219–1231. [Google Scholar] [CrossRef] [Green Version]
- Bryson, C.L.; Ioannou, G.N.; Rulyak, S.J.; Critchlow, C. Association between Gestational Diabetes and Pregnancy-induced Hypertension. Am. J. Epidemiol. 2003, 158, 1148–1153. [Google Scholar] [CrossRef] [PubMed] [Green Version]
- Casey, B.M. Pregnancy Outcomes in Women with Gestational Diabetes Compared with the General Obstetric Population. Obstet. Gynecol. 1997, 90, 869–873. [Google Scholar] [CrossRef]
- Reece, E.A.; Leguizamón, G.; Wiznitzer, A. Gestational diabetes: The need for a common ground. Lancet 2009, 373, 1789–1797. [Google Scholar] [CrossRef]
- Jones, C.W. Gestational Diabetes and Its Impact on the Neonate. Neonatal Netw. 2001, 20, 17–23. [Google Scholar] [CrossRef]
- Clausen, T.D.; Mathiesen, E.R.; Hansen, T.; Pedersen, O.; Jensen, D.M.; Lauenborg, J.; Damm, P. High Prevalence of Type 2 Diabetes and Pre-Diabetes in Adult Offspring of Women with Gestational Diabetes Mellitus or Type 1 Diabetes: The role of intrauterine hyperglycemia. Diabetes Care 2007, 31, 340–346. [Google Scholar] [CrossRef] [PubMed] [Green Version]
- American Diabetes Association. Gestational diabetes mellitus. Diabetes Care 2004, 27 (Suppl. S1), s88–s90. [Google Scholar]
- WHO. Diagnostic Criteria and Classification of Hyperglycaemia First Detected in Pregnancy; WHO Guidelines Approved by the Guidelines Review Committee Geneva; WHO: Geneva, Switzerland, 2013. [Google Scholar]
- Ali, S.; Dornhorst, A. Diabetes in pregnancy: Health risks and management. Postgrad. Med. J. 2011, 87, 417–427. [Google Scholar] [CrossRef]
- Ramsay, J.E.; Ferrell, W.R.; Crawford, L.; Wallace, A.M.; Greer, I.A.; Sattar, N. Maternal Obesity Is Associated with Dysregulation of Metabolic, Vascular, and Inflammatory Pathways. J. Clin. Endocrinol. Metab. 2002, 87, 4231–4237. [Google Scholar] [CrossRef] [PubMed]
- Heilbronn, L.K.; Campbell, L.V. Adipose Tissue Macrophages, Low Grade Inflammation and Insulin Resistance in Human Obesity. Curr. Pharm. Des. 2008, 14, 1225–1230. [Google Scholar] [CrossRef]
- Lappas, M.; Permezel, M.; Rice, G.E. Release of Proinflammatory Cytokines and 8-Isoprostane from Placenta, Adipose Tissue, and Skeletal Muscle from Normal Pregnant Women and Women with Gestational Diabetes Mellitus. J. Clin. Endocrinol. Metab. 2004, 89, 5627–5633. [Google Scholar] [CrossRef] [PubMed] [Green Version]
- Pantham, P.; Aye, I.L.M.H.; Powell, T.L. Inflammation in maternal obesity and gestational diabetes mellitus. Placenta 2015, 36, 709–715. [Google Scholar] [CrossRef] [Green Version]
- Retnakaran, R.; Hanley, A.J.; Raif, N.; Connelly, P.W.; Sermer, M.; Zinman, B. C-Reactive Protein and Gestational Diabetes: The Central Role of Maternal Obesity. J. Clin. Endocrinol. Metab. 2003, 88, 3507–3512. [Google Scholar] [CrossRef] [PubMed] [Green Version]
- Desoye, G.; Mouzon, S.H.-D. The Human Placenta in Gestational Diabetes Mellitus: The insulin and cytokine network. Diabetes Care 2007, 30, S120–S126. [Google Scholar] [CrossRef] [Green Version]
- Bowen, J.; Chamley, L.; Mitchellab, M.; Keelan, J. Cytokines of the Placenta and Extra-placental Membranes: Biosynthesis, Secretion and Roles in Establishment of Pregnancy in Women. Placenta 2002, 23, 239–256. [Google Scholar] [CrossRef] [PubMed]
- Wedekind, L.; Belkacemi, L. Altered cytokine network in gestational diabetes mellitus affects maternal insulin and placental–fetal development. J. Diabetes Complicat. 2016, 30, 1393–1400. [Google Scholar] [CrossRef]
- Zhang, J.; Chi, H.; Xiao, H.; Tian, X.; Wang, Y.; Yun, X.; Xu, Y. Interleukin 6 (IL-6) and Tumor Necrosis Factor α (TNF-α) Single Nucleotide Polymorphisms (SNPs), Inflammation and Metabolism in Gestational Diabetes Mellitus in Inner Mongolia. Med. Sci. Monit. 2017, 23, 4149–4157. [Google Scholar] [CrossRef] [Green Version]
- Lee, M.; Song, S.J.; Choi, M.-S.; Yu, R.; Park, T. IL-7 receptor deletion ameliorates diet-induced obesity and insulin resistance in mice. Diabetologia 2015, 58, 2361–2370. [Google Scholar] [CrossRef] [Green Version]
- Bikker, A.; Hack, C.E.; Lafeber, F.P.; Van Roon, J.A. Interleukin-7: A key Mediator in T Cell-driven Autoimmunity, Inflammation, and Tissue Destruction. Curr. Pharm. Des. 2012, 18, 2347–2356. [Google Scholar] [CrossRef] [PubMed]
- Fry, T.J.; Mackall, C.L. Interleukin-7: From bench to clinic. Blood 2002, 99, 3892–3904. [Google Scholar] [CrossRef] [Green Version]
- Urakaze, M.; Temaru, R.; Satou, A.; Yamazaki, K.; Hamazaki, T.; Kobayashi, M. The IL-8 Production in Endothelial Cells is Stimulated by High Glucose. Horm. Metab. Res. 1996, 28, 400–401. [Google Scholar] [CrossRef] [PubMed]
- Kleiblova, P.; Dostalova, I.; Bartlova, M.; Lacinova, Z.; Ticha, I.; Krejci, V.; Springer, D.; Kleibl, Z.; Haluzik, M. Expression of adipokines and estrogen receptors in adipose tissue and placenta of patients with gestational diabetes mellitus. Mol. Cell. Endocrinol. 2010, 314, 150–156. [Google Scholar] [CrossRef] [Green Version]
- Kuzmicki, M.; Telejko, B.; Wawrusiewicz-Kurylonek, N.; Citko, A.; Lipinska, D.; Pliszka, J.; Wilk, J.; Kalejta, K.; Lemancewicz, A.; Grabiec, M.; et al. The expression of suppressor of cytokine signaling 1 and 3 in fat and placental tissue from women with gestational diabetes. Gynecol. Endocrinol. 2012, 28, 841–844. [Google Scholar] [CrossRef]
- Hara, C.D.C.P.; França, E.L.; Fagundes, D.L.G.; De Queiroz, A.A.; Rudge, M.; Honorio-França, A.C.; Calderon, I.D.M.P. Characterization of Natural Killer Cells and Cytokines in Maternal Placenta and Fetus of Diabetic Mothers. J. Immunol. Res. 2016, 2016, 7154524–7154528. [Google Scholar] [CrossRef] [PubMed]
- Toth, B.; Haufe, T.; Scholz, C.; Kuhn, C.; Friese, K.; Karamouti, M.; Makrigiannakis, A.; Jeschke, U. Placental Interleukin-15 Expression in Recurrent Miscarriage. Am. J. Reprod. Immunol. 2010, 64, 402–410. [Google Scholar] [CrossRef]
- Makki, K.; Froguel, P.; Wolowczuk, I. Adipose Tissue in Obesity-Related Inflammation and Insulin Resistance: Cells, Cytokines, and Chemokines. ISRN Inflamm. 2013, 2013, 1–12. [Google Scholar] [CrossRef] [PubMed] [Green Version]
- Maury, E.; Ehala-Aleksejev, K.; Guiot, Y.; Detry, R.; Vandenhooft, A.; Brichard, S.M. Adipokines oversecreted by omental adipose tissue in human obesity. Am. J. Physiol. Metab. 2007, 293, E656–E665. [Google Scholar] [CrossRef] [Green Version]
- Hernández-Trejo, M.; Montoya-Estrada, A.; Torres-Ramos, Y.; Espejel-Núñez, A.; Guzmán-Grenfell, A.; Morales-Hernández, R.; Tolentino-Dolores, M.; Laresgoiti-Servitje, E. Oxidative stress biomarkers and their relationship with cytokine concentrations in overweight/obese pregnant women and their neonates. BMC Immunol. 2017, 18, 1–11. [Google Scholar] [CrossRef] [Green Version]
- Moreli, J.B.; Corrêa-Silva, S.; Damasceno, D.C.; Sinzato, Y.K.; Lorenzon-Ojea, A.R.; Borbely, A.U.; Rudge, M.V.; Bevilacqua, E.; Calderon, I.M. Changes in the TNF-alpha/IL-10 ratio in hyperglycemia-associated pregnancies. Diabetes Res. Clin. Pract. 2015, 107, 362–369. [Google Scholar] [CrossRef]
- Melekoglu, R.; Ciftci, O.; Celik, E.; Yilmaz, E.; Bastemur, A.G. Evaluation of second trimester amniotic fluid ADAMTS4, ADAMTS5, interleukin-6 and tumor necrosis factor-α levels in patients with gestational diabetes mellitus. J. Obstet. Gynaecol. Res. 2019, 45, 824–829. [Google Scholar] [CrossRef]
- Hutter, S.; Knabl, J.; Andergassen, U.; Mayr, D.; Hofmann, S.; Kühn, C.; Mahner, S.; Arck, P.C.; Jeschke, U. Fetal gender specific expression of tandem-repeat galectins in placental tissue from normally progressed human pregnancies and intrauterine growth restriction (IUGR). Placenta 2015, 36, 1352–1361. [Google Scholar] [CrossRef]
- Burns, C.; Hall, S.T.; Smith, R.; Blackwell, C. Cytokine Levels in Late Pregnancy: Are Female Infants Better Protected against Inflammation? Front. Immunol. 2015, 6, 318. [Google Scholar] [CrossRef] [Green Version]
- Barke, T.L.; Money, K.M.; Du, L.; Serezani, A.; Gannon, M.; Mirnics, K.; Aronoff, D.M. Sex modifies placental gene expression in response to metabolic and inflammatory stress. Placenta 2019, 78, 1–9. [Google Scholar] [CrossRef]
- Rosenfeld, C.S. Sex-Specific Placental Responses in Fetal Development. Endocrinology 2015, 156, 3422–3434. [Google Scholar] [CrossRef] [Green Version]
- Mandò, C.; Calabrese, S.; Mazzocco, M.I.; Novielli, C.; Anelli, G.M.; Antonazzo, P.; Cetin, I. Sex specific adaptations in placental biometry of overweight and obese women. Placenta 2016, 38, 1–7. [Google Scholar] [CrossRef]
- Strutz, J.; Cvitic, S.; Hackl, H.; Kashofer, K.; Appel, H.M.; Thüringer, A.; Desoye, G.; Koolwijk, P.; Hiden, U. Gestational diabetes alters microRNA signatures in human feto-placental endothelial cells depending on fetal sex. Clin. Sci. 2018, 132, 2437–2449. [Google Scholar] [CrossRef]
- Akdis, M.; Burgler, S.; Crameri, R.; Eiwegger, T.; Fujita, H.; Gomez, E.; Klunker, S.; Meyer, N.; O’Mahony, L.; Palomares, O.; et al. Interleukins, from 1 to 37, and interferon-γ: Receptors, functions, and roles in diseases. J. Allergy Clin. Immunol. 2011, 127, 701–721. [Google Scholar] [CrossRef]
- Kuzmicki, M.; Telejko, B.; Zonenberg, A.; Szamatowicz, J.; Kretowski, A.; Nikołajuk, A.; Laudanski, P.; Górska, M. Circulating Pro- and Anti-inflammatory Cytokines in Polish Women with Gestational Diabetes. Horm. Metab. Res. 2008, 40, 556–560. [Google Scholar] [CrossRef]
- Scott, N.M.; Hodyl, N.A.; Murphy, V.E.; Osei-Kumah, A.; Wyper, H.; Hodgson, D.M.; Smith, R.; Clifton, V.L. Placental Cytokine Expression Covaries with Maternal Asthma Severity and Fetal Sex. J. Immunol. 2009, 182, 1411–1420. [Google Scholar] [CrossRef] [PubMed] [Green Version]
- Scott-Coombes, D.; Whawell, S.; Vipond, M.N.; Thompson, J. Human intraperitoneal fibrinolytic response to elective surgery. BJS 1995, 82, 414–417. [Google Scholar] [CrossRef] [PubMed]
- Moffett-King, A. Natural killer cells and pregnancy. Nat. Rev. Immunol. 2002, 2, 656–663. [Google Scholar] [CrossRef] [PubMed]
- Budagian, V.; Bulanova, E.; Paus, R.; Bulfone-Paus, S. IL-15/IL-15 receptor biology: A guided tour through an expanding universe. Cytokine Growth Factor Rev. 2006, 17, 259–280. [Google Scholar] [CrossRef]
- Zhang, S.; Lin, H.; Kong, S.; Wang, S.; Wang, H.; Wang, H.; Armant, D.R. Physiological and molecular determinants of embryo implantation. Mol. Asp. Med. 2013, 34, 939–980. [Google Scholar] [CrossRef] [Green Version]
- Barber, E.M.; Pollard, J.W. The Uterine NK Cell Population Requires IL-15 but These Cells Are Not Required for Pregnancy nor the Resolution of a Listeria monocytogenes Infection. J. Immunol. 2003, 171, 37–46. [Google Scholar] [CrossRef] [Green Version]
- Laskarin, G.; Strbo, N.; Crncic, T.B.; Juretic, K.; Bataille, N.L.; Chaouat, G.C.; Rukavina, D. Physiological Role of IL-15 and IL-18 at the Maternal-Fetal Interface. In Immunology of Pregnancy; Karger Publishers: Basel, Switzerland, 2005; pp. 10–25. [Google Scholar]
- Fehniger, T.A.; Shah, M.H.; Turner, M.J.; VanDeusen, J.B.; Whitman, S.P.; Cooper, M.A.; Suzuki, K.; Wechser, M.; Goodsaid, F.; Caligiuri, M.A. Differential cytokine and chemokine gene expression by human NK cells following activation with IL-18 or IL-15 in combination with IL-12: Implications for the innate immune response. J. Immunol. 1999, 162, 4511–4520. [Google Scholar]
- Remmele, W. Vorschlag zur einheitlichen Definition eines Immunreaktiven Score (IRS) fur den immun-histochemischen Ostrogenrezeptor-Nachweis (ER-IRA) im Mammakarzinomgewebe. Pathologe 1987, 8, 138–140. [Google Scholar]
- R Core Team. R: A Language and Environment for Statistical Computing. Available online: https://www.r-project.org/ (accessed on 13 February 2012).
- Konietschke, F.; Placzek, M.; Schaarschmidt, F.; Hothorn, L.A. Nparcomp: An R software package for nonparametric multiple comparisons and simultaneous confidence intervals. J. Stat. Softw. 2015, 64, 1–17. [Google Scholar] [CrossRef] [Green Version]
- Koenker, R. Quantreg: Quantile Regression. R Package Version 5.73. 2020. Available online: https://CRAN.R-project.org/package=quantreg (accessed on 2 October 2020).


| GDM Entire | Control Entire | GDM Male | GDM Female | Control Male | Control Female | ||
|---|---|---|---|---|---|---|---|
| IL-7 | EVT | 8.0 (3.5) | 6.0 (4.5) | 7.0 (3.75) | 8.0 (6.5) | 4.0 (4.0) | 6.0 (5.0) |
| SCT | 9.0 (6.0) | 8.0 (9.0) | 10.5 (5.5) | 8.5 (5.5) | 4.0 (9.0) | 8.0 (4.75) | |
| IL-8 | EVT | 1.0 (1.25) | 2.0 (1.5) | 1.0 (2.0) | 1.0 (1.0) | 3.0 (1.0) | 2.0 (2.0) |
| SCT | 1.0 (2.0) | 1.0 (2.5) | 0.0 (1.75) | 2.0 (3.75) | 2.0 (3.0) | 1.0 (1.0) | |
| IL-15 | EVT | 6.0 (6.25) | 2.0 (3.5) | 6.0 (5.75) | 3.0 (6.0) | 2.0 (3.0) | 2.0 (2.75) |
| SCT | 4.5 (7.0) | 2.0 (5.0) | 6.0 (6.0) | 2.5 (8.0) | 2.0 (2.0) | 6.0 (4.0) |
| Outcome Variable | Input Variable in Model of Median Regression | p-Values in F-Statistics When Comparing Model with Previous Model Using ANOVA | Coefficients | Estimate | Std. Error | p-Values |
|---|---|---|---|---|---|---|
| IL7 EVT | GDM | p < 0.001 *** | GDM pos. | 1.00000 | 0.64017 | 0.122 |
| GDM+BMI | p < 0.001 *** | GDM pos. | 1.32075 | 0.58290 | 0.026 * | |
| BMI | −0.12579 | 0.06127 | 0.043 * | |||
| GDM + BMI + GDM:BMI | 0.067 | GDM pos. | −1.60090 | 1.93476 | 0.410 | |
| BMI | −0.11211 | 0.06038 | 0.067 | |||
| GDM pos.:BMI | 0.11211 | 0.06038 | 0.067 | |||
| IL7 SCT | GDM | 0.010 * | GDM pos. | 0.50000 | 0.87660 | 0.570 |
| GDM+BMI | 0.071. | GDM pos. | 1.95906 | 0.90459 | 0.0336 * | |
| BMI | −0.29240 | 0.14451 | 0.046 * | |||
| GDM + BMI + GDM:BMI | 0.023 * | GDM pos. | −4.23119 | 2.69147 | 0.120 | |
| BMI | −0.09976 | 0.09253 | 0.284 | |||
| GDM pos.:BMI | 0.21470 | 0.09253 | 0.023 * | |||
| IL8 EVT | GDM | p < 0.001 *** | GDM pos. | −0.50000 | 0.20080 | 0.015 * |
| GDM+BMI | 0.594 | GDM pos. | −0.50000 | 0.22848 | 0.032 * | |
| BMI | 0.00000 | 0.03716 | 1.000 | |||
| GDM + BMI + GDM:BMI | 0.330 | GMD pos. | −1.59677 | 0.95722 | 0.099 | |
| BMI | −0.04608 | 0.04581 | 0.318 | |||
| GDM pos.:BMI | 0.04608 | 0.04581 | 0.318 | |||
| IL8 SCT | GDM | 0.027 * | GDM pos. | 0.00000 | 0.32031 | 1.000 |
| GDM+BMI | 0.054. | GDM pos. | 0.46714 | 0.28318 | 0.103 | |
| BMI | −0.04695 | 0.02689 | 0.085 | |||
| GDM + BMI + GDM:BMI | 0.434 | GDM pos. | 0.91727 | 0.84417 | 0.280 | |
| BMI | −0.05591 | 0.02278 | 0.016 * | |||
| GDM pos.:BMI | −0.01789 | 0.02278 | 0.434 | |||
| IL15 EVT | GDM | 0.015 * | GDM pos. | 2.00000 | 0.64008 | 0.002 |
| GDM+BMI | 0.122 | GDM pos. | 2.00000 | 0.70699 | 0.006 | |
| BMI | 0.00000 | 0.08691 | 1.000 | |||
| GDM + BMI + GDM:BMI | 0.043 * | GDM pos. | 5.62674 | 2.24393 | 0.014 * | |
| BMI | 0.05811 | 0.07962 | 0.468 | |||
| GDM pos.:BMI | −0.16411 | 0.07962 | 0.043 * | |||
| IL15 SCT | GDM | 0.144 | GDM pos. | 2.00000 | 0.76082 | 0.010 * |
| GDM+BMI | 0.262 | GDM pos. | 2.00000 | 0.77757 | 0.012 * | |
| BMI | 0.00000 | 0.10292 | 1.000 | |||
| GDM + BMI + GDM:BMI | 0.107 | GDM pos. | 5.69877 | 2.88469 | 0.052 | |
| BMI | −0.00362 | 0.09952 | 0.971 | |||
| GDM pos.:BMI | −0.16235 | 0.09952 | 0.107 |
| GDM | Control Group | p-Value | |
|---|---|---|---|
| Maternal age (years) | 32.83 ± 4.56 | 31.15 ± 6.10 | 0.165 |
| Body mass index (BMI) | 28.13 ± 6.96 | 23.35 ± 6.21 | 0.002 |
| Gestational age (weeks) | 39.85 ± 1.29 | 39.78 ± 1.35 | 0.800 |
| Birth weight (g) | 3611.38 ± 0.08 | 3316.88 ± 501.73 | 0.013 |
| pH umbilical artery | 7.30 ± 0.08 | 7.29 ± 0.09 | 0.587 |
| Vaginal birth (%) | 67.5 | 79.5 | 0.171 |
| Contractions (%) | 85 | 82.5 | 0.727 |
| Antibody | Isotype | Clone | Dilution | Source |
|---|---|---|---|---|
| Goat-Anti-Mouse Cy3 | Goat IgG | Polyclonal | 1:500 | Dianova, Hamburg Germany |
| HLA-G (FITC marked) | Mouse IgG | Monoclonal | 1:100 | Bio-Rad Laboratories, Hercules, USA |
| IL-15 | Mouse IgG | Monoclonal | 1:1000 | Abcam, Cambridge, UK |
| IL-8 | Mouse IgG | Monoclonal | 1:250 | Abcam, Cambridge, UK |
| Il-7 | Mouse IgG | Monoclonal | 1:100 | R&D Systems, Minneapolis, USA |
Publisher’s Note: MDPI stays neutral with regard to jurisdictional claims in published maps and institutional affiliations. |
© 2020 by the authors. Licensee MDPI, Basel, Switzerland. This article is an open access article distributed under the terms and conditions of the Creative Commons Attribution (CC BY) license (http://creativecommons.org/licenses/by/4.0/).
Share and Cite
Keckstein, S.; Pritz, S.; Amann, N.; Meister, S.; Beyer, S.; Jegen, M.; Kuhn, C.; Hutter, S.; Knabl, J.; Mahner, S.; et al. Sex Specific Expression of Interleukin 7, 8 and 15 in Placentas of Women with Gestational Diabetes. Int. J. Mol. Sci. 2020, 21, 8026. https://0-doi-org.brum.beds.ac.uk/10.3390/ijms21218026
Keckstein S, Pritz S, Amann N, Meister S, Beyer S, Jegen M, Kuhn C, Hutter S, Knabl J, Mahner S, et al. Sex Specific Expression of Interleukin 7, 8 and 15 in Placentas of Women with Gestational Diabetes. International Journal of Molecular Sciences. 2020; 21(21):8026. https://0-doi-org.brum.beds.ac.uk/10.3390/ijms21218026
Chicago/Turabian StyleKeckstein, Simon, Sophia Pritz, Niklas Amann, Sarah Meister, Susanne Beyer, Magdalena Jegen, Christina Kuhn, Stefan Hutter, Julia Knabl, Sven Mahner, and et al. 2020. "Sex Specific Expression of Interleukin 7, 8 and 15 in Placentas of Women with Gestational Diabetes" International Journal of Molecular Sciences 21, no. 21: 8026. https://0-doi-org.brum.beds.ac.uk/10.3390/ijms21218026