Are Advanced Glycation End Products in Skin Associated with Vascular Dysfunction Markers? A Meta-Analysis

 , , ,
, , , 
Abstract
:1. Introduction
2. Materials and Methods
2.1. Search Strategy
2.2. Study Selection
2.3. Search and Data Extraction
2.4. Quality Assessment and Potential Bias
2.5. Statistical Analysis
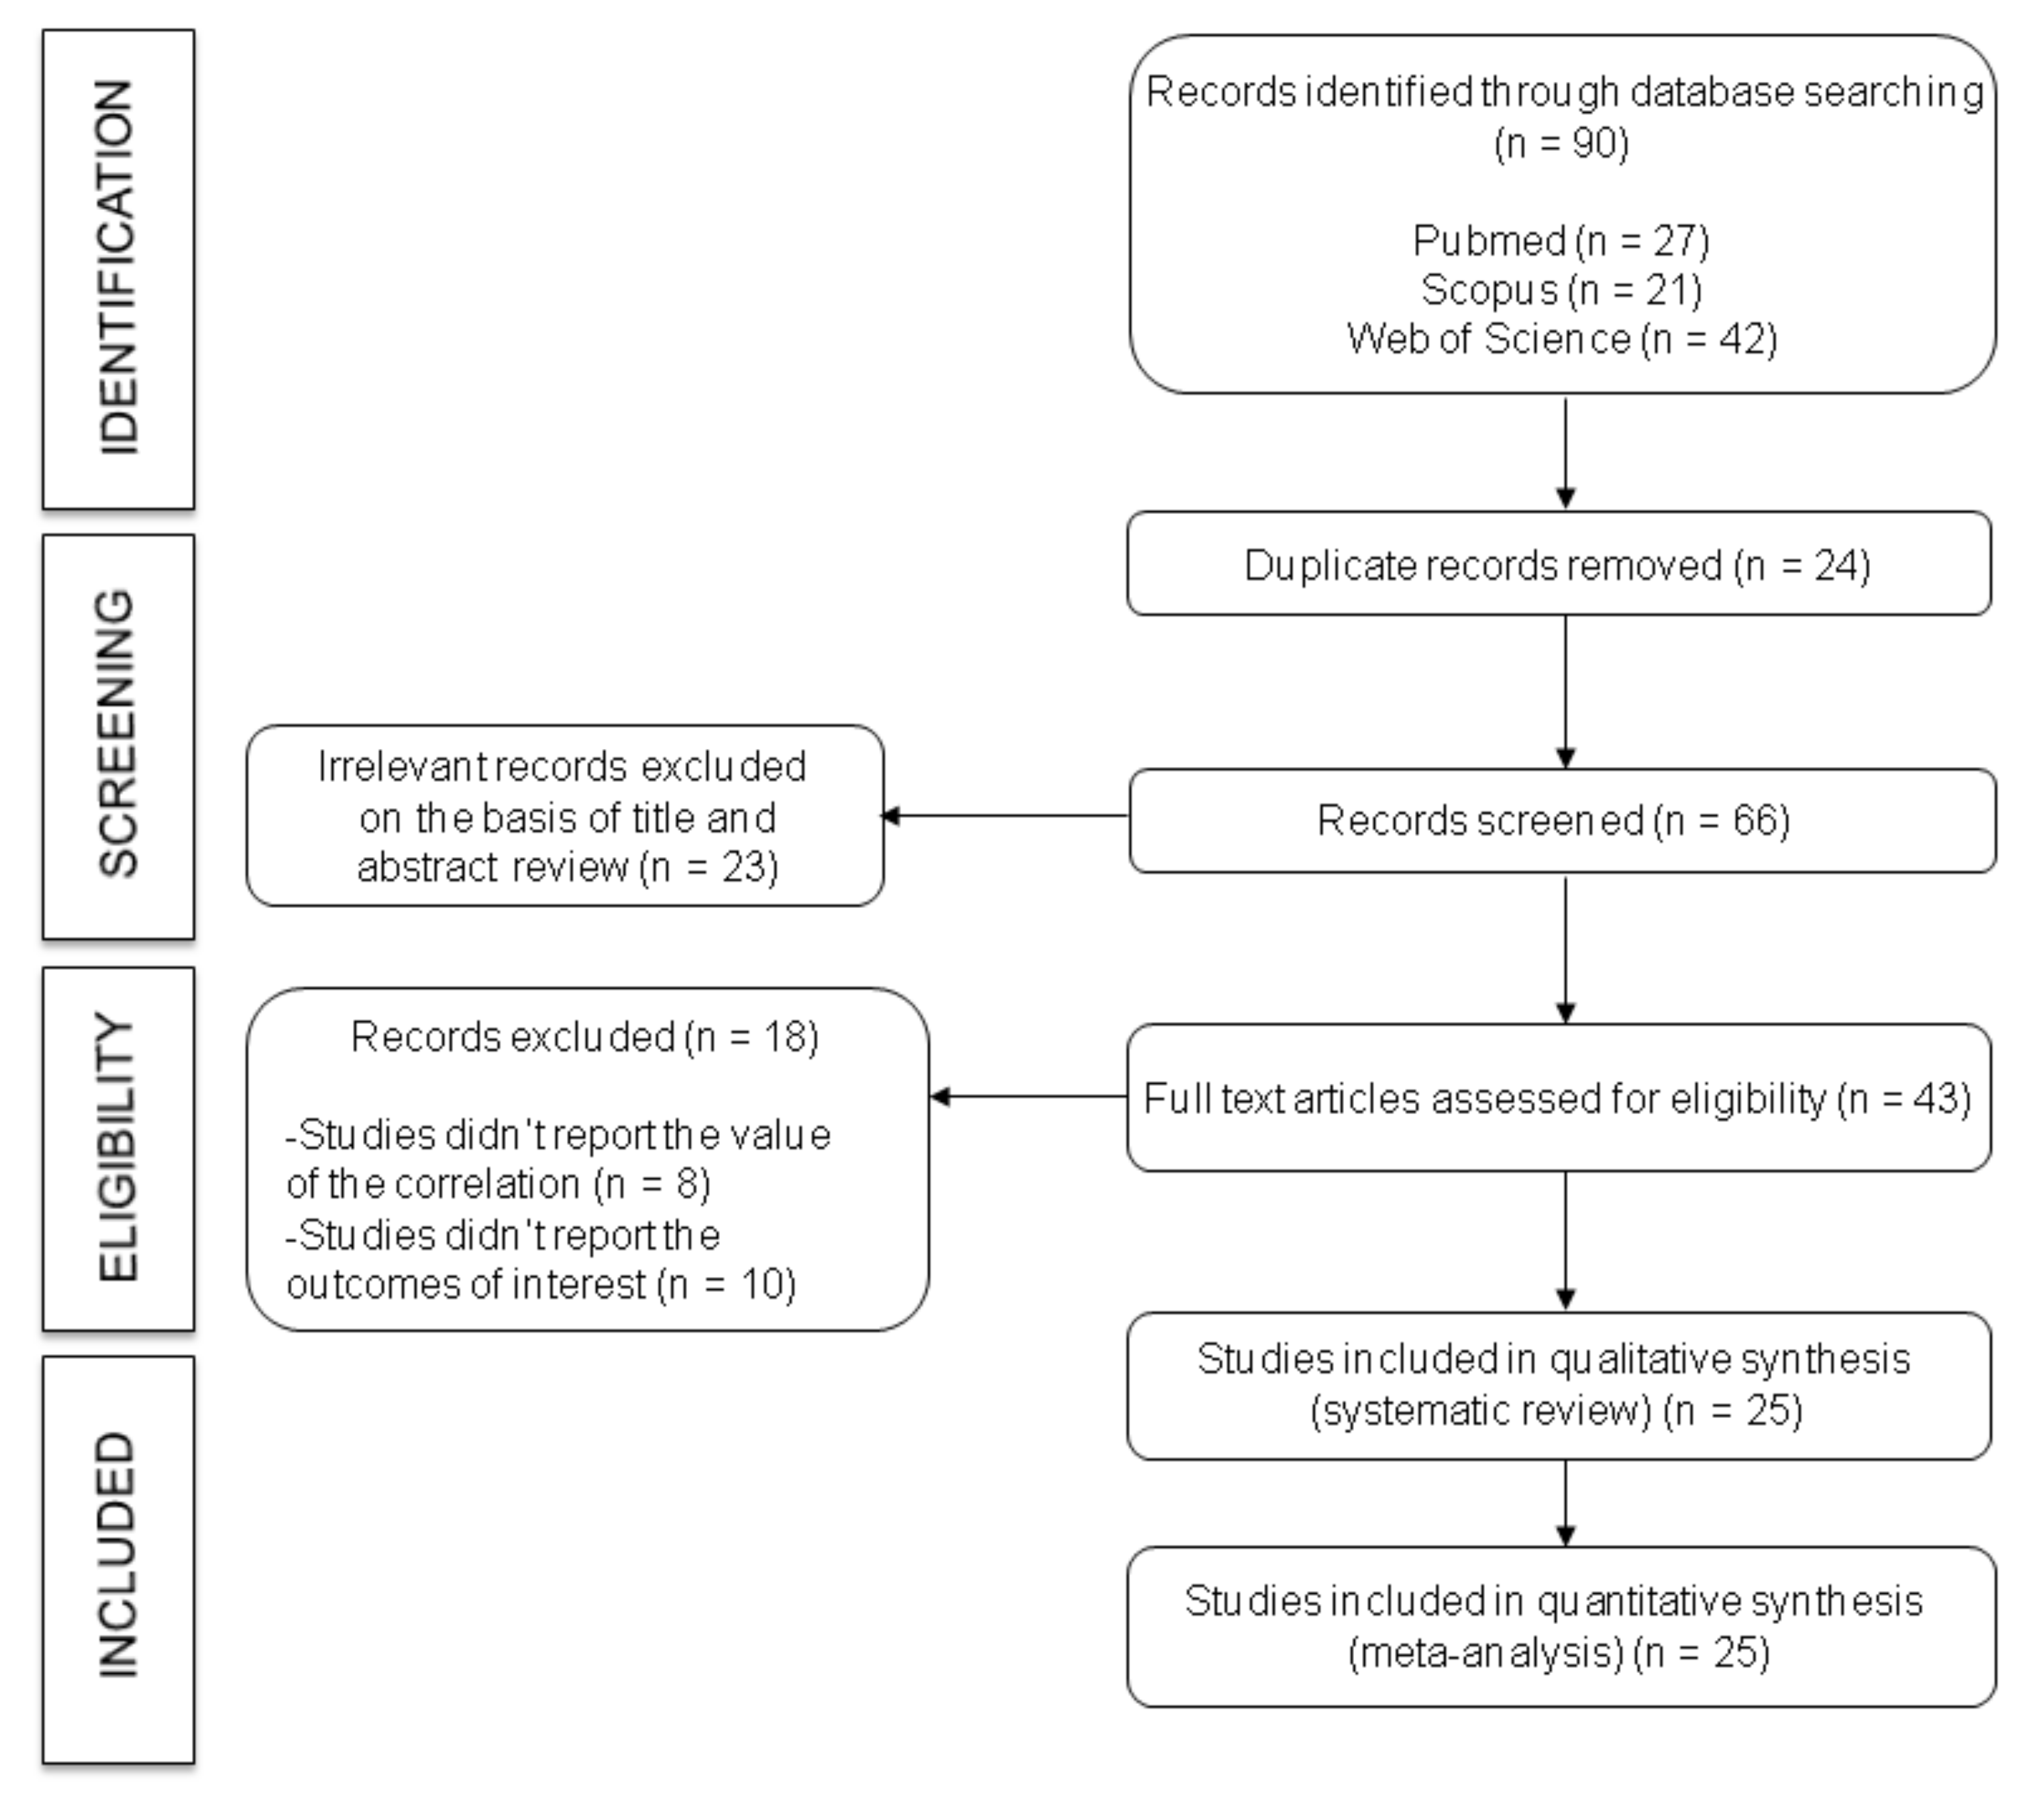
3. Results
3.1. Systematic Review

| Study (Year) | Country | Study Design | Population Characteristics | Outcome | Skin Autofluorescence | ||||||
|---|---|---|---|---|---|---|---|---|---|---|---|
| Sample Size (n) | Age (Years) | Type of Population | BMI (kg /m2) | Type | Measuring Device | Mean (mm) | Measuring Device | Mean (AU) | |||
| Araszkiewicz et al., 2015 [42] | Poland | Prospective longitudinal | UHS: 77 | UHS: 23 (20–28) | DM type 1 | UHS: 23 (21–25) | C-IMT | Acuson Cv 70 | UHS: 0.57 (0.52–0.67) | AGE Reader | UHS: 2.2 (1.9–2.6) |
| Hollander et al., 2007 [34] | The Netherlands | Cross-sectional | UHS: 8 HS: 30 | UHS: 27 (20–34) HS: 25 (21–32) | Glycogen storage disease type Ia | UHS: 24 (22–28) HS: 23 (21–26) | C-IMT | Acuson 128 XP | UHS: 0.53 (0.48–0.59) HS: 0.6 (0.58–0.62) | AGE Reader | UHS: 1.67 (1.57–1.76) HS: 1.55 (1.30–1.76) |
| Blaauw et al., 2006 [32] | The Netherlands | Cross-sectional | UHS: 26 HS: 17 | UHS: 30.0 ± 4.0 HS: 32.0 ± 3.0 | Preeclampsia | UHS: 25.0 ± 5.0 HS: 23.0 ± 3.0 | C-IMT | Acuson 128 XP | UHS: 0.64 ± 0.07 HS: 0.63 ± 0.09 | USB2000 | NA |
| Llaurado et al., 2014 [16] | Spain | Cross-sectional | UHS: 68 HS: 68 | UHS: 35.3 ± 10.1 HS: 35.4 ± 10.2 | DM type 1 | UHS: 25.7 ± 3.6 HS: 24.0 ± 3.1 | a-PWV | Millar tonometer: SPC-301 | UHS: 6.8 (6.0–7.9) HS: 6.1 (5.5–6.7) | AGE Reader | UHS: 2.1 (1.8–2.3) HS: 1.7 1.6–2.1) |
| Osawa et al., 2017 [21] | Japan | Cross-sectional | UHS: 105 HS: 23 | UHS: 37.4 ± 12.4 HS: 34.7 ± 6.2 | DM type 1 | UHS: 23. 0 ± 3.0 HS: 20.6 ± 2.6 | ba-PWV | BP203RPE | UHS: 13.18 ± 2.48 HS: 12.25 ± 1.56 | AGE Reader | UHS: 2.07 ± 0.50 HS: 1.90 ± 0.26 |
| C-IMT | NA | UHS: 1.09 ± 0.48 HS: 0.76 ± 0.21 | |||||||||
| De Leeuw et al., 2007 [33] | The Netherlands | Cross-sectional | UHS: 55 HS: 55 | UHS: 43.0 ± 12. HS: 43.0 ± 13.0 | Systemic lupus erythematosus | UHS: 24.3 ± 4.0 HS: 24.7 ± 4.0 | C-IMT | NA | UHS: 0.67 ± 0.16 HS: 0.69 ± 0.15 | AGE Reader | UHS: 1.50 ± 0.5 HS: 1.28 ± 0.4 |
| De Groot et al., 2015 [44] | The Netherlands | Prospective longitudinal | UHS: 58 HS: 58 | UHS: 18–80 HS: 18–80 | Rheumatoid arthritis | NA | C-IMT | NA | UHS: 0.73 (0.45–1.64) HS: 0.72 (0.39–1.46) | AGE Reader | UHS: 2.55 (1.29–4.65) HS: 2.12 (1.32–3.82) |
| De Leeuw et al., 2010 [36] | The Netherlands | Cross-sectional | UHS: 24 HS: 21 | UHS: 51.0 ± 11.0 HS: 56.0 ± 14.0 | Systemic autoimmune Disease (Wegener’s granulomatosis) | UHS: 25.0 ± 3.0 HS: 26.0 ± 5.0 | C-IMT | NA | UHS: 0.72 (0.62–0.81) HS: 0.67 (0.59–0.79) | NA | UHS: 1.5 ± 0.5 HS: 1.3 ± 0.3 |
| Den Dekker et al., 2013 [39] | The Netherlands | Cross-sectional | UHS1: 67 UHS2: 60 HS: 96 | UHS1: 51.8 ± 7.8 UHS2: 63.5 ± 7.6 HS: 43.8 ± 9.5 | Atherosclerosis | UHS1: 26.6 (23.8–29.8) UHS2: 26.3 (24.2–29.5) HS: 25.0 (23.1–27.7) | C-IMT | Acuson 128 XP | UHS1: 0.83 (0.67–0.98) UHS2: NA HS: 0.65 (0.57–0.74) | AGE Reader | UHS1: 2.11 (1.83–2.46) UHS2: 2.71 (2.15–3.27) HS: 1.87 (1.68–2.12) |
| Dadoniene et al., 2015 [43] | Lithuania | Cross-sectional | UHS: 47 HS: 47 | UHS: 52.64 ± 11.2 HS: 52.57 ± 7.69 | Systemic sclerosis | UHS: 24.27 ± 4.63 HS: 26.09 ± 4.50 | cr-PWV | SphygmoCor | UHS: 7.53 ± 1.70 HS: 7.51 ± 1.30 | AGE Reader | UHS: 2.23 ± 0.54 HS: 1.90 ± 0.47 |
| Lutgers et al., 2010 [20] | The Netherlands | Cross-sectional | UHS: 59 | UHS: 55.0 ± 10.0 | Healthy Metabolic syndrome | UHS: 24.9 ± 2.5 | C-IMT | Acuson 128 XP | UHS: 0.8 ± 0.15 | NA | UHS: 1.57 ± 0.41 |
| Ueno et al., 2008 [17] | Japan | Cross-sectional | UHS: 120 HS: 110 | UHS: 58.1 ± 9.3 HS: 57.0 ± 10.5 | End-stage renal disease | NA | ba-PWV | BP203RPE | UHS: 17.92 ± 4.49 HS: 14.21 ± 2.26 | AGE Reader | UHS: 1.8 ± 0.7 HS: 1.3 ± 0.5 |
| Ninomiya et al., 2018 [13] | Japan | Cross-sectional | UHS: 140 | UHS: 59.3 ± 12.8 | DM type 1 and type 2 | UHS: 27.3 ± 5.5 | ba-PWV | BP203RPE | UHS: 16.98 ± 4.04 | AGE Reader | UHS: 2.5 ± 0.5 |
| C-IMT | NA | SS: 1.8 ± 0.8 | |||||||||
| Ueno et al., 2011 [38] | Japan | Cross-sectional | UHS: 212 | UHS: 59.9 ± 10.1 | End-stage renal disease | UHS: 21.4 ± 2.8 | NA | NA | NA | AGE Reader | UHS: 1.8 ± 0.7 |
| C-IMT | NA | UHS: 0.762 ± 0.163 | |||||||||
| Hangai et al., 2016 [45] | Japan | Cross-sectional | UHS: 122 | UHS: 61.0 ± 13.0 | DM type 2 | UHS: 26.4 ± 5.1 | ba-PWV | BP203RPE | UHS: 15.69 ± 3.11 | AGE Reader | UHS: 2.42 ± 0.417 |
| C-IMT | LOGIQ 500 | UHS: 1.64 ± 0.70 mm | |||||||||
| Osawa et al., 2018 [12] | Japan | Cross-sectional | UHS: 193 HS: 24 | UHS: 61.1 ± 12.3 HS: 40.3 ± 7.8 | DM type 2 | UHS: 27.7 ± 5.95 HS: 20.9 ± 2.9 | ba-PWV | BP203RPE | UHS: 17.19 ± 4.58 HS: 12.75 ± 1.38 | AGE Reader | UHS: 2.57 ± 0.47 HS: 1.91 ± 0.29 |
| C-IMT | NA | SS: 1.89 ± 0.78 HS: 0.92 ± 0.54 | |||||||||
| Yoshioka, 2018 [47] | Japan | Cross-sectional | UHS: 162 HS: 42 | UHS: 61.2 ± 11.2 HS: 53.8 ± 13.0 | DM type 2 | UHS: 24.9 ± 4.0 HS: 22.6 ± 4.0 | C-IMT | NA | UHS: 1.64 ± 0.73 HS: 1.10 ± 0.23 | AGE Reader | UHS: 2.53 ± 0.45 HS: 2.19 ± 0.34 |
| Tanaka et al., 2009 [35] | Japan | Cross-sectional | UHS: 128 HS: 19 | UHS: 65.1 ± 11.6 HS: 64.1 ± 12.4 | Chronic kidney disease (DM) | UHS: 22.1 ± 3.3 HS: 24.6 ± 3.2 | C-IMT | SSD- 5000 | UHS: 0.9 ± 0.4 HS: NA | AGE reader | UHS: 2.35 ± 0.68 HS: 1.30 ± 0.37 |
| Kimura et al., 2014 [41] | Japan | Prospective longitudinal | UHS: 86 | UHS: 65.1 ± 11.6 | DM, primary glomerulonephritis, Hypertension, and other diseases | UHS: 22.1 ± 3.3 | C-IMT | SSD- 5000 | UHS: 0.9 ± 0.4 | AGE reader | UHS: 2.35 ± 0.68 |
| Temma et al., 2015 [22] | Japan | Cross-sectional | UHS: 61 | UHS: 66.6 ± 9.2 | DM type 2 | UHS: 25.5 ± 4.6 | C-IMT | GM-72P00A | UHS: 1.64 ± 0.75 mm | AGE Reader | UHS: 2.50 ±0.50 |
| Hofmann et al., 2013 [18] | Germany | Cross-sectional | UHS: 52 | UHS: 68.7 ± 10.15 | Coronary heart disease | UHS: 27.8 ± 4.0 | a-PWV | Vicorder | NA | AGE Reader | NA |
| McIntyre et al., 2011 [37] | United Kingdom | Cross-sectional | UHS: 284 HS: 1423 | UHS: 73.5 ± 8.0 HS: 72.8 ± 9.0 | Chronic kidney disease stage 3 | NA | cf-PWV | Vicorder | UHS: 10.4 ± 2.0 HS: 9.8 ± 2.0 | AGE Reader | UHS: 3.0 ± 0.7 HS: 2.7 ± 0.6 |
| McIntyre et al., 2013 [40] | Switzerland | Cross-sectional | UHS: 1717 | UHS: 74 (67–79) | Chronic kidney disease | UHS: 28.4 (25.6–31.8) | a-PWV | Vicorder | UHS: 9.9 ± 2.0 | AGE Reader | UHS: 2.67 (2.30–3.07) |
| Igase et al., 2017 [46] | Japan | Cross-sectional | UHS: 18 HS: 208 | UHS: 76.5 ± 6.7 HS: 67.2 ± 9.9 | Mild cognitive impairment | UHS: 22.9 ± 2.1 HS: 22.8 ± 3.0 | ba-PWV | FORM/ABI | UHS: 17.7 ± 3.19 HS: 15.77 ± 2.77 | AGE Reader | UHS: 2.56 ± 0.55 HS: 2.10 ± 0.41 |
| Watfa et al., 2012 [15] | France | Cross-sectional | HS1: 55 HS2: 61 | HS1: 49.1 ± 10.4 HS2: 77.5 ± 8.4 | Healthy | HS1: 27.2 ± 5.5 HS2: 25.3 ± 4.5 | cf-PWV | Pulse pen device (DiaTecne srl) | HS1: 7.48 ± 1.92 HS2: 11.83 ± 4.17 | AGE Reader | HS1: 2.11 ± 0.45 HS2: 2.75 ± 0.6 |
3.2. Quality Assessment and Potential Bias
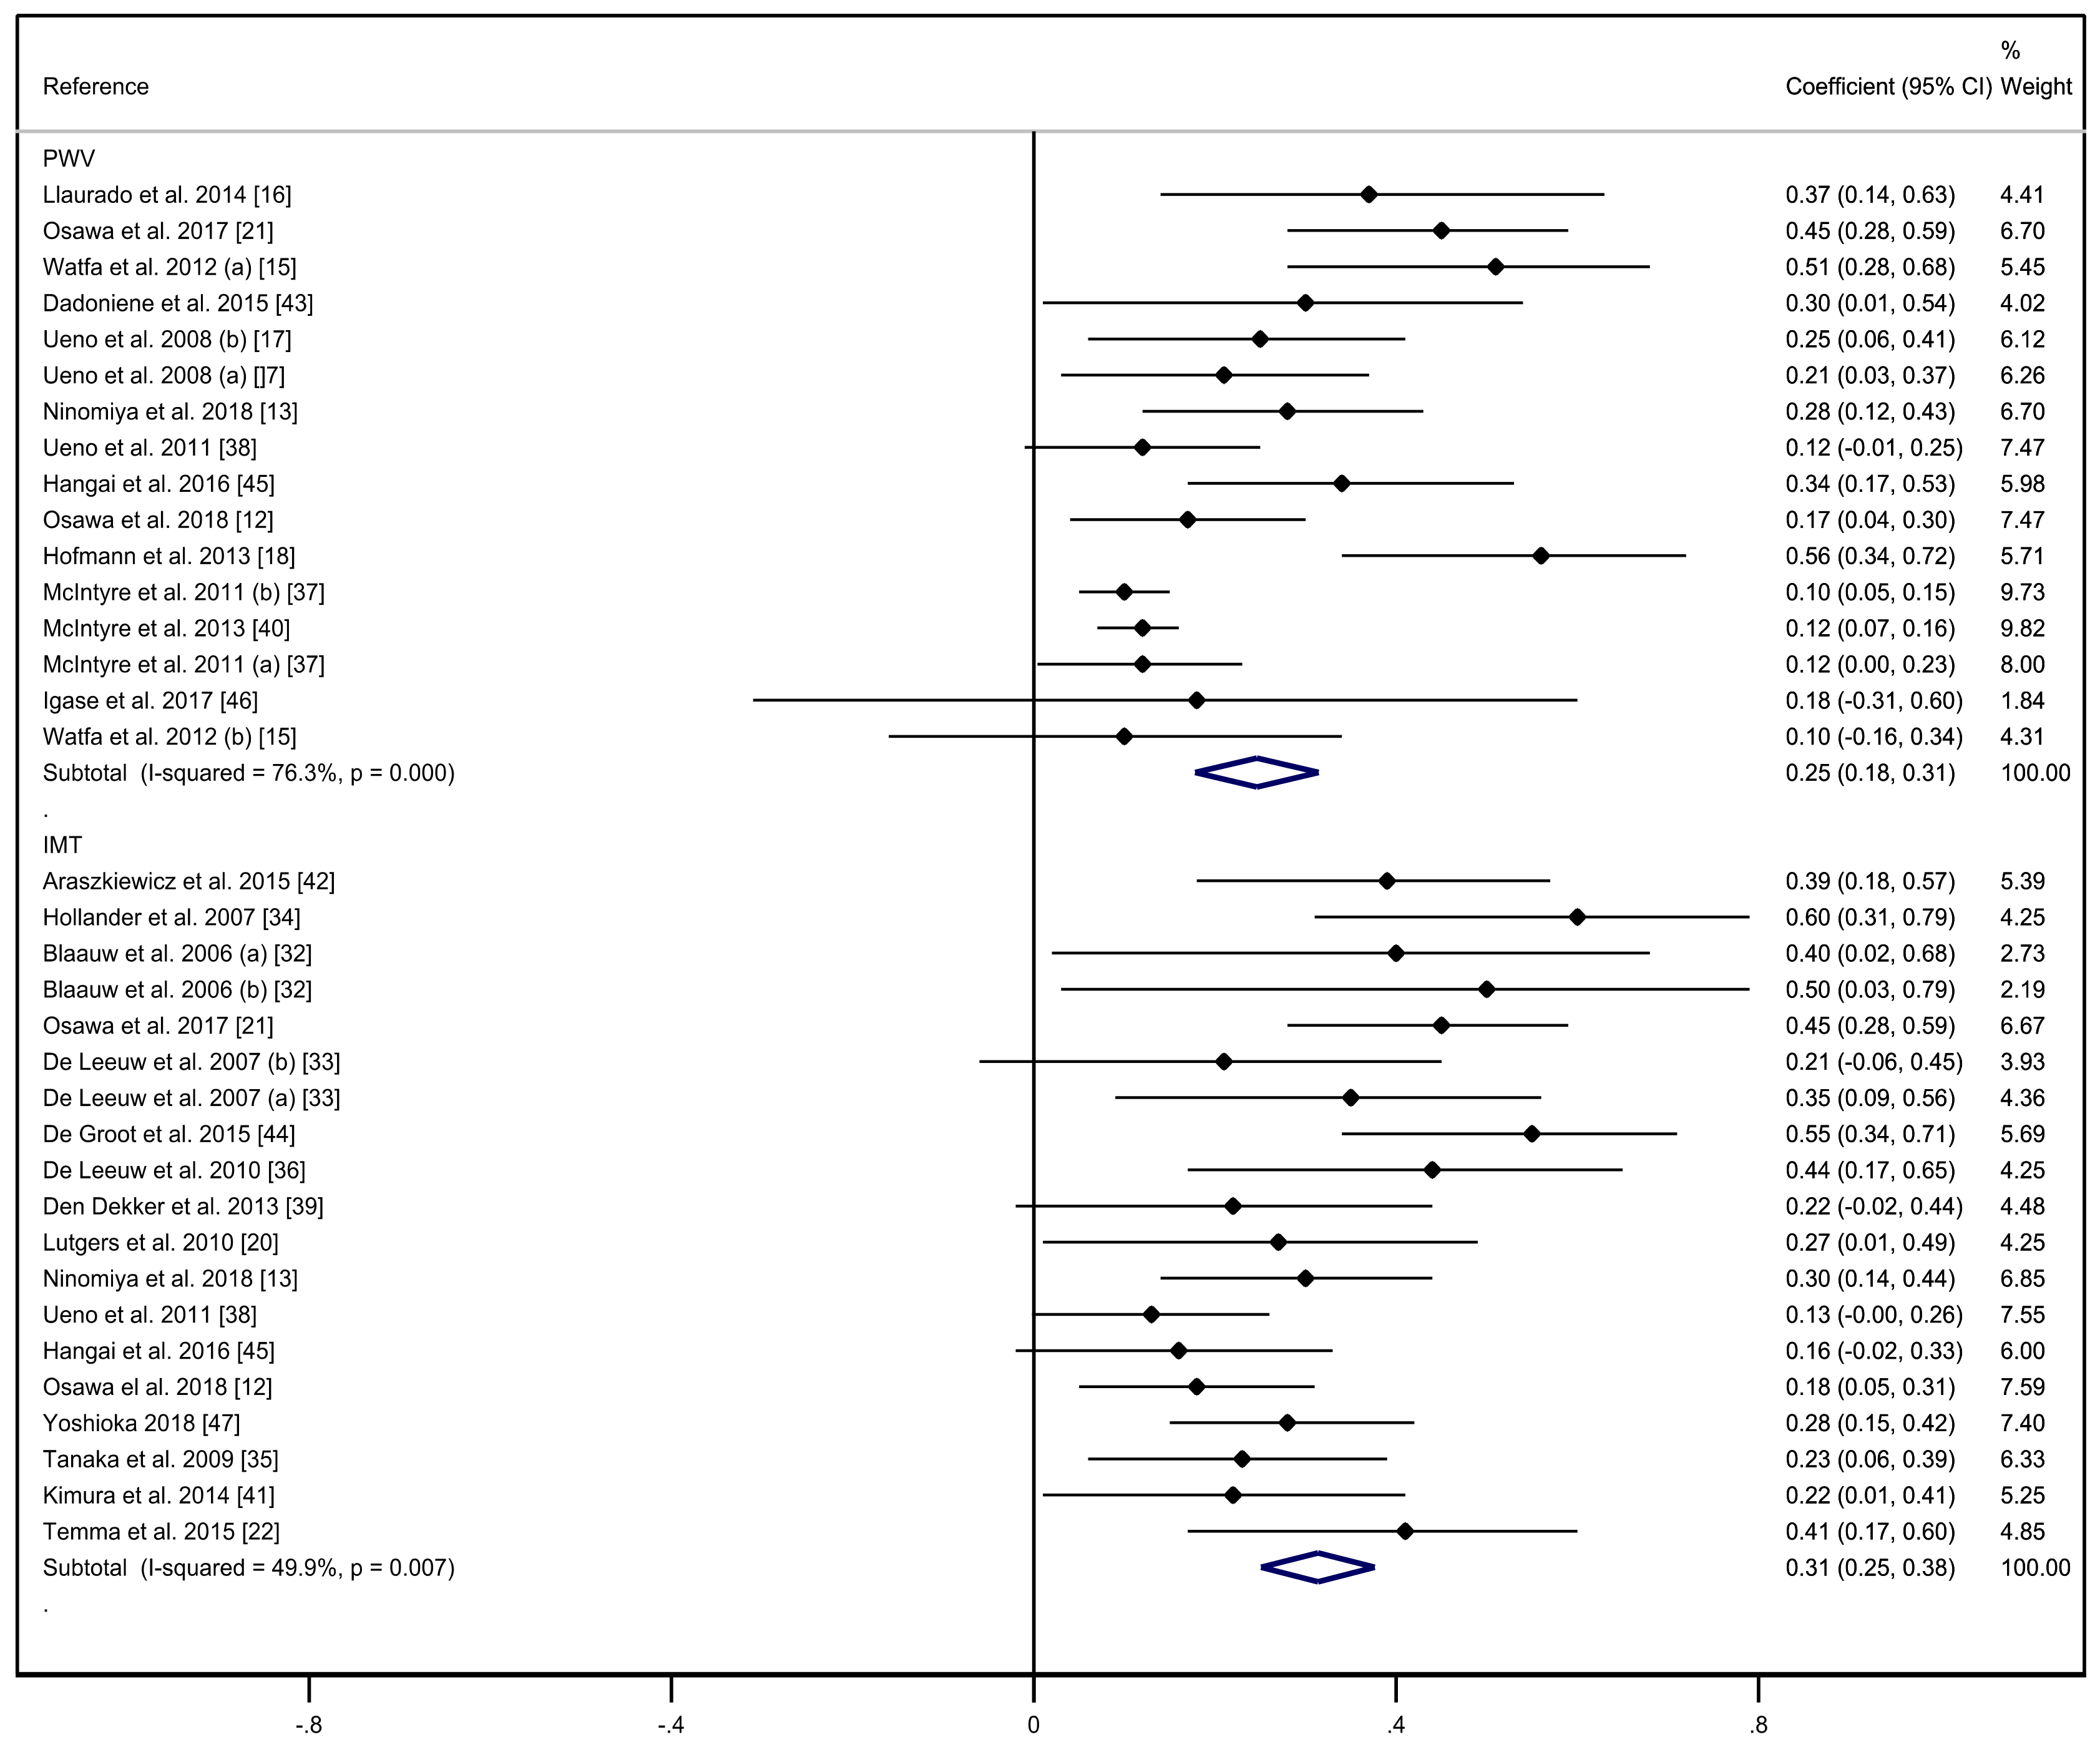
3.3. Meta-Analysis
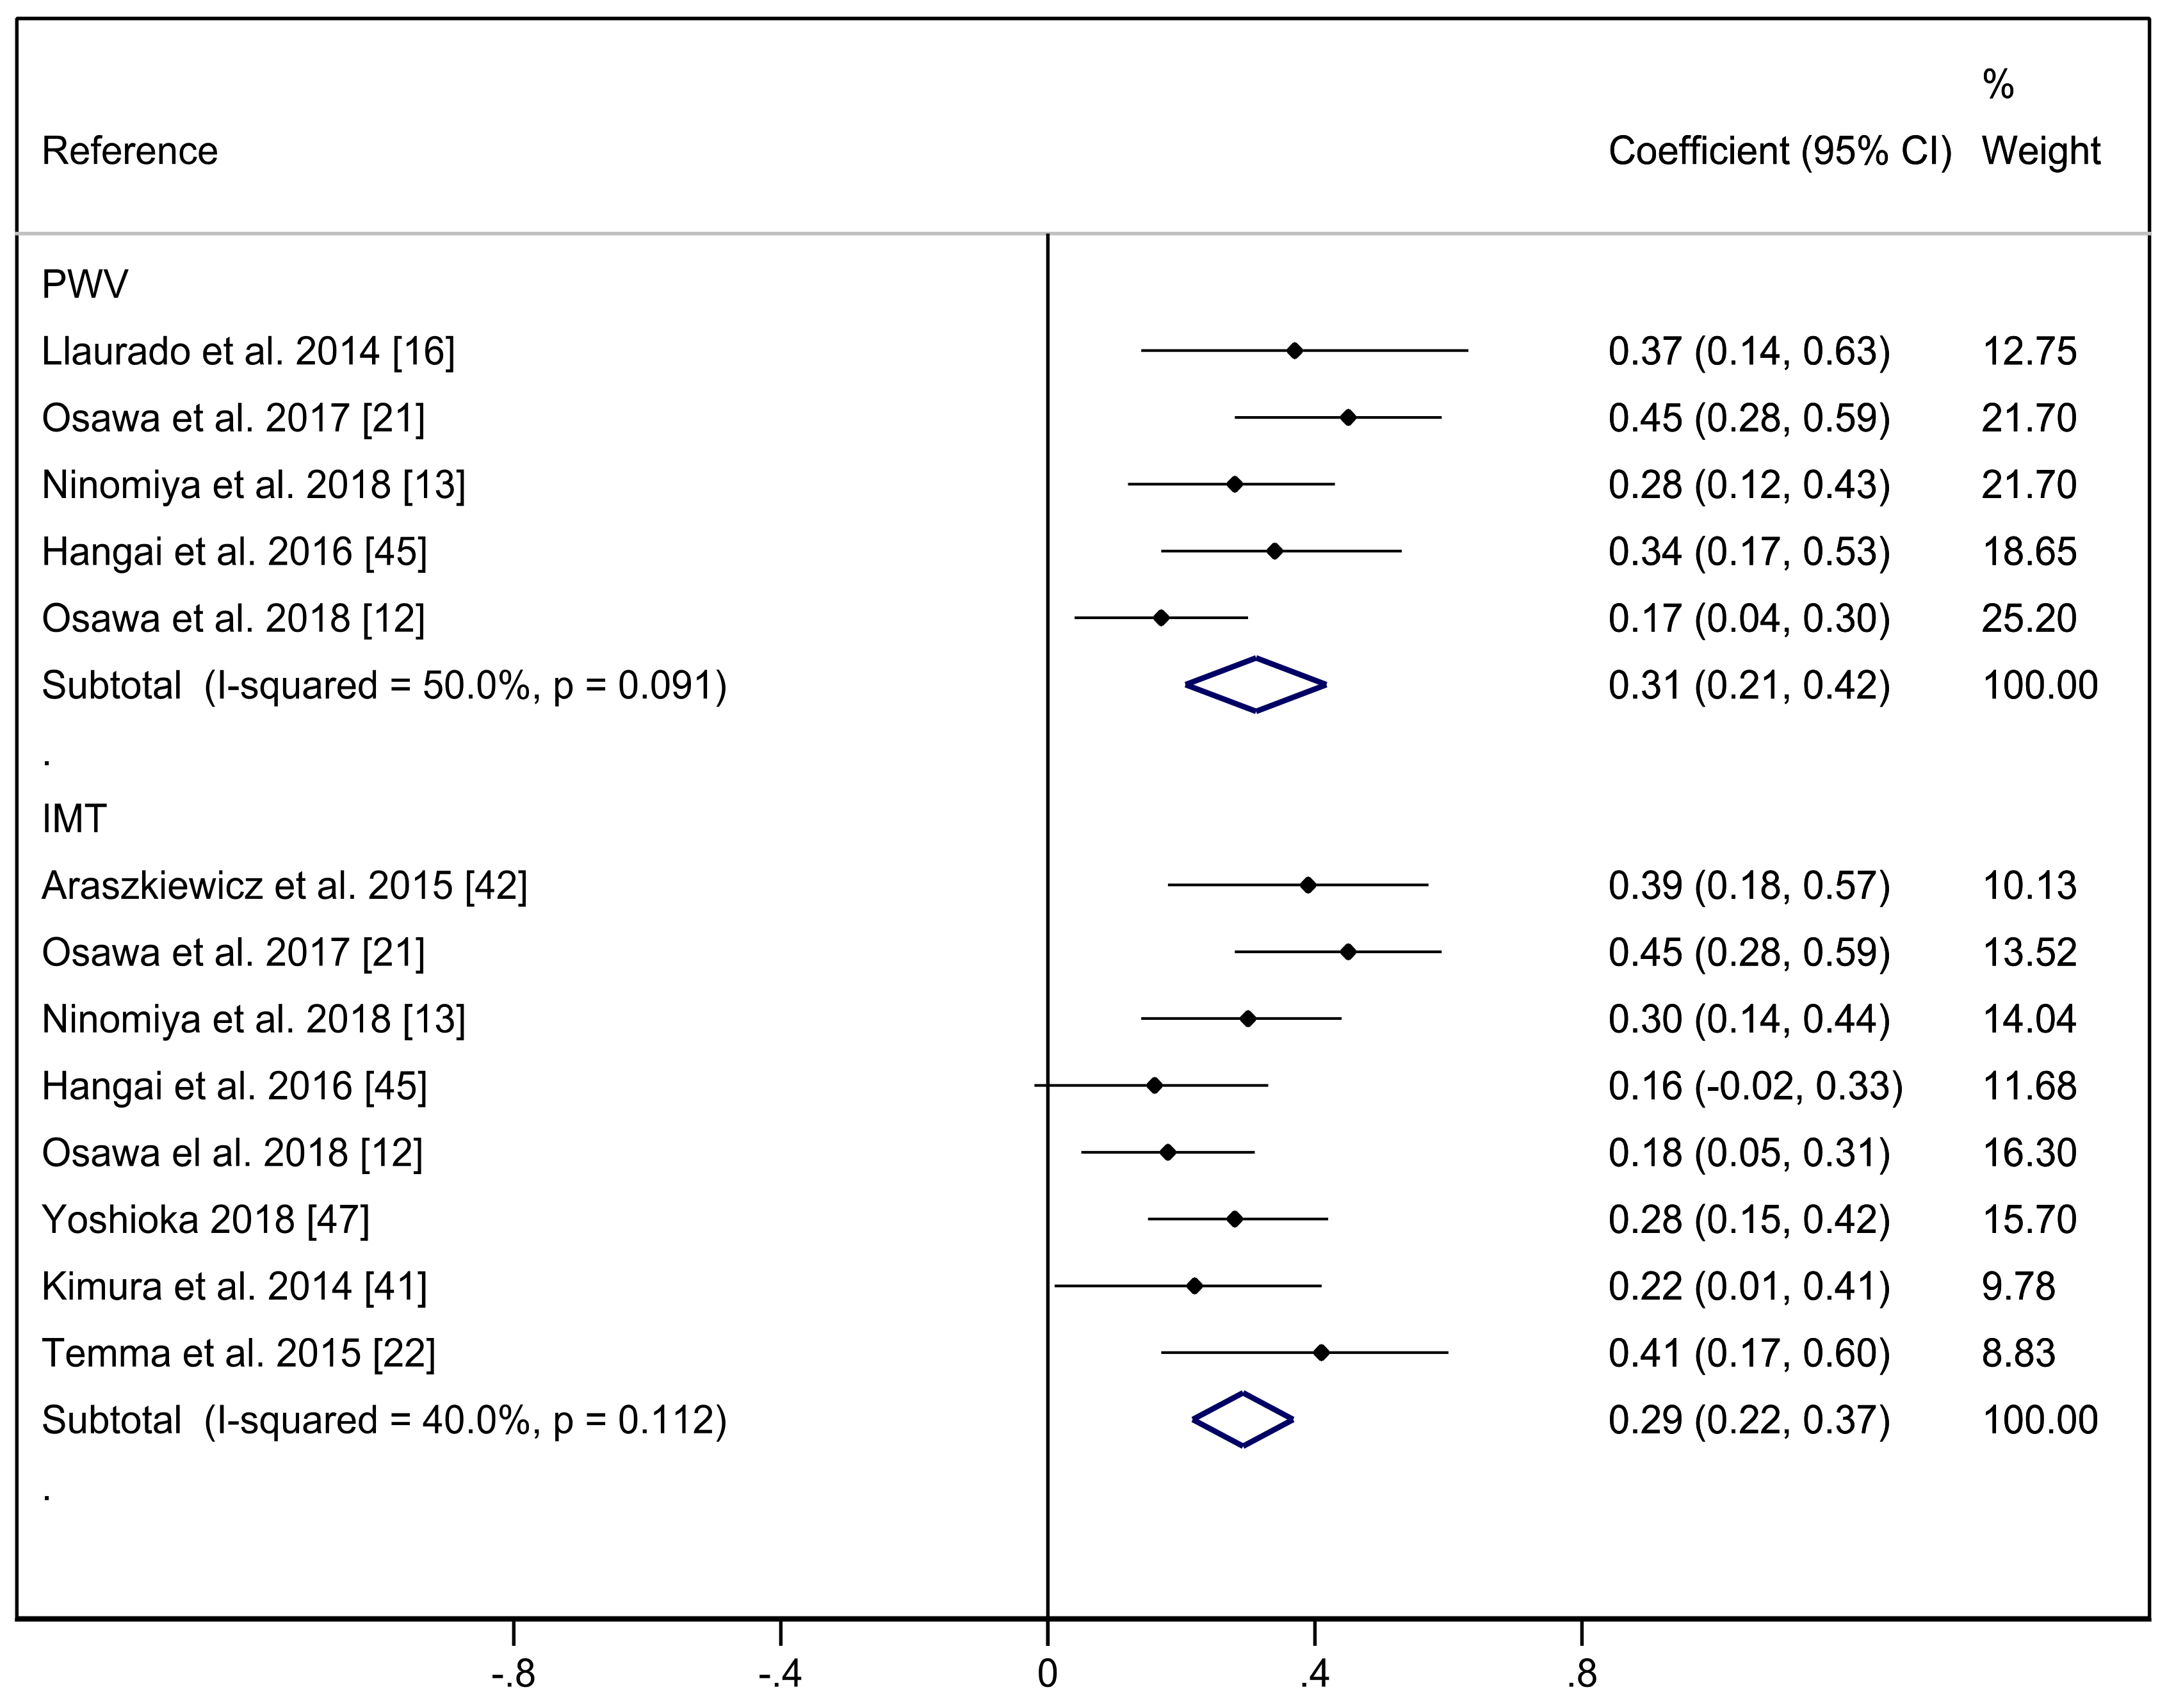
3.4. Sensitivity and Meta-Regression Analyses.
3.5. Publication Bias
4. Discussion
5. Conclusions
Supplementary Materials
Author Contributions
Funding
Conflicts of Interest
References
- Arsov, S.; Graaff, R.; van Oeveren, W.; Stegmayr, B.; Sikole, A.; Rakhorst, G.; Smit, A.J. Advanced glycation end-products and skin autofluorescence in end-stage renal disease: A review. Clin. Chem. Lab. Med. 2014, 52, 11–20. [Google Scholar] [CrossRef] [PubMed]
- Yamagishi, S.I.; Matsui, T.; Ueda, S.I.; Nakamura, K.; Imaizumi, T. Advanced Glycation End Products (AGEs) and Cardiovascular Disease (CVD) in Diabetes. Cardiovasc. Hematol. Agents Med. Chem. 2007, 5, 236–240. [Google Scholar] [CrossRef] [PubMed]
- Mulder, D.J.; van Haelst, P.L.; Graaff, R.; Gans, R.O.; Zijlstra, F.; Smit, A.J. Skin autofluorescence is elevated in acute myocardial infarction and is associated with the one-year incidence of major adverse cardiac events. Neth. Heart J. 2009, 17, 162–168. [Google Scholar] [CrossRef] [PubMed] [Green Version]
- Smit, A.J.; Gerrits, E.G. Skin autofluorescence as a measure of advanced glycation end product deposition: A novel risk marker in chronic kidney disease. Curr. Opin. Nephrol. Hypertens. 2010, 19, 527–533. [Google Scholar] [CrossRef]
- Oleniuc, M.; Schiller, A.; Secara, I.; Onofriescu, M.; Hogas, S.; Apetrii, M.; Siriopol, D.; Covic, A. Evaluation of advanced glycation end products accumulation, using skin autofluorescence, in CKD and dialysis patients. Int. Urol. Nephrol. 2012, 44, 1441–1449. [Google Scholar] [CrossRef]
- Prasad, A.; Bekker, P.; Tsimikas, S. Advanced Glycation End Products and Diabetic Cardiovascular Disease. Cardiol. Rev. 2012, 20, 177–183. [Google Scholar] [CrossRef]
- Prasad, K. AGE-RAGE stress: A changing landscape in pathology and treatment of Alzheimer’s disease. Mol. Cell Biochem. 2019, 459, 95–112. [Google Scholar] [CrossRef]
- Najjar, S.S.; Scuteri, A.; Lakatta, E.G. Arterial aging: Is it an immutable cardiovascular risk factor? J. Hypertens. 2005, 46, 454–462. [Google Scholar] [CrossRef] [Green Version]
- Bots, M.L.; Dijk, J.M.; Oren, A.; Grobbee, D.E. Carotid intima–media thickness, arterial stiffness and risk of cardiovascular disease: Current evidence. J. Hypertens. 2002, 20, 2317–2325. [Google Scholar] [CrossRef]
- Lee, J.G.; Joo, S.J. Arterial stiffness and cardiovascular risk. Korean J. Intern. Med. 2019, 34, 504–506. [Google Scholar] [CrossRef] [Green Version]
- Ravani, A.; Werba, J.P.; Frigerio, B.; Sansaro, D.; Amato, M.; Tremoli, E.; Baldassarre, D. Assessment and relevance of carotid intima-media thickness (C-IMT) in primary and secondary cardiovascular prevention. Curr. Pharm. Des. 2015, 21, 1164–1171. [Google Scholar] [CrossRef] [PubMed] [Green Version]
- Osawa, S.; Katakami, N.; Sato, I.; Ninomiya, H.; Omori, K.; Yamamoto, Y.; Takahara, M.; Miyashita, K.; Sakamoto, F.; Kawamori, D.; et al. Skin autofluorescence is associated with vascular complications in patients with type 2 diabetes. J. Diabetes Complicat. 2018, 32, 839–844. [Google Scholar] [CrossRef] [PubMed]
- Ninomiya, H.; Katakami, N.; Sato, I.; Osawa, S.; Yamamoto, Y.; Takahara, M.; Kawamori, D.; Matsuoka, T.; Shimomura, I. Association between Subclinical Atherosclerosis Markers and the Level of Accumulated Advanced Glycation End-Products in the Skin of Patients with Diabetes. J. Atheroscler. Thromb. 2018, 25, 1274–1284. [Google Scholar] [CrossRef] [PubMed] [Green Version]
- Amar, J.; Ruidavets, J.B.; Chamontin, B.; Drouet, L.; Ferrières, J. Arterial stiffness and cardiovascular risk factors in a population-based study. J. Hypertens. 2001, 19, 381–387. [Google Scholar] [CrossRef] [PubMed]
- Watfa, G.; Soulis, G.; Tartagni, E.; Kearney-Schwartz, A.; Borghi, C.; Salvi, P.; Benetos, A. Relationship between tissue glycation measured by autofluorescence and pulse wave velocity in young and elderly non-diabetic populations. Diabetes Metab. 2012, 38, 413–419. [Google Scholar] [CrossRef]
- Llauradó, G.; Ceperuelo-Mallafré, V.; Vilardell, C.; Simó, R.; Gil, P.; Cano, A.; Vendrell, J.; González-Clemente, J.M. Advanced glycation end products are associated with arterial stiffness in type 1 diabetes. J. Endocrinol. 2014, 221, 405–413. [Google Scholar] [CrossRef] [Green Version]
- Ueno, H.; Koyama, H.; Tanaka, S.; Fukumoto, S.; Shinohara, K.; Shoji, T.; Emoto, M.; Tahara, H.; Kakiya, R.; Tabata, T.; et al. Skin autofluorescence, a marker for advanced glycation end product accumulation, is associated with arterial stiffness in patients with end-stage renal disease. Metabolism 2008, 57, 1452–1457. [Google Scholar] [CrossRef]
- Hofmann, B.; Adam, A.C.; Jacobs, K.; Riemer, M.; Erbs, C.; Bushnaq, H.; Simm, A.; Silber, R.E.; Santos, A.N. Advanced glycation end product associated skin autofluorescence: A mirror of vascular function? Exp. Gerontol. 2013, 48, 38–44. [Google Scholar] [CrossRef]
- Van Eupen, M.G.A.; Schram, M.T.; Van Sloten, T.T.; Scheijen, J.; Sep, S.J.S.; Van del Kallen, C.J.; Dagnelie, P.C.; Koster, A.; Schaper, N.; Henry, R.M.A.; et al. Skin Autofluorescence and Pentosidine Are Associated With Aortic Stiffening. The Maastricht Study. Hypertension 2016, 68, 956–963. [Google Scholar] [CrossRef] [Green Version]
- Lutgers, H.L.; Graaff, R.; Vries, R.D.; Smit, A.J.; Dullaart, R.P.F. Carotid artery intima media thickness associates with skin autofluoresence in non-diabetic subjects without clinically manifest cardiovascular disease. Eur. J. Clin. Invest. 2010, 40, 812–817. [Google Scholar] [CrossRef]
- Osawa, S.; Katakami, N.; Kuroda, A.; Takahara, M.; Sakamoto, F.; Kawamori, D.; Matsuoka, T.; Matsuhisa, M.; Shimomura, I. Skin Autofluorescence is Associated with Early-stage Atherosclerosis in Patients with Type 1 Diabetes. J. Atheroscler. Thromb. 2016, 23, 312–326. [Google Scholar] [CrossRef] [PubMed] [Green Version]
- Temma, J.; Matsuhisa, M.; Horie, T.; Kuroda, A.; Mori, H.; Tamaki, M.; Endo, I.; Aihara, K.; Abe, M.; Matsumoto, T. Non-invasive Measurement of Skin Autofluorescence as a Beneficial Surrogate Marker for Atherosclerosis in Patients with Type 2 Diabetes. J. Med. Investig. 2015, 62, 126–129. [Google Scholar] [CrossRef] [Green Version]
- Goff, D.C.; Lloyd-Jones, D.M.; Bennett, G.; Coady, S.; D’Agostino, R.B.; Gibbons, R.; Greenland, P.; Lackland, D.T.; Levy, D.; O’Donnell, C.J.; et al. 2013 ACC/AHA guideline on the assessment of cardiovascular risk: A report of the American College of Cardiology/American Heart Association Task Force on Practice Guidelines. J. Am. Coll. Cardiol. 2014, 63, 2935–2959. [Google Scholar] [CrossRef] [PubMed] [Green Version]
- Kobayashi, K.; Akishita, M.; Yu, W.; Hashimoto, M.; Ohni, M.; Toba, K. Interrelationship between non-invasive measurements of atherosclerosis: Flow-mediated dilation of brachial artery, carotid intima-media thickness and pulse wave velocity. J. Atheroscler. 2004, 173, 13–18. [Google Scholar] [CrossRef] [PubMed]
- Meta-analysis of observational studies in Epidemiology (MOOSE) Group. Meta-analysis of observational studies in epidemiology: A proposal for reporting. JAMA 2000, 283, 2008–2012. [Google Scholar] [CrossRef] [PubMed]
- Moher, D.; Liberati, A.; Tetzlaff, J.; Altman, D.G. Preferred reporting items for systematic reviews and meta-analyses: The PRISMA statement. J. Clin. Epidemiol. 2009, 62, 1006–1012. [Google Scholar] [CrossRef]
- Higgins, J.P.T.; Green, S. Cochrane Handbook for Systematic Reviews of Interventions Version 5.1.0 (Updated March 2011). The Cochrane Collaboration. 2011. Available online: http://crtha.iums.ac.ir/files/crtha/files/cochrane.pdf (accessed on 22 January 2020).
- National Institutes of Health. Quality Assessment Tool for Observational Cohort and Cross-Sectional Studies. National Heart, Lung, and Blood Institute. Available online: www.nhlbi.nih.gov/health-pro/guidelines/in-develop/cardiovascular-risk-reduction/tools/cohort (accessed on 4 December 2018).
- DerSimonian, R.; Kacker, R. Random-effects model for meta-analysis of clinical trials: An update. Contemp. Clin. Trials 2007, 28, 105–114. [Google Scholar] [CrossRef]
- Higgins, J.P.; Thompson, S.G. Quantifying heterogeneity in a meta-analysis. Stat. Med. 2002, 21, 1539–1558. [Google Scholar] [CrossRef]
- Sterne, J.A.; Egger, M.; Smith, G.D. Systematic reviews in health care: Investigating and dealing with publication and other biases in meta-analysis. BMJ 2001, 323, 101–105. [Google Scholar] [CrossRef]
- Blaauw, J.; Smit, A.J.; van Pampus, M.G.; van Doormaal, J.J.; Aarnoudse, J.G.; Rakhorst, G.; Graaff, R. Skin autofluorescence, a marker of advanced glycation end products and oxidative stress, is increased in recently preeclamptic women. AJOG 2006, 195, 717–722. [Google Scholar] [CrossRef]
- De Leeuw, K.; Graaff, R.; Vries, R.; Dullaart, R.P.; Smit, A.J.; Kallenberg, C.G.; Bijl, M. Accumulation of advanced glycation endproducts in patients with systemic lupus erythematosus. J. Rheumatol. 2007, 46, 1551–1556. [Google Scholar] [CrossRef] [PubMed] [Green Version]
- Den Hollander, N.C.; Mulder, D.J.; Graaff, R.; Thorpe, S.R.; Baynes, J.W.; Smit, G.P.A.; Smit, A.J. Advanced glycation end products and the absence of premature atherosclerosis in glycogen storage disease Ia. J. Inherit. Metab. Dis. 2007, 30, 916–923. [Google Scholar] [CrossRef] [PubMed] [Green Version]
- Tanaka, K.; Katoh, T.; Asai, J.; Nemoto, F.; Suzuki, H.; Asahi, K.; Sato, K.; Sakane, M.; Miyata, T.; Watanabe, T. Relationship of Skin Autofluorescence to Cardiovascular Disease in Japanese Hemodialysis Patients. Ap. Dial. 2010, 14, 334–340. [Google Scholar] [CrossRef] [PubMed]
- De Leeuw, K.; Nienhuis, H.; Smit, A.A.; Stegeman, C.; Kallenberg, C.; Bijl, M. Increased accumulation of advanced glycation endproducts in patients with Wegener’s granulomatosis. Ann. Rheum. Dis. 2010, 69, 625–626. [Google Scholar] [CrossRef] [PubMed]
- McIntyre, N.J.; Fluck, R.J.; McIntyre, C.W.; Taal, M.W. Skin Autofluorescence and the Association with Renal and Cardiovascular Risk Factors in Chronic Kidney Disease Stage 3. Clin. J. Am. Soc. Nephrol. 2011, 6, 2356–2363. [Google Scholar] [CrossRef] [Green Version]
- Ueno, H.; Koyama, H.; Fukumoto, S.; Tanaka, S.; Shoji, T.; Shoji, T. Advanced glycation end products, carotid atherosclerosis, and circulating endothelial progenitor cells in patients with end-stage renal disease. Metabolism 2011, 60, 453–459. [Google Scholar] [CrossRef]
- Den Dekker, M.A.M.; Zwiers, M.; van den Heuvel, E.R.; de Vos, S.C.; Smit, A.J.; Zeebregts, C.J.; Oudkerk, M.; Vliegenthart, R.; Lefrandt, J.D.; Mulder, D.J. Skin Autofluorescence, a Non-Invasive Marker for AGE Accumulation, Is Associated with the Degree of Atherosclerosis. PLoS ONE 2013, 8, e83084. [Google Scholar] [CrossRef]
- McIntyre, N.J.; Fluck, R.J.; McIntyre, C.W.; Fakis, A.; Taal, M.W. Determinants of Arterial Stiffness in Chronic Kidney Disease Stage 3. PLoS ONE 2013, 8, e55444. [Google Scholar] [CrossRef] [Green Version]
- Kimura, H.; Tanaka, K.; Kanno, M.; Watanabe, K.; Hayashi, Y.; Asahi, K.; Suzuki, H.; Sato, K.; Sakane, M.; Terawaki, H.; et al. Skin Autofluorescence Predicts Cardiovascular Mortality in Patients on Chronic Hemodialysis. Apher. Dial. 2014, 18, 461–467. [Google Scholar] [CrossRef] [Green Version]
- Araszkiewicz, A.; Naskret, D.; Zozulinska-Ziolkiewicz, D.; Pilacinski, S.; Uruska, A.; Grzelka, A.; Wegner, M.; Wierusz-Wysoka, B. Skin autofluorescence is associated with carotid intima-media thickness, diabetic microangiopathy, and long-lasting metabolic control in type 1 diabetic patients. Microvasc. Res. 2015, 98, 62–67. [Google Scholar] [CrossRef]
- Dadoniene, J.; Cypiene, A.; Ryliskyte, L.; Rugiene, R.; Ryliškiene, K.; LauceviIius, A. Skin Autofluorescence in Systemic Sclerosis Is Related to the Disease and Vascular Damage: A Cross-Sectional Analytic Study of Comparative Groups. Dis. Markers 2015. [Google Scholar] [CrossRef] [PubMed] [Green Version]
- De Groot, L.; Jager, N.A.; Westra, J.; Smit, A.J.; Kallenberg, C.G.M.; Posthumus, M.D.; Bijl, M. Does reduction of disease activity improve early markers of cardiovascular disease in newly diagnosed rheumatoid arthritis patients? J. Rheumatol. 2015, 54, 1257–1261. [Google Scholar] [CrossRef] [PubMed] [Green Version]
- Hangai, M.; Takebe, N.; Honma, H.; Sasaki, A.; Chida, A.; Nakano, R.; Togashi, H.; Nakagawa, R.; Oda, T.; Matsui, M.; et al. Association of Advanced Glycation End Products with coronary Artery Calcification in Japanese Subjects with Type 2 Diabetes as Assessed by Skin Autofluorescence. J. Atheroscler. Thromb. 2016, 23, 1178–1187. [Google Scholar] [CrossRef] [PubMed] [Green Version]
- Igase, M.; Ohara, M.; Igase, K.; Kato, T.; Okada, Y.; Ochi, M.; Tabara, Y.; Kohara, K.; Ohyagi, Y. Skin Autofluorescence Examination as a Diagnostic Tool for Mild Cognitive Impairment in Healthy People. J. Alzheimer’s Dis. 2017, 55, 1481–1487. [Google Scholar] [CrossRef]
- Yoshioka, K. Skin Autofluorescence is a Noninvasive Surrogate Marker for Diabetic Microvascular Complications and Carotid Intima–Media Thickness in Japanese Patients with Type 2 Diabetes: A Cross-sectional Study. Diabetes 2018, 9, 75–85. [Google Scholar] [CrossRef] [Green Version]
- Zieman, S.J.; Kass, D.A. Advanced glycation end product crosslinking in the cardiovascular system: Potential therapeutic target for cardiovascular disease. Drugs 2004, 64, 459–470. [Google Scholar] [CrossRef]
- Sell, D.R.; Monnier, V.M. Molecular basis of arterial stiffening: Role of glycation. J. Gerontol. 2012, 58, 227–237. [Google Scholar]
- Goldin, A.; Beckman, J.A.; Schmidt, A.M.; Creager, M.A. Advanced glycation end products: Sparking the development of diabetic vascular injury. Circulation 2006, 114, 597–605. [Google Scholar] [CrossRef] [Green Version]
- Soro Paavonen, A.; Zhang, W.Z.; Venardos, K.; Coughlan, M.T.; Harris, E.; Tong, D.C.K.; Brasacchio, D.; Paavonen, K.; Chin-Dusting, J.; Cooper, M.E.; et al. Advanced glycation end-products induce vascular dysfunction via resistance to nitric oxide and suppression of endothelial nitric oxide synthase. J. Hypertens. 2010, 28, 780–788. [Google Scholar] [CrossRef]
- Ferland-McCollough, D.; Slater, S.; Richard, J.; Reni, C.; Mangialardi, G. Pericytes, an overlooked player in vascular pathobiology. Pharm. Ther. 2017, 171, 30–42. [Google Scholar] [CrossRef]
- Carroll, L.; Hannawi, S.; Marwick, T.; Thomas, R. Rheumatoid arthritis: Links with cardiovascular disease and the receptor for advanced glycation end products. Wien. Med. Wochenschr. 2006, 156, 42–52. [Google Scholar] [CrossRef] [PubMed]
- Benetos, A.; Waeber, B.; Izzo, J.; Mitchell, G.; Resnick, L.; Asmar, R.; Safar, M. Influence of age, risk factors, and cardiovascular and renal disease on arterial stiffness: Clinical applications. Am. J. Hypertens. 2002, 15, 1101–1108. [Google Scholar] [CrossRef]
- Tattersall, M.C.; Gassett, A.; Korcarz, C.E.; Gepner, A.D.; Kaufman, J.D.; Liu, K.J.; Astor, B.C.; Sheppard, L.; Kronmal, R.A.; Stein, J.H. Predictors of carotid thickness and plaque progression during a decade: The Multi-Ethnic Study of Atherosclerosis. Stroke 2014, 45, 3257–3262. [Google Scholar] [CrossRef] [PubMed] [Green Version]


© 2020 by the authors. Licensee MDPI, Basel, Switzerland. This article is an open access article distributed under the terms and conditions of the Creative Commons Attribution (CC BY) license (http://creativecommons.org/licenses/by/4.0/).
Share and Cite
Saz-Lara, A.; Álvarez-Bueno, C.; Martínez-Vizcaíno, V.; Notario-Pacheco, B.; Sequí-Dominguez, I.; Cavero-Redondo, I. Are Advanced Glycation End Products in Skin Associated with Vascular Dysfunction Markers? A Meta-Analysis. Int. J. Environ. Res. Public Health 2020, 17, 6936. https://0-doi-org.brum.beds.ac.uk/10.3390/ijerph17186936
Saz-Lara A, Álvarez-Bueno C, Martínez-Vizcaíno V, Notario-Pacheco B, Sequí-Dominguez I, Cavero-Redondo I. Are Advanced Glycation End Products in Skin Associated with Vascular Dysfunction Markers? A Meta-Analysis. International Journal of Environmental Research and Public Health. 2020; 17(18):6936. https://0-doi-org.brum.beds.ac.uk/10.3390/ijerph17186936
Chicago/Turabian StyleSaz-Lara, Alicia, Celia Álvarez-Bueno, Vicente Martínez-Vizcaíno, Blanca Notario-Pacheco, Irene Sequí-Dominguez, and Iván Cavero-Redondo. 2020. "Are Advanced Glycation End Products in Skin Associated with Vascular Dysfunction Markers? A Meta-Analysis" International Journal of Environmental Research and Public Health 17, no. 18: 6936. https://0-doi-org.brum.beds.ac.uk/10.3390/ijerph17186936