
Effects of the Menstrual Cycle on Jumping, Sprinting and Force-Velocity Profiling in Resistance-Trained Women: A Preliminary Study

 ,
,  , , , , and
Abstract
:1. Introduction
2. Methods
2.1. Participants
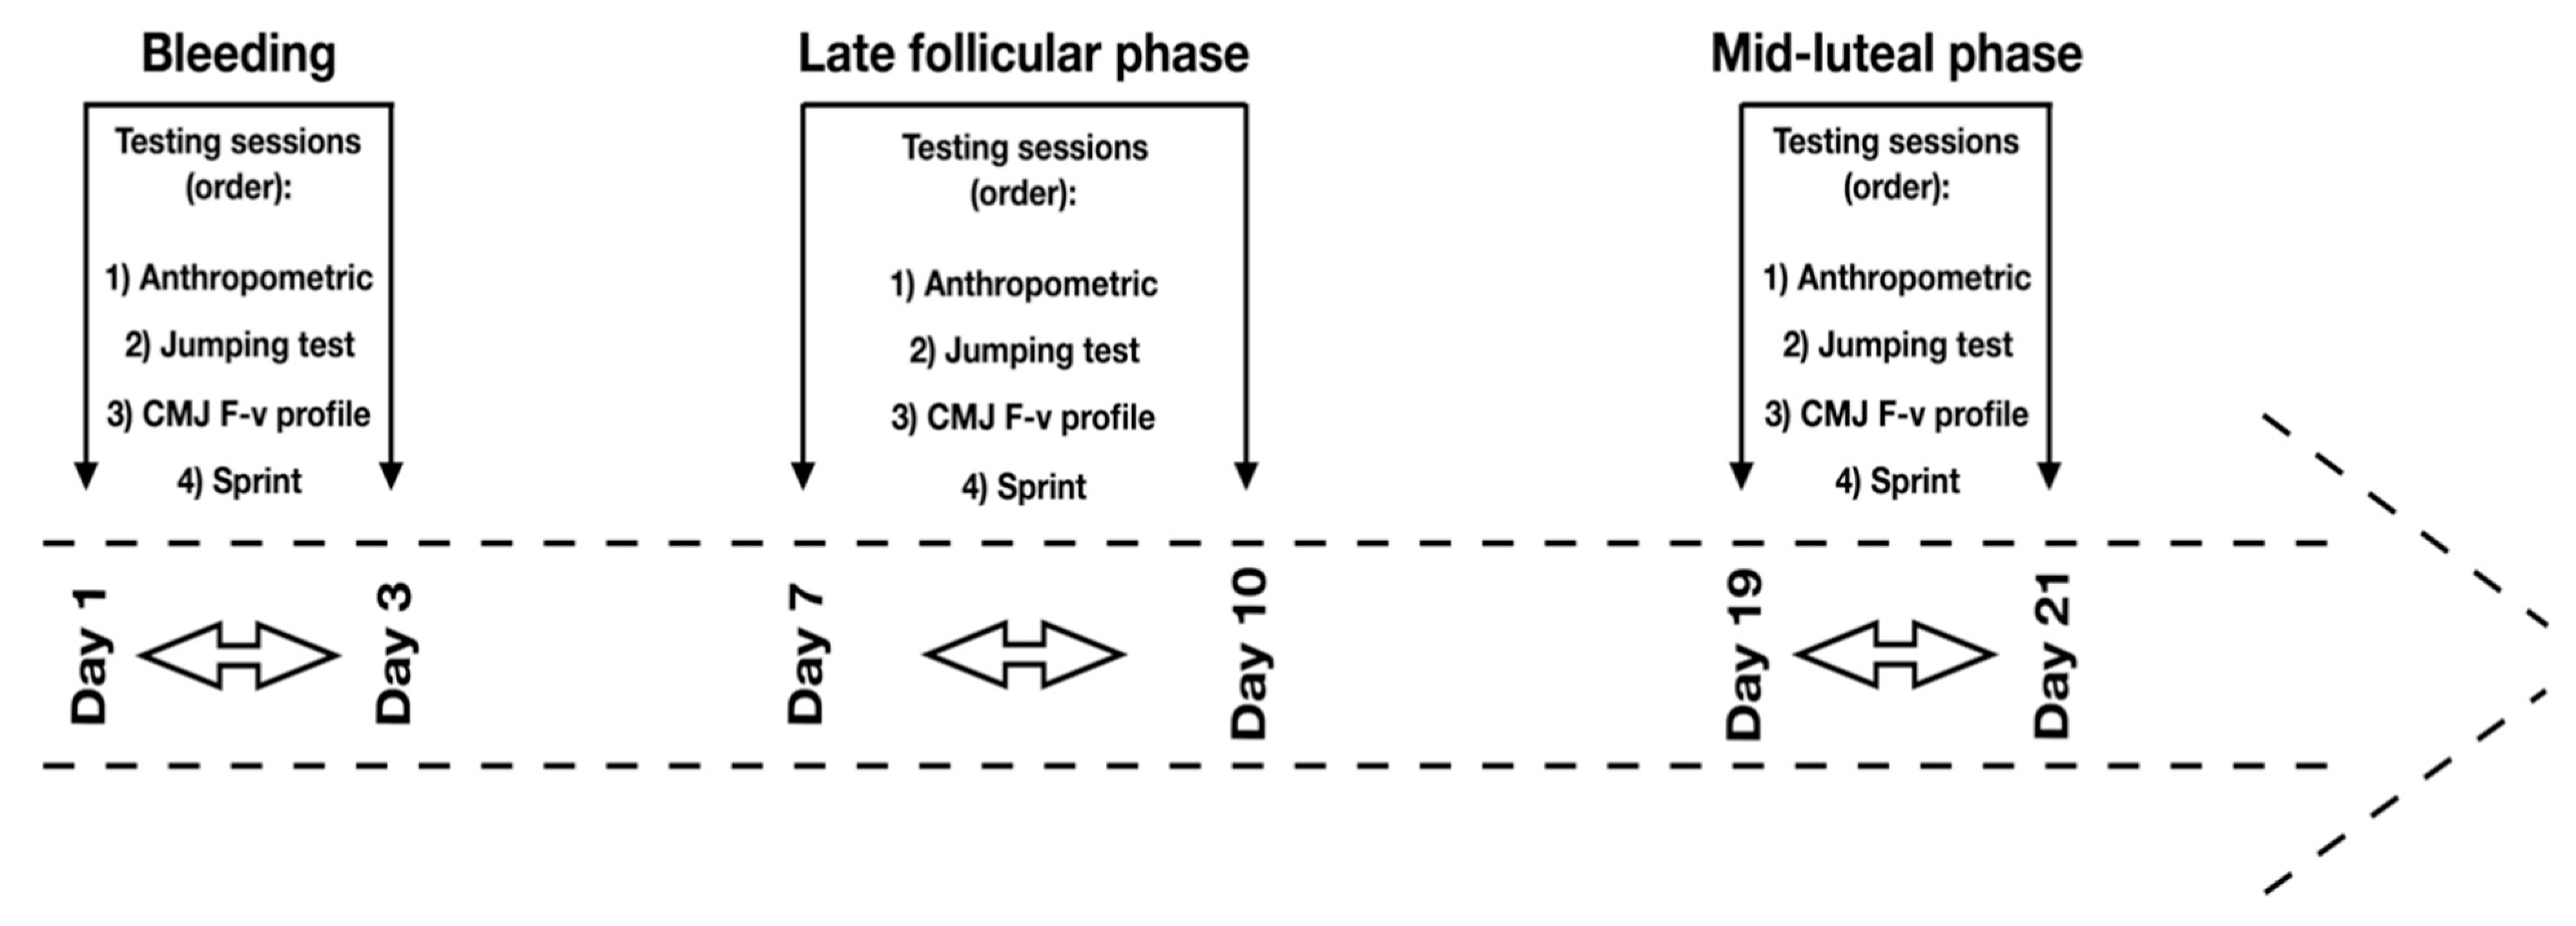
2.2. Procedures
2.3. Statistical Analysis
3. Results
4. Discussion
Practical Applications
5. Conclusions
Author Contributions
Funding
Institutional Review Board Statement
Informed Consent Statement
Data Availability Statement
Conflicts of Interest
References
- Hennessy, L.; Kilty, J. Relationship of the Stretch-Shortening Cycle to Sprint Performance in Trained Female Athletes. J. Strength Cond. Res. 2001, 15, 326–331. [Google Scholar] [CrossRef]
- Klavora, P. Vertical-jump Tests: A Critical Review. Strength Cond. J. 2000, 22, 70–75. [Google Scholar] [CrossRef]
- Samozino, P.; Morin, J.-B.; Hintzy, F.; Belli, A. A simple method for measuring force, velocity and power output during squat jump. J. Biomech. 2008, 41, 2940–2945. [Google Scholar] [CrossRef] [PubMed]
- Morin, J.-B.; Samozino, P. Interpreting Power-Force-Velocity Profiles for Individualized and Specific Training. Int. J. Sports Physiol. Perform. 2016, 11, 267–272. [Google Scholar] [CrossRef] [PubMed]
- Balsalobre-Fernández, C.; Glaister, M.; Lockey, R.A. The validity and reliability of an iPhone app for measuring vertical jump performance. J. Sports Sci. 2015, 33, 1574–1579. [Google Scholar] [CrossRef] [PubMed]
- Romero-Franco, N.; Jiménez-Reyes, P.; Castaño-Zambudio, A.; Capelo-Ramírez, F.; Rodríguez-Juan, J.J.; González-Hernández, J.; Toscano-Bendala, F.J.; Cuadrado-Peñafiel, V.; Balsalobre-Fernández, C. Sprint performance and mechanical outputs computed with an iPhone app: Comparison with existing reference methods. Eur. J. Sport Sci. 2016, 17, 386–392. [Google Scholar] [CrossRef] [PubMed]
- Sims, S.T.; Heather, A.K. Myths and Methodologies: Reducing scientific design ambiguity in studies comparing sexes and/or menstrual cycle phases. Exp. Physiol. 2018, 103, 1309–1317. [Google Scholar] [CrossRef] [Green Version]
- Stricker, R.; Eberhart, R.; Chevailler, M.-C.; Quinn, F.A.; Bischof, P.; Stricker, R. Establishment of detailed reference values for luteinizing hormone, follicle stimulating hormone, estradiol, and progesterone during different phases of the menstrual cycle on the Abbott ARCHITECT® analyzer. Clin. Chem. Lab. Med. 2006, 44, 883–887. [Google Scholar] [CrossRef] [PubMed]
- Chidi-Ogbolu, N.; Baar, K. Effect of Estrogen on Musculoskeletal Performance and Injury Risk. Front. Physiol. 2019, 9, 1834. [Google Scholar] [CrossRef]
- Constantini, N.W.; Dubnov, G.; Lebrun, C.M. The Menstrual Cycle and Sport Performance. Clin. Sports Med. 2005, 24, e51–e82. [Google Scholar] [CrossRef]
- De Jonge, X.A.K.J. Effects of the menstrual cycle on exercise performance. Sports Med. 2003, 33, 833–851. [Google Scholar] [CrossRef] [PubMed]
- Davies, B.N.; Elford, J.C.; Jamieson, K.F. Variations in performance in simple muscle tests at different phases of the menstrual cycle. J. Sports Med. Phys. Fit. 1991, 31, 532–537. [Google Scholar]
- Sipavičienė, S.; Daniusevičiūtė, L.; Klizienė, I.; Kamandulis, S.; Skurvydas, A. Effects of Estrogen Fluctuation during the Menstrual Cycle on the Response to Stretch-Shortening Exercise in Females. BioMed Res. Int. 2013, 2013, 1–6. [Google Scholar] [CrossRef]
- García-Pinillos, F.; Lago-Fuentes, C.; Bujalance-Moreno, P.; Pérez-Castilla, A. Effect of the Menstrual Cycle When Estimating 1 Repetition Maximum from the Load-Velocity Relationship During the Bench Press Exercise. J. Strength Cond. Res. 2020. [Google Scholar] [CrossRef]
- Romero-Moraleda, B.; Del Coso, J.; Gutiérrez-Hellín, J.; Ruiz-Moreno, C.; Grgic, J.; Lara, B. The Influence of the Menstrual Cycle on Muscle Strength and Power Performance. J. Hum. Kinet. 2019, 68, 123–133. [Google Scholar] [CrossRef] [PubMed] [Green Version]
- Julian, R.; Hecksteden, A.; Fullagar, H.H.K.; Meyer, T. The effects of menstrual cycle phase on physical performance in female soccer players. PLoS ONE 2017, 12, e0173951. [Google Scholar] [CrossRef] [PubMed] [Green Version]
- Wiecek, M.; Szymura, J.; Maciejczyk, M.; Cempla, J.; Szygula, Z.; Information, R. Effect of sex and menstrual cycle in women on starting speed, anaerobic endurance and muscle power. Acta Physiol. Hung. 2016, 103, 127–132. [Google Scholar] [CrossRef] [PubMed] [Green Version]
- Thompson, B.; Almarjawi, A.; Sculley, D.; De Jonge, X.J. The Effect of the Menstrual Cycle and Oral Contraceptives on Acute Responses and Chronic Adaptations to Resistance Training: A Systematic Review of the Literature. Sports Med. 2020, 50, 171–185. [Google Scholar] [CrossRef]
- Gür, H. Concentric and eccentric isokinetic measurements in knee muscles during the menstrual cycle: A special reference to reciprocal moment ratios. Arch. Phys. Med. Rehabil. 1997, 78, 501–505. [Google Scholar] [CrossRef]
- Abt, J.P.; Sell, T.C.; Laudner, K.G.; McCrory, J.L.; Loucks, T.L.; Berga, S.L.; Lephart, S.M. Neuromuscular and biomechanical characteristics do not vary across the menstrual cycle. Knee Surg. Sports Traumatol. Arthrosc. 2007, 15, 901–907. [Google Scholar] [CrossRef]
- Elliott-Sale, K.J.; McNulty, K.L.; Ansdell, P.; Goodall, S.; Hicks, K.M.; Thomas, K.; Swinton, P.A.; Dolan, E. The Effects of Oral Contraceptives on Exercise Performance in Women: A Systematic Review and Meta-analysis. Sports Med. 2020, 50, 1785–1812. [Google Scholar] [CrossRef] [PubMed]
- Pallavi, L.C.; Souza, U.J.D.; Shivaprakash, G. Assessment of Musculoskeletal Strength and Levels of Fatigue during Different Phases of Menstrual Cycle in Young Adults. J. Clin. Diagn. Res. 2017, 11, CC11–CC13. [Google Scholar] [CrossRef] [PubMed]
- Jiménez-Reyes, P.; Samozino, P.; Pareja-Blanco, F.; Conceição, F.; Cuadrado-Peñafiel, V.; González-Badillo, J.J.; Morin, J.-B. Validity of a Simple Method for Measuring Force-Velocity-Power Profile in Countermovement Jump. Int. J. Sports Physiol. Perform. 2017, 12, 36–43. [Google Scholar] [CrossRef] [PubMed]
- Ramírez-Campillo, R.; Andrade, D.C.; Izquierdo, M. Effects of Plyometric Training Volume and Training Surface on Explosive Strength. J. Strength Cond. Res. 2013, 27, 2714–2722. [Google Scholar] [CrossRef] [PubMed] [Green Version]
- Young, W.B.; Pryor, J.F.; Wilson, G.J. Effect of Instructions on characteristics of Countermovement and Drop Jump Performance. J. Strength Cond. Res. 1995, 9, 232–236. [Google Scholar] [CrossRef]
- Haynes, T.; Bishop, C.; Antrobus, M.; Brazier, J. The validity and reliability of the My Jump 2 app for measuring the reactive strength index and drop jump performance. J. Sports Med. Phys. Fit. 2019, 59, 253–258. [Google Scholar] [CrossRef] [PubMed] [Green Version]
- García-Ramos, A.; Pérez-Castilla, A.; Jaric, S. Optimisation of applied loads when using the two-point method for assessing the force-velocity relationship during vertical jumps. Sports Biomech. 2021, 20, 274–289. [Google Scholar] [CrossRef]
- Yamauchi, J.; Ishii, N. Relations Between Force-Velocity Characteristics of the Knee-Hip Extension Movement and Vertical Jump Performance. J. Strength Cond. Res. 2007, 21, 703–709. [Google Scholar] [CrossRef] [Green Version]
- Hopkins, W.G.; Marshall, S.W.; Batterham, A.M.; Hanin, J. Progressive Statistics for Studies in Sports Medicine and Exercise Science. Med. Sci. Sports Exerc. 2009, 41, 3–13. [Google Scholar] [CrossRef] [Green Version]
- Tsampoukos, A.; Peckham, E.A.; James, R.; Nevill, M.E. Effect of menstrual cycle phase on sprinting performance. Graefes Arch. Clin. Exp. Ophthalmol. 2010, 109, 659–667. [Google Scholar] [CrossRef]
- Sunderland, C.; Tunaley, V.; Horner, F.; Harmer, D.; Stokes, K.A. Menstrual cycle and oral contraceptives’ effects on growth hormone response to sprinting. Appl. Physiol. Nutr. Metab. 2011, 36, 495–502. [Google Scholar] [CrossRef] [PubMed]
- McNulty, K.L.; Elliott-Sale, K.J.; Dolan, E.; Swinton, P.A.; Ansdell, P.; Goodall, S.; Thomas, K.; Hicks, K.M. The Effects of Menstrual Cycle Phase on Exercise Performance in Eumenorrheic Women: A Systematic Review and Meta-Analysis. Sports Med. 2020, 50, 1813–1827. [Google Scholar] [CrossRef]
- Rael, B.; Romero-Parra, N.; Alfaro-Magallanes, V.M.; Barba-Moreno, L.; Cupeiro, R.; de Jonge, X.J.; Peinado, A.B. Body Composition Over the Menstrual and Oral Contraceptive Cycle in Trained Females. Int. J. Sports Physiol. Perform. 2021, 16, 375–381. [Google Scholar] [CrossRef]
- Giacomoni, M.; Bernard, T.; Gavarry, O.; Altare, S.; Falgairette, G. Influence of the menstrual cycle phase and menstrual symptoms on maximal anaerobic performance. Med. Sci. Sports Exerc. 2000, 32, 486–492. [Google Scholar] [CrossRef] [PubMed]
- Dasa, M.S.; Kristoffersen, M.; Ersvær, E.; Bovim, L.P.; Bjørkhaug, L.; Moe-Nilssen, R.; Sagen, J.V.; Haukenes, I. The Female Menstrual Cycles Effect on Strength and Power Parameters in High-Level Female Team Athletes. Front. Physiol. 2021, 12, 164. [Google Scholar] [CrossRef] [PubMed]
- Botcazou, M.; Gratas-Delamarche, A.; Allain, S.; Jacob, C.; Bentué-Ferrer, D.; Delamarche, P.; Zouhal, H. Influence de la phase du cycle menstruel sur les réponses en catécholamines à l’exercice de sprint chez la femme. Appl. Physiol. Nutr. Metab. 2006, 31, 604–611. [Google Scholar] [CrossRef] [PubMed]
- Janse, D.E.; Jonge, X.; Thompson, B.; Han, A. Methodological Recommendations for Menstrual Cycle Research in Sports and Exercise. Med. Sci. Sports Exerc. 2019, 51, 2610–2617. [Google Scholar] [CrossRef]
- Pérez-Castilla, A.; Fernandes, J.F.T.; Rojas, F.J.; García-Ramos, A. Reliability and Magnitude of Countermovement Jump Performance Variables: Influence of the Take-off Threshold. Meas. Phys. Educ. Exerc. Sci. 2021, 1–9. [Google Scholar] [CrossRef]


| Parameter | Phase 1 | Phase 2 | Phase 3 | p-Value | ES Phase 1 vs. Phase 2 | ES Phase 1 vs. Phase 3 | ES Phase 2 vs. Phase 3 |
|---|---|---|---|---|---|---|---|
| CMJ (cm) | 23.46 ± 5.17 | 24.50 ± 5.60 | 23.74 ± 5.57 | 0.322 | −0.18 | −0.05 | 0.13 |
| SJ (cm) | 21.75 ± 5.36 ^ | 22.98 ± 5.50 ^ | 21.70 ± 4.75 | 0.033 * | −0.22 | 0.01 | 0.24 |
| DJ30 (cm) | 23.22 ± 5.22 | 23.80 ± 5.48 | 23.33 ± 5.93 | 0.422 | −0.10 | −0.01 | 0.08 |
| RSI | 1.07 ± 0.28 | 1.09 ± 0.30 | 1.10 ± 0.23 | 0.833 | −0.07 | −0.11 | −0.04 |
| Sprint 5 m (s) | 1.65 ± 0.15 | 1.62 ± 0.15 | 1.62 ± 0.12 | 0.562 | 0.19 | 0.21 | 0.01 |
| Sprint 10 m (s) | 2.51 ± 0.19 | 2.48 ± 0.19 | 2.48 ± 0.16 | 0.321 | 0.15 | 0.16 | 0.01 |
| Sprint 15 m (s) | 3.37 ± 0.27 | 3.32 ± 0.25 | 3.32 ± 0.23 | 0.283 | 0.18 | 0.19 | 0.01 |
| Sprint 20 m (s) | 4.19 ± 0.33 | 4.14 ± 0.32 | 4.13 ± 0.29 | 0.233 | 0.15 | 0.18 | 0.03 |
| Sprint 25 m (s) | 4.95 ± 0.40 | 4.88 ± 0.38 | 4.88 ± 0.34 | 0.151 | 0.17 | 0.18 | 0.01 |
| Sprint 30 m (s) | 5.66 ± 0.46 | 5.58 ± 0.44 | 5.57 ± 0.39 | 0.113 | 0.17 | 0.20 | 0.01 |
| Parameter | Phase 1 | Phase 2 | Phase 3 | p-Value | ES (g) Phase 1 vs. Phase 2 | ES (g) Phase 1 vs. Phase 3 | ES (g) Phase 2 vs. Phase 3 |
|---|---|---|---|---|---|---|---|
| F0 (N) | 26.49 ± 2.97 | 28.02 ± 5.17 | 25.87 ± 5.04 | 0.441 | −0.35 | 0.14 | 0.40 |
| v0 (m·s−1) | 2.98 ± 0.81 | 2.85 ± 0.59 | 3.45 ± 1.68 | 0.327 | 0.17 | −0.34 | −0.44 |
| Pmax (W) | 20.31 ± 5.74 | 19.63 ± 3.19 | 22.13 ± 8.08 | 0.757 | 0.14 | −0.25 | −0.39 |
| Sfv (N·s·m−1) | −8.71 ± 2.80 | −9.69 ± 4.30 | −8.61 ± 5.55 | 0.774 | 0.26 | −0.02 | −0.21 |
| Parameter | Phase 1 | Phase 2 | Phase 3 | p-Value | ES Phase 1 vs. Phase 2 | ES Phase 1 vs. Phase 3 | ES Phase 2 vs. Phase 3 |
|---|---|---|---|---|---|---|---|
| HZT-F0 (N·kg−1) | 5.72 ± 1.01 | 5.86 ± 1.20 | 5.73 ± 0.86 | 0.710 | −0.12 | −0.01 | 0.12 |
| HZT-v0 (m·s−1) | 6.96 ± 0.73 | 7.06 ± 0.64 | 7.11 ± 0.60 | 0.340 | −0.13 | −0.21 | −0.08 |
| Pmax (W·kg−1) | 10.05 ± 2.71 | 10.45 ± 3.06 | 10.26 ± 2.37 | 0.377 | −0.13 | −0.08 | 0.07 |
| Fvslope | −0.82 ± 0.15 | −0.83 ± 0.13 | −0.79 ± 0.08 | 0.360 | 0.07 | −0.24 | −0.35 |
| RFmax (%) | 35.33 ± 4.21 | 36.11 ± 4.40 | 35.89 ± 3.62 | 0.386 | −0.17 | −0.14 | 0.05 |
| DRF (%) | −7.90 ± 1.15 | −7.93 ± 1.09 | −7.70 ± 0.70 | 0.613 | 0.03 | −0.20 | −0.24 |
Publisher’s Note: MDPI stays neutral with regard to jurisdictional claims in published maps and institutional affiliations. |
© 2021 by the authors. Licensee MDPI, Basel, Switzerland. This article is an open access article distributed under the terms and conditions of the Creative Commons Attribution (CC BY) license (https://creativecommons.org/licenses/by/4.0/).
Share and Cite
García-Pinillos, F.; Bujalance-Moreno, P.; Lago-Fuentes, C.; Ruiz-Alias, S.A.; Domínguez-Azpíroz, I.; Mecías-Calvo, M.; Ramirez-Campillo, R. Effects of the Menstrual Cycle on Jumping, Sprinting and Force-Velocity Profiling in Resistance-Trained Women: A Preliminary Study. Int. J. Environ. Res. Public Health 2021, 18, 4830. https://0-doi-org.brum.beds.ac.uk/10.3390/ijerph18094830
García-Pinillos F, Bujalance-Moreno P, Lago-Fuentes C, Ruiz-Alias SA, Domínguez-Azpíroz I, Mecías-Calvo M, Ramirez-Campillo R. Effects of the Menstrual Cycle on Jumping, Sprinting and Force-Velocity Profiling in Resistance-Trained Women: A Preliminary Study. International Journal of Environmental Research and Public Health. 2021; 18(9):4830. https://0-doi-org.brum.beds.ac.uk/10.3390/ijerph18094830
Chicago/Turabian StyleGarcía-Pinillos, Felipe, Pascual Bujalance-Moreno, Carlos Lago-Fuentes, Santiago A. Ruiz-Alias, Irma Domínguez-Azpíroz, Marcos Mecías-Calvo, and Rodrigo Ramirez-Campillo. 2021. "Effects of the Menstrual Cycle on Jumping, Sprinting and Force-Velocity Profiling in Resistance-Trained Women: A Preliminary Study" International Journal of Environmental Research and Public Health 18, no. 9: 4830. https://0-doi-org.brum.beds.ac.uk/10.3390/ijerph18094830