Article

Experimental Investigation of Oil Recovery from Tight Sandstone Oil Reservoirs by Pressure Depletion

1
State Key Laboratory of Enhanced Oil Recovery, Research Institute of Petroleum Exploration and Development, Beijing 100083, China
2
Research Institute of Enhanced Oil Recovery, China University of Petroleum, Beijing 102249, China
*
Author to whom correspondence should be addressed.
Submission received: 26 July 2018 / Revised: 29 September 2018 / Accepted: 2 October 2018 / Published: 7 October 2018
(This article belongs to the Special Issue Flow and Transport Properties of Unconventional Reservoirs 2018)

Abstract

:
Oil production by natural energy of the reservoir is usually the first choice for oil reservoir development. Conversely, to effectively develop tight oil reservoir is challenging due to its ultra-low formation permeability. A novel platform for experimental investigation of oil recovery from tight sandstone oil reservoirs by pressure depletion has been proposed in this paper. A series of experiments were conducted to evaluate the effects of pressure depletion degree, pressure depletion rate, reservoir temperature, overburden pressure, formation pressure coefficient and crude oil properties on oil recovery by reservoir pressure depletion. In addition, the characteristics of pressure propagation during the reservoir depletion process were monitored and studied. The experimental results showed that oil recovery factor positively correlated with pressure depletion degree when reservoir pressure was above the bubble point pressure. Moreover, equal pressure depletion degree led to the same oil recovery factor regardless of different pressure depletion rate. However, it was noticed that faster pressure drop resulted in a higher oil recovery rate. For oil reservoir without dissolved gas (dead oil), oil recovery was 2–3% due to the limited reservoir natural energy. In contrast, depletion from live oil reservoir resulted in an increased recovery rate ranging from 11% to 18% due to the presence of dissolved gas. This is attributed to the fact that when reservoir pressure drops below the bubble point pressure, the dissolved gas expands and pushes the oil out of the rock pore spaces which significantly improves the oil recovery. From the pressure propagation curve, the reason for improved oil recovery is that when the reservoir pressure is lower than the bubble point pressure, the dissolved gas constantly separates and provides additional pressure gradient to displace oil. The present study will help engineers to have a better understanding of the drive mechanisms and influencing factors that affect development of tight oil reservoirs, especially for predicting oil recovery by reservoir pressure depletion.

1. Introduction

Over the years, the oil and gas Exploration and Production (E&P) industry has shifted their focus from conventional oil and gas resources to unconventional resources due to decline of conventional resources and increasing need for energy. Until now fossil fuels still remain the world’s leading source of energy, therefore unconventional resources like tight oil and shale oil provides a means to supplement our energy demand for the years to come [1,2,3,4,5,6]. Data from bulletin of United States Geological Survey (USGS), International Energy Agency (IEA) and British Petroleum (BP) indicate that the recoverable resources of tight oil in the world is about 472.8 × 10⁸ t [7]. Therefore, with fast depletion of conventional oil resources, it is imperative to find ways to exploit these oil trapped in tight formations [8,9]. However, developing tight oil reservoirs are very challenging due to each unique formation characteristics, making field development based solely on its individual petrophysical attributes. Pore structures of tight formations are inherent factors affecting the storage and development oil tight oil reservoirs. This makes a comprehensive characterization of tight oil pore structures a great importance for their overall development [10,11,12]. Generally, there is no formal definition of tight oil, nonetheless several researchers define tight oil as those found in reservoir with ultra-low permeability and porosity (less than 0.1 md and 10% matrix porosity) [13,14,15,16,17]. Large reserve distribution across the world and better output potential of tight oil has led to the increasing exploitation of these resources in countries like United States, Canada, and Australia [18,19,20,21,22]. Tight oil reservoirs are also widely distributed in China, such as in the Ordos, Sichuan, Songliao, Junggar and Tuha basins, albeit their exploration and development remain in the pilot stage [23,24,25]. The Chang 7 tight reservoir in the Ordos Basin of the Changqing Oilfield has become the largest experimental area for developing tight oil in China [26]. Horizontal well technology and multi-stage hydraulic fracturing technology provide a basis for commercial exploitation of tight oil [27,28,29,30]. Even so, the recovery factor of tight oil reservoirs obtained by relying on formation energy is 3–10% due to its tight lithology, large seepage resistance and poor pressure conduction ability [31,32,33,34].
Reserve estimation is crucial for every oil and gas E&P venture and recovery factor is a key parameter that aid in calculating the reserve of a new oil and gas asset [35,36]. Recovery factor is usually defined as the ratio of geological reserves to economically extracted quantities. The recovery factor of tight oil is uncertain because it takes into account the original oil in place, natural and hydraulic fractures, crude oil properties and the formation’s low permeability and porosity. The resource potential of reservoir is typically assessed by Decline Curve Analysis (DCA) [37,38,39,40]. Though, published estimates of recovery factor in tight oil is mainly by the following three methods (1) Production data analysis; (2) Numerical simulation; (3) Laboratory experimental evaluation. When reservoir properties are known and production data is available, the first method would be the most accurate. Yet, this method has many uncertainties, many indexes and poor universality, and most importantly cannot reveal the factors affecting oil recovery in essence. In Bakken reservoir, the recovery factor according to Reisz et al., [41], Brohrer et al., [42] and Clark [43] with production data analysis method are 15–20%, 0.7–3.7 % and 6.1–8.7 % respectively. The results showed that the production analysis method cannot accurately evaluate the recovery factor of the Bakken reservoir. With the application of numerical simulation, Ghaderi et al., built a black oil simulator by using ECLIPSE 100TM simulator to evaluate the factors affecting primary recovery in multi-fractured horizontal wells [44]. Xu et al., used nonlinear seepage numerical simulation software of the low permeability reservoir to give the optimum fracture parameters of the specific block and analyze the effect of the fracture parameters on the depletion [45]. Xu et al., established a numerical model and experimental method to study the seepage law of tight oil from the microscopic study and analyze the relationship between the pressure, permeability, core size and depletion recovery factor in one dimensional space [46]. Kabir et al., generated a synthetic example with a finite-difference simulator to demonstrate the use of various analytical and numerical tools to learn about both short and long-term reservoir behaviors [47]. Dechongkit and Prasad used deterministic and probabilistic methods to calculate the Antelope, Pronghorn and Parshall oilfield recovery to be 9.2–16% [48]. Clark estimated the recovery factor to be 4–6 % with the material balance equation at the dissolved gas saturation pressure in Bakken shale reservoir [43]. The accuracy of the aforementioned three adopted methods to estimate the recovery rate is compared with the Perm reservoirs in Russia, which were evaluated by the three dimensional recovery factor rate model, the chart method and the (American Petroleum Institute) API recovery formula [49]. At the same time, according to the influencing factors of these methods, the recovery level of depletion were analyzed [50]. Recovery factor estimation methods of newly added measured reserves in present petroleum reserves standardization of China are inapt for sandstone oil reservoirs of extra-low permeability. For this reason, there are inadequate mature standard reference in the experimental study of tight oil depletion in China, hence few reports on experimental evaluation have been published [51]. Therefore, further research needs to be done experimentally in order to fully grasp the factors affecting recovery of tight oil and how recovery factor can be improved significantly before a decision whether or not to exploit specific tight oil reservoir can be made.
In this paper, a novel depletion laboratory experimental platform and its evaluation method about tight oil reservoir is developed. To simulate the actual conditions of horizontal flow in a well in the Chang 7 tight oil reservoir of the Yanchang Formation, three horizontal core samples were used. The depletion experiment at different temperature, formation pressure coefficient and oil properties were conducted to measure the recovery factor, as well as a real-time monitoring of the pressure propagation in the process of reservoir depletion. At the end of the experiment, the drive mechanism and recovery factor of tight oil reservoirs depletion were revealed.

2. Materials and Experiments

2.1. Materials

The target tight oil reservoir for this research is the Yanchang Formation, located in the Erdos Basin of China, and the reservoir temperature is 60 ℃. The reservoir formation depth is 2000 m and hydrostatic pressure is 20 MPa. However, the reservoir formation pressure is only 16 MPa, with a formation pressure coefficient of 0.8. The reservoir GOR is 54.1 m3/m3 with saturation pressure of 8.85 MPa. Kerosene was used as the experimental oil whereas methane as the dissolved gas. Because of low permeability and porosity of tight oil reservoir cores, using conventional core sample which has 1 in. diameter and pore volume usually smaller than 0.008 L leads to large measurement error. To reduce these systematic errors, three horizontal core samples with a total length of 88.3 cm and a total pore volume of 0.776 L were used during the experiment, as shown in Figure 1. The core samples were collected from the outcrop of the tight sandstone formation. Table 1 and Table 2 present the detailed oil and core sample properties used respectively.
The conventional method of saturating cores is unsuitable to saturate low permeability cores samples in the laboratory because they are normally restricted to small core samples which are easy to be destroyed in the saturation process. In this study, two centrifugal pumps were used to vacuum the 3 core samples in the core holder for 24 hours and at a final pressure of 0.01 MPa. The samples were later saturated with kerosene to measure the volume of the saturated kerosene. The saturation degree of the kerosene (ratio of the volume of kerosene to the cores pore volume) was more than 96%.

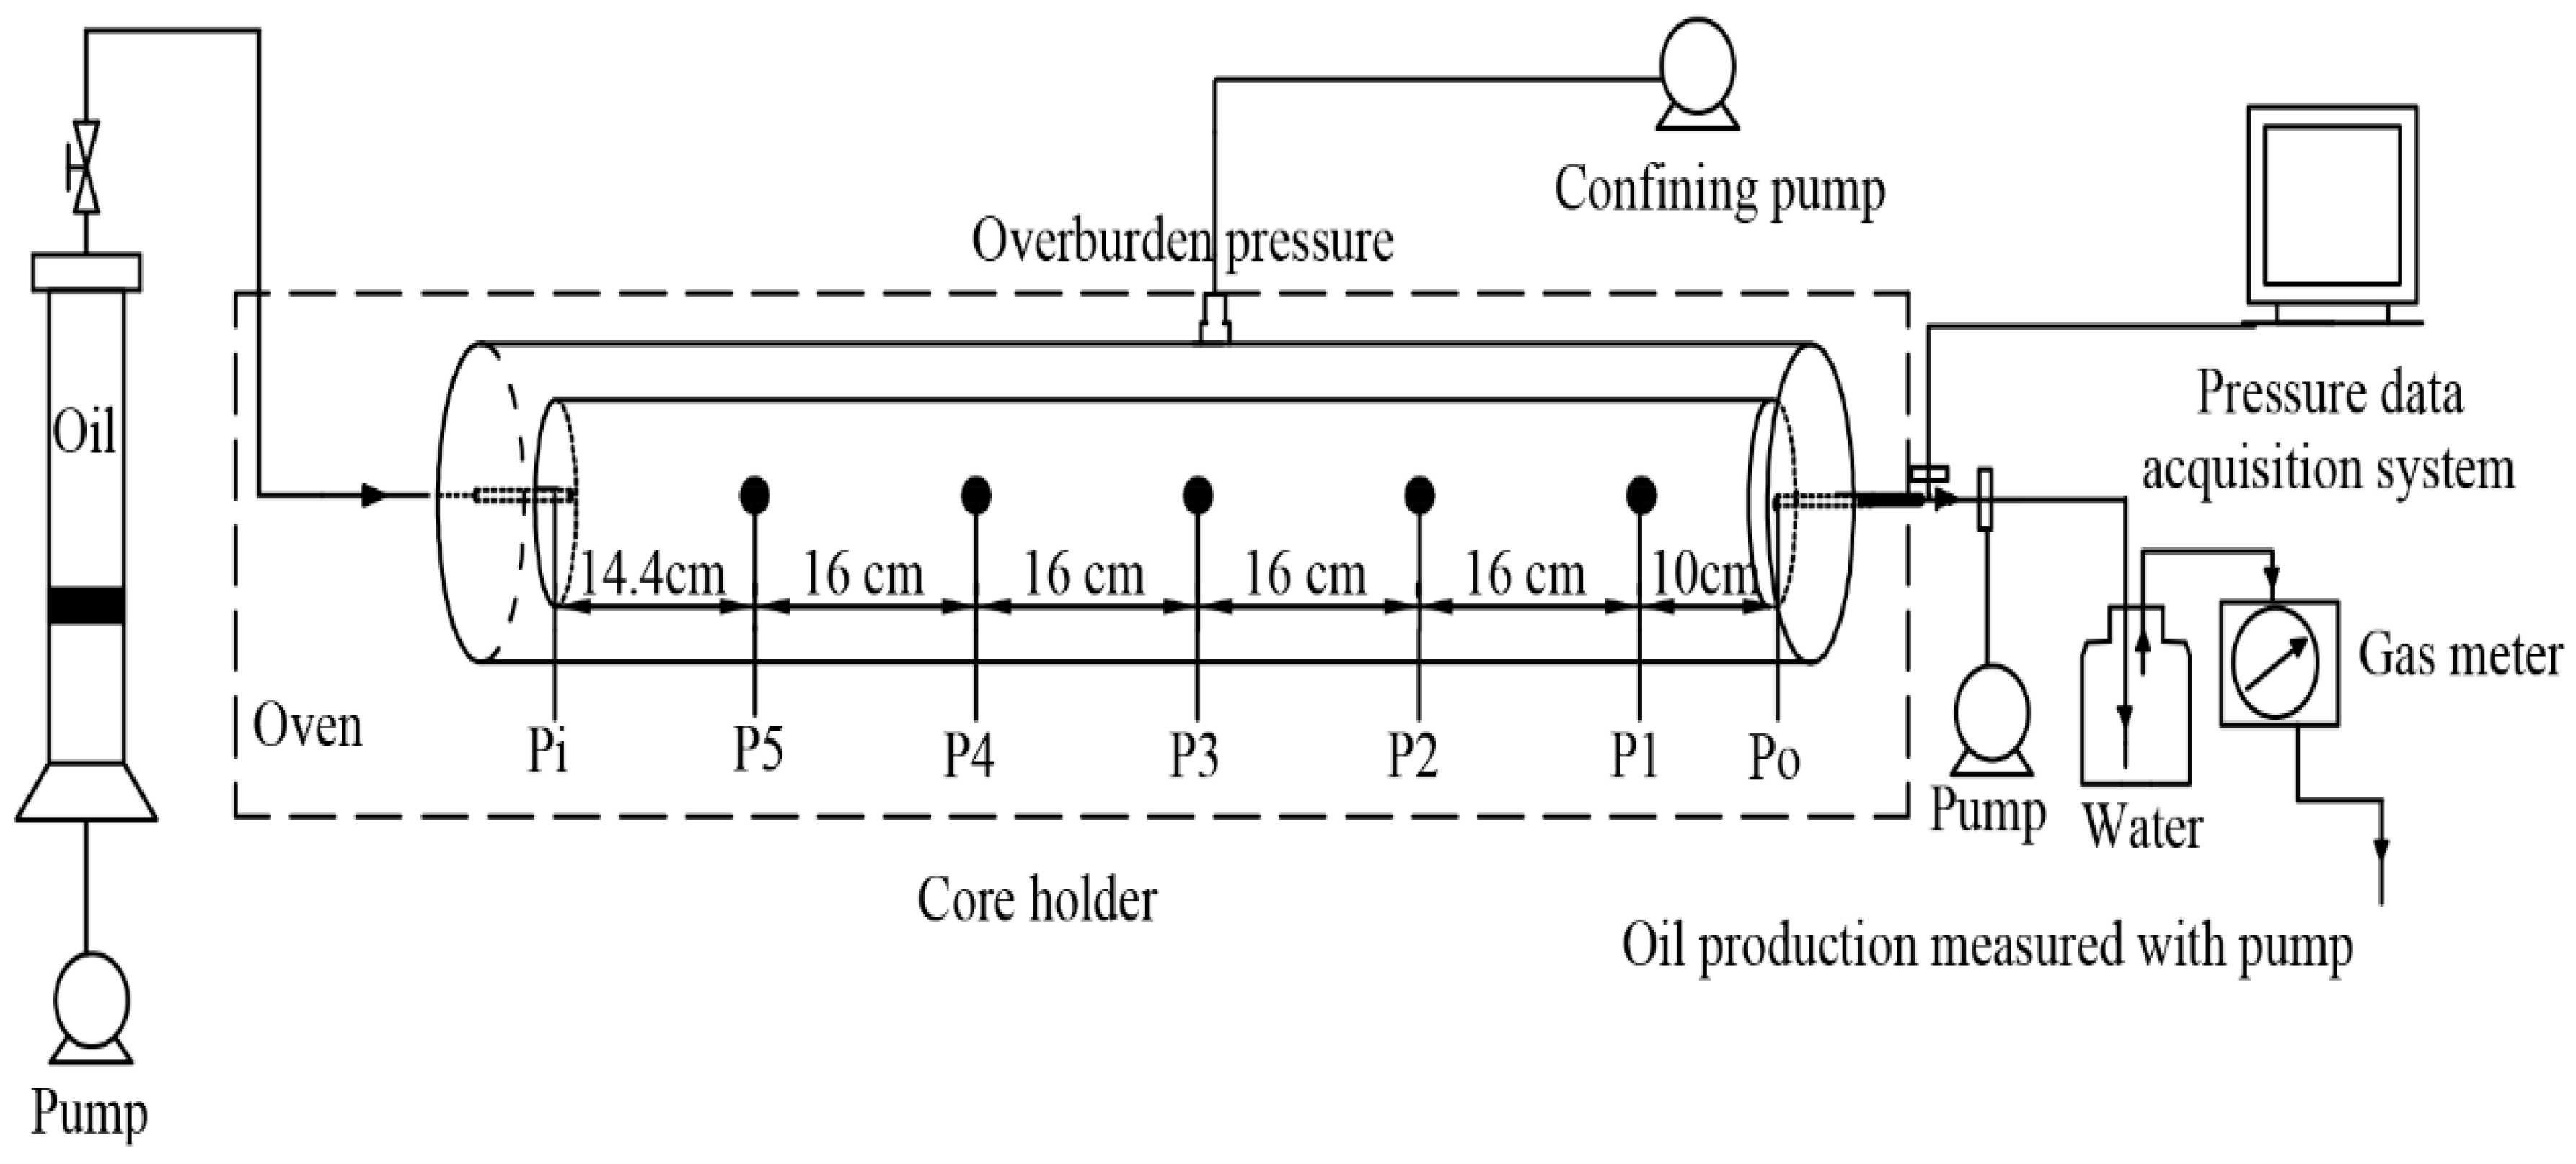
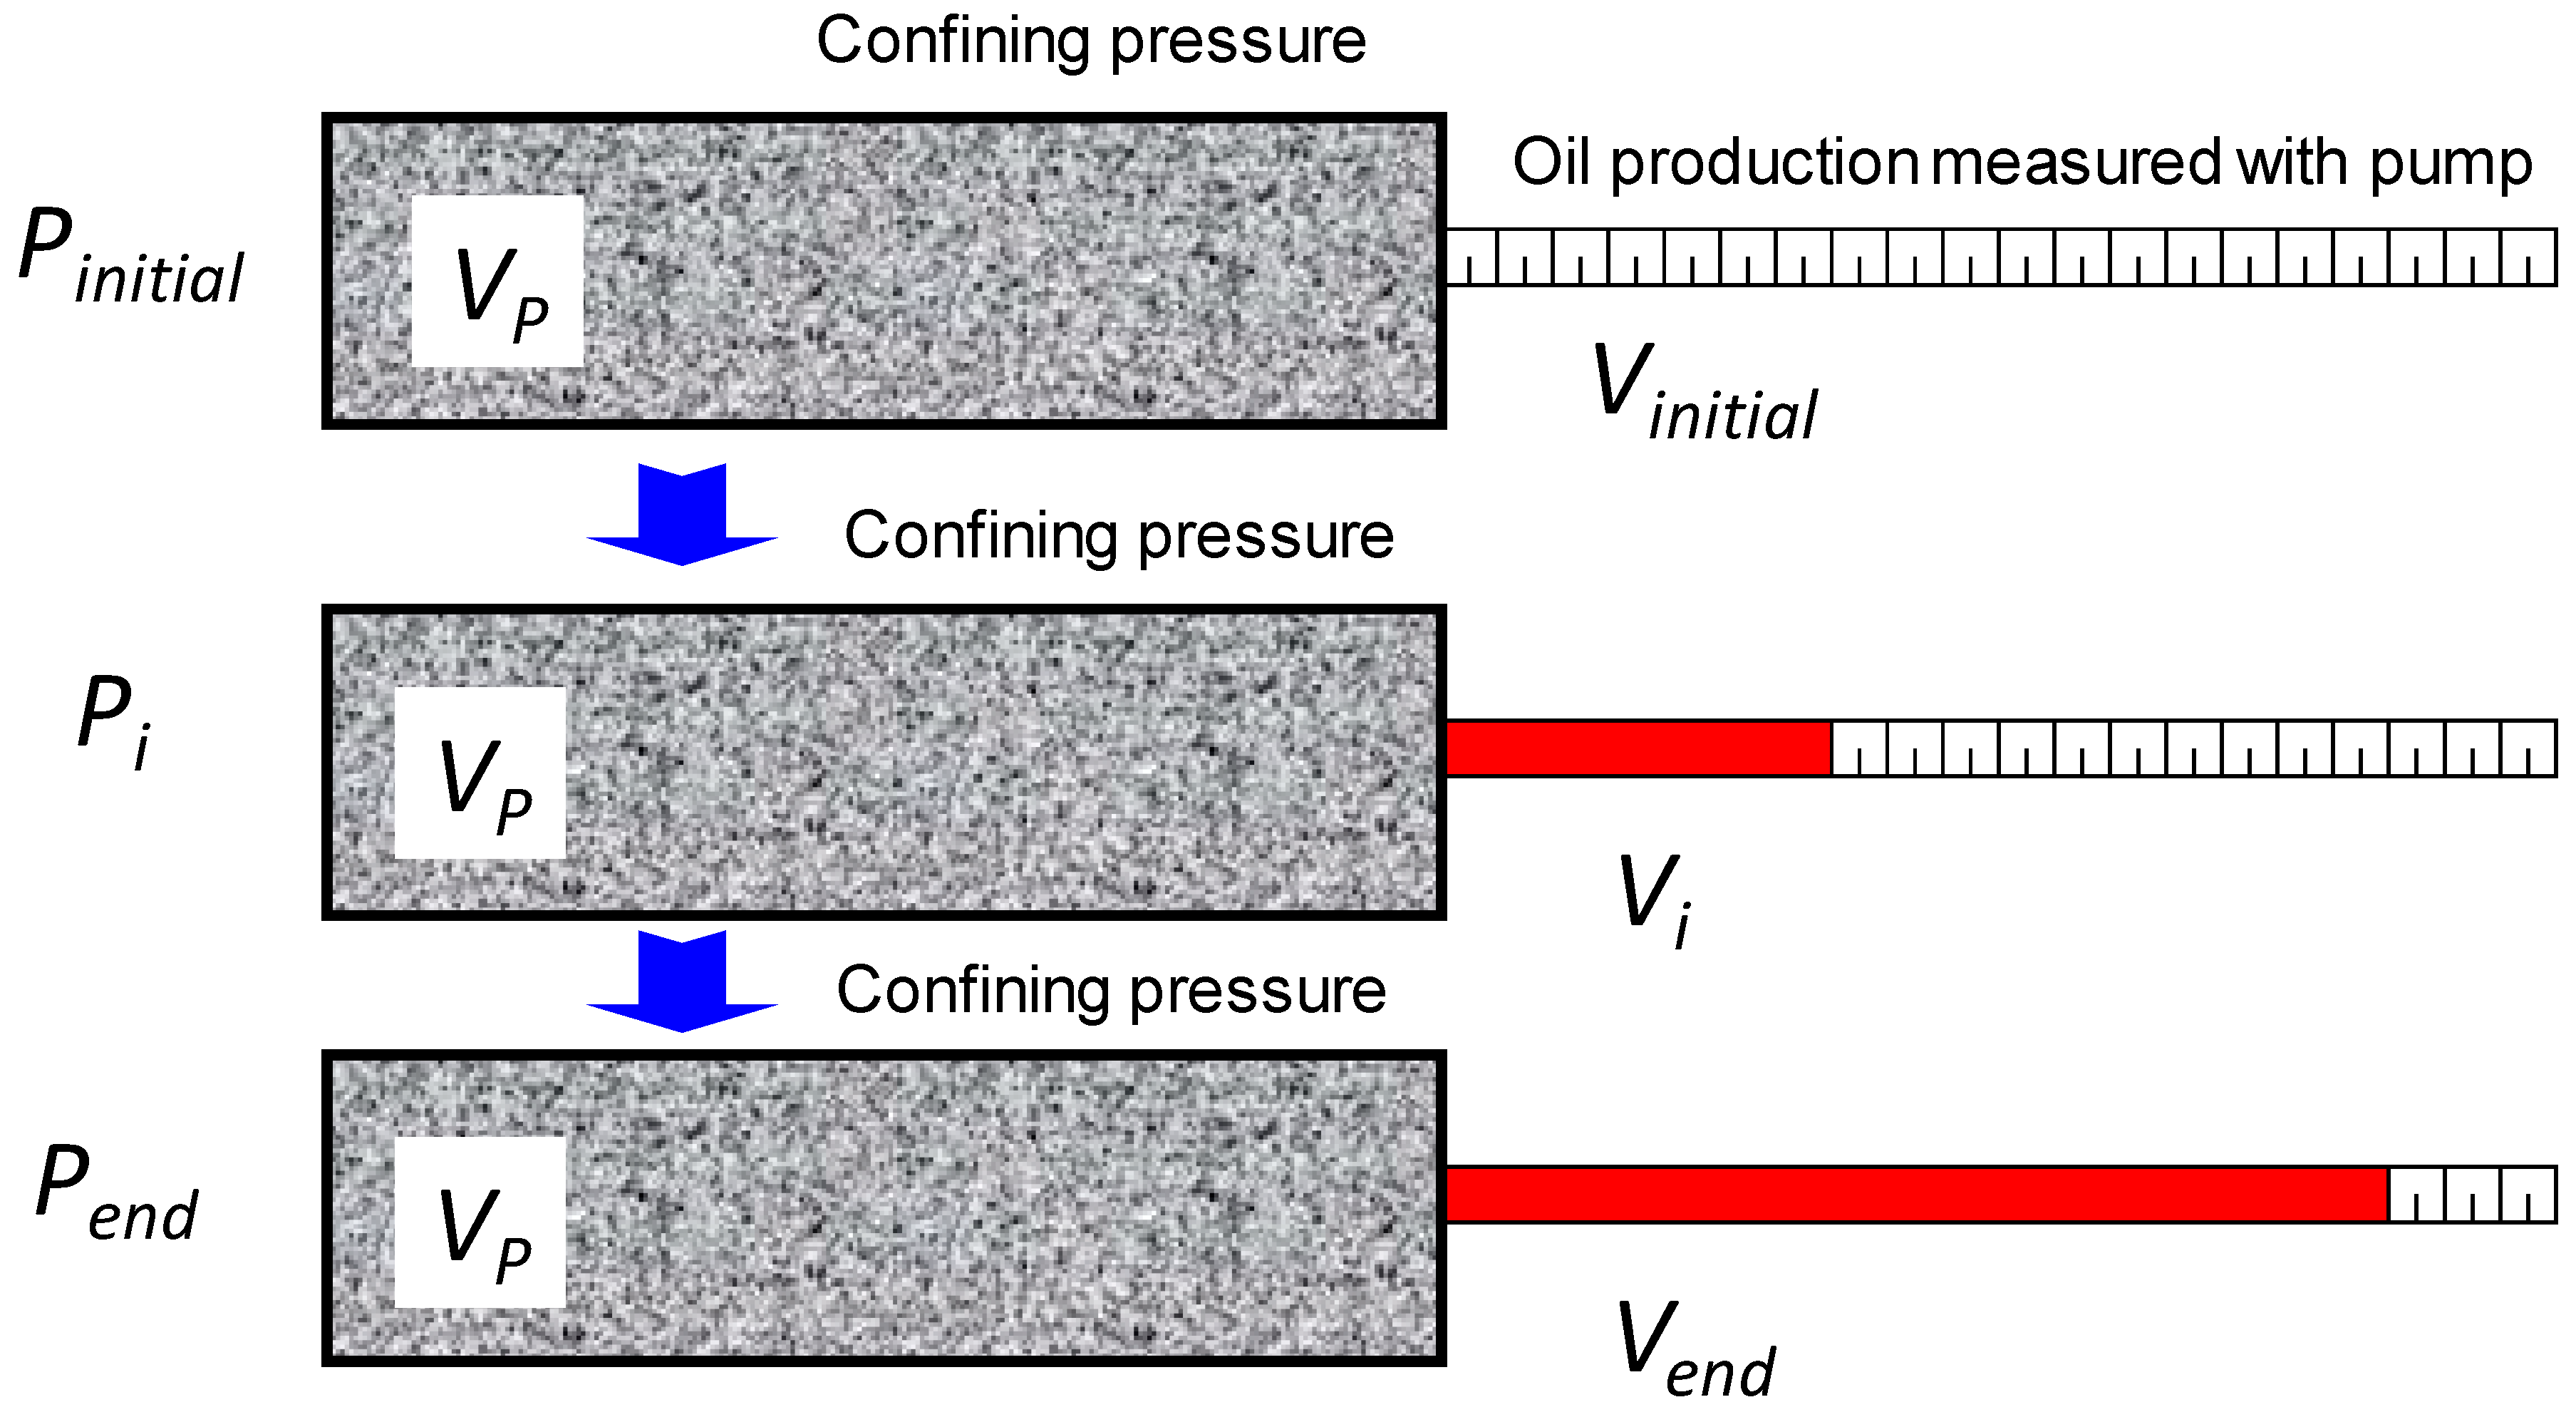
2.2. Experimental Platform and Methods

A novel experimental platform for studying tight oil reservoir depletion was developed in this paper. A schematic diagram of the experimental apparatus is shown in Figure 2. The core holder’s length was 1 m and seven piezometric points were placed along the holder from inlet to the end. The pressure propagation during the coring process was monitored in real time by sensors. A constant confining pressure of 46 MPa was applied to simulate the overburden pressure. The oil production by pressure depletion was measured with pump. As shown in Figure 3, the core pressure decreases with the oil expansion out of the core holder. Assuming the pore volume is VP, and the oil production at time ti is Vi, the oil recovery Ri at the same time ti can be calculated as:
R i = V i V p × 100 %

2.3. Experimental Scheme

The pressure depletion in tight sandstones saturated with dead oil and live oil were studied respectively. Besides, the effects of different experiment temperature, formation pressure coefficient, pressure depletion type (linear or step-like) and pressure depletion range on oil recovery and pressure propagation were investigated.

3. Experimental Results and Analysis

3.1. Depletion Characteristics of Tight Oil without Dissolved Gas

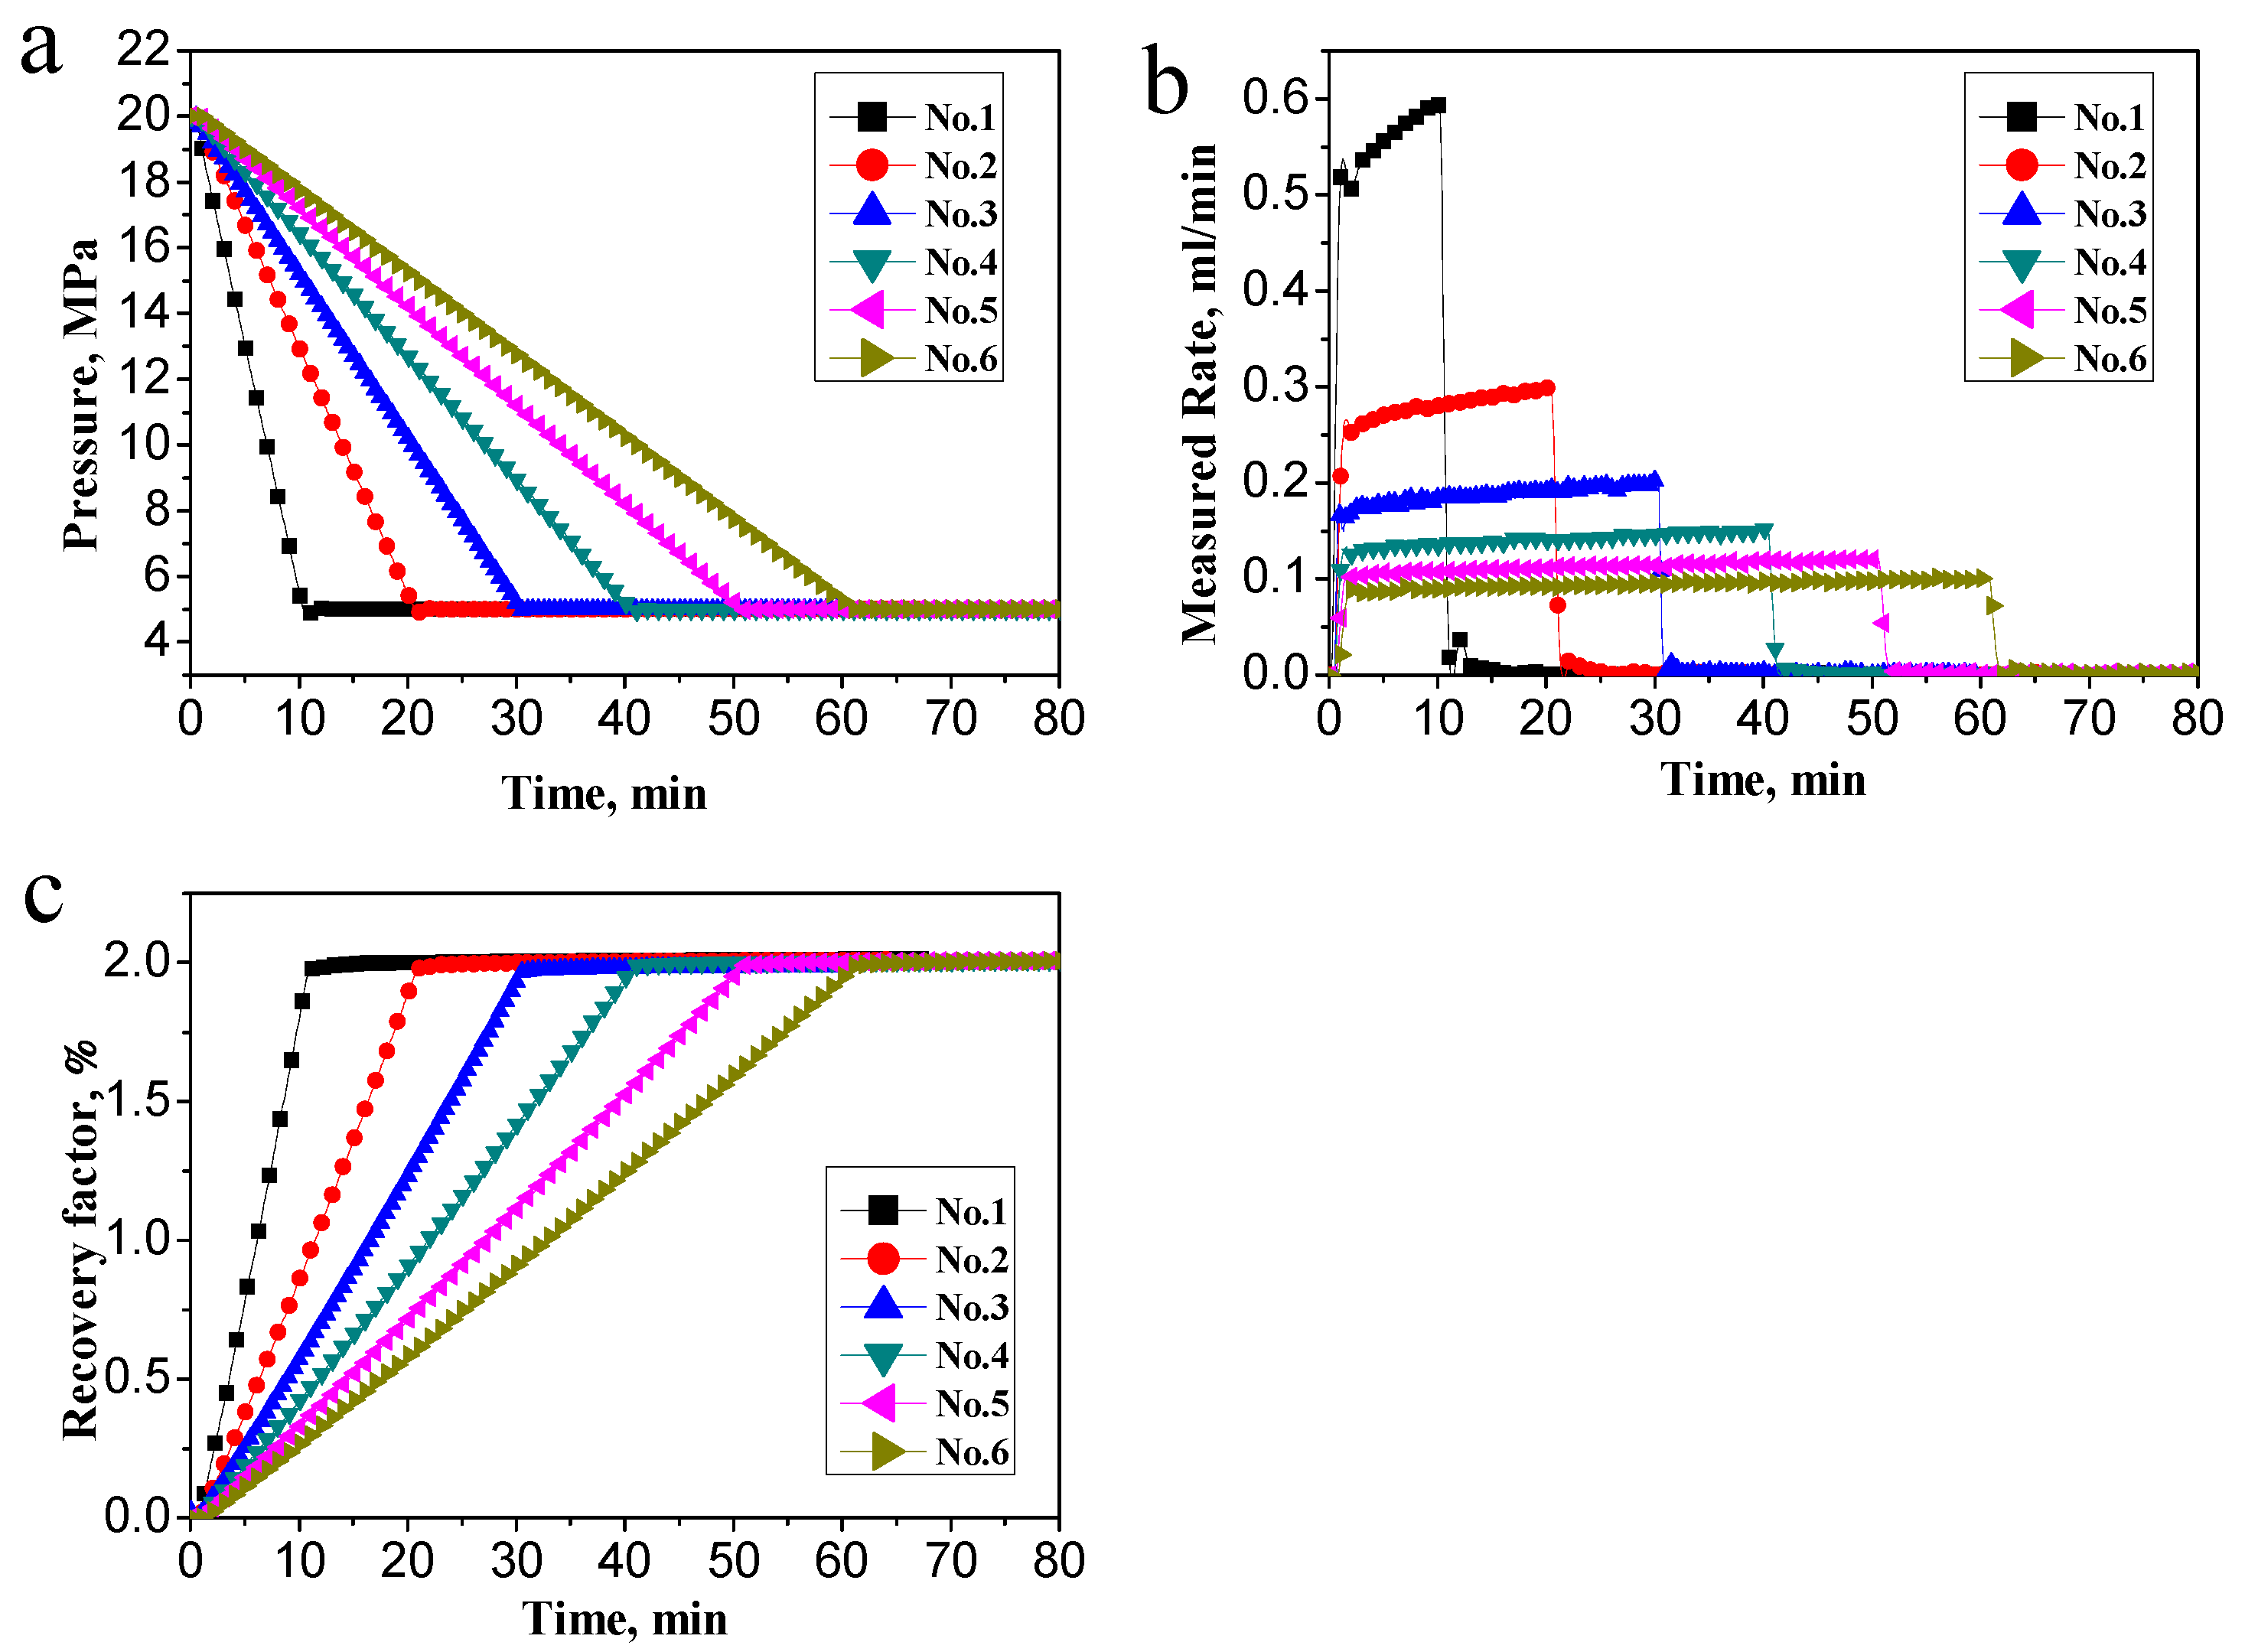
3.1.1. Depletion Experiments with Formation Pressure Coefficient of 1

At room temperature of 20.1 ℃ and formation pressure coefficient of 1, six set of linear pressure depletion experiments with different depletion rate were conducted, as shown in Table 3. The output of the experiment is shown in Figure 4. Although the depletion rate were different, the ultimate oil recovery was the same, around 2%. However, higher depletion rate resulted in higher oil production rate. Therefore, it can be concluded that depletion rate does not affect the ultimate oil recovery but directly affect oil production rate.
Other than the continuous linear pressure depletion, oil recovery by step-like pressure depletion was also investigated. As shown in Table 4, the depletion process was divided into four stages, and during each stage the pressure was kept constant then followed by linear pressure depletion of 5 MPa with a constant pressure depletion rate. The results of the step-like pressure depletion experiment are depicted in Figure 5. Comparatively, the results of the linear pressure depletion and step-like pressure depletion revealed a similar oil recovery trend irrespective of the change in pressure depletion type. This is because under the same initial formation pressure and final pressure conditions, the elastic recovery is basically the same. The depletion by means of formation pressure is mainly used to characterize the elastic energy of rocks and fluids.
When the formation pressure decreases, the fluid expands and the pore size shrinks causing elastic energy of the fluid in the rock pore to be released from the pore spaces into the wellbore. For these pressure depletion experiment with formation pressure coefficient of 1 and without dissolved gas, depletion mainly by the elastic deformation of rock and the release of fluid elastic energy resulted in a recovery factor of about 2%.

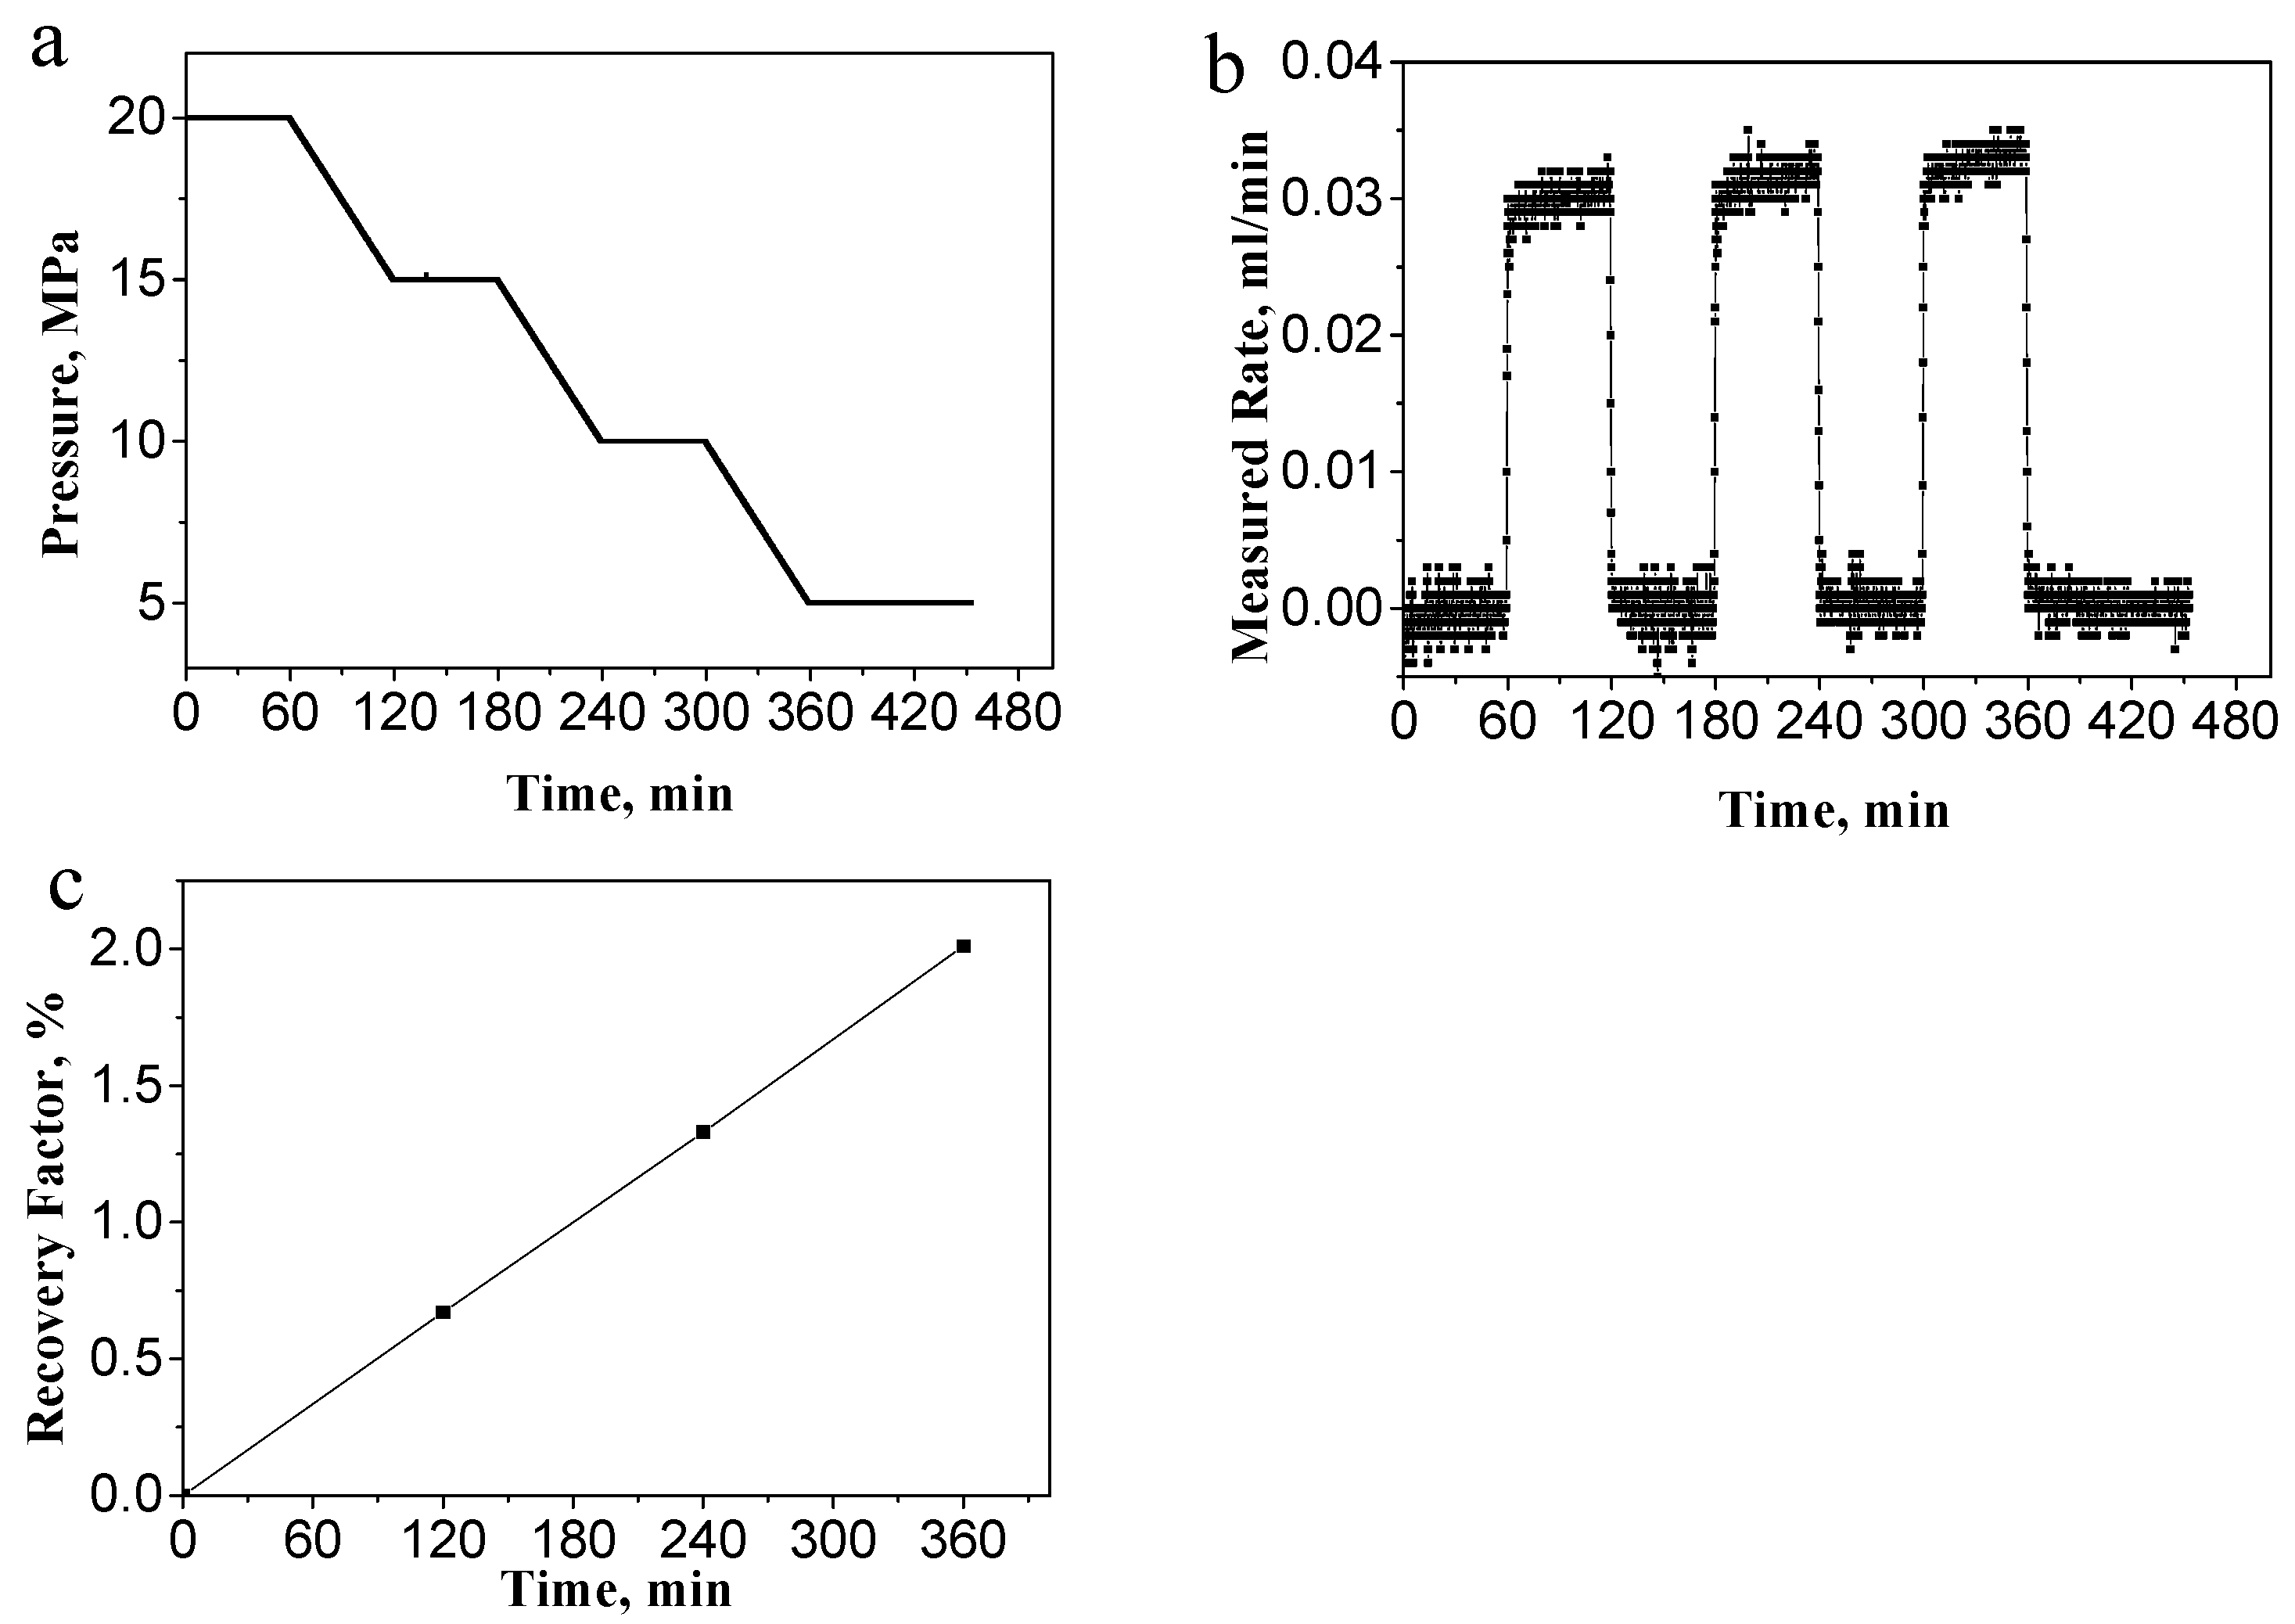
3.1.2. Depletion Experiments with Formation Pressure Coefficient of 1.5

The formation pressure coefficient was adjusted to a value of 1.5 resulting in an increase in the formation pressure from 20 MPa to 30 MPa. The significance of the increment in formation pressure coefficient was to ascertain how much the recovery factor can be improved if the reservoir’s pore pressure is increased. Eight linear pressure depletion experiments with different depletion rate were carried out on the core samples. The detailed experimental conditions are shown in Table 5.
Figure 6 presents the pressure, oil production rate and oil recovery versus time for the linear pressure depletion with eight different pressure depletion rates for the cases of formation pressure coefficient equal to 1.5. It is noticeable that the ultimate oil recovery is the same, however the increase in depletion speed, resulted in a faster oil recovery. Nonetheless, with the different depletion types, the ultimate recovery factor of tight oil reservoir was almost 3%. Compared with the cases of formation pressure coefficient equal to 1, the enhanced ultimate oil recovery by increasing initial formation pressure is proportional to the increased formation pressure coefficient. According to the theory of reservoir engineering, the elastic energy of the formation determines the final oil recovery by pressure depletion before dissolved gas comes out of crude oil, as given by [52]:
E R = B o i B o b [ C f + ϕ [ C o ( 1 S w c ) + C w S w c ] ] ϕ ( 1 S w c ) ( P initial P bubble )
where ER is the recovery factor by pressure depletion; Cf is the rock compressibility coefficient; Co is the compression coefficient of crude oil; Cw is the formation water compression coefficient; φ is porosity; Swc is the connate water saturation; Pinitial is the initial formation pressure; Pbubblr is the Crude oil bubble point pressure; Boi is the initial oil formation volume factor; Bob is the oil formation volume factor at bubble point. Equation (2) is generally adopted for estimating the recovery factor of primary oil recovery by depletion, and the oil recovery by pressure depletion is proportional to the pressure depletion range. When the formation pressure coefficient was 1.5, the recovery factor was higher compared to that with formation pressure coefficient of 1 due to the increase in reservoir’s energy. This indicates that recovery factor of the depletion process positively correlates with reservoir pressure. Under different pressure coefficients, the reservoir rock and fluid have different elastic energies. The larger the pressure coefficient, the higher elastic energy and the recovery factor will increase when the elastic energy is released.

3.1.3. Characteristics of Pressure Propagation of Dead Oil Depletion

It should be noted that although pressure can instantly deplete from the initial pressure to the ending pressure, it still takes some time to reach the ultimate oil recovery. For example, the pressure depletion of the No. 1 case in Figure 6 finishes instantly, oil recovery reaches the ultimate value but takes more than 50 min. It may be that pressure takes some time to propagate in the tight formations, hence the pressure cannot be balanced instantaneously. During the depletion process, the pressure propagation was analyzed from the real-time data collected from the pressure points distributed along the core holder.
Figure 7 depicts the pressure distribution along the core holder during the depletion experiments with different pressure depletion rate. Taking Figure 7c as an example, when the pressure depleted from 30 MPa to 5 MPa in 10 min, the pressure near the oil outlet dropped immediately. Otherwise, if the pressure points are far away from the oil outlet, the slower the rate of pressure drop, signifying that pressure propagation rate become much slower from the inlet to the outlet. With the pressure depletion rate increasing, the asynchrony of pressure depletion at different location becomes more significant. The pressure propagation can be explained by the radius of investigation of the reservoirs as given by [53]:
t = 0.0872 ϕ μ C t r 2 k
where Ct is the total compressibility in 1/MPa; φ is the formation porosity in fraction; μ is the fluid viscosity in mPa·s; k is the formation permeability in mD; r is the reservoir radius in m; t is the time for the transient pressure propagating to the reservoir radius r. Although Equation (3) is mainly used to estimate the time pseudo-steady flow begins in a homogenous reservoir with radial flow, it can also reflect how pressure propagation speed negatively correlates to formation permeability. For the tight formation with ultra-low permeability, pressure needs more time to propagate in the formation compared with highly permeable formation.

3.2. Characteristics of Tight Oil Depletion with Dissolved Gas

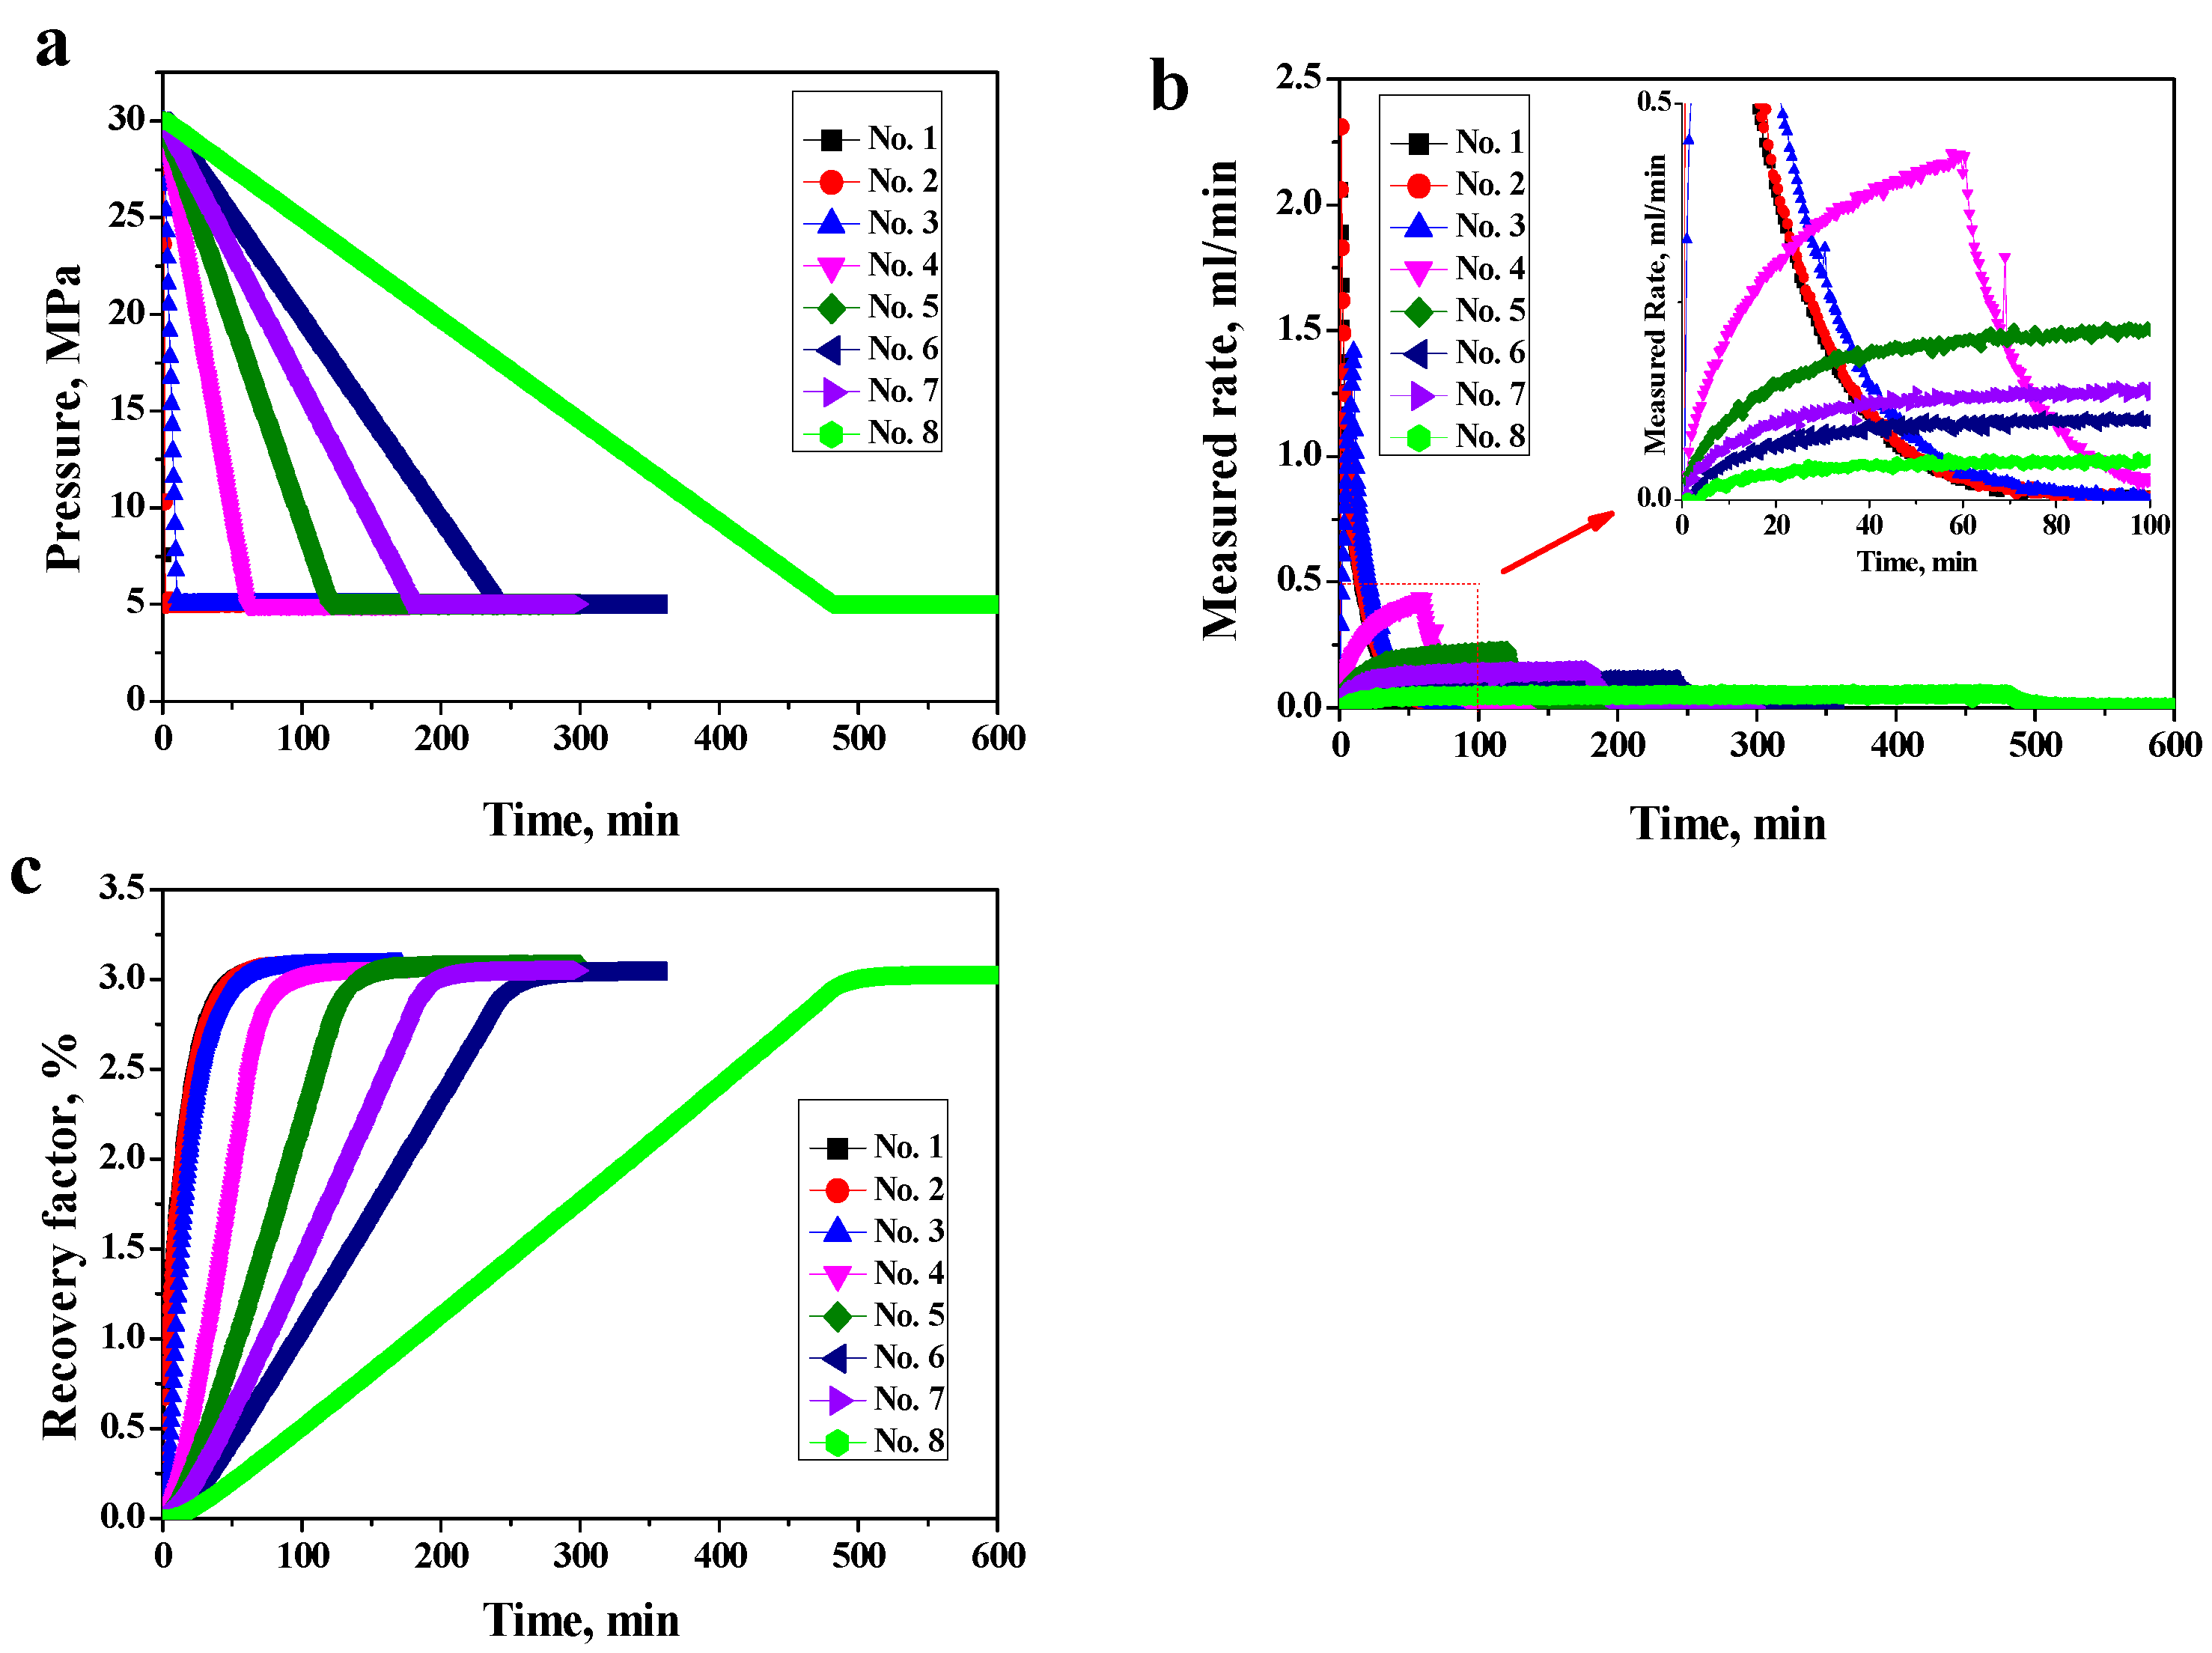
3.2.1. Depletion Experiments at Room Temperature (20.1 °C)

Dissolved gas usually exists in-situ in reservoir, therefore there is the need to carry out the depletion experiment with the oil containing dissolved gas. Four sets of different depletion experiments were carried out at 20.1 °C temperature with and without dissolved gas. The experimental conditions are shown in Table 6. The GOR of the live oil used in the experiment was 90 m3/m3 with saturation pressure of 9.1 MPa. The initial formation pressure was set to 20 MPa, and the linear pressure depletion was used to reduce the outlet pressure from 20 MPa to 5 MPa. The experimental conditions of the four groups were the same except the first group which did not contain dissolved gas (dead oil).
Figure 8 presents the oil recovery versus pressure depletion of experimental results. During the depletion process, at formation pressure higher than bubble point pressure, the recovery curve of the four groups basically coincided. However, it can still be identified that for the same pressure depletion range, the oil recovery of depletion experiments with dissolved gas (live oil) was a bit higher than that of the depletion experiment without dissolved gas (dead oil). This is ascribed to the fact that, the formation with dissolved gas has larger elastic energy to expand. However, when the formation pressure dropped below the bubble point pressure, there was an abrupt rise in the recovery degree of the live oil groups, though the rising trend of the dead oil recovery continued. As the formation pressure decreased from 20 MPa to 5 MPa, the ultimate recovery factor of dead oil group was only 2%. On the other hand, the recovery factor of the three groups of live oil (1–3) were 14.1%, 11.9% and 11.6% respectively. Therefore, from the output of the depletion process, dissolved gas has a significant effect on the recovery of tight oil depletion since recovery rate of live oil reached 14.1% compared to that of dead oil which was only 2%.

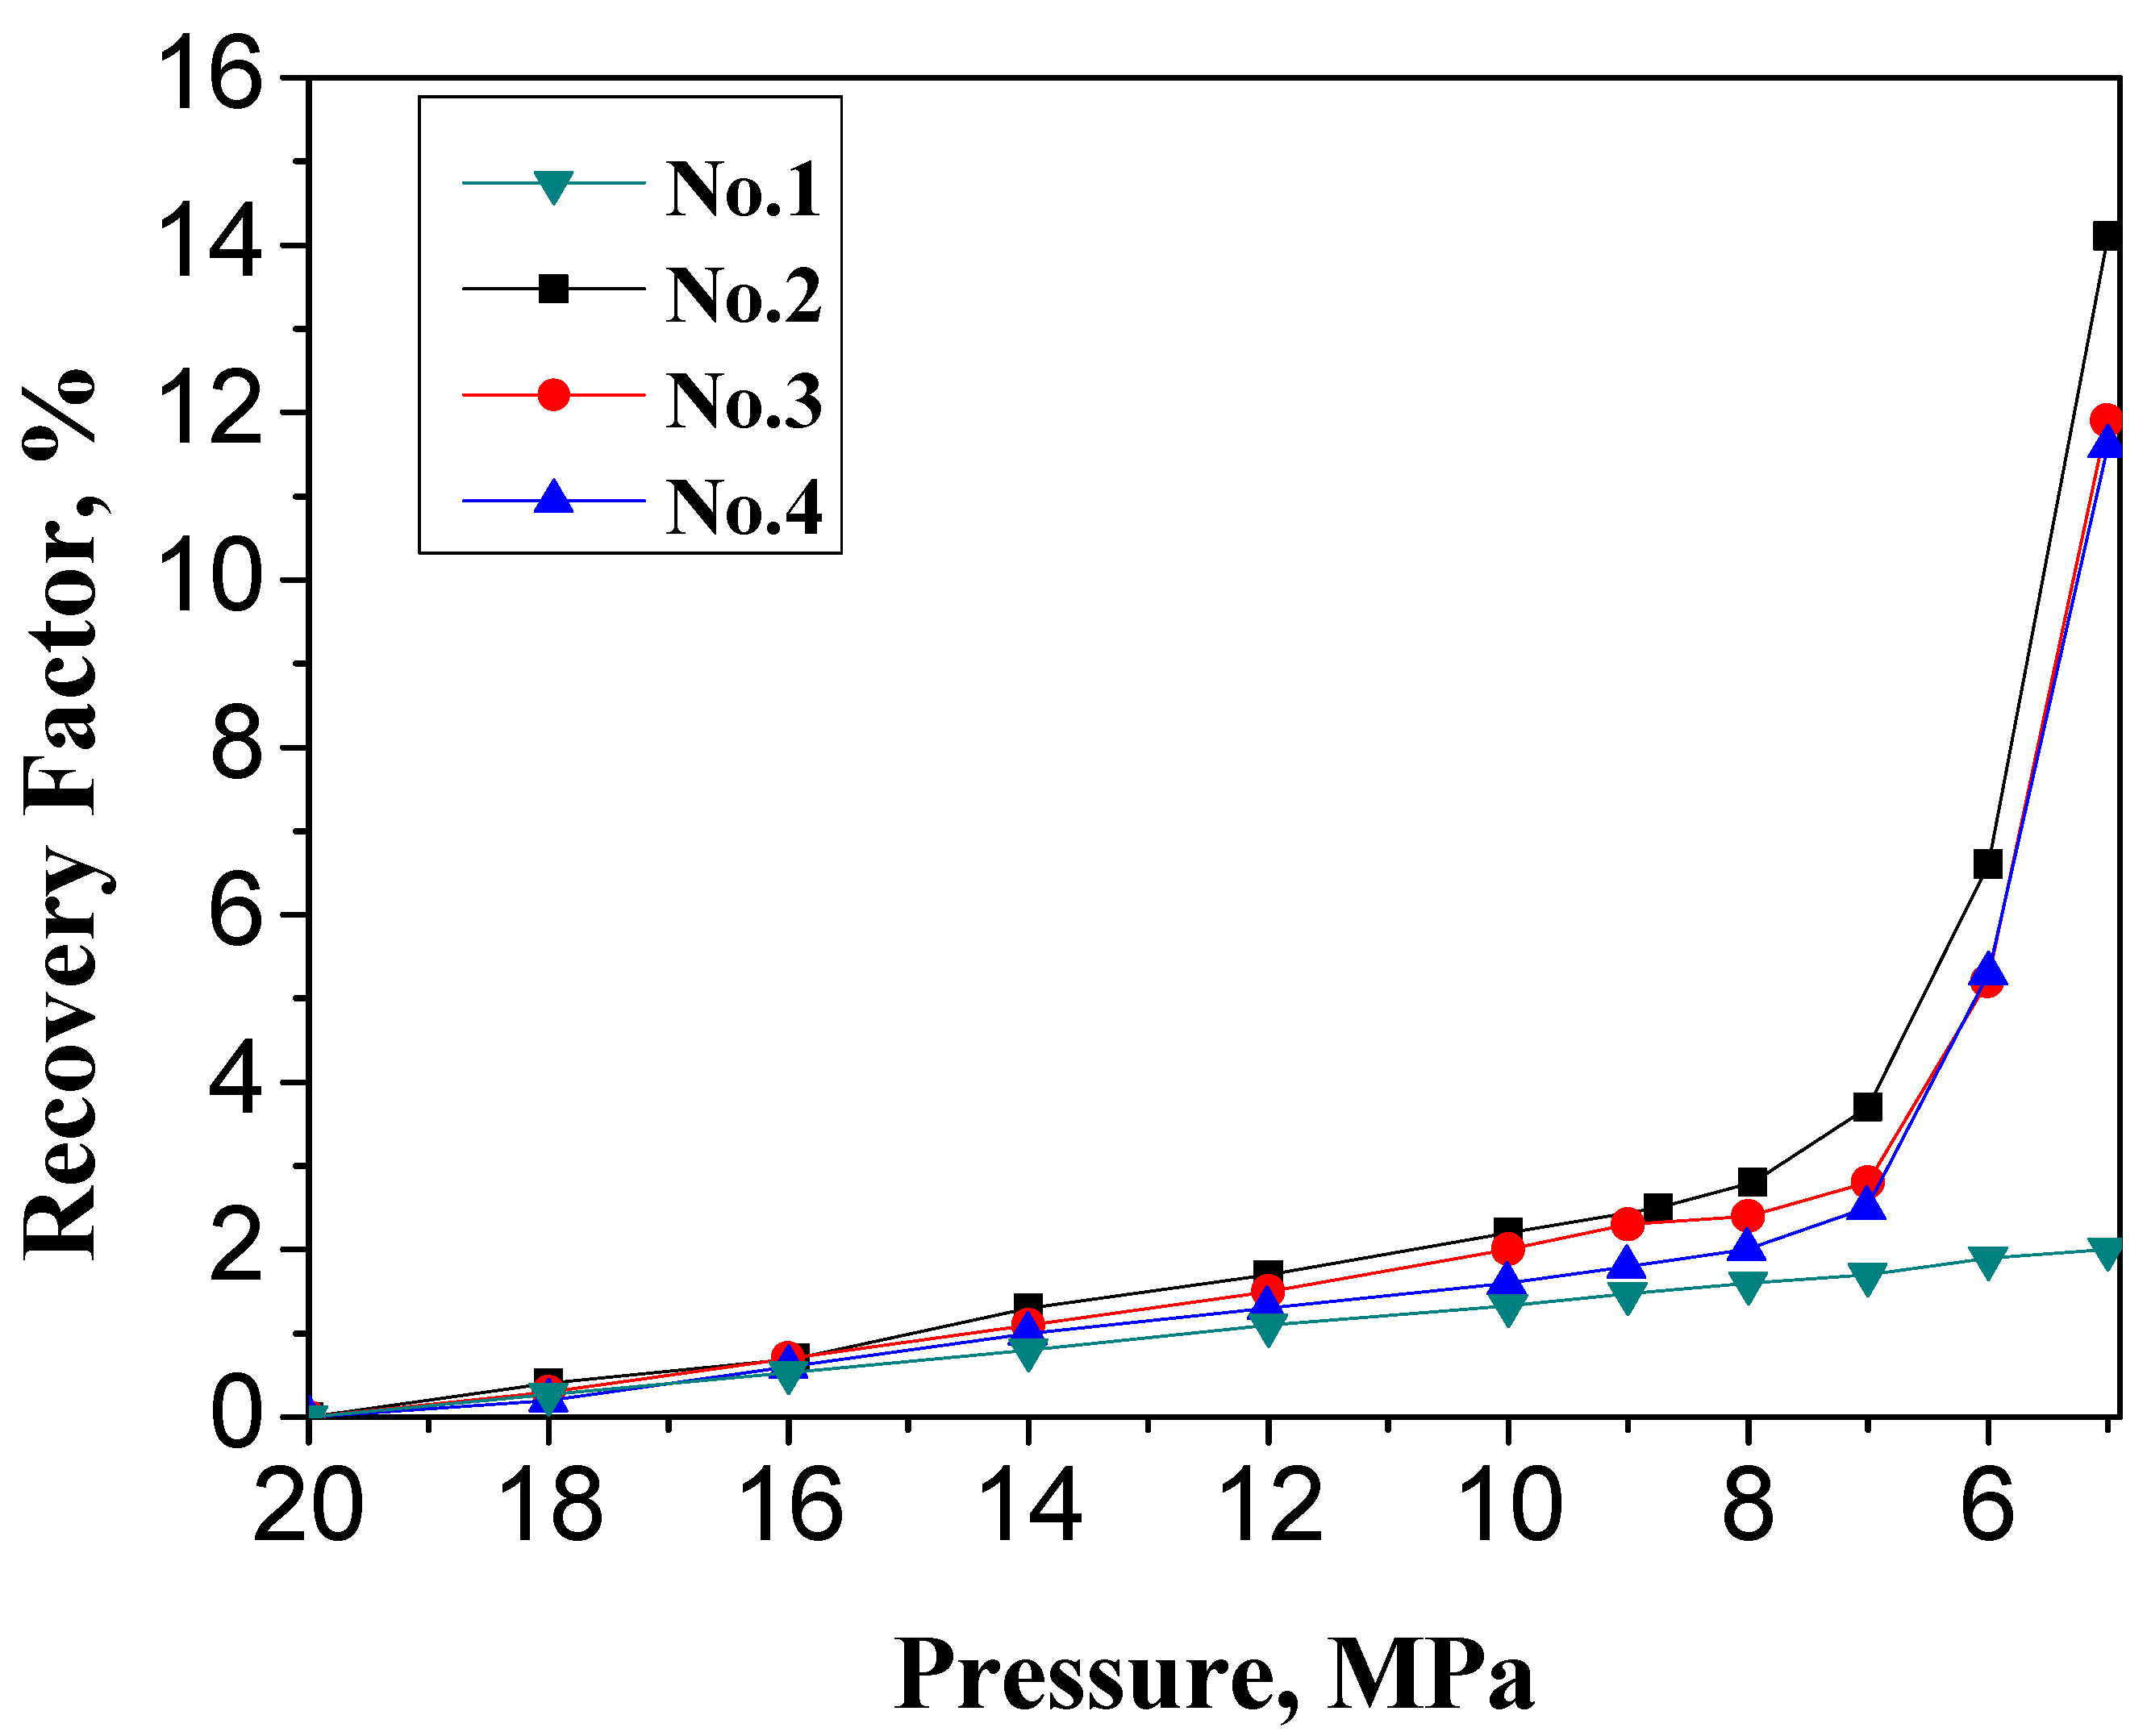
3.2.2. Depletion Experiments at Reservoir Temperature (60 °C)

Five groups of pressure depletion experiments with live oil at reservoir temperature with different initial formation pressure were conducted, and experimental conditions are shown in Table 7. There were three different formation pressure coefficients, i.e. 0.8, 1.25 and 1.5, and the depletion range and time vary from each other.
Figure 9 shows the oil recovery versus pressure depletion degree for the cases with the different initial formation pressure, and the detailed produced oil and gas volume are shown in Table 8. The experimental results demonstrate that ultimate oil recovery increases with increasing initial formation pressure. For the experiments with formation pressure coefficient equal to 0.8, the average ultimate oil recovery by pressure depletion from 16 MPa to 6 MPa was 11.41%. When the formation pressure coefficient was increased to 1.25, the oil recovery increased to 12.35%, but less than 1% oil recovery increment was seen. This is due to the limited elastic energy of fluids and rock. However, when the initial formation pressure was increased to 30 MPa and the final pressure decreased to 5 MPa, the ultimate oil recovery increased to 18.18%. It can be inferred that most of the oil recovery increment is due to the expansion of dissolved gas. When the formation pressure was above the bubble point pressure, the oil recovery was proportional to the pressure depletion degree, and the oil recovery lines were parallel which indicates the same total compressibility of formation. When the formation pressure dropped below the bubble point pressure, the oil recovery increased sharply, also the lower the final pressure, the high oil recovery factor will be.

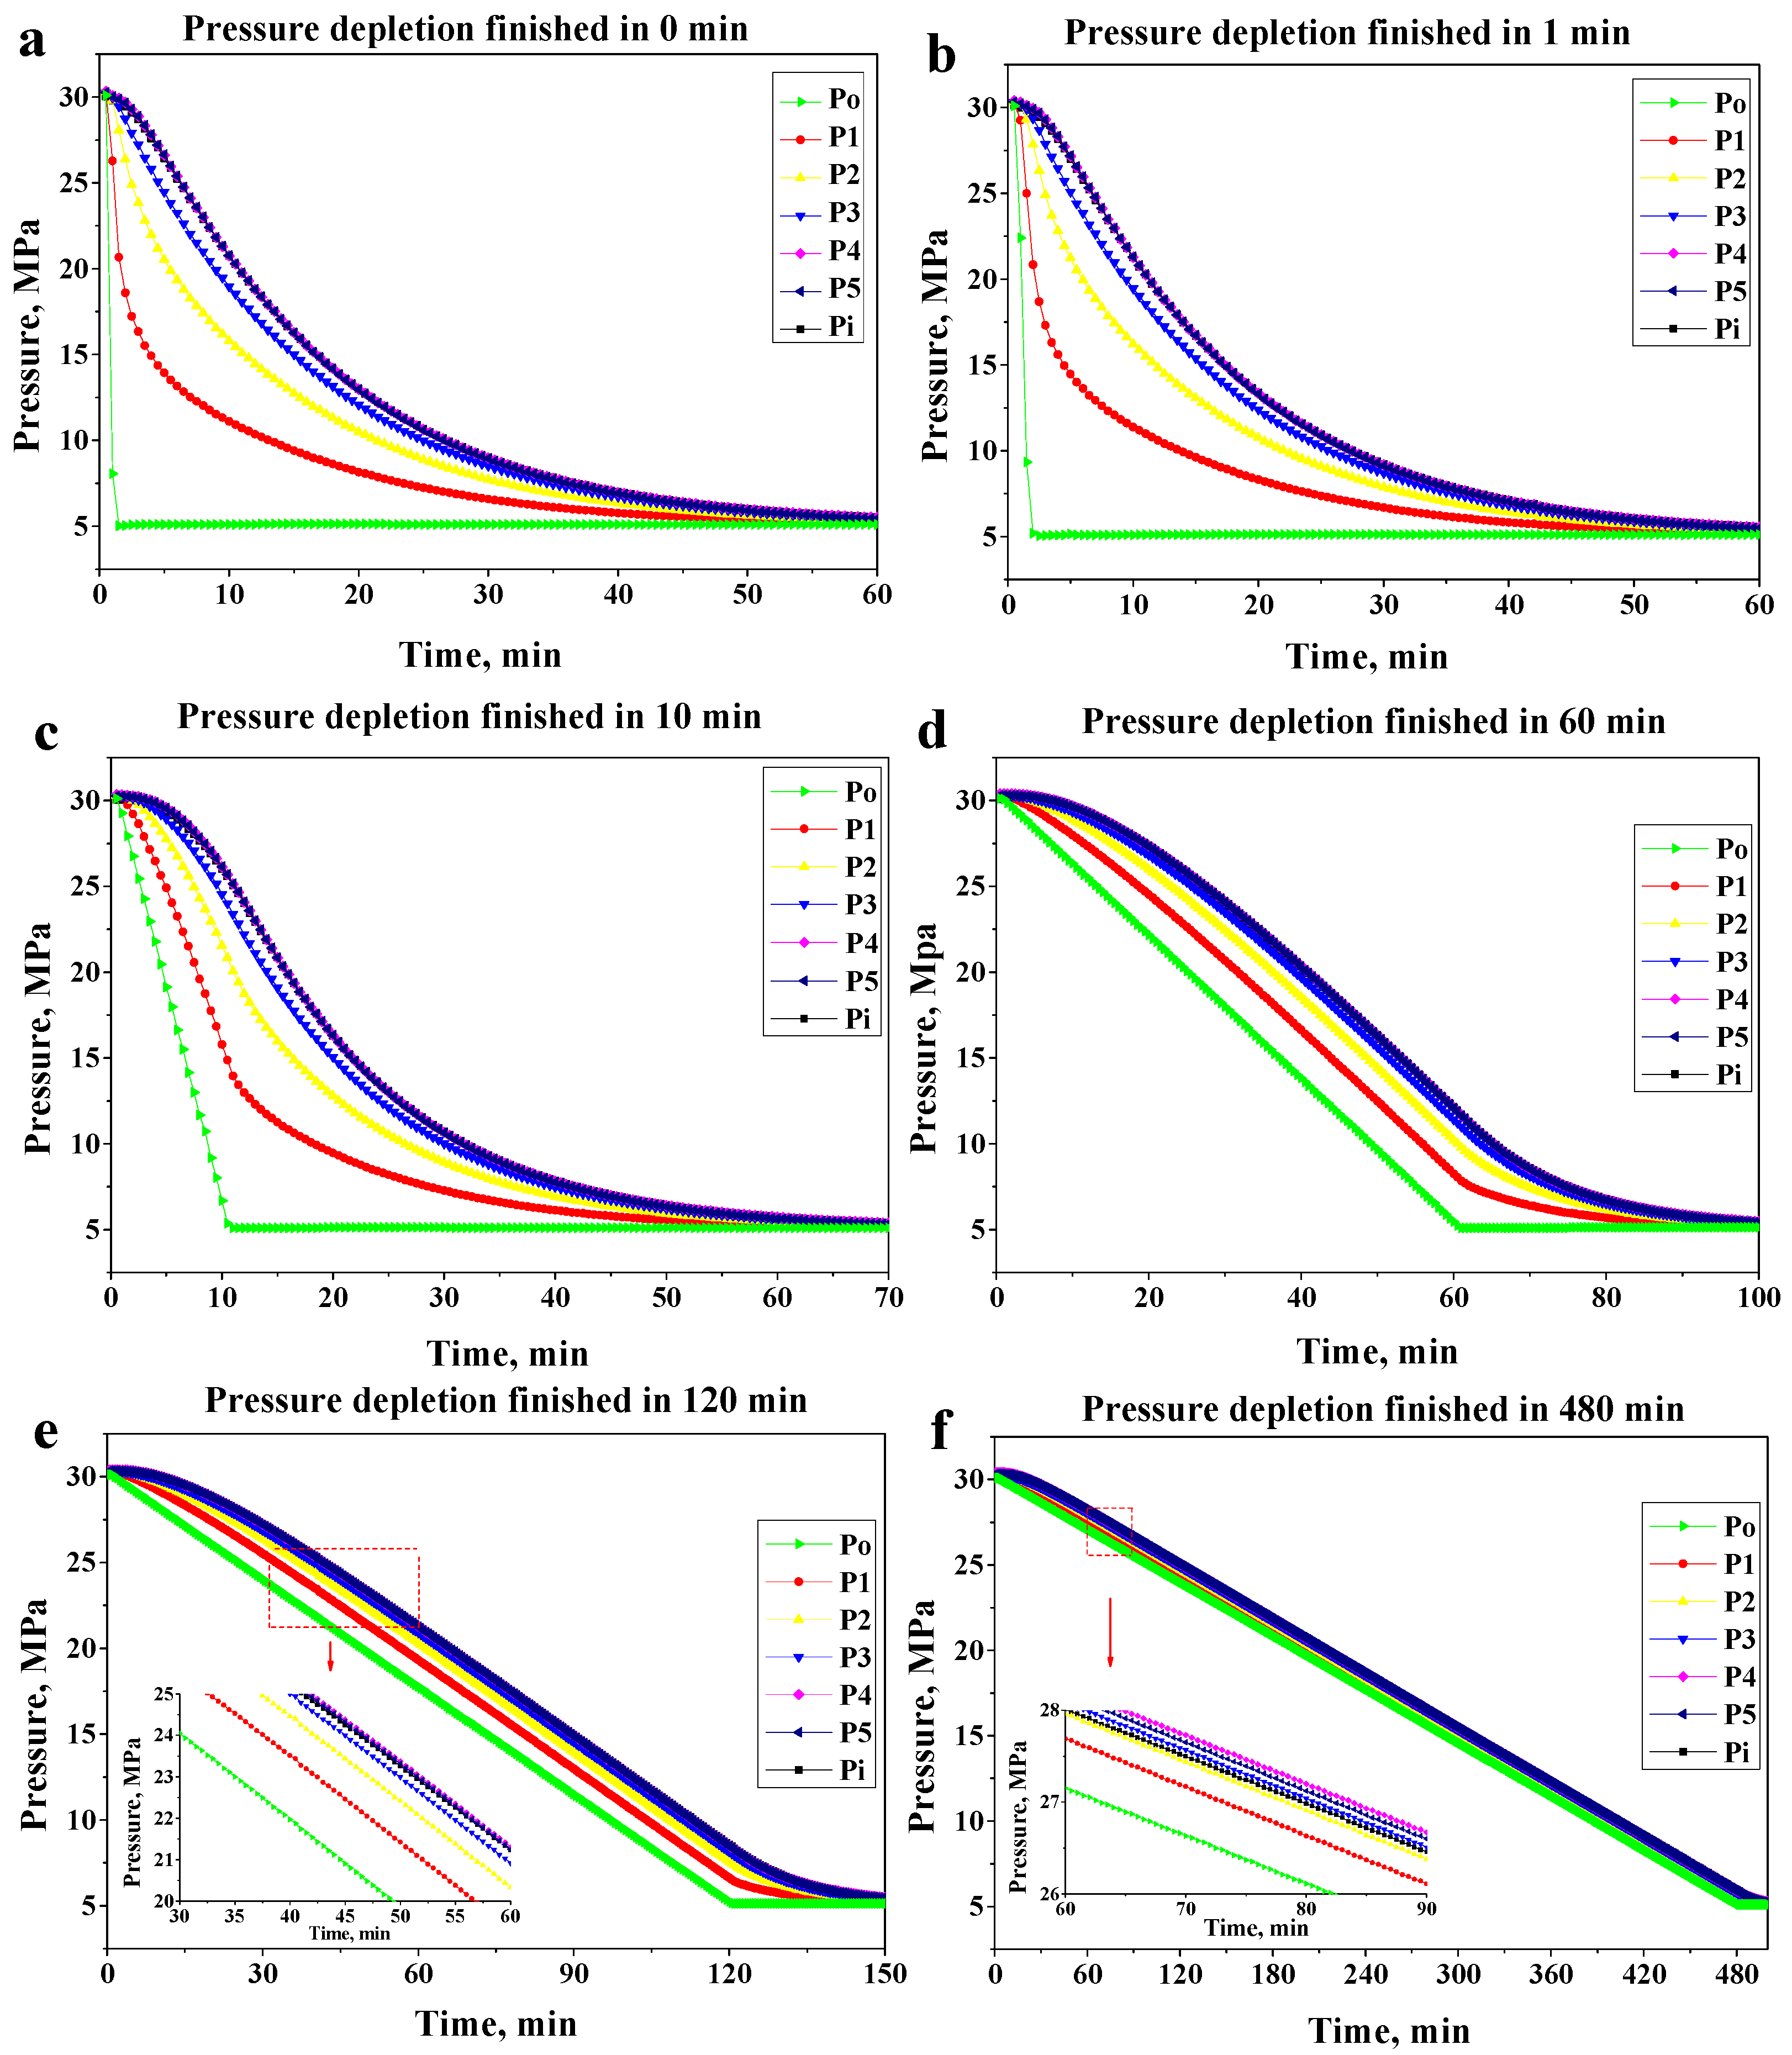
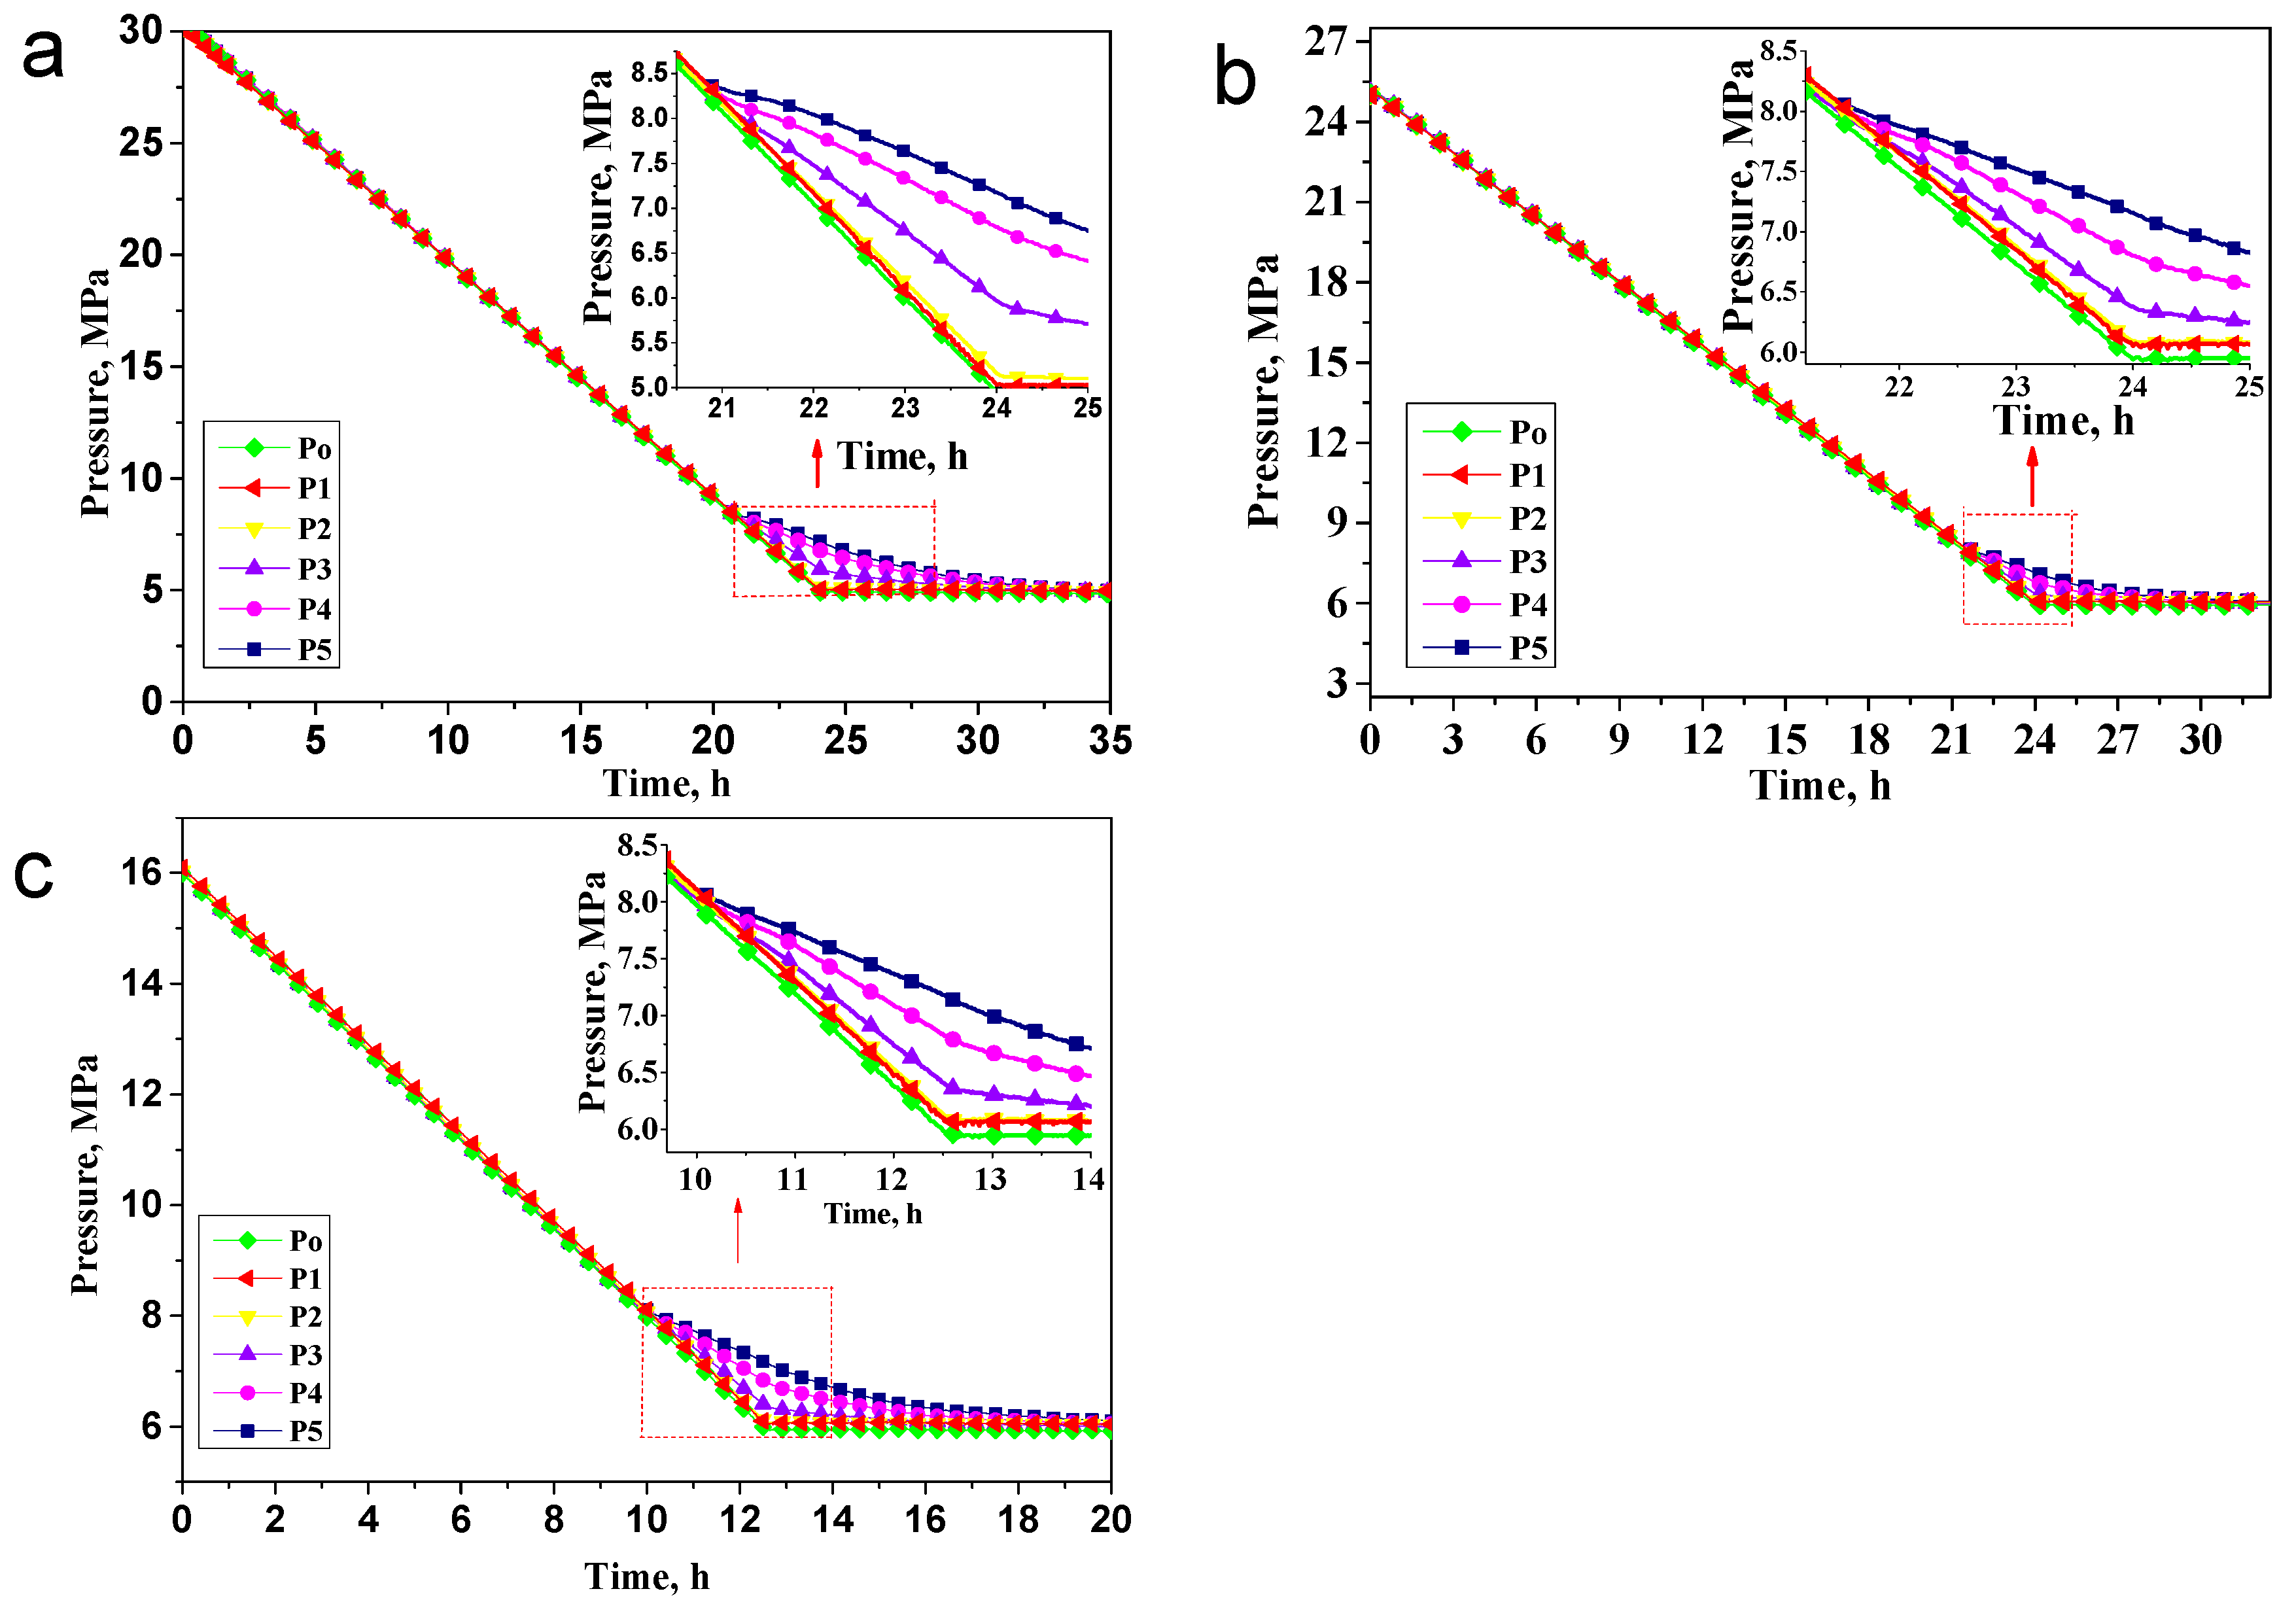
3.2.3. Characteristics of Pressure Propagation of Live Oil Depletion

The pressure distribution along the core holder was monitored during the experiments of pressure depletion using live oil. Figure 10 shows the pressure propagation during the live oil depletion experiments at different formation pressure coefficients. When formation pressure is higher than the bubble point pressure, only single-phase flow exists in the reservoir and the pressure drop of the pressure measurement points are synchronized as the pressure depletion rate is low. The initial stage is similar to the pressure propagation of dead oil depletion with low pressure depletion rate as depicted in Figure 7f. However, when the pressure is lower than the bubble point pressure, there exist pressure differences along the core holder, and the pressure of the measurement point far from the outlet is high than the outlet pressure due to the dissolved gas that comes out of solution. The dissolved gas provides additional pressure gradient to drive oil to the outlet, which in turn increases ultimate oil recovery. The pressure difference along the core holder after gas comes out of solution in Figure 10a is more significant than that in Figure 10b, due to the lower final pressure (5 MPa) which can account for the higher ultimate oil recovery (18.18%). The large pressure differences between measurement points due to more gas coming out of the oil provide larger pressure gradient to enhance oil recovery. The pressure propagation curves in Figure 10 can explain the mechanism of dissolved gas enhancing oil recovery.

4. Discussion

The recovery factor of tight oil depletion is mainly affected by the following factors.

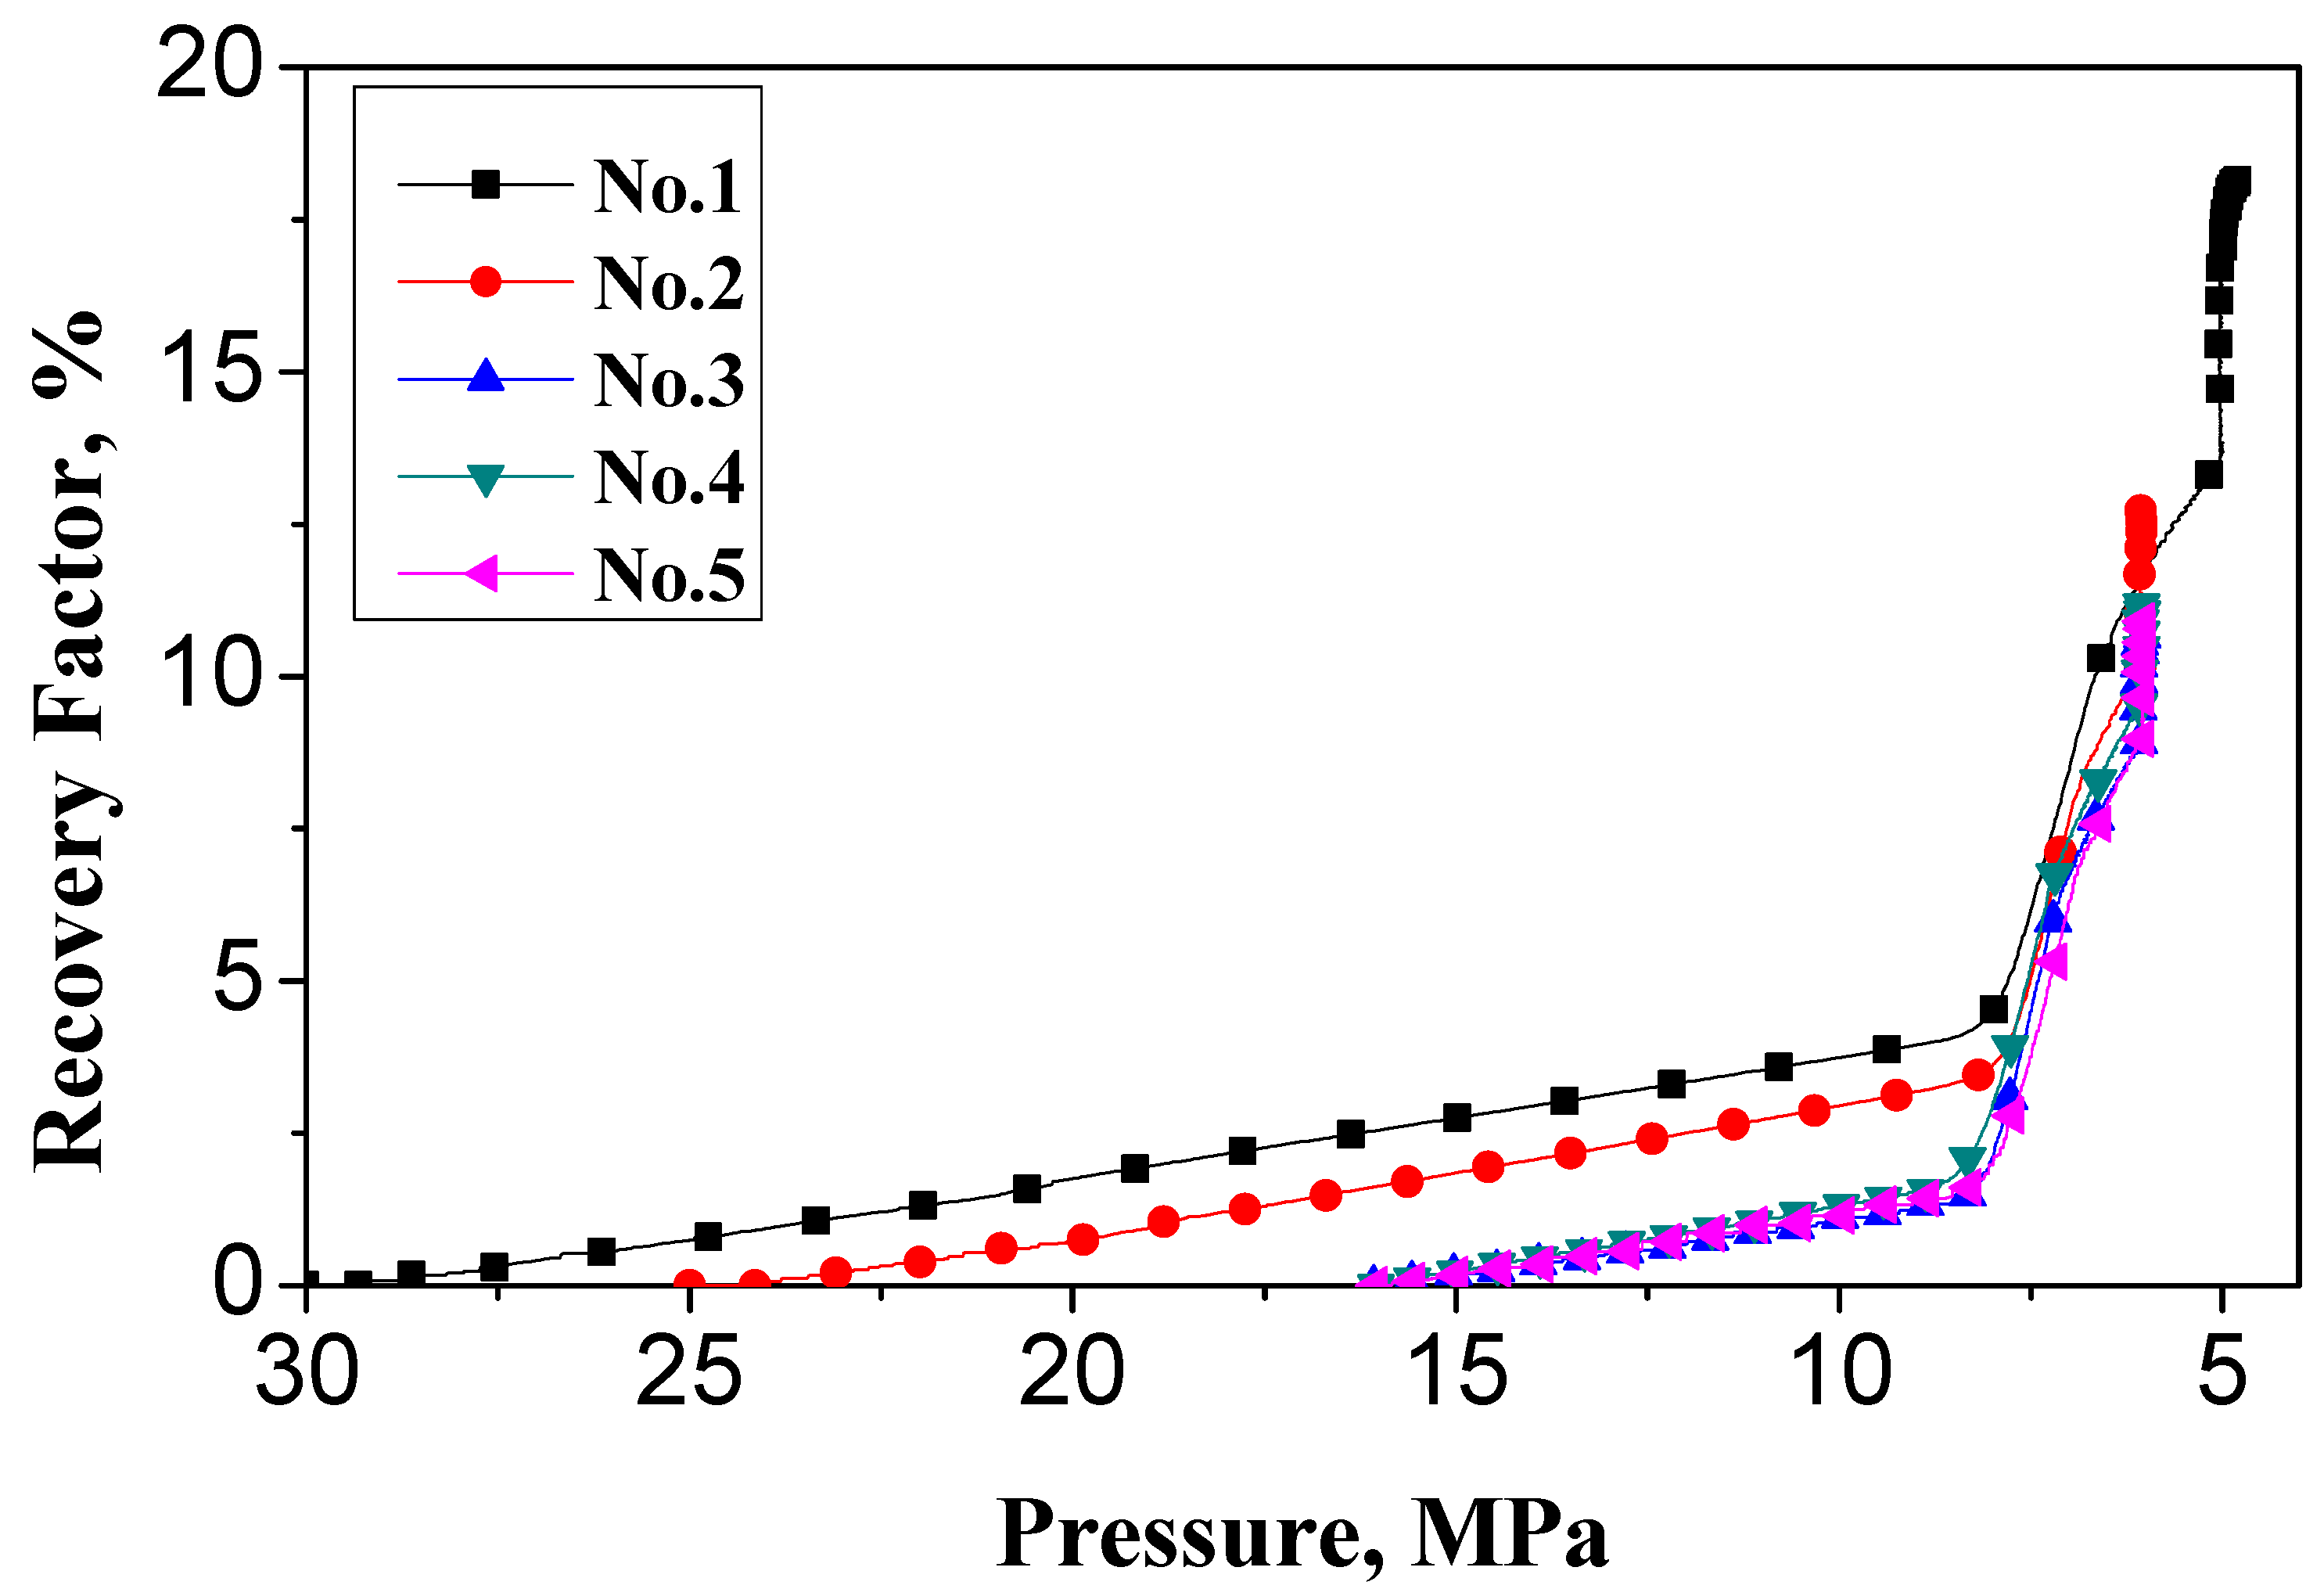
4.1. Effect of Formation Pressure Coefficient on Recovery Factor

Formation pressure coefficient will affect the physical properties of reservoir rock and fluid, mainly reflected on the elastic energy. From the elastic energy equation, the higher the formation pressure coefficient, the higher the elastic energy of the rock and fluid. The recovery factor is higher with depletion that has higher elastic energy. The effect was seen in the experimental results as the recovery factor of dead oil estimated with formation pressure coefficient of 1 was only 2% but 3% for formation pressure coefficient of 1.5, regardless of the different depletion time.

4.2. Effect of the Type of Depletion on Recovery Factor

Many depressurization ways can be used in tight reservoir depletion. Under the same formation pressure, depletion range can be reduced to different pressure values under different depletion times. From our experimental results, both the linear pressure depletion and step-like depletion method had a recovery factor of 2% despite the different depletion method. This means that, different ways of lowering pressure will only affect the rate of oil production, but not the final recovery factor since the elastic energy of the reservoir that releases the fluids is much dependent on the pressure rather than the depressurization method used. The way of lowering the pressure can be determined according to production requirements and equipment conditions.

4.3. Effect of Dissolved Gas on Recovery Factor

The presence of dissolved gas in tight oil reservoirs has a major effect on the recovery of tight oil. This is because when the pressure is higher than the bubble point pressure, gas is completely dissolved in the oil and the fluid in the reservoir is a single phase. In this case, the flow characteristics and the recovery factor of the dead oil and the live oil are basically the same. However, when the reservoir pressure is lower than the bubble point pressure, the dissolved gas is separated from the oil and expanded to form gas-liquid two-phase flow. The continuous expansion of the gas due to pressure decline tends to fills greater portion of the ultra-low rocks pores continuously thereby forcing the oil out of the pore spaces. This will accordingly improve the recovery factor greatly as it was seen that the recovery factor of live oil improved significantly to 18% compared to that of the deal oil which was only about 2–3%.

5. Conclusions

A novel experimental platform for modelling the pressure depletion process in tight oil reservoirs was developed. The developed experimental platform can effectively measure the oil recovery over pressure depletion, and the pressure propagation during depletion can also be recorded. The experimental results showed that pressure depletion without dissolved gas has limited elastic energy and the oil recovery was about 2–3%. In addition, the ultimate oil recovery was dependent on pressure depletion range but not pressure depletion types. The transient pressure propagates slowly in tight formations, and obvious pressure lags exist especially for the reservoir depletion with high pressure depletion rate. Dissolved gas can greatly enhance tight oil recovery when pressure depletes below bubble point pressure, since the ultimate oil recovery reached 11–18%, and it will continue to increase with decreasing final pressure. Pressure propagation curves of live oil depletion experiments demonstrated that the additional pressure gradients due to the evolution of gas out of the oil can account for the significant improvement in the oil recovery.

Author Contributions

Writing-Original Draft Preparation, W.C.; Experiment and Methodology, Z.Z. and X.C.; Project Administration, Q.L.; Writing-Review & Editing, P.O.A.; Data Analysis & Editing, F.W.

Acknowledgments

This work was supported by the National Science and Technology Special Project (Nos. 2016ZX05046 and 2017ZX05013-003), the National Natural Science Foundation of China (Nos. 51604285 and 41330319), and Scientific Research Foundation of China University of Petroleum, Beijing (No. 2462017BJB11).

Conflicts of Interest

The authors declare no conflict of interest.

References

  1. Chew, K.J. The future of oil: Unconventional fossil fuels. Philos. Trans. R. Soc. A 2014, 372, 34. [Google Scholar] [CrossRef] [PubMed]
  2. Wang, J.; Feng, L.; Steve, M.; Tang, X.; Gail, T.E.; Mikael, H. China’s Unconventional Oil: A review of its resources and outlook for long-term production. Energy 2015, 82, 31–42. [Google Scholar] [CrossRef]
  3. Leimkhler, J.; Leveille, G. Unconventional Resources. JSPE 2012, 8, 27–28. [Google Scholar] [CrossRef]
  4. Qiu, Z.; Zou, C.; Li, J. Unconventional Petroleum Resources Assessment: Progress and Future Prospects. NGG 2013, 24, 238–246. [Google Scholar]
  5. Rich, J.; Ammerman, M. Unconventional Geophysics for Unconventional Plays. In Proceedings of the SPE Unconventional Gas Conference, Pittsburg, PA, USA, 23–25 February 2010. [Google Scholar]
  6. Zou, C.; Yang, Z.; Zhang, G. Conventional and Unconventional Petroleum “Orderly Accumulation”: Concept and Practical Significance. PED 2014, 41, 14–27. [Google Scholar] [CrossRef]
  7. Zou, C.N.; Zhai, G.M.; Zhang, G.Y.; Wang, H.J.; Zhang, G.S.; Li, J.Z. Formation, distribution, potential and prediction of global conventional and unconventional hydrocarbon resource. J. Pet. Explor. Dev. 2015, 42, 13–25. [Google Scholar] [CrossRef]
  8. Miller, R.G.; Sorrell, S.R. The future of oil supply. Philos. Trans. R. Soc. A 2014, 372, 20130179. [Google Scholar] [CrossRef] [PubMed]
  9. Zhang, K. Potential technical solutions to recover tight oil. Unpublished Master’s Thesis, Norwegian University of Science and Technology (NTNU), Trondheim, Norway, 2014; p. 147. [Google Scholar]
  10. Zhou, Q.F.; Yang, G.F. Definition and application of tight oil and shale oil terms. Oil Gas Geol. 2012, 3, 541–544. [Google Scholar]
  11. Wang, F.; Yang, K.; Cai, J. Fractal Characterization of Tight Oil Reservoir Pore Structure Using Nuclear Magnetic Resonance and Mercury Intrusion Porosimetry. Fractals 2018, 26, 1840017. [Google Scholar] [CrossRef]
  12. Wang, F.; Liu, Z.; Jiao, L.; Wang, C.; Guo, H. A Fractal Permeability Model Coupling Boundary-Layer Effect For Tight Oil Reservoirs. Fractals 2017, 25, 1750042. [Google Scholar] [CrossRef]
  13. Law, B.E.; Curtis, J.B. Introduction to Unconventional Petroleum Systems. AAPG Bull. 2002, 86, 1851–1852. [Google Scholar]
  14. Lin, S.H.; Zou, C.N.; Yuan, X.J. Status quo of tight oil exploitation in the United States and its implication. Lithol. Reserv. 2011, 23, 25–30. [Google Scholar]
  15. Zou, C.N.; Zhu, R.K.; Wu, S.T. Types, characteristics, genesis and prospects of conventional and unconventional hydrocarbon accumulations: Taking tight oil and tight gas in China as an instance. Acta Pet. Sin. 2012, 33, 173–187. [Google Scholar]
  16. Jia, C.Z.; Zheng, M.; Zhang, Y.F. Unconventional hydrocarbon resources in China and the prospect of exploration and development. Pet. Explor. Dev. 2012, 39, 129–136. [Google Scholar] [CrossRef]
  17. Jia, C.Z.; Zou, C.N.; Tao, S.Z. Assessment criteria, main types, basic features and resource prospects of the tight oil in China. Acta Pet. Sin. 2012, 33, 343–350. [Google Scholar]
  18. Jing, D.; Ding, F. The Exploration and Development of Tight Oil in USA. Land Resour. Inf. 2012, 67, 18–19. [Google Scholar]
  19. Yan, C.Z.; Li, L.G.; Wang, B.F. New Progress of Shale Gas Exploration and Development in North America; Petroleum Industry Press: Beijing, China, 2009. [Google Scholar]
  20. Yu, C.; Guan, P.; Zou, C.; Wei, H.; Deng, K.; Wang, P.; Wu, Y. Formation conditions and distribution patterns of N1 tight oil in Zhahaquan Area, Qaidam Basin, China. Energy Explor. Exploit. 2016, 34, 339–359. [Google Scholar] [CrossRef]
  21. Azari, M.; Hamza, F.; Hadibeik, H.; Ramakrishna, S. Well testing Challenges in Unconventional and Tight Gas Reservoirs. In Proceedings of the SPE Western Regional Meeting, Garden Grove, CA, USA, 22–27 April 2018. [Google Scholar]
  22. Zhao, X.; Liao, X.; Chen, Z.; Mu, L.; Zhang, F.; Zhou, Y.; Zhou, Z.; Zhao, N. A Well Testing Analysis Methodology and Application for Tight Reservoirs. In Proceedings of the Offshore Technology Conference Asia, Kuala Lumpur, Malaysia, 22–25 March 2016. [Google Scholar]
  23. Zou, C.N.; Zhang, G.Y.; Tao, S.Z. Geological features, major discoveries and unconventional petroleum geology in the global petroleum exploration. Pet. Explor. Dev. 2010, 37, 129–145. [Google Scholar]
  24. Sun, Z.D.; Jia, C.Z.; Li, X.F. Unconventional Oil & Gas Exploration and Development (Upper Volume); Petroleum Industry Press: Beijing, China, 2011. [Google Scholar]
  25. Yang, H.; Li, S.; Liu, X. Characteristics and resource prospects of tight oil in Ordos Basin, China. Pet. Res. 2016, 1, 27–38. [Google Scholar] [CrossRef]
  26. Du, J.H.; He, H.Q.; Yang, T.; Li, J.Z.; Huang, F.X.; Guo, B.J.; Yan, W.P. Progress in China’s tight oil exploration and challenges. J. China Pet. Explor. 2014, 19, 1–9. [Google Scholar]
  27. Wei, Y.; Lashgari, H.R.; Wu, K.; Sepehrnoori, K. CO2 injection for enhance oil recovery in Bakken tight reservoirs. J. Fuel 2015, 159, 354–363. [Google Scholar]
  28. Clark, R.; Husain, A.; Rainey, S. Successful Post-fracture Stimulation Well Cleanup and Testing of Tight Gas Reservoir in the Sultanate of Oman. In Proceedings of the SPE Middle East Unconventional Resources Conference and Exhibition, Muscat, Oman, 26–28 January 2015. [Google Scholar]
  29. Jia, H.; Sheng, J.J. Discussion of the feasibility of air injection for enhanced oil recovery in shale oil reservoirs. Petroleum 2017, 3, 249–257. [Google Scholar] [CrossRef]
  30. Hui, P.; Qiquan, R.; Yong, L.; Youngjun, W. Development Strategy Optimization for Different Kinds of Tight oil Reservoirs. In Proceedings of the SPE Kingdom of Saudi Arabia Annual Technical Symposium and Exhibition, Dammam, Saudi Arabia, 24–27 April 2017. [Google Scholar]
  31. Manrique, E.J.; Thomas, C.P.; Ravikiran, R.; Kamouei, M.I.; Lantz, M.; Romero, J.L.; Alvarado, V. EOR: Current Status and Opportunities. In Proceedings of the SPE Improved Oil Recovery Symposium, Tulsa, OK, USA, 24–28 April 2010. [Google Scholar]
  32. Christensen, J.R.; Stenby, E.H.; Skauge, A. Review of WAG Field Experience. SPE Reserv. Eval. Eng. 2001, 4. [Google Scholar] [CrossRef]
  33. Huffman, B.T. Comparison of various gases for enhance recovery from shale oil reservoirs. In Proceedings of the SPE Improved Oil Recovery Symposium, Tulsa, OK, USA, 14–18 April 2012. [Google Scholar]
  34. Hawthorne, S.B.; Gorecki, C.D.; Sorensen, J.A.; Steadman, E.N.; Harju, J.A.; Melzer, S. Hydrocarbon Mobilization Mechanism from Upper, Middle, and Lower Bakken Reservoirs Rocks Exposed to CO2. In Proceedings of the SPE Unconventional Resources Conference Canada, Calgary, AB, Canada, 5–7 November 2013. [Google Scholar]
  35. Noureldien, D.M.; El-Banbi, A.H. Using Artificial Intelligence in Estimating Oil Recovery Factor. In Proceedings of the SPE North Africa Technical Conference and Exhibition, Cairo, Egypt, 14–16 September 2015. [Google Scholar]
  36. Demirmen, F. Reserves Estimation: The Challenge for the Industry. J. Pet. Technol. 2007, 59, 10. [Google Scholar] [CrossRef]
  37. Male, F.; Marder, M.; Browning, J.; Gherabati, A.; Ikonnikova, S. Production Decline Analysis in the Eagle Ford. In Proceedings of the SPE/AAPG/SEG Unconventional Resources Technology Conference, San Antonio, TX, USA, 1–3 August 2016. [Google Scholar]
  38. Swindell, G.S. Eagle Ford Shale—An Early Look at Ultimate Recovery. In Proceedings of the SPE Annual Technical Conference and Exhibition, San Antonio, TX, USA, 8–10 October 2012. [Google Scholar]
  39. Kanfar, M.; Wattenbarger, R. Comparison of Empirical Decline Curve Methods for Shale Wells. In Proceedings of the SPE Canadian Unconventional Resources Conference, Calgary, AB, Canada, 30 October–1 November 2012. [Google Scholar]
  40. Moridis, N.; Soltanpour, Y.; Medina-Cetina, Z.; Lee, W.J.; Blasingame, T.A. A Production Characterization of the Eagle Ford Shale, Texas—A Bayesian Analysis Approach. In Proceedings of the SPE Canadian Unconventional Resources Conference, Calgary, AB, Canada, 30 October–1 November 2017. [Google Scholar]
  41. Reisz, M.R. Reservoir Evaluation of Horizontal Bakken Well Performance on the Southwestern Flank of the Williston Basin. In Proceedings of the International Meeting on Petroleum Engineering, Beijing, China, 24–27 March 1992. [Google Scholar]
  42. Bohrer, M.; Fried, S.; Helms, L.; Hicks, B.; Juenker, B.; McCusker, D.; Anderson, F.; LeFever, J.; Murphy, E.; Nordeng, S. State of North Dakota Bakken Formation Resource Study Project. Appendix C. Available online: https://www.legis.nd.gov/assembly/60-2007/docs/pdf/ts063008appendixc.pdf (accessed on 21 June 2018).
  43. Clark, A.J. Determination of recovery factor in the Bakken formation, Mountrail County, ND. In Proceedings of the SPE Annual Technical Conference and Exhibition, New Orleans, LA, USA, 4–7 October 2009. [Google Scholar]
  44. Ghaderi, S.M.; Clarkson, C.R.; Kaviani, D. Investigation of Primary Recover in Tight Oil Formations: A Look at the Cardium Formation, Alberta. In Proceedings of the Canadian Unconventional Resources Conference, Calgary, AB, Canada, 15–17 November 2011. [Google Scholar]
  45. Xu, Q.; Zhu, D.; Ling, H.; Gao, T.; Wang, X. Fractures Parameters Optimization of the Depletion in Fractured Horizontal Wells for Ultra-low Permeability Reservoir. J. Unconv. Oil Gas 2014, 1, 37–42. [Google Scholar]
  46. Xu, Y.; Yang, S.; Zhang, Z.; Han, W. Study on Mining Failure Law of Tight reservoir. J. Liaoning Shihua Univ. 2017, 37, 37–41. [Google Scholar]
  47. Kabir, C.S.; Rasdi, M.F.; Igboalisi, B.O. Analyzing Production Data from Tight-oil Wells. In Proceedings of the Canadian Unconventional Resources and International Petroleum Conference, Calgary, AB, Canada, 19–21 October 2010. [Google Scholar]
  48. Dechongkit, P.; Prasad, M. Recovery Factor and Reserves Estimation in the Bakken Petroleum System (Analysis of the Antelope, Pronghorn and Parshall fields). In Proceedings of the Canadian Unconventional Resources and International Petroleum Conference, Calgary, AB, Canada, 15–17 November 2011. [Google Scholar]
  49. Turbakov, M.; Shcherbakov, A. Determination of Enhanced Oil Recovery Candidate Fields in the Volga-Ural Oil and Gas Region Territory. Energies 2015, 8, 11153–11166. [Google Scholar] [CrossRef] [Green Version]
  50. Zhao, W.Q.; Yao, C.J.; Wang, X.D.; Zhou, R.P. Determination of oil recovery factor under the condition of exhaustion mining. J. Foreign Oil Field Eng. 2010, 26, 1–2. [Google Scholar]
  51. Yuan, Z.; Wang, J.; Li, S.; Ren, J.; Zhou, M. A new approach to estimating recovery factor for extra-low permeability water-flooding sandstone reservoirs. Pet. Explor. Dev. 2014, 41, 1–10. [Google Scholar] [CrossRef]
  52. Li, A.; Zhang, Z.; Cui, C.; Sun, R.; Yao, T. Petrophysics; China University of Petroleum Press: Qingdao, China, 2011; p. 331. [Google Scholar]
  53. Jiang, H.; Yao, J.; Jiang, R. Principles and Methods of Reservoir Engineering; China University of Petroleum Press: Qingdao, China, 2006; p. 141. [Google Scholar]
Figure 1. Core samples used in the experiment.
Energies 11 02667 g001
Figure 2. Schematic diagram of the experimental setup.
Energies 11 02667 g002
Figure 3. A schematic diagram for the oil production measurement during pressure depletion.
Energies 11 02667 g003
Figure 4. Pressure, oil production rate and recovery factor of six different kinds of linear pressure depletion. (a) Pressure depletion with different depletion rate; (b) Oil production rate with different depletion rate; (c) Oil recovery factor with different depletion rate.
Energies 11 02667 g004
Figure 5. Pressure, production rate and oil recovery of the step-like pressure depletion experiment. (a) Pressure change with time; (b) Oil production rate change with time; (c) Oil recovery factor change with time.
Energies 11 02667 g005
Figure 6. Results of the linear pressure depletion experiments. (a) Pressure depletion with different depletion rate; (b) Oil production rate with different depletion rate; (c) Oil recovery factor with different depletion rate.
Energies 11 02667 g006
Figure 7. Characteristics diagram of pressure propagation during depletion experiments. (a) Pressure depletion finished in 0 min; (b) Pressure depletion finished in 1 min; (c) Pressure depletion finished in 10 min, (d) Pressure depletion finished in 60 min; (e) Pressure depletion finished in 120 min; (f) Pressure depletion finished in 480 min.
Energies 11 02667 g007
Figure 8. Recovery factor of live and dead oil depletion.
Energies 11 02667 g008
Figure 9. Recovery factor of live oil depletion under different pressure coefficient.
Energies 11 02667 g009
Figure 10. Pressure propagation characteristic of depletion experiments with different pressure depletion range (a) pressure depletion from 30 MPa to 5 MPa; (b) pressure depletion from 25 MPa to 6 MPa; (c) pressure depletion from 16 MPa to 6 MPa.
Energies 11 02667 g010
Table 1. The density and viscosity of kerosene used in the experiments at room and reservoir temperature.
Temperature (°C)Density (g/cm3)Viscosity (mPa·s)
20.10.7541.44
600.7250.86
Table 2. The parameters of core samples used in the experiments.
SampleLength
(cm)
Diameter
(cm)
Porosity
(%)
Porosity Volume
(L)
Air Permeability
(mD)
A228.9599.97910.4200.2360.350
A329.2649.97510.6700.2350.320
AB130.069.90613.1800.3050.300
Total88.3--0.776-
Table 3. Linear pressure depletion experiment with six different depletion rates.
No.Temperature
(°C)
Pressure Depletion Range (MPa)Depletion Time
(min)
Pressure Depletion Rate
(MPa/min)
Initial Pressure Final Pressure
120.1205101.50
220.1205200.75
320.1205300.50
420.1205400.38
520.1205500.30
620.1205600.25
Table 4. Experimental conditions of step-like pressure depletion.
No.Temperature
(°C)
Pressure Depletion Range (MPa)Depletion Time
(min)
Pressure Depletion Rate
(MPa/min)
Initial PressureFinal Pressure
120.12015608.33 × 10−2
220.11510608.33 × 10−2
320.1105608.33 × 10−2
420.150608.33 × 10−2
Table 5. Experimental conditions of linear pressure depletion with different pressure depletion rate for the cases of formation pressure coefficient equal to 1.5.
No.Temperature
(°C)
Pressure Depletion Range (MPa)Depletion Time
(min)
Pressure Depletion Rate
(MPa/min)
Initial PressureFinal Pressure
120.13050
220.1305125.0
320.1305102.5
420.1305604.2 × 10−1
520.13051202.1 × 10−1
620.13051801.4 × 10−1
720.13052401.0 × 10−1
820.13054805.2 × 10−2
Table 6. The experimental parameters with dissolved gas.
No.Oil TypeGOR
(m3/m3)
Saturation Pressure
(MPa)
Pressure Depletion Range (MPa)Depletion Time
(min)
Pressure Depletion Rate
(MPa/min)
Initial PressureFinal Pressure
1dead oil 2052400.0625
2live oil909.12052400.0625
3live oil909.12052400.0625
4live oil909.12052400.0625
Table 7. Experimental conditions of live oil depletion under different initial formation pressure.
No.Formation Pressure CoefficientPressure Depletion Range (MPa)Depletion Time
(min)
Pressure Depletion Rate
(MPa/min)
Oil TypeGOR
(m3/m3)
Saturation Pressure
(MPa)
Initial PressureFinal Pressure
11.530514400.0173live oil508.85
21.2525614400.0132live oil508.85
30.81667500.0133live oil508.85
40.81667500.0133live oil508.85
50.81667500.0133live oil508.85
Table 8. Experimental results of live oil depletion under different initial formation pressure.
No.Produced Gas Volume
(mL)
Produced Oil Volume
(mL)
Ultimate Oil Recovery Factor
(%)
111,827.8133.7218.18
25660.2888.6212.35
35496.1177.611.27
46364.3279.611.56
55234.478.4211.39

