Hydrogen Fuel Cell Road Vehicles: State of the Art and Perspectives

GeePs, Group of Electrical Engineering—Paris, UMR CNRS 8507, CentraleSupélec, Univ. Paris-Sud, Univ. Paris-Saclay, Sorbonne Université, 3 rue Joliot-Curie, 91192 Gif-sur-Yvette, France
Energies 2020, 13(21), 5843; https://0-doi-org.brum.beds.ac.uk/10.3390/en13215843
Submission received: 22 September 2020
/
Revised: 2 November 2020
/
Accepted: 6 November 2020
/
Published: 9 November 2020
(This article belongs to the Special Issue Design, Diagnosis and Control and Social Acceptance of Battery, Solar Cell and Fuel Cell System)
Abstract
:Driven by a small number of niche markets and several decades of application research, fuel cell systems (FCS) are gradually reaching maturity, to the point where many players are questioning the interest and intensity of its deployment in the transport sector in general. This article aims to shed light on this debate from the road transport perspective. It focuses on the description of the fuel cell vehicle (FCV) in order to understand its assets, limitations and current paths of progress. These vehicles are basically hybrid systems combining a fuel cell and a lithium-ion battery, and different architectures are emerging among manufacturers, who adopt very different levels of hybridization. The main opportunity of Fuel Cell Vehicles is clearly their design versatility based on the decoupling of the choice of the number of Fuel Cell modules and hydrogen tanks. This enables manufacturers to meet various specifications using standard products. Upcoming developments will be in line with the crucial advantage of Fuel Cell Vehicles: intensive use in terms of driving range and load capacity. Over the next few decades, long-distance heavy-duty vehicles and fleets of taxis or delivery vehicles will develop based on range extender or mild hybrid architectures and enable the hydrogen sector to mature the technology from niche markets to a large-scale market.
1. Introduction: Hydrogen at the Service of a New Mobility?
Mobility is undergoing profound societal modifications (car-sharing, car-pooling, selective traffic restrictions in city centers, etc.) and technological changes (the French market share of electrically rechargeable vehicles already reached 2.5% in 2019). Gasolines—liquid fuels that have a very large energy density (a high value of heat combustion around ), are easy to transfer (recharging time <5 min) and easy to store (plastic tanks shaped to fit the passenger compartment)—have been the hegemonic energy resource of road vehicles for over a century. This long lifetime has made it possible to optimize the internal combustion engine, a power converter whose efficiency, mass and volume power densities have greatly increased over this time, allowing a substantial vehicle volume growth which has maximized comfort, safety and social status criteria. This growth has increased this use as transport to the point of creating particularly acute public health problems in large urban centers. Based on compelling scientific evidence, the World Health Organization (WHO, Geneva, Switzerland) has classified diesel emissions as a definite carcinogen in 2012 [1,2].
However, taxation based on emissions (e.g., financial penalties imposed in the euro zone to manufacturers in the event they do not comply with a threshold of average consumption on sales) and standards (Euro6; China6, which is even more stringent and structuring for the world market given the involved volumes...) require car manufacturers to seek viable solutions on a large scale that do not emit carbon dioxide and pollutants (nitrogen oxides, fine particles, etc.) at the point of use. At the same time, although world oil reserves have been estimated at 50 years of contemporary consumption [3], the return on energy investment [4] of oil deposits is constantly deteriorating [5,6], leading to the search for another model of mobility based on renewable energies (i.e., intermittent energy sources based on short-term solar radiation, i.e., solar, biomass, wind, hydro, etc.) rather than stock energies (such as uranium, coal, oil and natural gas).
In a limited economic and geographical area, the electric operation is ideal due to the silence of the electric machine as well as its high efficiency (>90 to 95% over a wide power range) and its power reversibility associated with the excellent charge–discharge efficiency of Li-Ion batteries (>90 to 95%) [7]. This efficient two-way power reduces the overall consumption of trips by recovering braking energy in the urban cycle (individual vehicle on commuting trips, local buses, delivery trucks, etc.). On the other hand, intensive use (taxis, car-sharing, deliveries) and long road journeys (interurban transport) come up against a requirement for high energy storage. This leads to a significant increase in the battery mass, because the latter carries on its electrodes the chemistry reactants necessary for future electrochemical conversion. The first barrier is the increase in the transported no load mass, which has a negative impact on the ownership cost, the consumption and the power of the traction chain. When calculating the fair speed range, the road vehicle energy consumption is roughly proportional to its mass. For a passenger urban vehicle, it is estimated at between and and increases beyond [7]. Hence, consuming of mechanical energy permits to travel with a car. The second obstacle consists in the recharging time increase (and therefore the decrease in the vehicle’s availability time limiting the possibility of intensive use) and/or the need for very high recharging powers, which affects the stability of the electricity network as well as the cost of the related infrastructure and therefore the cost of using the battery electric vehicle (BEV) solution. On-road recharging solutions using an overhead contact line with catenary suspension (tested on a section of German motorway near Frankfurt) or energy transmission by magnetic induction (100-metre prototype road set up by QUALCOMM and VEDECOM in Versailles, France) enable to consider a reduction in on-board capacity at the cost of a considerable increase in infrastructure complexity and a reduction in charging efficiency [8]. It is therefore accepted that in the medium term of a few decades, this market segment will be difficult to satisfy with current and developing battery vehicle technologies [9].
While retaining the interest of electric traction, the use of a fuel cell system (FCS) to carry out the bulk of the electrochemical conversion is a lever to break the vicious circle described above: autonomy → mass power → consumption [10]. With this solution, storage is offset in a tank optimized only to efficiently store the highest mass and volume densities of reactants and allow rapid recharging at the end of use (~min). Moreover, one of the reactants can be not stored on-board by technological means since the dioxygen can be drawn from the ambient air on demand. Thus, the autonomy increase induces a very restricted on-board mass rise, limiting the effect on traction power. Moreover, since the hydrogen tank is not the critical system part, increasing its capacity has a low impact on the overall ownership cost. Finally, energy recharge is very fast since it only requires filling the small on-board tank by transferring dihydrogen gas from a large stationary tank. This is a key aspect for intensive use (inter-city trucks, taxis, car sharing, etc.) and a driver for integrating FCS in mobility objects. For instance, the Nexo designed by Huyndai is equipped with three high-pressure tanks which enables a high drive range ( based on WLTC cycle) and shows the versatility of this type of storage.
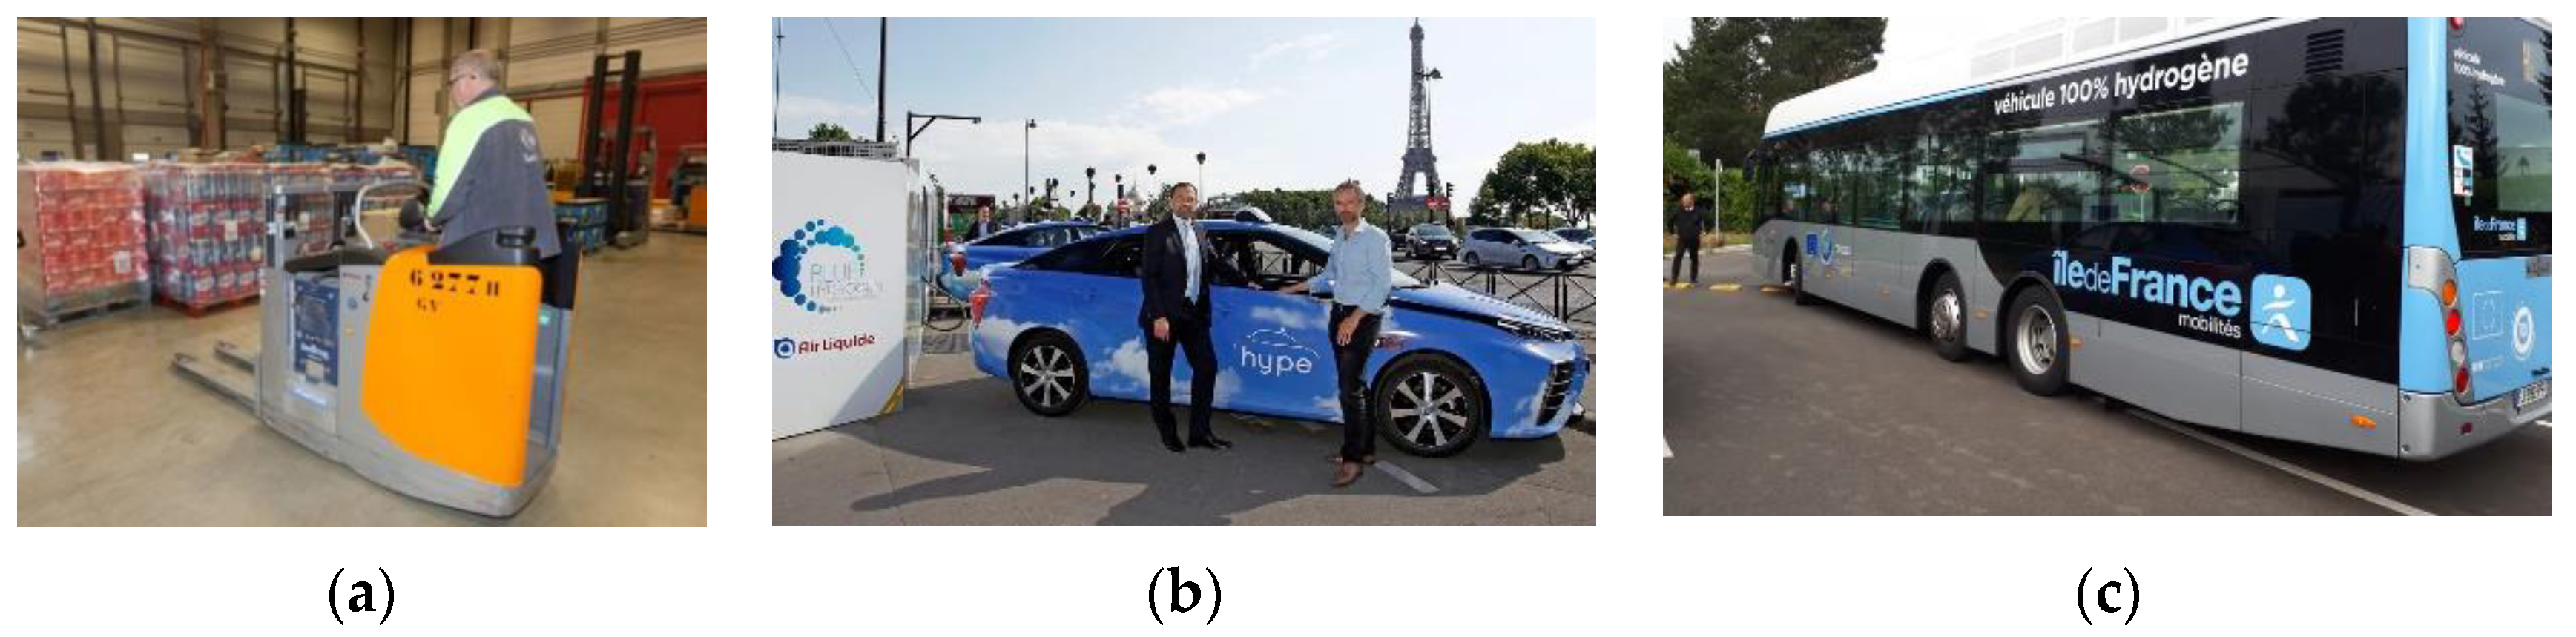
Although the fuel cell (FC) principle is quite old (discovered in the mid-19th century), its technological optimization with an industrial purpose started late (second half of the 20th century) in the extremely narrow market of manned space flight (i.e., outside any cost constraint). At the turn of the century, some car manufacturers (GM, Detroit, MI, USA; Daimler, Stuttgart, Germany; PSA, Velizy-Villacoublay, France; Toyota, Aichi, Japan, etc.) launched research programs to bring this technological brick to the maturity of a mass market product. In 2020, it is clear that the goal of technological maturity is about to be achieved, as vehicle integration has been proven in several applications. Toyota, Hyundai and Honda Asian manufacturers have been manufacturing and marketing pre-production fuel cell vehicles (FCV) for several years. The market is currently subsidized (as indeed is the entire electric vehicle market worldwide), with particularly strong support in China (since 2019, about subsidy per hydrogen car!). In Paris, France, the Hype taxi fleet operates intensively (several drivers per vehicle) 130 vehicles (early 2020) and intends to manage nearly 600 such vehicles in the late 2020. The whole fleet relies on four recharging stations in and around Paris (Pont de l’Alma, Orly, Roissy and Loges-en-Josas). Other experiments are also taking place in the heavy truck sector: in Versailles, France, two FC buses have just been put into circulation, while the French railway company (SNCF) has just ordered 15 hydrogen-powered regional trains from the Alstom group. Since 2018, the latter has already been experimenting this concept on German rail infrastructure on a 100 km section located in Lower Saxony. On the other hand, another application is developing without media attention, and without subsidies: the market for indoor handling trucks. For 3 × 8 and 7 days a week use, it is already more economical to have a single hydrogen-powered forklift than to need two battery-powered forklifts (one for use and the other one for recharging). In France, for instance, the Carrefour group’s logistics platform in Vendin-en-Vieil operates 137 FC-powered electric forklifts. Figure 1 illustrates some of these pioneering applications of dihydrogen use for electric road mobility.
This article describes the general principle of the FCS embedded in road vehicles for traction purpose. It gives precise insights of the actual implementations as well as the future trends to enhance their system performance in terms of size, cost and lifetime. Indeed, considering only the energy performance criterion, FCVs have intermediate performances between BEVs and internal combustion engine vehicles (ICEVs). However, in order to succeed in the fiercely contested vehicle market, many other functionality criteria must be met, such as easy fueling, cabin space for passenger cars and load capacity for duty vehicles, low purchasing price and low maintenance cost, no polluting gas emissions to be able to drive in urban centers, safe operation. Cost and lifetime and, to a lesser extent, vehicle integration are the current hurdles that still need to be overcome to make FCVs a viable alternative to BEVs and ICEVs. The avenues of progress to concretely meet these challenges are addressed showing that FCVs are meant for large driving range cars, utility vehicles and long-distance heavy-duty vehicles.
The rest of this paper is organized as follows: Section 2 presents FC principles and stresses the special characteristics and specific requirements of hydrogen FCV applications. Section 3 gives a comprehensive overview of the on-board FC and underlines the status and the perspectives of each of its elements. Section 4 extends the analysis to include the on-board FCS and details its components. This helps us to clearly understand the FCV future developments and classify the current implementations regarding the hybridization rate. Finally, the last section provides the conclusion and perspectives.
2. The Fuel Cell for Traction Use
After discussing the important elements of the automotive applications specification, this section aims to give the broad outlines of the FC from a system perspective. This first enables the definition of the FC efficiency and sheds light on the differences between the theoretical thermodynamic efficiency and the actual efficiency. This will help in understanding the possible improvements required to move towards a large scale FCV market.
2.1. FCV Specification
The FC integrated in a vehicle must be able to operate in a very demanding environment: vibration, high temperature range (typically to ), fast start-up time (typically the ability to deliver half of the rated power after the first 30 s), highly variable traction power, many on-off cycles, and a lifetime of more than . Moreover, as with any on-board system, mass and volume densities are closely scrutinized. In addition to all these technical criteria, the ownership and use costs are particularly constraining, especially in the passenger car market. Hence, for this intermittent use, FCV manufacturers face several trade-offs. They first need to achieve fast and energy-efficient starts while trying to avoid mechanical stresses that wear the multi-material structures during the on/off phases. Consequently, preference is given to FCSs that operate at a temperature close to ambient temperature. Second, removing the heat arising from FC losses is a key point with respect to embedded mass and volume. In order to promote thermal exchanges with the environment but also to stimulate chemical reactions without costly catalytic processes (Arrhenius’ law), high temperatures are sought within the FC.
In order to understand the technological devices implemented to best meet these specifications, the following subsection explains the principles governing the FC which acts as the power converter, and is the main device of an FCS.
2.2. FC Operation Principles an Their Consequences
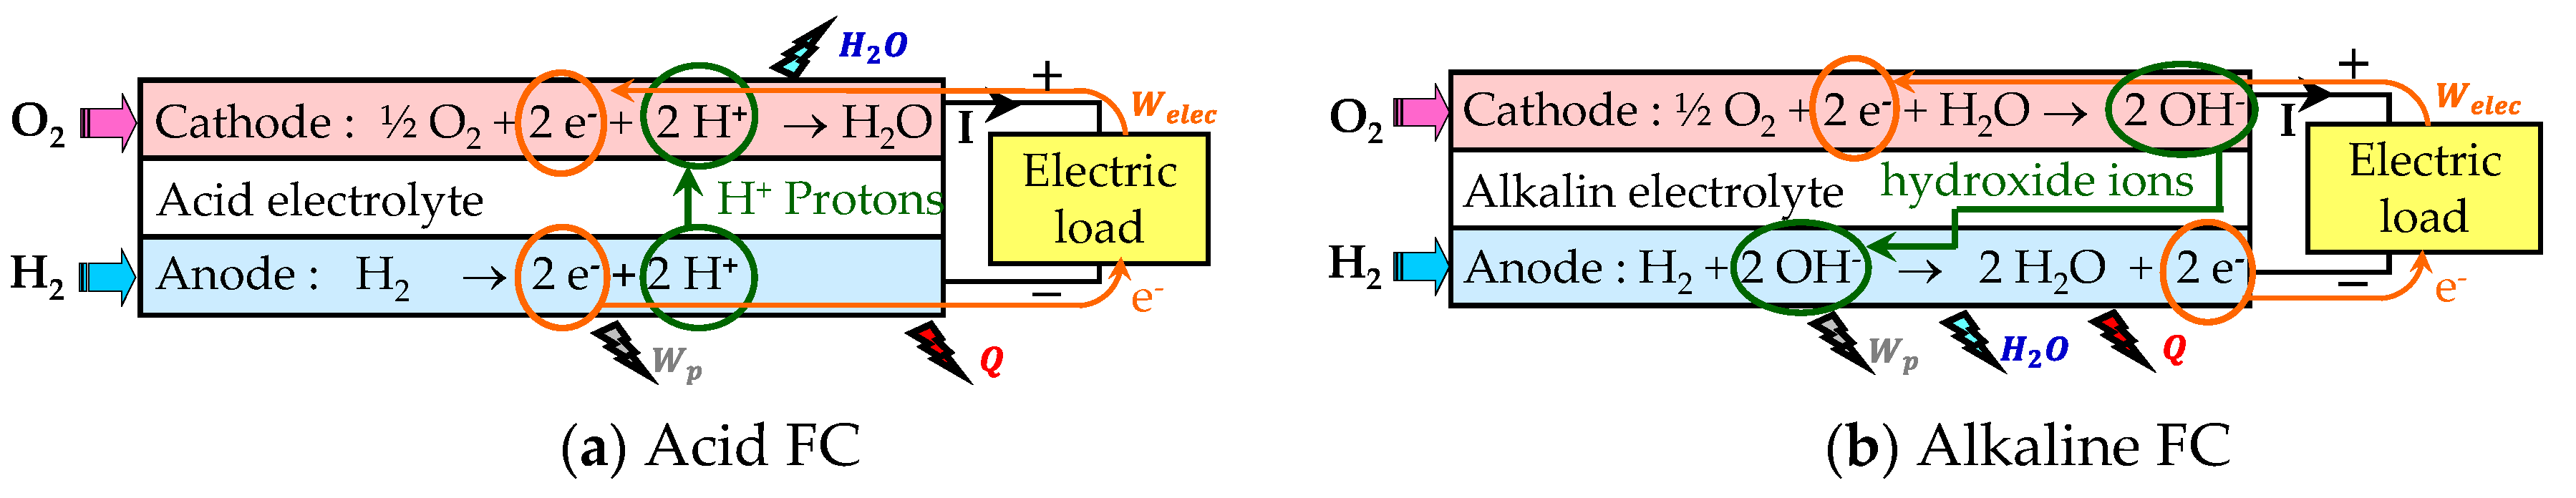
Like batteries, the FC is the site of two oxidation-reduction reactions (Figure 2), requiring that the reactants are isolated by an electrolyte which has the dual function of separating the reactants and allowing the ion passage necessary for coupling the two electrochemical reactions. The powered electrical device provides the electronic bridge and thus allows the recovery of the useful energy in the form of electric work [11]. Figure 2 illustrates the specific redox reactions involved in both acid and alkaline cases and the related ion flows through each specific electrolyte. In fact, car industry focuses on acid FC based on a solid and extremely thin ( to ) acid polymer membrane. This FC technology is called PEMFCs for Proton Exchange Membrane Fuel Cells. This enables a very compact power converter, good mechanical resistance to a difficult environment (vibrations), as well as a quite simple on-board system to implement this power generator.
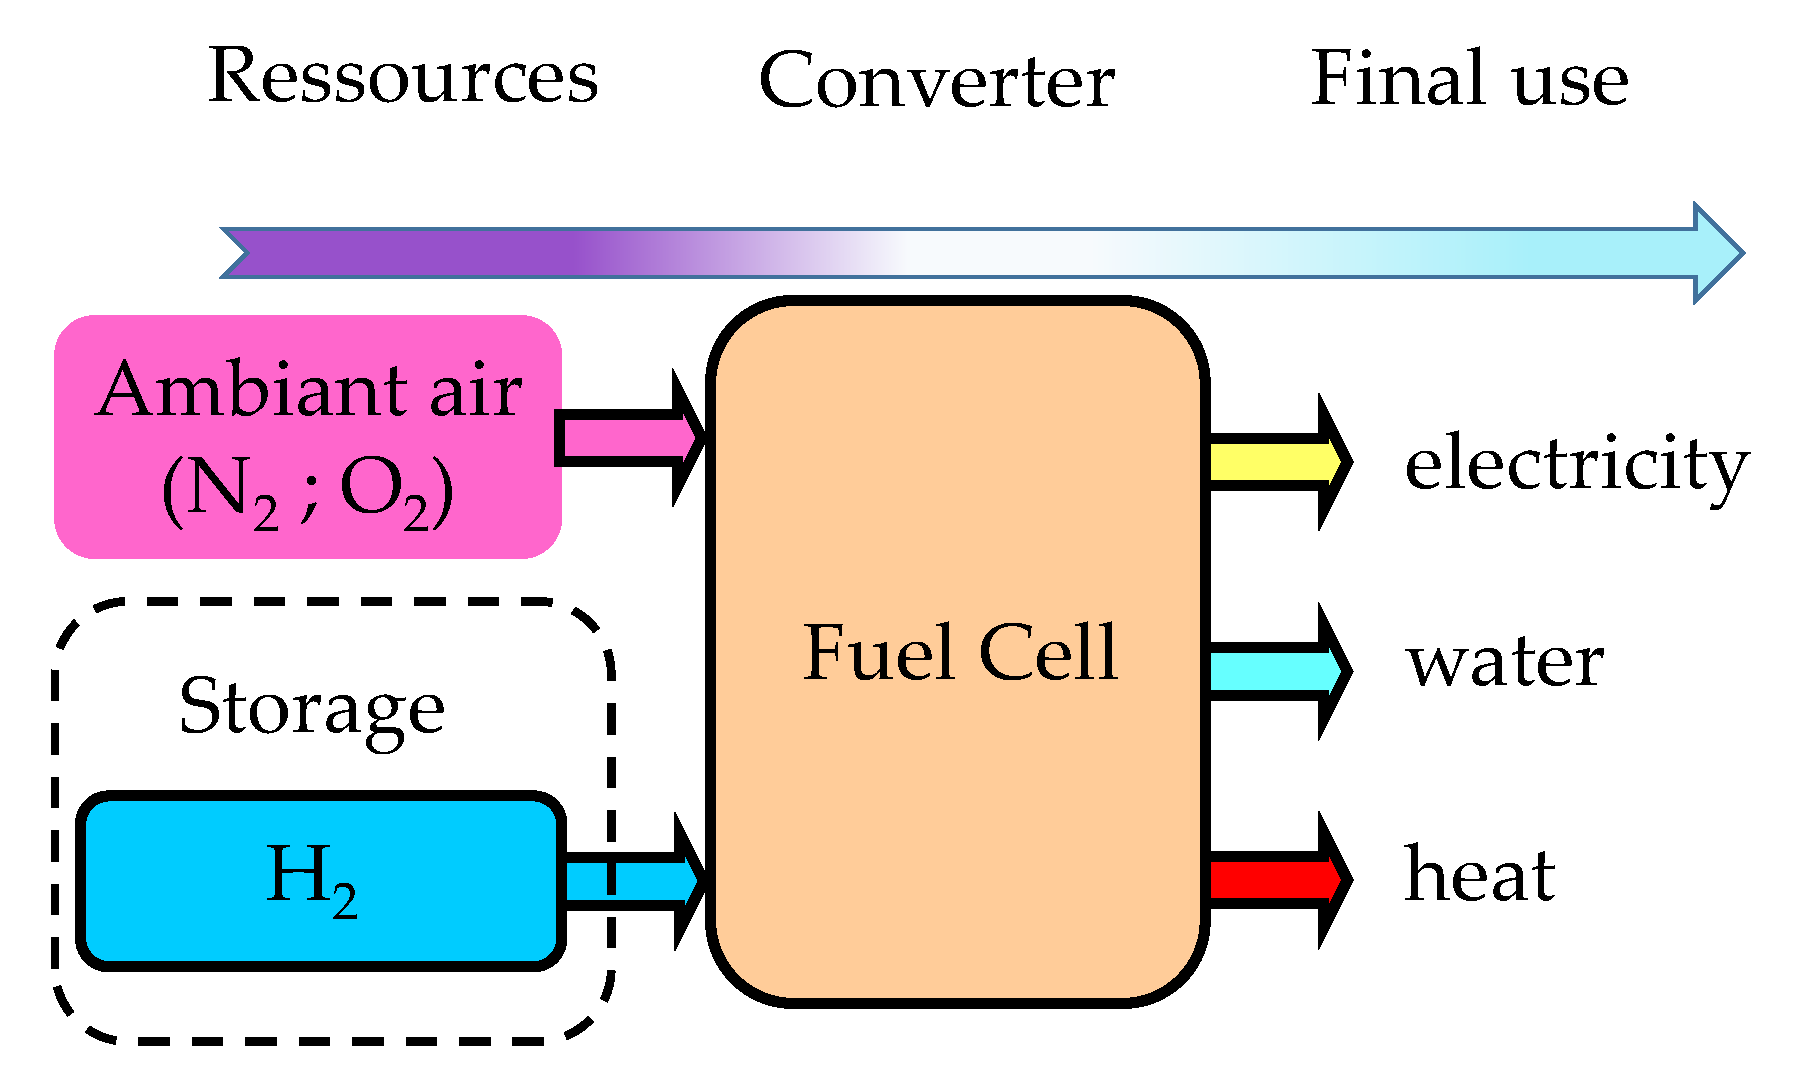
Figure 3 shows the FCS functional principle. The FCS differs from batteries in that, while the reactants ( and in the automotive application) are consumed at the electrodes, they are supplied in real time and on demand from tanks. The functions of conversion (power) and storage (energy) are therefore structurally separated. Hence, this technology decouples the optimization of the reactor from that of the energy stores (the dihydrogen tank the dioxygen supply or reservoir). While auxiliary power units for manned space flights or submarines require these two tanks, terrestrial applications allow the elimination of the dioxygen tank by extracting from the ambient air as it is consumed by the FC. Note this optimization factor is also one of the hopes for improving the energy density of lithium batteries through future developments of Li-air batteries [12]. As an energy store, dihydrogen seems a solid candidate because its energy density Lower Calorific Value (LCV) is about , while the energy density LCV of diesel fuel is about , i.e., 2.7 times lower.
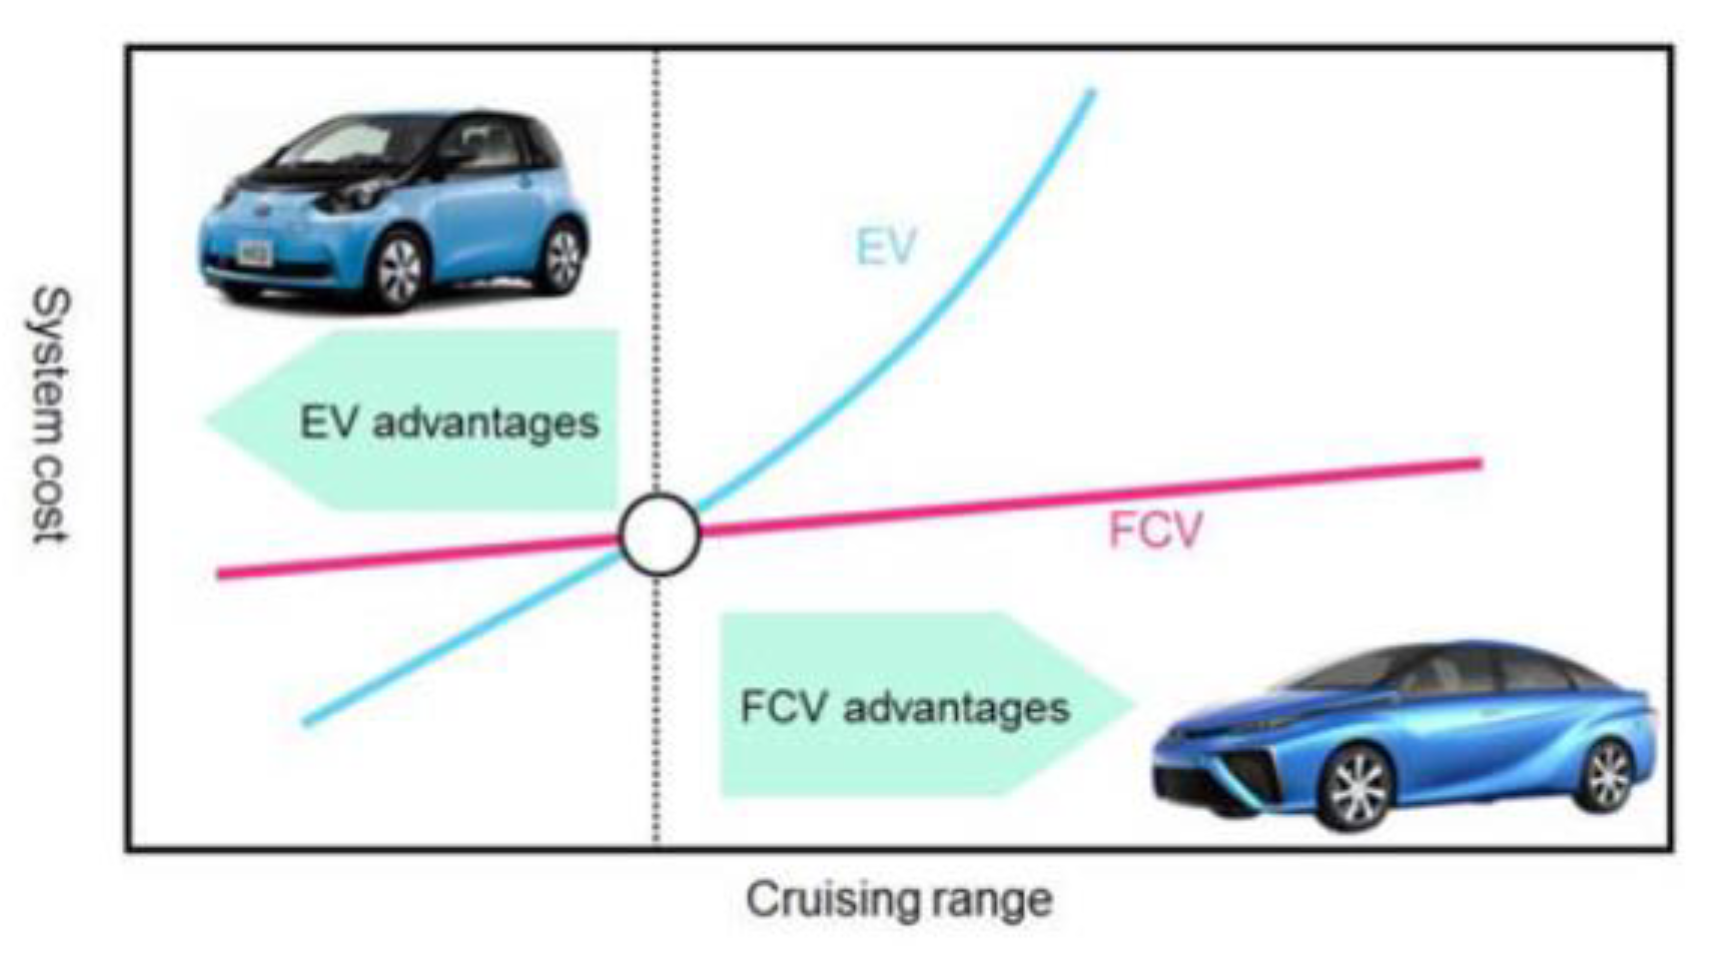
In the case of transport, and for reasonable cruising speeds, the power required is determined by the mass of the vehicle which governs the acceleration phases as well as the sloping road cases. Autonomy, on the other hand, is only correlated to the size of the fuel tank and its recharging speed. For battery vehicles, the reactants must be stored within the accumulator electrodes in order to ensure the desired autonomy: to guarantee occasional needs for long autonomy, the user must then accept a significant extra cost and overweight by purchasing a high-capacity battery vehicle. Conversely, the main cost of the FCV is related to its converter (power) while the increase in storage (energy) has a much lower impact on mass and cost. Moreover, its recharging by material transfer is very fast which implies that a range of to is more than adequate. The Japanese manufacturer Toyota, which is devoting major efforts to the development of hydrogen mobility, illustrates this in Figure 4 through the overall cost of the two types of electric vehicles as a function of the required range.
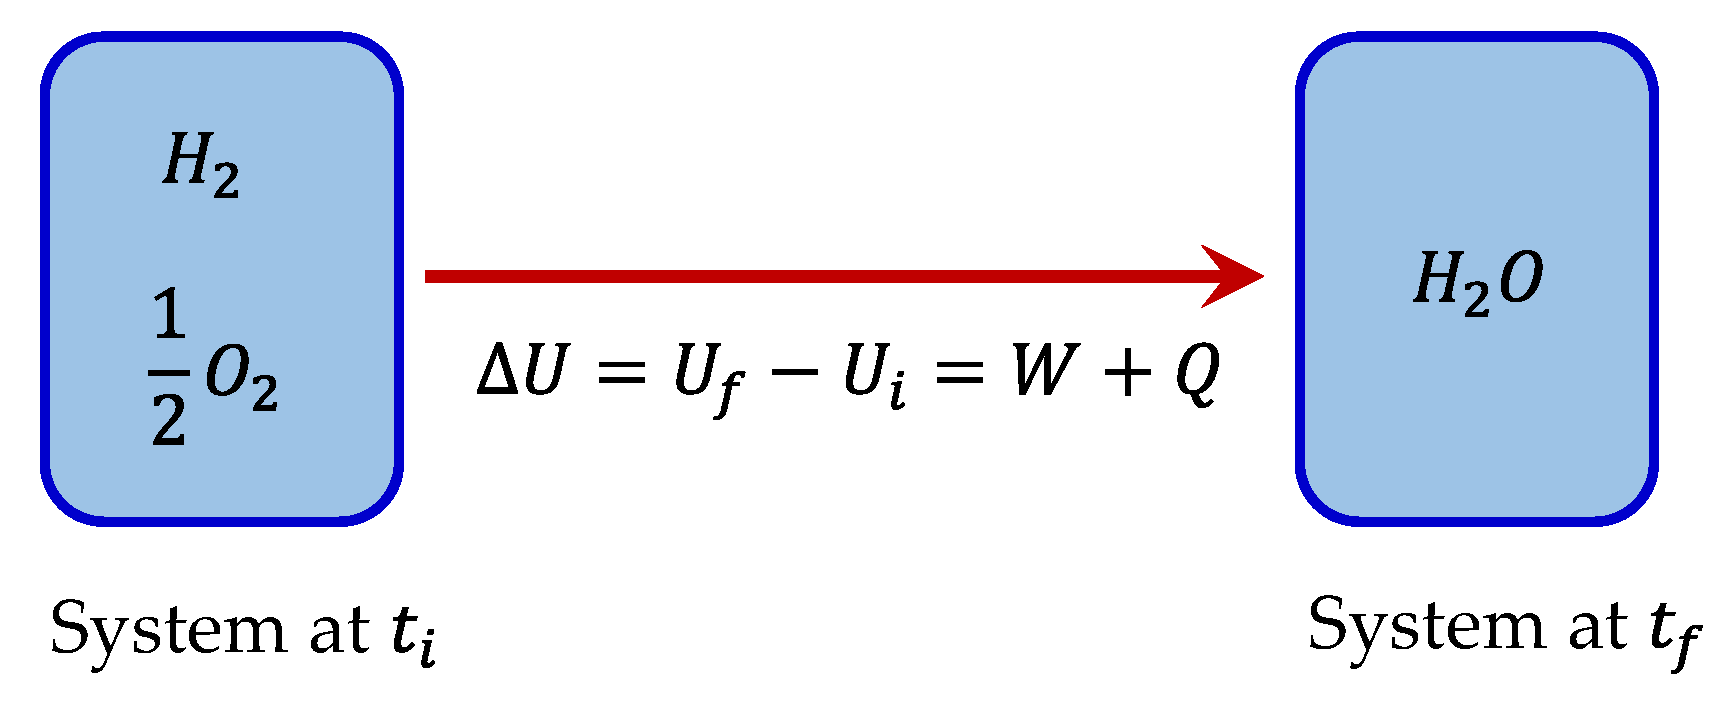
Applying the first thermodynamics law to the system in Figure 5 shows that the global reaction converts internal electrochemical energy :
- 1.
- In work due to the external forces of the studied system. A first part related to the pressure forces () is undergone while the useful corresponds to the electrical forces (), and;
- 2.
- Heat that must be dissipated to the environment in order to maintain the reactor at its reference temperature.
As the reaction takes place at constant pressure (generally atmospheric pressure), using the notion of enthalpy change ΔH (or calorific value CV), it derives:
The second thermodynamics law states the principle of asymmetry between work and heat . The controlled transformation in order to obtain work requires a minimal exchange of thermal energy . This would theoretically be measurable for a system in equilibrium (i.e., at zero power). The theoretical work is easily calculated through the potential difference between both electrodes in open circuit voltage. The thermodynamic equilibrium Open Circuit Voltage (OCV) at standard conditions is:
where is the number of electrons exchanged for one molecule of consumed, the Faraday number is the absolute value of the charge of one mole of electrons, is the enthalpy change of the reaction at standard conditions in the case of the exclusive production of liquid water (i.e., Higher Calorific Value (HCV)) and is the reversible amount of heat under standard conditions.
The FC voltage directly measures the FC efficiency. Indeed, the real efficiency is limited by the thermodynamic efficiency an upper limit and is given by:
Note that the combustion engines efficiency is estimated by adopting the LCV and not the HCV. If the latent heat of water condensation is excluded (hence considering LCV instead of HCV), the standard theoretical efficiency of an FC is as high as !
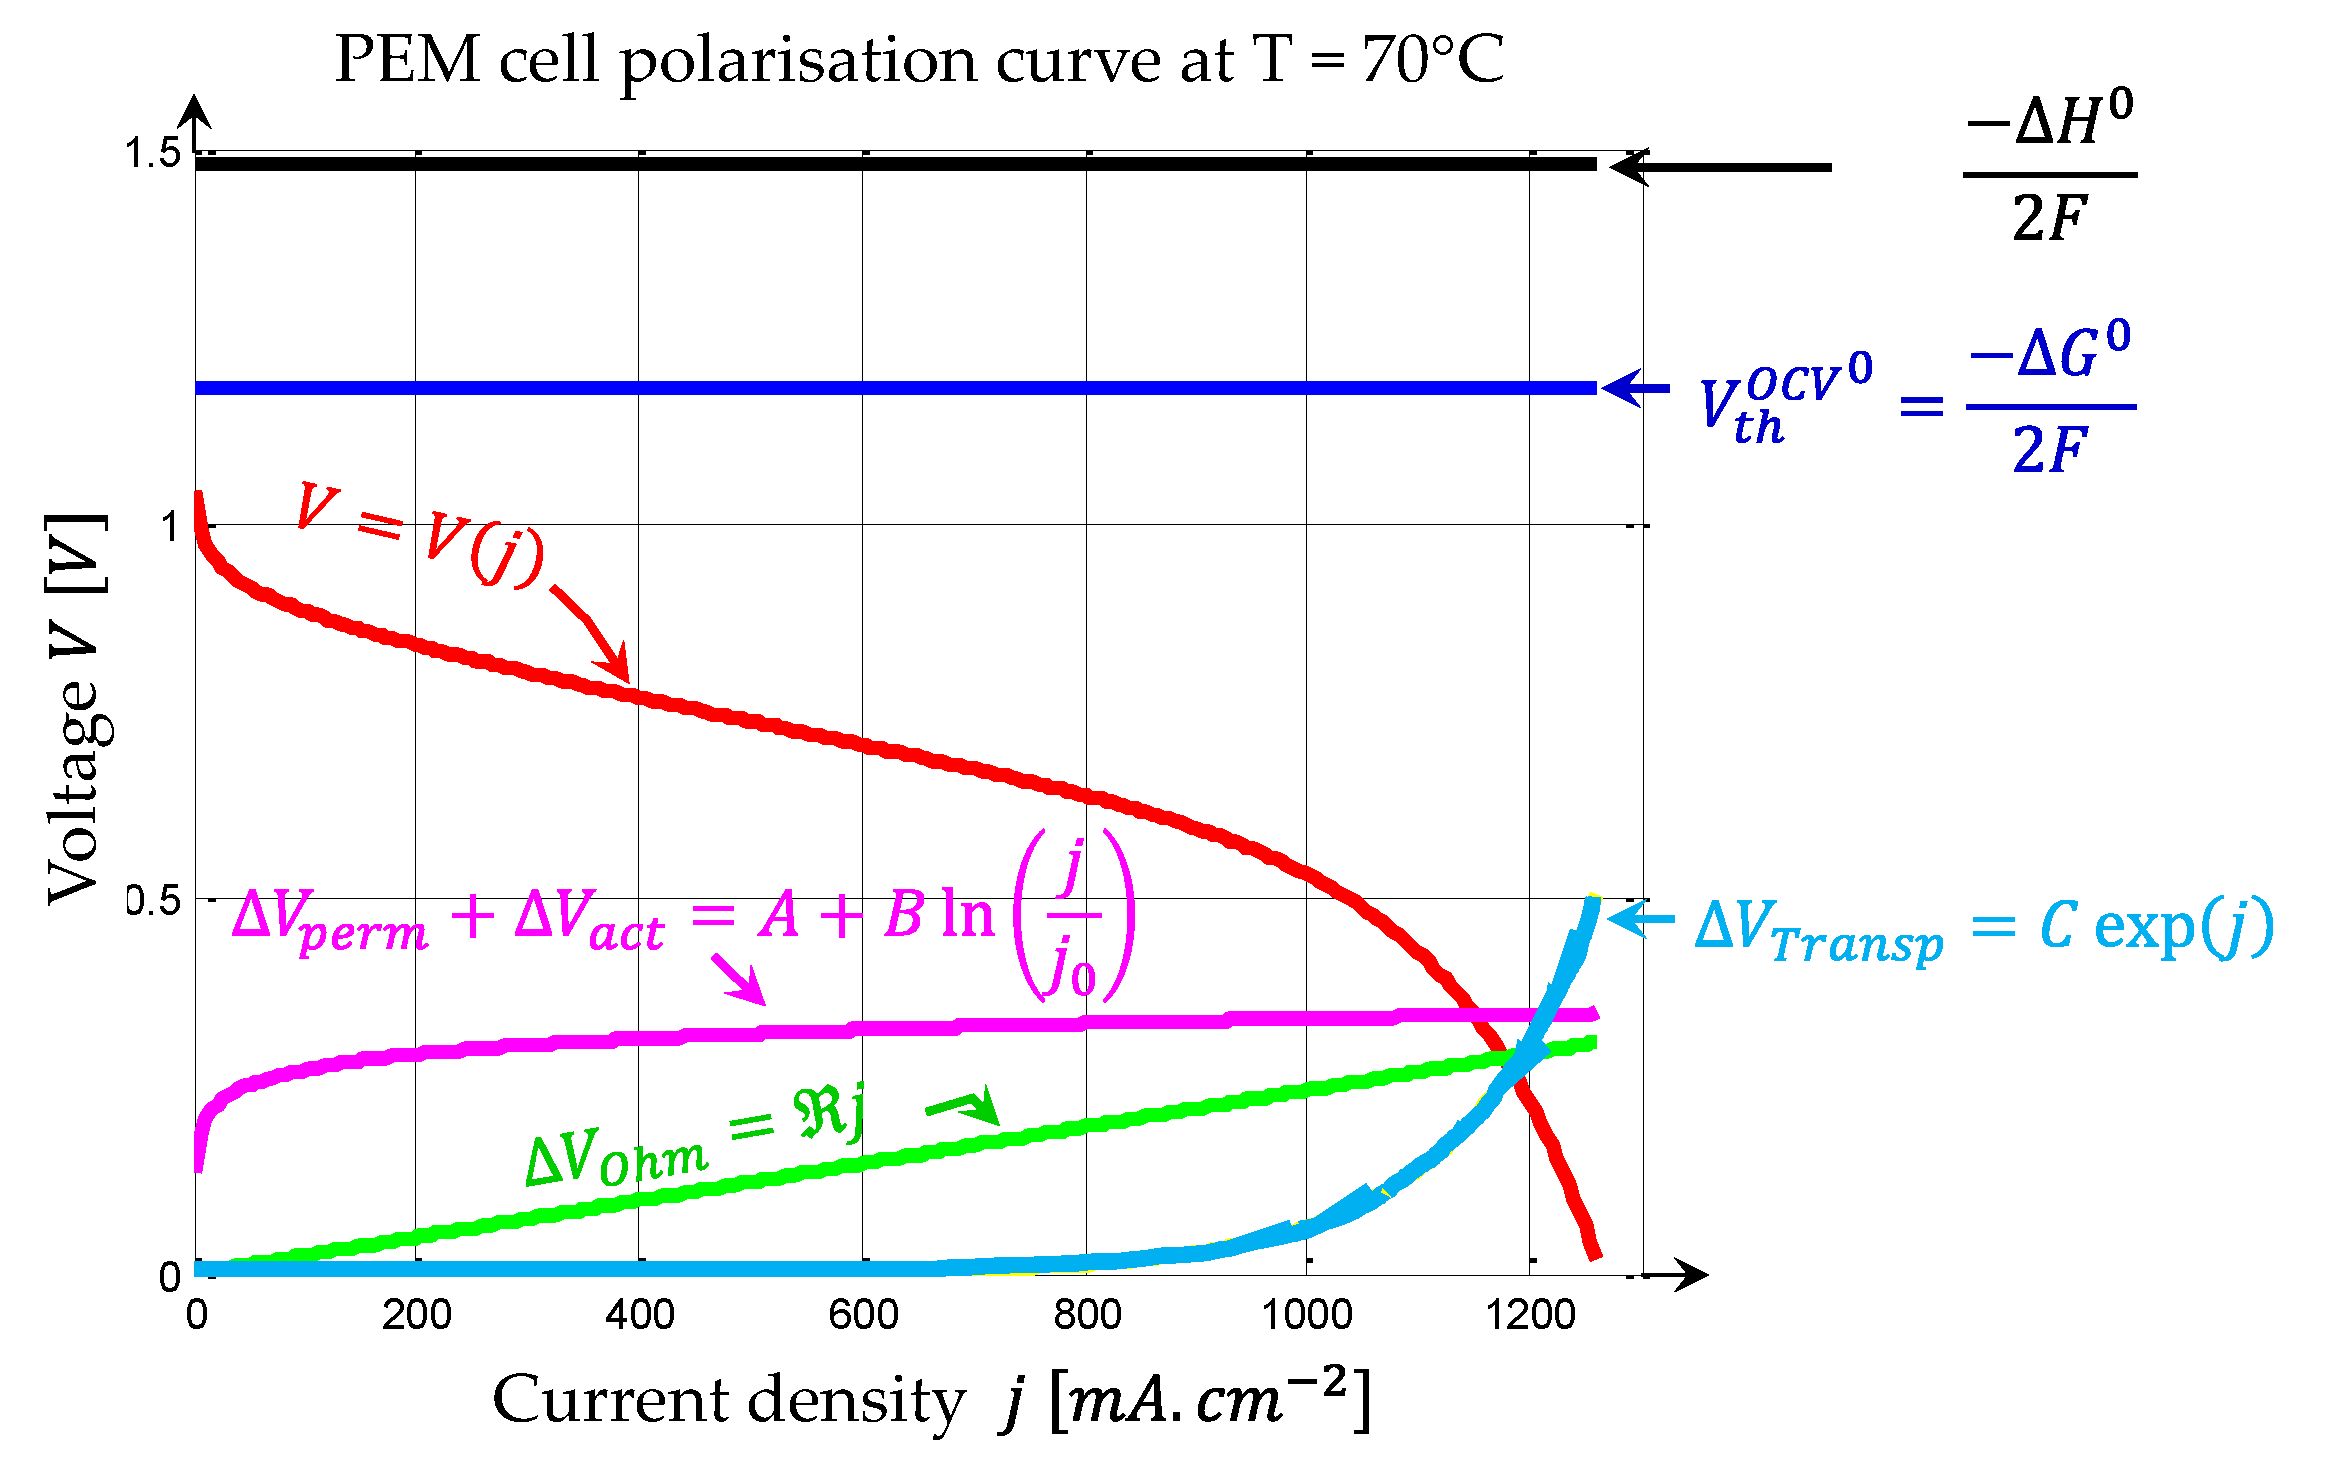
In practice, the actual FC voltage value is always lower. It decreases as the electrode current density increases. Figure 6 shows the characteristic. It also illustrates the deviations from the ideal situation related to the thermodynamic equilibrium; they are therefore synonymous with irreversible phenomena (losses). In relation to the thermodynamic voltage, there are several reasons for these irreversibilities (also called losses).
In order of importance, we find:
- 1.
- Due to its very thinness, the membrane is not perfectly impermeable to reactants. In particular, the permeation of a small amount of H2 through the electrolyte membrane alters the equilibrium potential (), which leads to a measured voltage lower than . The typical value of is of the order of , which constitutes a significant loss.
- 2.
- Overcoming the activation energy required for the reaction is responsible for losses, known as activation losses. At equilibrium, as reactions also take place, these losses are also responsible for the difference between and . In disequilibrium (), this phenomenon is described by the Butler–Volmer relationship, namely:
As soon as the current density is significant, this relationship can be simplified into the Tafel relationship which indicates the activation voltage drop linked to the current density according to a logarithmic law. This drop is particularly significant at low current densities (Figure 6).
Note that voltage drops due to both electrochemical couples competition and activation losses (in magenta in Figure 6) are preponderant over the entire range of use of the FC at normal operating conditions. This justifies the efforts put on both the catalysis (which enables to find other reaction pathways involving lower activation energies) and the membrane which allows the isolation of the cathode and anode parts.
- 3.
- The mobility of the electrons through the electrode as well as the mobility of the hydronium ions provide a linear voltage drop regarding current density. Hence these irreversibilities are called ohmic losses to refer to this linear aspect. These losses are characterized by the macroscopic coefficient , expressed in :
The former has limited importance and these losses are generally less important than activation losses and only become of the same order of magnitude as the previous ones while FC power becomes close to its rated value.
- 4.
- As the reactants are consumed at the interface between electrode and electrolyte, a partial pressure gradient is created between the gas supply and the electrolyte surface. The maximum reaction rate () is therefore related to the quantity of reactant that can diffuse through the porous electrode. Under normal operating conditions (unobstructed pores), this current density is never reached. However, in any case, reactants and products migrations generate losses. The associated voltage drop roughly follows an exponential law. It is often related to Nernst’s law which describes the decrease of Gibbs’ free energy as a function of the concentrations of reactants and products. Since Nernst’s law only describes reversible potential drops, transport voltage drop is obviously higher.
When the current density becomes close to , the transport voltage drop becomes very significant (yellow curve in Figure 6). It can therefore be noticed the importance of preserving a high value, which in concrete terms means avoiding clogging of the electrode pores, particularly by the water produced. This latter must essentially be withdrawn as water vapor. Given the need to keep the membrane at a highly hydrated level, this equilibrium point is delicate to ensure and maintain.
To give orders of magnitude related to 2020 technology, the rated power is defined for a cell voltage of , corresponding in the automotive sector to a trade-off close to . Considering the LCV (like in combustion engines) which corresponds, for dihydrogen, to an LCV voltage of , the FC efficiency is . Recall that the LCV point of view is specious, especially since the latent heat of condensation must be lost, at least partially. The choice of a threshold implies that a little more than half of the converted energy is useful for traction power whereas the second part () has to be extracted as heat. Choosing a higher threshold would induce a better FC efficiency but a lower current density. This latter design would lead to a bulkier FC, since the same power would require a higher cell surface. For instance, a rated voltage would lead to an FC efficiency as high as , but a poor FC power density [14]. Hence, the second counterpart would be a higher price, since the cell surface mainly drives the FC price. Conversely a lower rated voltage implies a lower efficiency and hence significantly impacts the size of the front wheel radiator rejecting the FC waste heat . A rated voltage results in a FC causing a bulky radiator. Indeed, considering a state-of-the-art automotive FC working with coolant FC temperature outlet under a ambient temperature, the cooling system performance index is as large as whereas according to Fuel Cell Technical Team of the US DRIVE it should be less than for mass commercialization of light vehicles [15]. The car industry’s trade-off between FC efficiency versus FC cost and compactness is obviously in favour of the latter. The exact rated voltage value is debatable, and its final choice has to consider a safety margin clearly imposed as a precautionary measure to take into account accidental operating conditions as well as the natural FC aging leading to lower voltages at rated current densities.
To produce electric power under the conditions outlined above (i.e., ), the electric load must therefore draw a current of , which requires a dihydrogen mass flow rate of . It hence requires a flow of . Similarly, at the cathode side, the air flow is controlled by the dioxygen demand. Since the proportion of in the air is , the air mass flow rate is , which corresponds to a minimum air flow rate of . In fact, in order to guarantee a sufficient cathode dioxygen supply, the flow rate actually supplied is almost doubled (i.e., close to one liter per second). This mandatory air flow has a significant impact on the system. As there is no tank to provide , the global FCS requires an air compressor and needs power to draw air to the FC active parts.
3. FC Components
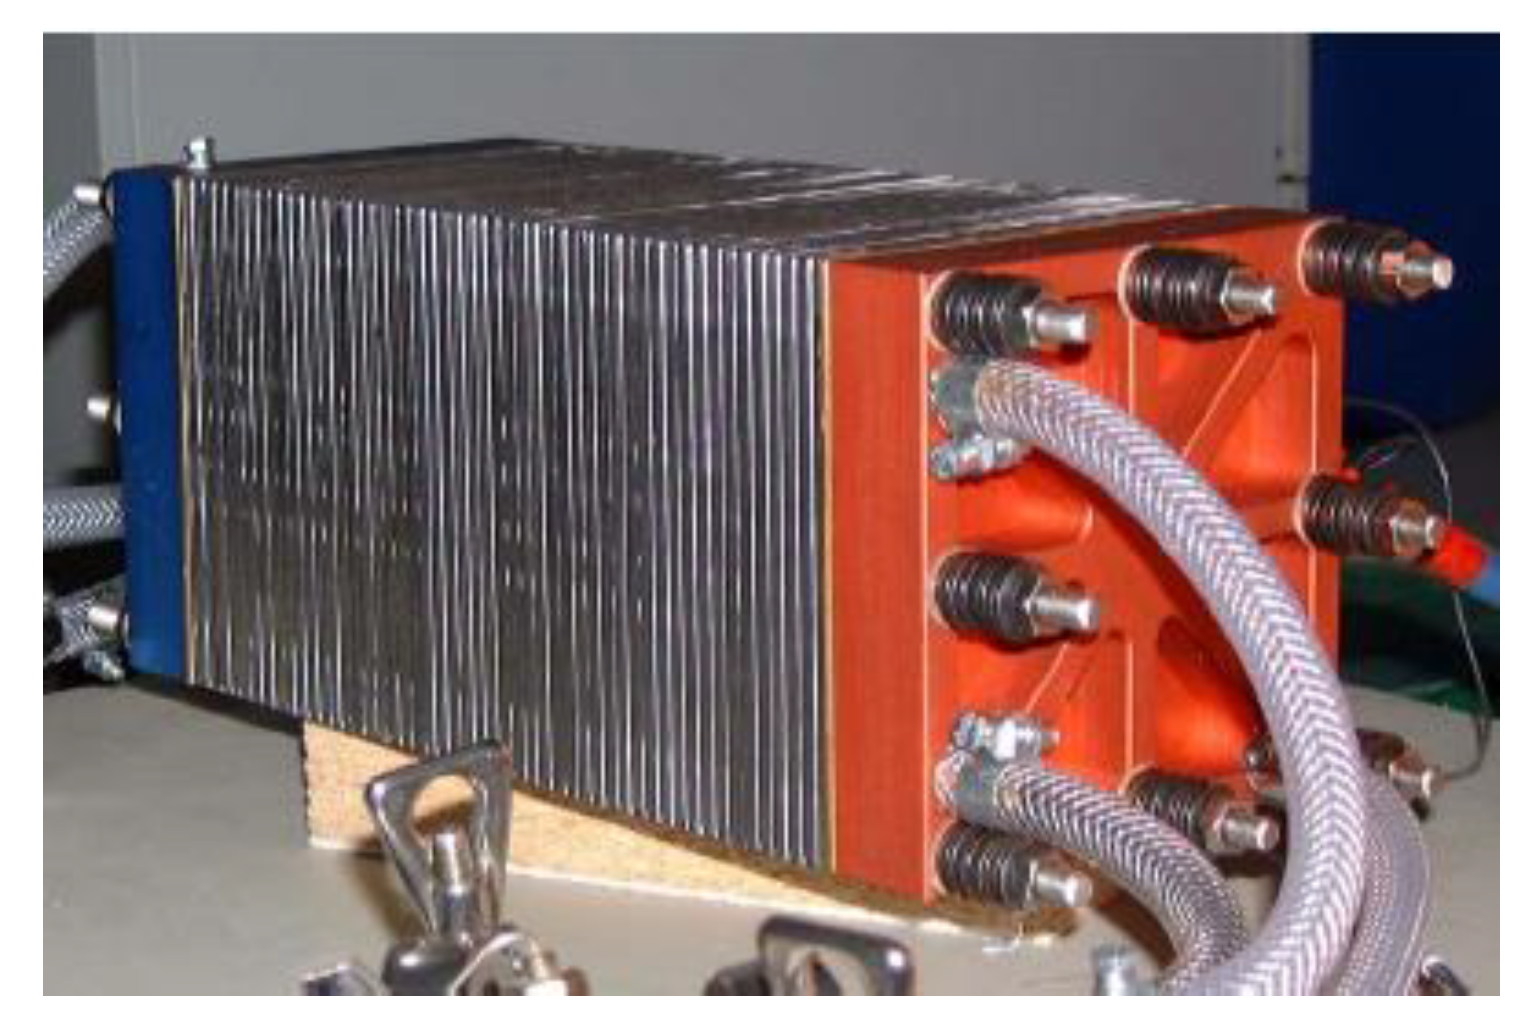
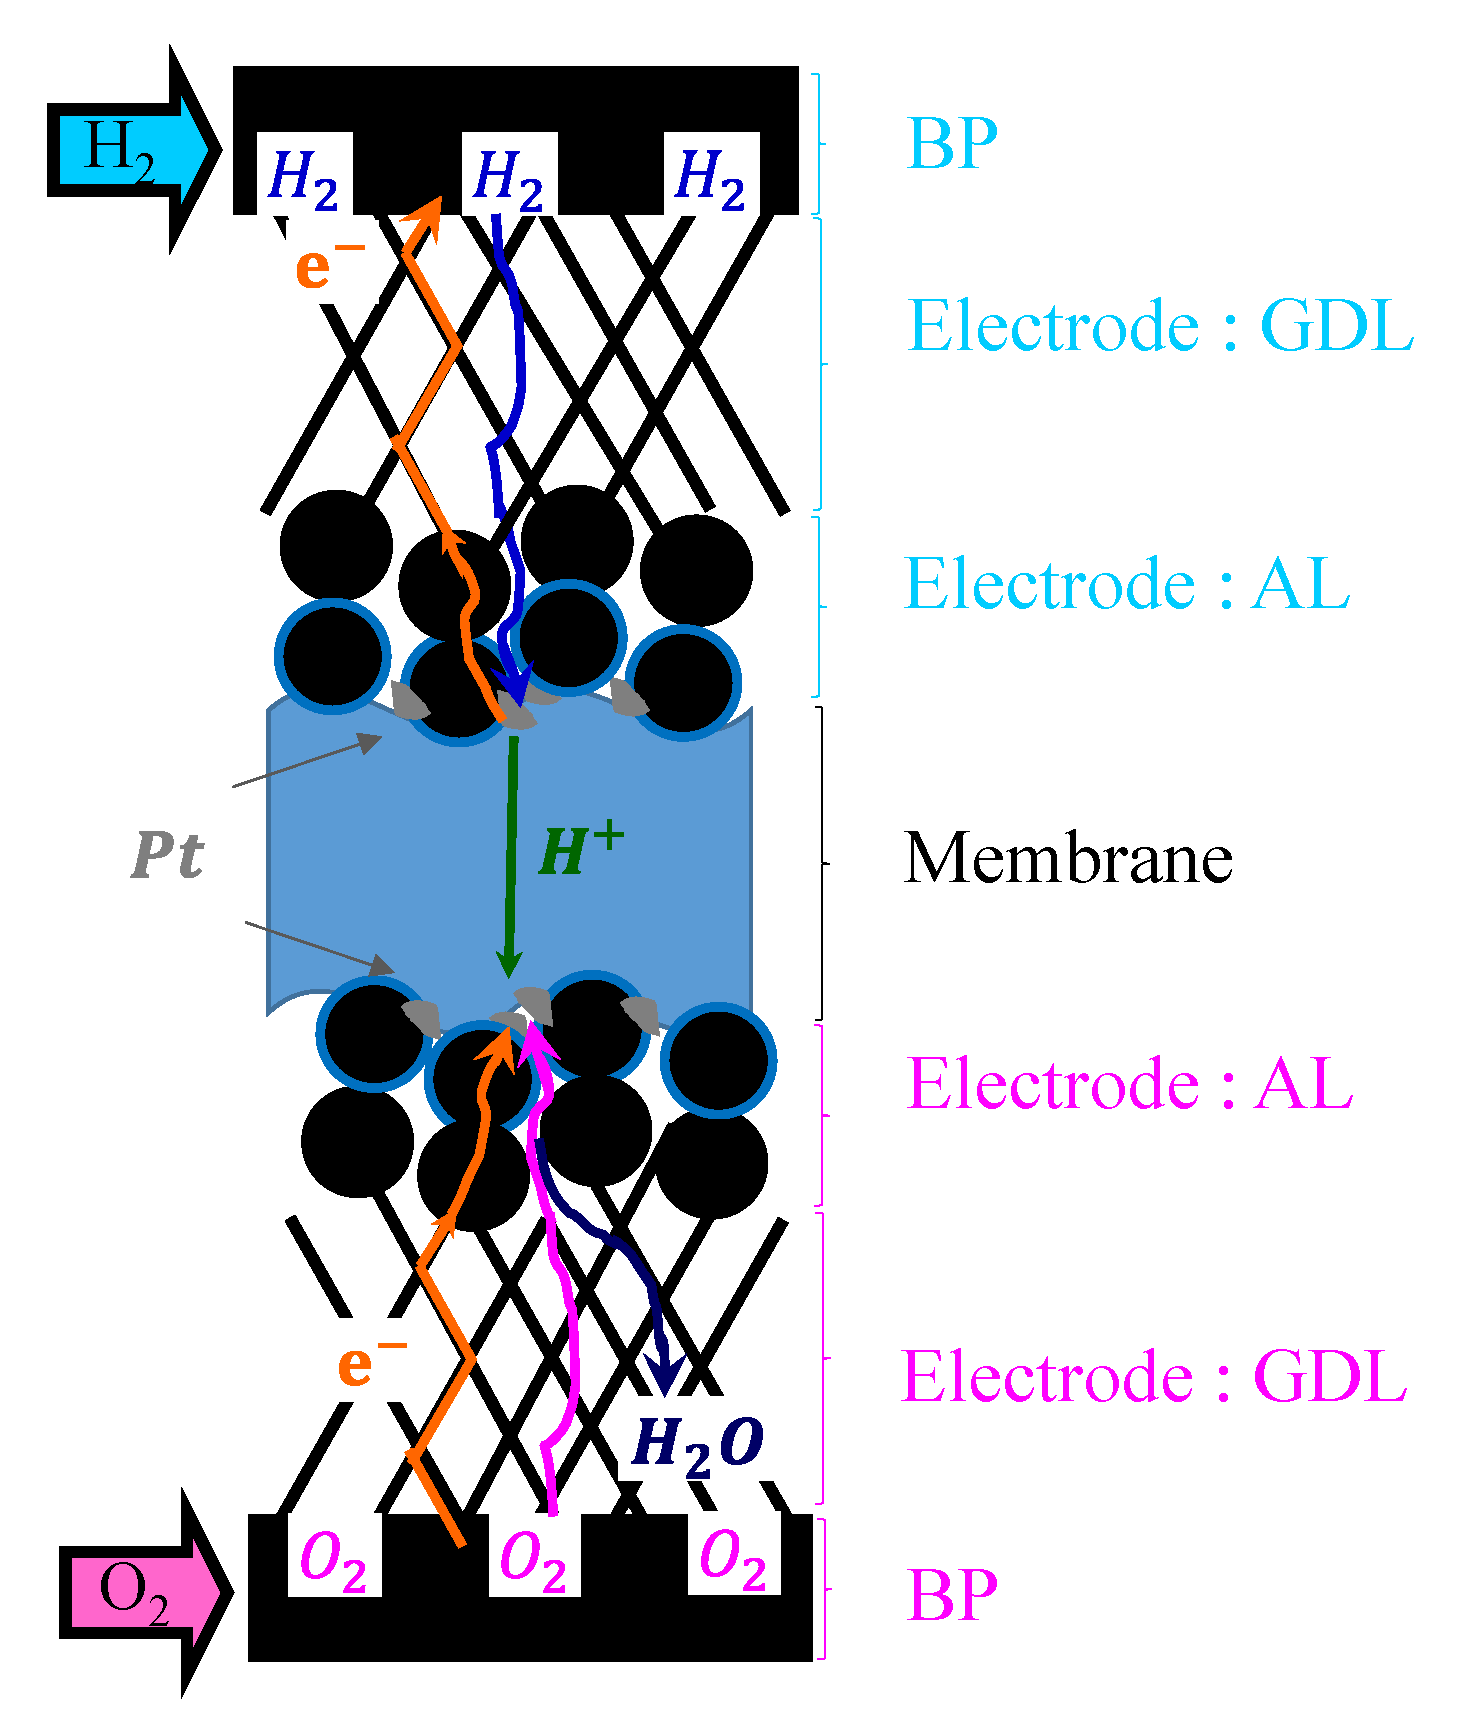
One cell provides an extremely low voltage (). Therefore, to obtain a voltage compatible with the application, it is necessary to stack the elementary cells in order to construct a serial electrical association (Figure 7). The cell is thus the elementary building block of the FC. As shown in Figure 8, it consists of two bipolar plates sandwiching a Membrane Electrode Assembly (MEA). More precisely and starting from the heart of the cell (Figure 8), it can be found: the membrane (M), the electrode with an Active Layer (AL) then a Gas Diffusion Layer (GDL) and finally a Bipolar Plate (BP). Creating intimate interlayer interface structures is crucial for achieving an efficient MEA behavior performance based on optimized mass transfer and low contact resistance.
3.1. The Membrane (M)
The solid electrolyte consists of a thin fluoro-polymer membrane that is virtually impermeable to reactants and allows the protons associated with one or more water molecules to pass through it. This phenomenon is called electro-osmotic transport and is quantified by its electro-osmotic coefficient. The latter is defined by the number of water molecules transported by each proton: its value, which depends on the membrane and its hydration, is commonly of the order of 2. The proton resistivity of the membrane is strongly influenced by its water content. When the cell is new, a running-in sequence is therefore necessary. It consists of operating it according to a precise protocol in order to obtain the correct humidification for its optimal use in the system [15,16]. Minimizing the duration of this process is a major issue for large scale production [17,18,19]. From an industrial point of view, the running-in of the FC can be seen as the charge and discharge cycle that the cells of Li-ion batteries must undergo before being definitively sealed [12]. Like it, this finishing process requires time and energy. However, unlike the Li-ion battery, it is important to note that after a prolonged shutdown (>months), the cell may become dry, hence requiring a reconditioning cycle. On the other hand, charging with water contributes to a significant increase in its volume. Its drying out during shutdown and its hydration during operation contribute to create important cycles of mechanical stresses that can eventually lead to harmful micro cracks in the membrane.
In addition, for mechanical strength reasons and the proton conductivity issue, the membrane must be maintained at temperatures below . The reference membrane is Nafion, a registered trademark of DuPont; it is a Teflon derivative with sulfonic acid groups that allow the optimal passage of protons at . By adding various components such as silicon oxides (), this temperature range can be extended. Nevertheless, this type of polymer forces the FCS to operate at a temperature in the range of to . This temperature range can lead to an excessive formation of liquid water inside the electrode, even causing it to become partially blocked. For this reason, active research is trying to develop membranes operating at higher temperatures. In addition, a higher operating temperature makes it possible to reduce the surface area of the heat exchanger, thus ensuring better integration into the vehicle. As an indication, the cooling circuit of internal combustion engines is at for most operating points, and its thermal management can change between and 110 °C. In absolute terms, this difference may seem minimal, but the key point is obviously the difference with the ambient temperature which can reach (). Therefore, under these conditions, any increase in temperature leads to appreciable gains in the volume of the system.
Hybrid membranes consisting of a polymer matrix containing phosphoric acid have thus been developed [20]. They have the advantage of operating up to temperatures of about and do not require liquid water to ensure good conductivity of the protons: they are then referred to as “HT-PEM” (acronym for high-temperature proton exchange membrane) FC. However, their use is reserved for static devices or auxiliary power supplies with regular operation. Their proton conductivity is very low at room temperature. Moreover, at start-up, their operation requires preheating above , and without electricity production, in order to avoid the extraction of phosphoric acid by the liquid water produced by the cathode [21]. All these phenomena prevent rapid starts under road vehicle normal conditions of use o ( and ) and make intermittent consumptions energetically costly. Moreover, the thickness is increased leading to voluminous implementations.
Even if the membrane is today a functional component, there is still progress to be made in terms of (i) cost, (ii) production and recycling, and (iii) operating temperature.
3.2. The Electrode Active Layer (AL)
The AL is a key element in the continuous trend to reduce PEMFC cost and improve its lifetime. Chemical reactions take place in this layer and its design strategy directly impacts those two crucial performance indexes [22].
Each half reaction (Figure 2a) takes place in a triple phase boundary (TPB). At the cathode side, the oxygen reduction reaction (ORR) requires simultaneously the presence of gaseous dioxygen , electrons and protons at the electrochemically active sites. Water is produced and must be drained to the BP via the GDL to prevent cathode flooding. Conversely ionomer channel enables protons to migrate from the membrane while electronically conductive network (carbon and metal) ensures the electron transport from the electric load via BP and GDL [23,24]. The non-catalyzed ORR is slow. In the extreme acidity generated by the perfluorinated sulfonic acid resin (Nafion membrane), Pt-alloys (like Pt-Co or Pt-Ni) are the best catalyst to strongly increase its chemical reaction rate, specifically at low temperatures, obviously associated to reactants low thermal energy. At the anode side, hydrogen oxidation reaction (HOR) splits gaseous dihydrogen into protons and electrons contributing to a second TPB. Protons move to the membrane using ionomer channels while electrons are transferred to the electric load via effective electronical paths. This second reaction is faster than ORR but also greatly improved by Pt-based catalyst.
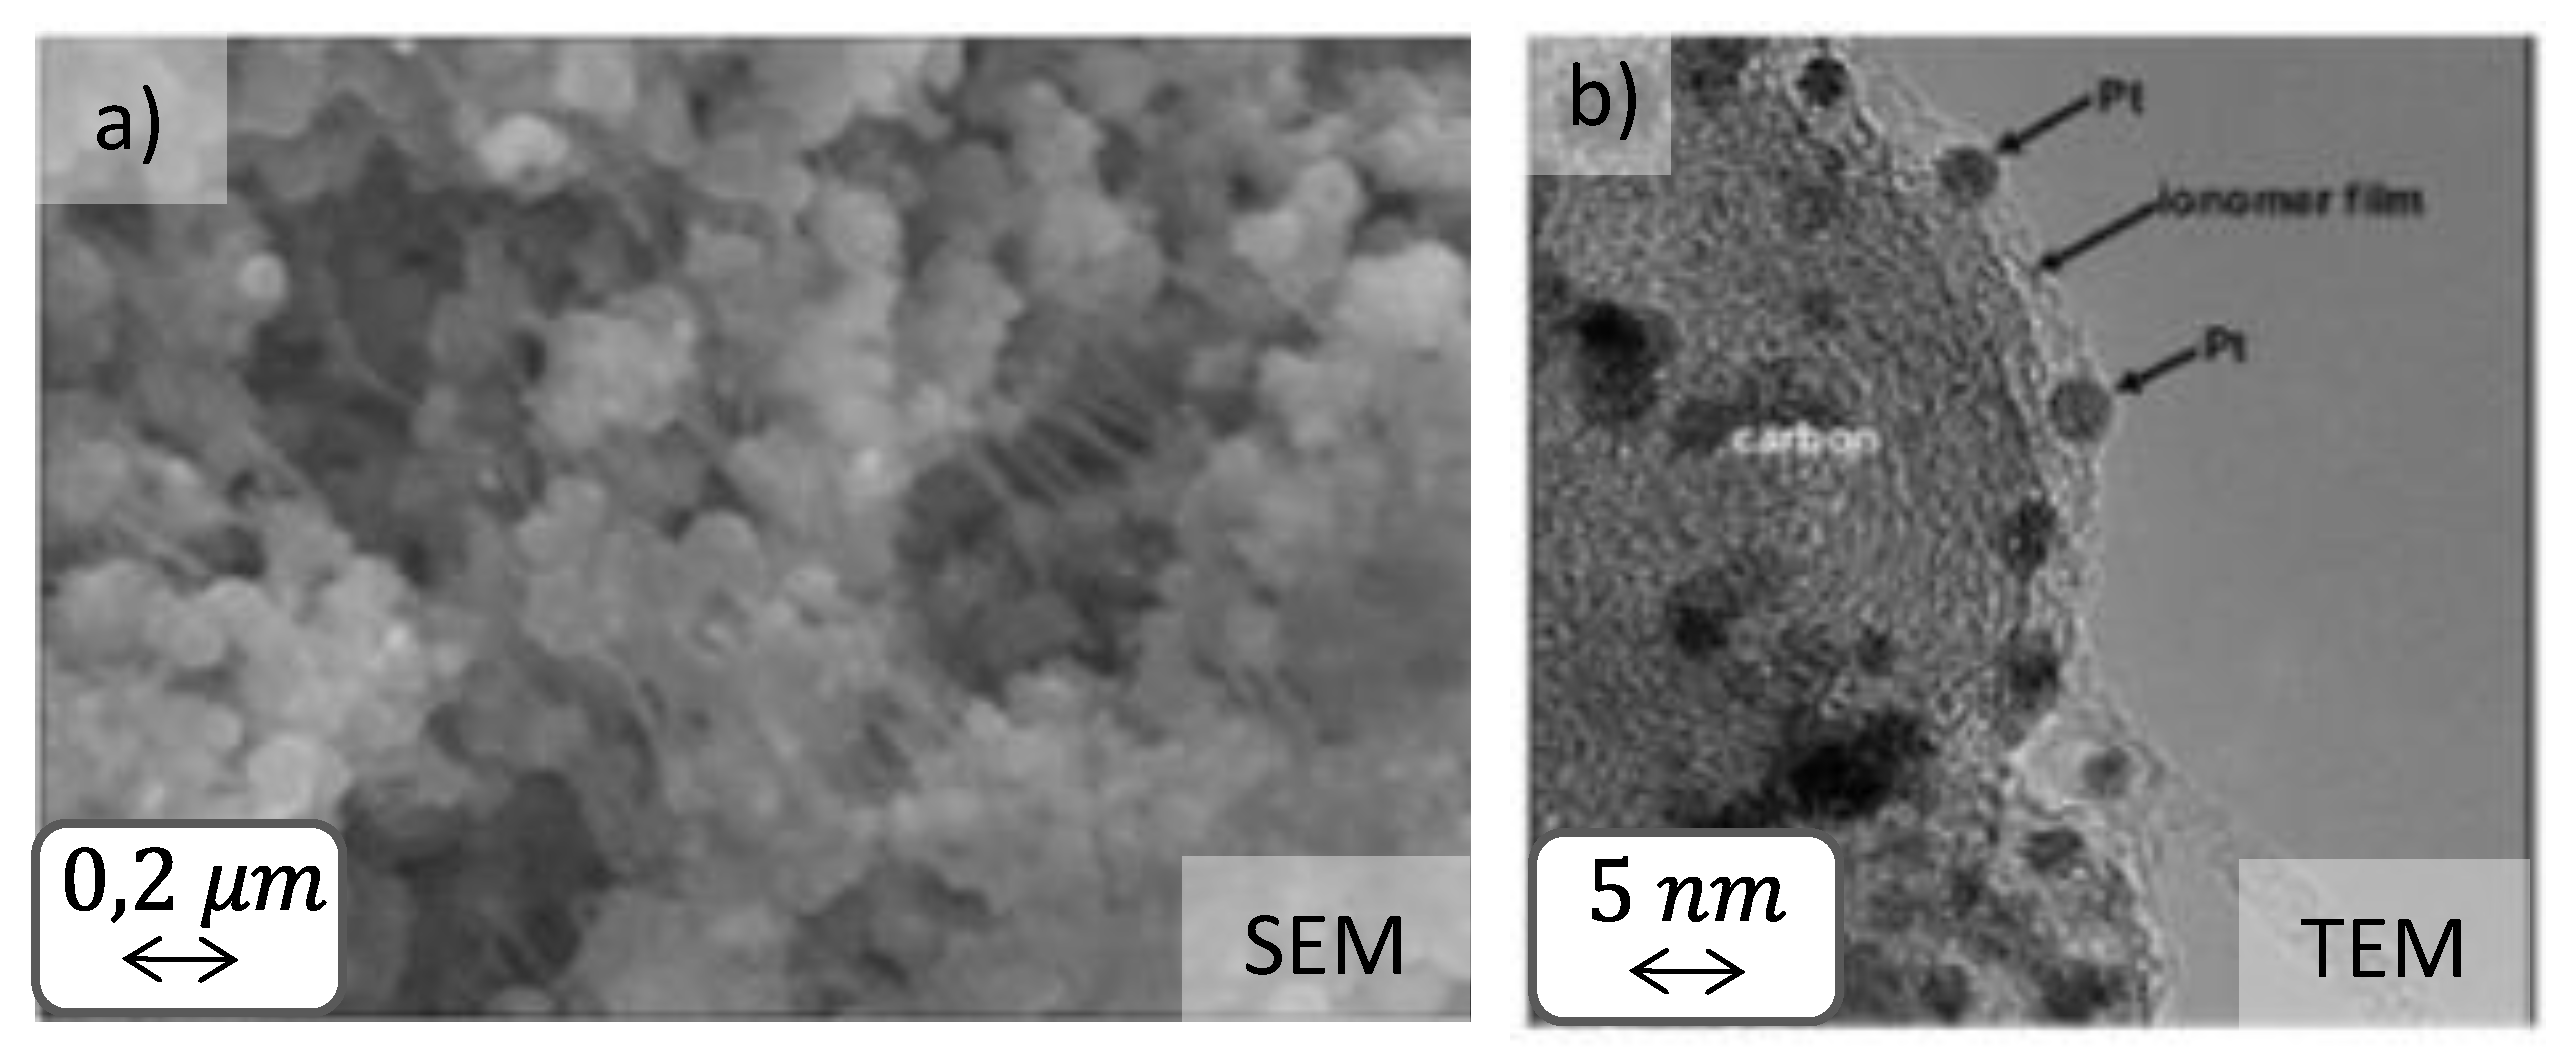
Therefore, both ORR and HOR reactions require a complex structure enabling high gas accessibility and efficient transport of water, protons and electrons. The AL is hence a porous structure combining Pt nano-particles for catalyst purpose, ionomer to enable large proton conductance and carbon particles to create an electronically conductive network [25,26]. The ionomer commonly used material is similar to the membrane one, i.e., the Nafion. Using these key raw materials (Pt, Carbon black and ionomer), conventional ALs are manufactured based on a printing process. Figure 9a shows a scanning electron microscope image of the appearance of an AL and Figure 9b provides a Transmission electron microscopy image showing the interaction between Pt/C agglomerates and the ionomer [22]. As depicted in this figure, the resulting AL () is composed of a microporous carbon structure made of primary carbon particles which are in diameter. The carbon support structure enables a large surface area. Pt-alloy nano-particles of are dispersed upon this carbon black support and can be both located inside the particles pores or on the primary particles. The Pt/C agglomerates are bound with an ultrathin ionomer film of a few nanometers in thickness () [27]. The Nafion film thickness is a trade-off between proton conduction and gas diffusion effectiveness. The carbon support is a porous network permitting both suitable gaseous mass transfer and large electronic conductivity. The AL is intimately linked to the GDL and the membrane.
As a final point, Pt load is particularly sensitive because it highly impacts the MEA performance in term of power efficiency, durability, cost and capability to reach mass-product. Pt, as any metallic element of the Platinum-Group Metals (PGMs), is rare and expensive. Therefore, major research efforts aim to limit the quantity required, either by controlling the deposition process to ensure it takes place only at the interface and not in unnecessary areas, by alloying it with other metals [28,29], or by synthesizing new catalysts with similar properties that can limit or eliminate PGMs use [30]. Regarding AL lifetime under automotive operating conditions, finding clear insights of catalyst degradation would enable us to propose effective mitigation strategies to enhance active layer durability, which is another crucial technological issue [27,31].
3.3. The Gas Diffusion Layer (GDL)
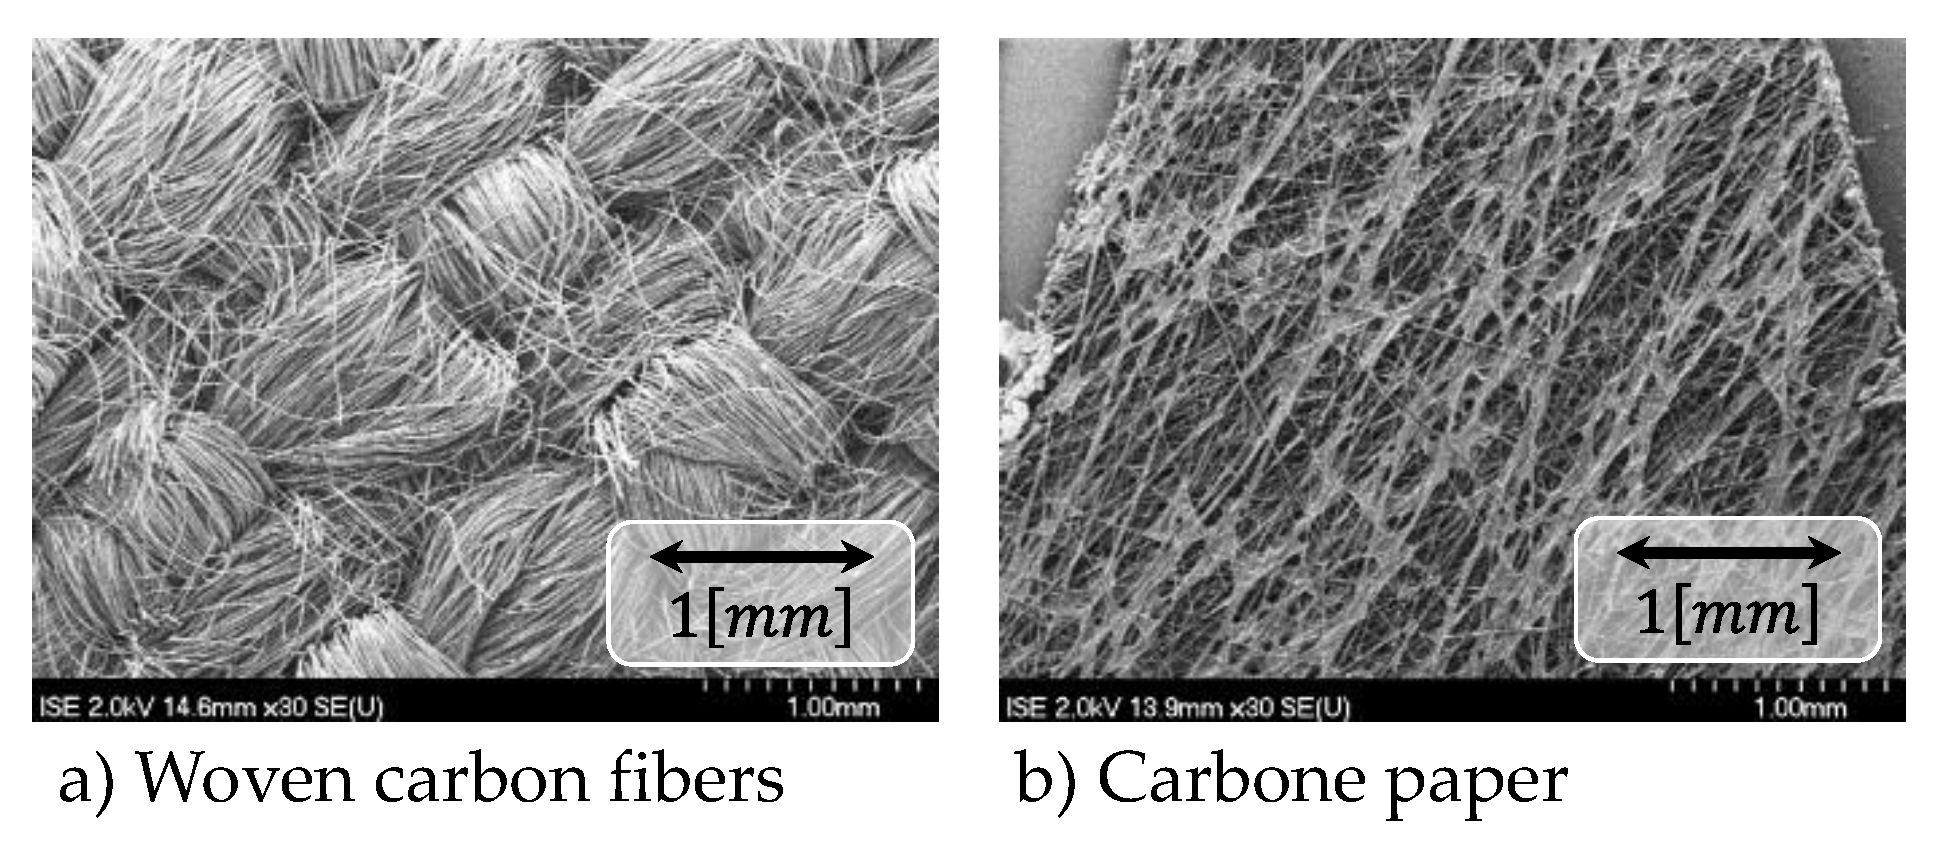
The upper part of the electrode has the dual function of diffusing gases to homogenize the concentration of reactants in the active layer and of conducting electrons [32]. For this reason, it is made of carbon fabric () made partially hydrophobic by impregnation with Teflon. Figure 10 shows scanning electron microscope views of the two types of diffusion layer made of carbon fibers.
3.4. The Bipolar Plate (BP)
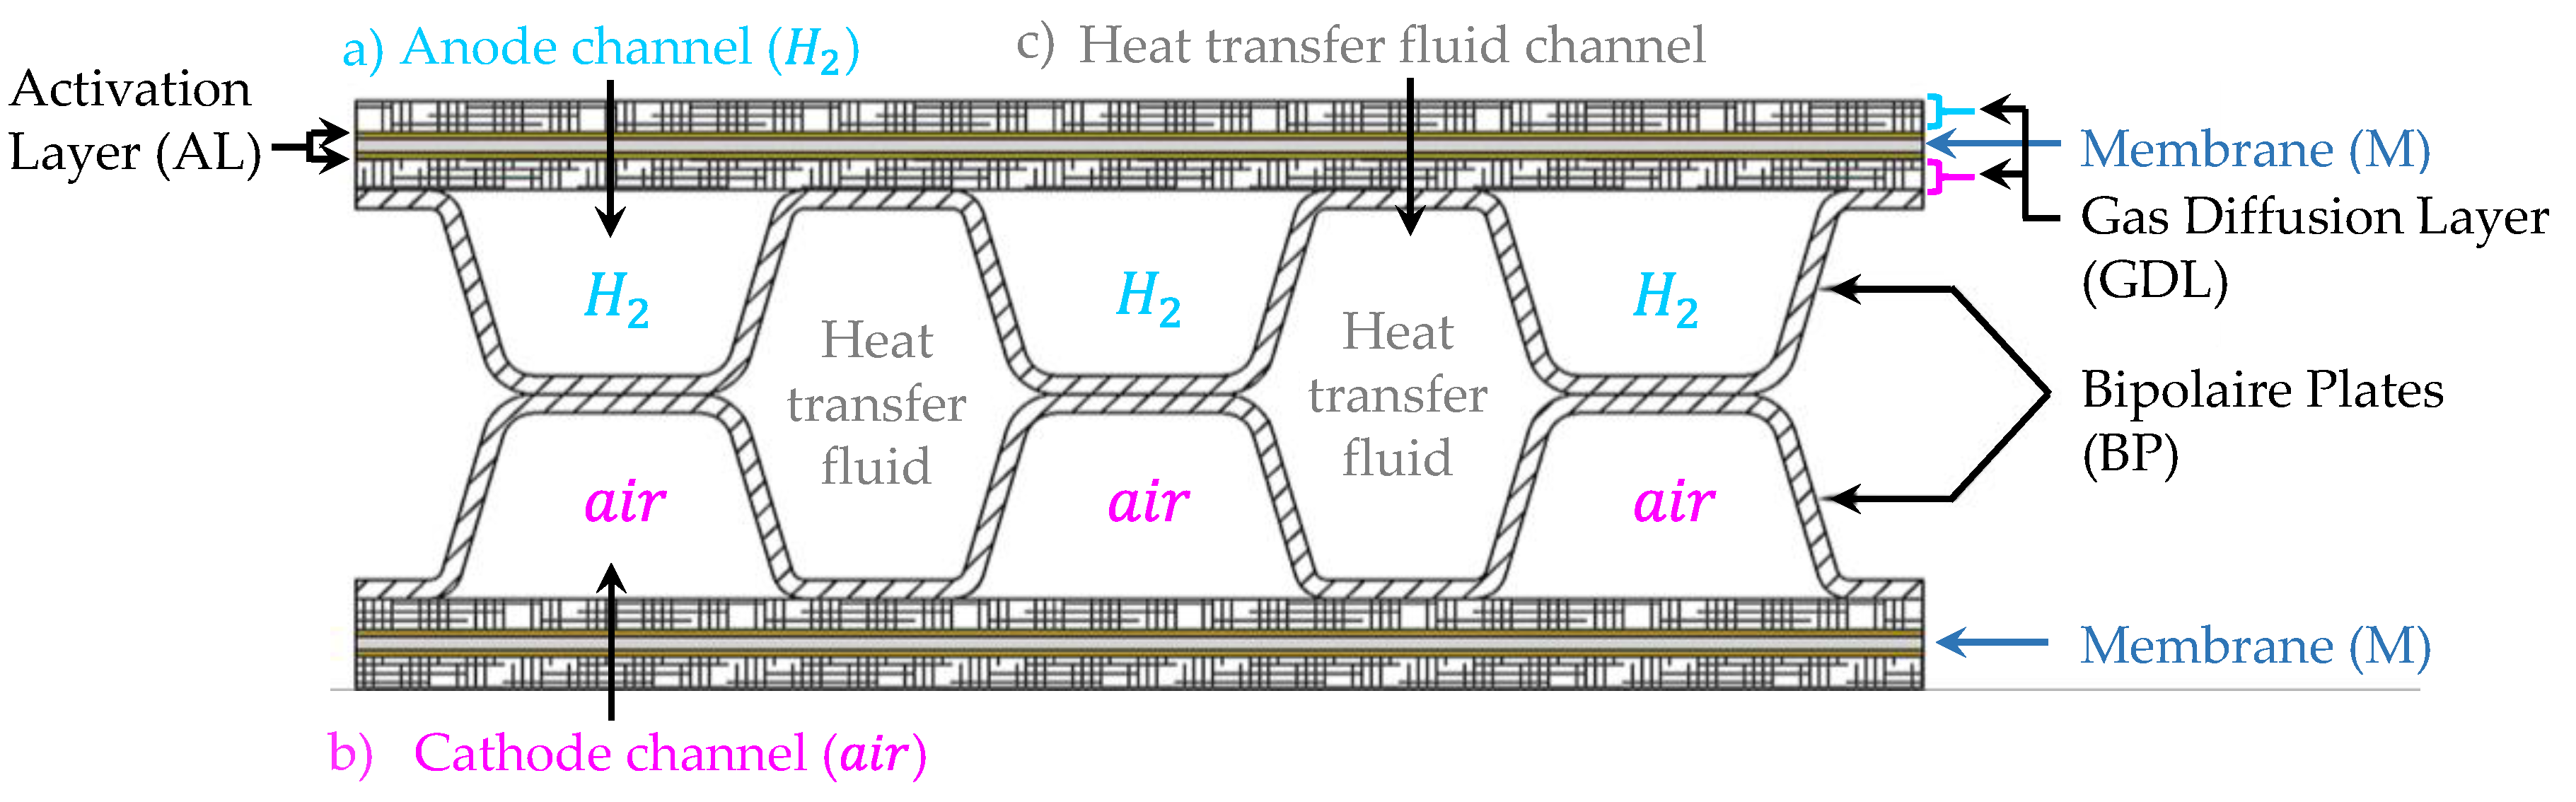
A bipolar plate (BP) is illustrated in Figure 11. The BPs have the quadruple function of supplying fluids separately (reactants as well as the heat transfer fluid), evacuating products including water (which requires hydrophobic surfaces), conducting the electronic current to the current collector supplying the electrical load, and ensuring the mechanical strength of the MEA and the cells stack.
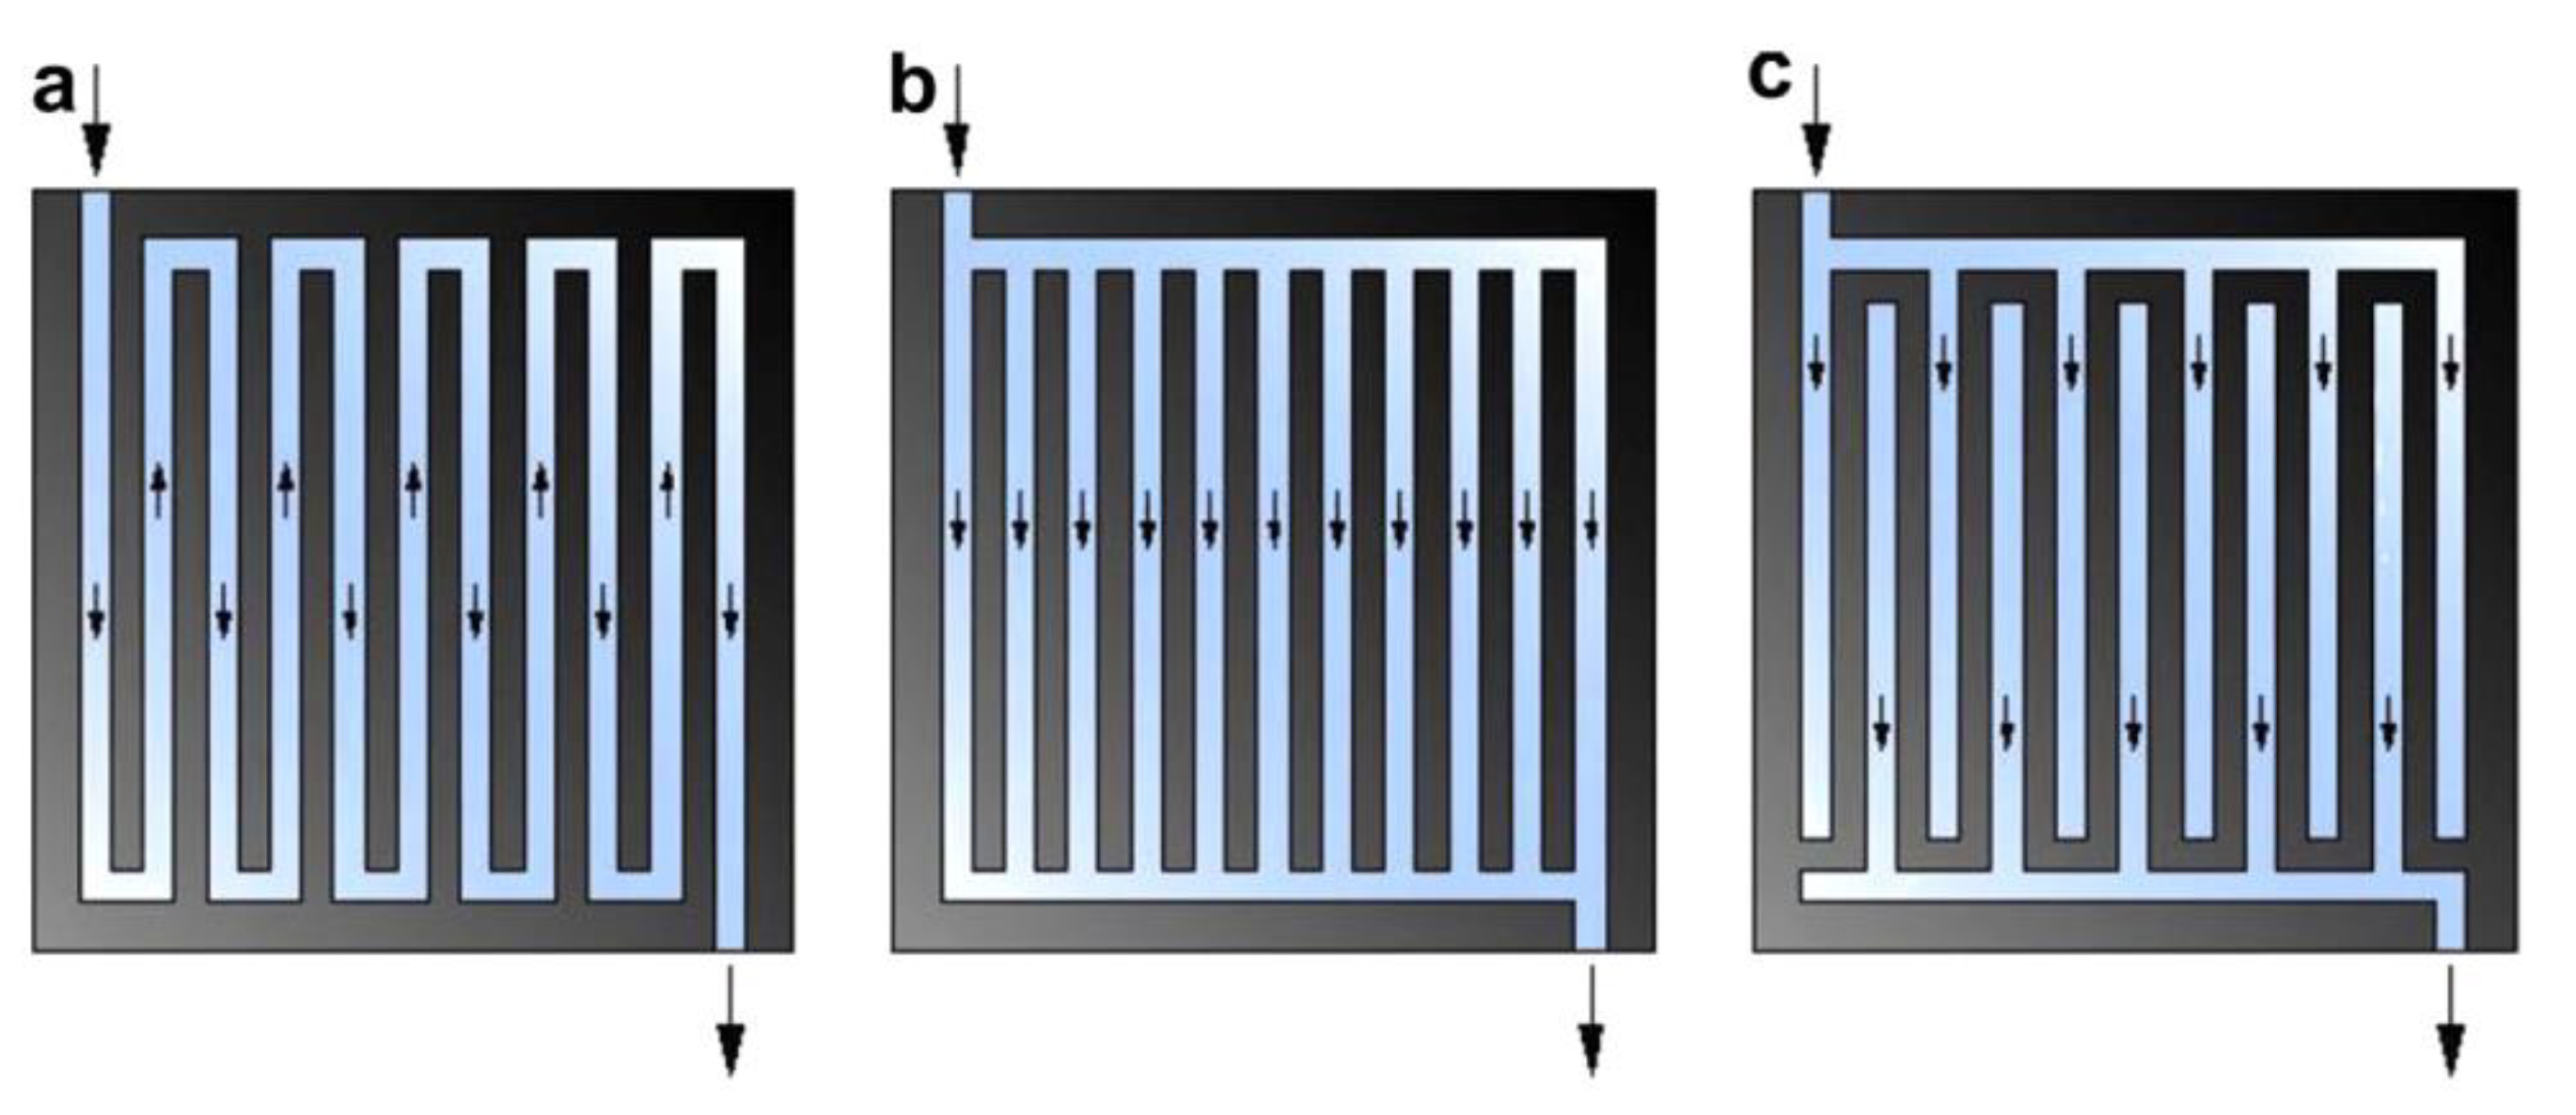
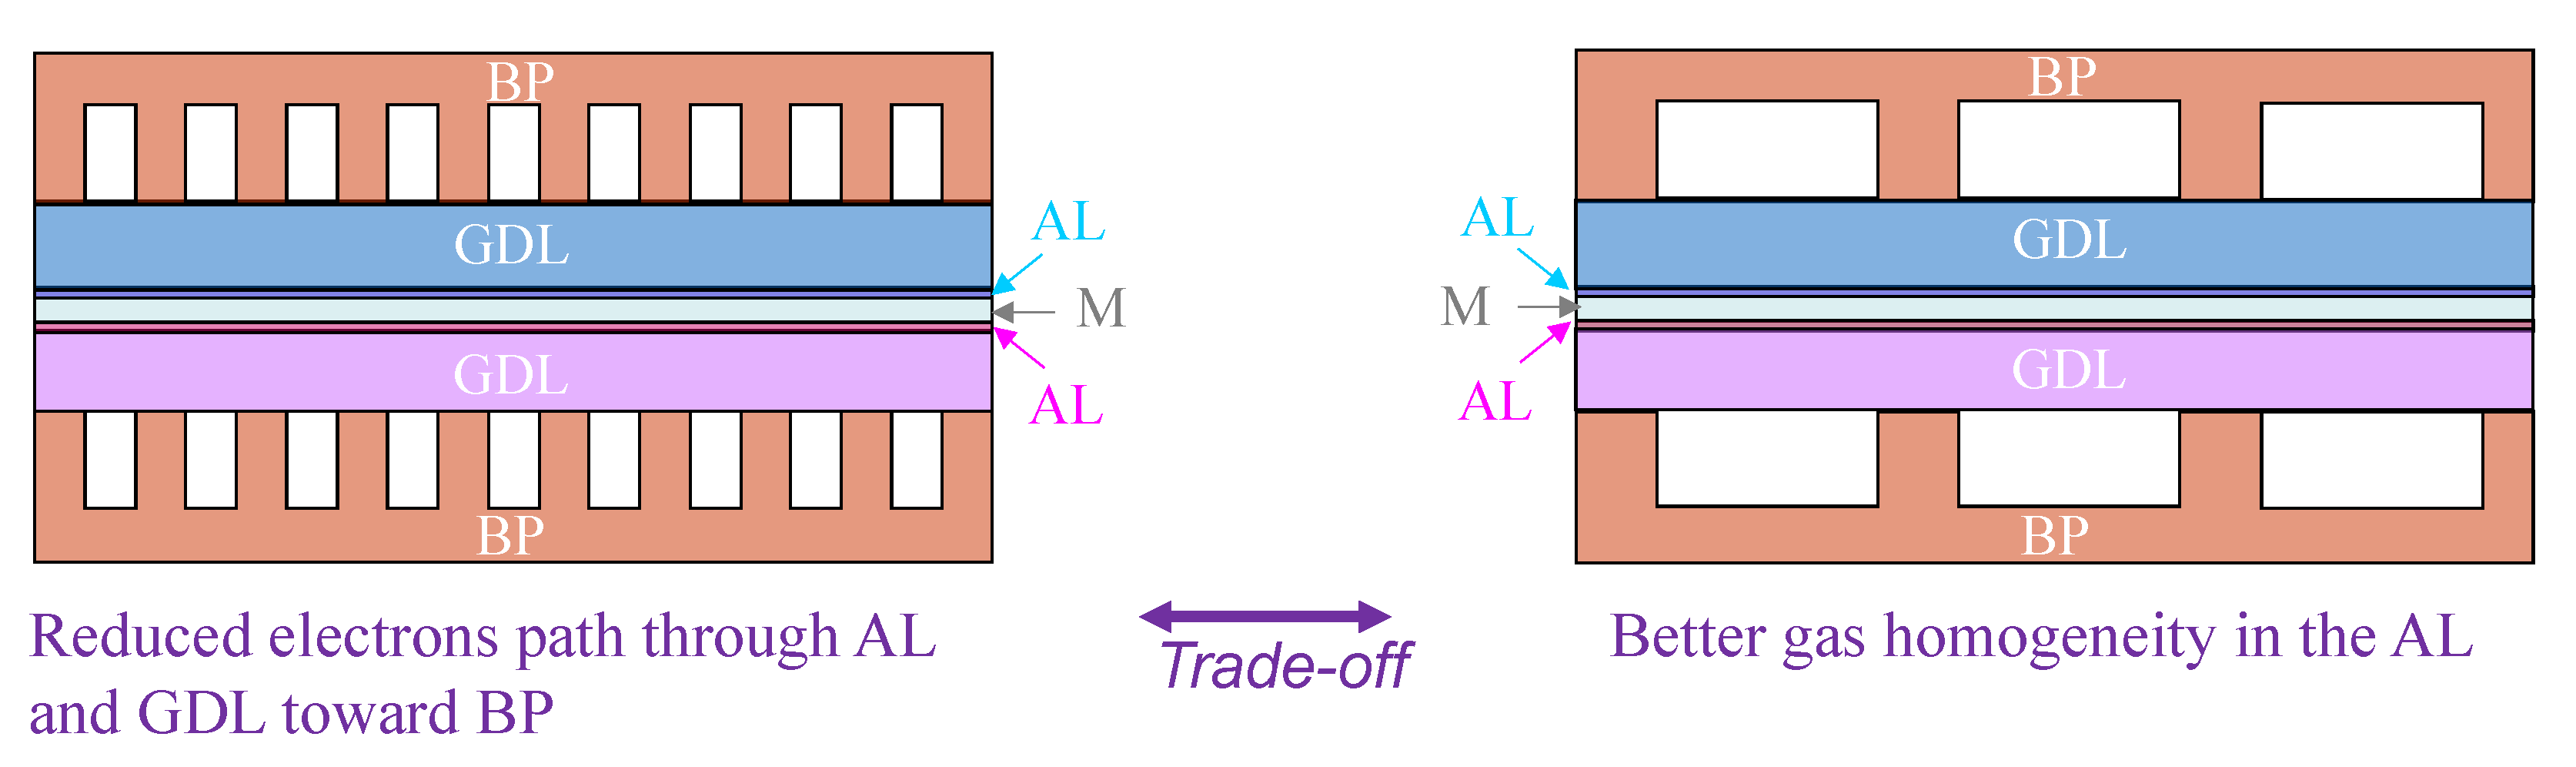
The design of the channels (shape of the channel and the inlet and outlet layout shown in Figure 12) is the result of a thorough study to ensure the best possible performance of all these functions by guaranteeing the best distribution (temperature and reactants) on the active surface of the MEA [35]. In particular, it is the result of a trade-off between, on the one hand, a large width synonymous with good homogeneity of the reactants, low pressure losses and a reduced risk of clogging, and, on the other hand, a narrow width reducing Joule losses [36].
Figure 13 gives a schematic illustration of BP channel design trade-off. In the same way, the channels carrying the refrigerant fluid enter near the reactant supplies (thus the least humid) and exit near the air and exhausts with the highest moisture content. Indeed, the saturating vapor pressure evolves according to an exponential law (Antoine’s experimental law). For example, the relative humidity of a mixture at constant pressure increases by 18% when the temperature only rises from to .
There are a number of technologies available to achieve the channel implementation. For reasons of compactness () and production rate (in anticipation of high-volume production), the automotive industry favors the use of deep-drawn metal plates to which an anti-corrosion coating is added. Initially, steel plates were treated with an anti-corrosion precious metal deposit, but today good properties in terms of electronic conductivity and corrosion resistance are obtained without the use of any precious metals.
In conclusion, this component can be considered to be practically mature. Nevertheless, some progress still needs to be made to further reduce its cost in order to achieve a goal compatible with a mass market. Indeed, in the 2020 niche markets, BPs account for about 30% of the price of a PEM-type FC stack [35].
4. The Fuel Cell System (FCS)
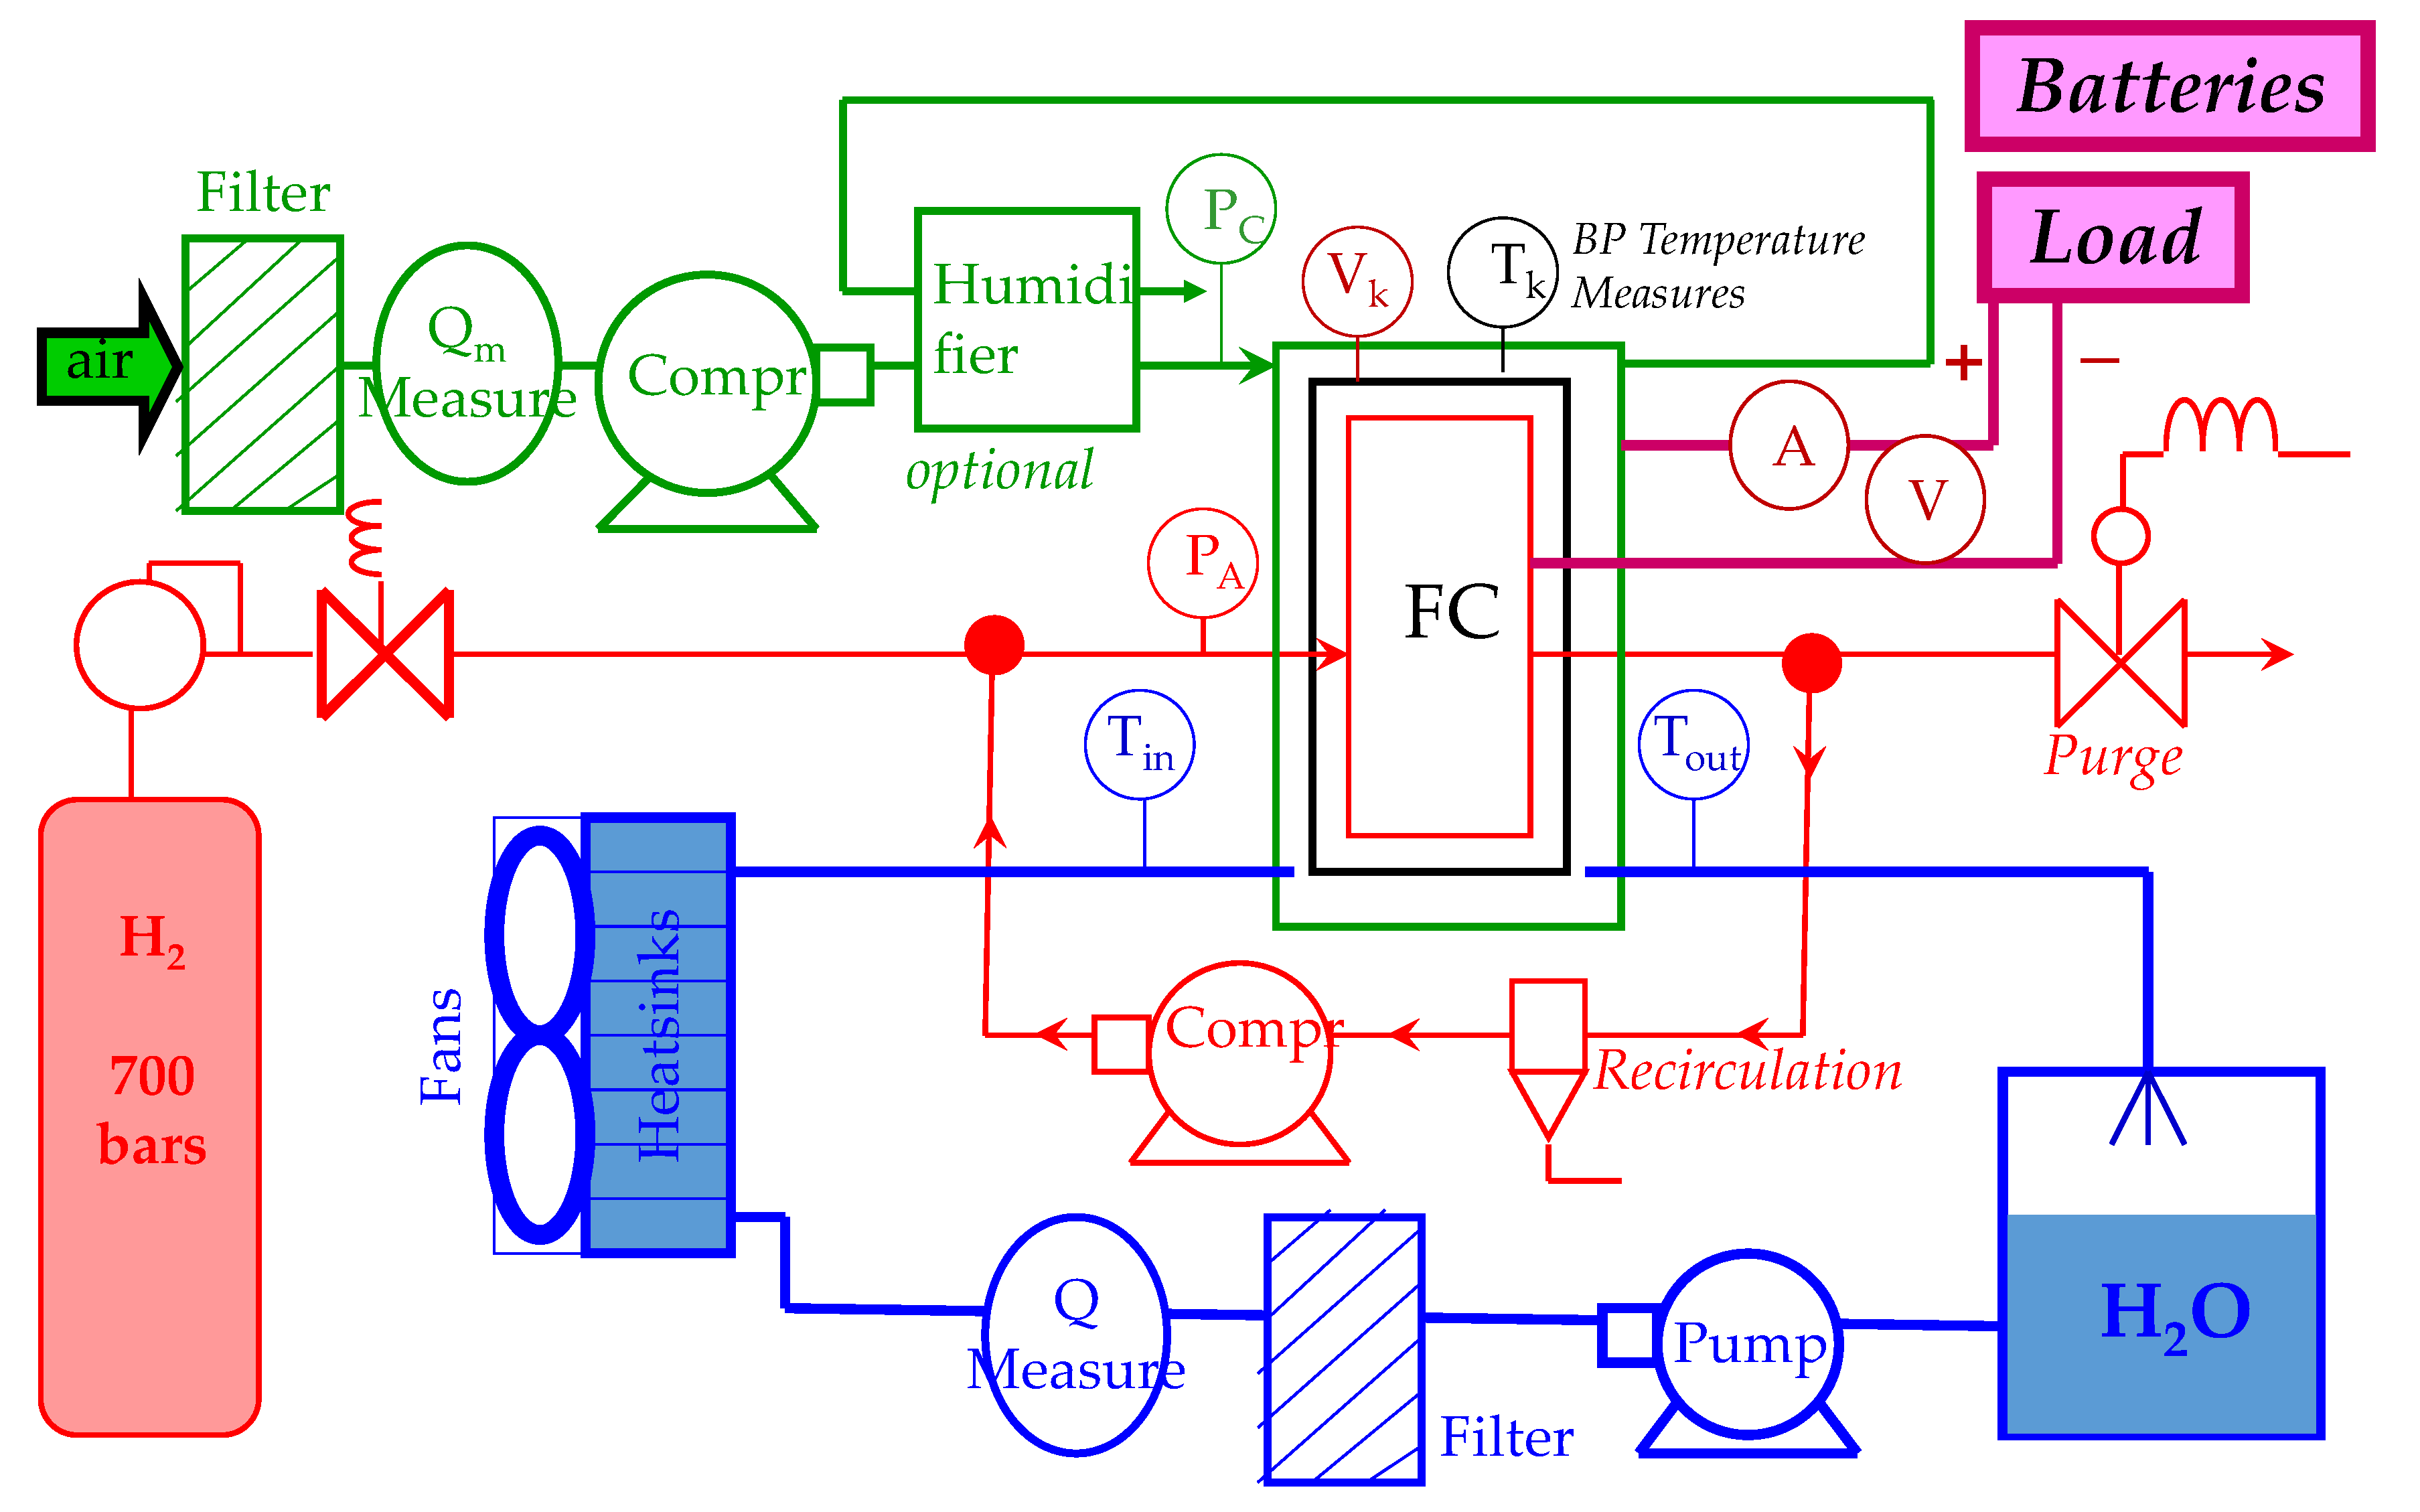
The FC is the reactor in which the electrochemical reaction takes place. It is a power converter which must be placed in suitable operating conditions (temperature, pressures, etc.) and receive the reactants necessary for its operation since the storage (energy) of these has been remoted. To obtain electrical power on demand, the FC itself is hence surrounded by auxiliaries with coordinated operations. This assembly constitutes the FCS. Figure 14 shows a synoptic diagram of it. There are four interacting subsystems controlled by dedicated local loops.
4.1. The Air Line
The air line (shown in green in Figure 14) is mass flow controlled using an air compressor. The flow set point is imposed by the current delivered by the FC to the load and its own auxiliaries. The air taken from the outside (free and not requiring an on-board tank) must be filtered in order to avoid poisoning the cathode and in particular its catalyst which is sensitive to oxygen monoxide (CO), soot (HC), etc., at extremely low quantities. Moreover, as the dry air consists essentially of nitrogen (78.08%), the air compressor must set in motion by overpressure a very large mass of air in order to supply the sufficient quantity of oxygen (20.95% of the dry air) to the triple contact point of the cathode. As previously explained, a stoichiometric coefficient of 1.6 is preferred, i.e., the air line must supply almost twice as much air as is required by the (cathode) reaction. In spite of the huge progress made on this component, the air compressor has one of the most important energy consumptions and hence a large impact on the overall efficiency of the FCS. In [37], J-P Poirot-Crouvezier proposes an FCS dedicated to traction capable of providing a rated net power of using a FC stack powered by a low pressure () air compressor of , thus representing of the total auxiliary consumption of .
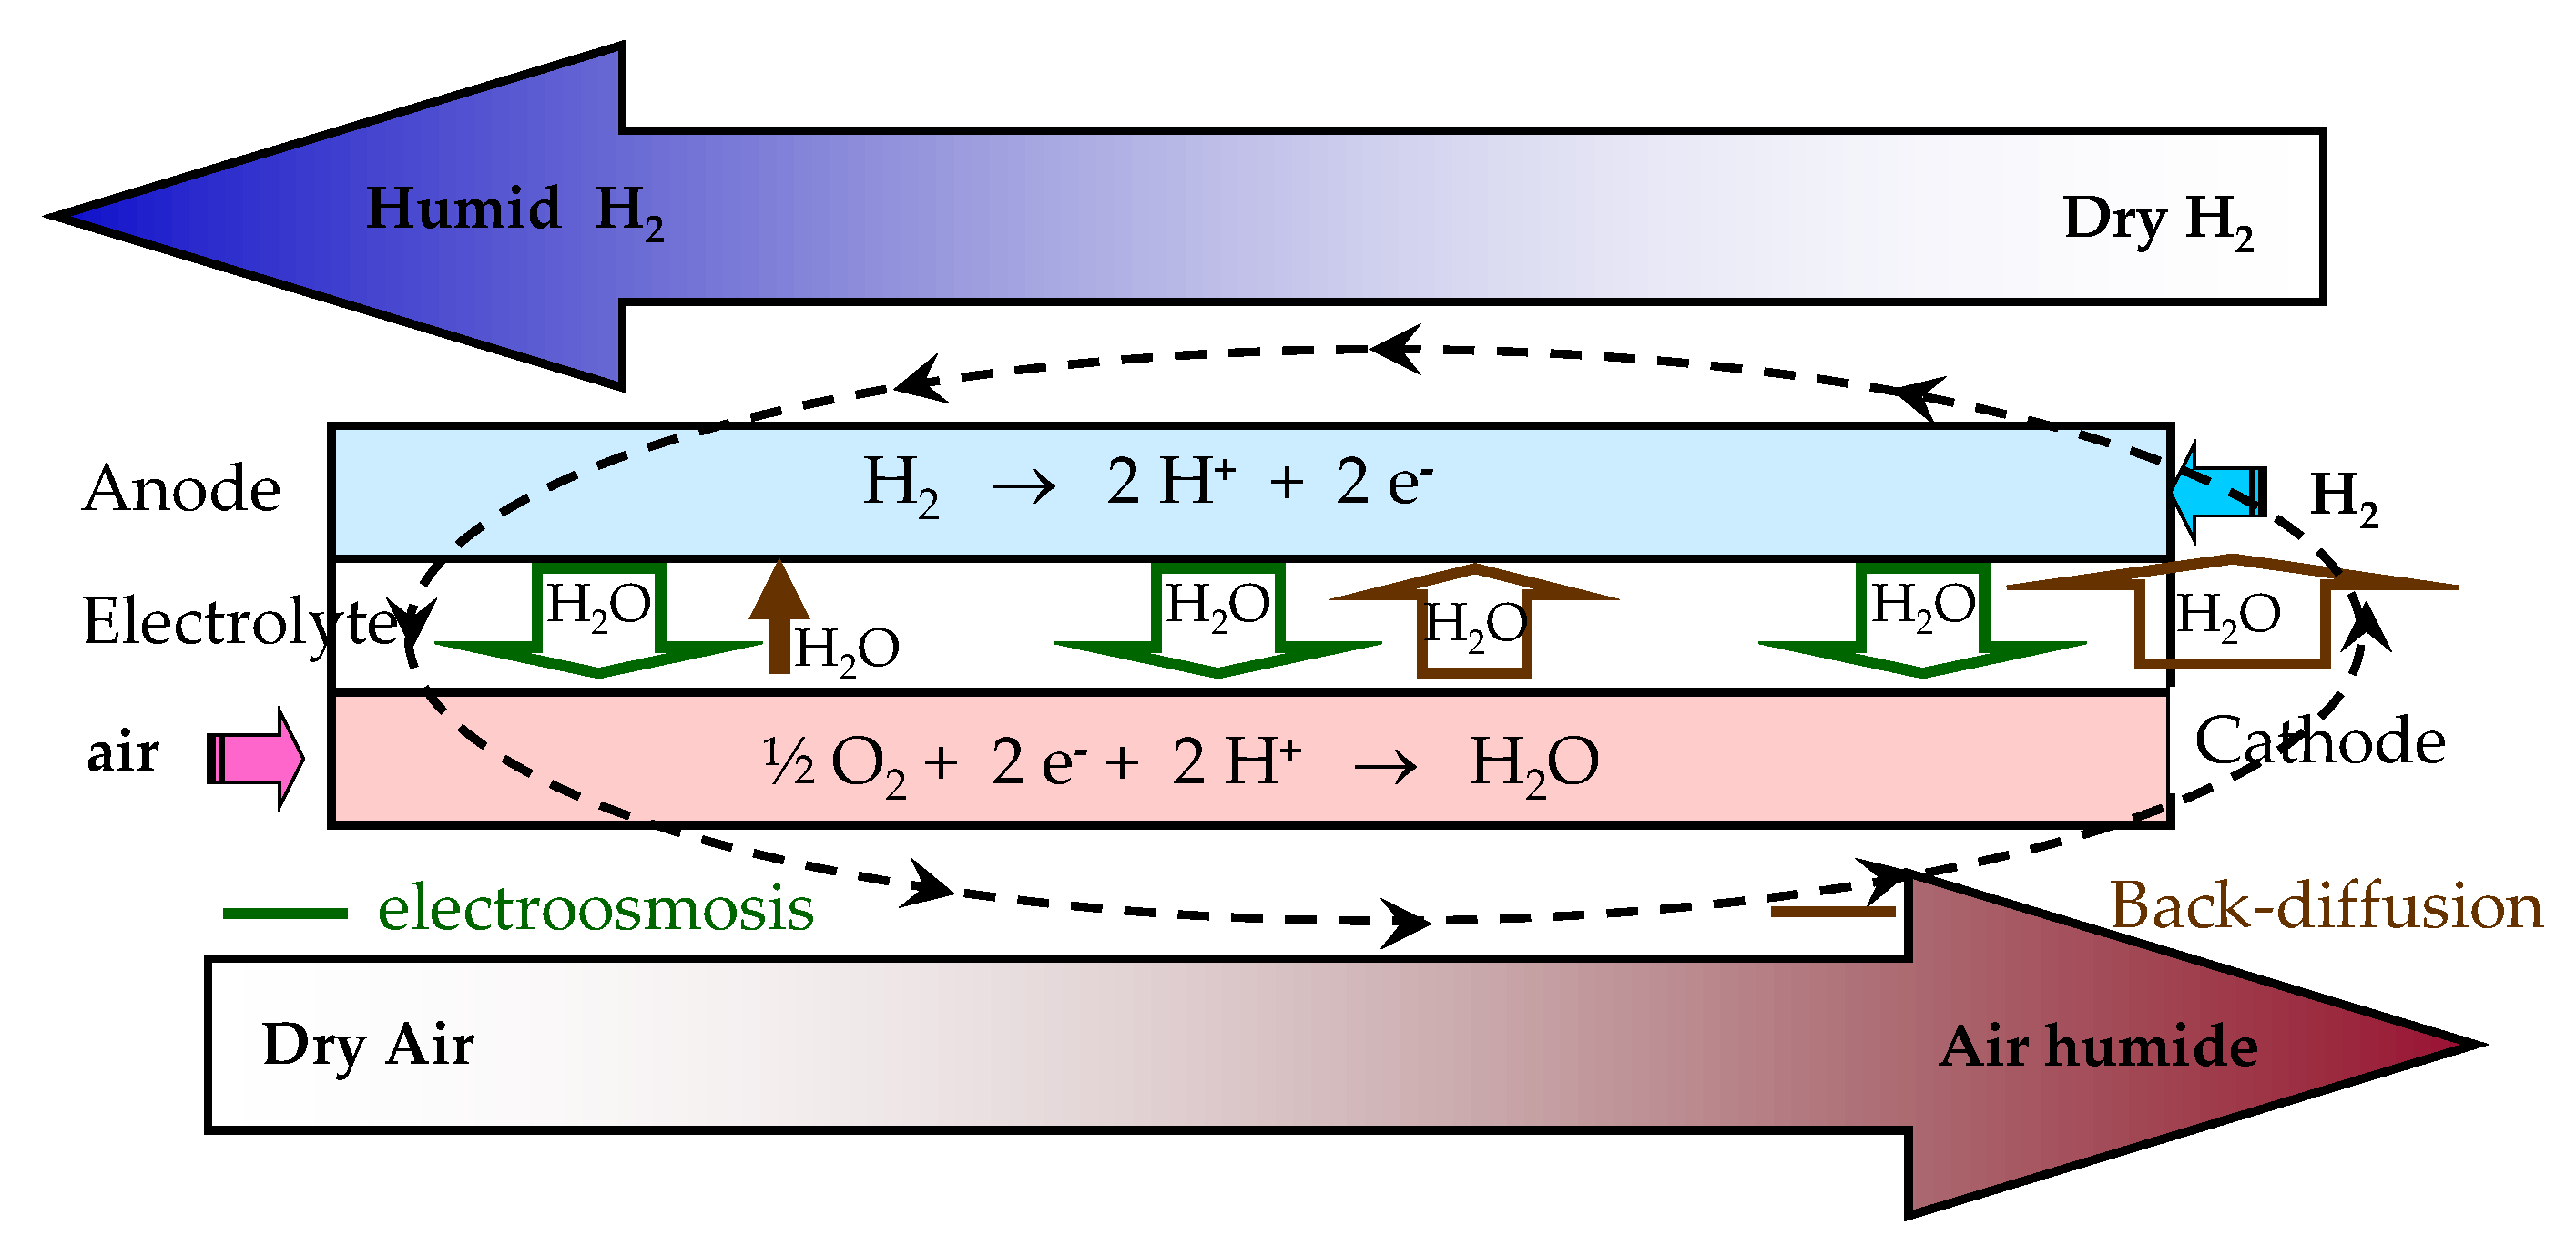
The diagram shows an air humidifier in the air supply. It enables us, by diffusive exchange and heat transfer, to inject part of the humidity from the hot air exhaust to its initially dry and fresh air inlet. In this way the humidifier homogenizes the temperatures and relative humidity levels in the cathode, avoiding dry areas at the channel outlets and saturated or even flooded areas at the outlets. Two technologies coexist [37]. The first one consists in interfacing the humid air at the cathode outlet with the dry air entering via a polymer membrane of the same type as the one used as the PEMFC electrolyte [38]. It offers the double property of being gastight and water permeable [39]. The second one uses an enthalpy wheel made of water-absorbent materials [39,40]. This proven technology is derived from building air-conditioning systems. In the FCS case, it absorbs moisture at the cathode outlet and deposits it at the cathode inlet. It should be noted that Toyota has proposed and produced the first FCS without any humidifier since 2014 [39,41]. It simplifies the system, reduces pressure drop, reduces the price, and enhances the system compactness by eliminating a component. To achieve this, Toyota has reduced the thickness of the proton-exchange fluoropolymer membrane (by 1/3). In addition to improving proton conductivity, this thinning reinforces the phenomenon of water diffusion between the cathode, where water is produced () and the anode, where water is removed by migration of protons (electro-osmosis phenomenon already described in Section 3.1.). Since electro-osmosis is uniform and back-diffusion has non-uniform distribution because it is intimately dependent on the local concentration gradient between the cathodic and anodic water vapor partial pressures, a water circulation that homogenizes the relative humidity occurs if care is taken to choose the anode and cathode flows in counter current (Figure 15). It is this reverse flow management combined with a reinforcement of the back-diffusion that ensures, by design, an adequate and homogeneous humidification of the cell.
Finally, the air mass flow is measured with a hot-wire flowmeter, which ensures a high measurement dynamic. It is the mechanical dynamics of the compressor unit () that limit the dynamic response of the air loop. In order to ensure the correct functioning of the FC and to avoid any deficiency phenomenon, the air flow rate is assigned a stoichiometric coefficient greater than 1: typically 1.6 (with a working range between 1.3 and 2.0).
4.2. The Dihydrogen Line
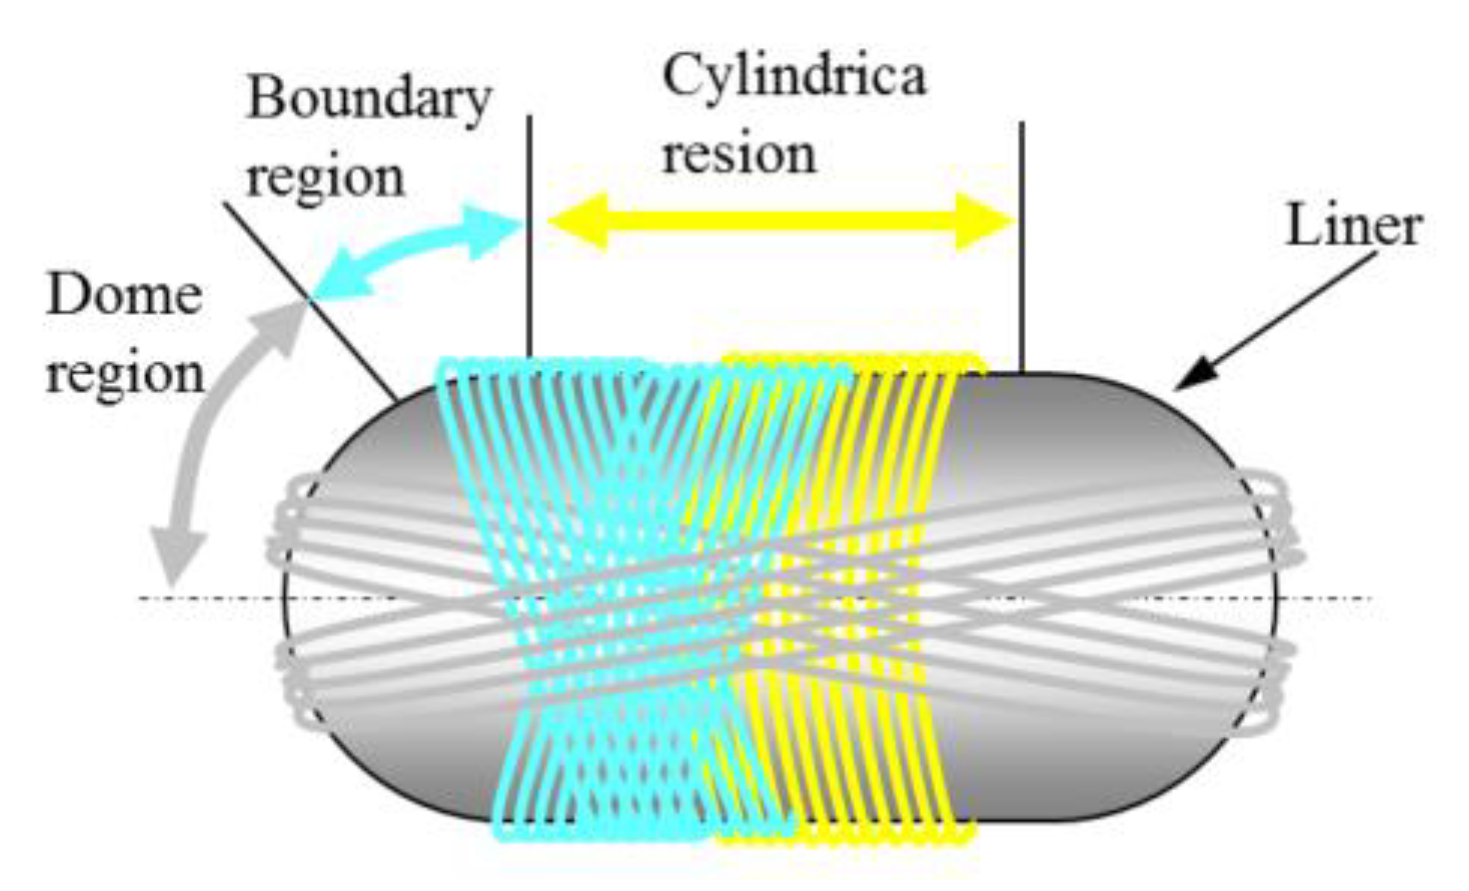
Unlike the air line, which has a natural supply, the dihydrogen line (shown in red in Figure 14) starts with a technology tank. The cost and size of the latter are non-negligible. Indeed, given its very low molar mass (), dihydrogen must be stored at high pressure and therefore with optimized shapes and materials. Today, car manufacturers are integrating cylindrical-shaped tanks (with spherical heads) capable of withstanding a pressure of throughout the life of the vehicle and even beyond (reuse or use for another, possibly less restrictive, use). It should be noted that two high-pressure standards still coexist: type III tanks () and type IV tanks (). Their mass density is similar because the need to maintain double pressure requires the use of a larger quantity of material. Conversely, the volume density is clearly favourable to type IV tanks [37]. While industrial vehicles (trucks, buses) have, for a time, favored the bulkier solution (type III), it seems that uses (light vehicles and heavy goods vehicles) are converging towards a common technology in order to reduce costs through standardization (manufacturing and approvals). The tank consists of three functional layers [41,42]. From the core to the outside (Figure 16), there are (for type IV) (i) the liner which completely blocks the passage of the molecules and is commonly made of a polymer material with an internal metallic deposit essentially made of aluminium; (ii) a structure resistant to mechanical stress made with a carbon fibre reinforcement; (iii) an outer protective layer made of glass fibres combined with a resin. With this type of tank, it is now possible to achieve a ratio between the mass of compressed and the mass of the tank of the order of 6% while the target is set to 8%. Among the vehicles on the market are the Toyota Mirai with a tank mass of and a mass density of , and the new Huyndai Nexo with a tank mass of and a mass density of very close to the setting target [43].
Embedding in a light vehicle enables a range over the WLTC certification cycle of about ( per ) [37]. Using the ideal gas law (see below) at the standard temperature of shows that this vehicle must carry a tank of (interior volume). However, a temperature of must be considered in order to take a safety margin in relation to the maximum storage temperature of the vehicle (). An internal volume of is therefore adopted.
In addition, by adopting a 6% gravimetric density for the storage system, the (light vehicle) requires a tank with an empty mass of , or when the tank is full. For comparison, the same amount of stored energy requires about of gasoline or diesel, which is about of gasoline or of diesel fuel. Taking a more realistic view of range, this means a tank of about for the petrol engine and for the diesel one. Moreover, this specific tank has a negligible mass and is perfectly modular in shape to ensure the best vehicle integration.
From this realistic example, it can be deduced that, even if the gravimetric and volumetric densities as well as the shape factor of the tank are not as good as those of a hydrocarbon tank, hydrogen technology is already practical for long-distance mobility, compared to traditional hydrocarbon solutions. Of course, the production of polymorphic tanks is one of the promising lines of research to improve integration into the FCV.
In terms of cost and feasibility, FCV is also a much better option than BEV for low-carbon emission vehicles. A dihydrogen mass of has a specific energy of . Even assuming a high power-to-weight ratio of , a battery storing this quantity of energy requires an equivalent mass of . This mass could be reduced to to account a more efficient BEV, but this efficiency is offset by the higher mass (hence higher power demand for equivalent performance).
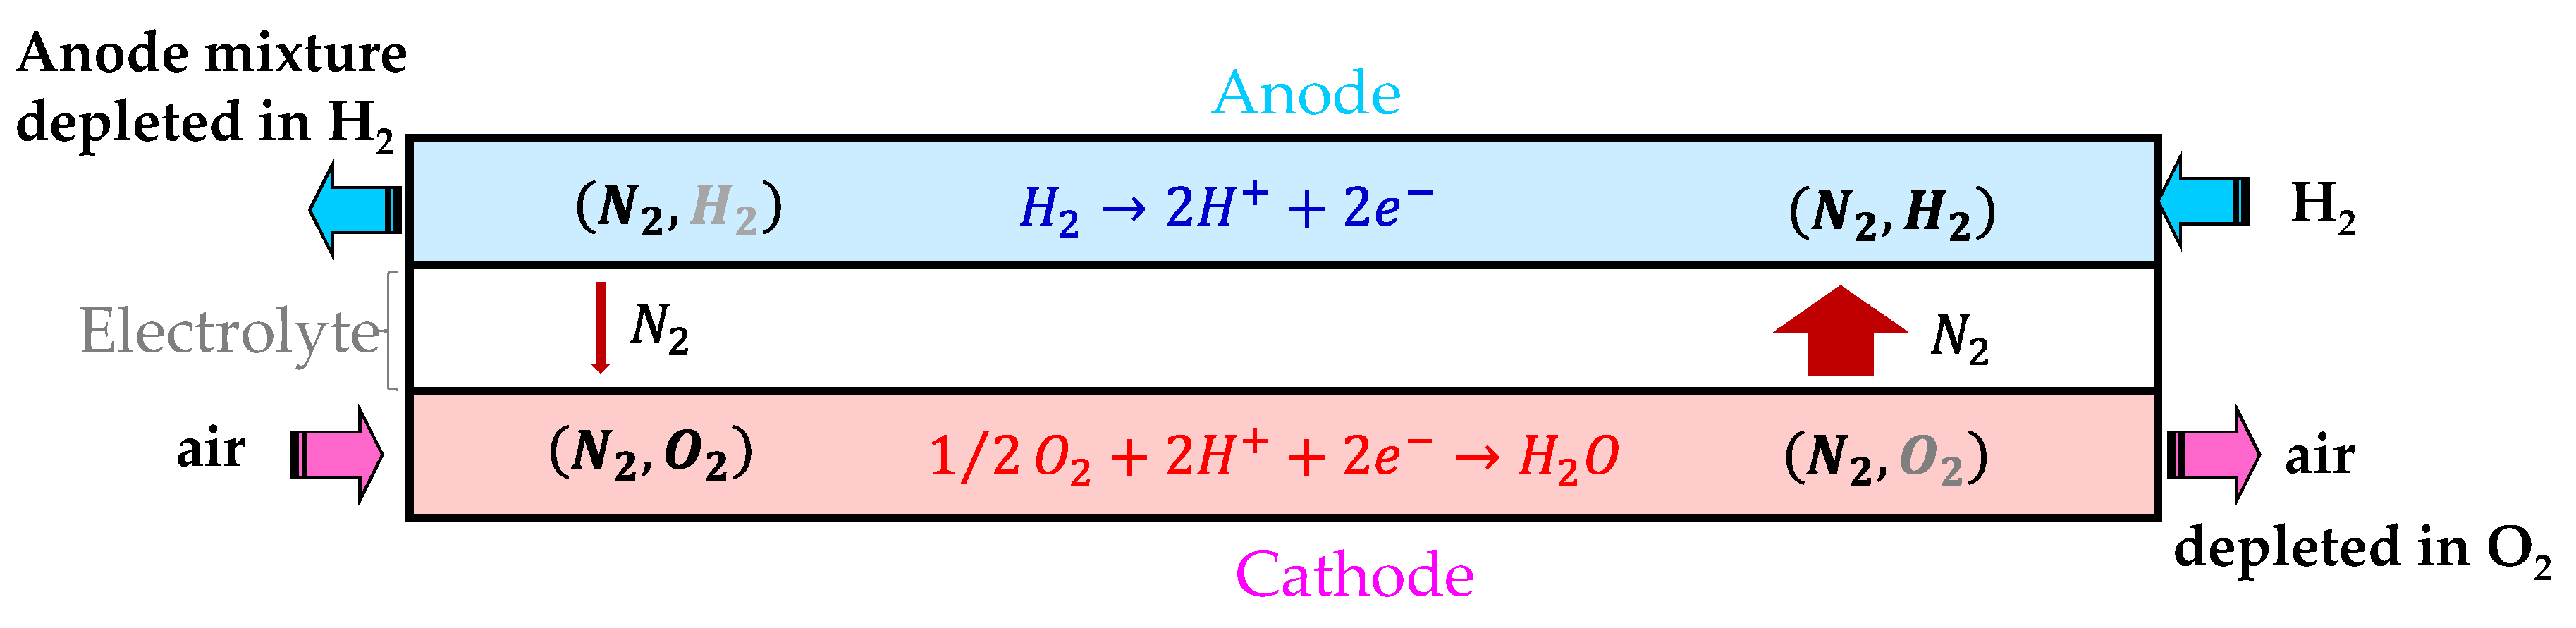
The dihydrogen line is pressure-controlled to ensure a zero differential between anode and cathode pressures, guaranteeing the mechanical integrity of the very thin polymer membrane. To do this, the controller actuates the solenoid valve located at the outlet of the regulator to admit more or less under pressure into the FC. The outlet of the line is normally blocked. The line is nevertheless purged periodically in order to evacuate the nitrogen which diffuses from the cathode (air) towards the anode and thus dilutes the dihydrogen. It is generally considered that one percent of fuel is globally lost during these successive purges. It is important to point out the need to ensure recirculation of in order to homogenize the partial pressures of the , and mixture over the entire surface of the MEA. For this purpose, it is necessary to create this return circuit in which the key element is the recirculation pump (high stress on its seal). Without recirculation, a nitrogen stratification occurs characterized by a low concentration of close to the exhaust. It hence generates a significant discrepancy in the current density distribution along the MEA. This phenomenon is illustrated schematically in Figure 17.
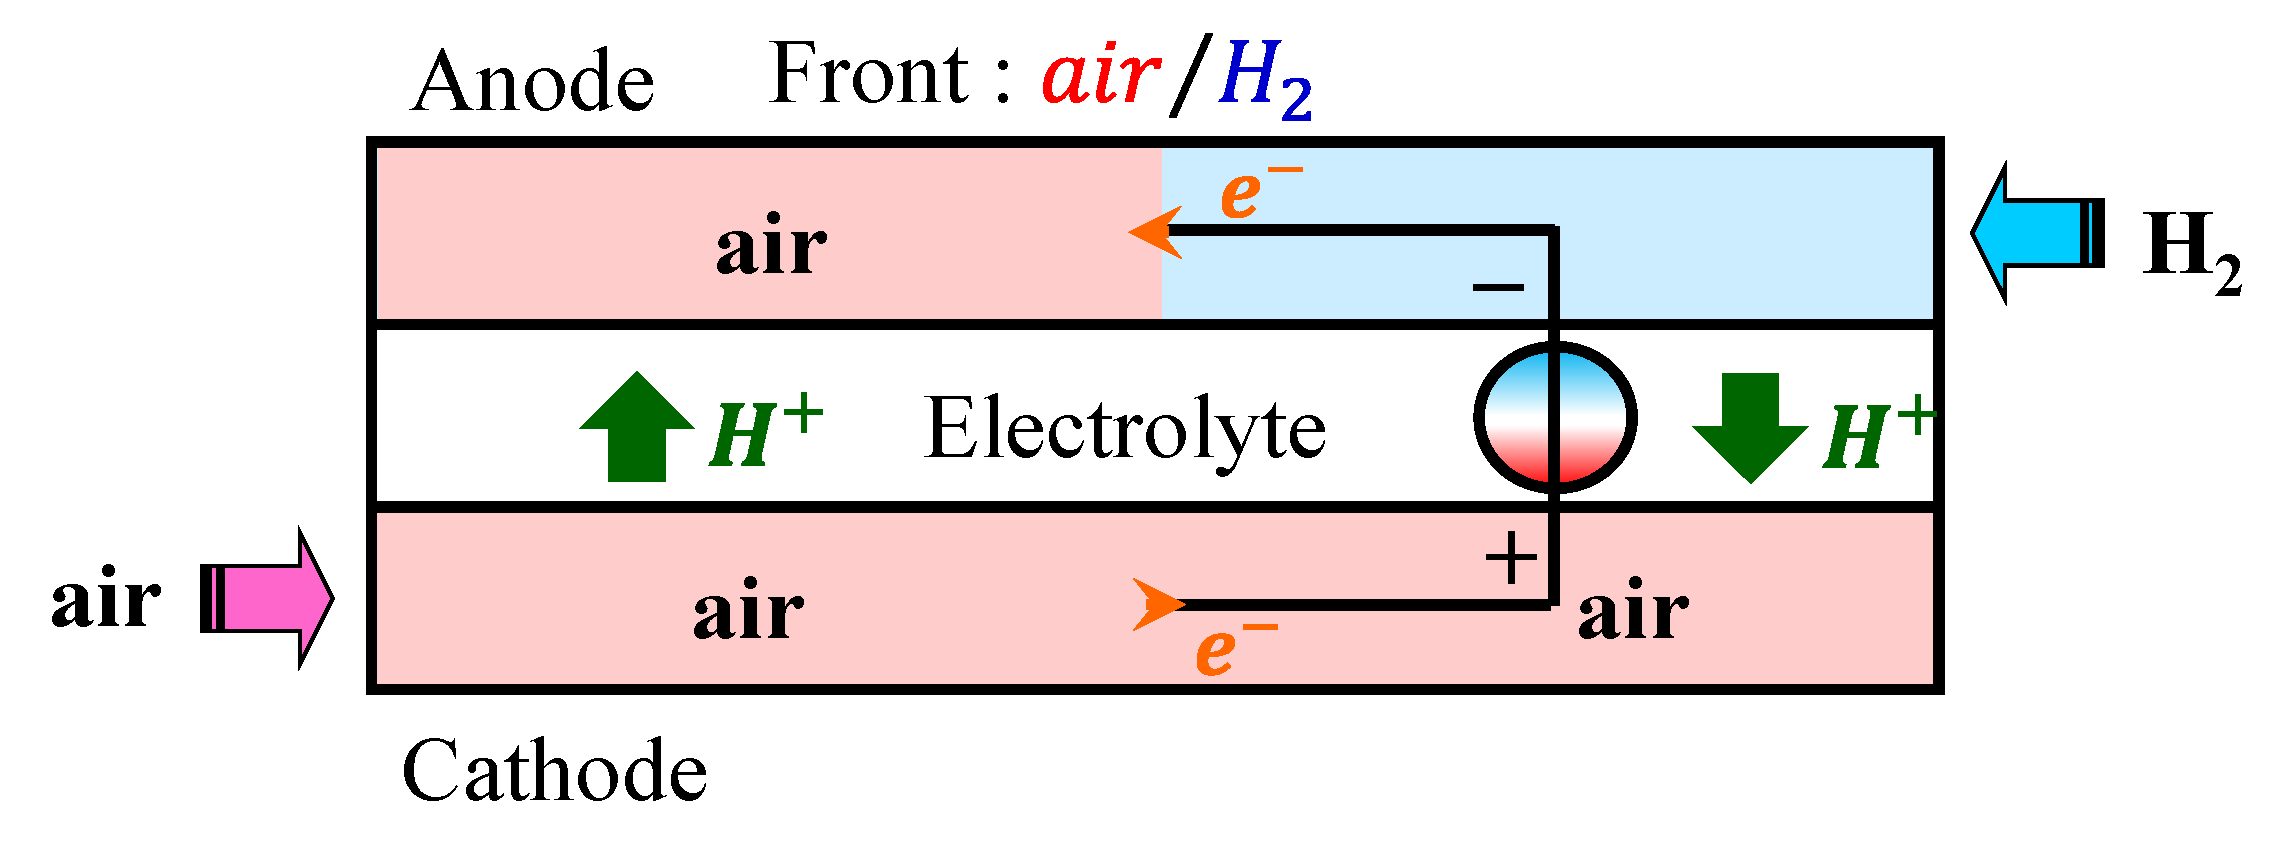
As the reactants are brought on demand it negatively impacts the PEMFC lifetime during the shutdown and start-up phases [44,45,46]. Indeed, the shutdown of the PEMFC causes air to fill the anode compartment, initially filled with dihydrogen. To restart the PEMFC, dihydrogen is again introduced at the anode which expels the air. During these two transient phases, the transient coexistence of dihydrogen and dioxygen at the negative electrode is observed. The surface of the MEA which is normally supplied (right part in Figure 18) behaves like a generator with a high electrical potential, because its current density is almost zero. The second part of the MEA (left part in Figure 18) is electrically interconnected to the first via the electrodes and can only behave as an electrical load because of the presence of dioxygen on either side of the membrane. Regarding the left side of the MEA:
- 1.
- The presence of electrons at the anode promotes the oxidation of the oxygen present, according to the electrochemical equation:
- 2.
- While at the positive electrode, the potential is sufficient to cause the oxidation of carbon or water , both present in the active layer, according to the electrochemical equation:
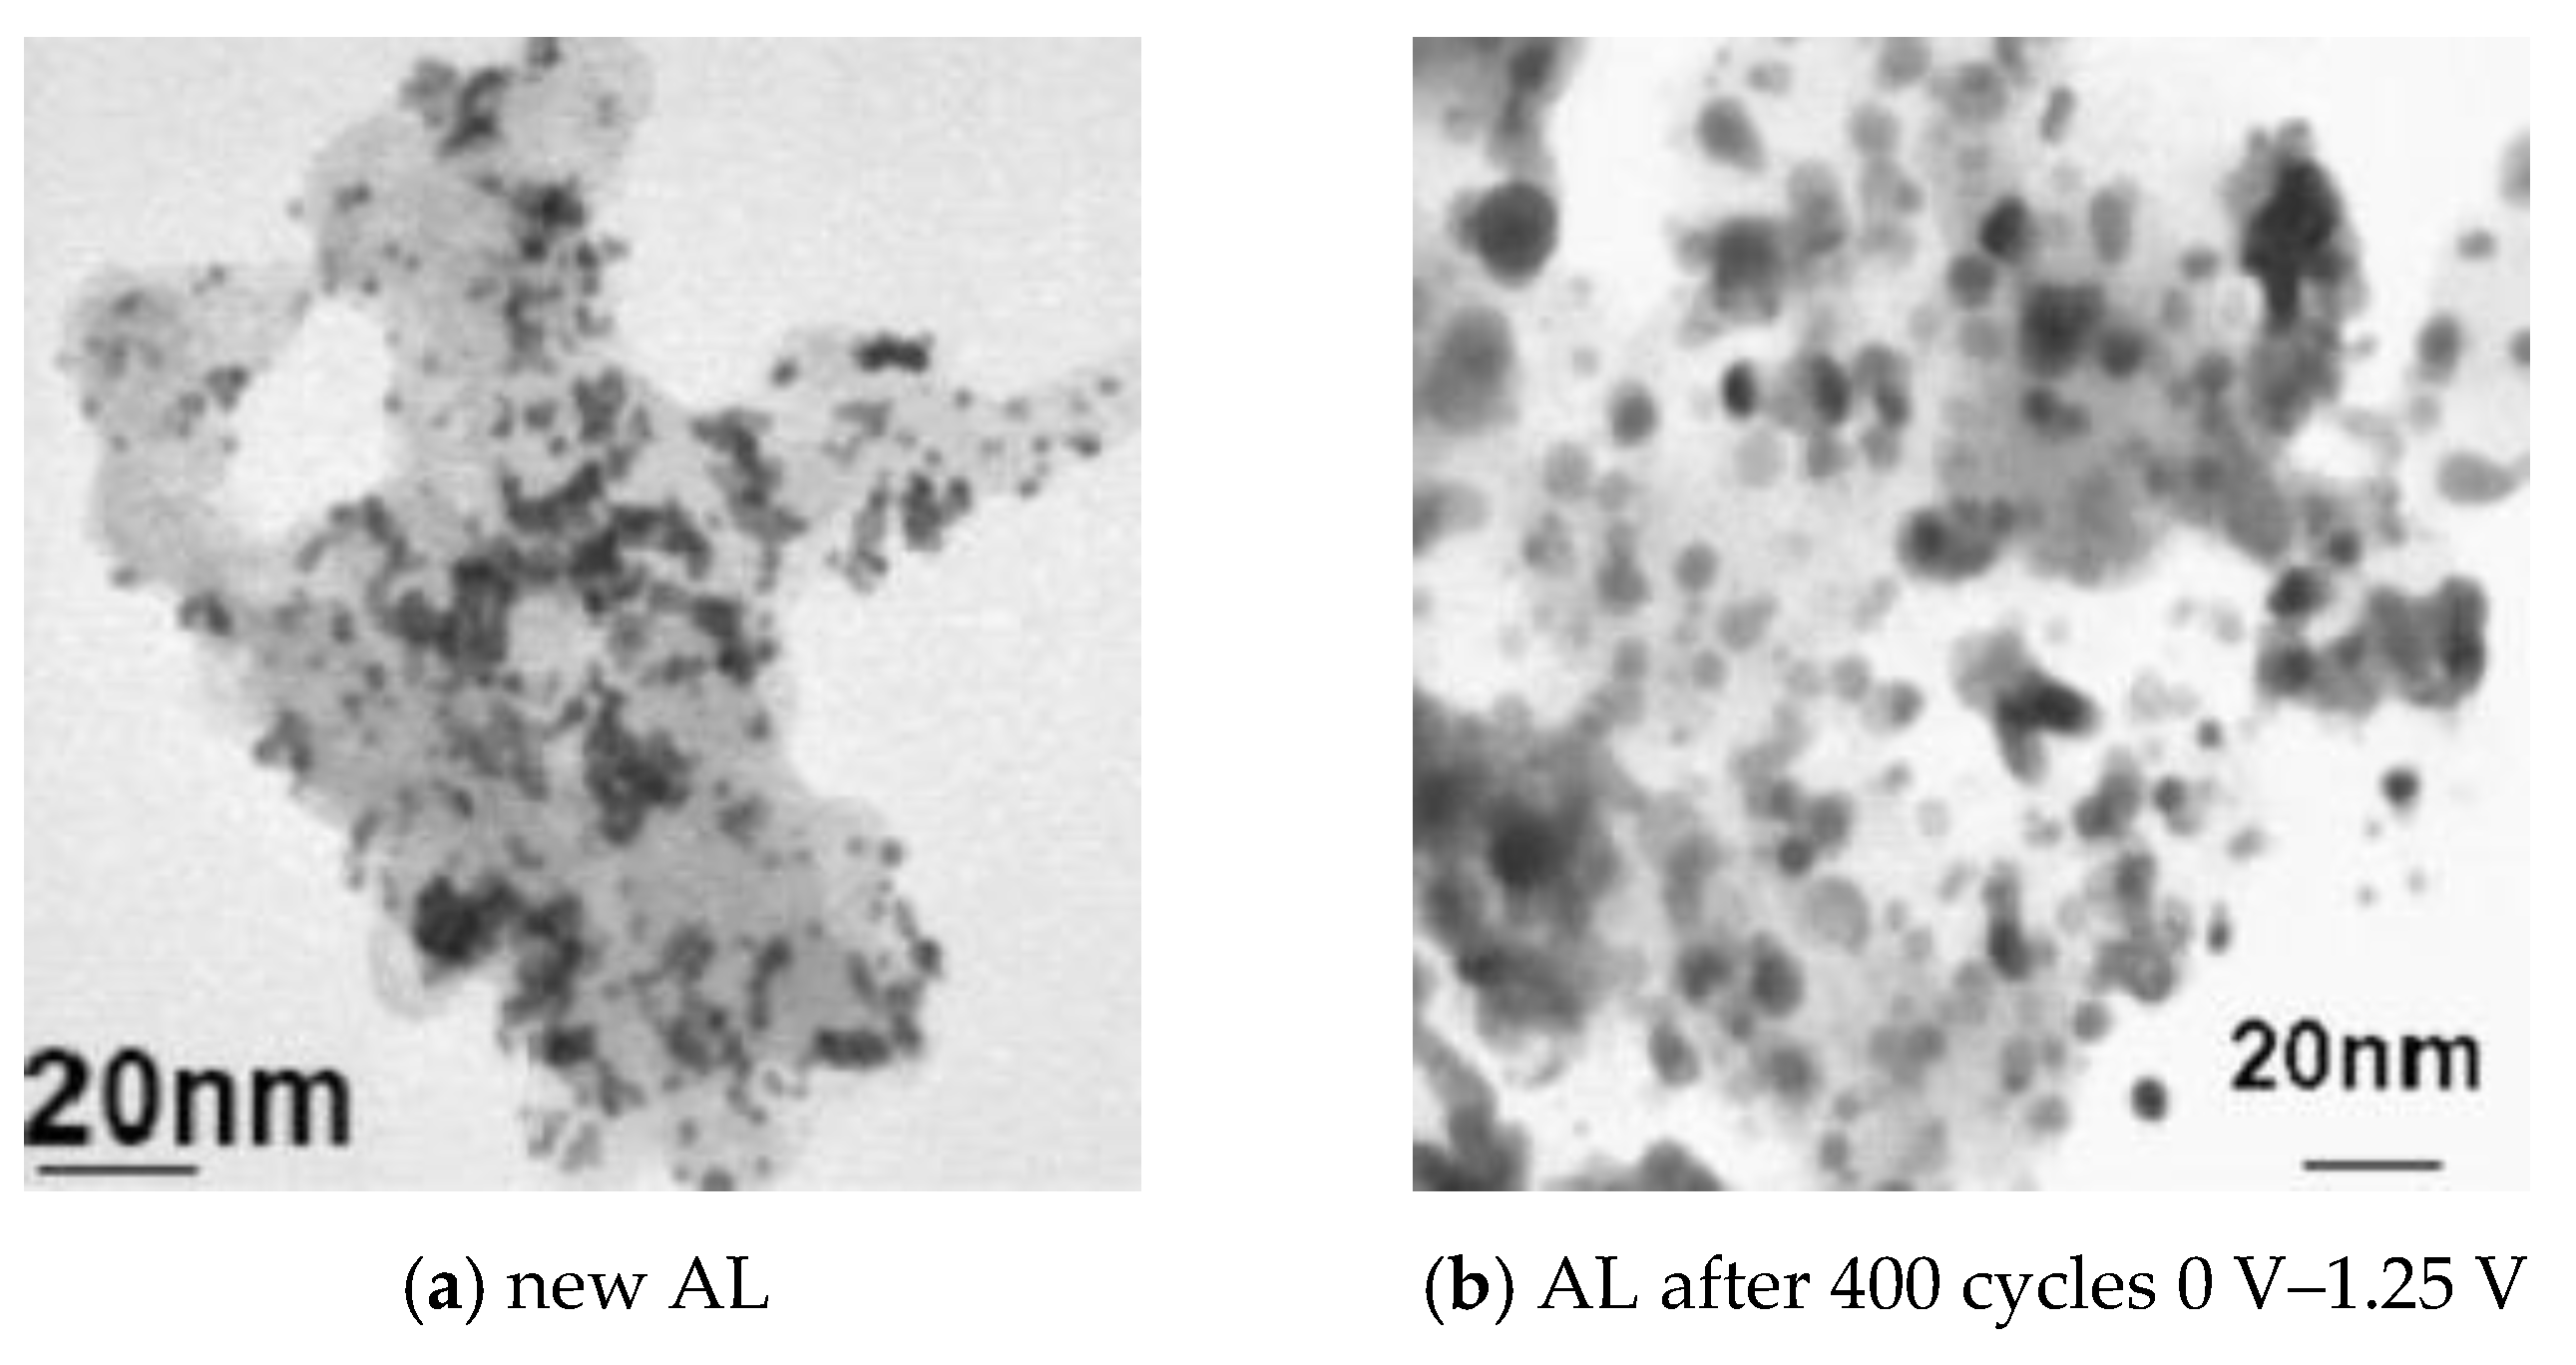
Thus, there is a circulation of protons in the expected direction on the right side of the MEA and in the opposite direction on the left side of the MEA and a production at the anode that is measurable in the laboratory. On the other hand, even if the electrochemical couple has a high activation energy involving a low internal current density, this phenomenon (revealed by the presence of ) causes corrosion of the carbon particles which are the support material of the Pt catalyst. It induces the destruction of the nanostructured surface of the AL associated with the dissolution of the platinum whose grains disperse in the structure and become inactive while aggregating with the water flow. Figure 19 illustrates this phenomenon by showing Transmission Electron Microscopy (TEM) images of new (a) and degraded (b) ALs. This phenomenon can lead to a very rapid decline in FC performance and must be combated by minimizing the duration of this front . To this purpose, as soon as the FC stops, the anode compartment is vigorously purged by the ambient air in order to quickly expel the residual dihydrogen.
4.3. The Electric Line
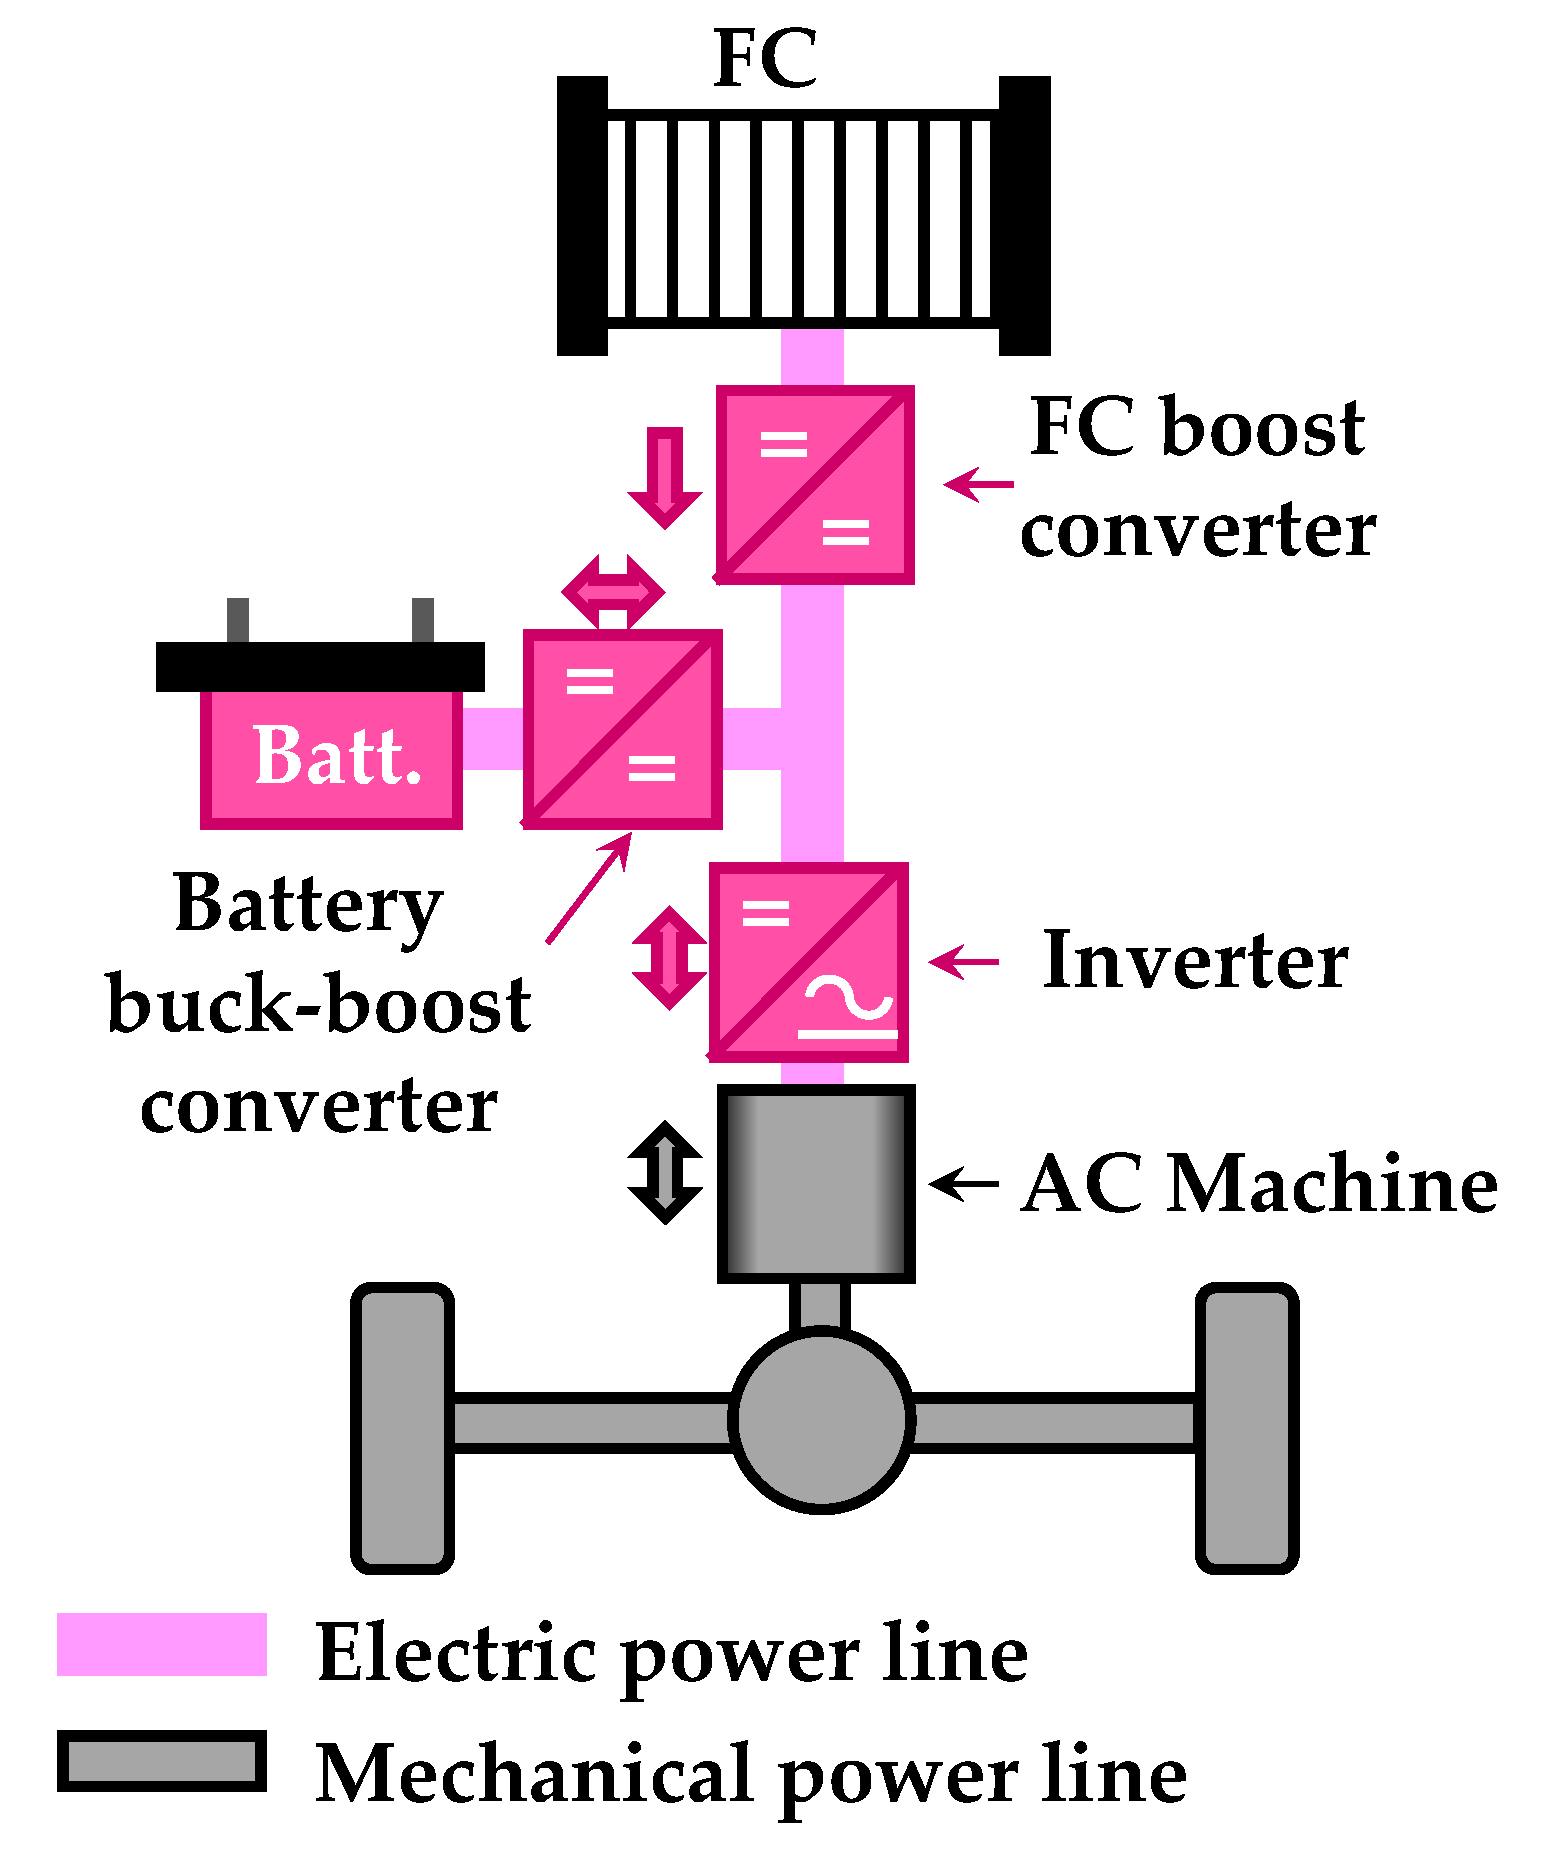
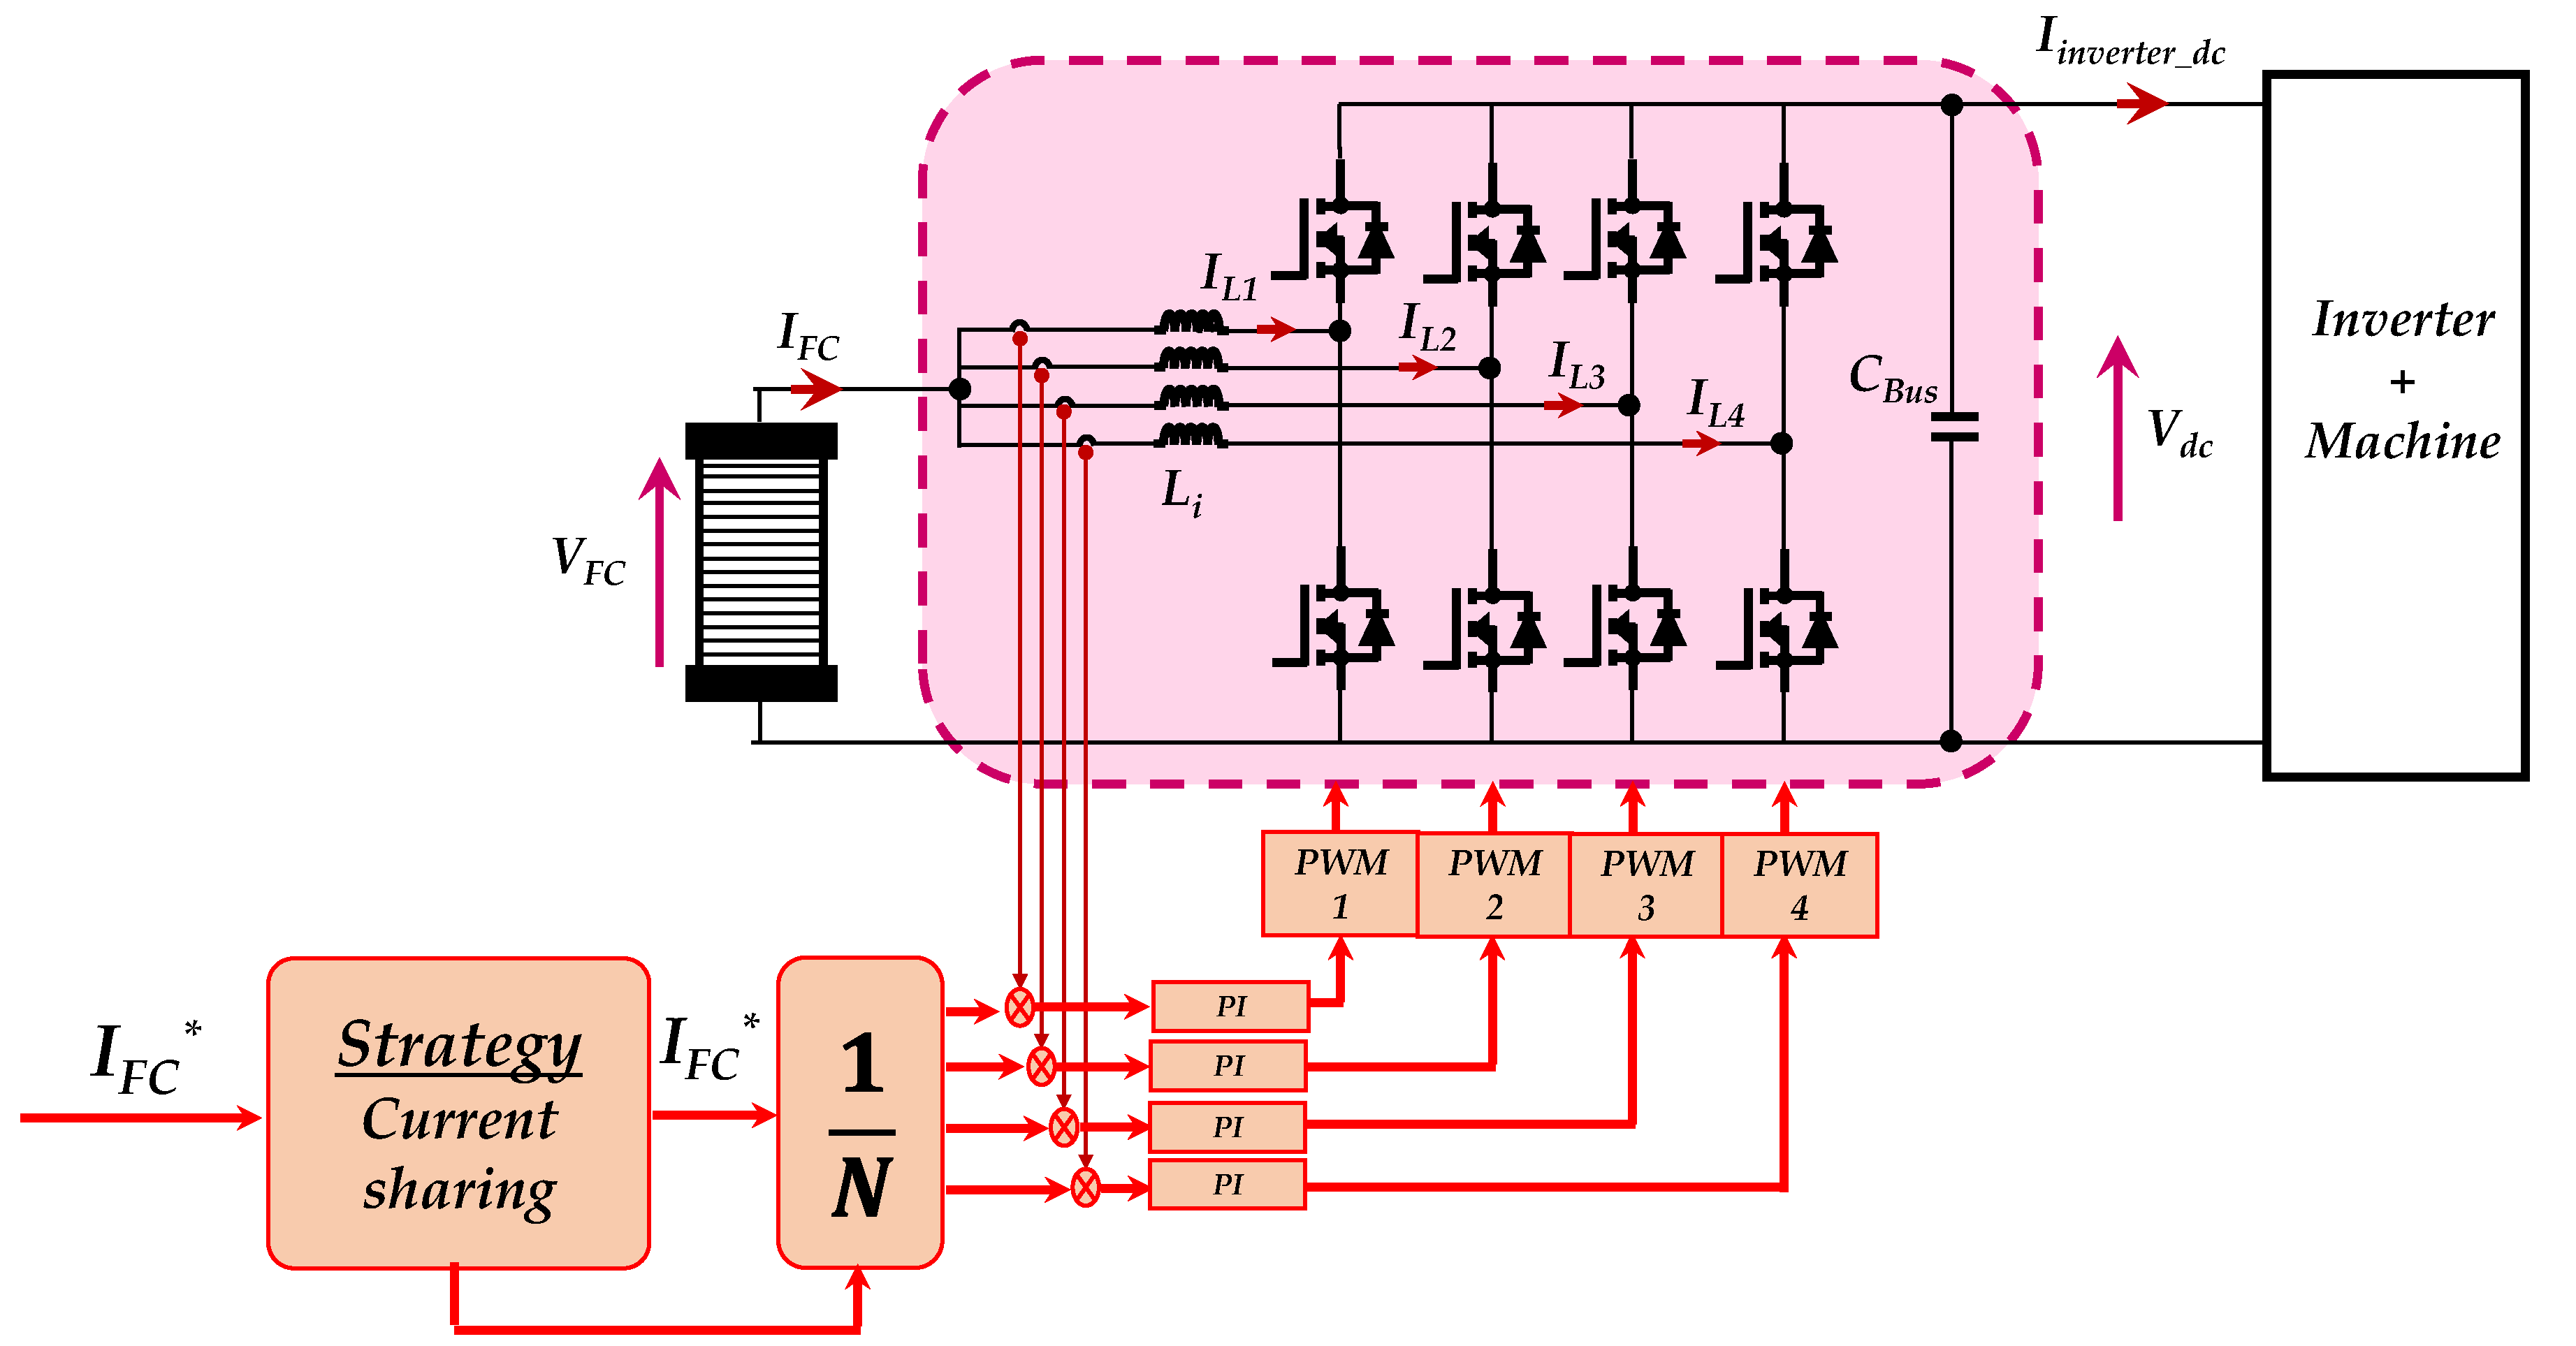
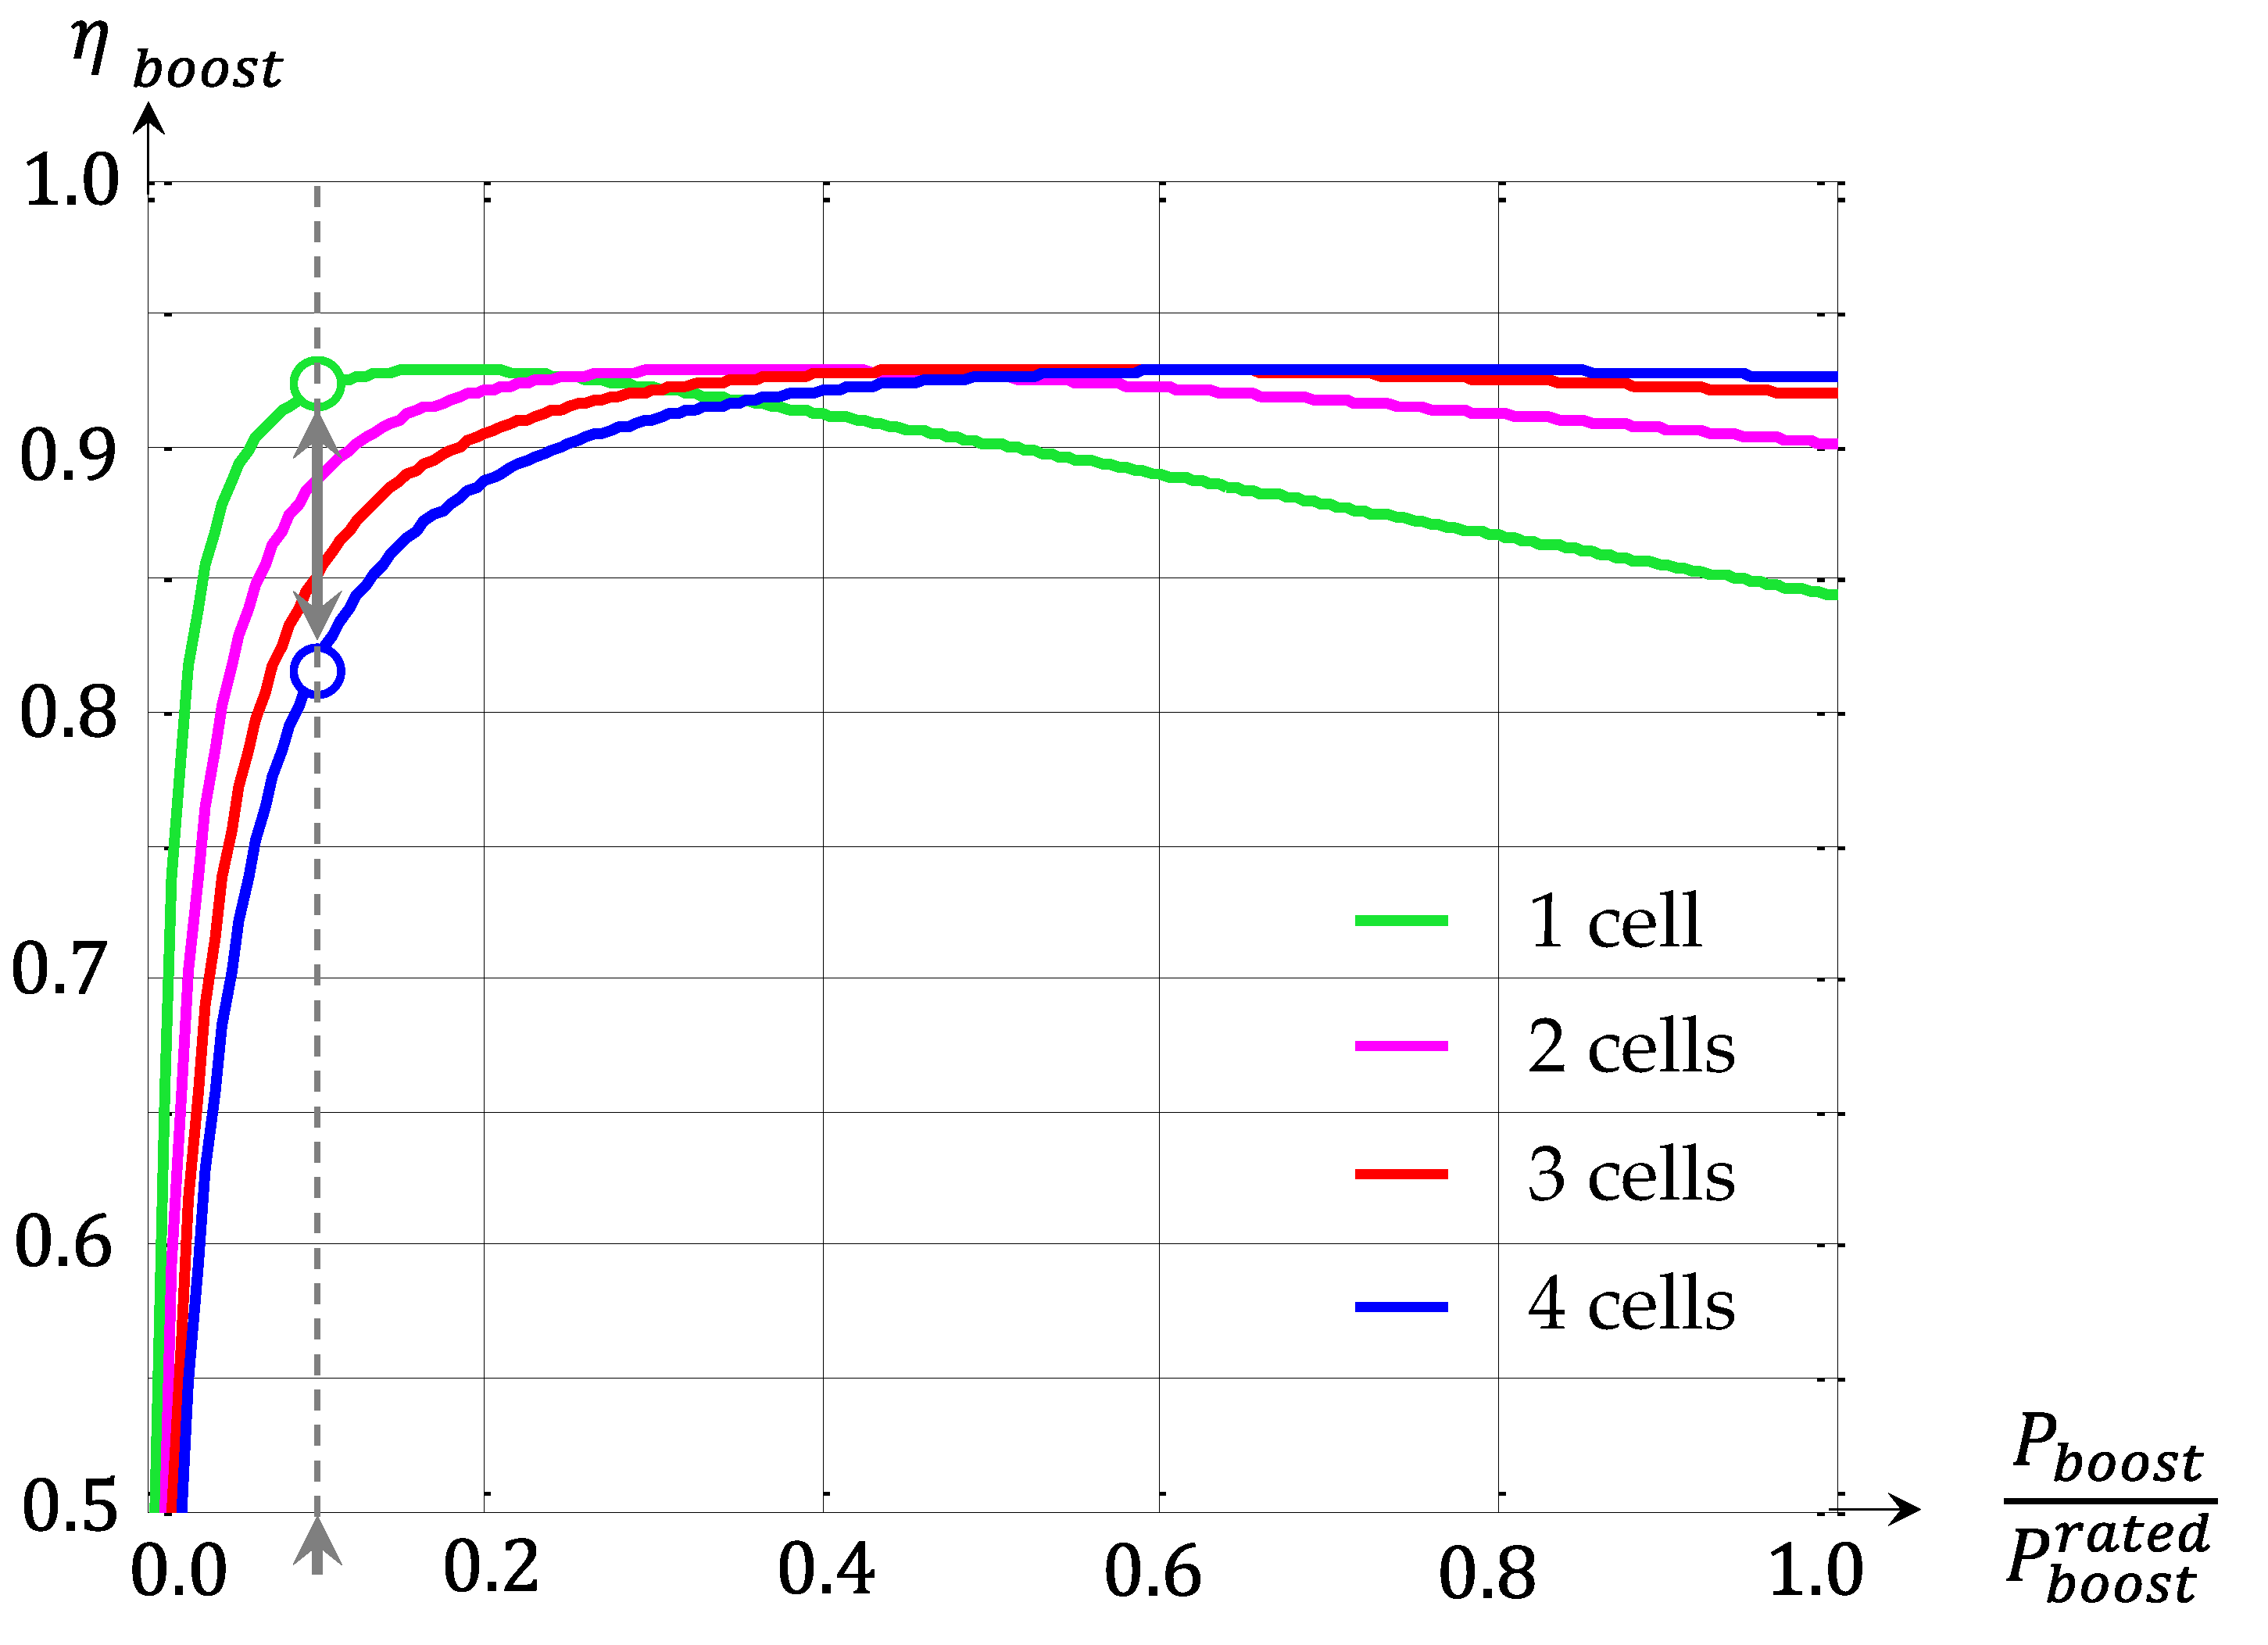
The electric line is shown in magenta in Figure 14. The voltage delivered by an FC varies greatly depending on its operating point, typically from 100% for no-load operation to for full power operation. Moreover, the stacking of elementary cells is constrained by mechanical considerations, such as the ability to have homogeneous fastener pressures. Therefore, the number of cells that can be connected in series is technologically restricted, which means that the maximum delivered voltage is limited and may not reach the rated voltage that enables the electrical machine to be optimally supplied via its inverter [48]. As an indication, it should be noted that the Toyota Mirai FC consists of a single row of 370 cells allowing a rated power of [49]. Its voltage thus varies from about downto for a rated current of . To supply the inverter-machine assembly (Figure 20) which requires a maximum voltage of , this voltage must therefore be increased and controlled. This is the role of the interleaved boost converter (Figure 21). This converter is placed in series in the conversion chain and its output permanently impacts the overall system efficiency. As automotive traction is characterized by very high power dynamics, it is crucial that , the chopper efficiency, remains at a high value over a wide power range [50]. Toyota strategy is power splitting, which fits well with the large FC-rated current of several hundred Ampere [51,52]. Considering the Mirai, the power converter is thus made up of the parallel arrangement of four elementary switching cells whose commands are interleaved to minimize the current ripples in the FC as well as in the capacitor of the high voltage bus. The current ripple reduction is favorable with respect to the lifetime of the FC, which is reduced compared to an ideal situation without the ripples due to PWM switching [53]. For low powers, only one cell is operational, thus avoiding the fatal losses of the three other cells. The boost converter management strategy consists in putting more cells into operation as the FC power demand increases [13]. This strategy significantly improves the efficiency for the operating points at partial power. Doing this, the converter gains 10 efficiency points for operation at (i.e., about of the rated power) which is commonly used. Figure 22 illustrates this principle.
From a system point of view, the boost converter is one of the two key energy consumption items of the FCS. In [37], J-P Poirot-Crouvezier considers that, for about , an efficiency of is quite feasible over a wide operating range. For this FCS, the boost converter contributes to of losses while the FCS delivers its rated net power of . This is approximately of the overall auxiliary consumption and represents the same order of magnitude as the air compressor.
Current research is, of course, aimed at further reducing the losses of the boost converter while ensuring its integration into the system. In relation to the latter aspect, one of the critical points lies in the cooling temperatures of the active semiconductor components. Indeed, the boost power switches (IGBTs and diodes) are presently made of silicon and often require a cooling fluid at a temperature of lower than that of the FC fluid. The latter is currently of , but, as explained, the setting target is higher (i.e., roughly ) in order to ensure an MEA temperature below [54]. In the current context, the cooling circuit must have several cooling loops at different temperatures, which makes it complex and therefore expensive and bulky. For this reason, the research effort aims to ensure that the system operates at a single coolant temperature [37]. In this respect, components with large gaps such as silicon carbides (SiC) or gallium nitrides (GaN) offer promising prospects, with the added benefit of reduced electrical-to-electrical conversion losses [50,55].
As the inverter and electric machine combination is bi-directional in power, electric vehicles have the capacity to recover part of the kinetic braking energy as well as potential energy during downhill roads. For this purpose, the combination of a battery and a DC/DC converter is placed in shunt on the DC bus. This second converter is a bidirectional buck-boost converter (Figure 20) which adapts the voltage levels between the DC bus and the auxiliary battery. The voltage of the latter depends on its state of charge and its temperature and is limited by the number of cells placed in series.
From a functional point of view, the power supply system is hybrid [56] and the power demanded by the load (traction and on-board auxiliaries) can be delivered by an infinite number of couples . The distribution function of these two powers is established while respecting the characteristics of the two electrochemical sources [57]. Since the battery is capable of delivering a large power with a high dynamic range, its role is to respond to power transients that could directly impact the DC bus voltage. The control of the buck-boost converter dedicated to the battery is therefore dedicated to the DC bus voltage control. The setpoint of this servo control can possibly be adapted by a general strategy aimed at minimizing the losses of the converter-machine assembly. Such a strategy takes into account the operating point and is mainly based on the speed of the vehicle. Simultaneously, the boost converter control monitors the FC power and only ensures, slow variations (ramp of a few seconds) in order to respect the dynamics of the air line limited by the compressor time response. Transiently, the battery therefore provides the difference between the power required by the drive train and the FC power. As the battery’s reactants are directly located at its electrodes, sudden variations in power do not impact the battery life time.
From a design point of view, any FC and battery sizing are theoretically feasible. In practice, however, the FC power and the auxiliary battery energy are closely linked.
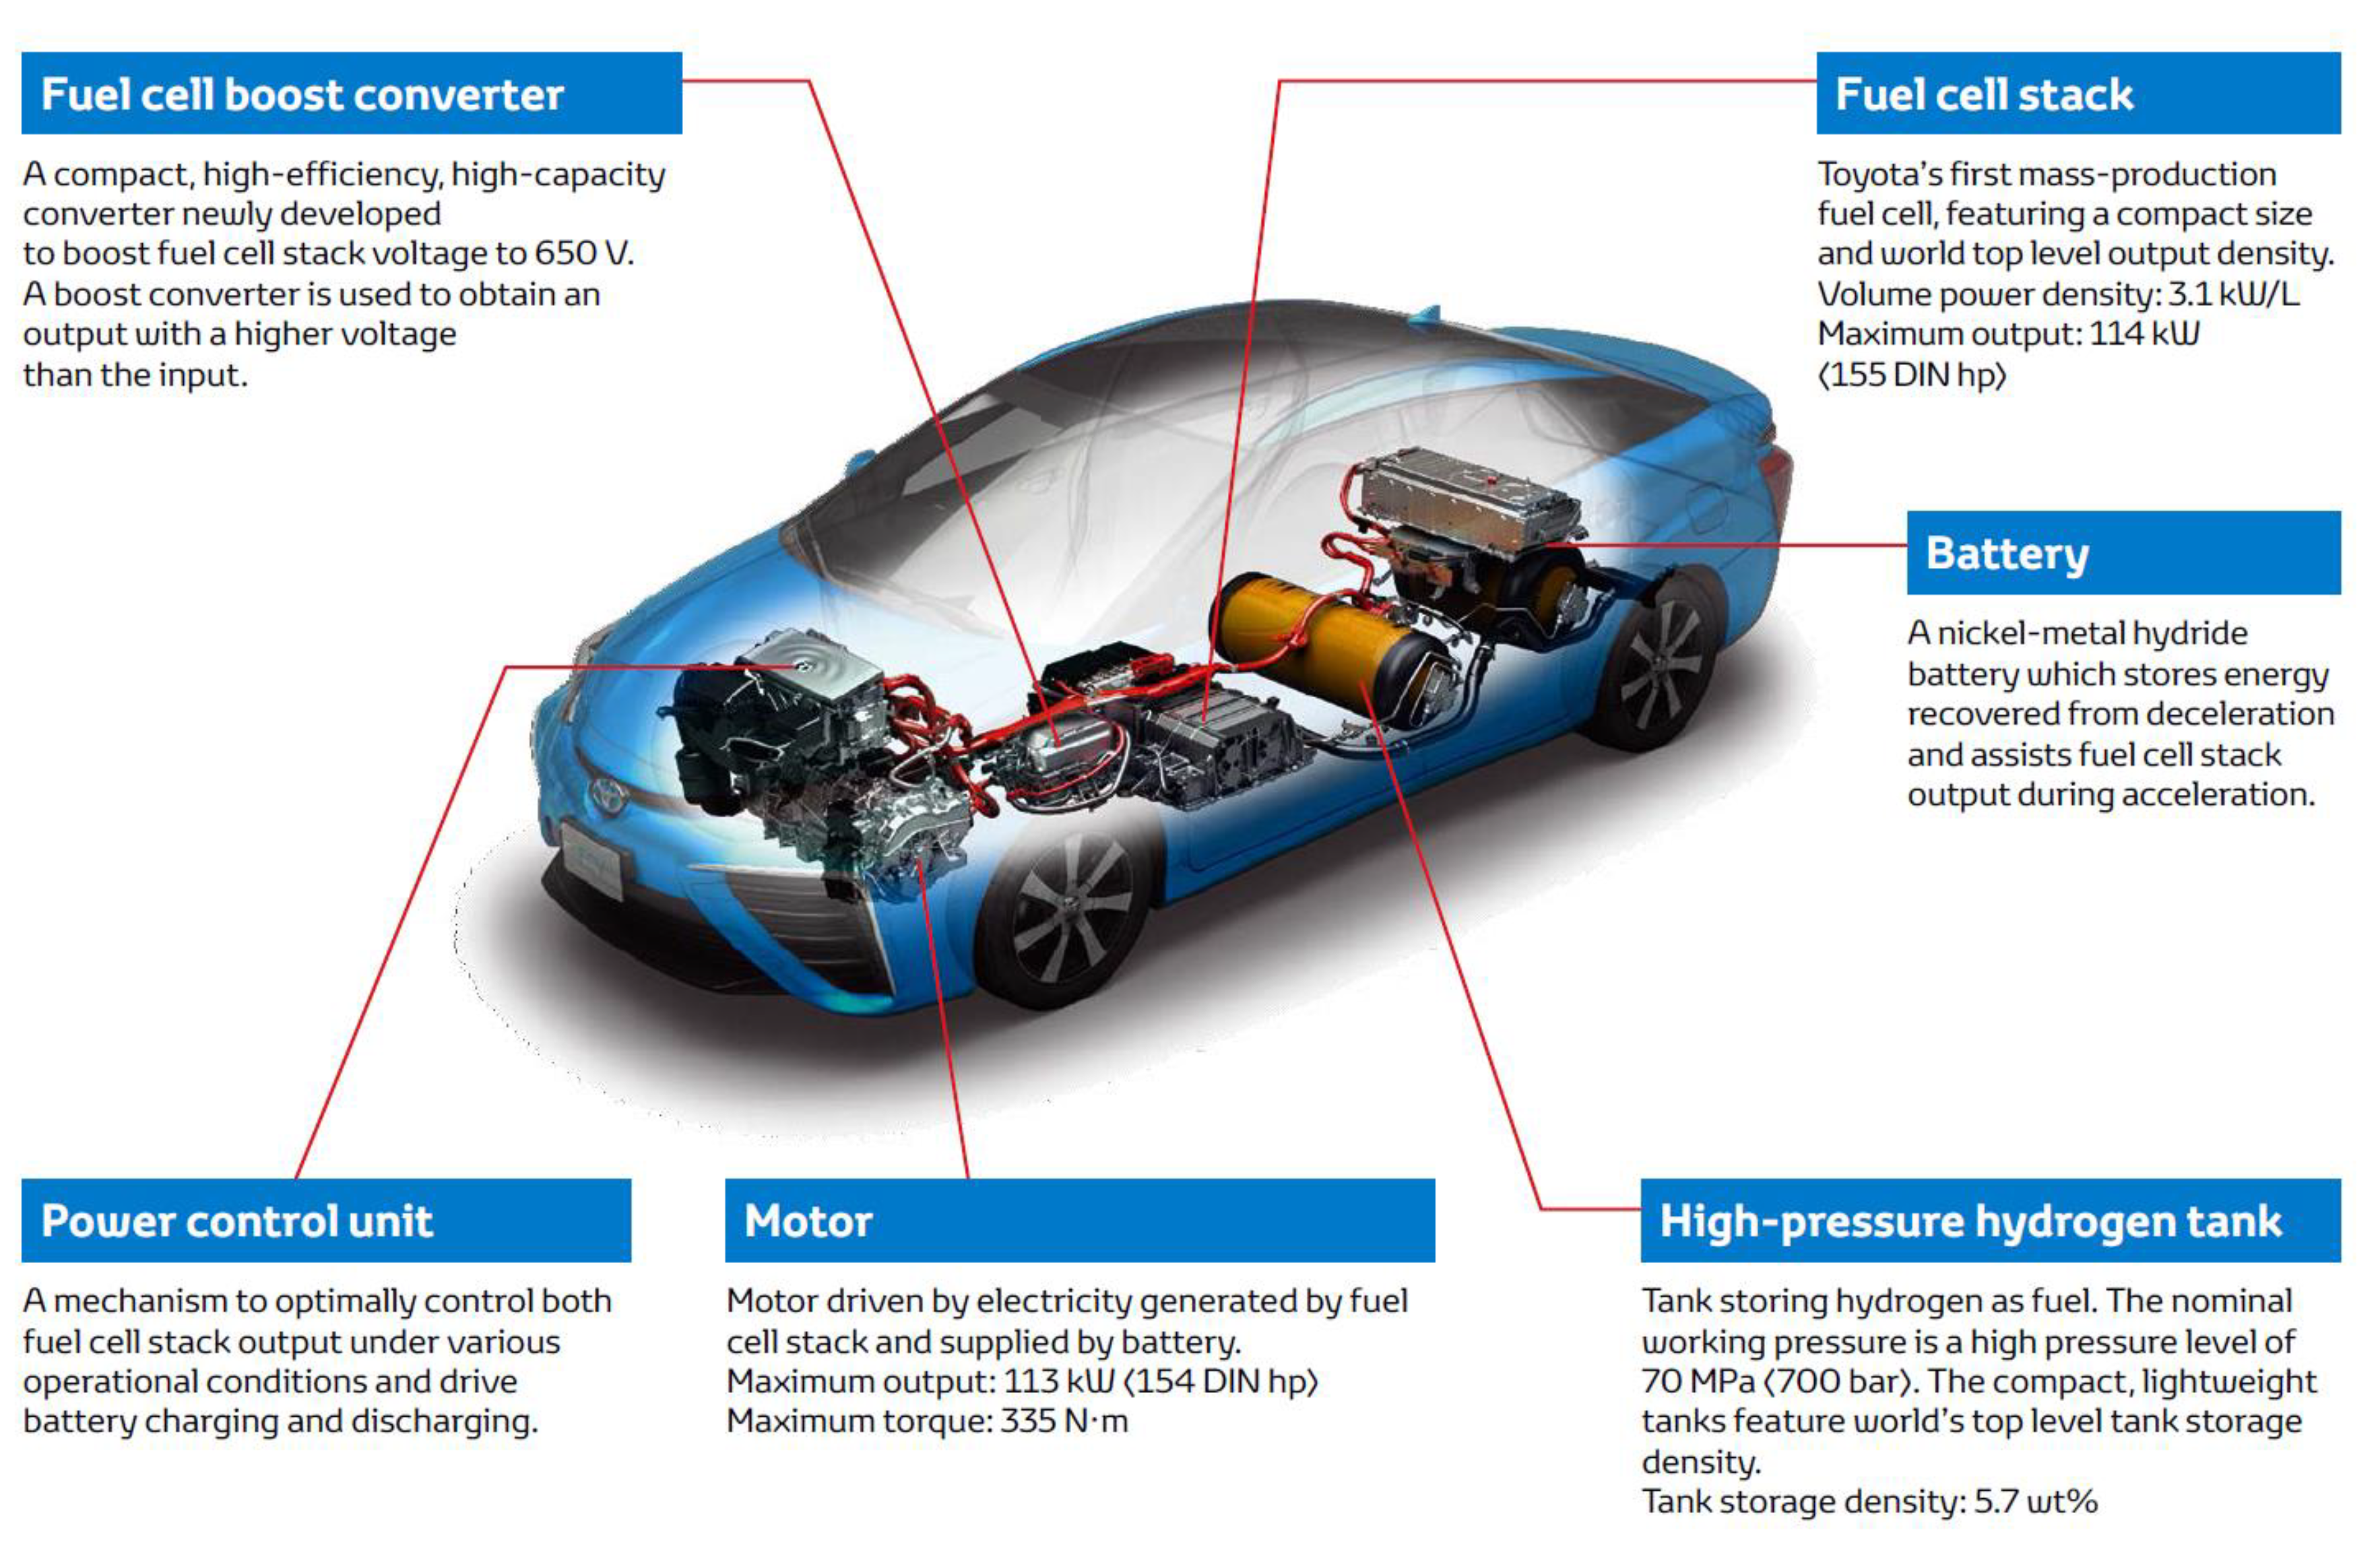
Light hybridization (called “full-power” by Toyota) is at one end of the spectrum. This sizing consists of expecting only energy recovery from the battery, as well as compensation for the response times of the FCS and assistance with cold starts. This architecture leads to the design of an FCS capable of responding to all the required powers, in particular acceleration and uphill cases. The battery must be able to provide the supplied and recovered powers over a short time. Its design is therefore a power type battery. This kind of architecture is common in light passenger vehicles developed by Asian manufacturers. The Hyundai Nexo SUV, the Honda Clarity Fuel Cell sedan and the Toyota Mirai sedan are three recent commercial examples (Figure 23). The latter has a nickel-metal hydride (Ni-MH) battery with a small capacity, namely . The FCS has the same net power as the electric traction machine, i.e., which is why this hybrid architecture is called “full-power”. The Mirai’s FCS draws its energy from two dihydrogen tanks with a total capacity of which can store of at [56]. The mass density of this storage is , while the power density of the FC is () which is above the US Department of Energy (US DoE) 2020 target () and close to its future 2025 target () [52].
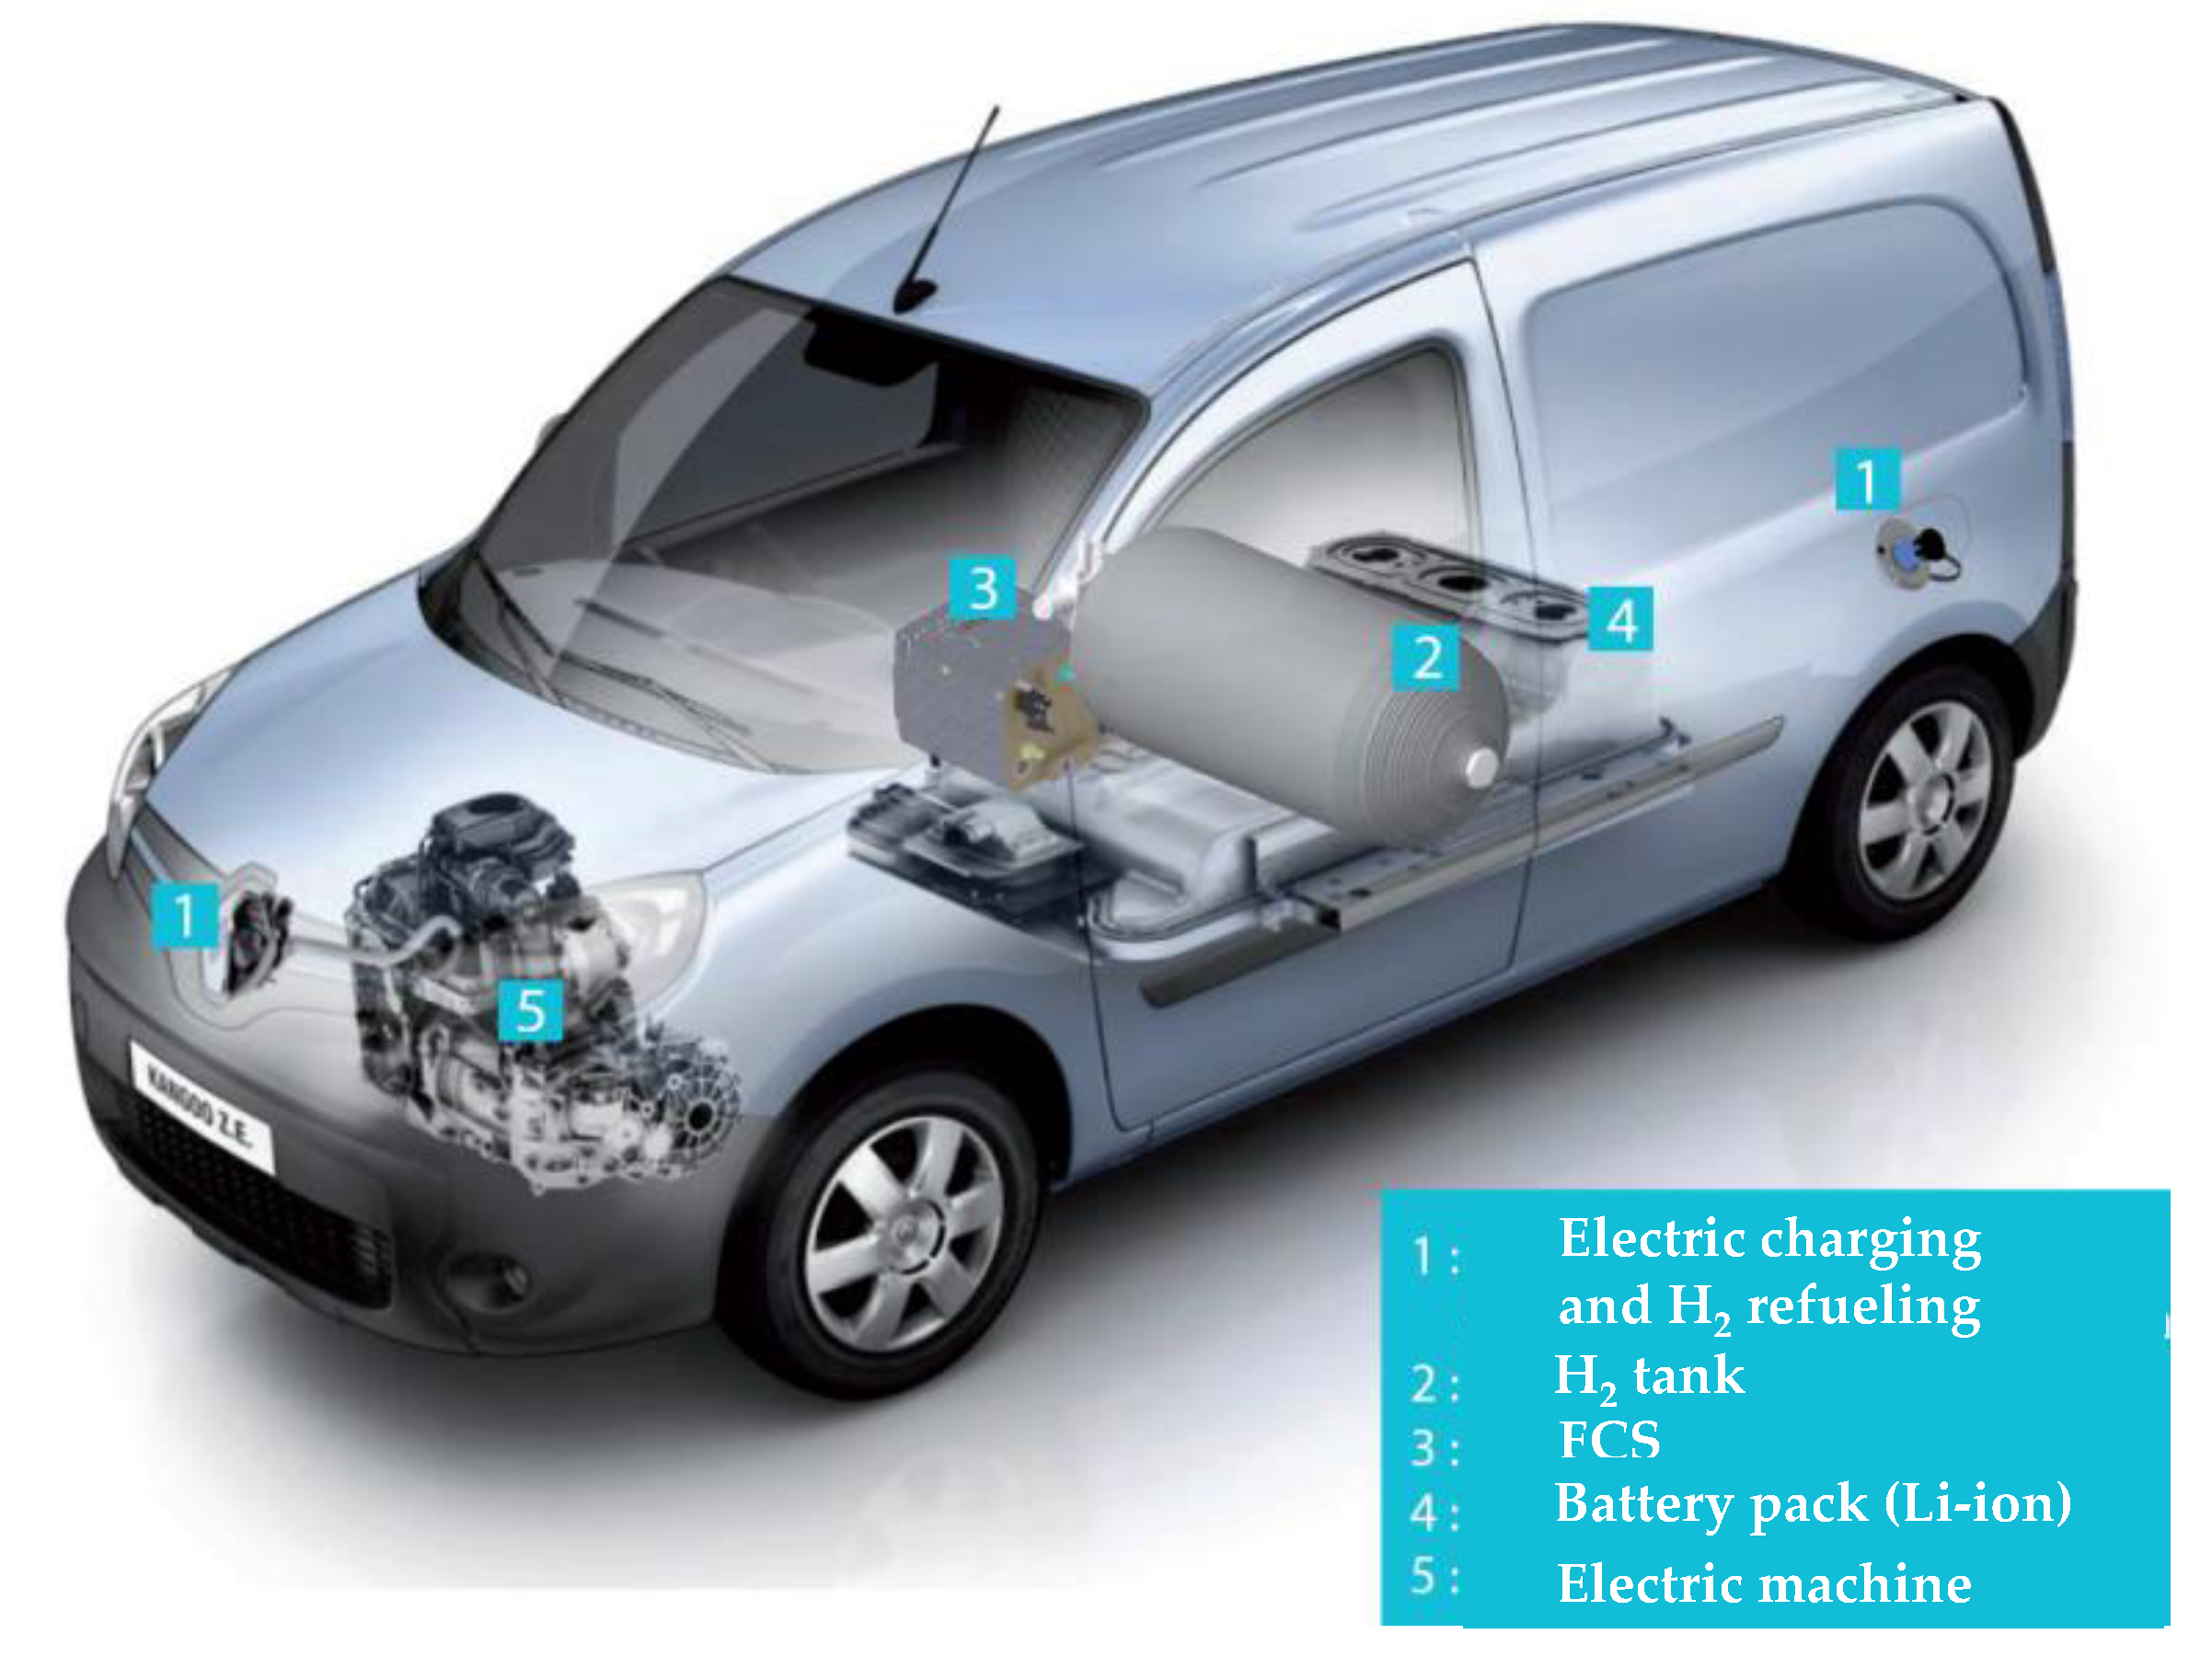
On the other hand, the tank–FCS combination can act as a range extender [59]. In this case, the auxiliary battery is that of a BEV and the hydrogen system extends its range for intensive use. In these conditions, the FCS is of low power because it is only designed to provide the average power required on the journey. Its ownership cost is therefore very low, and its use is optimal because it is close to a steady state regime that is easy to optimize in terms of efficiency and service life. This option has now been adopted by the Renault group, which has joined forces with Symbio (a joint venture between the Michelin and Faurecia groups) to produce hybrid service vehicles: Renault Kangoo ZE H2 and Master ZE H2. The Renault Kangoo ZE REH2 light commercial vehicle is equipped with a Lithium-ion battery and a tank combined with a FC (Figure 24). The latter value must be compared with the traction machine rated power which is . If the so-called “full power” vehicles have a power ratio of 100%, this ratio is reduced to 11.4% in this “range extender” type implementation. This ratio is even lower (8.8%) in the case of the Master ZE Hydrogen, because it has the same FCS (and the same auxiliary battery) but has a slightly more powerful drivetrain (). It is also interesting to note that the FCS is optimized for low operating dynamics since its minimum net power is half of its maximum power: . This results in a compact FCS with a high volume density of . The Master vehicle is equipped with two and tanks with the capacity to store of . On the other hand, the Kangoo’s tank is type III with a rated pressure of and therefore bulkier than those of type IV. The volume of Kangoo’s single tank is indeed . Finally, it should be noted that the electrical energy input is significant. In fact, considering an electrical efficiency of 50%, the can provide while the provides . At the same time, in winter, when heating is required, the thermal power is supplied directly by the heat produced by the FCS thus avoiding the reduction in the power output. Depending on the operating point of the FCS, the thermal power varies between and .
Between these two extreme hybridization rates (≅10% to 100%), other architectures have been developed; they are called “mid-power” hybridization (or “mild-hybrid”). The Mercedes GLC F-cell SUV developed by Daimler is a perfect illustration (Figure 25). The battery capacity () makes it possible to make daily commutes: range in WLTC cycle. This driving range is almost multiplied by ten thanks to the of embedded in two type IV tanks (i.e., ). The electric traction machine can deliver a power of 147 kW, while the FCS has a rated power of a few tens of kW, typically in the range of to , which means a hybridization rate around 30%. Furthermore, the full battery recharge uses a modest power charger (). It hence has a low impact on the electrical grid and enables a full recharge in a limited time of (the net capacity of the battery being only ).
4.4. The Thermal Line
The thermal line is shown in blue in Figure 14. Thermal management is an essential element both from the point of view of the FCS size and its proper operation.
First of all, it is important to stress that the FCS must remove a thermal power similar to its electric power. This ratio is more interesting than in an internal combustion engine dedicated for automotive application. Current internal combustion engines have an average efficiency around and a maximum efficiency of about (namely for a diesel engine and for a gasoline engine). However, note that the cooling temperature of the FCS is generally only , whereas it operates around for an internal combustion engine (with specific fluctuations between and ). This difference leads to a requirement for oversizing of the heat exchanger surface to enhance the heat transfer to the ambient air. It hence modifies the vehicle grille design and increases the vehicle drag coefficient (Cx). Indeed, in the unfavorable case of the specification (), the relative deviation of () between the FCV and the conventional thermal vehicle is !
In order to increase the thermal fluid temperature, two options are explored simultaneously. The first one consists in looking for membranes that maintain their mechanical properties, such as their proton conductivity, beyond the current limit of to [21]. The interest of this first approach is to increase the electrochemical reaction temperature (Arrhenius’ law) and to both reduce the catalyst mass load per unit area and increase poisoning concentration threshold. The second option is systemic. It consists in developing a “software sensor” that makes it possible to deduce in real time the temperature distribution on the membrane surface. The principle consists of running an MEA model. This model is fed in real time by the non-invasive measurements implemented to ensure the FCS control. Included among them are the temperatures at the FC inlet and outlet, the mass flow rates of the cooling circuit, the cathode circuit and the anode circuit, the FC current and voltage, etc. This type of model already exists and is used to design the MEAs and the channels of the bipolar plates. However, it must be adapted in order to take into account the constraints of real-time implementation in an on-board computer [60]. Its systematic use will allow the adoption of a less conservative approach which uses large safety margins to avoid reaching the maximum membrane temperature. It thus enables us to increase the cooling circuit temperature.
As already mentioned, in addition to cooling the FC, it is also mandatory to extract heat from the various auxiliary components, such as the power electronics converters and the electrical machine. The coolant temperatures of all these devices may be different, which obviously makes the system more complex and has an impact on its cost, volume and reliability (thermal aspects being a highly critical). The aim to standardize cooling temperatures implies working on the system devices: large gap components for the power electronic converters, design of a synchronous machine without a rare earth component, etc.
As well as this, engineers are still working on decreasing the FC heat capacity. In order to obtain an FC fast start in cold weather conditions (), it is mandatory to raise the FC temperature beyond before the water produced has had time to freeze and thus clog the electrodes and permanently damage their porous structure. This work on the heat capacity is in line with the desire to increase the FC power-to-mass ratio. Today, and thanks to adapted rules for stopping (drying of the electrodes) and starting, the rapid start-up in extreme cold is considered to be perfectly achievable [49,54,58,61]. More generally, thermal management is closely linked to the water management of the MEA, which is an essential point for its proper operation in both transient and steady state [62].
From the control point of view (Figure 13), the heat transfer fluid is regulated in incoming and outgoing temperatures thanks to (i) the control of its mass flow rate (indeed, is all the lower as this flow rate increases) and (ii) the heat power transfer (through the exchange coefficient between the heat sink and the environment). This thermal management, whatever the operating point, is made complex by the variety of situations to be handled. For example, the compressor tends to heat the compressed air: as such, the air brought to the FC can require cooling during full power operation. Conversely the air blown in at low power may require heating at the FC inlet. The air supply to the cathode therefore requires controlled heat exchangers.
4.5. FCS Efficiency
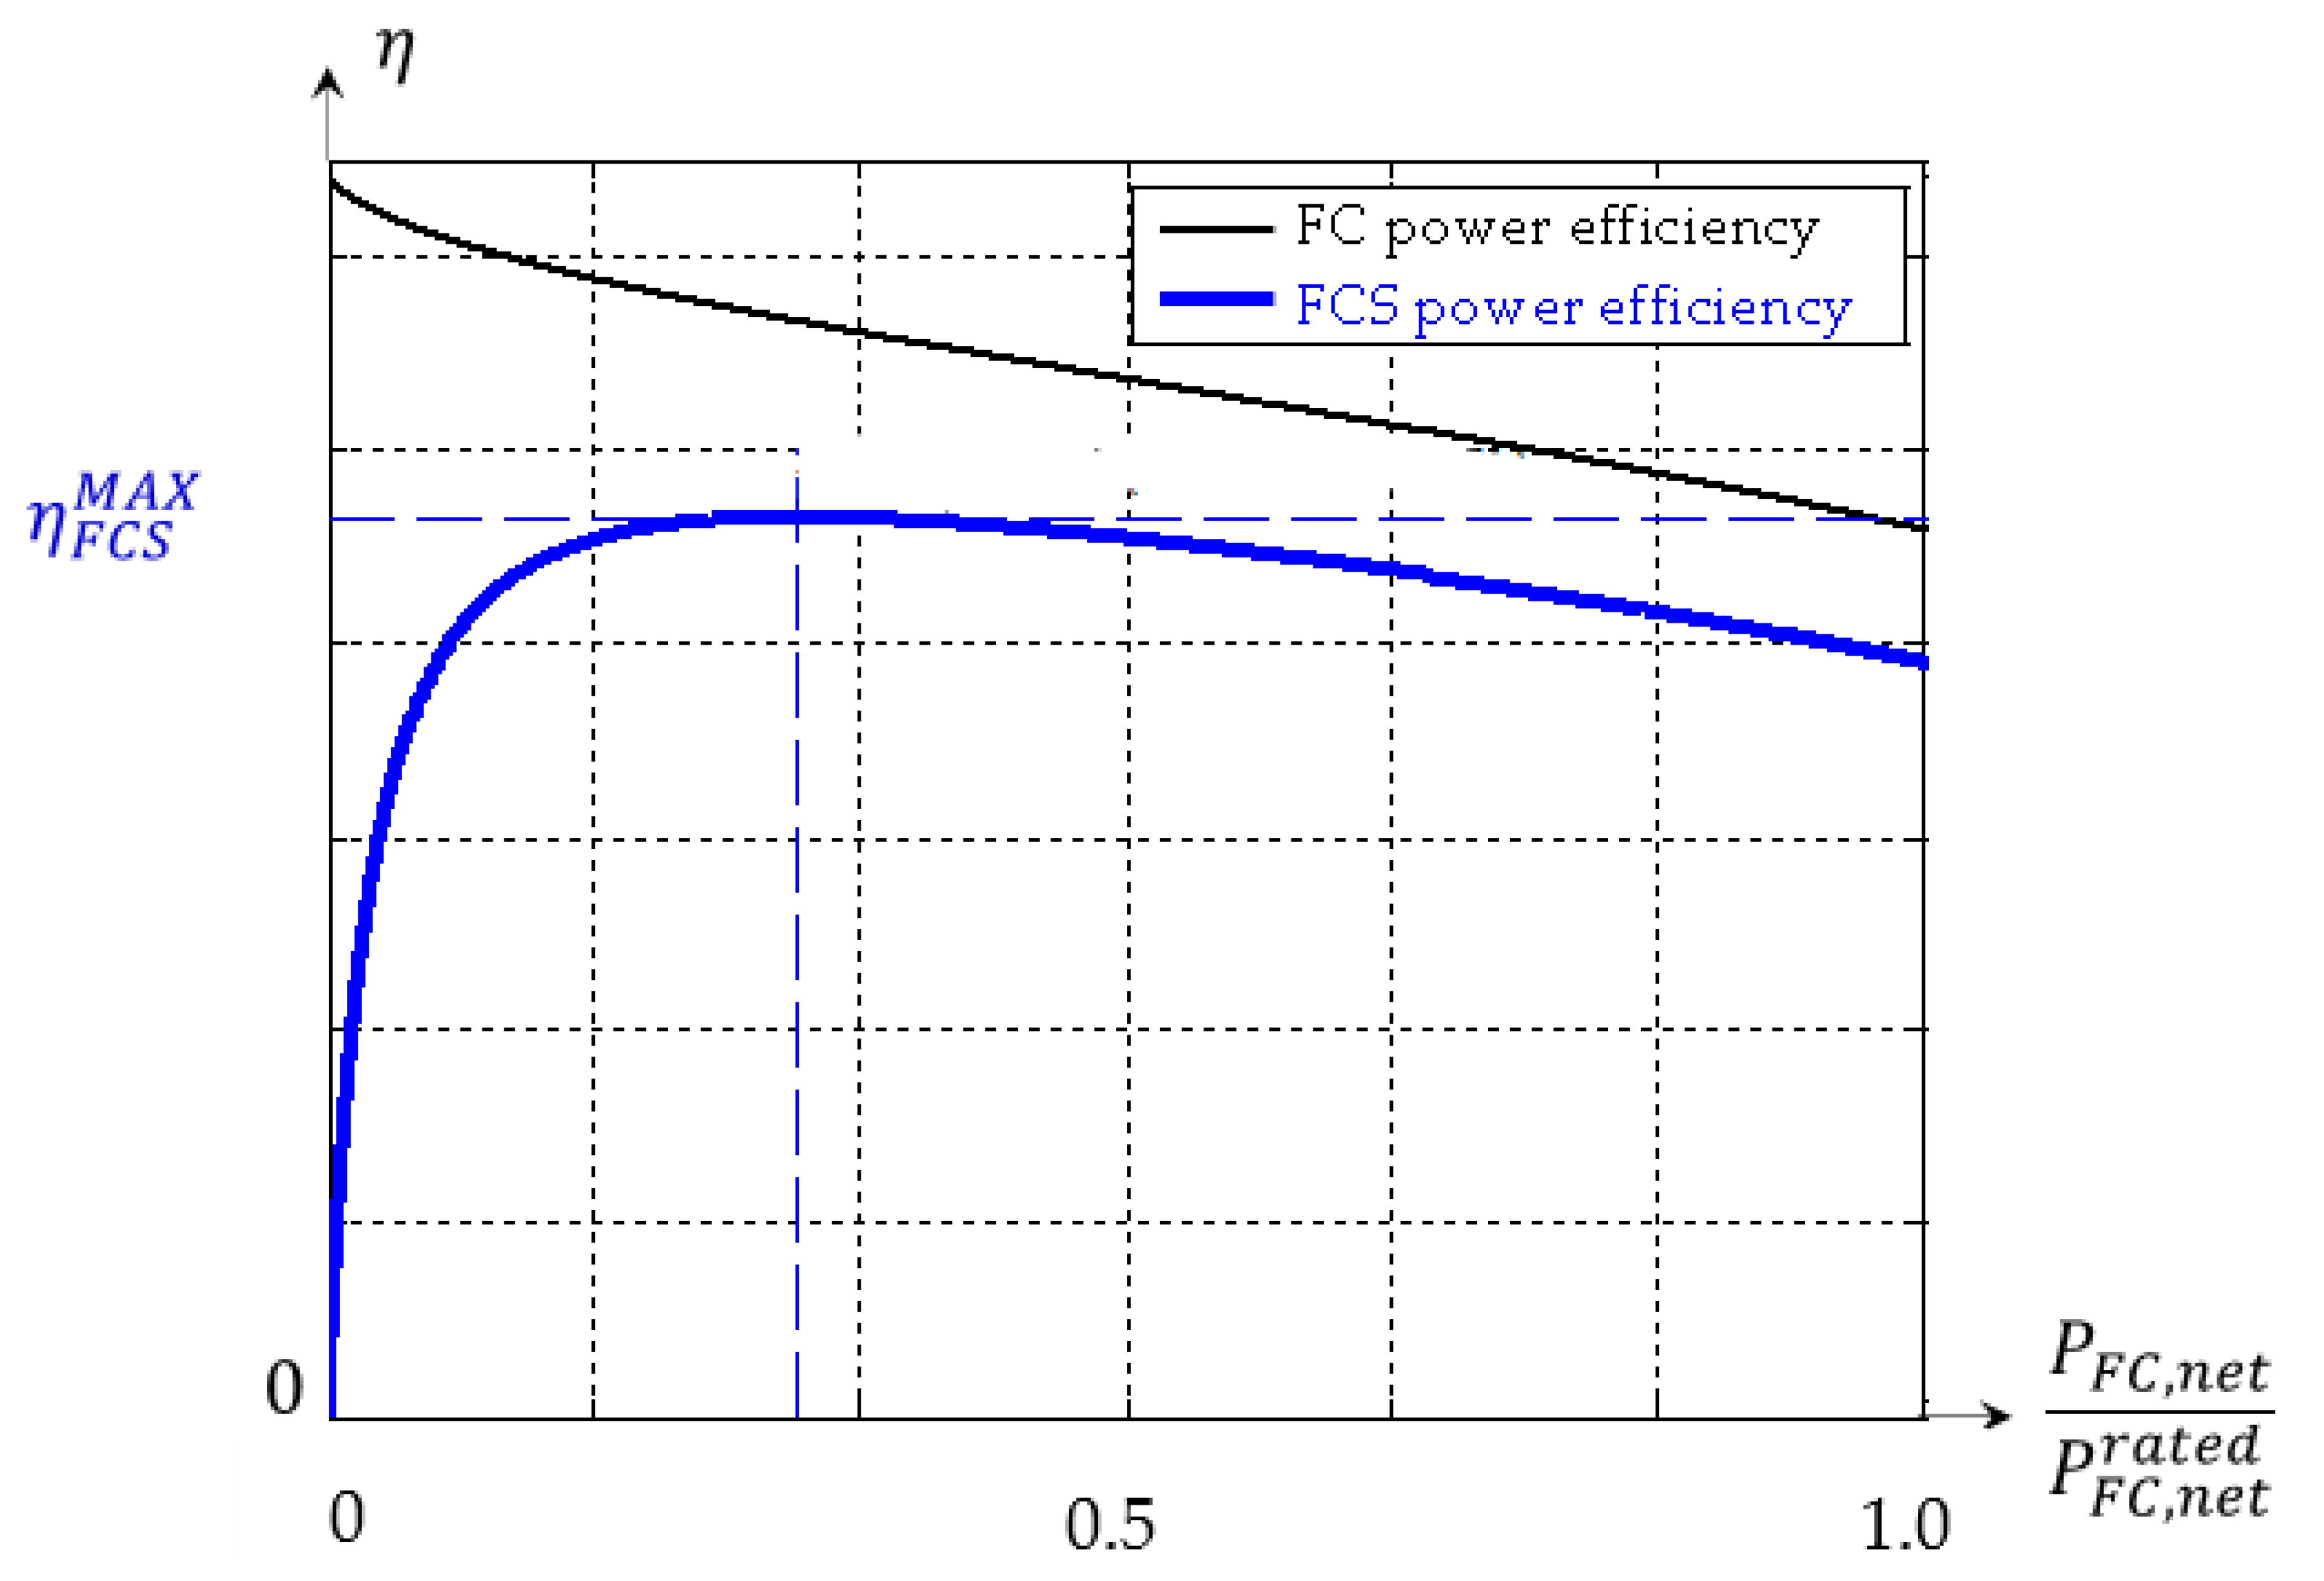
The previous section has shown the FCS in its structural complexity and its management sophistication. These two aspects are fundamentally linked to the initial aim to decouple the power and the energy optimizations. The former is delivered by the FC whereas the latter is linked to the tank. As a consequence, the FCS operation requires numerous auxiliaries to synchronize the electric power demand with the FC optimal operating conditions. These auxiliaries have a power consumption indexed to the net electric power delivered to the load. The related auxiliary power is, however, non-zero when the net power is. Therefore, the FCS efficiency is systematically lower than that of the FC itself. It is very low or even at zero when the net power is limited. Conversely the FCS efficiency is close to the FC efficiency (without reaching it) when the load increases. Therefore, the plot of the FCS efficiency vs. FC net power follows a bell-shaped curve with a maximum at an intermediate net power (Figure 26). This figure shows that the average efficiency on a mission profile is reduced by periods of low load operation. Consequently, mild-hybrid and particularly range extender architectures enable to decouple the instantaneous net demand from the peak-to-peak power. They allow better overall efficiency than a full hybrid architecture using a low energy battery [63,64,65], which explains the technological choice of the Renault group.
Additionally, even in the case of a full power hybrid architecture, a high rated FCS efficiency may not be the best trade-off for automotive sector. Indeed, Ahluwalia et al. show that decreasing the FC MEA surface, although decreasing the rated power FCS efficiency, leads to a significant FCS cost reduction, which may allow high-volume manufacturing FCVs to compete with internal combustion engines vehicles regarding cost [66]. Based on a full power FCS, their study shows that reducing Pt use dramatically from down to significantly lowers the full power FCS efficiency from down to . However, the resulting fuel consumption only increases by based on the US EPA certification driving cycle, while the FCS cost significantly decreases by 25% regarding an industrial production of 500,000 vehicles manufactured per year. The challenging consequence of this lower cost/lower efficiency FCS design is the increase in waste heat: it clearly limits further Pt use lowering.
5. Conclusions
Regarding useful electric power, an FCS proves to be less efficient than a Lithium-ion battery: roughly compared to approximatively . However, designing a system such as a car requires meeting several performance indexes to reach the final functionality demanded by the consumer: large driving range, habitability for passenger cars and large load capacity for commercial vehicles, fast recharging, low operating costs, safety and reliability. Using an on-board FCS to provide traction power has several key advantages:
First, the driving range can be completed using the adequate number of high-pressure hydrogen tanks. The latter may be placed in various places which permits to optimize the available volume enhancing passengers’ habitability and trunk capacity. This first degree of freedom has little impact on cost and refueling time. Hence, the short-term perspective is to produce highly standardized high-pressure hydrogen tanks causing a fall in prices and a great increase in reliability. Using three cylinder tanks and having a driving range of 666 km (on WLTP cycle), the Huyndai Nexo is a clear example of the high level of this performance index.
Second, the rated traction power deriving from mass, speed and road slope is achieved combining the right number of basic FCS. This has the fourfold advantage of lowering the global cost, enhancing the driving cycle efficiency [67], ensuring continuity of service by operating in degraded mode [68,69], and finally increasing service life by spreading wear and tear over the various sub-systems [70].
Third, the tank refueling is simple and fast permitting both to make the cost and space of recharging stations profitable compared to fast charging stations dedicated to BEVs and to achieve intensive use like taxi or bus fleets.
Fourth, FCVs are very safe even in case of car accidents. Indeed, based on hydrogen high diffusivity, dealing with safety mainly relies on concentrating the brittleness at one point in order to obtain sufficient leakage to remain below the flammability level. This design is quite simple and focused on the tank as the key device. Hyundai NEXO scoring five-star Euro NCAP safety test illustrates this figure.
Based on these main feature, Kate Forrest et al. studied the medium and heavy-duty electric vehicle prospective in the California context [71]. They showed that FCVs can easily fit the Class 8 truck specifications compared to battery electric vehicles, benefiting from compact on board storage and fast fuelling, even at the high demanded power required by large energy capacities. For instance, Class 8 100-mile FCVs can meet up of vehicle miles travelled with home base charging compared to for same range battery vehicles. Besides, without impacting the payload, this range can easily be expanded to 200-mile FCVs, contrary to battery electric vehicles. This expanded range may enable to satisfy up to of the vehicle miles demand.
However, FCVs still need improvements. The first challenge remains cost reduction. The avenues for possible improvement are shifts on materials and process, specifically for catalyst (Platinum), and the acid electrolyte (polymer membrane), and also redesigning the FCS while seeking to simplify and streamline it. The second challenge is compactness. Note that the latter can find synergies with the previous one (i.e., cost). Additionally, finding materials and process to produce polymorphic tanks is another promising line to enhance cabin space. The third challenge is life span, which is sufficient but still lower than internal combustion engine cars.
In sum, FCVs are reaching maturity and hence can already play a role in zero-emission vehicle trend. Natural markets are long-distance heavy-duty vehicles and fleets of taxis or delivery vehicles. As FCS are still expensive, these markets will develop based on range extender or mild hybrid architectures. These first implementations will enable us to mature the technology from niche markets to a large-scale market. It will also identify the right business models across the entire value chain. In the perspective of the future intensive use of hydrogen energy in transportation, the supply chain study is going to play a key role both in terms of environmental and economic issues [72]. This complete study is the subject of future work [73].
Funding
This research received no external funding.
Conflicts of Interest
The author declares no conflict of interest.
Abbreviations
| FCS | fuel cell systems |
| FCV | fuel cell vehicle |
| BEV | battery electric vehicle |
| FC | Fuel Cell |
| ICEV | internal combustion engine vehicles |
| PEMFC | Proton Exchange Membrane Fuel Cell |
| LCV | Lower Calorific Value |
| HCV | Higher Calorific Value |
| OCV | Open Circuit Voltage |
| MEA | Membrane Electrode Assembly |
| M | Membrane |
| AL | Active Layer |
| GDL | Gas Diffusion Layer |
| BP | Bipolar Plate |
| PGM | Platinum-Group Metals |
| SEM | Scanning Electron Microscopy |
| TEM | Transmission Electron Microscopy |
| PWM | Pulse Width Modulation |
| DC | Direct Current |
| EPA | U.S. Environmental Protection Agency |
References
- Olsson, A.C.; Gustavsson, P.; Kromhout, H.; Peters, S.; Vermeulen, R.; Brüske, I.; Pesch, B.; Siemiatycki, J.; Pintos, J.; Brüning, T.; et al. Exposure to Diesel Motor Exhaust and Lung Cancer Risk in a Pooled Analysis from Case-Control Studies in Europe and Canada. Am. J. Respir. Crit. Care Med. 2011, 183, 941–948. [Google Scholar] [CrossRef] [Green Version]
- Kelland, K. Diesel Exhaust Fumes Can. Cause Cancer, WHO Says; Reuters Agency: London, UK, 2012. [Google Scholar]
- Gurney, J.; Company, B.P. BP Statistical Review of World Energy. J. Policy Anal. Manag. 1985, 4, 283. [Google Scholar] [CrossRef]
- Lambert, J.; Hall, C. EROI of Global Energy Resources Preliminary, Status and Trends; State University of New York, College of Environmental Science and Forestry: Syracuse, NY, USA, 2012. [Google Scholar]
- Guilford, M.C.; Hall, C.A.; O’Connor, P.; Cleveland, C.J. A New Long Term Assessment of Energy Return on Investment (EROI) for U.S. Oil and Gas Discovery and Production. Sustainability 2011, 3, 1866–1887. [Google Scholar] [CrossRef] [Green Version]
- Hiller, J.; Hampton, L. U.S. Shale Producers to Tap Brakes in 2020 after Years of Rapid Growth; Reuters: London, UK, 2020. [Google Scholar]
- Behaviour of Lithium-Ion. Batteries in Electric Vehicles; Springer Science and Business Media LLC: Berlin, Germany, 2018. [Google Scholar]
- Pang, H.; Zhang, Z.; Xu, X. Targeted contactless charging for roadway-powered electric vehicles. In 2017 IEEE PELS Workshop on Emerging Technologies: Wireless Power Transfer (WoW); IEEE: New York, NY, USA, 2017; pp. 103–105. [Google Scholar]
- Ajanovic, A.; Haas, R. Electric vehicles: Solution or new problem? Environ. Dev. Sustain. 2018, 20, 7–22. [Google Scholar] [CrossRef]
- Van De Kaa, G.; Scholten, D.; Rezaei, J.; Milchram, C. The Battle between Battery and Fuel Cell Powered Electric Vehicles: A BWM Approach. Energies 2017, 10, 1707. [Google Scholar] [CrossRef] [Green Version]
- Barbir, F. PEM Fuel Cells: Theory and Practice, 2nd ed.; Academic Press: Cambridge, MA, USA, 2012; ISBN 9780123983725. [Google Scholar]
- Sauvant-Moynot, V.; Orsini, F.; Juton, A. Batteries; La Revue 3EI, N° 99; SEE: Paris, France, 2020. [Google Scholar]
- Hasuka, Y.; Sekine, H.; Katano, K.; Nonobe, Y. Development of Boost Converter for MIRAI; SAE Technical Paper: Warrendale, PA, USA, 2015. [Google Scholar]
- Ahluwalia, R.; Wang, X.; Steinbach, A. Performance of advanced automotive fuel cell systems with heat rejection constraint. J. Power Sources 2016, 309, 178–191. [Google Scholar] [CrossRef]
- Qi, Z.; Kaufman, A. Activation of low temperature PEM fuel cells. J. Power Sources 2002, 111, 181–184. [Google Scholar] [CrossRef]
- Xu, Z.; Qi, Z.; Kaufman, A. Activation of proton-exchange membrane fuel cells via CO oxidative stripping. J. Power Sources 2006, 156, 281–283. [Google Scholar] [CrossRef]
- Motor, H. Company Patent. Apparatus and Method for Acceleratively Activating Fuel Cell; Patent and Trademark Office: Washington, DC, USA, 2011. [Google Scholar]
- Yuan, X.-Z.; Zhang, S.; Sun, J.C.; Wang, H. A review of accelerated conditioning for a polymer electrolyte membrane fuel cell. J. Power Sources 2011, 196, 9097–9106. [Google Scholar] [CrossRef]
- Qi, Z.; Kaufman, A. Quick and effective activation of proton-exchange membrane fuel cells. J. Power Sources 2003, 114, 21–31. [Google Scholar] [CrossRef]
- Tawalbeh, M.; Nancarrow, P.; Tawalbeh, M.; Ka’Ki, A.; El-Ahwal, K.; El Taher, B.; Alkasrawi, M. Novel composite membrane based on zirconium phosphate-ionic liquids for high temperature PEM fuel cells. Int. J. Hydrog. Energy 2020, 0360–3199. [Google Scholar] [CrossRef]
- Rosli, R.; Sulong, A.B.; Daud, W.; Zulkifley, M.; Husaini, T.; Rosli, M.; Majlan, E.; Haque, M. A review of high-temperature proton exchange membrane fuel cell (HT-PEMFC) system. Int. J. Hydrog. Energy 2017, 42, 9293–9314. [Google Scholar] [CrossRef]
- Chen, M.; Zhao, C.; Sun, F.; Fan, J.; Li, H.; Wang, H. Research progress of catalyst layer and interlayer interface structures in membrane electrode assembly (MEA) for proton exchange membrane fuel cell (PEMFC) system. eTransportation 2020, 5, 100075. [Google Scholar] [CrossRef]
- Dhanda, A.; Pitsch, H.; O’Hayre, R. Diffusion Impedance Element Model for the Triple Phase Boundary. J. Electrochem. Soc. 2011, 158, B877–B884. [Google Scholar] [CrossRef]
- Van Dao, D.; Adilbishb, G.; Le, T.D.; Lee, I.-H.; Yu, Y.-T. Triple phase boundary and power density enhancement in PEMFCs of a Pt/C electrode with double catalyst layers. RSC Adv. 2019, 9, 15635–15641. [Google Scholar] [CrossRef] [Green Version]
- Inoue, G.; Kawase, M. Understanding formation mechanism of heterogeneous porous structure of catalyst layer in polymer electrolyte fuel cell. Int. J. Hydrog. Energy 2016, 41, 21352–21365. [Google Scholar] [CrossRef]
- Hou, Y.; Deng, H.; Pan, F.; Chen, W.; Du, Q.; Jiao, K. Pore-scale investigation of catalyst layer ingredient and structure effect in proton exchange membrane fuel cell. Appl. Energy 2019, 253. [Google Scholar] [CrossRef]
- Ramaswamy, N.; Gu, W.; Ziegelbauer, J.M.; Kumaraguru, S. Carbon Support Microstructure Impact on High Current Density Transport Resistances in PEMFC Cathode. J. Electrochem. Soc. 2020, 167, 064515. [Google Scholar] [CrossRef]
- Wang, X.; Ahluwalia, R.K.; Steinbach, A.J. Kinetics of Hydrogen Oxidation and Hydrogen Evolution Reactions on Nanostructured Thin-Film Platinum Alloy Catalyst. J. Electrochem. Soc. 2013, 160, F251–F261. [Google Scholar] [CrossRef]
- Ahluwalia, R.; Wang, X.; Lajunen, A.; Steinbach, A.; Hendricks, S.; Kurkowski, M.; Debe, M. Kinetics of oxygen reduction reaction on nanostructured thin-film platinum alloy catalyst. J. Power Source 2012, 215, 77–88. [Google Scholar] [CrossRef]
- Ballard; Nisshinbo. Non-Precious Metal. Catalysts: Cathode Catalyst Layer Design Considerations for High. In Proceedings of the Performance and Stability, SSI-21 Conference, Padoue, Italy, 18–23 June 2017. [Google Scholar]
- Mayur, M.; Gerard, M.; Schott, P.; Bessler, W.G. Lifetime Prediction of a Polymer Electrolyte Membrane Fuel Cell under Automotive Load Cycling Using a Physically-Based Catalyst Degradation Model. Energies 2018, 11, 2054. [Google Scholar] [CrossRef] [Green Version]
- Chen, Y.; Jiang, C.; Cho, C. Characterization of Effective In-Plane Electrical Resistivity of a Gas Diffusion Layer in Polymer Electrolyte Membrane Fuel Cells through Freeze–Thaw Thermal Cycles. Energies 2019, 13, 145. [Google Scholar] [CrossRef] [Green Version]
- Oedegaard, A.; Hebling, C.; Schmitz, A.; Møller-Holst, S.; Tunold, R. Influence of diffusion layer properties on low temperature DMFC. J. Power Sources 2004, 127, 187–196. [Google Scholar] [CrossRef]
- Leng, Y.; Ming, P.; Yang, D.; Zhang, C. Stainless steel bipolar plates for proton exchange membrane fuel cells: Materials, flow channel design and forming processes. J. Power Sources 2020, 451, 227783. [Google Scholar] [CrossRef]
- Wilberforce, T.; El Hassan, Z.; Ogungbemi, E.; Ijaodola, O.; Khatib, F.; Durrant, A.; Thompson, J.; Baroutaji, A.; Olabi, A. A comprehensive study of the effect of bipolar plate (BP) geometry design on the performance of proton exchange membrane (PEM) fuel cells. Renew. Sustain. Energy Rev. 2019, 111, 236–260. [Google Scholar] [CrossRef]
- Fink, C.; Fouquet, N. Three-dimensional simulation of polymer electrolyte membrane fuel cells with experimental validation. Electrochim. Acta 2011, 56, 10820–10831. [Google Scholar] [CrossRef]
- Poirot-Crouvezier, J.-P. Road Electric Transportation—Fuel Cell Vehicles; D5570; Techniques de l’ingénieur: Saint-Denis, France, 2015. [Google Scholar]
- Ahluwalia, R.K.; Wang, X.; Johnson, W.; Berg, F.; Kadylak, D. Performance of a cross-flow humidifier with a high flux water vapor transport membrane. J. Power Sources 2015, 291, 225–238. [Google Scholar] [CrossRef]
- Chang, Y.; Li, X.; Yin, Y.; Zhang, J.; Li, X. Humidification strategy for polymer electrolyte membrane fuel cells—A review. Appl. Energy 2018, 230, 643–662. [Google Scholar] [CrossRef]
- Casalegno, A.; De Antonellis, S.; Colombo, L.; Rinaldi, F. Design of an innovative enthalpy wheel based humidification system for polymer electrolyte fuel cell. Int. J. Hydrog. Energy 2011, 36, 5000–5009. [Google Scholar] [CrossRef]
- Yumiya, H.; Kizaki, M.; Asai, H. Toyota Fuel Cell System, EVS28, May 2015, Corée. World Electr. Veh. J. 2015, 7, WEVJ7-0085. [Google Scholar]
- Rivard, E.; Trudeau, M.; Zaghib, K. Hydrogen Storage for Mobility: A Review. Materials 2019, 12, 1973. [Google Scholar] [CrossRef] [Green Version]
- Pollet, B.G.; Kocha, S.S.; Staffell, I. Current status of automotive fuel cells for sustainable transport. Curr. Opin. Electrochem. 2019, 16, 90–95. [Google Scholar] [CrossRef]
- Linse, N. Start/Stop Phenomena in Polymer Electrolyte Fuel Cell. Ph.D. Thesis, Eidgenössische Technische Hochschule ETH Zürich, Zurich, Switzerland, 2012. [Google Scholar]
- Reiser, C.A.; Bregoli, L.; Patterson, T.W.; Yi, J.S.; Yang, J.D.; Perry, M.L.; Jarvi, T.D. A Reverse-Current Decay Mechanism for Fuel Cells. Electrochem. Solid State Lett. 2005, 8, A273–A276. [Google Scholar] [CrossRef]
- Yousfi-Steiner, N.; Moçotéguy, P.; Candusso, D.; Hissel, D. A review on polymer electrolyte membrane fuel cell catalyst degradation and starvation issues: Causes, consequences and diagnostic for mitigation. J. Power Sources 2009, 194, 130–145. [Google Scholar] [CrossRef]
- Grolleau, C.; Coutanceau, C.; Pierre, F.; Léger, J.-M. Effect of potential cycling on structure and activity of Pt nanoparticles dispersed on different carbon supports. Electrochim. Acta 2008, 53, 7157–7165. [Google Scholar] [CrossRef]
- Rain, X. Les Solutions Actuelles de Motorisations Pour Véhicules Electriques; La Revue 3EI, N° 99; SEE: Paris, France, 2020. [Google Scholar]
- Konno, N.; Mizuno, S.; Nakaji, H.; Ishikawa, Y. Development of Compact and High-Performance Fuel Cell Stack. SAE Int. J. Altern. Powertrains 2015, 4, 123–129. [Google Scholar] [CrossRef]
- Azib, T.; Bethoux, O.; Remy, G.; Marchand, C.; Berthelot, E. An Innovative Control Strategy of a Single Converter for Hybrid Fuel Cell/Supercapacitor Power Source. IEEE Trans. Ind. Electron. 2010, 57, 4024–4031. [Google Scholar] [CrossRef]
- Kolli, A.; Gaillard, A.; De Bernardinis, A.; Bethoux, O.; Hissel, D.; Khatir, Z. A review on DC/DC converter architectures for power fuel cell applications. Energy Convers. Manag. 2015, 105, 716–730. [Google Scholar] [CrossRef]
- Bethoux, O.; Laboure, E.; Remy, G.; Berthelot, E. Efficiency-optimal power partitioning for improved partial load efficiency of electric drives. Electr. Power Syst. Res. 2017, 142, 176–189. [Google Scholar] [CrossRef]
- Wahdame, B.; Girardot, L.; Hissel, D.; Harel, F.; François, X.; Candusso, D.; Péra, M.C.; Dumercy, L. Impact of power converter current ripple on the durability of a fuel cell stack. In Proceedings of the 2008 IEEE International Symposium on Industrial Electronics, Cambridge, UK, 30 June–2 July 2008; pp. 1495–1500. [Google Scholar]
- U.S. DRIVE. Fuel Cell Technical Team Roadmap; Department of Energy: Washington, DC, USA, 2017.
- Ahmed, A.A.; Ramadan, H.S. Prototype implementation of advanced electric vehicles drivetrain system: Verification and validation. Appl. Energy 2020, 266, 114807. [Google Scholar] [CrossRef]
- Davat, B.; Astier, S.; Azib, T.; Bethoux, O.; Candusso, D.; Coquery, G.; De Bernardinis, A.; Druart, F.; François, B.; Arregui, M.G.; et al. Fuel cell-based hybrid systems. In Proceedings of the 2009 8th International Symposium on Advanced Electromechanical Motion Systems & Electric Drives Joint Symposium, Lille, France, 1–3 July 2009; pp. 1–11. [Google Scholar]
- Azib, T.; Bethoux, O.; Remy, G.; Marchand, C. Saturation Management of a Controlled Fuel-Cell/Ultracapacitor Hybrid Vehicle. IEEE Trans. Veh. Technol. 2011, 60, 4127–4138. [Google Scholar] [CrossRef]
- Toyota. Outline of the Mirai. Available online: https://www.toyota-europe.com/download/cms/euen/Toyota Mirai FCV_Posters_LR_tcm-11-564265.pdf (accessed on 6 November 2020).
- Grijalva, E.R.; López, J.-M.; Flores, M.N.; Del Pozo, V. Design and Simulation of a Powertrain System for a Fuel Cell Extended Range Electric Golf Car. Energies 2018, 11, 1766. [Google Scholar] [CrossRef] [Green Version]
- Tardy, E.; Courtois, F.; Chandesris, M.; Poirot-Crouvezier, J.-P.; Morin, A.; Bultel, Y. Investigation of liquid water heterogeneities in large area PEM fuel cells using a pseudo-3D multiphysics model. Int. J. Heat Mass Transf. 2019, 145, 118720. [Google Scholar] [CrossRef]
- Luo, Y.; Jiao, K. Cold start of proton exchange membrane fuel cell. Prog. Energy Combust. Sci. 2018, 64, 29–61. [Google Scholar] [CrossRef]
- Nandjou, F.; Poirot-Crouvezier, J.-P.; Chandesris, M.; Blachot, J.-F.; Bonnaud, C.; Bultel, Y. Impact of heat and water management on proton exchange membrane fuel cells degradation in automotive application. J. Power Sources 2016, 326, 182–192. [Google Scholar] [CrossRef]
- Raga, C.; Barrado, A.; Lázaro, A.; Martin-Lozano, A.; Quesada, I.; Zumel, P. Influence of the Main Design Factors on the Optimal Fuel Cell-Based Powertrain Sizing. Energies 2018, 11, 3060. [Google Scholar] [CrossRef] [Green Version]
- Ceschia, A.; Azib, T.; Bethoux, O.; Alves, F. Optimal design methodology for sizing a fuel cell/battery hybrid power source. Proc. Inst. Mech. Eng. Part A J. Power Energy 2020. [Google Scholar] [CrossRef]
- Ceschia, A.; Azib, T.; Bethoux, O.; Alves, F. Optimal Sizing of Fuel Cell Hybrid Power Sources with Reliability Consideration. Energies 2020, 13, 3510. [Google Scholar] [CrossRef]
- Ahluwalia, R.; Wang, X.; Kwon, J.; Rousseau, A.; Kalinoski, J.; James, B.; Marcinkoski, J. Performance and cost of automotive fuel cell systems with ultra-low platinum loadings. J. Power Sources 2011, 196, 4619–4630. [Google Scholar] [CrossRef]
- Marx, N.; Hissel, D.; Gustin, F.; Boulon, L.; Agbossou, K. On Maximizing the Steady-State Efficiency of a Multi-Stack Fuel Cell System. In Proceedings of the 2018 IEEE Vehicle Power and Propulsion Conference (VPPC), Chicago, IL, USA, 27–30 August 2018; pp. 1–6. [Google Scholar]
- Marx, N.; Hissel, D.; Cárdenas, D.C.T.; Boulon, L.; Gustin, F. Degraded mode operation of multi-stack fuel cell systems. IET Electr. Syst. Transp. 2016, 6, 3–11. [Google Scholar] [CrossRef]
- De Bernardinis, A.; Frappé, E.; Bethoux, O.; Marchand, C.; Coquery, G. Multi-port power converter for segmented PEM fuel cell in transport application. Eur. Phys. J. Appl. Phys. 2012, 58, 20901. [Google Scholar] [CrossRef]
- Marx, N.; Hissel, D.; Gustin, F.; Boulon, L.; Agbossou, K. On the sizing and energy management of an hybrid multistack fuel cell—Battery system for automotive applications. Int. J. Hydrog. Energy 2017, 42, 1518–1526. [Google Scholar] [CrossRef]
- Forrest, K.; Mac Kinnon, M.; Tarroja, B.; Samuelsen, S. Estimating the technical feasibility of fuel cell and battery electric vehicles for the medium and heavy duty sectors in California. Appl. Energy 2020, 276, 115439. [Google Scholar] [CrossRef]
- Bansal, S.; Zong, Y.; You, S.; Mihet-Popa, L.; Xiao, J. Technical and Economic Analysis of One-Stop Charging Stations for Battery and Fuel Cell EV with Renewable Energy Sources. Energies 2020, 13, 2855. [Google Scholar] [CrossRef]
- Béthoux, O. Hydrogen Fuel Cell Road Vehicles and its infrastructure: An option towards environmental friendly energy transition. Energies 2020, in press. [Google Scholar]
Figure 1.
use in road vehicles. (a) Forklift truck (in a store deposit); (b) Taxi fleet (Paris region); (c) hydrogen bus (Paris region).
Figure 1.
use in road vehicles. (a) Forklift truck (in a store deposit); (b) Taxi fleet (Paris region); (c) hydrogen bus (Paris region).

Figure 2.
Oxidation-reduction reactions in the fuel cell (FC).

Figure 3.
Fuel cell systems (FCS) functional principle.

Figure 4.
Comparison of battery vehicles (EV) and fuel cell vehicles (FCVs) [13].
Figure 4.
Comparison of battery vehicles (EV) and fuel cell vehicles (FCVs) [13].

Figure 5.
Studied thermodynamic system.

Figure 6.
FC voltage and the main related voltage drops (due to irreversibilities).

Figure 7.
Stack of elementary cells (“stack”) produced by the German manufacturer UBzM, Ulm—Germany (GeePs laboratory).
Figure 7.
Stack of elementary cells (“stack”) produced by the German manufacturer UBzM, Ulm—Germany (GeePs laboratory).

Figure 8.
FC details: membrane-electrode assembly (MEA).

Figure 9.
Detail of the active layer (AL) of an MEA: [22]. (a) Scanning Electron Microscopy (SEM) image | (b) Transmission Electron Microscopy (TEM) image.
Figure 9.
Detail of the active layer (AL) of an MEA: [22]. (a) Scanning Electron Microscopy (SEM) image | (b) Transmission Electron Microscopy (TEM) image.

Figure 10.
Scanning electron microscope (SEM) imaging of 2 gas diffusion layer (GDL) technologies [33].
Figure 10.
Scanning electron microscope (SEM) imaging of 2 gas diffusion layer (GDL) technologies [33].

Figure 11.
Section of a bipolar plate (BP) with its three channels [34]. (a) anode channel (H2) | (b) cathode channel (air) | (c) heat transfer fluid channel.
Figure 11.
Section of a bipolar plate (BP) with its three channels [34]. (a) anode channel (H2) | (b) cathode channel (air) | (c) heat transfer fluid channel.

Figure 12.
Shape design examples of BP channels [35]. (a) serpentine channels | (b) parallel channels | (c) interdigitate channels.
Figure 12.
Shape design examples of BP channels [35]. (a) serpentine channels | (b) parallel channels | (c) interdigitate channels.

Figure 13.
Trade-off in designing BP channels.

Figure 14.
Schematic view of an FCS. green: air line (cathode) | red: hydrogen line (anode) | blue: cooling line | purple: electric line.
Figure 14.
Schematic view of an FCS. green: air line (cathode) | red: hydrogen line (anode) | blue: cooling line | purple: electric line.

Figure 15.
Principle of homogenization of the water content in the PEMFC MEA.

Figure 16.
Synopsis of the first two layers of the tank [41].
Figure 16.
Synopsis of the first two layers of the tank [41].

Figure 17.
Anode nitrogen stratification without recirculation for partial pressure homogenization.

Figure 18.
Anode nitrogen stratification without partial pressure homogenization by recirculation.

Figure 19.
Platinum particles on carbon support (dark dots) before (a) and after (b) exposure to 400 potential changes between 0.0 V and [47].
Figure 19.
Platinum particles on carbon support (dark dots) before (a) and after (b) exposure to 400 potential changes between 0.0 V and [47].

Figure 20.
FCV hybrid drive train.

Figure 21.
Boost converter dedicated to the FC.

Figure 22.
Efficiency curves of the FC interleaved boost converter.

Figure 23.
Toyota Mirai sedan and its main components [58].
Figure 23.
Toyota Mirai sedan and its main components [58].

Figure 24.
Range extender vehicle: Renault Kangoo ZE H2 Light Commercial Vehicle.

Figure 25.
Mercedes GLC F-Cell SUV light vehicle: mild-hybrid type with a FCS.

Figure 26.
FCS efficiency curve (boldly blue line).

Publisher’s Note: MDPI stays neutral with regard to jurisdictional claims in published maps and institutional affiliations. |
© 2020 by the author. Licensee MDPI, Basel, Switzerland. This article is an open access article distributed under the terms and conditions of the Creative Commons Attribution (CC BY) license (http://creativecommons.org/licenses/by/4.0/).
Share and Cite
MDPI and ACS Style
Bethoux, O. Hydrogen Fuel Cell Road Vehicles: State of the Art and Perspectives. Energies 2020, 13, 5843. https://0-doi-org.brum.beds.ac.uk/10.3390/en13215843
AMA Style
Bethoux O. Hydrogen Fuel Cell Road Vehicles: State of the Art and Perspectives. Energies. 2020; 13(21):5843. https://0-doi-org.brum.beds.ac.uk/10.3390/en13215843
Chicago/Turabian StyleBethoux, Olivier. 2020. "Hydrogen Fuel Cell Road Vehicles: State of the Art and Perspectives" Energies 13, no. 21: 5843. https://0-doi-org.brum.beds.ac.uk/10.3390/en13215843
Note that from the first issue of 2016, this journal uses article numbers instead of page numbers. See further details here.