
Life Cycle Assessment of a Barge-Type Floating Wind Turbine and Comparison with Other Types of Wind Turbines


Civil Engineering Department, School of Engineering, University of Birmingham, Edgbaston, Birmingham B15 2TT, UK
*
Author to whom correspondence should be addressed.
Energies 2021, 14(18), 5656; https://0-doi-org.brum.beds.ac.uk/10.3390/en14185656
Submission received: 3 August 2021
/
Revised: 31 August 2021
/
Accepted: 3 September 2021
/
Published: 8 September 2021
(This article belongs to the Special Issue Recent Advances in Offshore Wind Turbines)
Abstract
:The intensive increase of global warming every year affects our world negatively and severely. The use of renewable energy sources has gained importance in reducing and eliminating the effect of global warming. To this end, new technologies are being developed to facilitate the use of these resources. One of these technological developments is the floating wind turbine. In order to evaluate the respective environmental footprint of these systems, a life cycle assessment (LCA) is herein applied. In this study, the environmental impact of floating wind turbines is investigated using a life cycle assessment approach and the results are compared with the respective ones of onshore and jacket offshore wind turbines of the same power capacity. The studied floating wind turbine has a square foundation that is open at its centre and is connected to the seabed with a synthetic fibre-nylon anchorage system. The environmental impact of all life cycles of such a structure, i.e., the manufacture, the operation, the disposal, and the recycling stages of the wind turbines, has been evaluated. For these floating wind turbines, it has been found that the greatest environmental impact corresponds to the manufacturing stage, whilst the global warming potential and the energy payback time of a 2 MW floating wind turbine of a barge-type platform is higher than that of the onshore, the jacket offshore (2 MW) and the floating (5 MW) wind turbines on a sway floating platform.
1. Introduction
Despite the fact that progress is being made towards the seventh UN sustainable development goal [1], with encouraging signs that energy is becoming more sustainable and widely available, the world still relies on traditional fossil energy. The latter is the dominant contributor to climate change, accounting for around 60% of the total global greenhouse gases emissions [1].
According to the long-term climate change strategy recently agreed, universal access to affordable, sustainable energy services should be ensured by 2030, and society should be climate-neutral by 2050 [2]. According to this, wind energy stands as a prominent renewable source that encourages the development of innovative wind energy systems with enhanced output generation capacity. Such new developments are floating wind turbines or very tall onshore turbines [2].
Increasing environmental problems, energy costs, and diminishing nonrenewable energy sources oblige people to prefer renewable energy sources such as wind, solar, and hydropower [3]. Renewable energy sources are provided from natural resources and are sustainable energies. Renewable energy sources are not only clean, safe, and environmentally friendly, but also cost-effective and inexhaustible [4]. The negative impacts of renewable energy resources are limited and insignificant compared to the other traditional energy resources as sustainable energy has a limited negative impact on natural vegetation and human health, does not burn fossil sources, has no radioactive effect, and is experiencing rapid technological development [5]. Wind energy is the foremost renewable energy, offering clean energy, economic advantages, and a clear way to reduce greenhouse gas emissions (GHG) [5].
In 2020, wind energy production reached over 650 GW around the world, with 59.7 GW added in the previous year [6]. In 2019, the growth rate of wind energy was 10.1% higher than the 2018 rate in terms of market size, but less than in 2017 and 2016. China and the US, having the biggest wind market size of the last five years, installed wind energy amounting to 27.5 and 9.1 GW, respectively, in 2019. Although European countries erected 15.4 GW of wind energy capacity in 2019, the growth rate of wind energy was 27% higher than the previous year but 10% less than the rate in 2017 [6,7,8].
According to the 2019 report “Wind Energy in Europe: Outlook to 2023” [9], it is accepted that the wind energy capacity of Germany, Spain and the UK will sharply rise by 2023. Installation of 65 GW of wind energy is planned across nine European countries from 2019 to 2023. Germany will install 11.2 GW of onshore wind energy in these years and will be the leader in onshore wind energy in the European continent. Furthermore, Spain (8.7 GW), France (8.1 GW) and Sweden (7.5 GW) come after Germany in terms of onshore wind capacity. Concerning offshore wind energy, the UK will install 6.4 GW of wind energy over five years, followed by The Netherlands (4 GW), Germany (2.9 GW), Denmark (1.7 GW), and France (1.3 GW). The UK will become the leader in offshore wind energy in Europe [9,10].
Thanks to new technologies, wind turbines which have taller structures, longer blades, and set up different locations can be constructed and thus wind energy capacity is rising. Onshore wind turbines with new hybrid structures have taller hub heights and allow better operation of wind energy in higher locations [11]. Floating wind turbines, being a recent high-innovation development in the wind energy sector, are located in deep waters where fixed-bottom offshore wind towers are not feasible because of the cost of the foundation and the lack of technology [12]. Along with the design of these new wind turbine structures, the carbon emissions emitted during their manufacture, installation, operation, and disposal must also be considered. Given these new turbine structures, this study focuses on the environmental impacts of floating wind turbines using the life cycle assessment methodology.
2. Life Cycle Assessment—An Overview
Sustainability revolves around achieving an equal balance among the economic, environmental, and social factors throughout the life cycle of any given product [13]. The LCA is a rigorous method that evaluates the environmental impact of energy, raw materials and waste, and emissions resulting from a product, process, or service based on the ISO 14040 and 14044 standards [14,15]. The LCA is carried out in the following four standard steps. In the first step, the purpose, scope, methodologies, and limits of the system are determined, and, in the second step, the life cycle inventory (LCI) is determined with inputs and outputs at the boundaries of the system. In the third step, a life cycle impact assessment (LCIA) is performed with environmental impact potentials determined using inventory data collected and compiled in the previous step, and the results are interpreted in the fourth step [13].
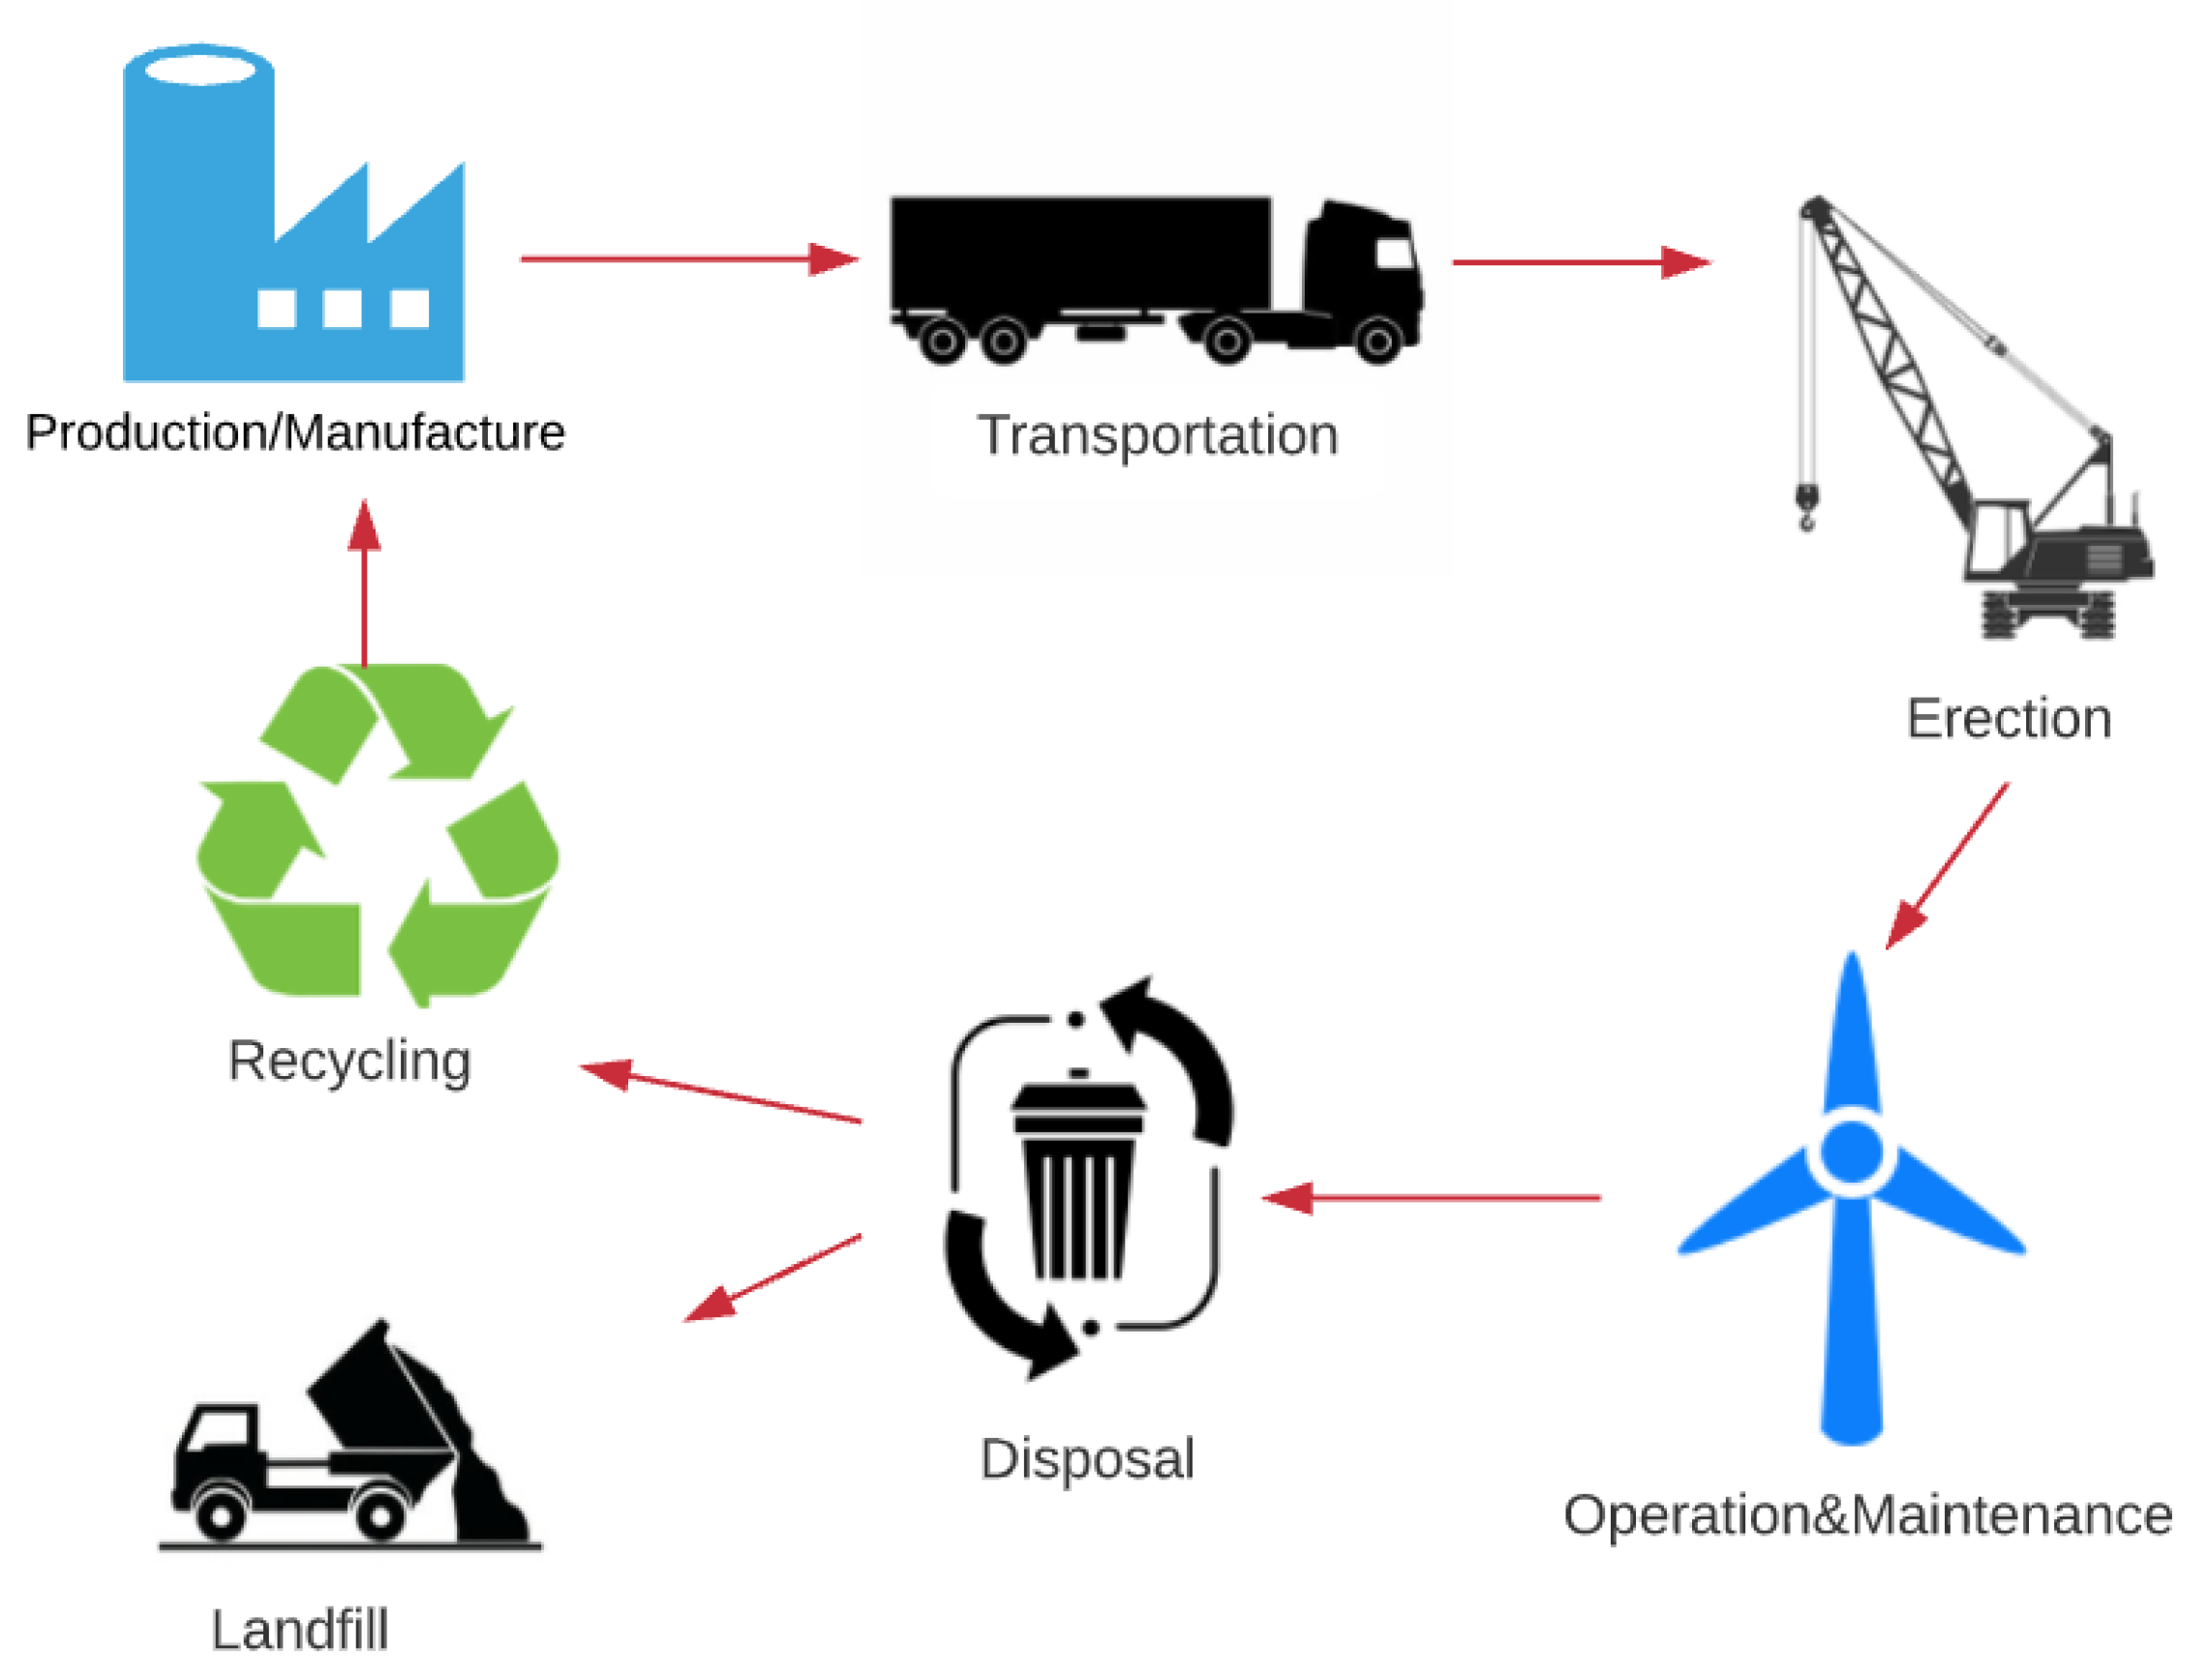
The LCA methodology adopted for this study is depicted in Figure 1. The system boundary (Section 3.2) includes the following six stages that have been considered in all analyses: manufacture, transportation, erection, operation and maintenance, disposal and recycling. With reference to the six stages of the wind turbines’ LCA (Figure 1), the following should be noted:
- During the production and manufacture stage, the materials and parts are selected and made for the wind turbine, i.e., the tower, blades, nacelle, foundation, etc. are produced.
- During transportation, the manufactured parts are transferred to the area where the system will be installed. Here, the distance between the factory and the installation area is the critical impact factor.
- During the erection, the installation of the system is completed. The wind turbine parts must be modular and of movable size.
- Concerning the operation and maintenance of the system, a periodic maintenance of the system carried out systematically that has to be taken into account.
- For the disposal, a turbine that has completed its life cycle is dismantled.
Until now, LCA studies have been focused on different wind turbine designs and sizes of onshore and offshore wind turbines. Demir and Taskin [16] studied the environmental impact of onshore wind turbines having different heights and sizes. They recommend large-size wind turbines with alternative environmentally friendly materials to decrease the environmental emissions. Guezuragaet et al. [17] conducted the LCA of 2 and 1.8 MW steel wind towers. They highlighted higher environmental emissions during the manufacturing phase. Gervásio et al. [18] focused on the LCA of concrete, steel, and composite wind turbine towers having different heights and sizes. It has been pointed out that the environmental impact of using steel towers is less than other towers. Gkantou et al. [11] focused on the environmental impact of two tall hybrid towers. The towers consisted of two parts, a top tubular part and the bottom lattice part with either four or six legs. The four-legged hybrid tower exhibited a lower environmental impact than the six-legged one. Stavridou et al. [19] analysed comparatively a 2 MW tall tubular tower and a lattice wind tower and concluded that the lattice tower has lower environmental impact and energy-payback time. Alsaleh and Sattler [20] studied the environmental impact of large onshore wind farms in the US. The manufacturing stage was more than 60% of the total CO2 contribution. Moreover, extension of the lifetime of the wind farm, such as to 25 and 35 years, was analysed. These extended lifetimes have lower impacts per kWh of electricity generated. Lanzen and Wachsmann [21] compared the LCA of wind turbines in different geographical locations (e.g., Brazil and Germany) considering the manufacturing locations of the components. They considered the distance from the manufacturing area of wind turbine components to the place of operation of the wind turbine in five different scenarios, such as production in Germany and operation in Brazil. The scenario of production and operation in Brazil has a lower kg CO2/kWh than other scenarios. In addition, Kaldellis and Apostolou [22] studied the life cycle energy and CO2 emission comparison of offshore and onshore wind energy systems. Offshore wind turbines have a large carbon footprint; however, they are the best choice considering their high energy efficiency. Huang et al. [23] evaluated the LCA of offshore aeolian farms considering two different substations (onshore and offshore). They highlighted that the high environmental impact corresponds to the offshore substation; they also concluded that the impact could be moderated using recycled materials. Considering twenty past studies, Bhandari et al. [24] investigated the GHG emissions and the annual energy yields (AEY) of single onshore and offshore wind turbines. The results of Bhandari et al. highlighted a correlation between the GHG to the AEY for onshore wind farms and single wind turbines. Kasner et al. [25] investigated the energy efficiency and environmental effects of wind turbines with a lifespan of 25 years and 50 years, using the sustainable modernization method. To increase the lifetime of the wind turbine to 50 years, it was extended by replacing components, such as rotor, blades, structure parts etc., and maintaining them at the required time. In this study, they analysed the environmental impacts of a wind turbine with a life of 50 years and a new wind turbine that has completed its 25-year lifetime and which will operate again for 25 years. They highlighted that the greenhouse gas emission of the wind turbine with a lifetime 50 years, is lower by 40–50% than that of two wind turbines during their 25-year life periods [25].
LCA of onshore and offshore wind turbines has been investigated in the past as shown in Table 1. These past studies have focused on a wind turbine in a specific area, comparing other wind turbines or renewable energy sources (solar), different heights, wind tower materials (steel, concrete, etc.), and wind turbine size. The results of these LCA studies, environmental impacts and energy payback time of a wind turbine have been calculated and these results have been interpreted.
The first floating wind turbine was built in Scotland in 2017 by Equinar and Masdar Companies [38]. This newly developed wind turbine attracted the interest of researchers who perform LCA on wind turbines. Currently, four studies related to LCA of floating wind turbines have been published [Table 2]. Weinzettel et al. [39] focused on comparative LCA of a 5 MW sway floating wind power plant, a 2 MW offshore turbine, and a natural gas electricity system. The energy payback time and the CO2 emissions of the floating wind power plant were calculated at 5.2 months and 3 ×10⁻⁴ kg, respectively. This comparative study shows that the sway floating wind power plant has less environmental impact than the 2 MW offshore wind power plant and a natural gas electricity system. Randal et al. [40] compared the GHG emission and energy performance of six different wind turbines. These wind turbines have different foundations and mooring designs: spar, two tension-leg-buoy (MIT and UMaine TLB), sway, semisubmersible floating, and jacket bottom-fixed designs. According to the results of Randal et al., the lowest GHG emission was of the MIT TLB at 18.0 g CO2 eq./kWh, while the semisubmersible design had a higher value (31.4 gCO2 eq./kWh). Furthermore, they stated that wind turbines with a higher energy payback ratio and lower energy payback time have the best energy performance. Taking account of that shows that MIT TLB and jacket offshore wind turbines have the best performance, and steel platforms and anchor cables have high contributions to the total CO2 emissions. Elginoz and Bas [41] focused on the life cycle assessment of a floating multiuse offshore platform farm that combines a wind and a wave energy system, considering the overall environmental impact. In addition, this study includes a comparative analysis of a spar platform with a single-use semisubmersible one over a lifespan of 25 years. As a result of their research, for the semisubmersible floating wind turbine they concluded that the amount of terrestrial ecotoxicity, freshwater aquatic ecotoxicity and eutrophication is high. Kausche et al. [42] investigated the economic and environmental impact of a tension leg platform floating wind turbine. The first objective of their study was to investigate a possible reduction of the economic impact and investment cost, and the second one was the curtailment of CO2 emissions during the manufacturing process of the system. Three types of floating wind turbines, steel-concrete, steel-reinforced concrete, and steel structure, were designed and analysed considering the economic and environmental impact. Concerning the CO2 emissions, the steel-concrete turbine has a lower value of about 395 t/MW, while the best economic result corresponds to the steel-concrete wind turbine [42]. As can be observed in Table 2, the published literature on floating wind turbine towers has been collected and presented in chronological order. The four studies focused on the LCA of five different types of floating platforms, sway, spar, TLB, semisubmersible, and TLP.
As a result of a comprehensive literature review, the LCAs of wind turbines were analysed considering parameters such as turbine size, height, design, location, type of turbine. In the light of the literature review, the present study aims to analyse the environmental impacts of the barge-type floating wind turbine and compare it to the environmental impacts of the spar floating, the onshore, and the jacket offshore wind turbines.
3. Life Cycle Assessment of a Floating Wind Turbine Tower
3.1. The Barge-Type Floating Wind Turbine
For the present study, the LCA of a barge-type floating wind tower was examined considering the boundaries shown in Figure 1. Realistic site data [37,43] and published data [44] were used in this work. The LCA of the floating wind turbine was then conducted using the open-source Gemis 5 software [45]. The software can also perform life cycle costing (LCC) and social life cycle assessment, calculate the carbon and water footprints, produce the environmental product declaration (EPD) and investigate the integrated product policy (IPP). The software is used in the Europa database and it details the required primary energy for the process, the amount of emissions, and the energy flow of the system. The software calculates carbon dioxide (CO2), methane (CH4), and nitrous oxide (N2O). The unit of these gases is measured in equivalents kg/kWh [17].
The barge-type floating wind tower consists of a 60 m steel tubular tower which is made of two parts. The length of the lower part is 25 m, and the top part is 35 m. The total weights of the tower and the transition piece are 133 tonnes (t) and 50 tonnes (t), respectively. The turbine is a 2 MW Vestas 80V (40 m blade length) [37,43].
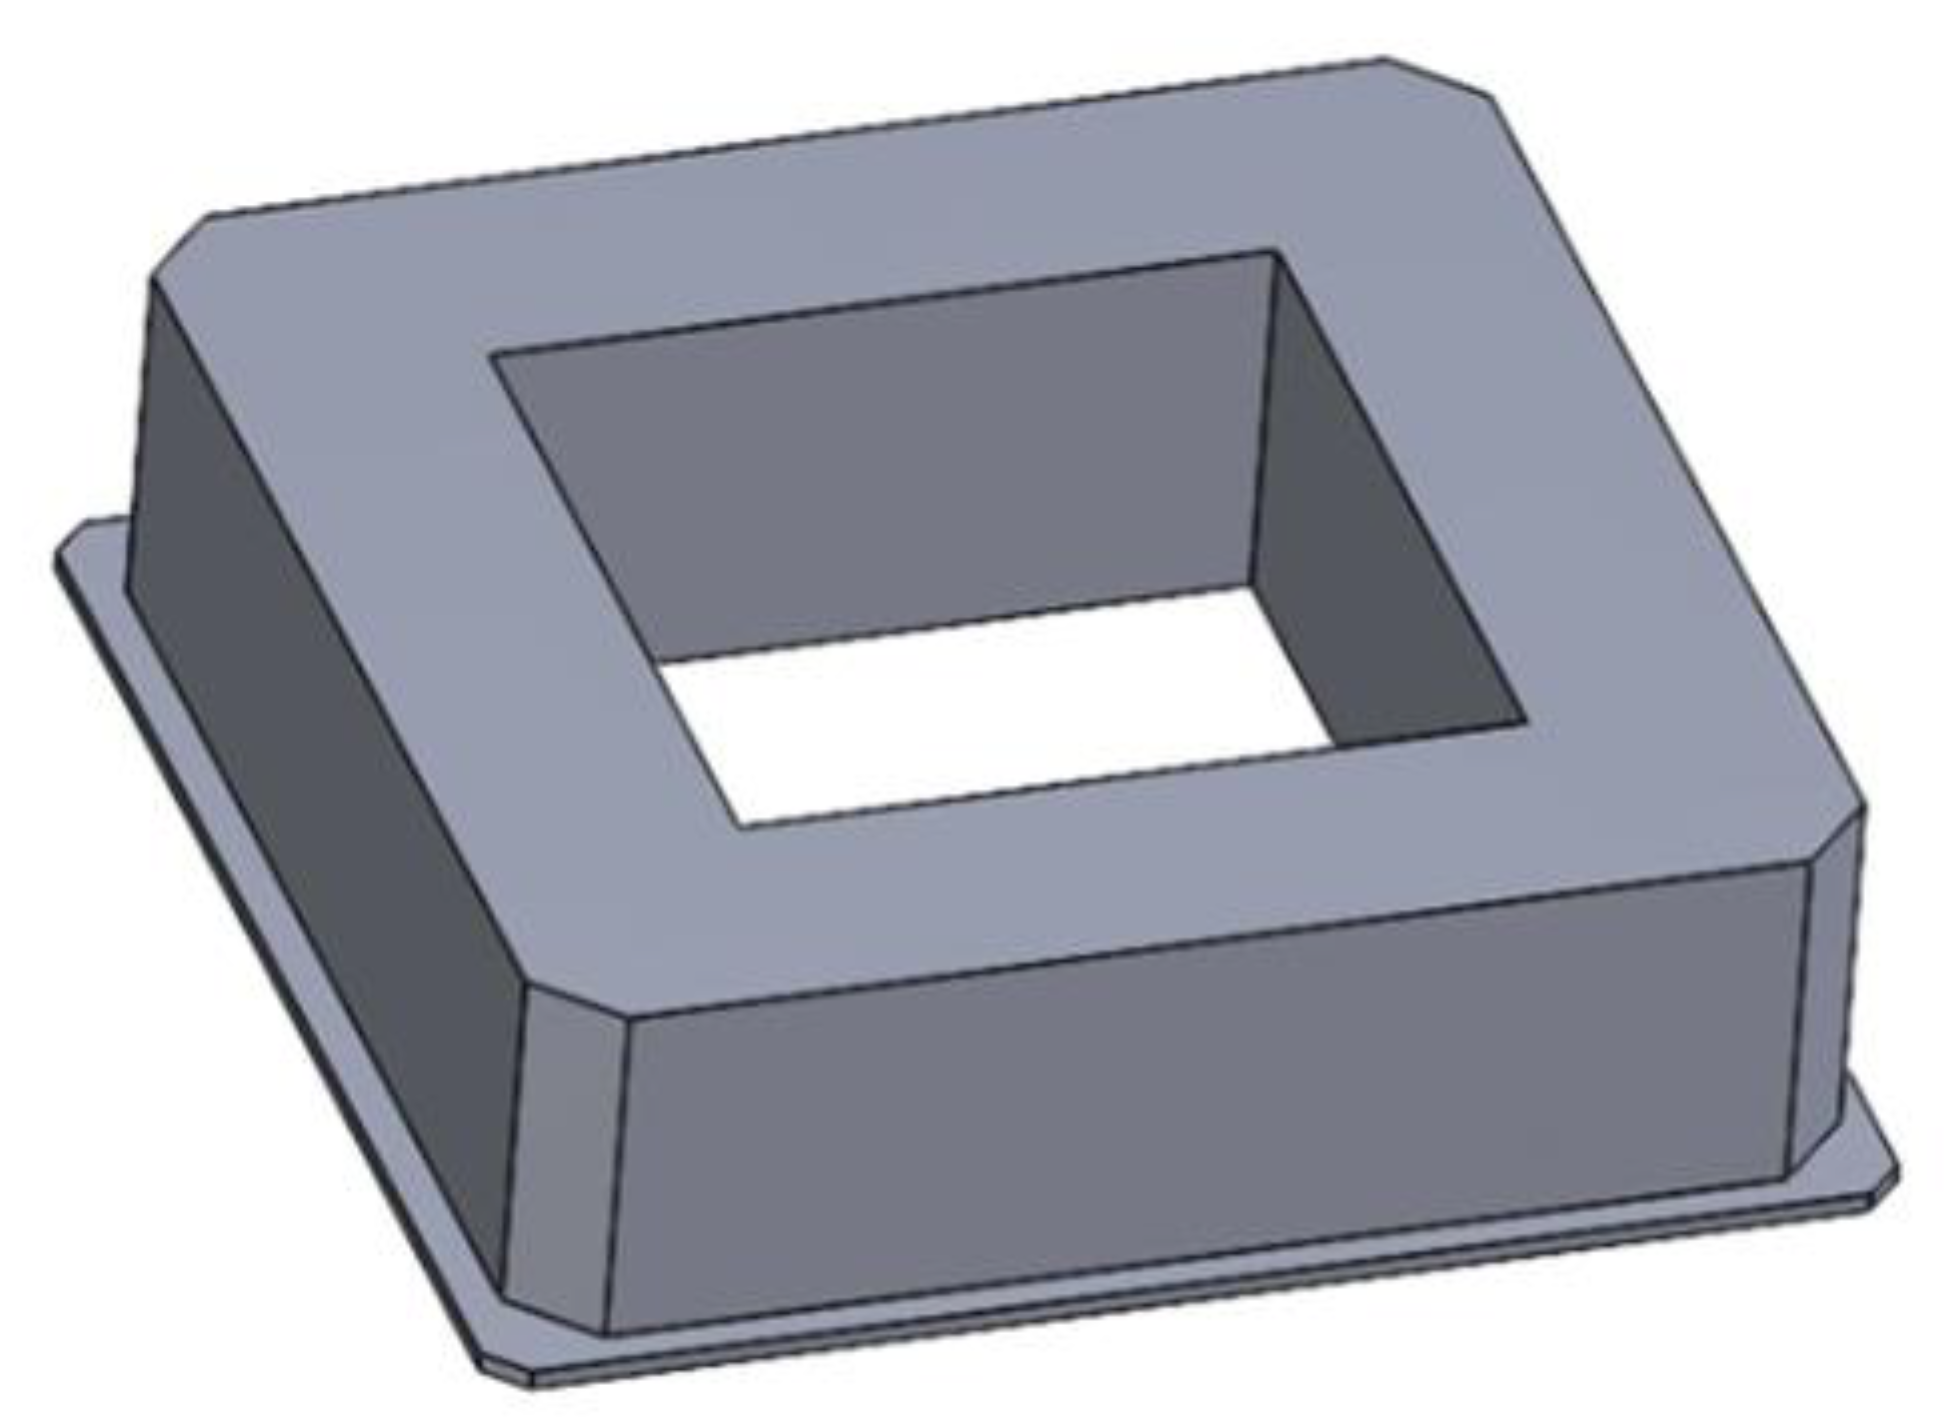
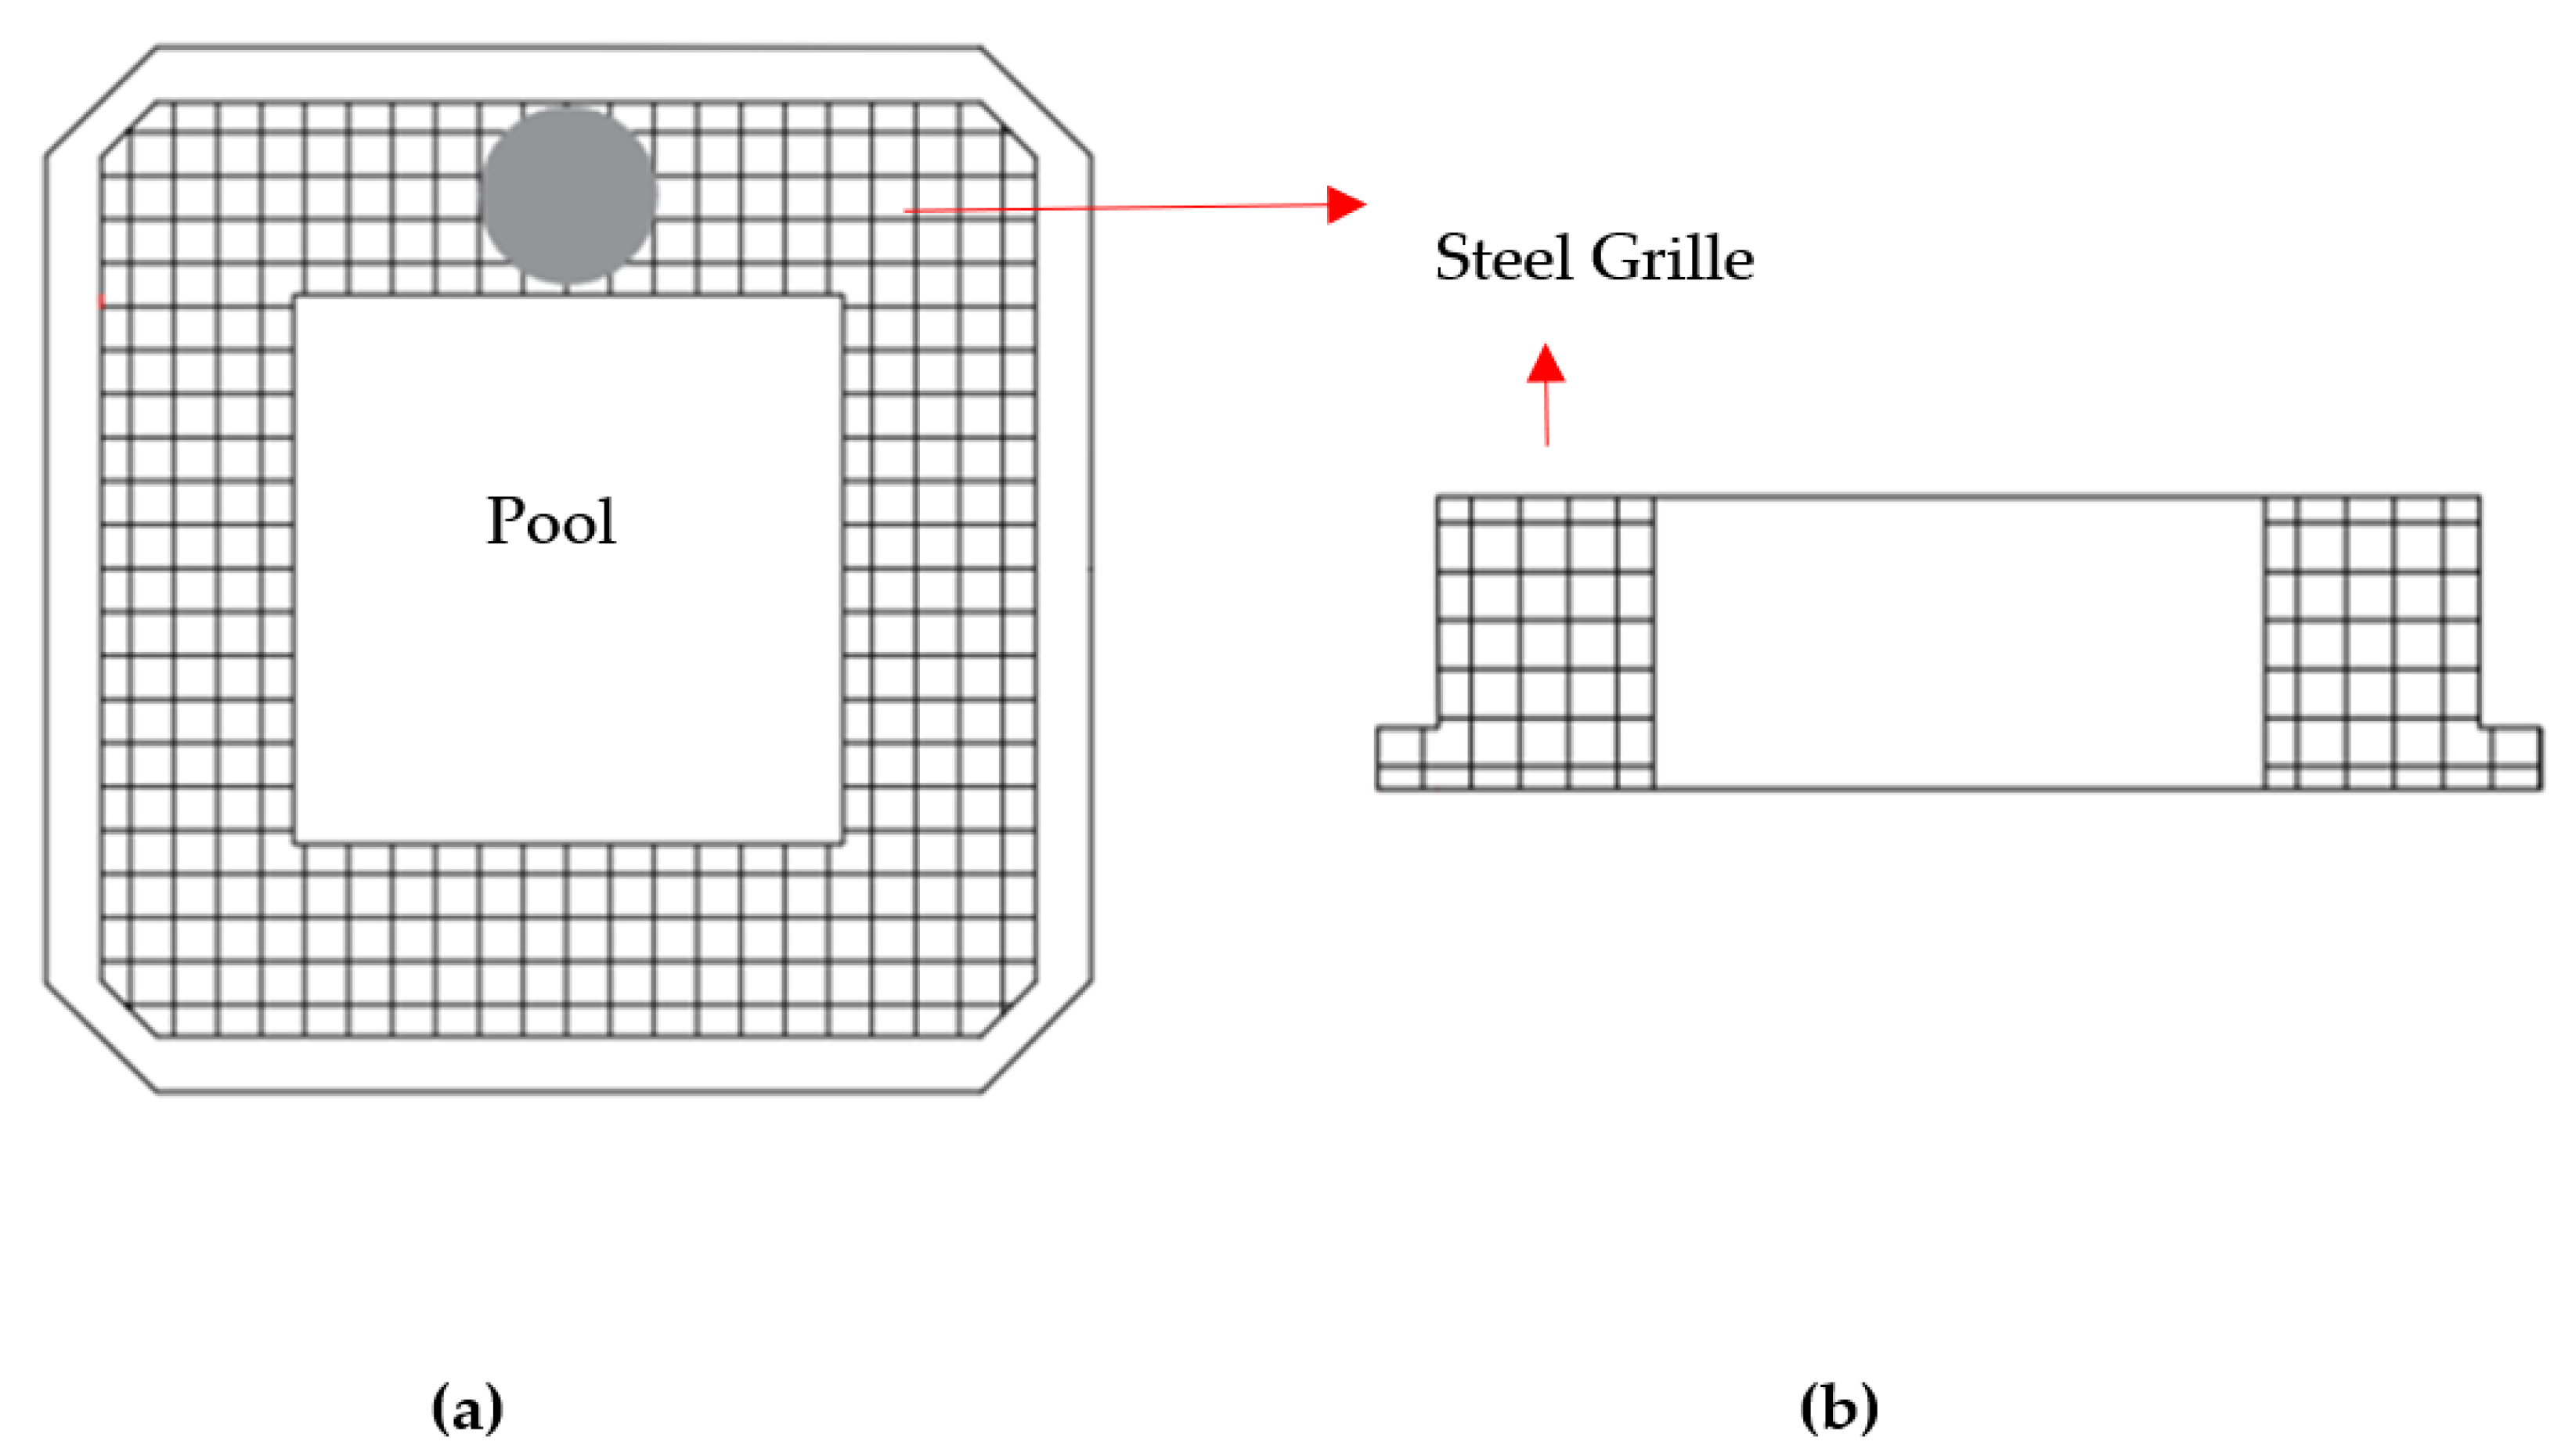
The floating foundation is a barge-type platform that is a square ring-shaped (open in its centre, 36 m wide, 9.5 m high, 7.5 m draft) and made of concrete (C55/67) and steel reinforcement (Figure 2). This steel part is designed as a grilled plate in the platform (Figure 3). The square ring shape is named pool, and dimension 20 × 20 m (Figure 3). The mooring system is semitaut. This mooring system is the best solution for deep water [38]. In this mooring line system, synthetic fibre-nylon ropes connect the floating platform to the seabed. The significant advantage of the rope is that it is not prone to corrosion [42,43,44,46].
3.2. Boundary System
The boundary system is the stage that materials, energy inflows and outflows and the life cycle stages are specified in a product [28]. In Figure 1, the boundary system of the life cycle assessment for a wind turbine are depicted. In the present analysis, all life cycle stages have been considered.
3.2.1. Manufacture Stage
The barge-type floating wind turbine was manufactured by European contractor companies. In Table 3 the mass distribution of the system is presented. It is shown that the platform including the mooring system has the largest mass. Here, the floating wind turbine platform is made of concrete and steel and the mooring system is composed of steel, cast iron, polyurethane foam, and nylon fibres. The anchors comprise two parts: the fluke and shank, with dimensions of 7 m × 4 m × 1 m and 3 m × 7 m × 3 m, respectively. The other parts of the system are the tower, the nacelle, and the rotor, which were manufactured in Spain. The nacelle is made of steel, aluminium, cast iron, glass fibre-reinforced plastic, and copper. The rotor consists of three blades which are made of glass fibre-reinforced plastic and cast iron [43].
3.2.2. Transportation Stage
This stage involves transporting all components from the factory/workshop to the site area. LCA of this stage is dependent on the type of vehicle, distance (factory to site area), and the emissions during the production of fuels [11]. In this study, cargo vessels and road transportation were utilised. Moreover, in Section 5.2, different transportation scenarios are considered and analysed.
3.2.3. Erection Stage
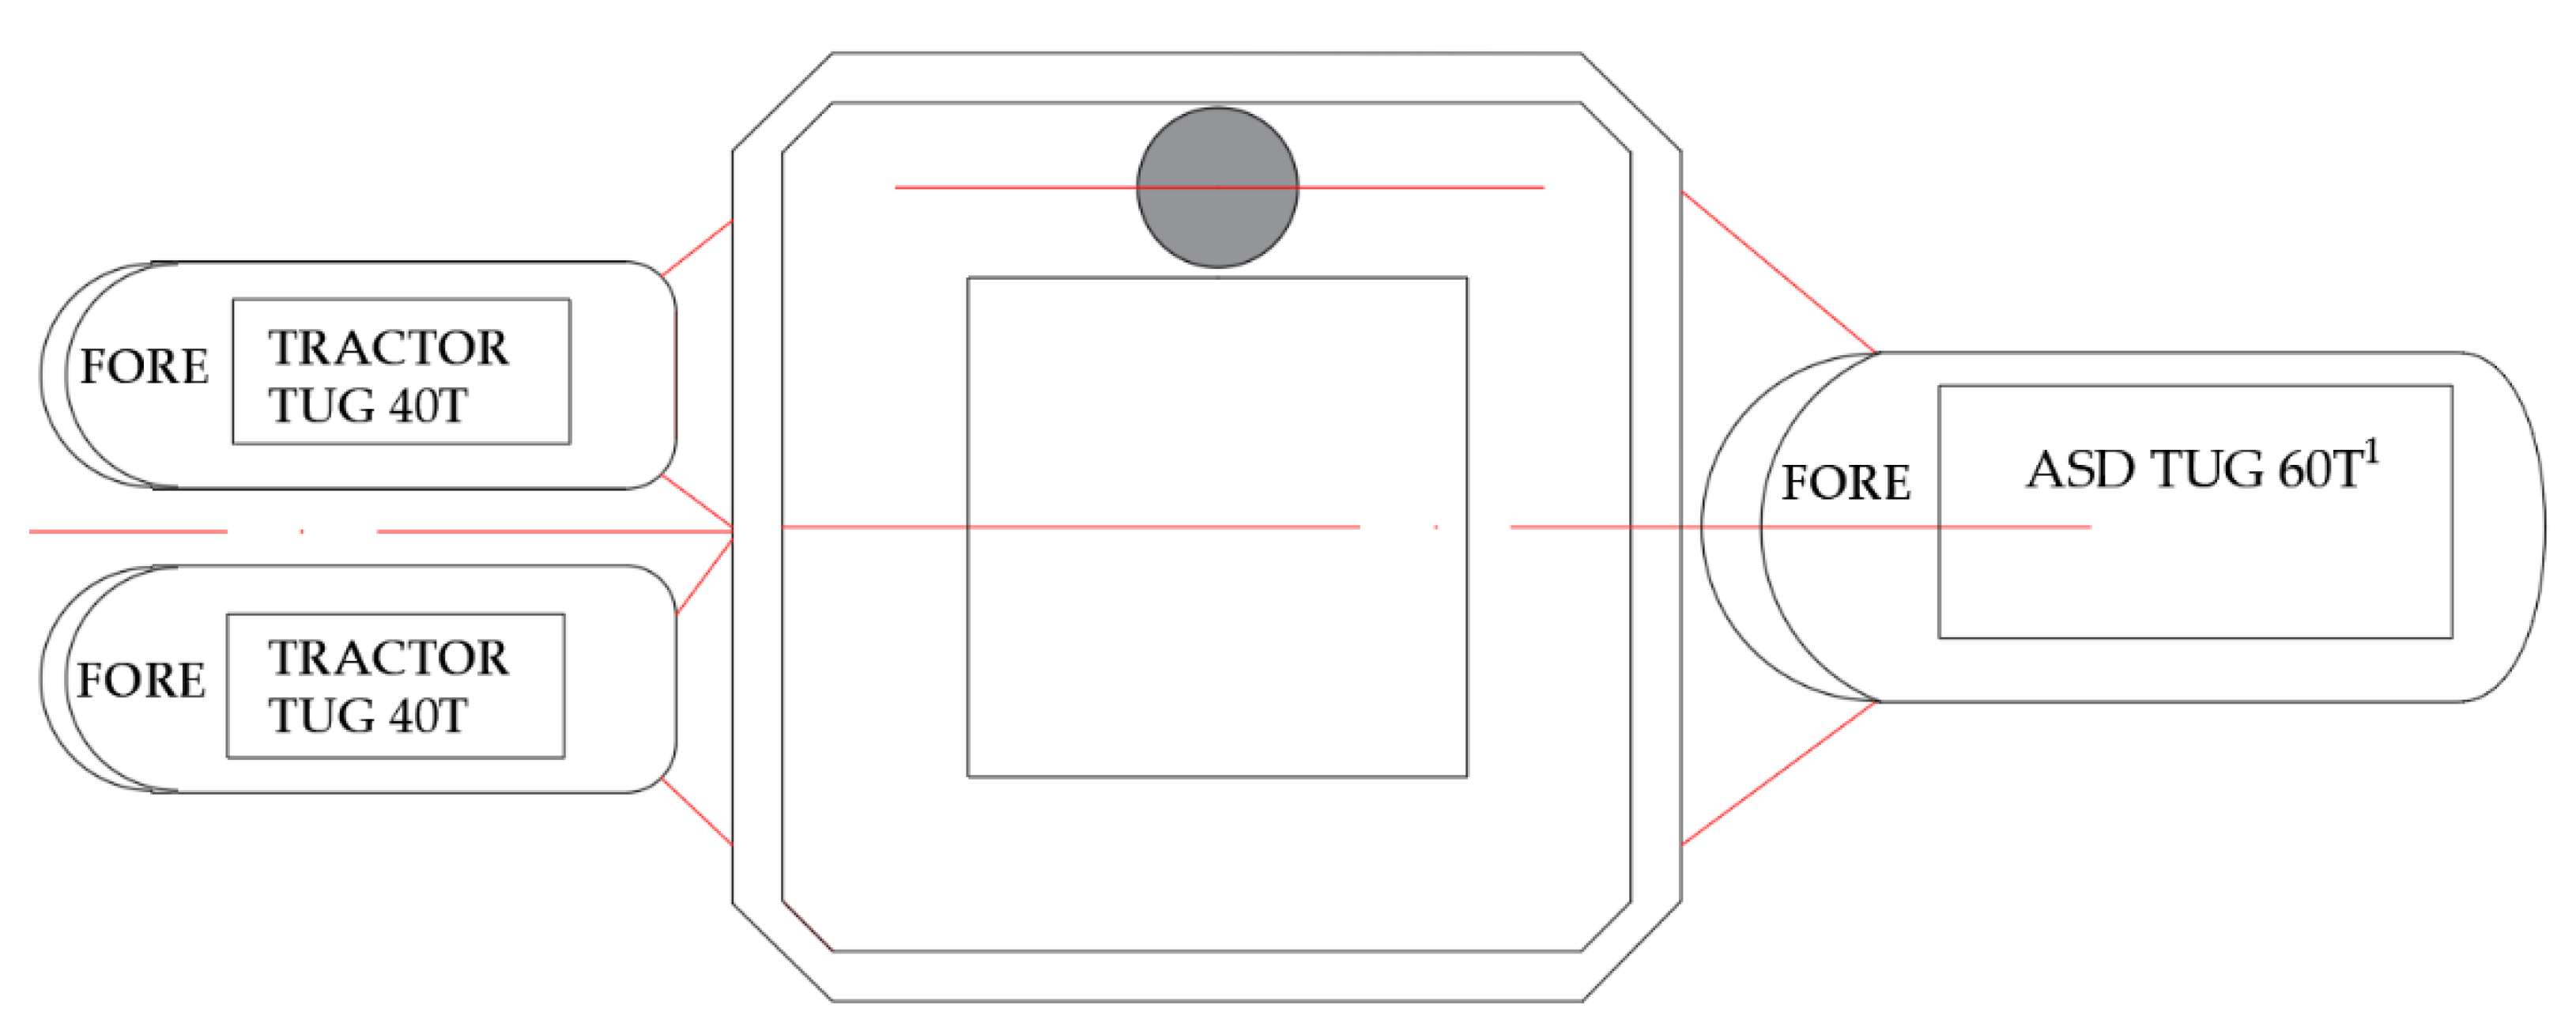
In this stage, a forklift and a heavy mobile crane were utilised for the land erection stage. In addition to the sea erection stage, the floating wind turbine was transported by three tugboats to the area of construction (Figure 4).
3.2.4. Operation and Maintenance Stage
In the operation stage, it was considered that the operation time of the barge-type platform would have been 3000 h per year [46]. Taking into account the performance of the wind turbine, the annual electricity generation is 6 GWh. During the maintenance stage, it is assumed that the wind energy systems gearbox has to be changed once in the lifetime of the turbine, and that all components must be examined and lubricated twice a year by specialised personnel.
3.2.5. Disposal and End-of-Life Stage
Following the operation and maintenance stage of the wind turbine tower, the next and final stage is its disposal at the end of its life. The end-of-life stage is conducted according to previous studies [9]. Concrete, glass fibre and nylon fibre materials are landfilled 20 km away from the coast. Here the recyclable percentage of steel and cast iron was assumed to be 85% [11]. Further assumptions are as follows [47,48]:
- Copper and aluminium: recycling 90%;
- Concrete, glass fibre and glass-reinforced plastic: landfill 100%;
- Nylon fibre: recycling 100%;
- Polyurethane foam: recycling 80%.
4. Life Cycle Inventory (LCI)
A life cycle inventory (LCI) comprises energy requirements and input-output material flows of a product system. The LCI of a wind turbine is its energy requirements and input-output data, which come from the manufacture, transportation, erection, operation and maintenance, and disposal steps of the product [11]. The LCI refers to the tower, the nacelle, the foundation and the rotor of the floating wind turbine tower and the respective data have been collected in order to carry out the LCA. According to the life cycle stages and product units, the derived data were categorized and imported to the software. The collected data from the barge-type floating wind turbine are presented in Table 4. This table provides information categorised by life stage and structure components.
5. LCA Results for the Barge-Type Floating Wind Turbine
The LCA of the barge-type floating wind turbine included all life cycle stages from raw materials to the end of its life. The lifespan of the floating wind turbine is assumed to be 20 years [11].
Table 5 contains a summary of the LCA of the barge-type floating wind turbine. The majority of the past studies focused on the following four environmental impacts: global warming potential (GWP), acidification potential (AP), abiotic depletion potential for fossil fuels (ADPF), and energy payback time, where
- Abiotic depletion potential for fossil fuels focused on the non-renewable resource is measured in MJ;
- Global warming potential is related to CO2 emissions measured in CO2-equivalent;
- AP values show aggregated acid air emissions measured in SO2-equivalent;
- The energy payback time, a ratio of primary energy to annual energy produced by a wind turbine, is calculated in months and years [11].
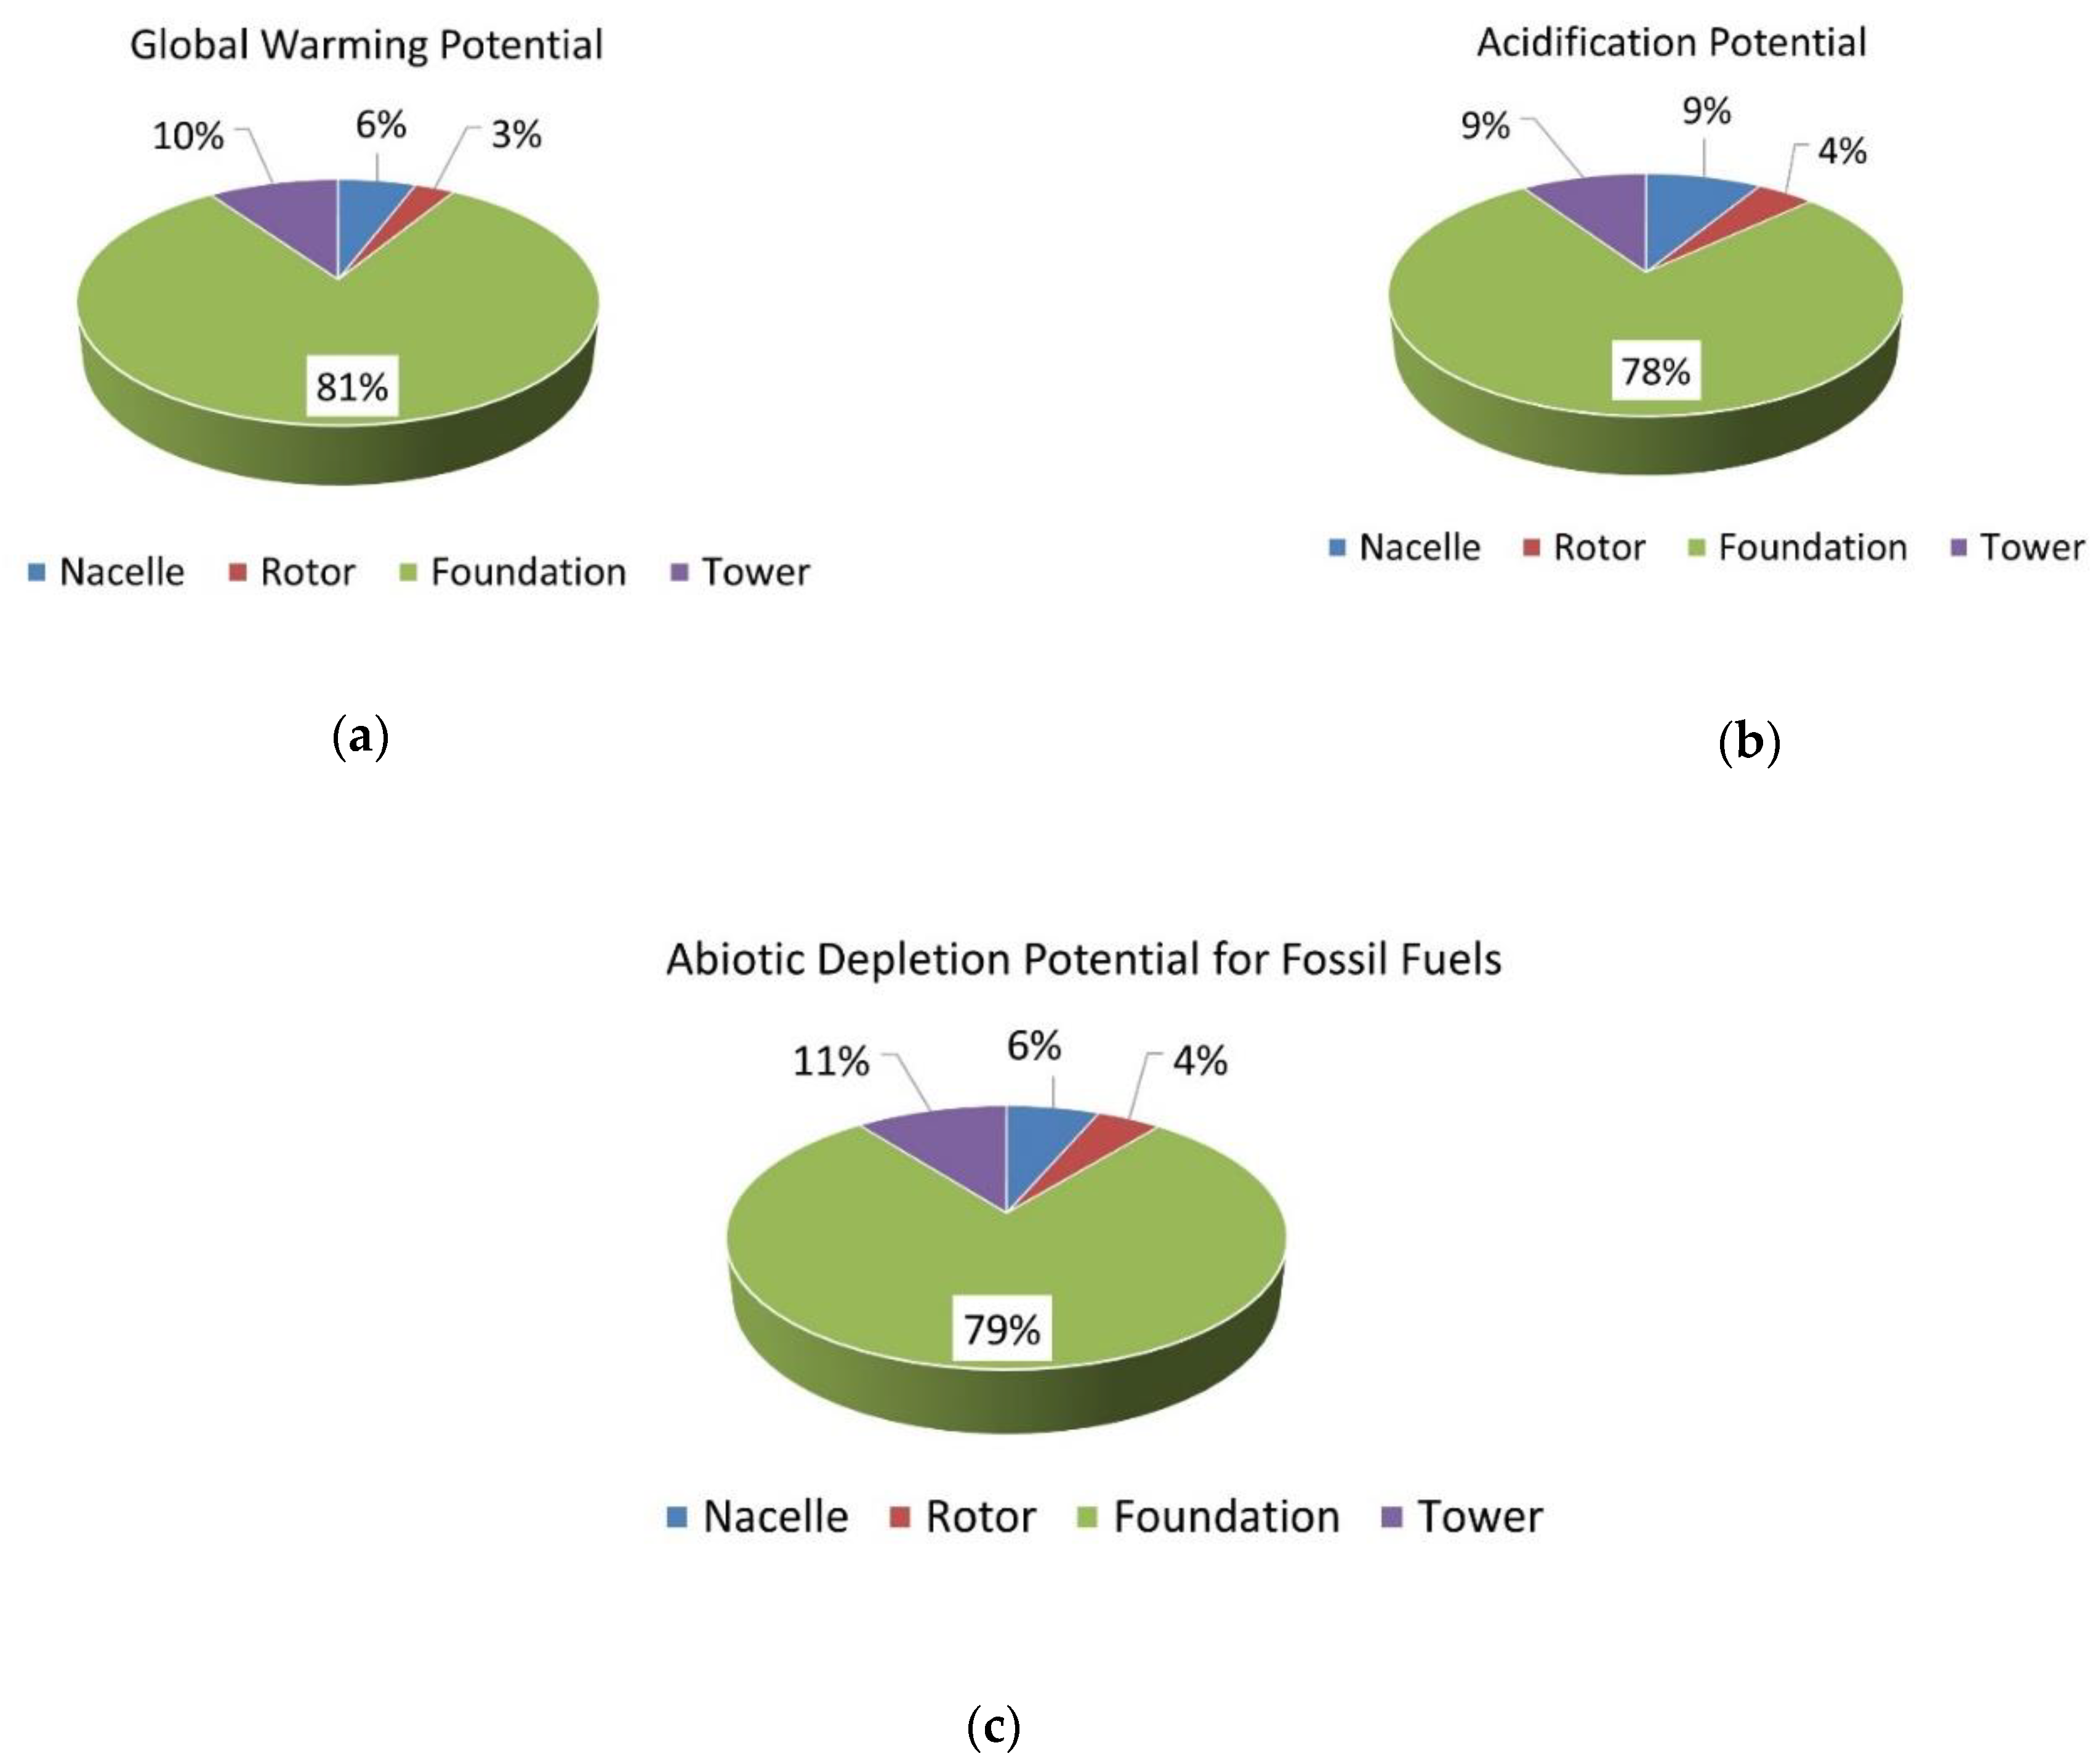
The global warming potential, AP, and ADPF of each component and life cycle stage are presented in Figure 5 and Figure 6. As can be observed in Figure 5, it can be seen that the foundation component has the largest percentage of all the components in measures of global warming potential, acidification potential, and abiotic depletion potential for fossil fuels. The foundation component constitutes 81% of the total equivalent GWP of the floating wind turbine. This could be related to the use of steel, concrete, nylon fibre and polyurethane, and the long usage of the crane and tugs. Likewise, the ADPF and acidification potential percentage of the foundation component is higher than the other 78% and 79%, components respectively. The second highest GWP and ADPF is the tower component, at 10% and 11%, respectively. The second highest AP is reported at 9% for both the tower and nacelle components. The main reason for this high value for the nacelle is using large amounts of iron and steel in its production/manufacture stage. On the other hand, the lowest value of GWP, AP and ADPF is obtained at nearly 4% for the rotor component.
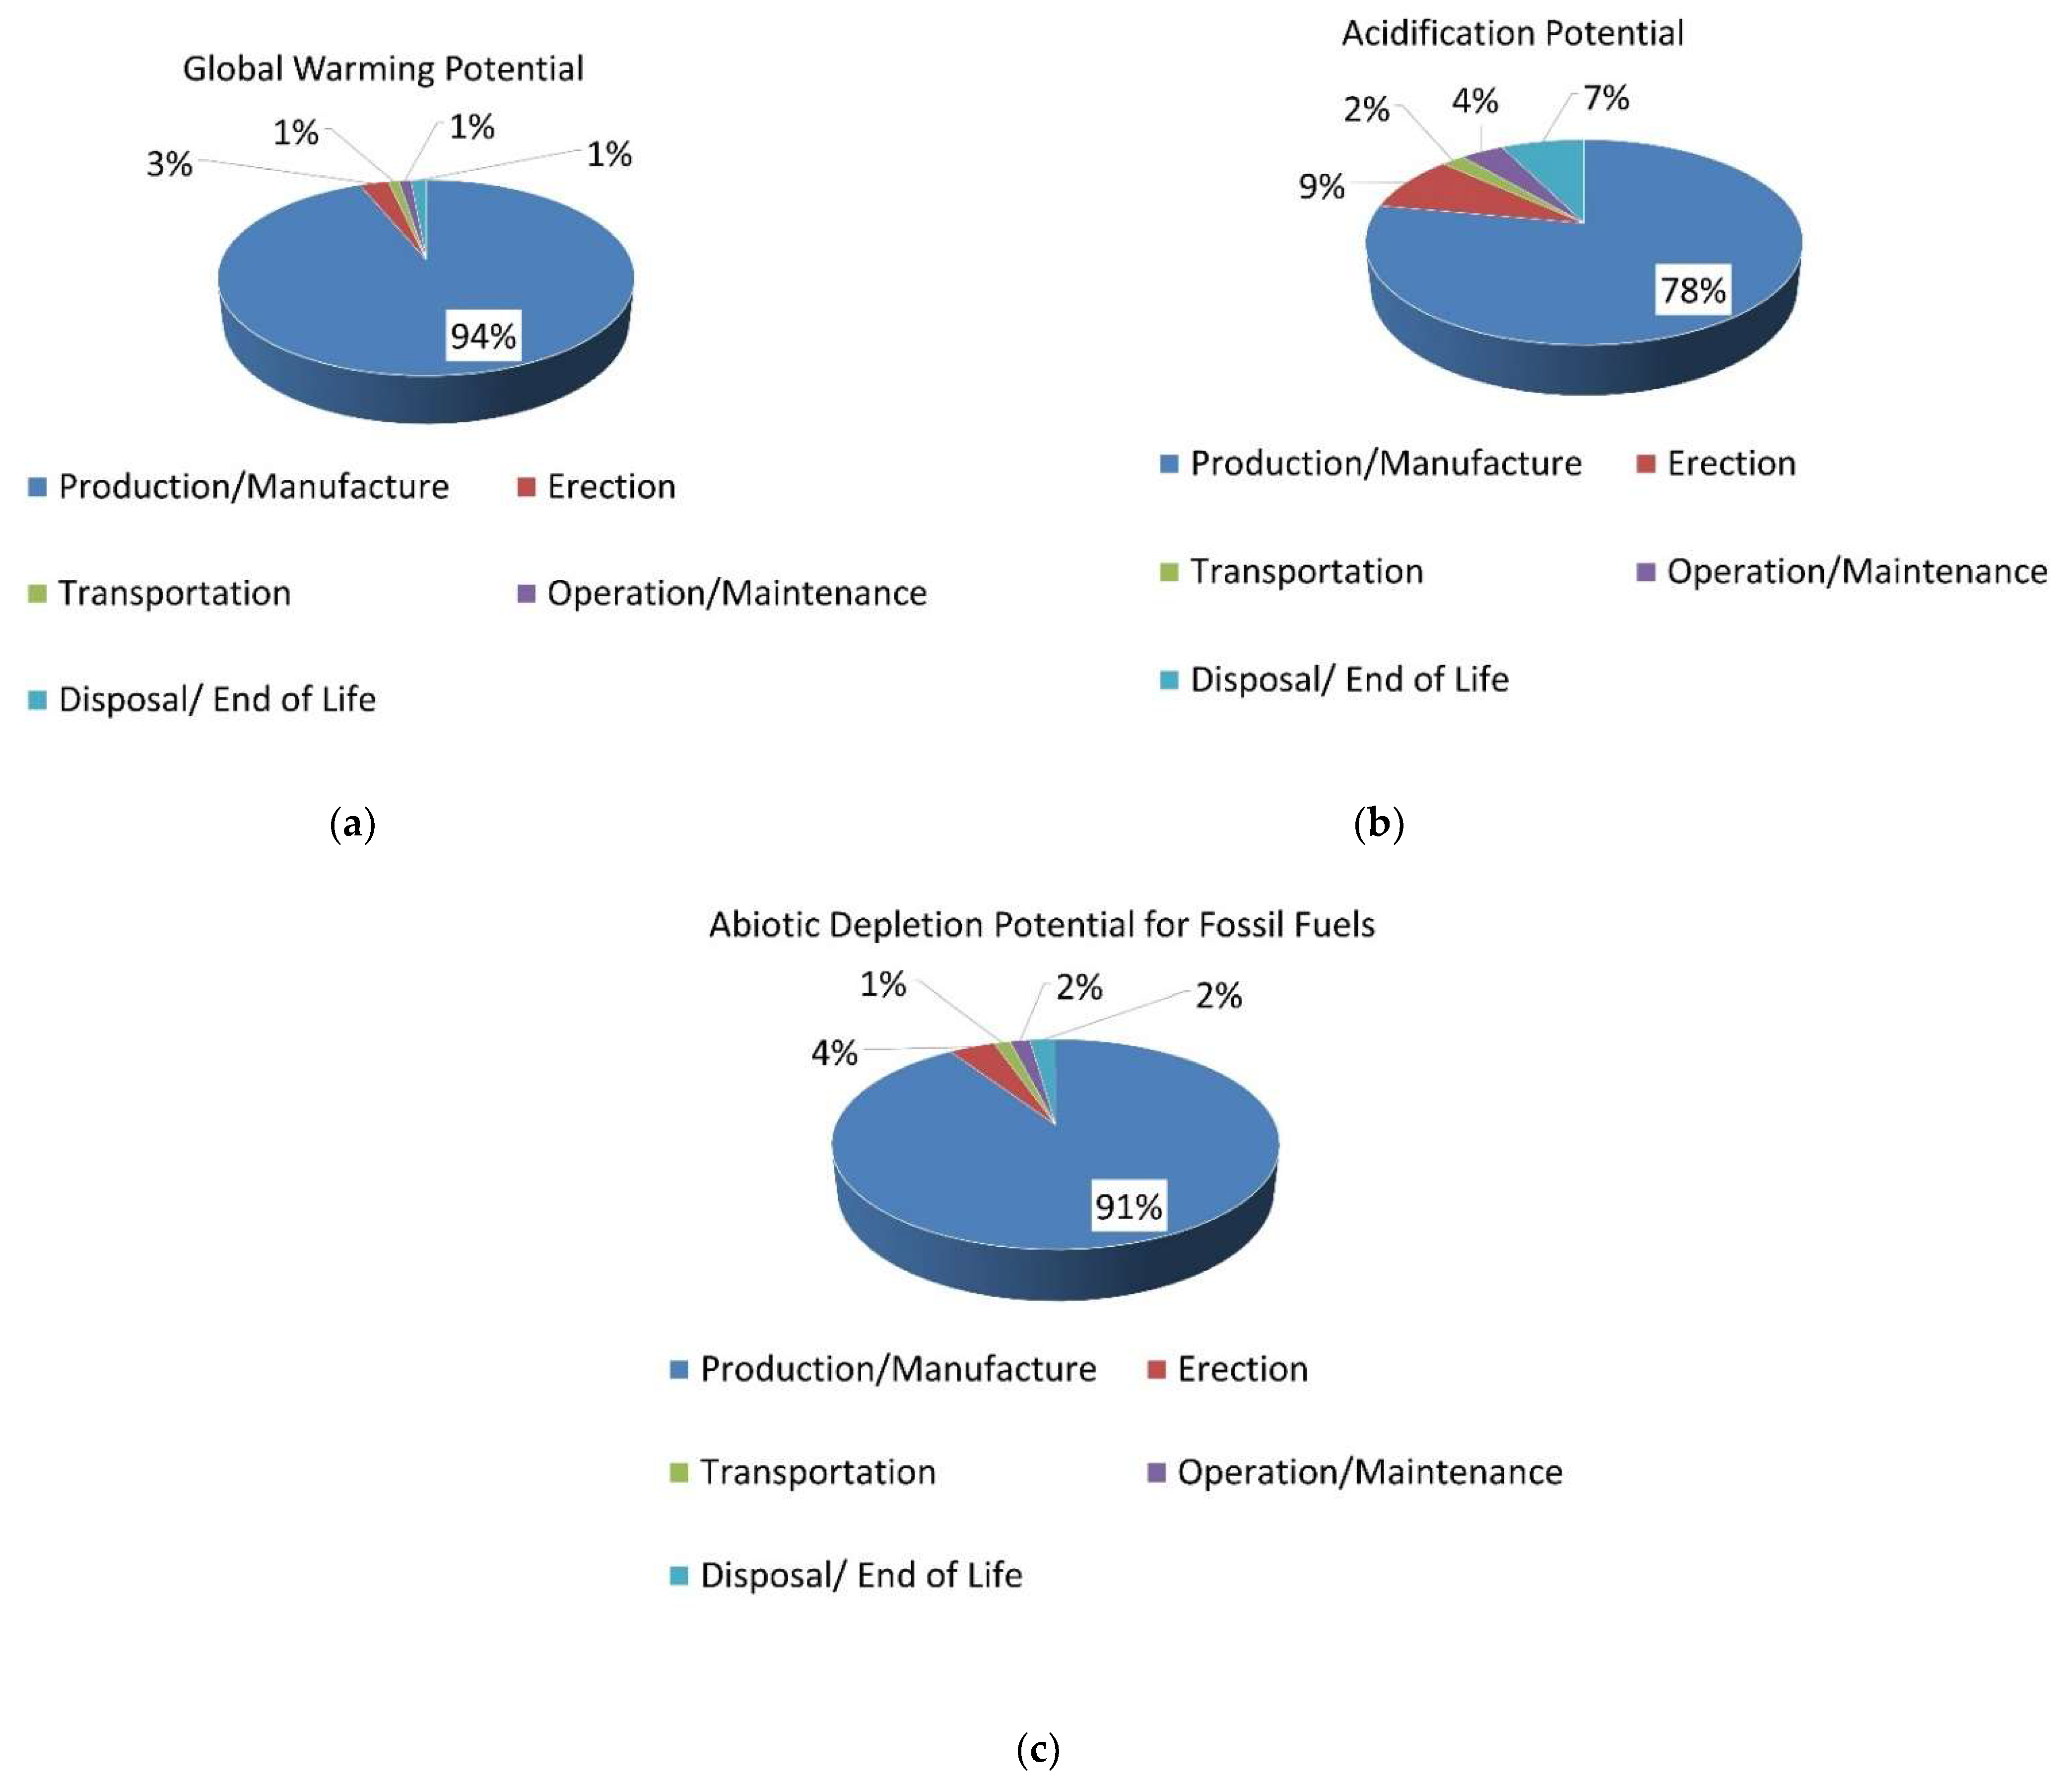
As far as the share among the life cycle stages is concerned, Figure 6 demonstrates that production/manufacture is the stage with the biggest contribution of global warming potential (CO2), acidification potential (SO2), and abiotic depletion potential for fossil fuels (MJ). GWP of the production/manufacture stage is 94%. As a matter of fact, in line with past studies [11,16,17,18,19,20,21,22,23,24,25], Table 1 and Table 2 show the largest GWP contribution comes from the production/manufacture stage in wind turbines. It can be decreased using alternative materials with the lowest CO2 emissions or reducing the amounts of concrete and steel for the production/manufacture stage. The lowest contribution to GWP, AP and ADPF are derived from the transportation stage. It can be clearly seen that the erection stage is much higher compared to that of other stages, considering the contribution to GWP, AP, and ADPF. Given that the erection stage entails consumption of fuel, long-time usage of the crane and tugs, the amounts of GWP, AP, and ADPF are expected to be higher than other stages in the erection stage. Regarding energy performance, the energy payback time, as defined in this section, has been calculated as 1.13 years. In the aforementioned studies, EPT values were reported between 1.6 and 2.7 years. As a matter of fact, EPT and energy performance of the wind energy have opposite correlations. Hence, it is expected that the smaller the EPT, the better the energy performance.
5.1. Comparison of the Barge-Type Floating Wind Turbine LCA Results with Those of Other Types of Wind Turbines
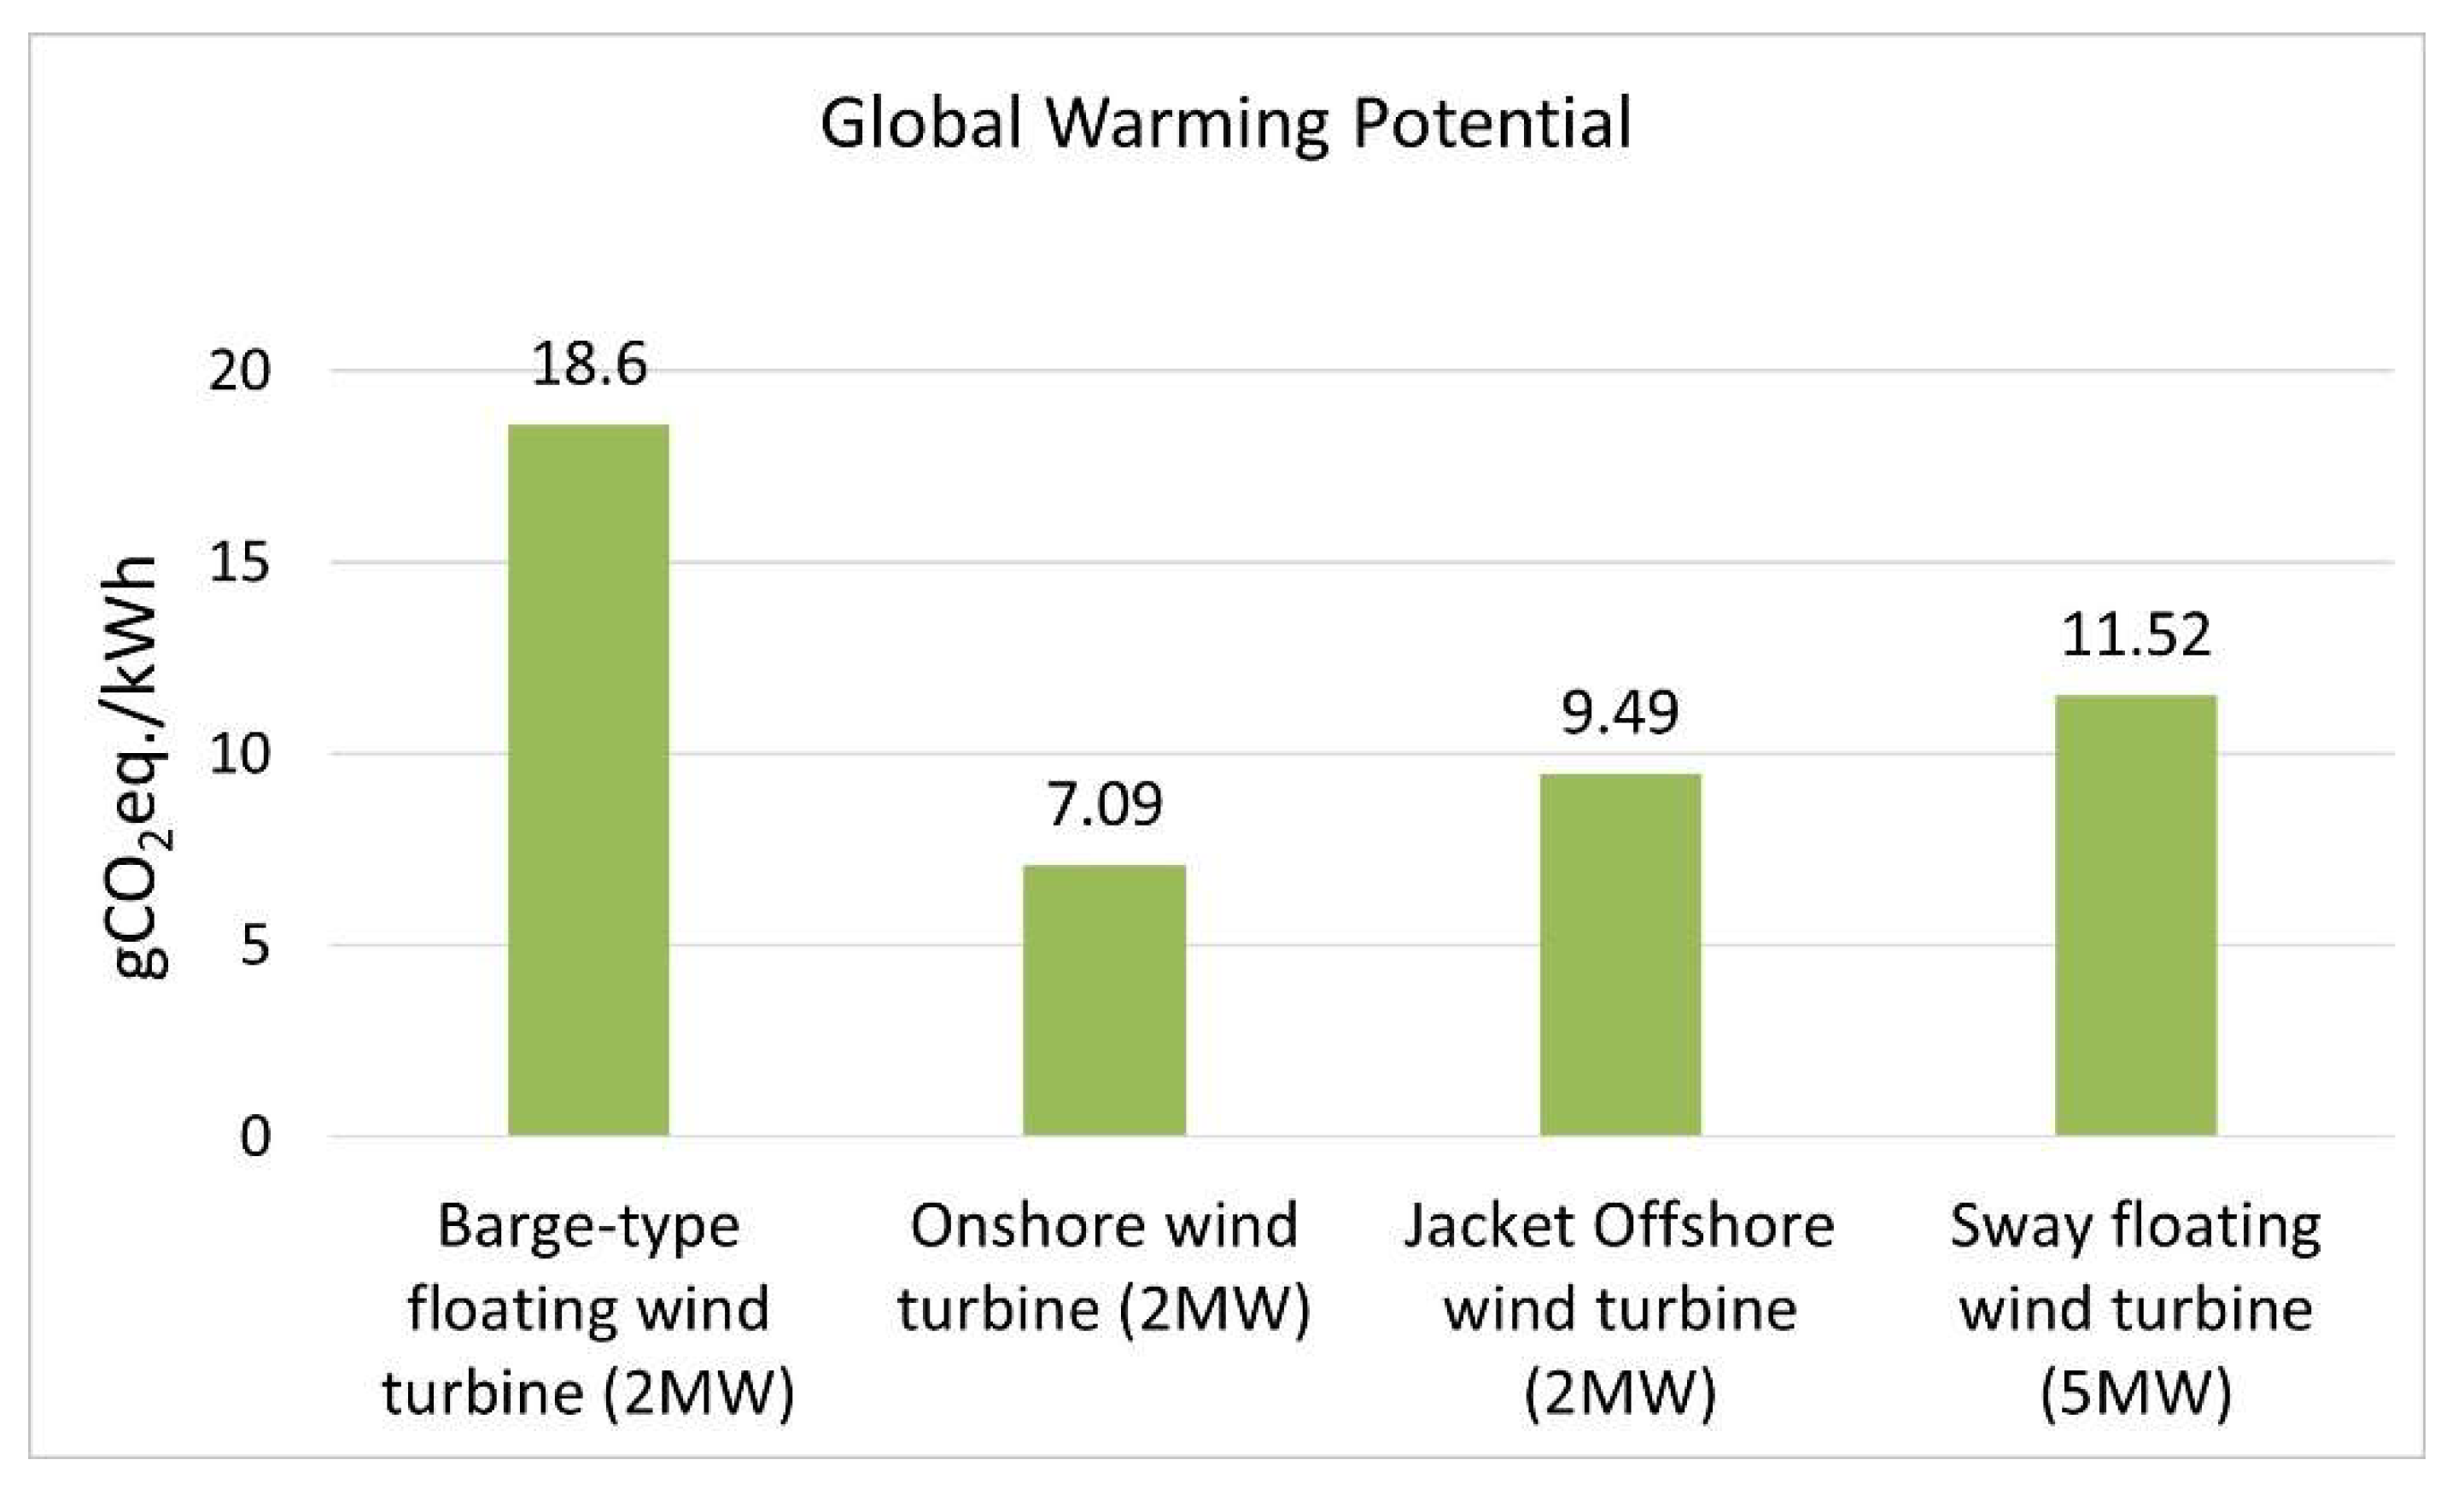
In this section, the results of the LCA of the barge-type floating wind turbine are compared with those from onshore (2MW-398 tonne), offshore (2MW-979 tonne) and floating (5MW-4225 tonne) wind turbines. The data for the LCAs for these wind turbines have been already published in [37,39]. The LCA of these turbines correspond to g/kWh of electricity produced. Abiotic depletion potential for fossil fuels (measured in MJ), GWP (gCO2eq./kWh), AP (gSO2eq./kWh) and the energy payback time (months) of all turbines have been included. Regarding the results of GWP shown in Figure 7, the largest GWP contribution is 18.6 gCO2 eq./kWh for the barge-type floating wind turbine, while the lowest contribution is from the 2MW onshore wind turbine (representing 7.09 gCO2eq./kWh). One of the most important factors is that the barge-type floating wind turbine platform is made using a high amount of concrete and steel. Therefore, the respective value was expected to be high. Furthermore, the installation of floating and offshore wind towers takes a longer time, and uses heavy cranes, hydraulic hammers, heavy-duty forklifts, pile drivers, vessels, and tugboats. The operation of this equipment consumes fossil fuel resources, having, as consequence of this consumption, high CO2 emissions to the atmosphere.
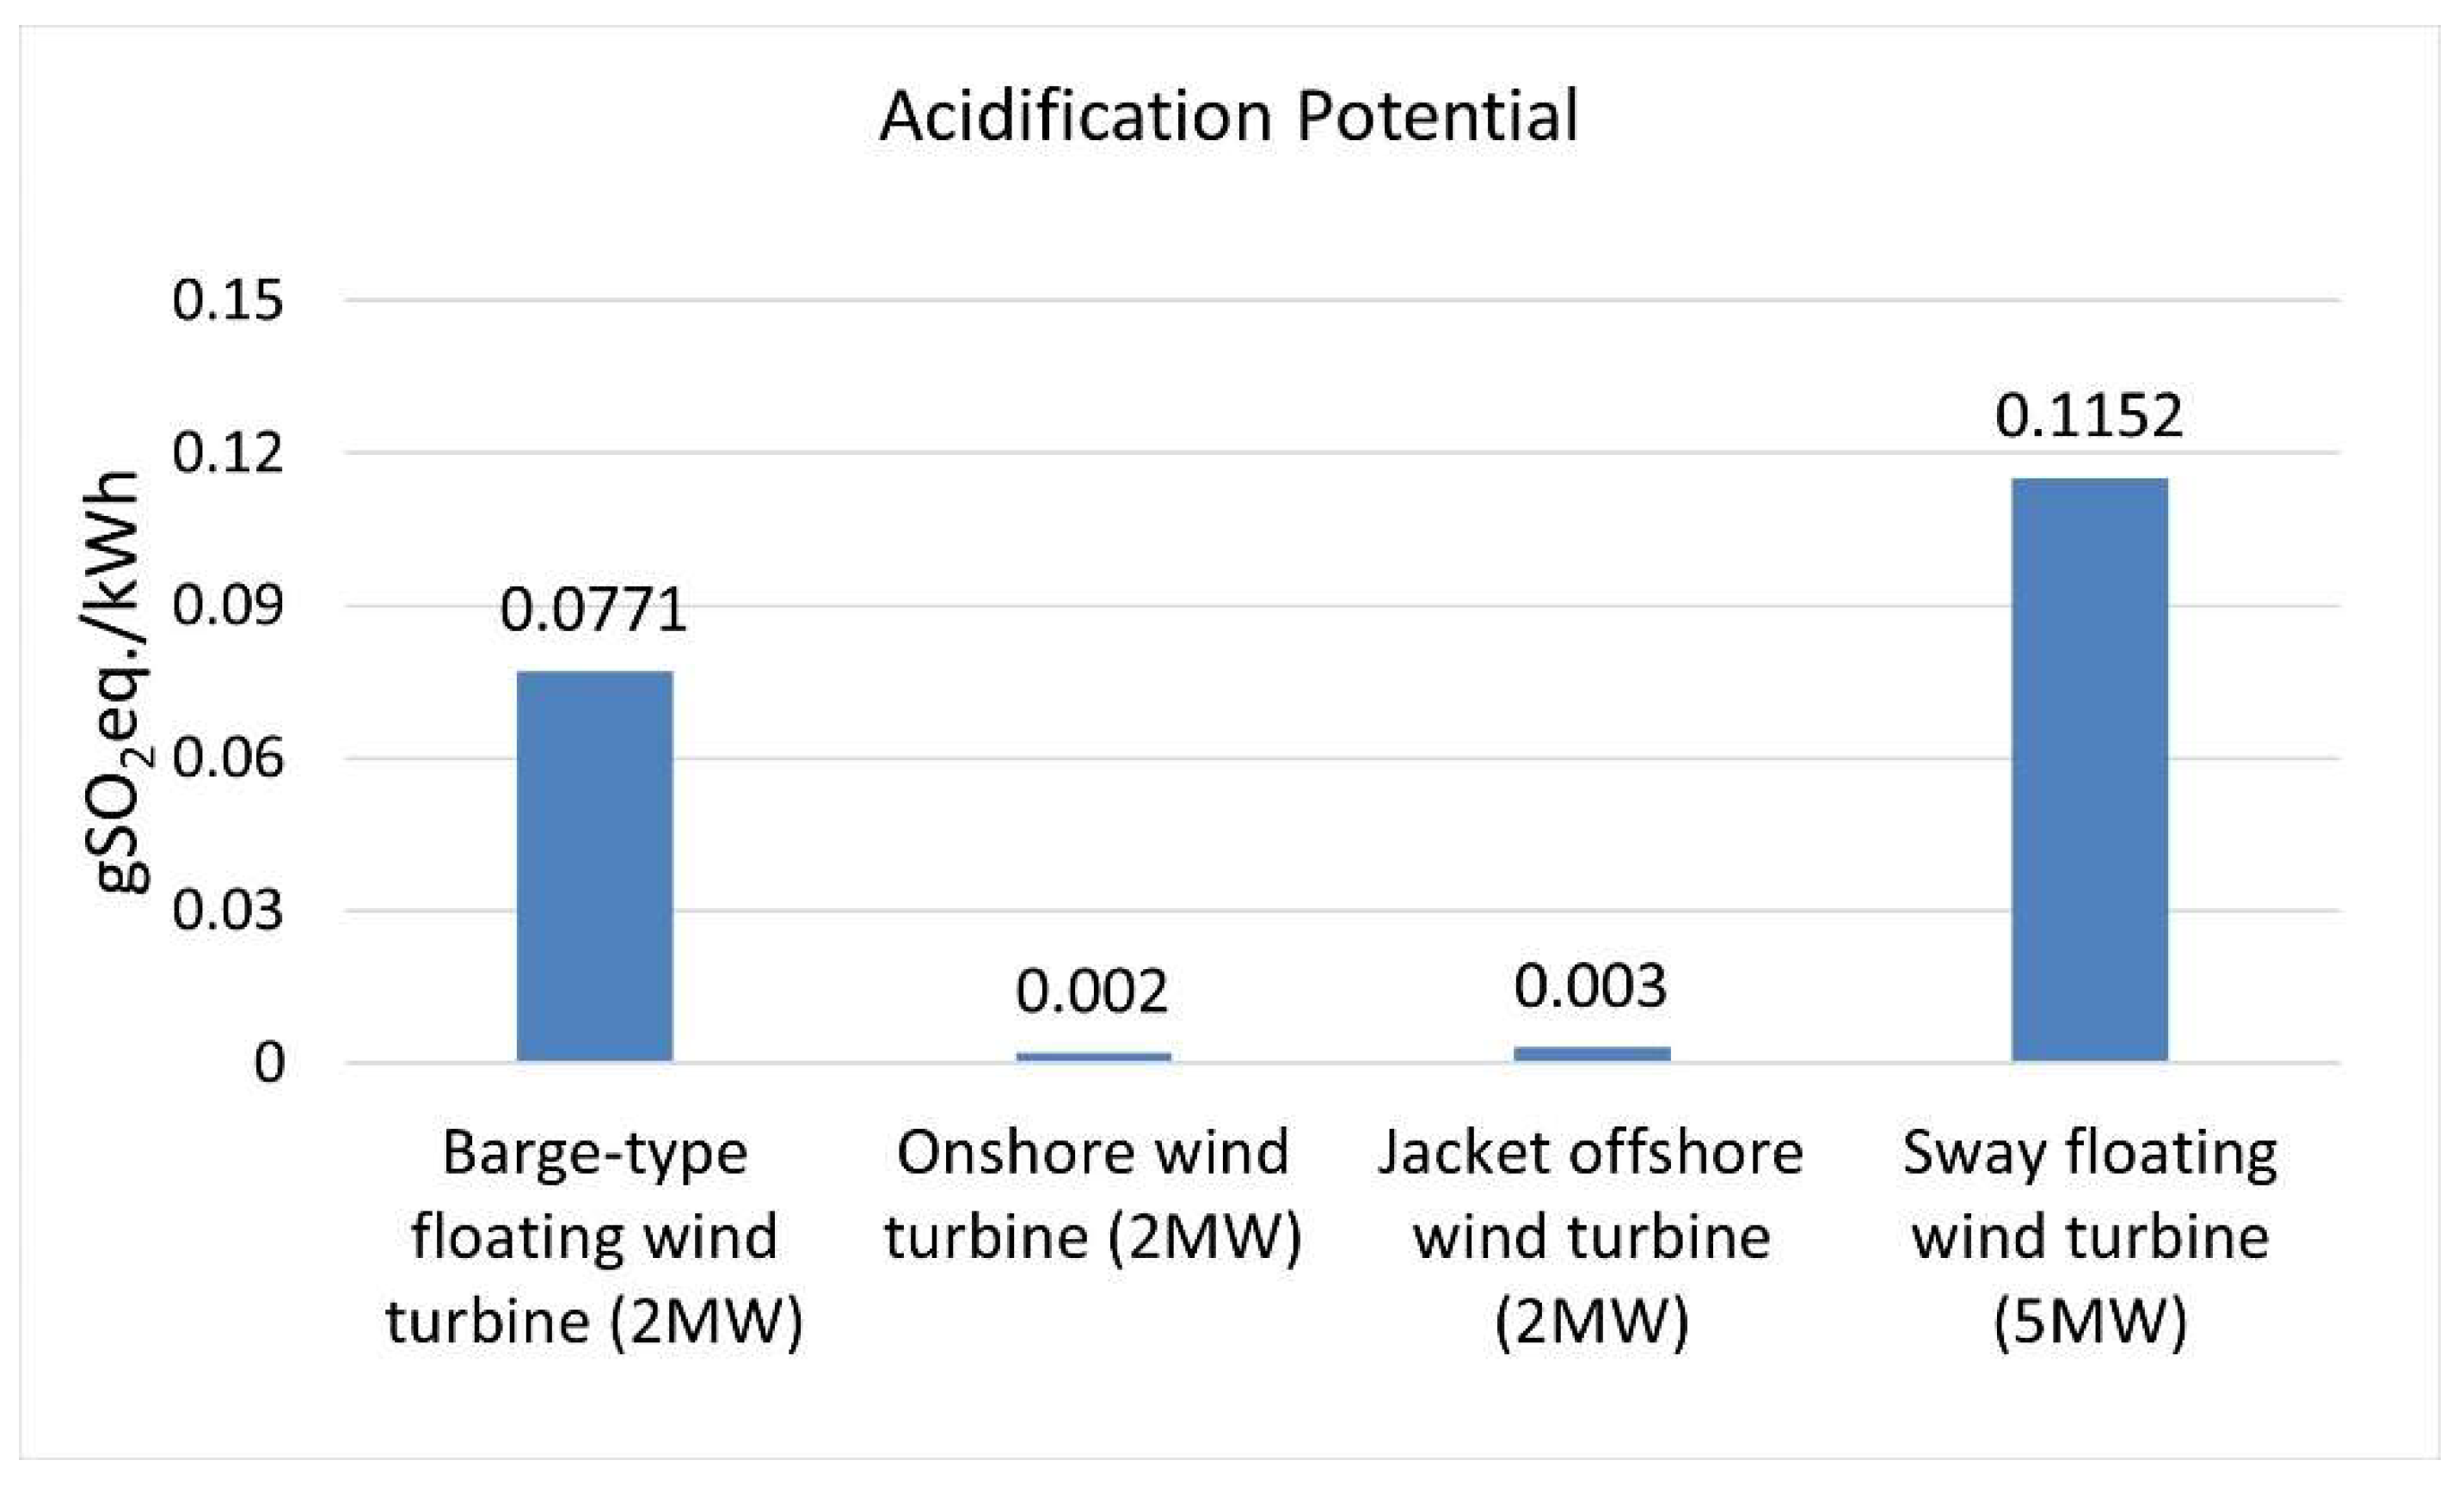
As can be observed in Figure 8, there are four comparable different types of wind turbines with regard to the AP contribution. Although the AP of the barge-type floating wind turbine is nearly 15 times larger than the onshore and jacket offshore wind turbine, the AP value of the floating wind turbine (5 MW) has a higher value than the barge-type floating wind turbine (representing 0.11 and 0.05 gCO2 eq./kWh, respectively). The reason for the high AP value is due to the usage of iron and steel in all components (nacelle, tower and foundation) and construction. These differences between the on-/offshore and floating wind turbines are due to the high usage of iron in the platform, the mooring system and the nacelle. Since the sway floating turbine (5 MW) is large-scale, it consists of a high amount of iron material in the nacelle part, so the amount of iron used causes the AP value to be increased.
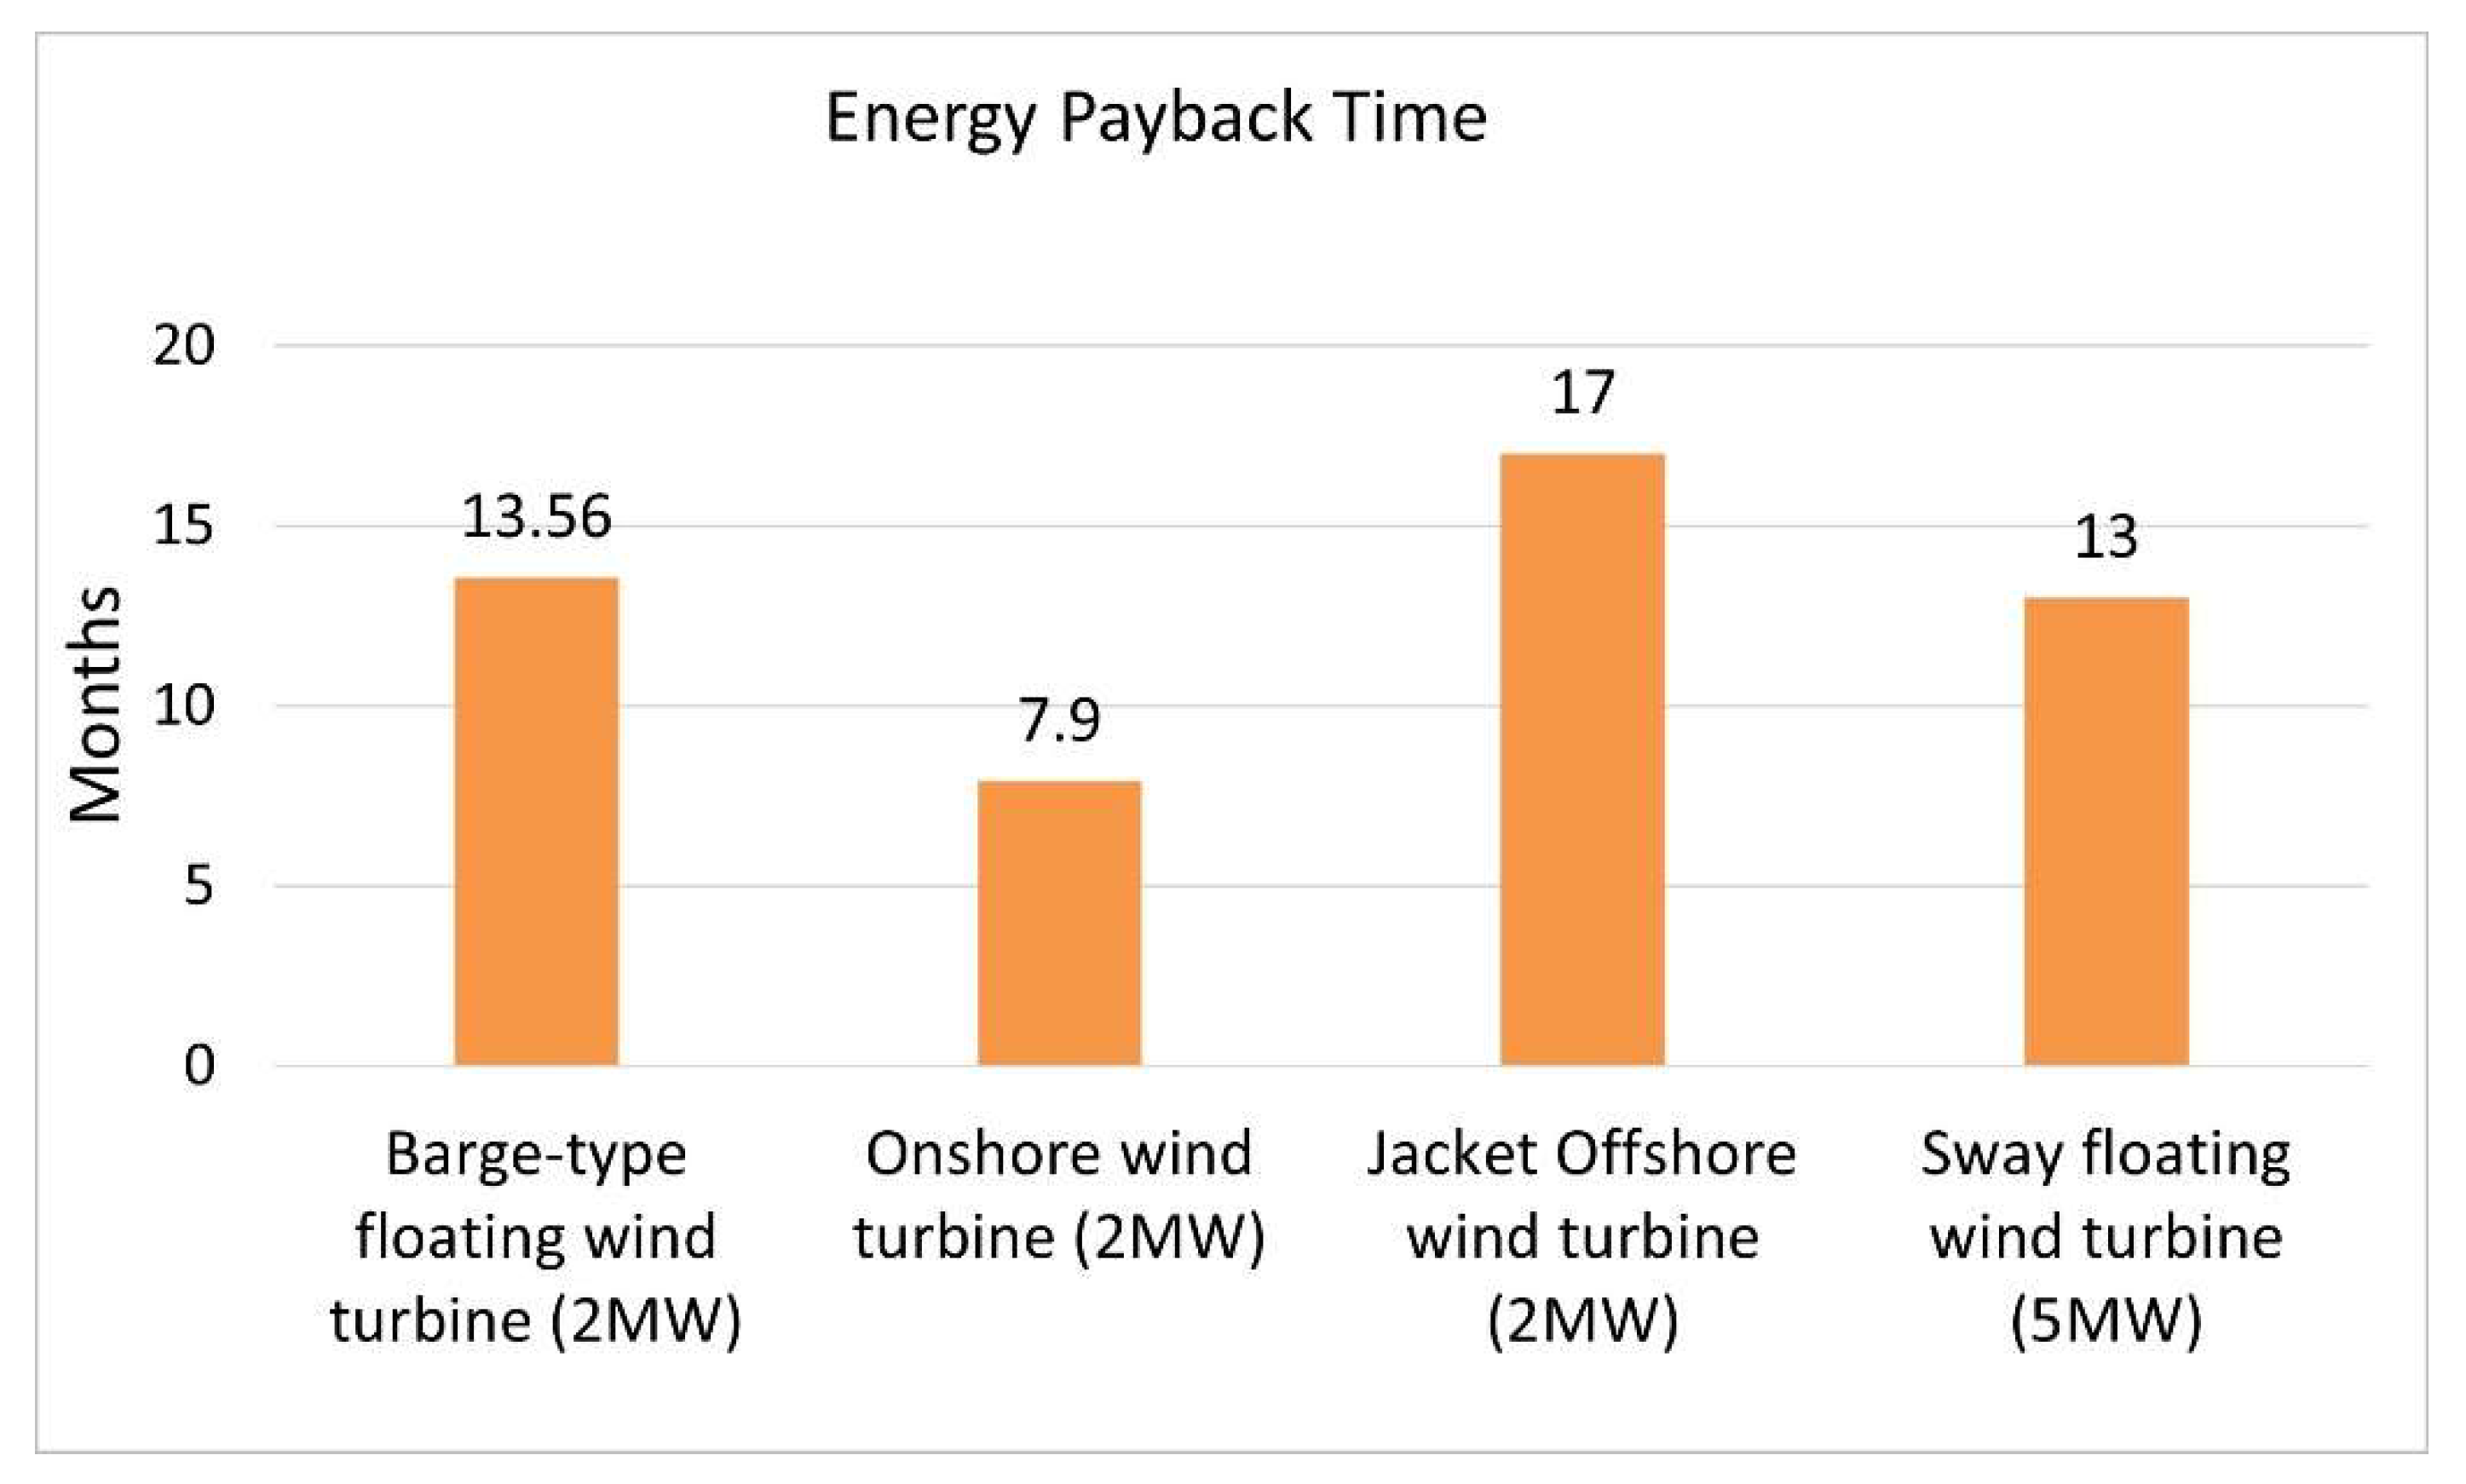
Energy payback time of the barge-type floating wind turbine is slightly higher, as shown in Figure 9. This value was expected because the total mass of the barge-type floating wind turbine, and the duration of the erection stage and the transportation stage, are larger than the others. It should be noted that although the barge-type floating wind turbine has a large mass and long erection time, the energy payback time and CO2 emissions of the floating wind turbine are not higher than the other ones (Figure 7 and Figure 9). The EPT of the onshore turbine is lower than the others. That is due to the turbine having less mass, a short erection time, and less fuel consumption.
5.2. LCA of the Barge-Type Wind Turbine Transportations Scenarios
In this section, the transportation stage of the barge-type floating wind turbine are analysed considering different scenarios, such as, truck, train and vessel. The three manufacture locations were Spain, The Netherlands and Belgium. Truck, vessel, train, and hybrid models have been considered as transportation stage scenarios. These scenarios were modelled to investigate their effect on environmental impacts. The hybrid model was analysed for the LCA of the barge-type floating wind turbine (see Section 5.1). In the truck, train, and vessel scenarios, all components of the barge-type floating wind turbine were transported by road, railway, and seaway, respectively. Moreover, Table 6 shows total distance of components transportation such as road, railway and sea distances. Concerning the results, the total CO2 emissions (tonnes) and CO2e (g/kWh) emissions for the whole the LCA of the barge-type floating wind turbine are shown in Table 7. As a result of these scenarios, the total distance of the train scenario was higher than other scenarios, while, regarding total CO2 and g CO2eq./kWh, the train scenario had lower values, 20.6 tonnes, and 0.172 g/kWh, respectively. Although the total transportation distance is the shortest by sea, it is the transportation mode with the highest carbon emissions and g CO2eq./kWh. This was analysed for the hybrid scenario in the LCA of the barge-type floating wind turbine. The main reason for this is that the parts such as blades, nacelle, and towers are large. Moreover, the seaway is preferred in order to transport these parts without any damage and to avoid jeopardizing other traffic.
6. Conclusions
Previous studies have focused on the LCA of sway, spar, TLB, semisubmersible, and TLP wind turbines excluding the barge-type floating one. In this paper, the life cycle assessment of the barge-type floating wind turbine was performed, and the LCA of the barge-type floating wind turbine was compared to the LCA of 2 MW, onshore, offshore and 5 MW sway-type floating wind turbines by considering global warming potential, acidification potential, and energy payback time. The LCA of the barge-type floating wind turbine illustrates that the manufacture stage has high GWP and AP. The principal reason for this is the use of a high quantity of steel, nylon fibre and concrete. The other LCA stages do not exceed 6% of the total value of GWP contribution.
CO2 emissions of all turbines varies from 7.09 to 22.3 g CO2 eq./kWh. The energy payback time varies from 7.9 to 20.3 months. The barge-type floating wind turbine has a higher CO2 and energy payback time when compared with other wind turbines, whilst the results of the onshore wind turbine show less CO2 and SO2 and low energy payback time. Regarding acidification potential, the highest contribution to SO2 emissions was calculated for the 5 MW floating wind turbine. This highest value is related to the use of cast iron for the mooring system of the floating wind turbine. Given these results, the 2 MW onshore wind turbine is the most environmentally friendly and has the best energy performance.
GWP and energy payback time can be decreased by using alternative materials, components and recycling materials. Specifically, it is recommended during the development of the manufacturing stage to decrease environmental impacts. In this study, GWP and energy payback time were found to be the highest in the barge-type floating wind turbine. Thus, further research is recommended on whether GWP and energy payback time can be decreased and annual energy yield can be increased. In light of the results of the present study, the following recommendations can be made:
- The energy capacity of the barge-type floating wind turbine should be increased. With this rise, the GWP emissions will reduce, and energy payback time will decrease while increasing the annual energy yield.
- The platform and the tower, which are the most energy-consuming parts of the structure, should be designed optimally to save materials. The platform of the barge-type floating wind turbine is made of concrete and steel. Hence, a type of concrete having less CO2 emissions or an advanced high-strength concrete (saving material) could be preferred.
- As floating wind turbines are located in deep water, a combination of a platform of the barge-type wind turbine that includes a wave energy system should be developed. This combination could decrease the equivalent CO2 emissions by increasing the annual energy yield as described in [24].
- The lifetime of the wind turbine could be extended, e.g., to 25 or 30 years. Thus, the environmental impact (CO2 and SO2) per kWh of electricity generated would diminish.
Author Contributions
Conceptualization, N.Y.; methodology, N.Y.; software, N.Y.; validation, N.Y.; formal analysis, N.Y.; investigation, N.Y.; resources, N.Y.; data curation, N.Y.; writing—original draft preparation, N.Y.; writing—review and editing, H.H. and C.B.; visualization, N.Y. All authors have read and agreed to the published version of the manuscript.
Funding
This research received no external funding.
Institutional Review Board Statement
Not applicable.
Informed Consent Statement
Not applicable.
Data Availability Statement
Data are included in the paper and no further data are stored anywhere.
Acknowledgments
The authors would like to acknowledge the Ministry of National Education of Turkey for the financial support of his research activity. Valuable discussions with Michaela Gkantou, Liverpool John Moores University are also acknowledged with thanks. The third author would also like to acknowledge with thank Alexander von Humboldt Stiftung’s continuous support to his research work.
Conflicts of Interest
The authors declare no conflict of interest.
References
- United Nations Sustainable Development. Take Action for the Sustainable Development Goals. 2021. Available online: https://www.un.org/sustainabledevelopment/energy/ (accessed on 1 March 2021).
- European Commission. Wind Energy. 2021. Available online: https://ec.europa.eu/commission/presscorner/detail/en/IP_20_2096 (accessed on 2 March 2021).
- Energy.gov. Advantages and Challenges of Wind Energy. 2021. Available online: https://www.energy.gov/eere/wind/advantages-and-challenges-wind-energy (accessed on 12 May 2021).
- Acciona.com. What Are the Benefits of Wind Power? ACCIONA|Business as Unusual. 2021. Available online: https://www.acciona.com/renewable-energy/wind-energy/?_adin=02021864894 (accessed on 6 March 2021).
- Thoubboron, K. Advantages and Disadvantages of Renewable Energy|Energy Sage Solar News. 2021. Available online: https://news.energysage.com/ (accessed on 11 June 2021).
- World Wind Energy Association. World Wind Capacity, World Wind Energy Association. 2021. Available online: https://wwindea.org/world-wind-capacity-at-650-gw/ (accessed on 20 January 2021).
- Wind Energy. Country. 2019. Available online: https://www.power-technology.com (accessed on 10 October 2019).
- Wind in Europe. European Statistical Data Support. 2019. Available online: https://windeurope.org/ (accessed on 25 October 2019).
- Wind Energy in Europe: Outlook to 2023. 2019. Available online: https://www.anev.org/wp-content/uploads/2019/10/Market-outlook-2019.pdf (accessed on 10 December 2019).
- EDF Renouvelables. Offshore Wind–EDF Renouvelables. 2020. Available online: https://www.edf-renouvelables.com/en/project-development/offshore-wind/ (accessed on 5 December 2020).
- Gkantou, M.; Rebelo, C.; Baniotopoulos, C. Life Cycle Assessment of Tall Onshore Hybrid Steel Wind Turbine Towers. Energies 2020, 13, 3950. [Google Scholar] [CrossRef]
- Martin, R. Floating Wind Turbines Could Provide Huge Amounts of Clean Power—If They Can Ever Compete on Cost MIT Technology Review. 2020. Available online: https://www.technologyreview.com/s/601481/floating-wind-farms-great-concept-implausible-economics/ (accessed on 17 September 2020).
- Pre-Sustainability. 2018. Available online: https://www.pre-sustainability.com/ (accessed on 18 March 2019).
- ISO. ISO 14040. Environmental Management-Life Cycle Assessment-Principles and Framework; International Organization for Standardization: Geneva, Switzerland, 2006. [Google Scholar]
- ISO. ISO 14044. Environmental Management-Life Cycle Assessment-Requirements and Guidelines; International Organization for Standardization: Geneva, Switzerland, 2006. [Google Scholar]
- Demir, N.; Taşkın, A. Life cycle assessment of wind turbines in Pınarbaşı-Kayseri. J. Clean. Prod. 2013, 54, 253–263. [Google Scholar] [CrossRef]
- Guezuraga, B.; Zauner, R.; Pölz, W. Life cycle assessment of two different 2 MW class wind turbines. Renew. Energy 2012, 37, 37–44. [Google Scholar] [CrossRef]
- Gervasio, H.; Rebelo, C.; Moura, A.; Veljkovic, M.; Simoesdasilva, L. Comparative life cycle assessment of tubular wind towers and foundations–Part 2: Life cycle analysis. Eng. Struct. 2014, 74, 292–299. [Google Scholar] [CrossRef]
- Stavridou, N.; Koltsakis, E.; Baniotopoulos, C.C. A comparative life-cycle analysis of tall onshore steel wind-turbine towers. Clean Energy 2019, 4, 48–57. [Google Scholar] [CrossRef]
- Alsaleh, A.; Sattler, M. Comprehensive life cycle assessment of large wind turbines in the US. Clean Technol. Environ. Policy 2019, 21, 887–903. [Google Scholar] [CrossRef]
- Lenzen, M.; Wachsmann, U. Wind turbines in Brazil and Germany: An example of geographical variability in life-cycle assessment. Appl. Energy 2004, 77, 119–130. [Google Scholar] [CrossRef]
- Kaldellis, J.; Apostolou, D. Life cycle energy and carbon footprint of offshore wind energy. Comparison with onshore counterpart. Renew. Energy 2017, 108, 72–84. [Google Scholar] [CrossRef]
- Huang, Y.-F.; Gan, X.-J.; Chiueh, P.-T. Life cycle assessment and net energy analysis of offshore wind power systems. Renew. Energy 2017, 102, 98–106. [Google Scholar] [CrossRef]
- Bhandari, R.; Kumar, B.; Mayer, F. Life cycle greenhouse gas emission from wind farms in reference to turbine sizes and capacity factors. J. Clean. Prod. 2020, 277, 123385. [Google Scholar] [CrossRef]
- Kasner, R.; Kruszelnicka, W.; Bałdowska-Witos, P.; Flizikowski, J.; Tomporowski, A. Sustainable Wind Power Plant Modernization. Energies 2020, 13, 1461. [Google Scholar] [CrossRef] [Green Version]
- Bonou, A.; Laurent, A.; Olsen, S.I. Life cycle assessment of onshore and offshore wind energy-from theory to application. Appl. Energy 2016, 180, 327–337. [Google Scholar] [CrossRef] [Green Version]
- Al-Behadili, S.; El-Osta, W. Life Cycle Assessment of Dernah (Libya) wind farm. Renew. Energy 2015, 83, 1227–1233. [Google Scholar] [CrossRef]
- Siddiqui, O.; Dincer, I. Comparative assessment of the environmental impacts of nuclear, wind and hydro-electric power plants in Ontario: A life cycle assessment. J. Clean. Prod. 2017, 164, 848–860. [Google Scholar] [CrossRef]
- Wang, Y.; Sun, T. Life cycle assessment of CO2 emissions from wind power plants: Methodology and case studies. Renew. Energy 2012, 43, 30–36. [Google Scholar] [CrossRef]
- Uddin, S.; Kumar, S. Energy, emissions and environmental impact analysis of wind turbine using life cycle assessment technique. J. Clean. Prod. 2014, 69, 153–164. [Google Scholar] [CrossRef]
- Oebels, K.B.; Pacca, S. Life cycle assessment of an onshore wind farm located at the northeastern coast of Brazil. Renew. Energy 2013, 53, 60–70. [Google Scholar] [CrossRef]
- Wagner, H.-J.; Baack, C.; Eickelkamp, T.; Epe, A.; Lohmann, J.; Troy, S. Life cycle assessment of the offshore wind farm alpha ventus. Energy 2011, 36, 2459–2464. [Google Scholar] [CrossRef]
- Vargas, A.; Zenón, E.; Oswald, U.; Islas, J.; Güereca, L.; Manzini, F. Life cycle assessment: A case study of two wind turbines used in Mexico. Appl. Therm. Eng. 2015, 75, 1210–1216. [Google Scholar] [CrossRef]
- Martínez-Cámara, E.; Sanz, F.; Pellegrini, S.; Jimenez, E.; Blanco, J. Life cycle assessment of a multi-megawatt wind turbine. Renew. Energy 2009, 34, 667–673. [Google Scholar] [CrossRef]
- Tremeac, B.; Meunier, F. Life cycle analysis of 4.5 MW and 250 W wind turbines. Renew. Sustain. Energy Rev. 2009, 13, 2104–2110. [Google Scholar] [CrossRef]
- Xu, L.; Pang, M.; Zhang, L.; Poganietz, W.-R.; Marathe, S.D. Life cycle assessment of onshore wind power systems in China. Resour. Conserv. Recycl. 2018, 132, 361–368. [Google Scholar] [CrossRef]
- Chipindula, J.; Botlaguduru, V.S.V.; Du, H.; Kommalapati, R.R.; Huque, Z. Life Cycle Environmental Impact of Onshore and Offshore Wind Farms in Texas. Sustainability 2018, 10, 2022. [Google Scholar] [CrossRef] [Green Version]
- Hywind Scotland Pilot Park. 2019. Available online: https://www.equinor.com/ (accessed on 15 May 2020).
- Weinzettel, J.; Reenaas, M.; Solli, C.; Hertwich, E.G. Life cycle assessment of a floating offshore wind turbine. Renew. Energy 2009, 34, 742–747. [Google Scholar] [CrossRef]
- Raadal, H.L.; Vold, B.I.; Myhr, A.; Nygaard, T.A. GHG emissions and energy performance of offshore wind power. Renew. Energy 2014, 66, 314–324. [Google Scholar] [CrossRef]
- Eligoz, N.; Bas, B. Life Cycle Assessment of a multi-use offshore platform: Combining wind and wave energy production. Ocean. Eng. 2017, 145, 430–443. [Google Scholar]
- Kausche, M.; Adam, F.; Dahlhaus, F.; Großmann, J. Floating offshore wind–Economic and ecological challenges of a TLP solution. Renew. Energy 2018, 126, 270–280. [Google Scholar] [CrossRef]
- The FLOATGEN Project Deliverable. 2019. Available online: https://floatgen.eu/en/node/30 (accessed on 5 June 2019).
- Floatgen-Design and Construction of the First Floating Wind Turbine in France. 2019. Available online: https://www.researchgate.net/publication/332014174_FLOATGEN-Design_and_construction_of_the_first_floating_wind_turbine_in_France (accessed on 4 December 2019).
- GEMIS. Global Emissions Model for Integrated Systems. 2021. Available online: http://iinas.org/news.html (accessed on 20 January 2020).
- Kang, J.; Wang, Z.; Soares, C.G. Condition-Based Maintenance for Offshore Wind Turbines Based on Support Vector Machine. Energies 2020, 13, 3518. [Google Scholar] [CrossRef]
- Properzi, S.; Herk-Hansen, H. Life cycle assessment of a 150 MW offshore wind turbine farm at Nysted/Roedsand, Denmark. Int. J. Environ. Sustain. Dev. 2002, 1, 113. [Google Scholar] [CrossRef]
- Haapala, K.R.; Prempreeda, P. Comparative life cycle assessment of 2.0 MW wind turbines. Int. J. Sustain. Manuf. 2014, 3, 170. [Google Scholar] [CrossRef]
Figure 1.
Life cycle assessment stages of a wind energy system.

Figure 2.
A barge-type platform.

Figure 3.
Top (a) and side (b) view of the barge-type platform.

Figure 4.
Sea installation stage of the barge-type floating wind turbine. 1 ASD TUG 60T: azimuthing stern-drive tug is a kind of tug that performs towing over the bow, and its weight is 60 tonnes.
Figure 4.
Sea installation stage of the barge-type floating wind turbine. 1 ASD TUG 60T: azimuthing stern-drive tug is a kind of tug that performs towing over the bow, and its weight is 60 tonnes.

Figure 5.
Contribution of the parts of the floating wind turbine to GWP (a), AP (b) and ADPF (c).

Figure 6.
Contribution of each life cycle stage of the floating wind turbine to GWP (a), AP (b) and ADPF (c).
Figure 6.
Contribution of each life cycle stage of the floating wind turbine to GWP (a), AP (b) and ADPF (c).

Figure 7.
Total global warming potential for floating, onshore, and offshore wind turbine.

Figure 8.
Total acidification potential for floating, onshore, and offshore wind turbine.

Figure 9.
Energy payback time for floating, onshore, and offshore wind turbines.


Table 1.
Past studies of LCA of onshore and offshore wind turbine towers.
| Authors | Tower Type | Height (m) | Size (MW) | Location | Contributions |
|---|---|---|---|---|---|
| Bonou et al. [26] | Onshore and offshore | 99.5–92.5 onshore 68.25–87.72 offshore | 2.3–3.2 onshore 4.0–6.0 offshore | Europe | The GHG emissions of offshore wind turbine are higher due to more materials and resources (fuel, oil, etc.) for erection and maintenance. |
| Al-Behadili and El-Osta [27] | Onshore | 71 | 1.65 | Libya | Using recycled wind turbine materials gains a reduction of CO2 emissions by 55%. |
| Siddiqui and Dincer [28] | - | - | 2.0 | Canada | Wind energy has a large environmental impact compared nuclear and hydropower due to its manufacturing stage. |
| Wang and Sun [29] | Onshore and offshore | 1.6 and 3.0 | China | Using the short route would decrease the CO2 emissions of the transportation stage. | |
| Uddin and Kumar [30] | Vertical and horizontal axis | 0.3 and 0.5 | Thailand | Reuse of materials could reduce environmental impacts by about 15%. | |
| Oebels and Pacca [31] | Onshore | 2.0 and 3.0 | Brazil | Steel materials comprise more than 50% of the total CO2 emissions. | |
| Wagner et al. [32] | Offshore | - | 5.0 | German | The foundation and submarine cables cause an increase in total CO2 emissions. |
| Vargas et al. [33] | - | - | 2.0 | Mexico | The largest energy requirement and environmental impacts come from the nacelle and tower. |
| Martinez et al. [34] | Onshore | 70 | 2.0 | Spain | The largest environmental impacts and energy requirement come from the foundation and nacelle, respectively. |
| Tremeac and Meunier [35] | Onshore | 124 | 4.5 and 0.25 | France | Minimizing the transportation stage, such as short routes and vehicles emitting lower CO2, can be achieved. |
| Xu et al. [36] | Onshore | 65, 50 | 1.5 and 0.75 | China | Taller wind turbines can improve environmental impact indicators. |
| Chipindula et al. [37] | Onshore and offshore | - | 1.0, 2.0, 2.3 and 5.0 | Texas | There is an inverse correlation between EPT and the turbine size. If the size increases, EPT decreases. |
Table 2.
Literature on LCA of floating wind turbine towers.
| Researchers | Year | Hub-Height (m) | Wind Turbine Size (MW) | Water Depth (m) | General Description |
|---|---|---|---|---|---|
| Weinzettel et al. [39] | 2009 | 200 | 5 | 100–300 | Sway floating wind turbine (5 MW) and an offshore wind turbine (2 MW) were examined considering LCA and energy payback time. |
| Raadal et al. [40] | 2014 | 90 | 5 | 100 | UMaine spar, MIT TLB (tension-leg-buoy), sway (tension-leg-spar), UMaine semisubmersible, UMaine TLP (tension-leg-platform) and OC4 jacket turbines were investigated considering their LCAs. |
| Eligoz and Bas [41] | 2017 | 90 | 5 | - | The LCAs of semisubmersible and spar platform floating wind turbines were analysed and compared. |
| Kausche et al. [42] | 2018 | - | 6 | 40–200 | Different material combinations of floating wind tower (tension-leg-platform) were investigated. These combinations were steel, steel-concrete, and steel-reinforced concrete. |
| Components | Unit | Value |
|---|---|---|
| Rotor | tonne | 28.5 |
| Nacelle | tonne | 64 |
| Tower | tonne | 183 |
| Platform | tonne | 5472.5 |
| Component | Stage | Comment | Unit |
|---|---|---|---|
| TOWER | Manufacture | Steel | 133 t |
| TOWER | Manufacture | Steel (Transition part) | 50 t |
| ROTOR | Manufacture | Glass Fibre | 23.5 t |
| ROTOR | Manufacture | Cast Iron | 5 t |
| NACELLE | Manufacture | Steel | 35 t |
| NACELLE | Manufacture | Aluminium | 2 t |
| NACELLE | Manufacture | Copper | 7 t |
| NACELLE | Manufacture | Glass-Reinforced Plastic | 4 t |
| NACELLE | Manufacture | Cast Iron | 16 t |
| PLATFORM | Manufacture | Concrete | 4350 t |
| PLATFORM | Manufacture | Steel | 912.5 t |
| PLATFORM | Manufacture | Cast Iron | 60 t |
| PLATFORM | Manufacture | Nylon Fibre | 126 t |
| PLATFORM | Manufacture | Polyurethane | 24 t |
| TOWER-RNA 2 | Transport | Vessel | 165,300 tkm |
| TOWER-RNA | Transport | Truck | 13,775 tkm |
| PLATFORM | Transport | Truck | 87,000 tkm |
| PLATFORM | Transport | Truck | 16,560 tkm |
| PLATFORM | Transport | Truck | 77,450 tkm |
| PLATFORM | Transport | Truck | 94,500 tkm |
| PLATFORM | Transport | Truck | 2400 tkm |
| PLATFORM | Transport | Truck | 6000 tkm |
| TOWER | Erection | Crane | 7.92 h |
| ROTOR | Erection | Crane | 10.56 h |
| NACELLA | Erection | Crane | 10.56 h |
| PLATFORM | Erection | Crane and Tugboat | 105.56 h |
| TOWER | Disposal & End of Life | Landfill | 27.45 t |
| ROTOR | Disposal & End of Life | Landfill | 24.25 t |
| NACELLE | Disposal & End of Life | Landfill | 12.55 t |
| PLATFORM | Disposal & End of Life | Landfill | 4500.675 t |
| TOWER | Disposal & End of Life | Transport to | 549 tkm |
| ROTOR | Disposal & End of Life | Transport to | 485 tkm |
| NACELLE | Disposal & End of Life | Transport to | 251 tkm |
| FOUNDATION | Disposal & End of Life | Transport to | 900,013.5 tkm |
2 RNA: rotor-nacelle assembly.
Table 5.
Summary of results.
| LCA Results | Unit | Value |
|---|---|---|
| Abiotic depletion potential for fossil fuels (ADPF) | MJ | 18,429,264 |
| Acidification potential (AP) | kg SO2 eq. | 5945 |
| Global warming potential (GWP) | kg CO2 eq. | 2,187,947 |
| Energy payback time (EPT) | years | 1.13 |
Table 6.
Transportation distance.
| Scenario | Road Distance (km) | Railway Distance (km) | Seaway Distance (km) |
|---|---|---|---|
| Truck | 2720 | - | - |
| Train | 670 | 2270 | - |
| Vessel | 570 | - | 2022 |
| Hybrid | 2190 | - | 600 |
Table 7.
Results for different transportation scenarios.
| Units | Hybrid Scenario | Truck Scenario | Train Scenario | Vessel Scenario | |
|---|---|---|---|---|---|
| Total CO2 | tonnes | 21.3 | 22.6 | 20.6 | 25.9 |
| CO2 | g.eq./kWh | 0.178 | 0.188 | 0.172 | 0.216 |
Publisher’s Note: MDPI stays neutral with regard to jurisdictional claims in published maps and institutional affiliations. |
© 2021 by the authors. Licensee MDPI, Basel, Switzerland. This article is an open access article distributed under the terms and conditions of the Creative Commons Attribution (CC BY) license (https://creativecommons.org/licenses/by/4.0/).
Share and Cite
MDPI and ACS Style
Yildiz, N.; Hemida, H.; Baniotopoulos, C. Life Cycle Assessment of a Barge-Type Floating Wind Turbine and Comparison with Other Types of Wind Turbines. Energies 2021, 14, 5656. https://0-doi-org.brum.beds.ac.uk/10.3390/en14185656
AMA Style
Yildiz N, Hemida H, Baniotopoulos C. Life Cycle Assessment of a Barge-Type Floating Wind Turbine and Comparison with Other Types of Wind Turbines. Energies. 2021; 14(18):5656. https://0-doi-org.brum.beds.ac.uk/10.3390/en14185656
Chicago/Turabian StyleYildiz, Nurullah, Hassan Hemida, and Charalampos Baniotopoulos. 2021. "Life Cycle Assessment of a Barge-Type Floating Wind Turbine and Comparison with Other Types of Wind Turbines" Energies 14, no. 18: 5656. https://0-doi-org.brum.beds.ac.uk/10.3390/en14185656
Note that from the first issue of 2016, this journal uses article numbers instead of page numbers. See further details here.