Article

Thermal Draft Load Coefficient for Heating Load Differences Caused by Stack-Driven Infiltration by Floor in Multifamily High-Rise Buildings

1
Division of Architecture and Urban Design, Incheon National University, Incheon 22012, Korea
2
Institute of Urban Science, Incheon National University, Incheon 22012, Korea
3
College of Architecture, Konkuk University, Seoul 05029, Korea
*
Authors to whom correspondence should be addressed.
Submission received: 6 January 2022 / Revised: 3 February 2022 / Accepted: 11 February 2022 / Published: 14 February 2022

Abstract

:
The stack effect is dominant in multifamily high-rise buildings (MFHRBs) in winter because of the considerable height of MFHRBs, which causes a difference in the infiltration amount between floors. This difference causes a heating load difference between floors in a MFHRB. However, there are no indicators to quantify the heating load differences in previous studies. In this article, an indicator—the thermal draft load coefficient (TDLC)—is proposed that can be used to estimate and evaluate the differences between floors in a MFHRB. The TDLC is built on a theoretical model of the stack effect and leakage area of the airflow paths, considering the entire building airflow in a MFHRB. The theoretical model was validated by comparison with a simulation model. The winter average coefficient of variation of the root mean square error and the normalized mean bias error of the theoretical model were acceptable (17.1% and 9.3%, respectively). The TDLC resulted in a maximum of 2.5 and a minimum of approximately 0.1 in the target MFHRB. The TDLC can pre-evaluate the load difference in the building design stage and can be utilized to build design standards or guidelines.

1. Introduction

1.1. Background

Airflows in high-rise buildings affect indoor environments, air quality, and cooling and heating energy consumption [1]. There is a strong airflow through the doors [2], sometimes preventing elevator and front doors from opening and closing [3]. The airflow results in unpleasant noises [4], the diffusion of smoke [5], odors [6], pollutants [7], and viruses [8], and an increase in heating loads [9] on some floors. For example, Andargie et al. [1] emphasized the effects of airflow on indoor environments and thermal comfort in multifamily high-rise buildings (MFHRBs). According to the actual resident complaints analyzed in [4], the stack-driven airflow noise accounted for 80 cases (57.1%) in the total of 140 cases, which is the most frequent complaint followed by excessive draft at doors (31.4%). Therefore, airflow is a major factor in the MFHRBs.
The driving forces of the airflow in a MFHRB are (1) wind and (2) stack effect resulting from the temperature difference between the indoor and outdoor environments, as shown in Figure 1. The outdoor wind causes infiltration through the household envelope. The stack effect causes infiltration through the household envelope below the neutral pressure level (NPL), where the pressure difference between the indoor and outdoor is zero. However, in households above the NPL, interzonal airflow occurs through household entrance doors. Thus, the unintended air infiltration into dwelling units can be divided into two types under the two driving forces: (1) infiltration through the household envelope and (2) interzonal airflow through the household entrance.
More specifically, in the airflow in MFHRBs, the dwelling infiltration rates including the two types vary depending on the household and/or floor. Winds that increase in speed with height cause a difference in the infiltration rate for each floor. The effect of wind is divided into windward and leeward according to the wind direction, causing a difference in the amount of infiltration by household. The stack-driven infiltration rate increases as the floor level decreases below the NPL, and the interzonal airflow rate increases as the floor increases above the NPL. Therefore, each household in a MFHRB has different airflow rates for outdoor infiltration and interzonal air. Such characteristics should be investigated as they can lead to differences in indoor environments, air quality, and cooling and heating loads between floors as shown in Figure 1; for example, the color scale filled in the households conceptualizes the level of heating loads caused by airflow by floor in Figure 1. In particular, residents would complain about household energy consumption differences if the phenomenon were present in their building.

1.2. Literature Review

1.2.1. Infiltration Responsibility for Heating Load in Buildings

In MFHRBs, a strong airflow caused by the wind and stack effect increases the heating load. Thus, the effect of infiltration on energy use in MFHRBs has been studied. The infiltration is responsible for 10.27% of the total winter heating load in a Korean MFHRB [9] and 10.5–27.4% of winter energy demand in 13 Spanish MFHRBs [10]. Emmerich et al. [11] estimated that infiltration in U.S. office buildings accounted for 33% of the heating energy. Jones et al. [12] predicted that infiltration is responsible for 11–15% of U.K. housing stock energy demand, 3–5% of total U.K. energy demand, and 10–14% of U.K. housing stock carbon emissions. Moreover, in recent years, because the insulation performance of walls has significantly improved in low-energy buildings, the proportion of the infiltration load to the total heating load has been increasing. Persily et al. [13] identified an increase in the heating load of infiltration from 13% to 25% owing to the improved insulation in U.S. office buildings. Thus, the infiltration load can account for a substantial proportion of the heating demand in MFHRBs.

1.2.2. Dwelling Infiltration Differences in MFHRBs

Different dwelling infiltration rates in MFHRBs have been reported based on the field measurements in the studies. Shi et al. [14] measured the dwelling infiltration rate using a tracer gas decay method in 34 households in 34 buildings in Beijing. The dwelling infiltration rate varied from 0.05 to 0.59 h−1. In 41 households in 15 buildings in Korea, Hong and Kim [15] measured the seasonal dwelling infiltration rate by a tracer gas decay method, which varied from 0.09 to 1.28 h−1. Moreover, the dwelling infiltration rate varied according to the weather conditions because the magnitude of the driving forces differed depending on the weather conditions. The range of dwelling infiltration in summer was 0.09–0.34 h−1 and that in winter was 0.24–1.28 h−1 [15]. These field measurements for dwelling infiltration show a considerable difference in infiltration rates depending on buildings, households, and floors under different weather conditions.
The difference in the infiltration rate in a MFHRB is larger by floor than by household. In winter, when the stack effect is more dominant than the wind because of large indoor and outdoor temperature difference, the difference in interzonal airflow by floor appears to be more dominant than the difference in outdoor infiltration by households at the windward. In a previous study [16], the amount of dwelling infiltration by household and floor was calculated through thermal and airflow network simulation considering the interaction between wind and stack effects in MFHRB. According to the result, the difference between the top floor and the lowest floor was 179%, with 0.11 h−1 on the top floor (interzonal airflow: 0.10 h−1, infiltration: 0.01 h−1) and 0.023 h−1 on the lowest floor (only infiltration).

1.2.3. Heating Load Differences by Floor in MFHRBs

The different infiltration rates by floor in a MFHRB can cause a significant difference in heating load or heating energy consumption by floor. Kang et al. [17] analyzed the characteristics of monthly heating energy consumption in winter by household for 56 Korean MFHRBs (4494 households) with 15 stories. The highest heating energy consumption was on the lowest floor, and it decreased with the increase in floor level. However, the energy consumption on the top floor was the second largest. The study stressed that the households located on the lowest floor consumed as much as 1.7 times more than those that consumed the least heating energy, causing a large thermal difference among these households.
Using the heating energy consumption data obtained by Kang et al. [17], Jang et al. [18] developed a building energy model derived from an individual MFHRB unit. The model revealed that the MFHRB units on lower floors require higher set point temperatures (as much as 23 °C) or longer heating times (more than 7 h) than the probable range for heating control of the building (17–20 °C).
Song et al. [19] modeled a hypothetical supertall building with a 200 stories (1000 m) and simulated the heating and cooling energy loads according to the height for vertical meteorological changes. If the supertall building was divided vertically into five zones, the annual heating load increased in proportion to the height. The increase was attributed to infiltration by wind, the speed of which increases with height. The uppermost zone required 736% of the heating load of the lowermost zone.
Yoon et al. [9] investigated the difference in the infiltration load in a 32-story MFHRB by using airflow and energy simulations in winter. Based on the simulation results, the infiltration load and total heating load were found to consume the most energy on the bottom floor, followed by the second floor, and the top floor, respectively. The ratio between the minimum and maximum infiltration loads by floor was 1197.14%. Accordingly, the total heating load difference was found to be 160.11%.

1.2.4. Research Gaps

The previous studies mentioned have the following research gaps.
1.
The heating load differences by floor have still not been investigated thoroughly or theoretically in terms of entire-building airflow in MFHRBs.
Previous studies have usually focused on heating load difference between floors in MFHRBs using field measurements. However, the major influential factors have not been thoroughly identified. To determine the cause, it is necessary to understand the airflow of the entire building in MFHRBs and the difference in dwelling infiltration rates by floor according to weather conditions.
2.
There is no indicator to quantify the heating load differences by floor.
In previous studies, the heating load differences were determined differently because of the absence of an indicator to quantify them. To express the phenomenon between floors effectively, each floor must be compared in a MFHRB. In other words, it is necessary to devise an index to quantify the heating load differences between floors.
3.
A theoretical model is necessary to estimate heating load differences in the building design stage.
The findings from previous studies were obtained in the building operation stage. To prevent (or minimize) the heating load differences for each floor in advance, it is necessary to evaluate the heating load differences in the design stage. Thus, a theoretical model is required in order to do so (or to calculate an indicator of the heating load difference by floor).

1.3. Objective, Novelty, and Contribution

To address the research gaps mentioned above, the purpose of this study was to develop, based on the stack-driven dwelling infiltration characteristics, (1) a new indicator, named thermal draft load coefficient (TDLC), quantifying/observing the heating load difference by floor in a MFHRB and (2) a theoretical model for the indicator calculation in the design stage. The proposed TDLC is the ratio between the total winter heating load for each floor and the average for all households in a MFHRB. To our knowledge, it is the first study to propose an indicator and formulate the theoretical model for quantifying the heating load differences by floor in MFHRBs. According to the theory of the thermal draft coefficient (TDC), which represents the stack effect characteristic in a MFHRB [20,21], the proposed TDLC is formulated by leakage area under given indoor and outdoor temperatures. Thus, it can be calculated using building information in the design stage. It is expected that this study will benefit designers and engineers and can even be applied to building design standards or guidelines for considering heating loads in MFHRBs.
In Section 2, the TDLC is formulated based on a theoretical study of the stack-driven dwelling infiltration and heating load in MFHRBs. To validate the TDLC, coupled thermal and airflow network simulation was conducted using EnergyPlus [22] for a target MFHRB, as discussed in Section 3. As described in Section 4, the theoretical TDLC model was validated by comparing it with the entire building energy and airflow simulation. The validation was conducted under different weather conditions defined by a clustering method. Finally, in Section 5, the phenomena of differences in dwelling infiltration and the associated heating load by floor in a target building are examined based on the proposed TDLC, and the reliability of TDLC under different weather conditions is discussed in detail.

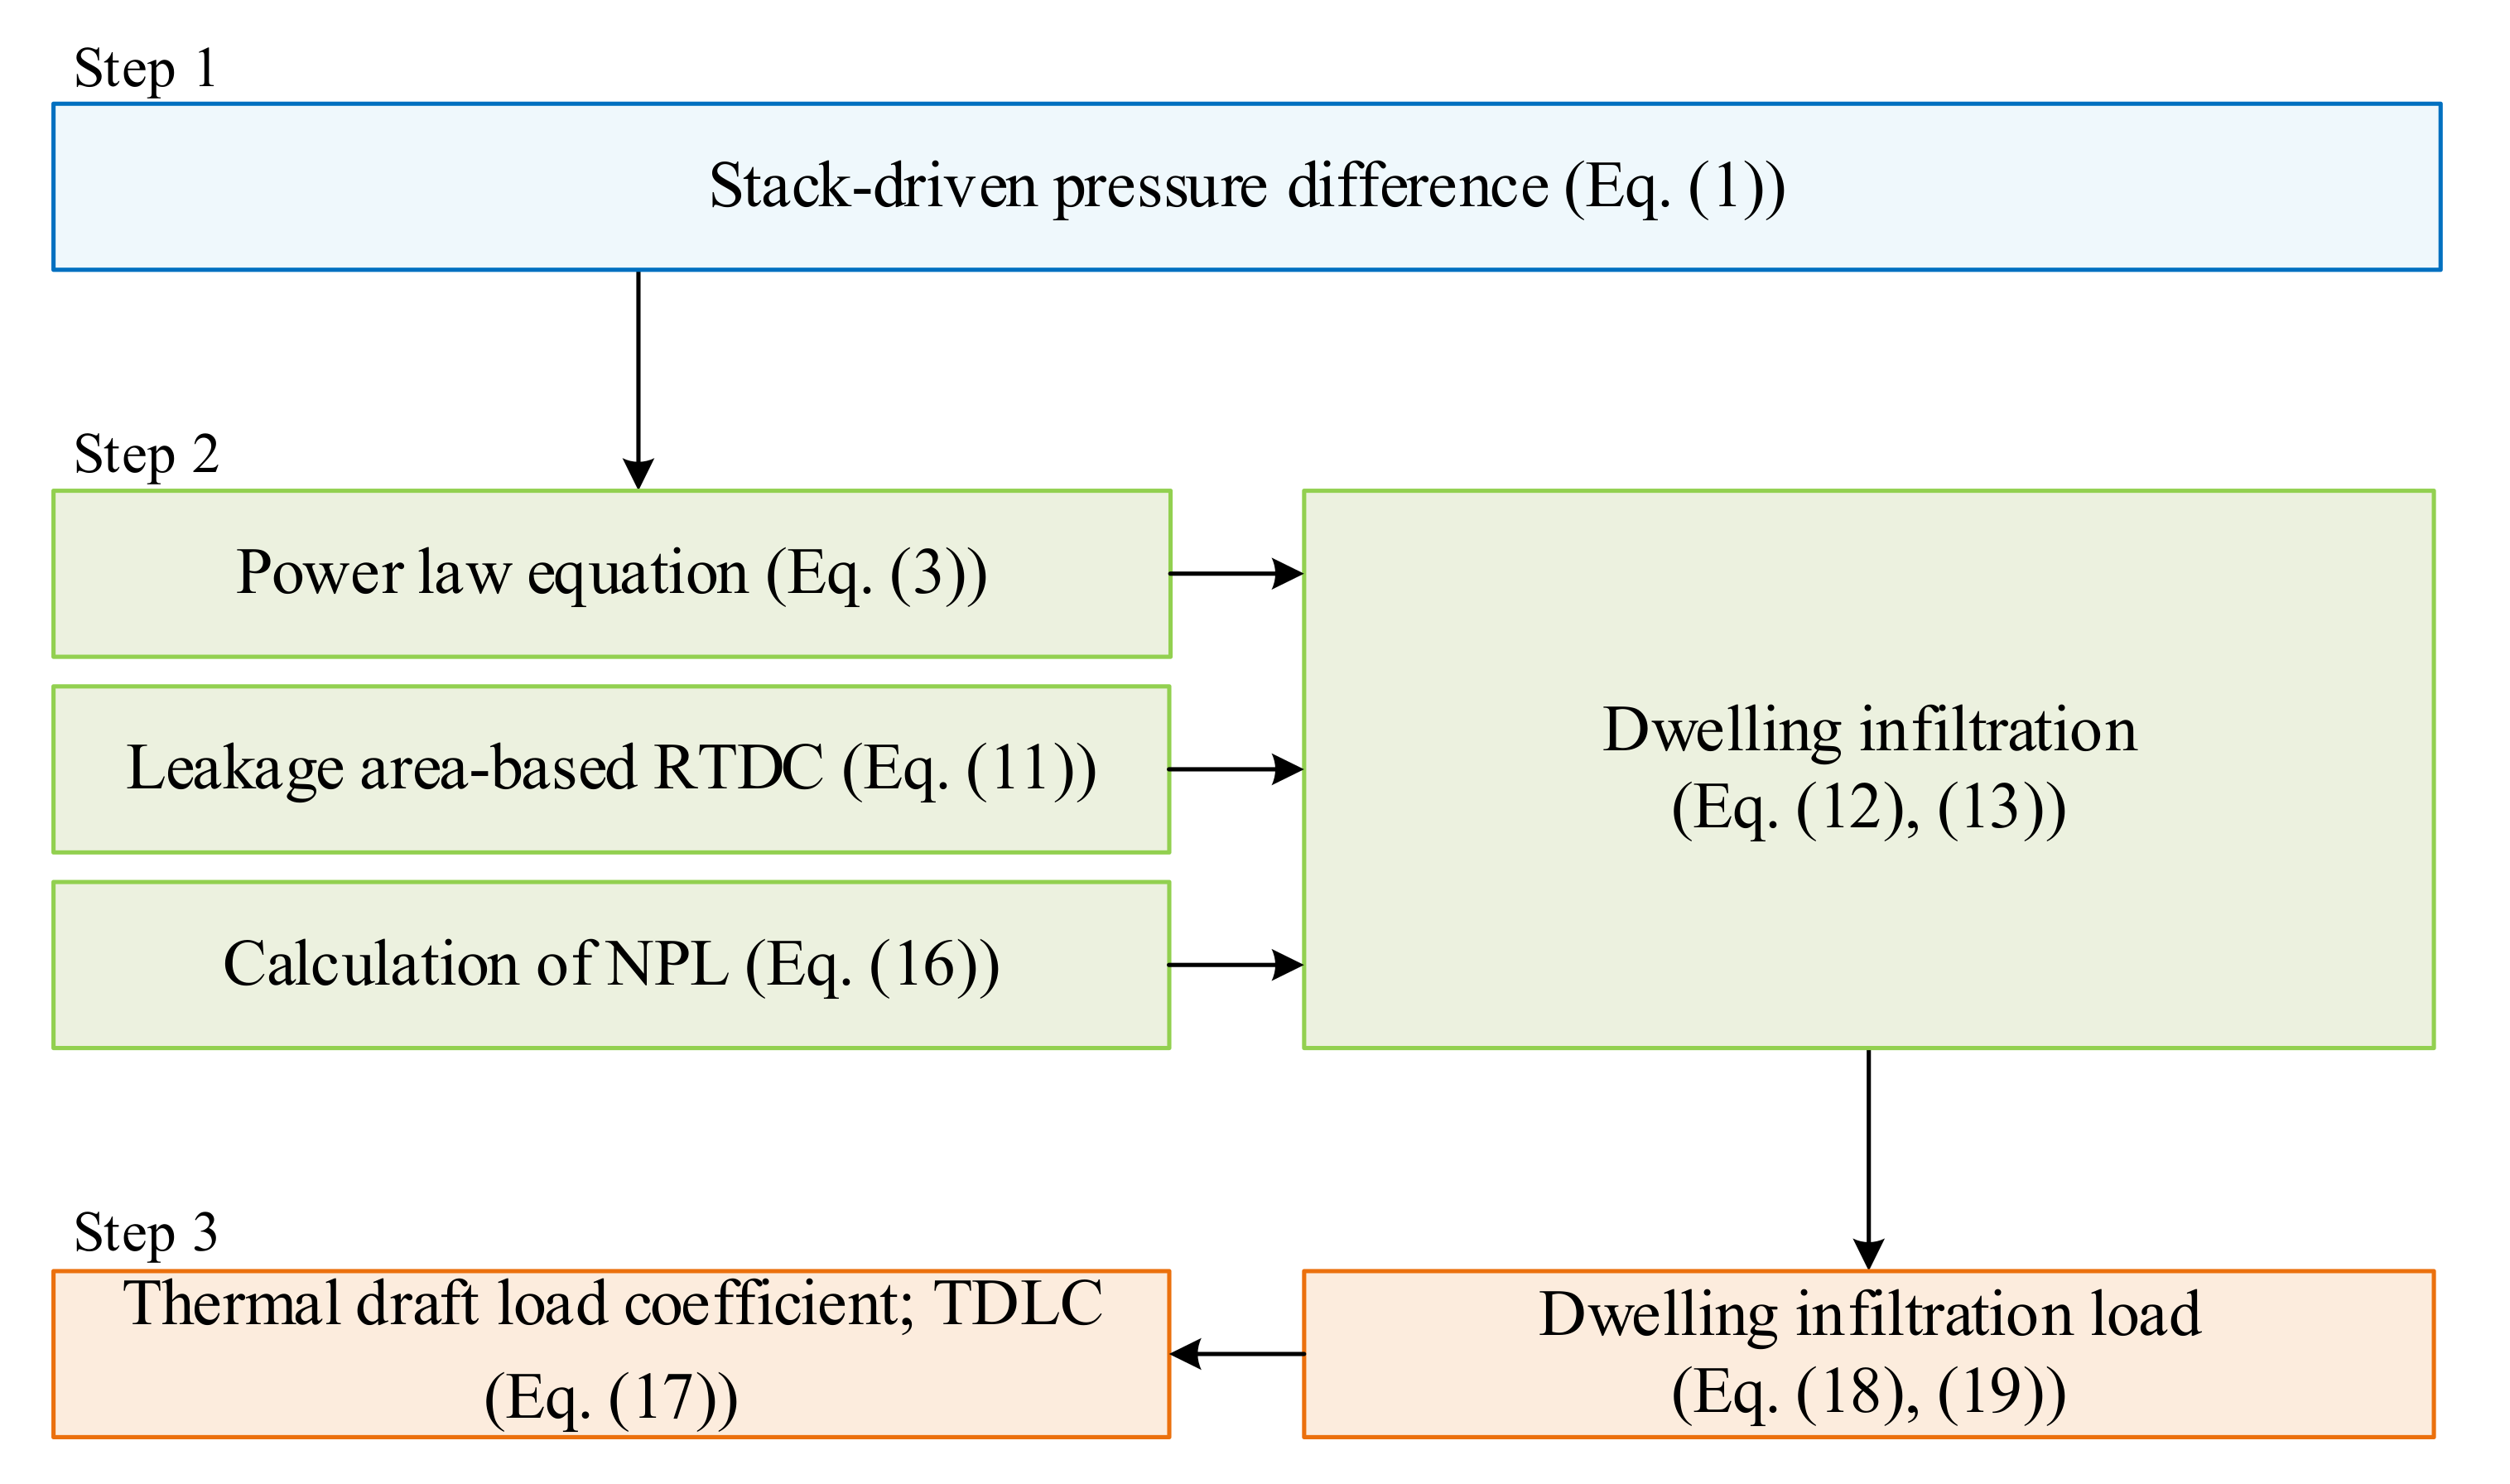
2. Theoretical Study

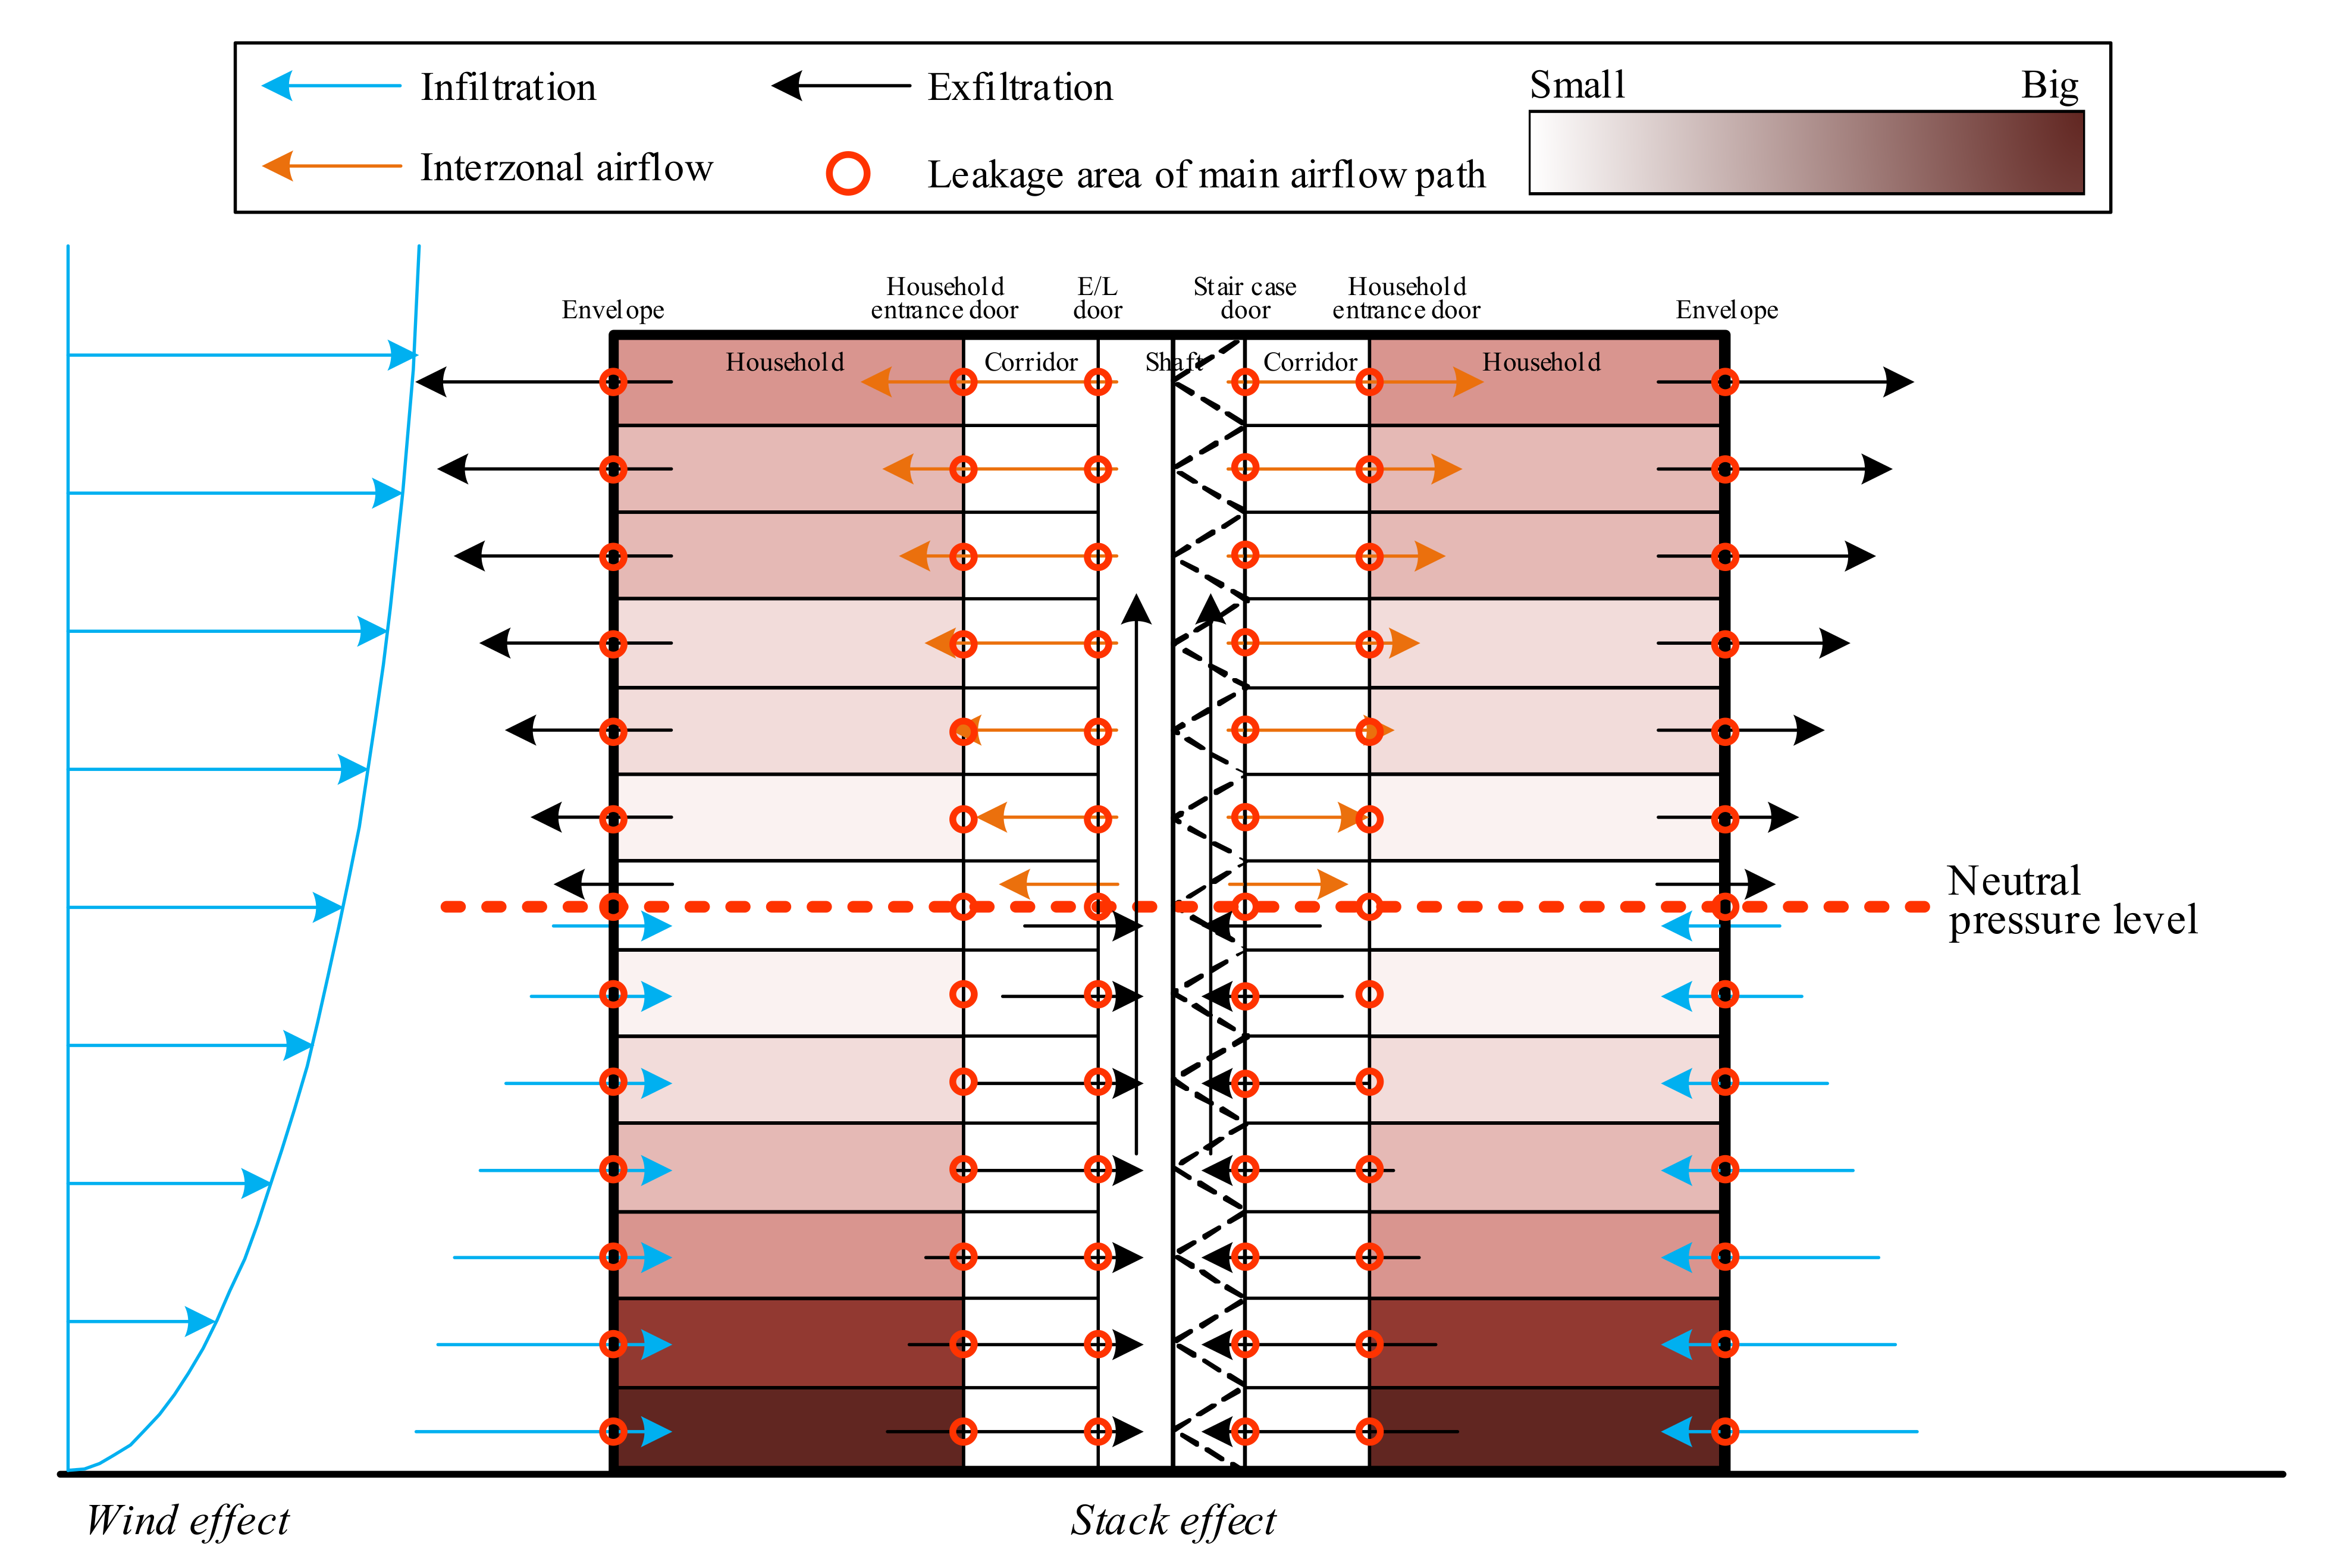
2.1. Stack-Driven Pressure Differences

The stack effect is the dominant driving force of air in high-rise buildings. The indoor and outdoor temperature differences of the building cause the air density to differ. The difference in air density causes a pressure difference at the horizontal and vertical airflow paths in the building. The resulting airflow phenomenon is called the “stack effect”. The pressure difference in the stack effect can be expressed by Equation (1). The pressure difference is proportional to the distance from the NPL and the indoor and outdoor temperature differences. Thus, the stack effect is dominant in a MFHRB with long vertical shafts in winter.
Δ P i = g h i h n p l ρ o u t T i n T o u t T i n
where Δ P i is the pressure difference between the outdoor environment and indoor spaces on the ith floor caused by stack action (Pa), g is the gravitational constant (m/s2), h i is the building height the ith floor (m), h n p l is the height of the neutral pressure level (m), ρ o u t is the outdoor air density (kg/m3), T i n is the indoor temperature (K), and T o u t is the outdoor temperature (K).

2.2. Stack-Driven Dwelling Infiltration by Floor in a MFHRB

2.2.1. Power Law Equation

The relationship between infiltration rates and pressure differences across a crack or opening generally follows a power-law equation. The orifice form of the power-law equation [23] is shown in Equation (2). Equation (3) shows a power-law formula with a leakage area and reference pressure difference. Based on the NPL in a MFHRB, the infiltration from the envelope at the lower part and the interzonal airflow from the household entrance door at the upper part can be expressed as in Equations (4) and (5), respectively, in terms of stack effect.
Q = C b ρ o u t   Δ P n     C b = A   C D 2   Δ P r e f 0.5 n
Q = A   C D 2   Δ P r e f 0.5 n ρ o u t   Δ P n
Q i , e n v l o w e r = A e n v   C D 2   Δ P r e f 0.5 n   ρ o u t   Δ P i , e n v n
Q i , e n t u p p e r = A e n t   C D 2   Δ P r e f 0.5 n   ρ c o r r i d o r   Δ P i , e n t n
where Q is the mass flow rate (kg/s), ρ o u t is the outdoor air density (kg/m3), Δ P is the pressure difference (Pa), n is the flow exponent (–), A is the equivalent or effective leakage area (m2), C D is the discharge coefficient (–), Δ P r e f is the reference pressure difference (Pa), Q i , e n v l o w e r is the mass flow rate from the envelope on the ith floor lower than the NPL (kg/s), Q i , e n t u p p e r is the mass flow rate from the household entrance door on the ith floor above the NPL (kg/s), A e n v is the leakage area of envelope (m2), A e n t is the leakage area of household entrance door (m2), Δ P i , e n v is the pressure difference at the envelope on the ith floor (Pa), Δ P i , e n t is the pressure difference at the household entrance door on the ith floor (Pa), and ρ c o r r i d o r is the corridor air density (kg/m3).

2.2.2. Thermal Draft Coefficient

To characterize and quantify the stack-driven pressure distributions given for airflow paths in a high-rise building, the TDC is defined as the pressure difference ratio for a particular partition (e.g., envelope) on each floor or in a building. The TDC has been extended from previous studies [20,21,24,25,26]. The original TDC ( γ ) was suggested by Tamura [24] for an office building with open floor plans. This is expressed as in Equation (6), which shows the ratio between the sum of envelope pressure differences at the top (actual pressure difference) and bottom floors, and the theoretical pressure differences for the shaft and envelope at the top and bottom of the building (theoretical pressure difference). This means that the envelope pressure difference ratio is caused by the stack effect in a building. Then, the original form of the TDC ( γ ) was redefined as the TDC ( γ i ) for each floor by Hayakawa and Togari [25] to impart a physical meaning to the individual envelope pressure difference ratios for each floor, as in Equation (7). Subsequently, Jo et al. [26] applied the TDC to high-rise residential buildings, considering the interior partitions of the residential buildings, as in Equation (8), in the existing TDC; Equation (8) has a new term representing the pressure differences across interior partitions. Based on previous TDC studies, Yoon et al. [20] extended the physical meaning of the TDC from the envelope ( Δ P w i ) to all partitions ( Δ P i , j ), not only for the envelope, on each floor, as in Equation (9). The extended TDC for the main horizontal airflow paths in a high-rise residential building is defined, as in Equation (10), by their leakage areas based on the relationship between the pressure difference and leakage area in stack-driven serial airflow.
Recently, Kim et al. [21] suggested the residential TDC (RTDC), including three correction factors ( C E , C S , and C ρ ), as in Equation (11), to reduce the uncertainties caused by the actual MFHRB conditions as follows: (1) different household layouts, (2) multiple shafts, and (3) horizontal temperature differences on each floor. Three correction factors are used, respectively, to cover the three uncertainty factors. The formulation and explanation can be found in detail elsewhere [21]. Finally, stack-driven dwelling infiltration, as shown in Equations (4) and (5), can be transformed into Equations (12) and (13), respectively, by applying the RTDC of Equation (11), expressed as the leakage area to the stack-driven pressure difference ( Δ P i , e n v and Δ P i , e n t ). Therefore, the driving forces ( Δ P i , e n v and Δ P i , e n t ) in the stack-driven dwelling infiltration in Equations (4) and (5) are formulated, as in Equations (12) and (13), using the leakage-area-based RTDC ( γ ^ i , j , k ) with the total stack pressure ( Δ P ) on each floor.
γ = P a P t = Δ P w T + Δ P w B Δ P w T + Δ P w B + i = 1 m 1 Δ P f i = Δ P w T + Δ P w B Δ P w T + Δ P w B + Δ P s T + Δ P s B
γ i = Δ P w i Δ P w i + Δ P s i
γ i = Δ P w i Δ P w i + j = 1 m Δ P p j + Δ P s i
γ i , j = Δ P i , j j = 1 m Δ P i , j
γ i , j = Δ P i , j j = 1 m Δ P i , j = Δ P i , j Δ P i , j + Δ P i , j + 1 + + Δ P i , m = Δ P i , j Δ P i , j + Δ P i , j · A i , j A i , j + 1 1 n + + Δ P i , j · A i , j A i , m 1 n = 1 1 + A i , j A i , j + 1 1 n + + A i , j A i , m 1 n = 1 A i , j A i , j 1 n + A i , j A i , j + 1 1 n + + A i , j A i , m 1 n = 1 A i , j 1 n j = 1 m 1 A i , j 1 n
γ ^ i , j , k = 1 C E C ρ C S   1 A i , j , k 1 n j = 1 m   1 C E C ρ C S   1 A i , j , k 1 n     I f   j = e n v e l o p e   o r   e n t r a n c e ,   C s = 1 I f   j = i n t e r n a l   p a r t i t i o n s   e x c e p t   e n v e l o p e   a n d   e n t r a n c e ,   C E = C s = 1 I f   j = s h a f t ,   C E = 1  
Q i , e n v l o w e r = A e n v   C D 2   Δ P r e f 0.5 n   ρ o u t     γ ^ i , j , k   Δ P i , e n v n
Q i , e n t u p p e r = A e n t   C D 2   Δ P r e f 0.5 n   ρ c o r r i d o r   γ ^ i , j , k   Δ P i , e n t n
where γ is TDC (–), P a is the sum of the actual pressure difference at the exterior wall (Pa), P t is the sum of the theoretical pressure differences across the exterior wall and the shaft wall (Pa), Δ P w T is the pressure difference at the exterior wall on the top floor (Pa), Δ P w B is the pressure difference at the exterior wall on the bottom floor (Pa), Δ P f i is the pressure difference at the floor on ith floor (Pa), Δ P s T is the pressure difference at the wall of the shaft on the top floor (Pa), Δ P s B is the pressure difference at the wall of the shaft on the bottom floor (Pa), γ i is the TDC on the ith floor (–), Δ P w i is the pressure difference at the exterior wall on the ith floor (Pa), Δ P s i is the pressure difference at the wall of the shaft on the ith floor (Pa), Δ P p j is the pressure difference at the jth interior partition (Pa), m is the number of partitions on the ith floor, γ i , j is the TDC at the jth partition on the ith floor (–), Δ P i , j is the pressure difference at the jth partition on the ith floor (Pa), A i , j is the leakage area at the jth partition on the ith floor (m2), n is the flow exponent (–), γ ^ i , j , k is the corrected TDC at the jth partition of the kth household on the ith floor (–), A i , j , k is the leakage area at the kth household of jth partition on the ith floor (Pa), C E is the envelope area ratio correction factor (–), C ρ is the air density correction factor (–), and C S is the shaft ratio correction factor (–).

2.2.3. Neutral Pressure Level

The NPL must be predefined to calculate the stack-driven pressure and airflow rate, as shown in Equations (1), (12) and (13). Based on the defined NPL, infiltration, Equation (12), or the interzonal airflow rates, Equation (13) can be calculated for the lower and upper dwelling units. For a given MFHRB, the NPL can be calculated from the continuity equation, as shown in Equation (14). Assuming that there is no air leakage except for the main building entrances, envelope, and dwelling entrance doors, the amount of infiltration from (1) the main building entrances on the lobby and basement floors and (2) the dwelling envelope below the NPL is equal to the total exfiltration of interzonal airflow from the dwelling entrance doors above the NPL, as in Equation (15). Hence, the location of the NPL can be determined using Equation (16).
Q i n = Q o u t
i = B o t t o m L o b b y Q i , m a i n   e n t l o w e r + i = L o b b y N P L Q i , e n v l o w e r = i = N P L T o p Q i , e n t u p p e r
f N P L = i = B o t t o m L o b b y Q i , m a i n   e n t l o w e r + i = L o b b y N P L Q i , e n v l o w e r i = N P L T o p Q i , e n t u p p e r = 0
where Q i n is the mass flow rate from outside to the inside (kg/s), Q o u t is the mass flow rate from inside to the outside (kg/s), Q i , m a i n   e n t l o w e r is the mass flow rate from the main entrance door on the ith floor lower than the NPL (kg/s), Q i , e n v l o w e r is the mass flow rate from the envelope on the ith floor lower than the NPL (kg/s), and Q i , e n t u p p e r is the mass flow rate from the household entrance door on the ith floor above the NPL (kg/s).

2.3. Thermal Draft Load Coefficient: Proposed Indicator

In this section, an indicator, the TDLC, is proposed, as shown in Equation (17), to quantify the stack-driven dwelling airflow load differences by floor in a MFHRB. The TDLC is defined for each floor (TDLCi) based on the airflow load ratio between the load of each floor and the average load for all floors in a building. The TDLC can be used to examine the airflow load differences by floor in the design stage or to observe the real-time phenomenon in operational buildings. If the TDLC of a specific floor is greater than 1, the airflow load is higher than the average load of all floors. A TDLC lower than 1 indicates relatively low airflow loads in a building. In this study, based on the theoretical models for stack-driven dwelling infiltration discussed above, the infiltration load and interzonal airflow loads were calculated by multiplying the given specific heat, temperature difference, and dwelling infiltration (or interzonal airflow) rate, as in Equations (18) and (19), in the steady-state model. The development process of the theoretical models for calculating the TDLC is shown in Figure 2.
T D L C i = q i q a v e = q i n f i l t r a t i o n + q i n t e r z o n a l   a i r f l o w i   i = 1 t h   t y p i c a l   f l o o r   T o p q i n f i l t r a t i o n + q i n t e r z o n a l   a i r f l o w i   n u m b e r   o f   t y p i c a l   f l o o r s    
q i n f i l t r a t i o n = C p , o u t   T h o u s e h o l d T o u t   Q i , e n v l o w e r
q i n t e r z o n a l   a i r f l o w = C p , c o r r i d o r   T h o u s e h o l d T c o r r i d o r   Q i , e n t u p p e r
where T D L C i is thermal draft load coefficient on the ith floor (–), q i is the sum of the q i n f i l t r a t i o n and the q i n t e r z o n a l   a i r f l o w on the ith floor (Wh), q i n f i l t r a t i o n is the infiltration load (Wh), q i n t e r z o n a l   a i r f l o w is the interzonal airflow load (Wh), q a v e is the average load for all typical floors in a building (Wh), C p , o u t is the specific heat of the outdoor air (J/kg∙K), C p , c o r r i d o r is the specific heat of the corridor air (J/kg∙K), T h o u s e h o l d is the temperature of the household air (K), T c o r r i d o r is the temperature of the corridor air (K), Q i , e n v l o w e r is the mass flow rate from the envelope on the ith floor lower than the NPL (kg/s), and Q i , e n t u p p e r is the mass flow rate from the household entrance door on the ith floor above the NPL (kg/s).

3. Airflow and Energy Simulation Method

The theoretical model was compared with the simulation model to validate its accuracy. The simulation model is described in Section 3. First, in Section 3.1, the target building and the leakage area of the main airflow paths are introduced. Based on the building information, the airflow and thermal coupled simulation model and conditions are described in Section 3.2.

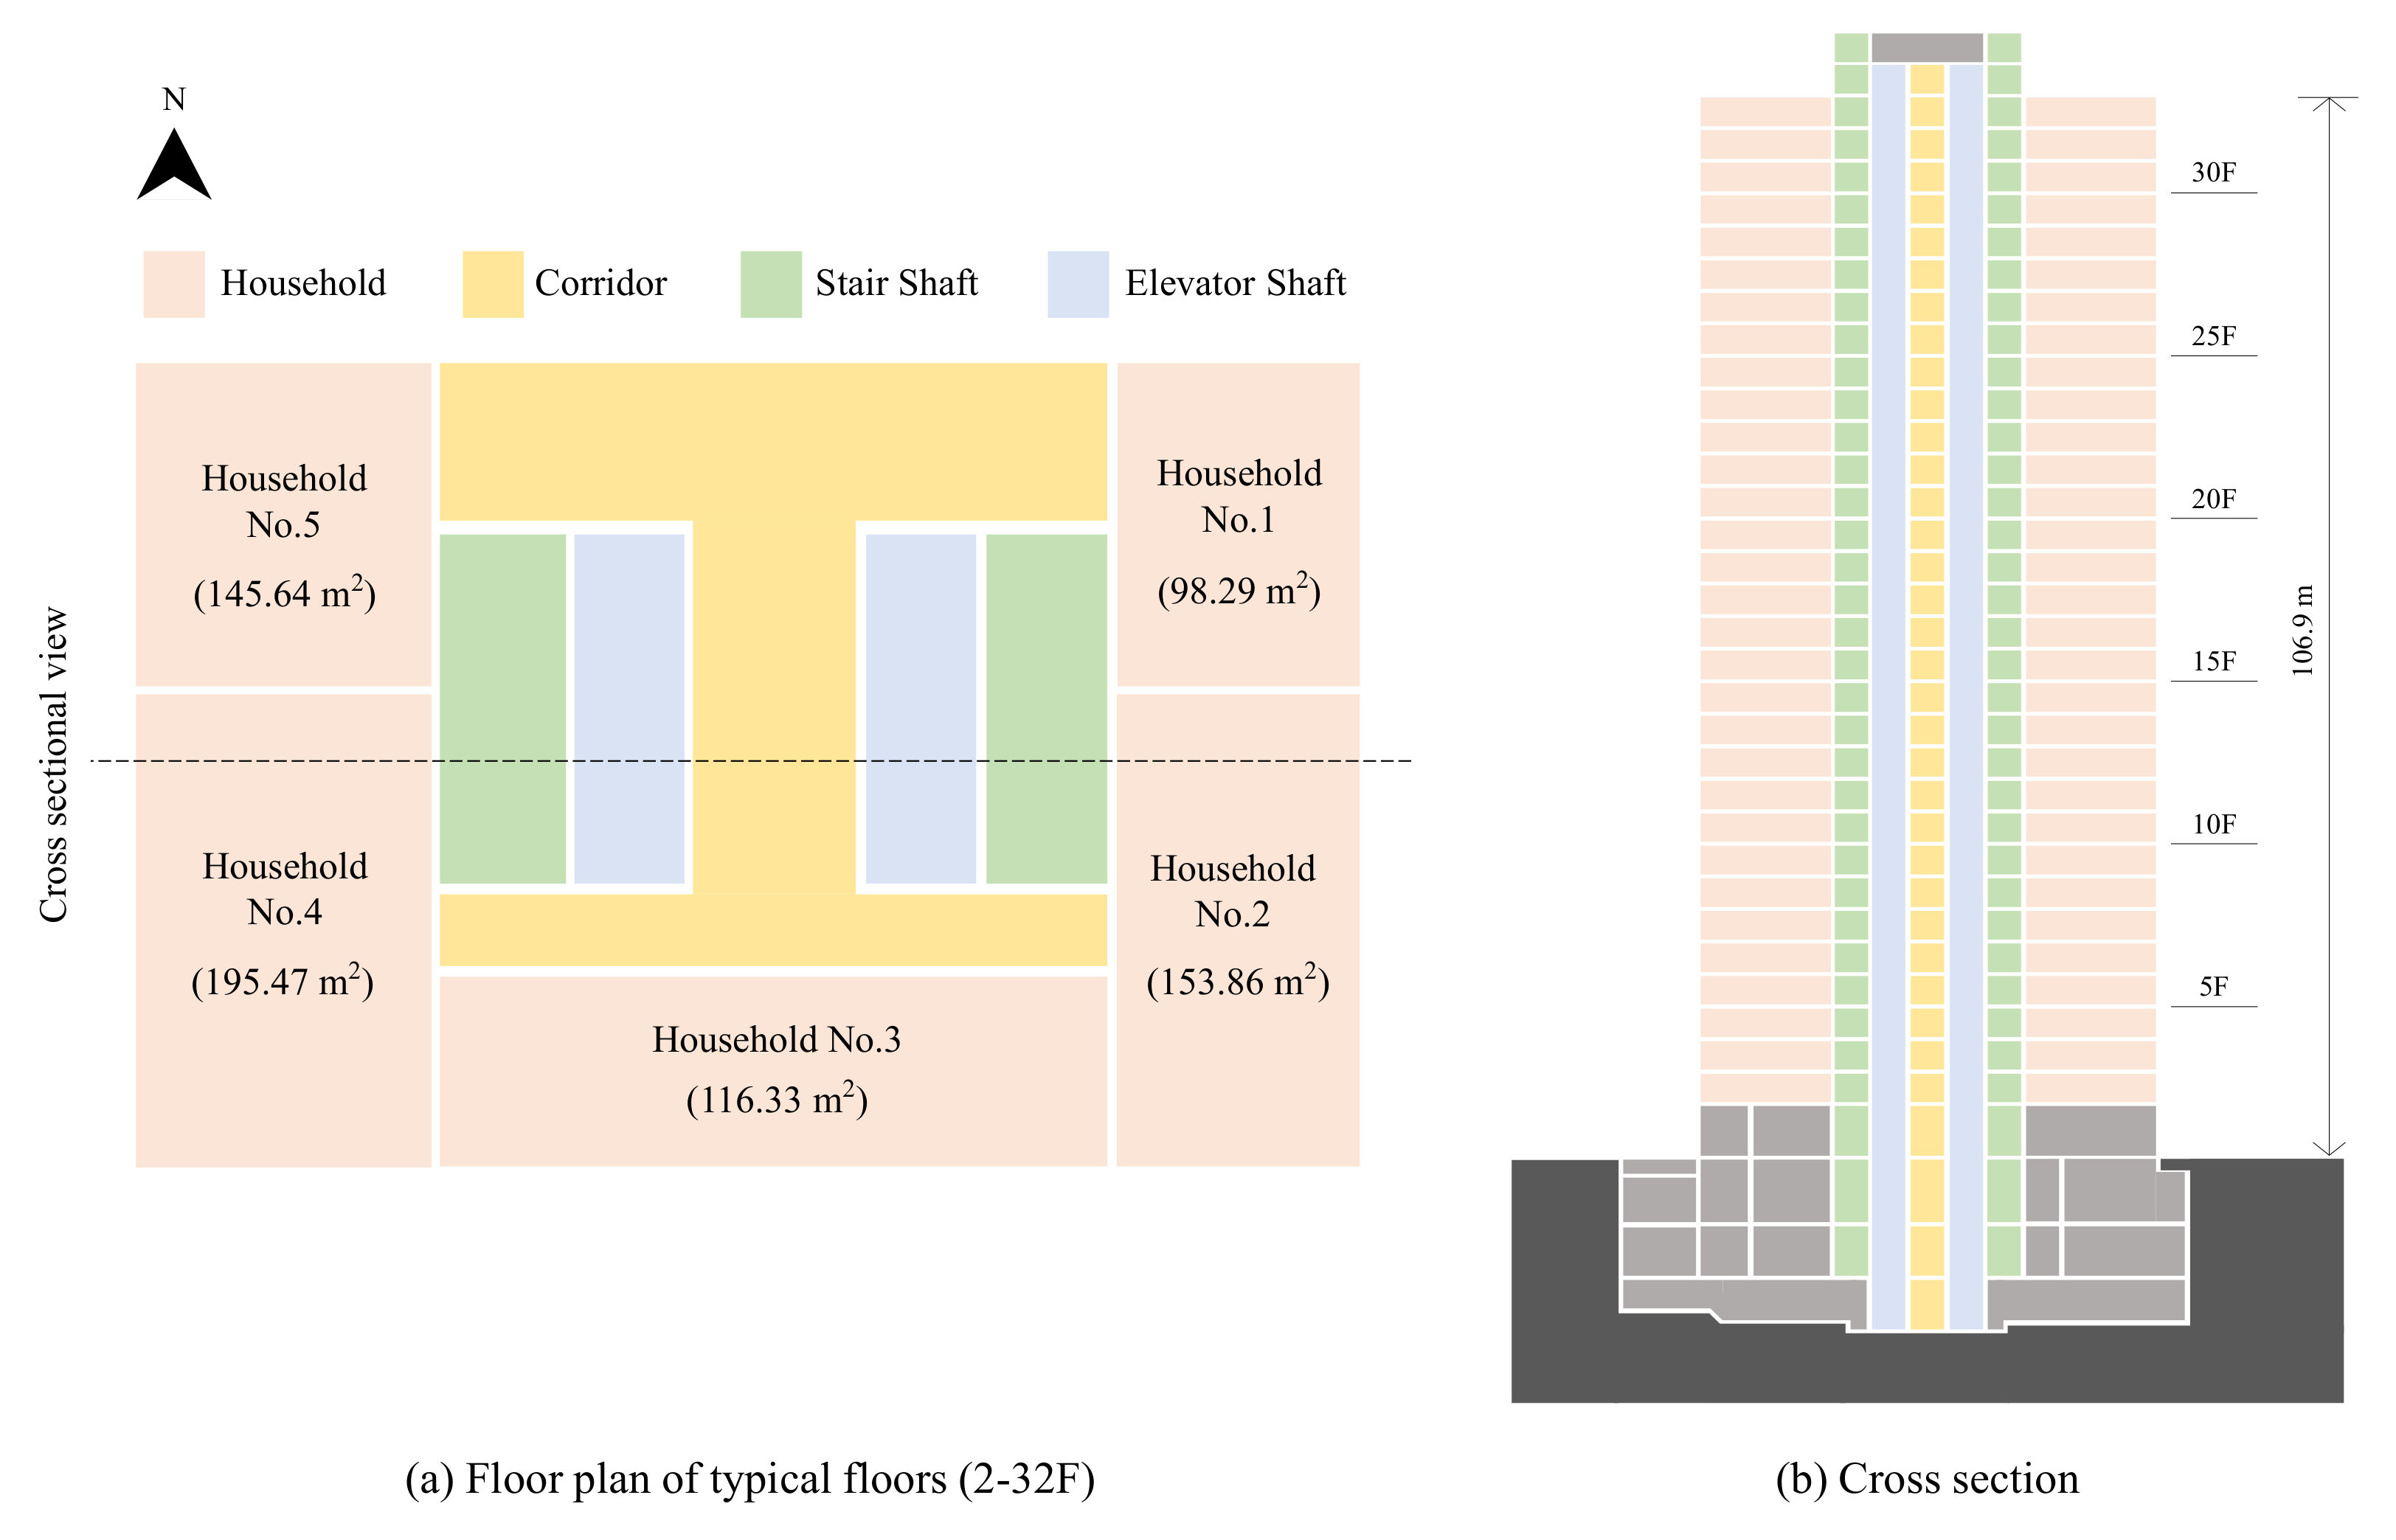
3.1. Target Building and Its Leakage Area

The target building is a typical MFHRB in Korea. As shown in Figure 3, the target building is 106.9 m high with two basement floors, one lobby floor, and 31 typical floors. The typical floors consist of five households, a corridor, stair shafts, and elevator shafts, as shown in Figure 3a. From the perspective of the stack-driven airflow in the target building, the main vertical airflow paths are the stair shafts and elevator shafts. The main horizontal airflow paths on the basement/lobby floors include elevator doors, vestibule doors, and main entrance doors. On typical floors are the elevator doors, household entrance doors, and household envelope. All spaces, except households, are unconditioned.
The leakage area is a major variable in the theoretical model. The leakage areas of the target building are based on an investigation of the MFHRBs in Korea, as shown in Table 1. The leakage areas were defined by cm2/m2@10 Pa and cm2/item@10 Pa, respectively for envelope and doors, based on the equivalent leakage area (EqLA) at the reference pressure of 10 Pa. The NPL in Korean MFHRBs was investigated, as summarized in Table A1. The average height of the NPL was one-third the height of the target building. The leakage areas of the target building were adjusted from the investigated leakage areas to fit the one-third NPL and to affect the same TDC in every main horizontal airflow path. The adjusted leakage areas used to calculate the theoretical and simulation models are listed in Table 1.

3.2. Simulation by the Airflow and Thermal Coupled Network Model (EnergyPlus)

Simulations were performed using a coupled airflow, thermal multizone network, and EnergyPlus (version 9.2.0, U.S. Department of Energy; Washington, DC, USA) [22]. The airflow network modeling was conducted based on the main airflow paths of the target building described in Section 3.1. Each airflow node on the paths was connected horizontally and vertically by the “airflow network object” [30]. The airflow network object in EnergyPlus derives the accurate airflow distributions and temperature distributions by the coupled airflow and heat calculations of every zone. To consider the magnitude of the stack effect, the indoor temperatures of the unconditioned spaces (corridor, stair shafts, and elevator shafts) were calculated in the simulation model. Unlike the theoretical model in this study, the simulation model considered the wind effect. The wind pressure coefficient of the target building was defined using the surface average calculation method [31]. The simulation conditions are listed in Table A2.

4. Validation of Theoretical Model

The accuracy of the theoretical model was validated using the simulation model. The validation was conducted under the classified weather conditions based on the strength of the wind and stack effect. In Section 4.1, clustering analysis is introduced to cluster the outdoor temperature and wind speed. In Section 4.2, the validation of the theoretical models using these indices is described. The validation dataset is organized by time (hourly) according to weather conditions and floor (2F–32F) according to the input variables.

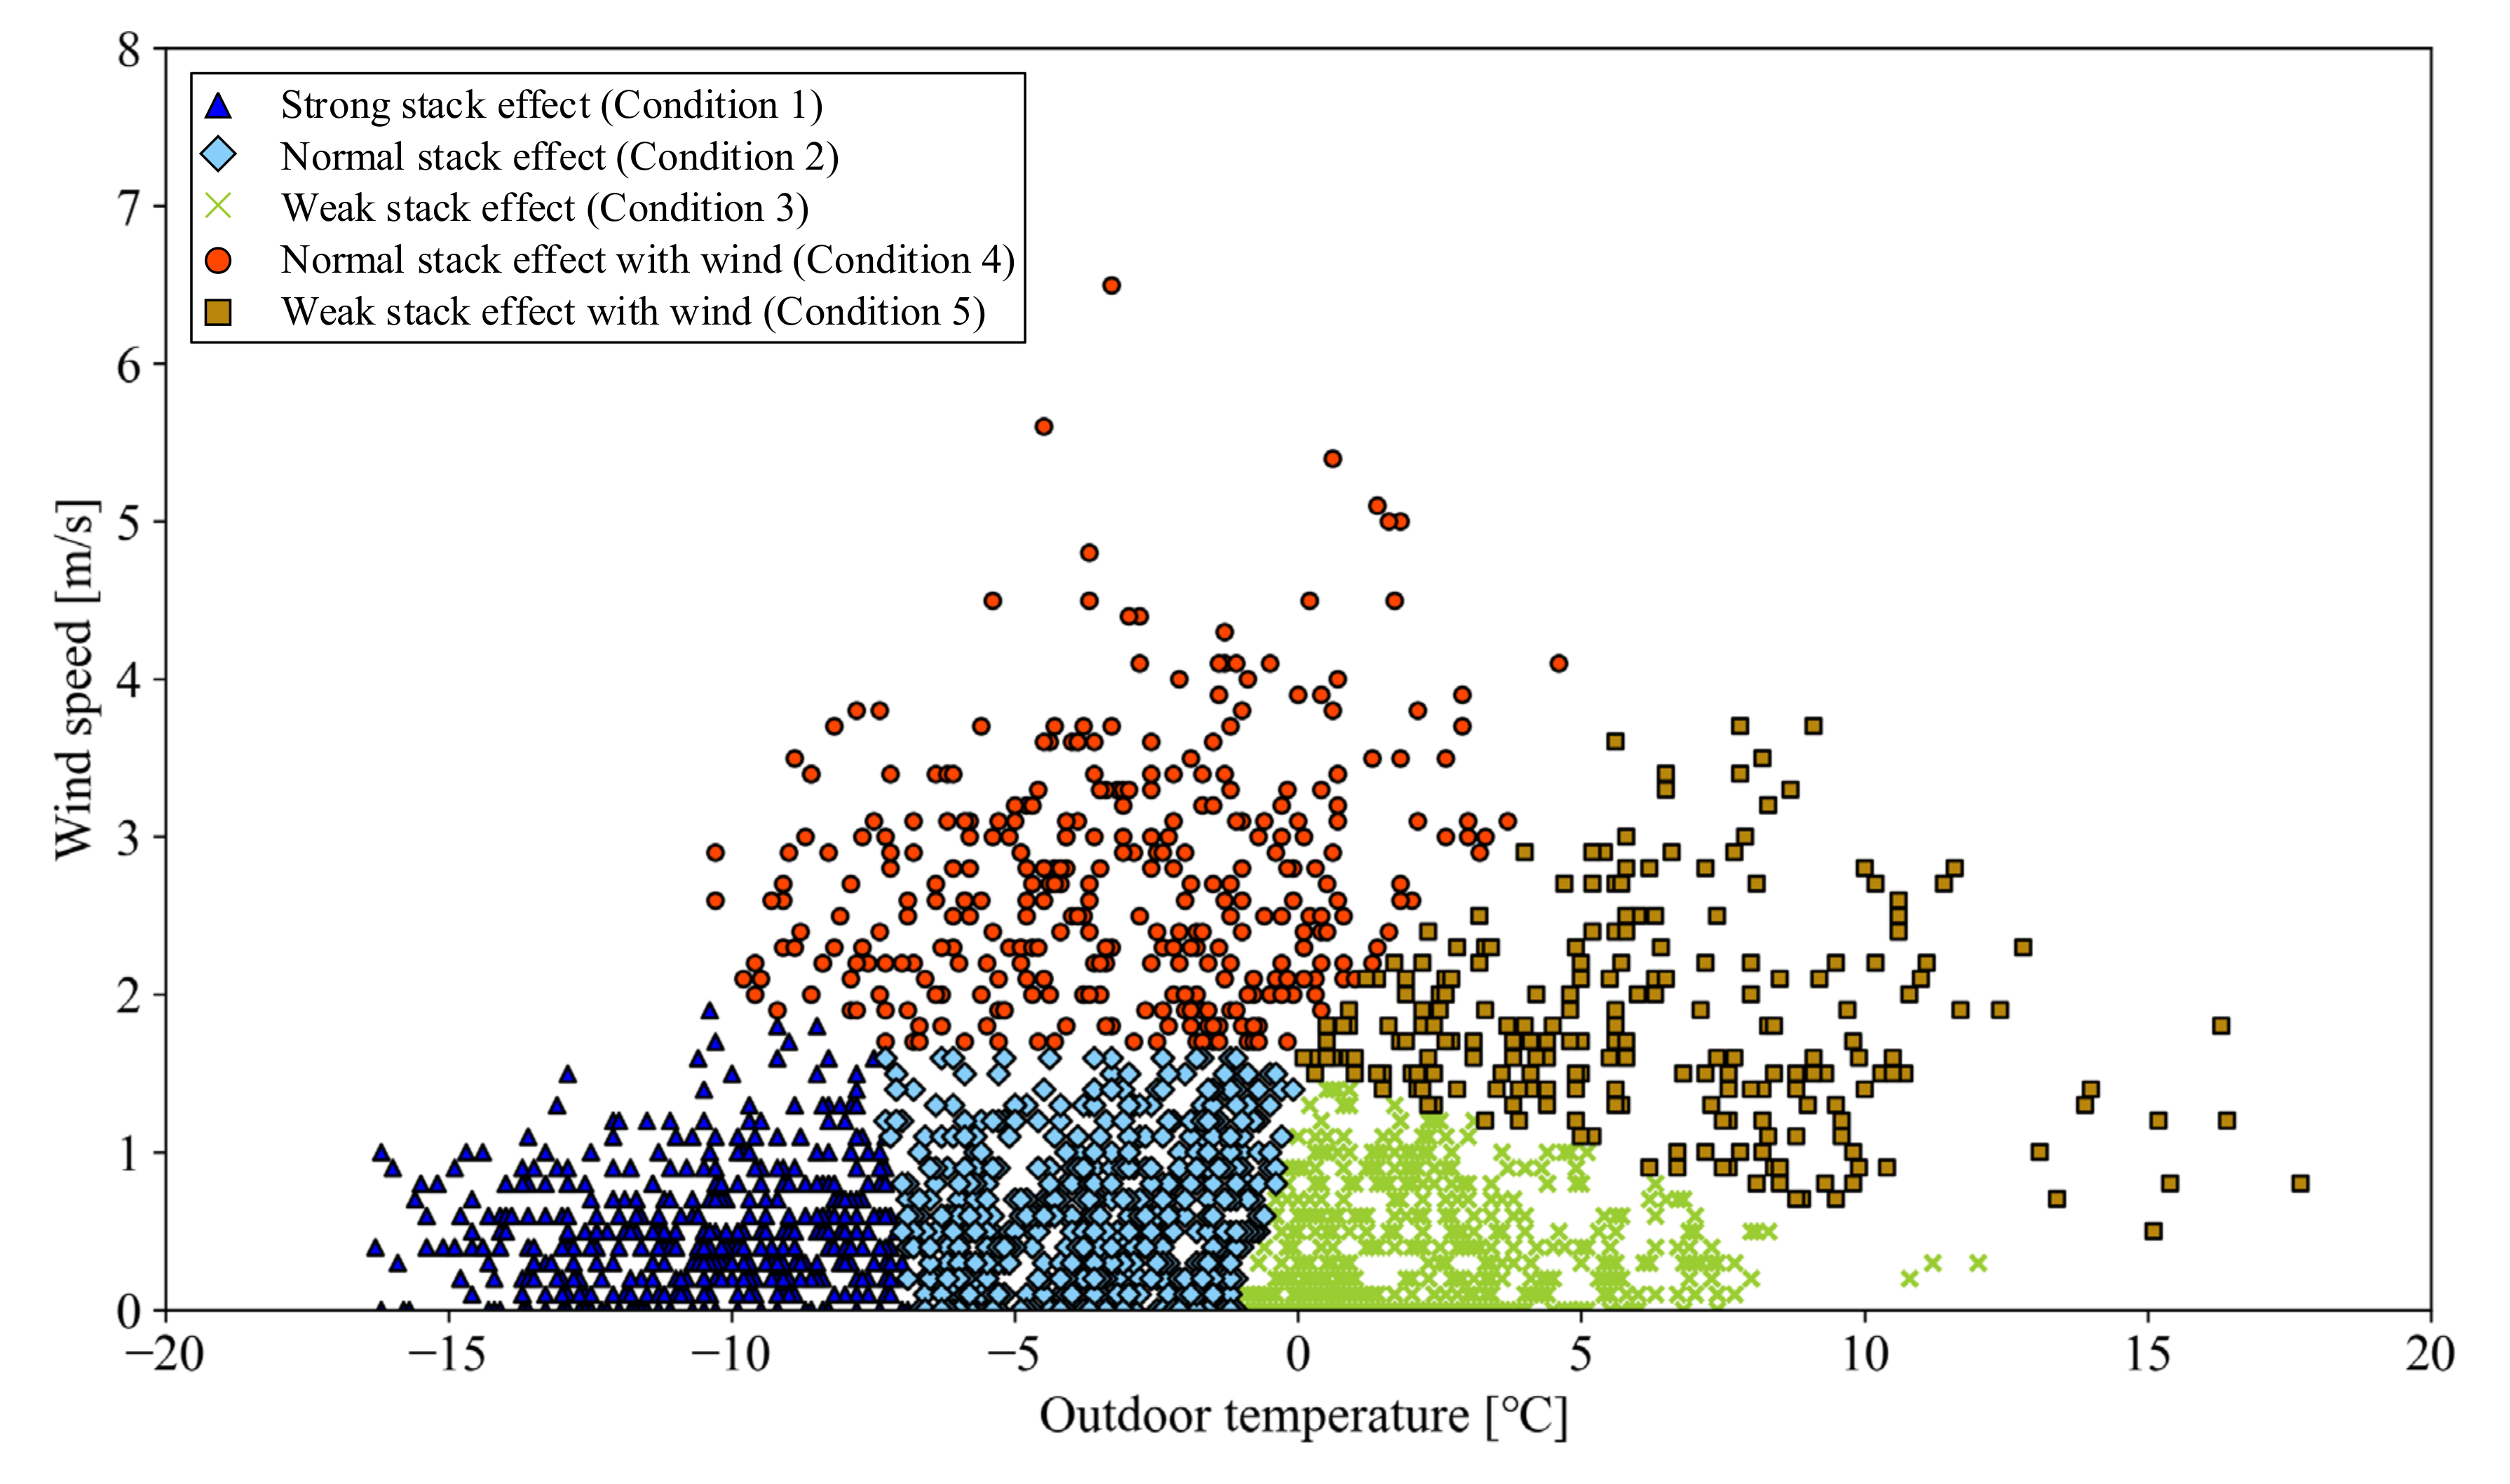
4.1. Classification of Weather Conditions by Clustering Analysis

Clustering is an unsupervised learning algorithm that can cluster unlabeled data based on similarity. In this study, k-means clustering was used to partition the winter (January, February, and December in Korea) weather dataset (hourly) into subgroups. The k-means clustering is a centroid-based algorithm in which the cost function is defined as in Equation (20). The number of clusters (k = 5) was determined using the elbow method [32]. The clustering analysis was performed in Python environments. The clustering results are presented in Figure 4. The cluster in the lower-left area of Figure 4 has the lowest outdoor temperature and the lowest wind speed, which is a strong stack effect condition. Based on the strong stack effect condition, in counterclockwise order, the normal stack effect condition, the weak stack effect condition, the weak stack effect with wind condition, and the normal stack effect with wind condition are classified as dominant for each weather condition. The accuracy of the theoretical model was validated under these five weather conditions.
C = i = 1 k x j S i x j μ i 2
where C is the cost function of k-means clustering, k is the number of clusters, x j is the jth data sample in S i , S i is ith cluster from dataset, and μ i is the centroid (mean of cluster samples) of cluster S i .

4.2. Validation of Theoretical-Model-Based Dwelling Infiltration Rates and Its Heating Load

The indices used to validate the accuracy of the theoretical model are the coefficient of variation of the root mean square error, or CV(RMSE), and normalized mean bias error (NMBE), as shown in Equations (21) and (22), which are used in the uncertainty analysis of energy models. The CV(RMSE) indicates the ability of the model to calculate the overall shape reflected in the data. The criterion of the acceptable CV(RMSE) is less than 30% for the energy model proposed in ASHRAE Guideline 14 [33,34]. The NMBE provides the global difference between the real (simulation model) and the predicted (theoretical model) values [35]. The NMBE criterion for the energy model was less than 10% [33,34]. The theoretical model satisfied the criteria for most weather conditions.
C V R M S E = 1 y ¯   i = 1 n y i y ^ i 2 n p   100   %
N M B E = 1 y ¯ i = 1 n y i y ^ i n p   100   %
where y ¯ is the average of the real values, y i is the real value, y i ^ is the predicted value, n is the number of the data, and p is the number of adjustable model parameters, suggested to be one in CV(RMSE), and zero in NMBE [36,37].
Figure 5 shows the accuracy of the theoretical-model-based dwelling infiltration rates, as in Figure 5a, and dwelling infiltration heating load, as in Figure 5b, against the simulation model under clustered weather conditions. In addition, the accuracies of the theoretical model with and without RTDC were compared. The theoretical model with the RTDC applied was more accurate than that without the RTDC, resulting in a smaller CV(RMSE) and NMBE under all weather conditions. Compared with the model without the RTDC, the CV(RMSE) and NMBE of the model with the RTDC decreased by 42.2% and 76.2%, respectively, for all weather conditions in dwelling infiltration, respectively, as shown in Figure 5a, and decreased by 36.5% and 49.7% in the dwelling infiltration heating load, respectively, as shown in Figure 5b. In Figure 5a, the stronger the stack effect, the better the accuracy of the theoretical dwelling infiltration. The accuracy of the stack-dominant conditions (conditions 2 and 3) was better than that of the stack effect with wind conditions (conditions 4 and 5). This is because the theoretical model is based on the stack effect and does not consider wind.
Based on the theoretical dwelling infiltration, the accuracy of the heating load under clustered weather conditions is shown in Figure 5b. The CV(RMSE) and NMBE in Figure 5b are similar to those in Figure 5a, but the numeric values of the indices are slightly larger overall. However, the CV(RMSE) of the theoretical-model-based heating load with the RTDC was less than 30% under all weather conditions. The theoretical model satisfied the CV(RMSE) and NMBE criteria in all weather conditions except for condition 5 (weak stack effect with wind) in NMBE, proving its validity.

5. Results and Discussion

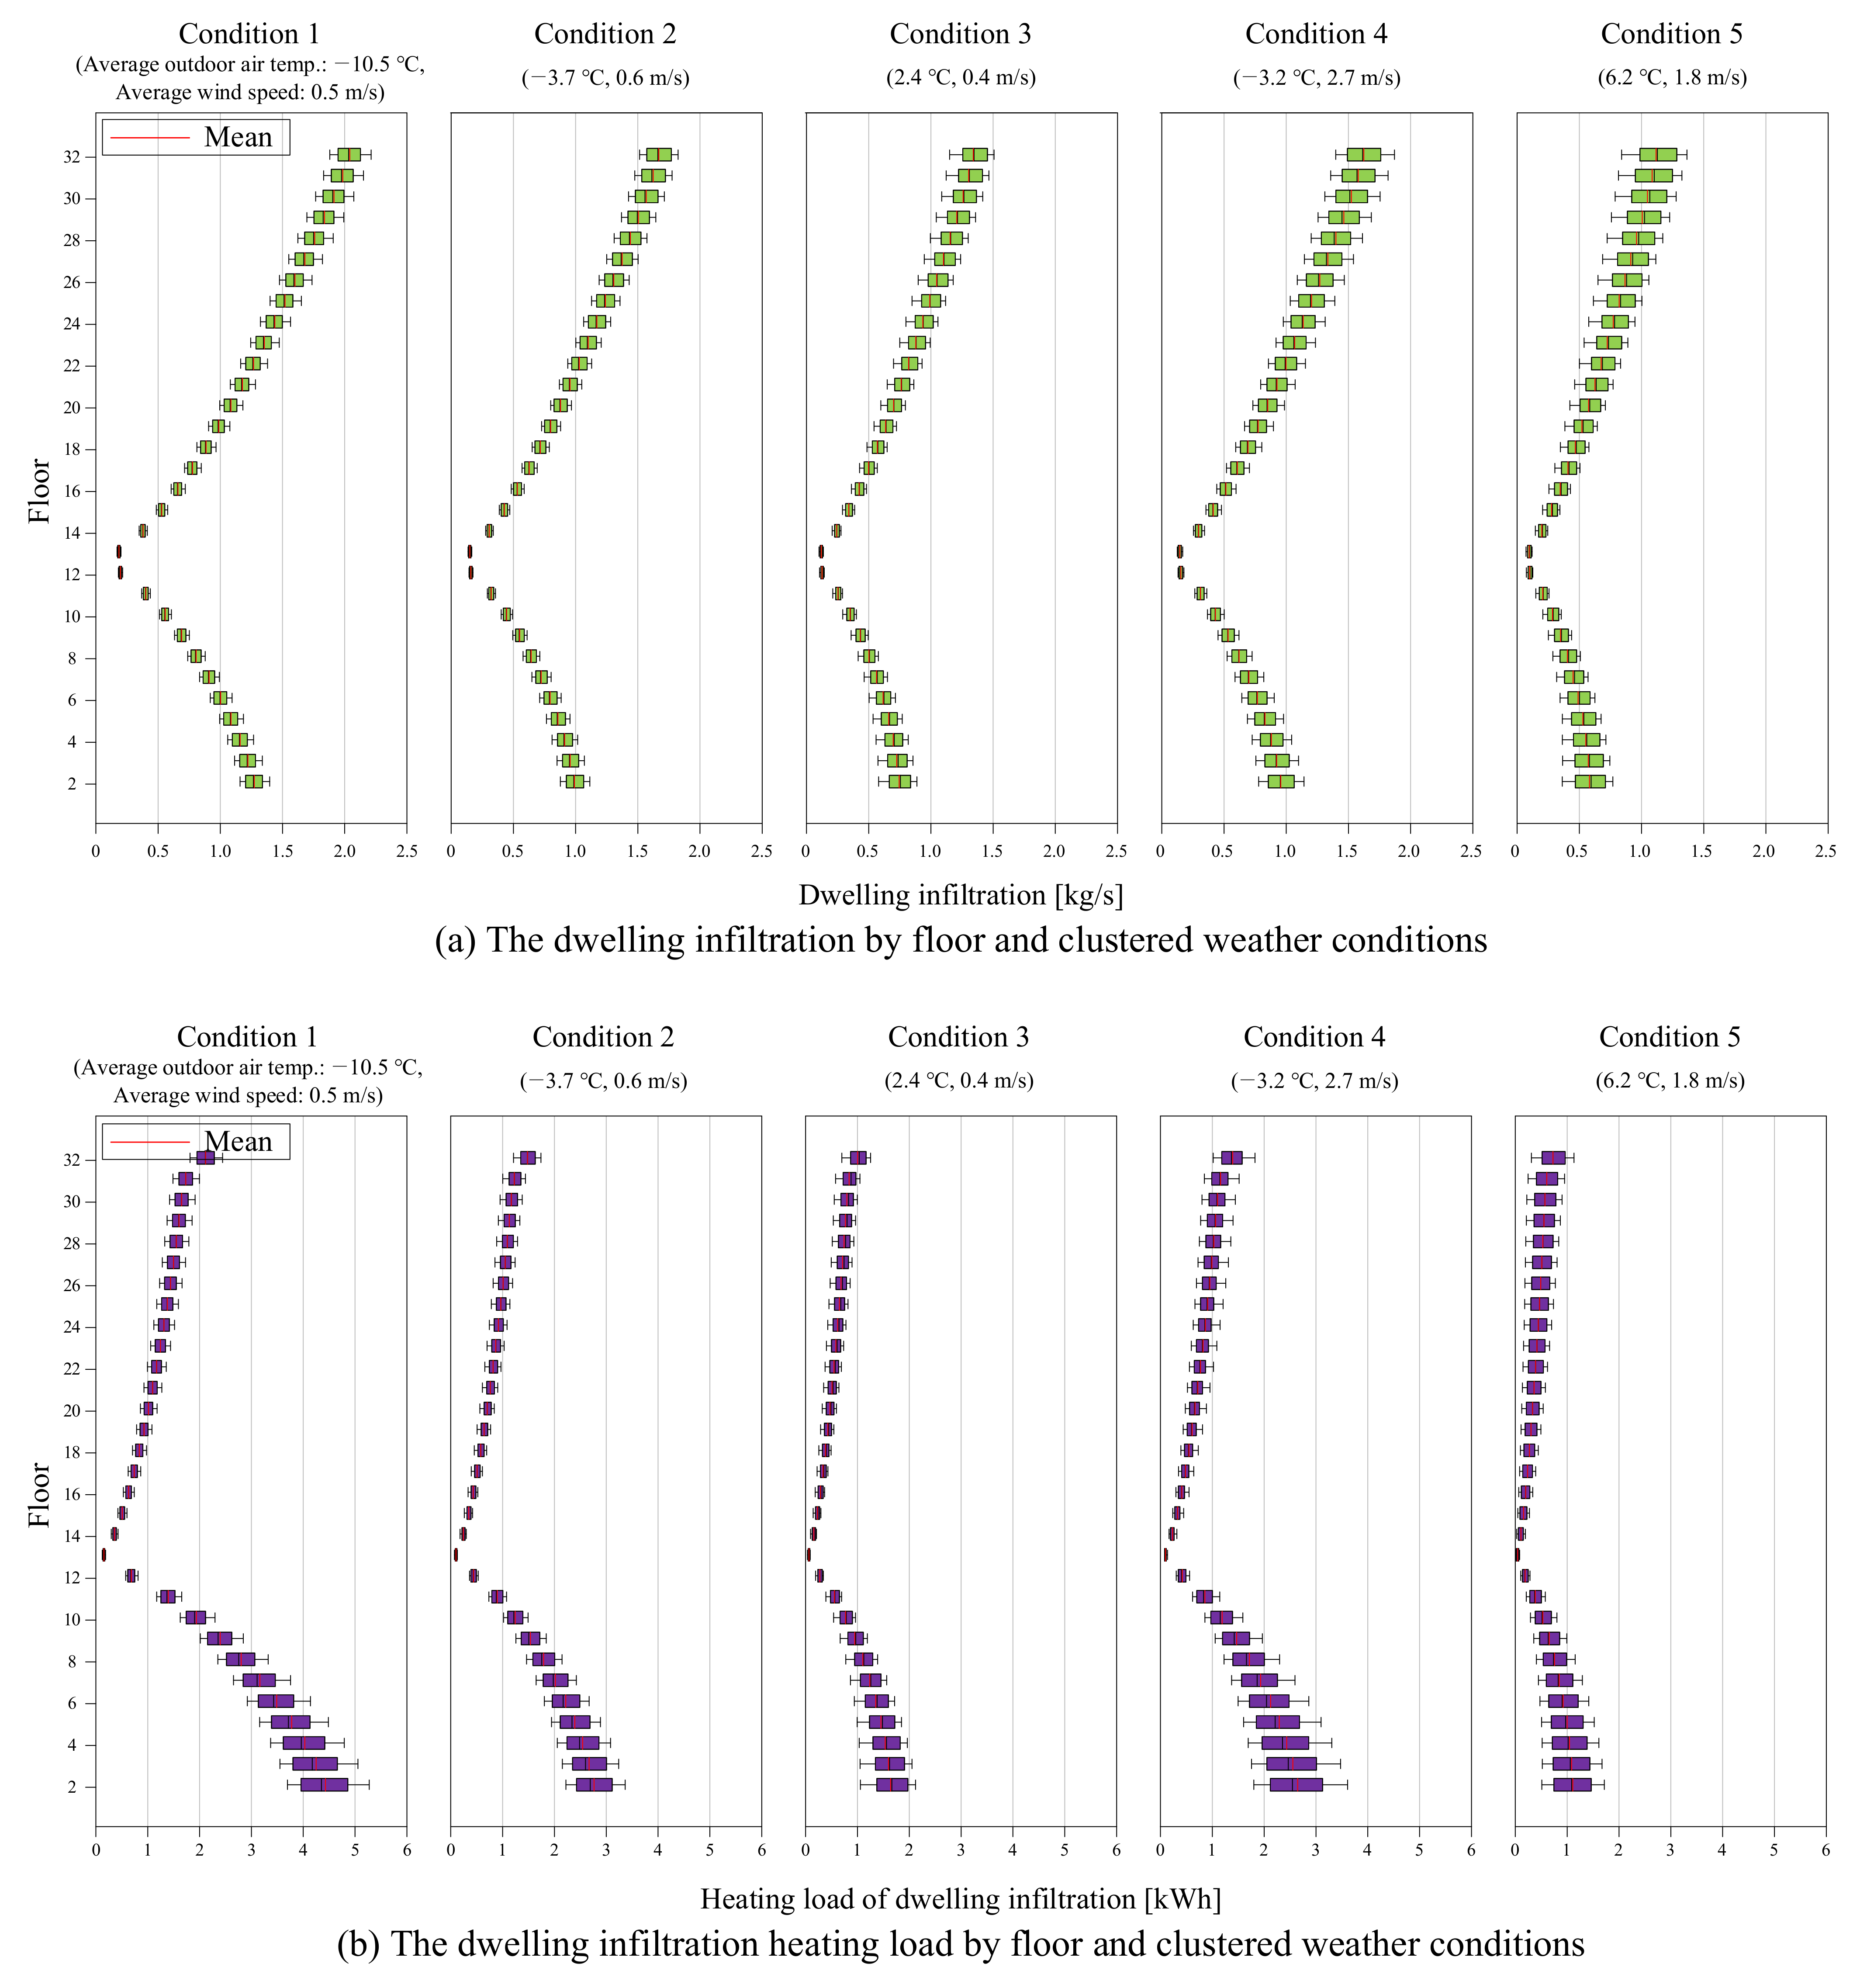
5.1. Dwelling Infiltration and Heating Load by Floor
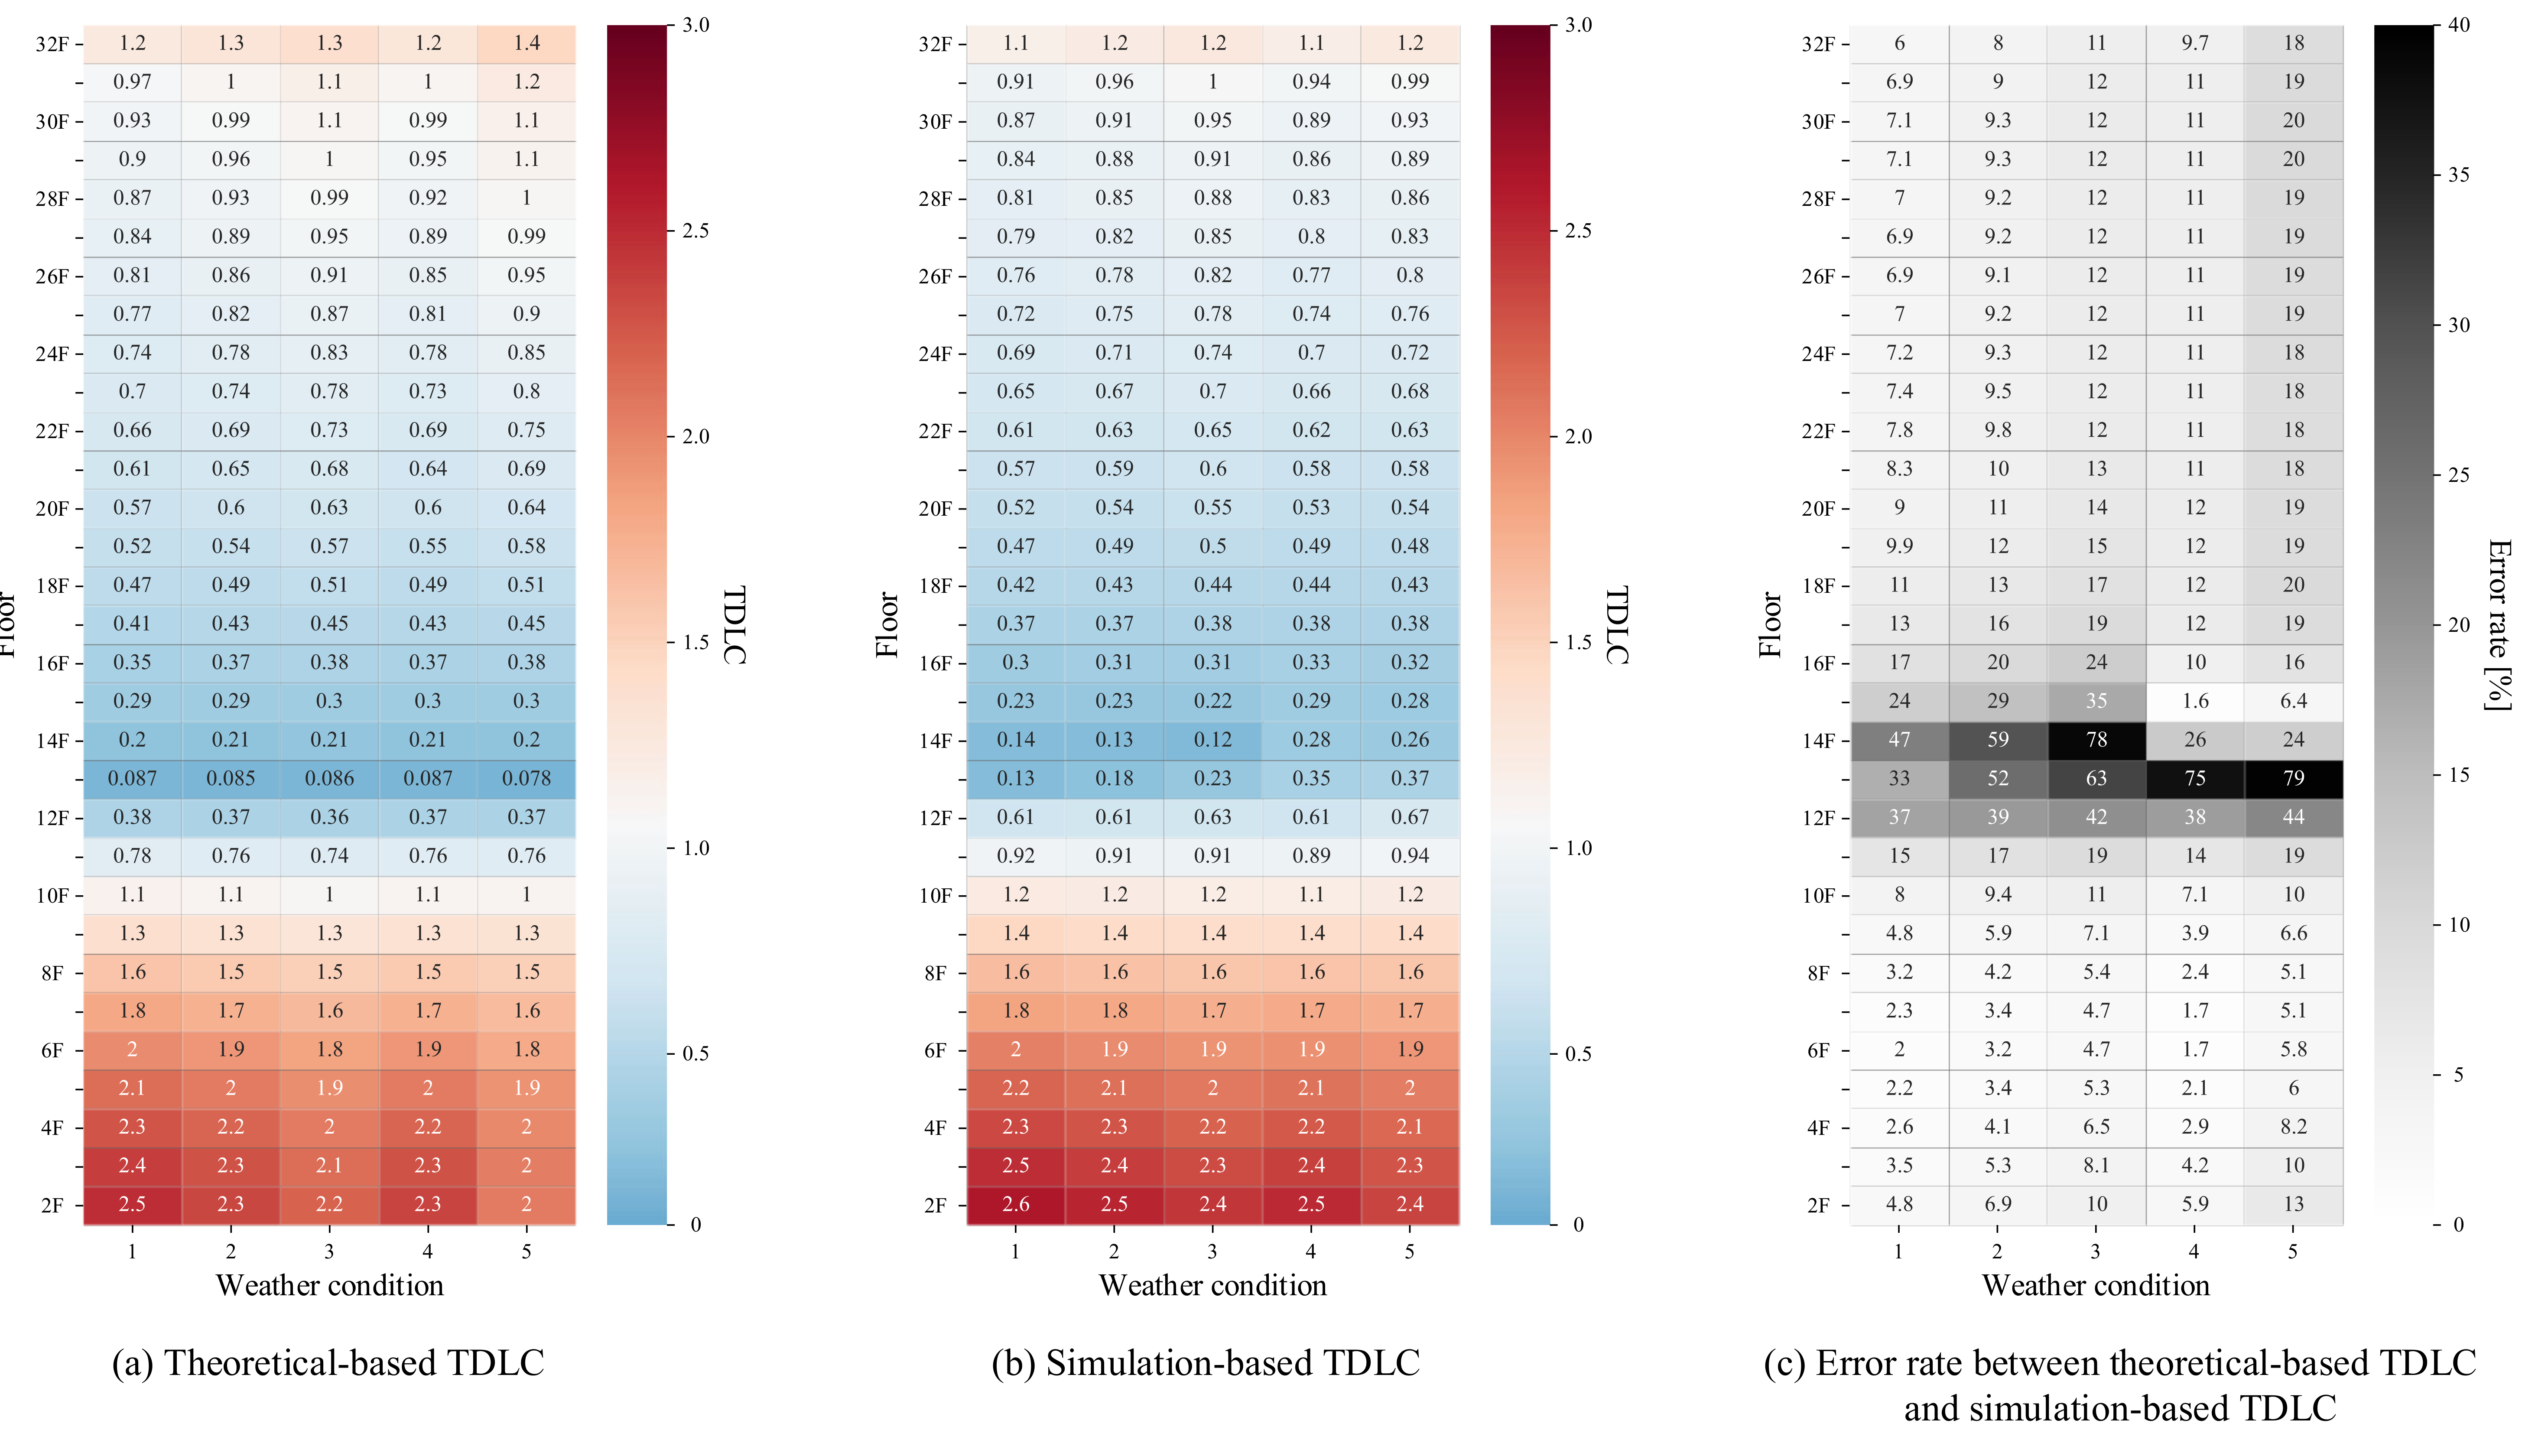
The theoretical-model-based dwelling infiltration rates and its heating load by floor are expressed as a boxplot in Figure 6. Each box includes hourly results, and outliers are removed. Figure 6a shows dwelling infiltration by weather conditions. In stack-dominant conditions (conditions 1, 2, and 3), the amount of infiltration under the NPL (between 12F and 13F in the target building) increased as the distance from the NPL increased. The amount of interzonal airflow above the NPL increased farther away from the NPL. The top floors showed the highest infiltration rates, which were the stack-driven interzonal airflow rates from the corridors, under the five weather conditions. These trends become prominent as the stack effect strengthens. The feature of the stack effect with wind conditions (conditions 4 and 5) was similar to the stack-dominant conditions because wind was not considered in the theoretical model.
As shown in Figure 6b, the heating load of the dwelling infiltration also increased with increasing distance from the NPL. The heating load under the NPL was larger because of the stack-driven outdoor air infiltration temperatures, although the outdoor air infiltration rates were lower than the interzonal airflow rates above the NPL. The heating loads above the NPL were smaller owing to the higher temperatures of the interzonal airflow from the corridors. Specifically, the increasing rate of heating load by the floor on the top floor (32F) was relatively high. This was because the interzonal air temperatures of the corridor were lower on the top than on the other floors owing to the heat transfer with the exterior roof. The stronger the stack effect, the greater the difference in the heating load between floors. In the strong stack effect condition (condition 1), the smallest heating load was 0.15 kWh (average) on 13F near the NPL, and the largest heating load was 4.4 kWh (average) on 2F, showing a 29-fold difference. Conditions 2 and 4 had a difference of 27 times, and conditions 3 and 5 had a 25-times difference. These results indicate the necessity of the TDLC to identify the heating load differences.

5.2. TDLC

By applying the TDLC to the dwelling infiltration heating load, as shown in Figure 6b, the difference between floors can be expressed intuitively, as shown in Figure 7a. The TDLC in Figure 7 was calculated using the average of the hourly dwelling infiltration heating loads by weather conditions. In Figure 7, the theoretical-model-based TDLC, as in Figure 7a, simulation-based TDLC, as in Figure 7b, and their error rates, as in Figure 7c, are expressed as a heatmap. A TDLC of a floor larger than 1 (red) is greater than the average dwelling infiltration heating load of all floors. A TDLC smaller than 1 (blue) implies less than the average load of all floors.
The theoretical TDLC, as shown in Figure 7a, increased as the floor levels decreased (from 13F to 2F) based on the NPL. The maximum TDLC was 2.5 on the lowest floor with condition 1 (strong stack effect), which is 2.5 times greater than the average load of all floors. On the upper floor of the NPL, the TDLC was less than 1, which means less than the average load of all floors. The TDLC increased as the floors increased (from 13F to 32F) and approached approximately 1. From the perspective of weather conditions, the greater the stack effect, the greater the TDLC on the lower floors and the greater the TDLC on the upper floors.
The simulation-based TDLC, as shown in Figure 7b, is generally similar to the theoretical one, as in Figure 7a. In condition 1 (strong stack effect), the average error rate between the theoretical- and simulation-based TDLCs of entire floors was only 10.8%, as shown in Figure 7c. However, the TDLC around the NPL (between 12F and 13F) showed a relatively large difference (maximum 79% on 13F in condition 5). This is because of the wind-driven infiltration occurring around the NPL, where the pressure difference of the stack effect was less. In conditions 4 and 5 (stack effect with wind), the error rate on the upper floors of the NPL was slightly larger than those of conditions 2 and 3 (stack dominant), respectively, because the wind pressure increases with height. For example, the error rate on the top floor was 18% in condition 5 (weak stack effect with wind) and 11% in condition 3 (weak stack effect). Despite the wind effect, the error rate decreased for all floors as the stack effect increased. Therefore, the theoretical-model-based TDLC can be reasonable in winter when the stack effect is dominant.

6. Conclusions

An indicator (the TDLC) was proposed for expressing and evaluating the dwelling infiltration heating load differences between floors in a MFHRB in winter. The TDLC is based on the stack effect and leakage area of the airflow paths, considering the entire building airflow in the MFHRB. To validate the accuracy of the theoretical model, its results were compared with that of a simulation using the airflow and thermal coupled network model. The comparison was performed according to the magnitude of the stack effect and wind, by clustering the weather conditions in winter. The theoretical model satisfied the accuracy criteria of the energy model [33,34] under stack conditions, even though there were errors in the wind-dominated condition. Because the stack effect dominates over the wind in winter, big errors appear only on certain floors around the NPL. The winter average CV(RMSE) and NMBE showed 17.1% and 9.3%, respectively, and they were acceptable. According to the results for the target building, the difference in heating load between floors was significantly large because of the difference in the amount of dwelling infiltration between floors. In particular, the TDLC under the NPL was larger than 1 (a maximum of 2.5) owing to infiltration from the outside. The TDLC above the NPL was smaller than 1 (a minimum of approximately 0.1) owing to the interzonal airflow. As the stack effect became greater, the TDLC under the NPL increased further, and the TDLC above the NPL decreased further.
The theoretical-model-based TDLC can be used in the building design and operation stages. The theoretical-model-based TDLC enables designers or engineers to identify and reduce the heating load differences for each floor in advance by adjusting the leakage area of the main airflow paths in the design stage. In the building operation, the proposed TDLC model can be used with indoor temperature sensors (or indoor environmental sensing systems) to observe the stack-driven dwelling infiltration rates and heating loads in real time. In future research, the proposed TDLC can be extended into the dwelling unit/zone-level models, thus providing detailed information about the zone-level infiltration rates and heating loads for indoor air and environmental management applications. The main leakage areas should be defined by floors or dwelling units for more realistic applications. In addition, it will be necessary to supplement the limitation of the wind effect in the theoretical model.

Author Contributions

Conceptualization, S.Y., H.L., J.B.; Formal analysis, J.B., J.K.; Investigation, J.K.; Writing—original draft preparation, J.B.; Writing—review & editing, S.Y., J.B.; Supervision, S.Y., H.L. All authors have read and agreed to the published version of the manuscript.

Funding

This work was supported by Research Assistance Program (2019) in the Incheon National University. This work was supported by the National Research Foundation of Korea (NRF) grant funded by the Korea government (MSIT) (No. 2021R1F1A1057904).

Institutional Review Board Statement

Not applicable.

Informed Consent Statement

Not applicable.

Data Availability Statement

Not applicable.

Conflicts of Interest

The authors declare no conflict of interest.

Nomenclature

Abbreviation
MFHRBmultifamily high-rise building
TDLCthermal draft load coefficient
NPLneutral pressure level
TDCthermal draft coefficient
RTDCresidential thermal draft coefficient
EqLAequivalent leakage area
CV(RMSE)coefficient of variation of the root mean square error
NMBEnormalized mean bias error
Symbols
Q mass flow rate [kg/s]
ρ air density [kg/m3]
Δ P pressure difference [Pa]
n flow exponent [–]
A equivalent or effective leakage area [m2]
C D discharge coefficient [–]
γ TDC [–]
P a sum of the actual pressure difference at the exterior wall [Pa]
P t sum of the theoretical pressure differences across the exterior wall and the shaft wall [Pa]
Δ P w T pressure difference at the exterior wall on the top floor [Pa]
Δ P w B pressure difference at the exterior wall on the bottom floor [Pa]
Δ P f i pressure difference at the floor on ith floor [Pa]
Δ P s T pressure difference at the wall of the shaft on the top floor [Pa]
Δ P s B pressure difference at the wall of the shaft on the bottom floor [Pa]
Δ P w i pressure difference at the exterior wall on the ith floor [Pa]
Δ P s i pressure difference at the wall of the shaft on the ith floor [Pa]
Δ P p j pressure difference at the jth interior partition [Pa]
C E envelope area ratio correction factor [–]
C ρ air density correction factor [–]
C S shaft ratio correction factor [–]
q load [Wh]
C p specific heat [J/kg∙K]
T air temperature [K]
C cost function of k-means clustering [–]
k number of clusters [–]
x data sample [–]
S dataset [–]
μ centroid (mean of cluster samples) [–]
y ¯ average of the real values [–]
y i real value [–]
y i ^ predicted value [–]
n number of the data [–]
p number of adjustable model parameters [–]
Subscripts
o u t outdoor or from inside to the outside
r e f reference
i ith floor or ith cluster
j jth partition or jth data
k kth household
e n v envelope
e n t household entrance door
l o w e r lower the NPL
u p p e r upper the NPL
m number of partitions
i n from outside to inside
m a i n   e n t main entrance door
a v e average

Appendix A

C E i , j , k = i = 1 K 1 1 A i , j , k 1 n + 1 A i , j + 1 , k 1 n + + 1 A i , m 1 , k 1 n n 1 n 1 1 A i , j , k 1 n + 1 A i , j + 1 , k 1 n + + 1 A i , m 1 , k 1 n n 1 n · A i , j , k 1 n k = 1 K A i , j , k 1 n
A i , j , k = α i , j , k · A i , j , k   ( j   is   household   envelope )
where C E i , j , k is the envelope area ratio correction factor at the jth partition of the kth household on the ith floor (–), A i , j is the leakage area at the jth partition on the ith floor without partition between households in the ideal building (m3/s), K is the number of households, n is the flow exponent (–), α i , j , k is the architectural envelope area at the jth partition of the kth household on the ith floor, and A i , j , k is the leakage area per envelope area.
C ρ i , j , k = 273.15 + T i , R 273.15 + T i , j , k 1 2 n ,   ( Inflow )
C ρ i , j , k = 273.15 + T i , R 273.15 + T i , j + 1 , k 1 2 n ,   ( Outflow )
where C ρ i , j , k is the air density correction factor at the jth partition of the kth household on the ith floor (–), T i , j , k is the air temperature of the previous airflow zone at the jth partition of the kth household on the ith floor (℃), T i , R is the reference air temperature on the ith floor (℃), and n is the flow exponent (–).
C S i = N E L A E L + N S C A S C N E L A E L 1 n
C S V i = N S C 1 A S C 1 n + 1 A V 1 n n + N E L A E L N E L A E L 1 n
where N E L is the number of elevator shafts on the ith floor, N S C is the number of staircase shafts on the ith floor, A E L is the total leakage area of an elevator shaft on the ith floor, A S C is the total leakage area of a staircase shaft on the ith floor, C S i is the shaft ratio correction factor (–) on the ith floor, C S V is the shaft ratio correction factor with vestibule door (–), A V is the leakage area of the vestibule door, and n is the flow exponent (–).
Table A1. Neutral pressure level (NPL) investigated in Korea [29].
Building No.Top Floor (Basement Floor)NPL FloorNPL RatioReference
120 (3)30.15[38]
232 (2)40.14[20]
340 (5)120.30[39]
437 (6)170.45[40]
547 (3)260.55
630 (2)30.10[41]
720 (-)90.48[42]
872 (-)360.50[43]
946 (-)180.39
Average38 (4)140.34-
Table A2. EnergyPlus simulation conditions [29].
Simulation ConditionCompositionDescription
General SetupSimulation periodBegin: 12/01, End: 02/28 (winter season in Korea)
Whether dataEPW (Climate.OneBuilding), Chuncheon, Korea [44]
Airflow network objectAirflow element: Effective leakage area
Simulation control: Multi-zone without distribution
Wind pressure coefficient: Surface average calculation
Thermal performanceU-value (based on the passivhaus standard in Korea [45])Opaque Wall: 0.15 W/m2·K
Window: 0.7 W/m2·K, SHGC: 0.4
MaterialOpaque Wall: No Mass
Window: Simple Glazing System
Leakage areaTypical floorsAs shown in Table 1
Main entrances
Others [20]Rooftop entrance door: 215.53 cm2/item@10 Pa
Top opening of the elevator shaft: 0.83 m2
Mechanical SystemsHeating systemsIdeal Load Air system
Heating set point: 24℃ for households
Operation Schedule: same as the simulation period
Ventilation systemNot modeled
Internal heat gain and scheduleInternal heat gain [46]People: 95 W/person (Zone floor area per person: 35.3 m2/person) Lights: 6.5 W/m2
Electric equipment: 6.7 W/m2
Schedule [47]DOE residential-building reference model

References

  1. Andargie, M.S.; Touchie, M.; O’Brien, W. A review of factors affecting occupant comfort in multi-unit residential buildings. Build. Environ. 2019, 160, 106182. [Google Scholar] [CrossRef]
  2. Song, D.; Lim, H.; Lee, J.; Seo, J. Application of the mechanical ventilation in elevator shaft space to mitigate stack effect under operation stage in high-rise buildings. Indoor Built Environ. 2014, 23, 81–91. [Google Scholar] [CrossRef]
  3. Lee, J.; Song, D.; Park, D. A study on the development and application of the E/V shaft cooling system to reduce stack effect in high-rise buildings. Build. Environ. 2010, 45, 311–319. [Google Scholar] [CrossRef]
  4. Yoon, S.; Song, D.; Kim, J.; Kim, J.; Lim, H.; Koo, J. Identifying stack-driven indoor environmental problems and associated pressure difference in high-rise residential buildings: Airflow noise and draft. Build. Environ. 2020, 168, 106483. [Google Scholar] [CrossRef]
  5. Tamura, G.T. Smoke Movement and Control in High-Rise Buildings. NRC-IRC. 1971. Available online: https://nrc-publications.canada.ca/eng/view/object/?id=af1afd4c-f8d6-4daf-8d2b-0aea9bf0089e (accessed on 5 January 2022).
  6. Suh, H.; Kim, B.S.; Kim, T.; Lim, J. Influence analysis of stack effect on odor dispersion from unit to core in the high-rise residential buildings. Proc. Build. Sumulation 2007, 1062–1068. [Google Scholar]
  7. Mao, J.; Yang, W.; Gao, N. The transport of gaseous pollutants due to stack and wind effect in high-rise residential buildings. Build. Environ. 2015, 94, 543–557. [Google Scholar] [CrossRef]
  8. Li, Y.; Duan, S.; Yu, I.; Wong, T. Multi-zone modeling of probable SARS virus transmission by airflow between flats in Block E, Amoy Gardens. Indoor Air 2005, 15, 96–111. [Google Scholar] [CrossRef] [PubMed]
  9. Yoon, S.; Song, D.; Kim, J.; Lim, H. Stack-driven infiltration and heating load differences by floor in high-rise residential buildings. Build. Environ. 2019, 157, 366–379. [Google Scholar] [CrossRef]
  10. Meiss, A.; Feijo-Munoz, J. The energy impact of infiltration: A study on buildings located in north central Spain. Energy Effic. 2014, 8, 51–64. Available online: https://0-link-springer-com.brum.beds.ac.uk/article/10.1007/s12053-014-9270-x (accessed on 5 January 2022). [CrossRef]
  11. Emmerich, S.J.; Persily, A.K.; McDowell, T.P. Impact of infiltration on heating and cooling loads in U.S. office buildings. In Proceedings of the 26th IEA Conference of the Air Infiltration and Ventilation Center 2005, Brussels, Belgium, 21–23 September 2005; Available online: https://www.researchgate.net/publication/265919110 (accessed on 5 January 2022).
  12. Jones, B.; Das, P.; Chalabi, Z.; Davies, M.; Hamilton, I.; Lowe, R.; Mavrogianni, A.; Robinson, D.; Taylor, J. Assessing uncertainty in housing stock infiltration rates and associated heat loss: English and UK case studies. Build. Environ. 2015, 92, 644–656. [Google Scholar] [CrossRef] [Green Version]
  13. Emmerich, S.J.; Persily, A.K. Energy impacts of infiltration and ventilation in U.S. office buildings using multi-zone airflow simulation. In IAQ & Energy 98; American Society of Heating, Refrigerating and Air-Conditioning Engineers: Atlanta, GA, USA, 1998; pp. 191–203. [Google Scholar]
  14. Shi, S.; Chen, C.; Zhao, B. Air infiltration rate distributions of residences in Beijing. Build. Environ. 2015, 92, 528–537. [Google Scholar] [CrossRef]
  15. Hong, G.; Kim, B.S. Field measurements of infiltration rate in high rise residential buildings using the constant concentration method. Build. Environ. 2016, 97, 48–54. [Google Scholar] [CrossRef]
  16. Bak, J.; Yoon, S.; Song, D.; Kim, Y. Weather-driven infiltration and interzonal airflow in a multifamily high-rise building: Dwelling infiltration distribution. Build. Environ. 2020, 181, 107098. [Google Scholar] [CrossRef]
  17. Kang, J.; Lee, S.; Ahn, T. A study on characteristics of energy consumption in apartment buildings. J. Archit. Inst. Korea 1995, 11, 139–148. (In Korean) [Google Scholar]
  18. Jang, H.; Kang, J. An energy model of high-rise apartment buildings integrating variation in energy consumption between individual units. Energy Build. 2018, 158, 656–667. [Google Scholar] [CrossRef] [Green Version]
  19. Song, D.; Kim, Y.S. Effects of vertical meteorological changes on heating and cooling loads of super tall buildings. Int. J. High-Rise Build. 2012, 1, 81–85. [Google Scholar]
  20. Yoon, S.; Seo, J.; Cho, W.; Song, D. A calibration method for whole-building airflow simulation in high-rise residential buildings. Build. Environ. 2015, 85, 253–262. [Google Scholar] [CrossRef]
  21. Kim, J.; Yoon, S.; Koo, J.; Bak, J.; Kim, Y. TDC-based horizontal leakage area estimation in multiunit residential buildings: Three correction factors. Build. Environ. 2021, 192, 107630. [Google Scholar] [CrossRef]
  22. DOE. EnergyPlus 9.2.0; Department of Energy: Washington, DC, USA, 2019; Available online: https://energyplus.net/downloads (accessed on 5 January 2022).
  23. Dols, W.S.; Polidoro, B.J. CONTAMW User Guide and Program Documentation Version 3.2; Technical Note (NIST TN): Gaithersburg, MD, USA, 1887. [Google Scholar]
  24. ASHRAE. Chapter 25: Ventilation and Infiltration. In ASHRAE Handbook—Fundamentals; American Society of Heating, Refrigerating and Air-Conditioning Engineers: Atlanta, GA, USA, 1997. [Google Scholar]
  25. Hayakawa, S.; Togari, S. Study on the stack effect of tall office building. J. Archit. Inst. Jpn. 1988, 387, 42–52. [Google Scholar]
  26. Jo, J.; Lim, J.; Song, S.; Yeo, M.; Kim, K. Characteristics of pressure distribution and solution to the problems caused by stack effect in high-rise residential buildings. Build. Environ. 2007, 42, 263–277. [Google Scholar] [CrossRef]
  27. Jo, J. Prediction of Pressure Distribution Due to Stack Effect in High-Rise Residential Buildings and Evaluation of its Impact. Ph.D. Thesis, Seoul National University, Seoul, Korea, 2005. [Google Scholar]
  28. Bae, S.; Lee, B.; Hong, C. A Research on the Actual Condition of the Leakage Area of the Building Elements; Korean Institute of Fire Science & Engineering: Seoul, Korea, 2004; pp. 158–162. [Google Scholar]
  29. Bak, J.; Yoon, S. Dwelling infiltration and heating energy demand in multifamily high-rise and low-energy buildings in Korea. Renew. Sustain. Energy Rev. 2021, 148, 111284. [Google Scholar] [CrossRef]
  30. DOE. EnergyPlus Engineering References-EnergyPlus Manual Documentation; The Board of Trustees of the University of Illinois and the Regents of the University of California through the Ernest Orlando Lawrence Berkeley National Laboratory; Department of Energy: Washington, DC, USA, 2014. [Google Scholar]
  31. Akins, R.E.; Peterka, J.A.; Cermak, J.E. Averaged pressure coefficients for rectangular buildings. In Proceedings of the Fifth International Wind Engineering Conference 1979, Fort Collins, CO, USA, 8–14 July 1979; pp. 369–380. [Google Scholar]
  32. Purnima, B.; Arvind, K. EBK-Means: A Clustering Technique based on Elbow Method and K-Means in WSN. Int. J. Comput. Appl. 2014, 105, 17–24. Available online: https://www.ijcaonline.org/archives/volume105/number9/18405-9674 (accessed on 5 January 2022).
  33. ASHRAE Guideline 14-2014. Measurement of Energy and Demand Savings; Technical Report; American Society of Heating, Ventilating, and Air Conditioning Engineers: Atlanta, GA, USA, 2014. [Google Scholar]
  34. ASHRAE Guideline 14-2002. Measurement of Energy and Demand Savings; Technical Report; American Society of Heating, Ventilating, and Air Conditioning Engineers: Atlanta, GA, USA, 2002. [Google Scholar]
  35. Ruiz, G.R.; Bandera, C.F. Validation of calibrated energy models: Common errors. Energies 2017, 10, 1587. [Google Scholar] [CrossRef] [Green Version]
  36. Reddy, T.A.; Maor, I.; Jian, S.; Panjapornporn, C. Procedures for Reconciling Computer-Calculated Results with Measured Energy Data; Technical Report; American Society of Heating, Refrigerating and Air-Conditioning Engineers: Atlanta, GA, USA, 2006. [Google Scholar]
  37. Robertson, J.; Polly, B.; Collis, J. Evaluation of Automated Model Calibration Techniques for Residential Building Energy Simulation; Technical Report; NREL Technical Report 5500-60127; National Renewable Energy Laboratory (NREL): Golden, CO, USA, 2013. [Google Scholar]
  38. Yoon, S.; Seo, J.; Lee, J.; Song, D. A Study on the Pressure Distribution in High-Rise Residential Building; The Society of Air-Conditioning and Refrigerating Engineers of Korea: Seoul, Korea, 2010; pp. 413–419. [Google Scholar]
  39. Jo, J.; Yeo, M.; Kim, K. Simulation of Pressure Distribution and Solving the Pressure Differentials Problem in High-Rise Residential Buildings; Architectural Institute of Korea: Seoul, Korea, 2005; pp. 269–276. [Google Scholar]
  40. Jo, J.; Yeo, M.; Kim, K. Pressure Distribution due to Stack Effect in High-Rise Residential Buildings; Architectural Institute of Korea: Seoul, Korea, 2005; pp. 207–214. [Google Scholar]
  41. Seo, J. A Study on the Analysis of Interactions between Countermeasures for Stack Effect in High-Rise Buildings. Ph.D. Thesis, Sungkyunkwan University, Suwon, Korea, 2013. [Google Scholar]
  42. Seo, J.; Park, D.; Lee, J.; Song, D. Study on the Characteristics of Pressure Distribution due to the Stack Effect in Residential Buildings; Korea Institute of Architectural Sustainable Environment and Building Systems: Seoul, Korea, 2008; pp. 129–133. [Google Scholar]
  43. Lee, K.; Kim, S.; Park, Y.; Moon, J.; Sohn, J. A Study on the Air Tightness Performance and Stack Effect Characteristics in High-Rise Apartments; Architectural Institute of Korea: Seoul, Korea, 2005; pp. 279–286. [Google Scholar]
  44. Climate OneBuilding, Repository of Free Climate Data for Building Performance Simulation. Available online: https://climate.onebuilding.org/default.html (accessed on 5 January 2022).
  45. PHIKO, Passive House Institute Korea 2018. Available online: http://www.phiko.co.kr (accessed on 5 January 2022).
  46. DOE, Building Energy Codes Program, U.S. Department of Energy. Available online: https://www.energycodes.gov/development/commercial/prototype_models#90.1 (accessed on 5 January 2022).
  47. Deru, M.; Field-Macumber, K. National Renewable Energy Laboratory, Energy Savings Modeling and Inspection Guidelines for Commercial Building Federal Tax Deductions for Buildings in 2016 and Later. Available online: https://www.energy.gov/sites/prod/files/2016/09/f33/Energy%20Savings%20and%20Modeling%20and%20Inspection%20Guidelines%20NREL%202016.pdf (accessed on 5 January 2022).
Figure 1. Air-driving forces and the associated heating load differences between floors in a MFHRB.
Energies 15 01386 g001
Figure 2. Development process of the theoretical models to calculate TDLC.3. Airflow and energy simulation method.
Energies 15 01386 g002
Figure 3. Floor plan and cross section of the target building [16].
Energies 15 01386 g003
Figure 4. Five climatic conditions classified by k-means cluster.
Energies 15 01386 g004
Figure 5. The accuracy of the theoretical model against the simulation model.
Energies 15 01386 g005
Figure 6. The dwelling infiltration and heating load by floor under the clustered weather conditions.
Energies 15 01386 g006
Figure 7. The TDLC (Thermal Draft Load Coefficient) and its error rate by clustered weather conditions.
Energies 15 01386 g007
Table 1. Leakage area applied to theoretical model and simulation model.
FloorMain Horizontal Airflow PathInvestigated Leakage Areas *Adjusted Leakage Areas to Fit the Average NPL *
Typical floorEnvelope [cm2/m2 @10 Pa]1.21~1.51 [26]1
1.32~1.74 [16]
1.37~2.69 [16]
2.05 [20]
1.41~2.77 [16]
3.27~3.40 [16]
Entrance door17 [20]70
70 [26]
103 [27]
225.21 [28]
Elevator door325 [26]120
517.44 [28]
Vestibule door163.5 [16,29]163.5
Stairwell door219.45 [16,29]219.45
Main entrances1st FloorMain entrance door (Automatic door)1000 [29], 3685.32 [16]5000
Vestibule door (Swing)6445.97 [16,29]6445.97
B1Main entrance door (Swing)1000 [29], 6769.95 [16]5000
Vestibule door (Swing)2105.05 [16,29]2105.05
B2Main entrance door (Swing)1000 [29], 3205.60 [16]5000
Vestibule door (Swing)2215.08 [16,29]2215.08
*: Unit of leakage area: cm2/item@10Pa, discharge coefficient: 0.611, and flow exponent: 0.65.
Publisher’s Note: MDPI stays neutral with regard to jurisdictional claims in published maps and institutional affiliations.

