Identifying Influential Nodes of Complex Networks Based on Trust-Value


School of Computer Science and Engineering, Central South University, Changsha 410083, China
*
Author to whom correspondence should be addressed.
Algorithms 2020, 13(11), 280; https://0-doi-org.brum.beds.ac.uk/10.3390/a13110280
Submission received: 17 September 2020
/
Revised: 27 October 2020
/
Accepted: 4 November 2020
/
Published: 5 November 2020
(This article belongs to the Special Issue Algorithms for complex network and its applications)
Abstract
:The real world contains many kinds of complex network. Using influence nodes in complex networks can promote or inhibit the spread of information. Identifying influential nodes has become a hot topic around the world. Most of the existing algorithms used for influential node identification are based on the structure of the network such as the degree of the nodes. However, the attribute information of nodes also affects the ranking of nodes’ influence. In this paper, we consider both the attribute information between nodes and the structure of networks. Therefore, the similarity ratio, based on attribute information, and the degree ratio, based on structure derived from trust-value, are proposed. The trust–PageRank (TPR) algorithm is proposed to identify influential nodes in complex networks. Finally, several real networks from different fields are selected for experiments. Compared with some existing algorithms, the results suggest that TPR more rationally and effectively identifies the influential nodes in networks.
1. Introduction
Complex networks simplify the complex systems that are found in the real world. The research on complex networks can help people to deeply understand them, such as their internal dynamic evolution and for behavior prediction [1,2,3]. Some nodes in complex networks play key roles in the information dissemination of entire networks; these are called influential nodes. Identifying influential nodes in complex networks is an important direction in the field of complex network research [4], and has practical value for information dissemination in real-world networks [5], spread of infectious diseases [6], product promotion [7,8], etc. This task can effectively reduce economic cost and avoid economic loss to a certain extent [9]. For example, in traffic networks [10], the identification of the influential nodes of roads can be used as an important reference for road resource allocation and flow diversion. Identifying the influential nodes in biological networks [11] can provide auxiliary means for disease treatment and understanding of biological information.
In recent decades, from structural centrality and iterative refinement of centrality to dynamic operation based on nodes, many algorithms for identifying influential nodes have been proposed in the field of complex networks. For instance, the degree centrality (DC) [12] algorithm judges the importance of the nodes by counting the number of their directly connected neighbor nodes. Chen et al. [13] considered the semi-local information of nodes and proposed semi-local centrality. Betweenness centrality (BC) [14] describes the ability of nodes to control the information flow along the shortest path in the network. Newman [15] considered that the shortest paths were more important than the non-shortest paths in the process of information propagation, and proposed the random walk betweenness centrality. The K-shell [16] algorithm strips the nodes in the outer layer of the network, and considers the nodes at the core of the network has having strong influence. As a node deletion method, it can avoid problems arising from the unsuitable selection of attributes and indicators during the analysis of social networks by reverse thinking [17]. The feature vector centrality [12] uses the influence value of adjacent nodes as their influence indicator. The PageRank (PR) [18] algorithm is a variant of feature vector centrality. As a web page sorting algorithm applied in the Google search engine, PageRank considers each web page as a node and hyperlinks between pages as edges between nodes. The influence indicator of the node is defined as the PR value. Each node evenly distributes its PR value to neighboring nodes. The LeaderRank algorithm proposed by Lü et al. [19] identifies influential nodes using the idea of the random walk, which performs well in directed networks. Kleinber proposed an algorithm named HITS that assigns each node an authority value and a hub value, which affect each other as the indicator used to evaluate the influence of nodes [20]. In recent years, some algorithms based on the H-index have been proposed [21,22]. The H-index is an indicator based on citation frequency in the paper citation network [23]. These are essentially node-degree-based algorithms.
The above algorithms describe the influence of nodes from different perspectives and each method has its own advantages, but they also have certain limitations. For example, DC is the most intuitive algorithm but does not consider the location of nodes or the influence of surrounding nodes [24]; K-shell often assigns the same influence value to a large number of nodes in some special networks, such as tree networks. PageRank distributes its own PR values evenly to adjacent nodes, which are deviated from actual cognition. BC and the algorithms based on node deletion or contraction are time-consuming, and some algorithms are not effective in disconnected networks. For example, the node deletion method cannot distinguish the influence of nodes that make the network no longer connected after deletion [25].
Most of the above algorithms are based on the topology of the network, and do not consider the attribute information between nodes, where the structures of networks have certain limitations in expressing nodes’ information. The interaction between nodes in networks may also affect the importance of the nodes. For example, in a social network, if there are more commonalities between two individuals, the more similar they are, the more they trust each other, and the more information they may exchange. In addition, if an individual has correlation with more individuals in the network, then transmitting information to the individual will facilitate the rapid spread of information throughout the network. Gu proposed an algorithm based on LeaderRank and nodes’ similarity but only considered the number of nodes pointed in and pointed out [26].
Inspired by the PageRank algorithm and considering the attribute information between nodes, we constructed a new algorithm for identification of influential nodes, trust–PageRank (TPR), by combining the trust-value and PageRank algorithm. The algorithm considers the topology characteristics of networks and the interaction behavior between nodes to avoid one-sidedness of the evaluation. We introduce the trust–PageRank algorithm in detail in Section 2. In Section 3, the TPR, DC, BC, PageRank, and HITS algorithms are applied to the specific real network and compared. The results show that the TPR algorithm can reasonably and effectively identify the influential nodes of complex networks and can effectively distinguish the nodes with similar influence. Section 4 concludes our work as well as its prospects.
2. Methods
In this section, we first provide an overview of the PageRank algorithm, then we introduce the basic idea inspired by PageRank, and some definitions are proposed, including the similarity ratio, the degree ratio, the trust-value, and the trust–PageRank algorithm. The trust–PageRank algorithm is the main idea proposed in this paper, which can be seen as a combination of PageRank and the trust-value. The trust-value consists of similarity ratio and degree ratio, inspired by the process of information transmission in real life.
2.1. Basic Idea
PageRank is generated from web page sorting, which is not only the core of Google and other search engines, but also currently used to rank data in various network environments. PageRank is popular due to both its perceived effectiveness and its easy-to-understand philosophy, rather than ranking objects based on difficult-to-measure intrinsic qualities [27]. As mentioned above, in PageRank, pages are abstracted to nodes and hyperlinks are abstracted to edges. The influence indicator of nodes in PageRank is defined by the PR value. One node’s PR value depends on the importance of other nodes pointing to this node. One node has a higher PR value if it has many edges from other high-PR nodes. In PageRank, each node has an initial PR value, which stabilizes after continuous iteration. In this process, a web user may not only jump to an adjacent web page from some web page with a random probability, but also jump to any web page with an additional probability. The PR value of node i at time t is defined as
where n is the number of nodes in the network, is the set of neighbors of node i, is the jump probability, and represents the count of nodes to which node j points.
In the PageRank algorithm, each node distributes its own PR value evenly to neighboring nodes. However, the probability and amount of information exchanged between nodes in the actual network are largely not average allocations. In the process of information dissemination in the network, to simplify the description, it is assumed that only one node needs to transmit information through the network. To transmit the information to all nodes at a faster rate, the node spreads the information to all nodes in a set of its neighbors, and nodes that are more “trustworthy” will receive more information until the network reaches a steady state, or the algorithm reaches a certain number of iterations, which is consistent with our perception in reality.
Inspired by this phenomenon, we propose a trust-value concept that consists of the similarity ratio and the degree ratio. In this section, we explain similarity ratio, degree ratio, and trust-value in detail. Finally, we introduce the proposed trust–PageRank algorithm.
Herein, the network is represented by , where V represents the nodes set of networks and E represents the edge set. The adjacent matrix of the network G is . In the undirected network, if there is an edge between the nodes and , then . is the number of nodes in the network and is the number of edges in the network. Table 1 provides the definitions of symbols that will be used below.
2.2. The Similarity Ratio
In social networks, if two individuals have common hobbies, they have quite a few similarities, to some extent, which means they interact with each other more frequently and exchange more information with each other. Conversely, the similarity between individuals is relatively low if there is no intersection between them; accordingly, they may not interact frequently. Thus, we define the similarity ratio as:
Definition 1.
The similarity ratio of a node to an adjacent node is the value of the similarity between the two nodes divided by the sum of the similarity between the adjacent node and its neighbor nodes. The similarity ratio of node i to adjacent node j is defined in Equation (2).
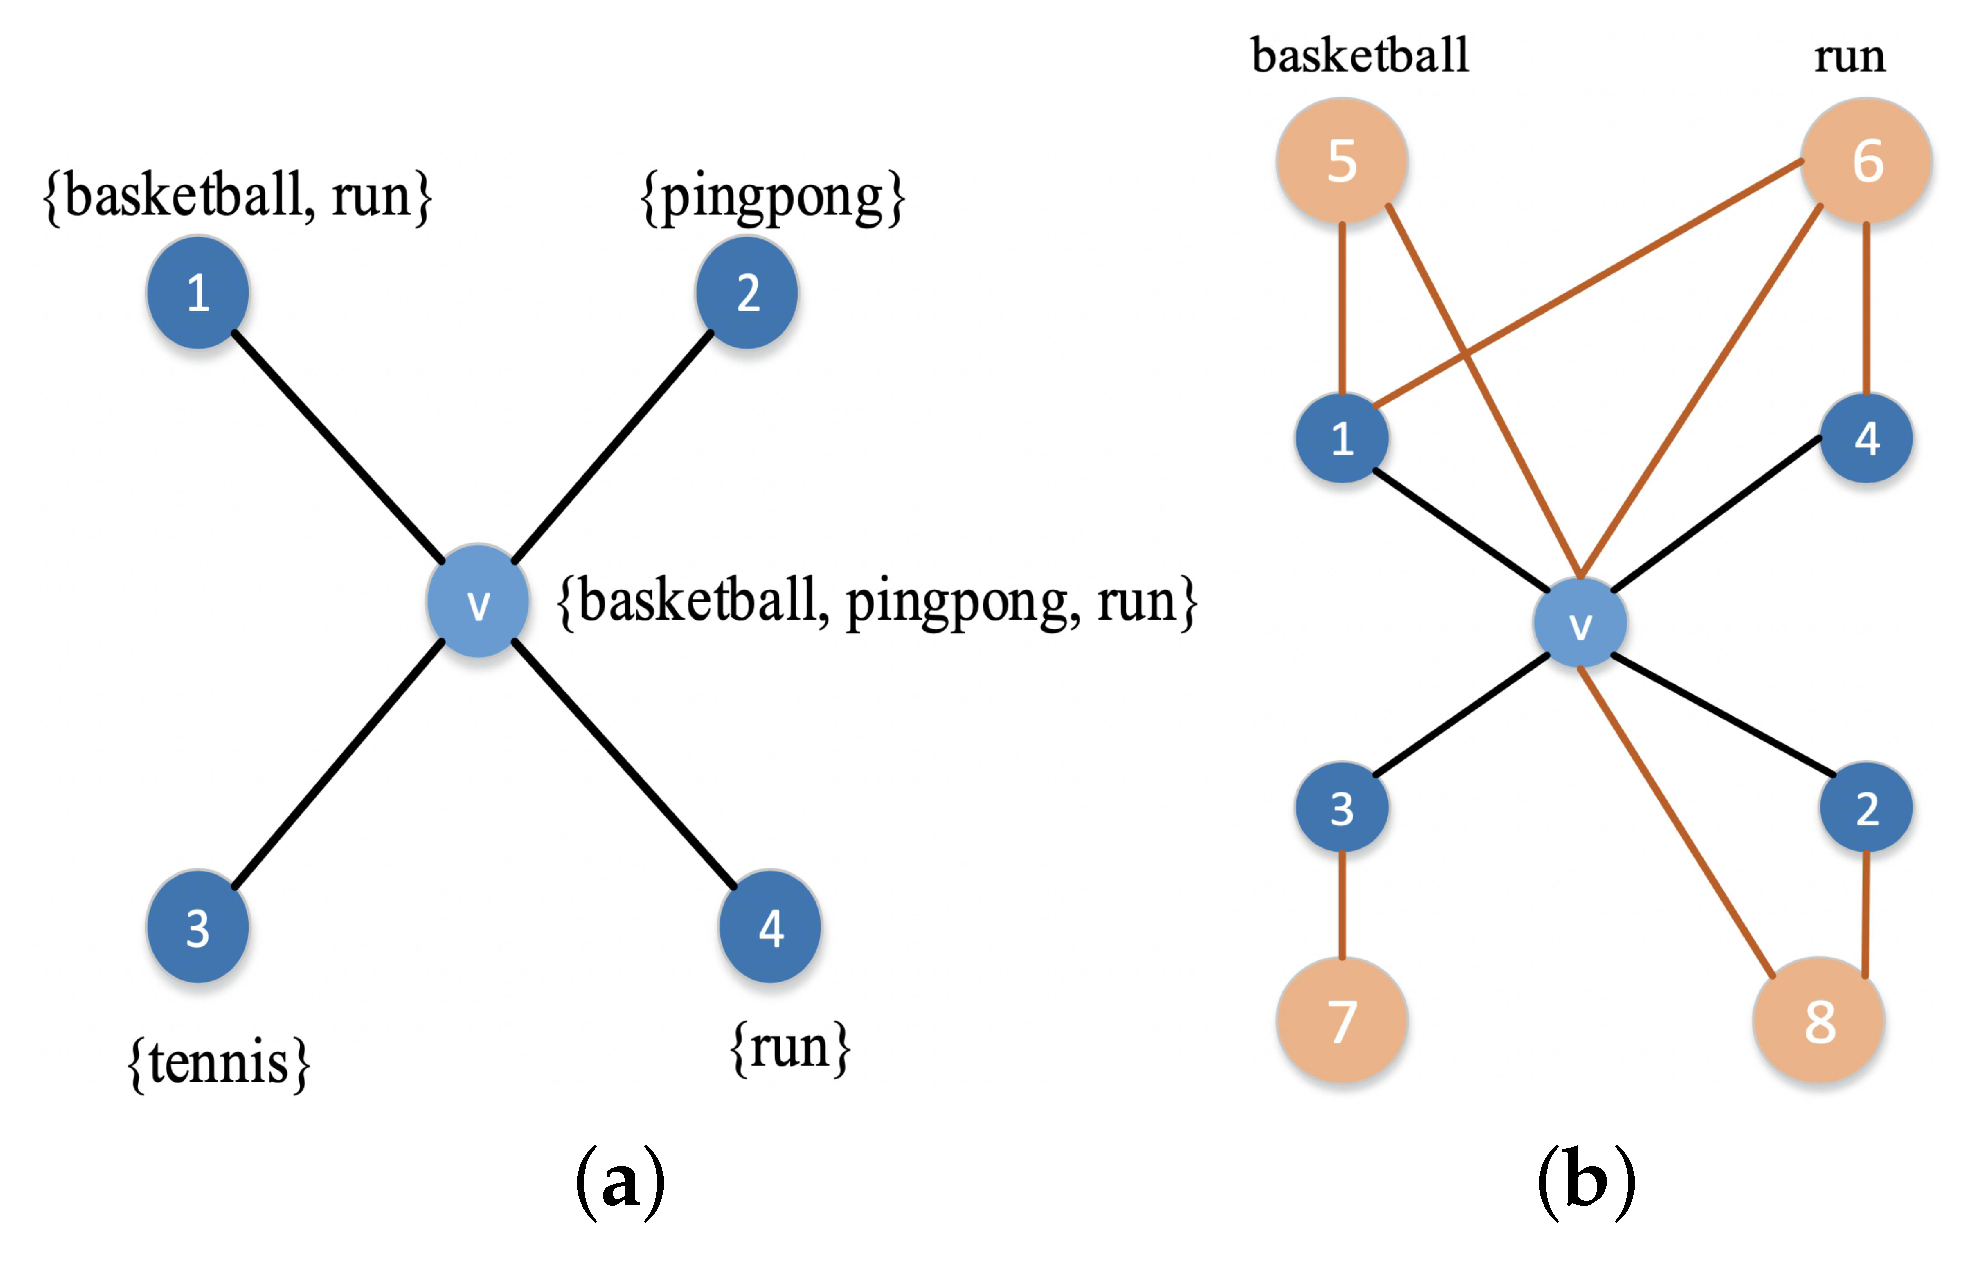
Assume there is a network as shown in Figure 1a. The hobby sets of nodes v, 1, 2, 3, and 4 are , , , , and , respectively. Their values are shown in Table 2.
If the similarity of nodes i and j is defined as
where , , , and , and the ratios of the similarity of nodes 1, 2, 3, and 4 to the summation of node v are , , , and , respectively.
If each hobby set of one node is treated as a set of neighbor nodes, as shown in Figure 1b, the similarity between the nodes is determined by their common neighbor nodes. The more similar the neighbor nodes of two nodes, the more similar these two nodes. In addition, the purpose of Equation (3) is only to illustrate the idea that the similarity of nodes depends on the similarity of their neighbor nodes. Here, we use the SimRank [28] algorithm for calculating similarity.
In SimRank, two objects are similar if they are related to similar objects. Just like a social network, if two individuals have more common or similar neighbors, they will be more similar to each other. In SimRank, the similarity between a and b is defined as
where C is a constant that represents an attenuation factor. The value of C does not affect the results, since only the ratio of similarity is calculated in the experiments. In this paper, C is taken as 1. represents the ith neighbor node of node a. If or is an empty set, then . To prevent the case where the divisor is 0 in Equation (4), is defined. As we can see from Equation (4), how to calculate in SimRank is an iterative process. Thus, before starting the iteration, we initialize to 1 if while to if .
2.3. The Degree Ratio
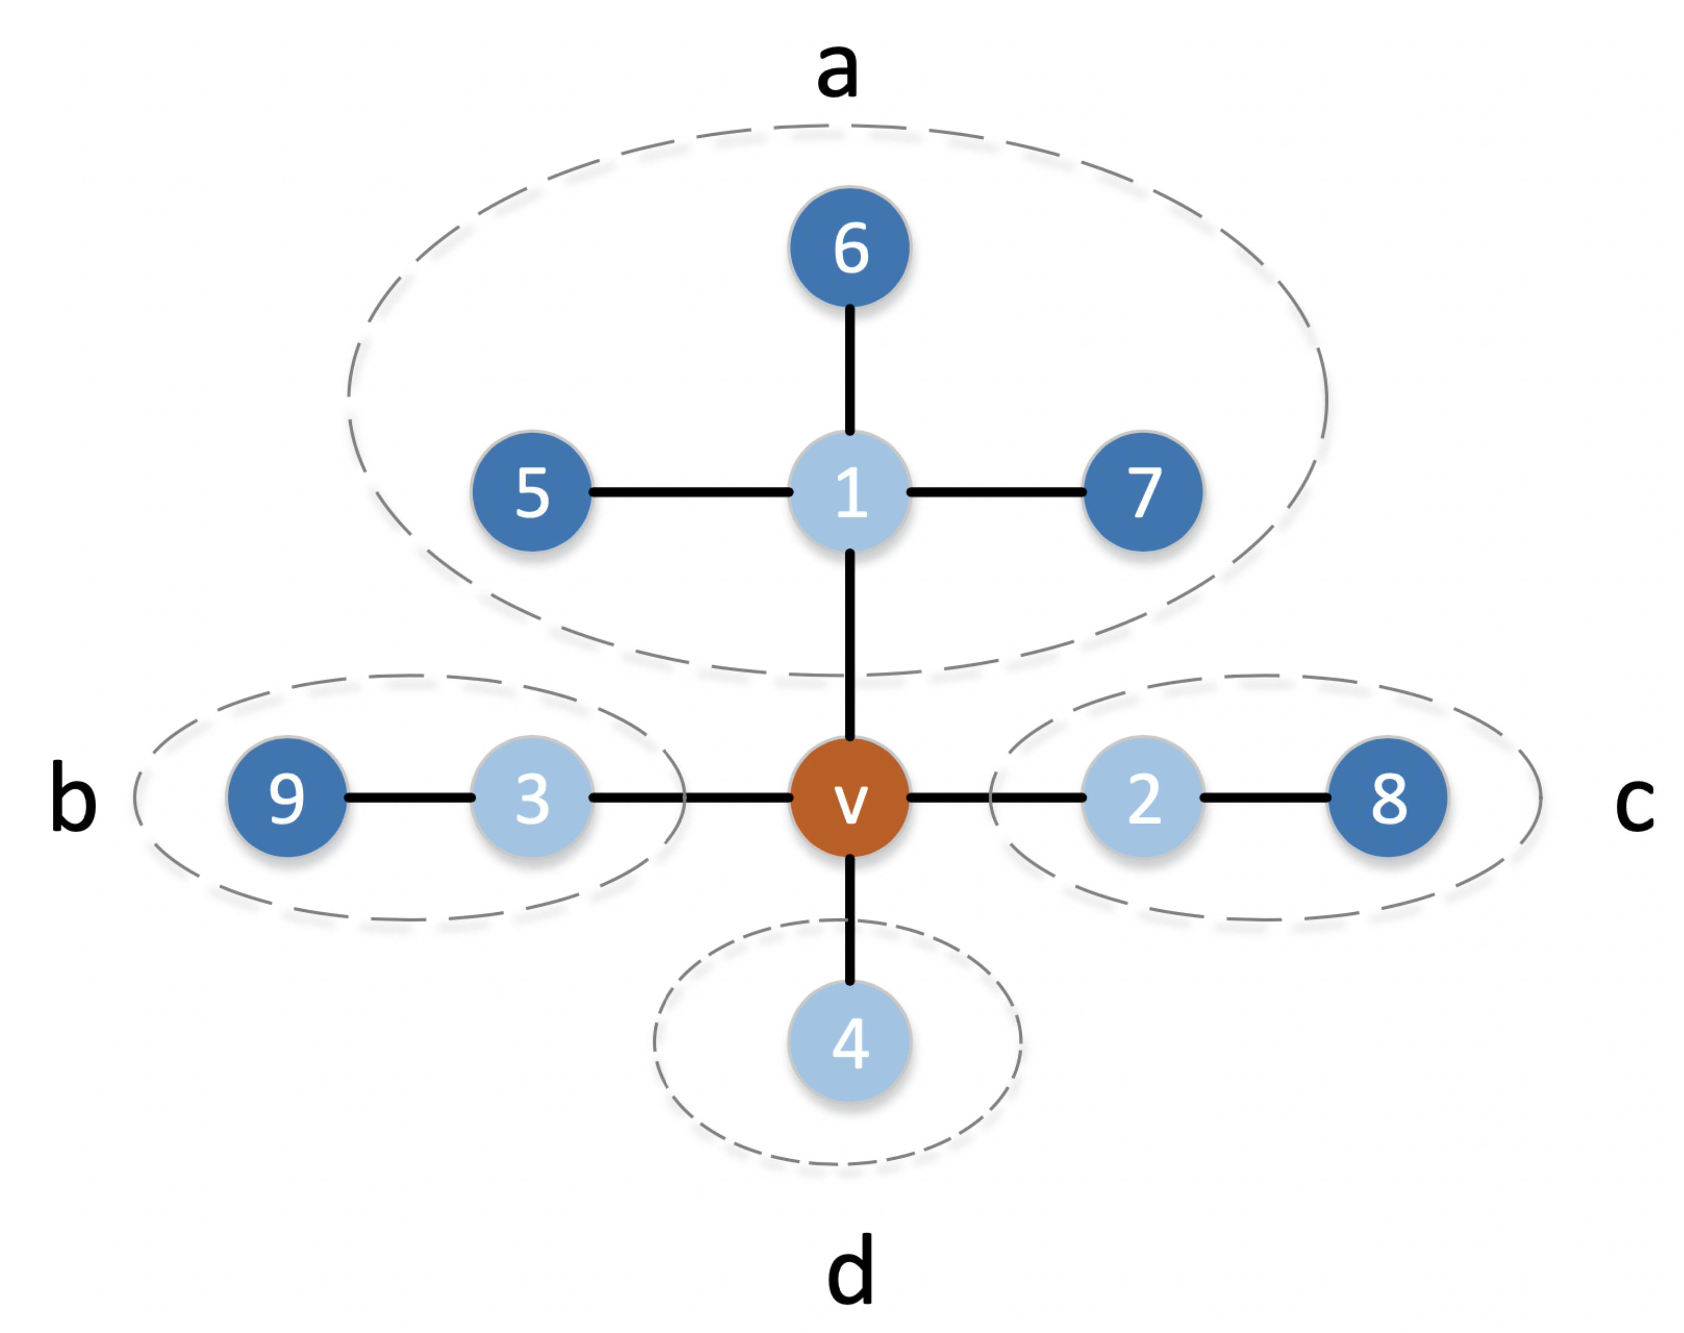
In the network, the higher the degree of a node, the wider the range in contact with surrounding nodes. If a node needs to propagate information, then propagating the information to the neighbor nodes with larger degrees will benefit the information spread. However, it is one-sided to propagate the information only to the node with the largest value. As an example, as shown in Figure 2, if node v only propagates information to node 1 with the highest degree, then regions b, c, and d will not receive any transmitted information. To spread the information to all corners as quickly as possible, we propose the degree ratio with the number of neighbor nodes and their degree at overall consideration.
Definition 2.
The degree ratio of node i to its adjacent node j is the ratio of the degree of node i to the sum of the degree of adjacent nodes of j as shown in Equation (5):
2.4. The Trust-Value
The degree of trust between nodes in the network is composed of the similarity ratio of the node based on the attribute information and the degree ratio based on the topology.
Definition 3.
The trust-value of node i to adjacent node j depends on the similarity ratio and degree ratio of j to i. The greater the degree of adjacent node, the more similar the two nodes and the higher the trust-value. The trust-value of node j to i is defined as
Normally, . In this paper, we discuss the value of k in Section 3.
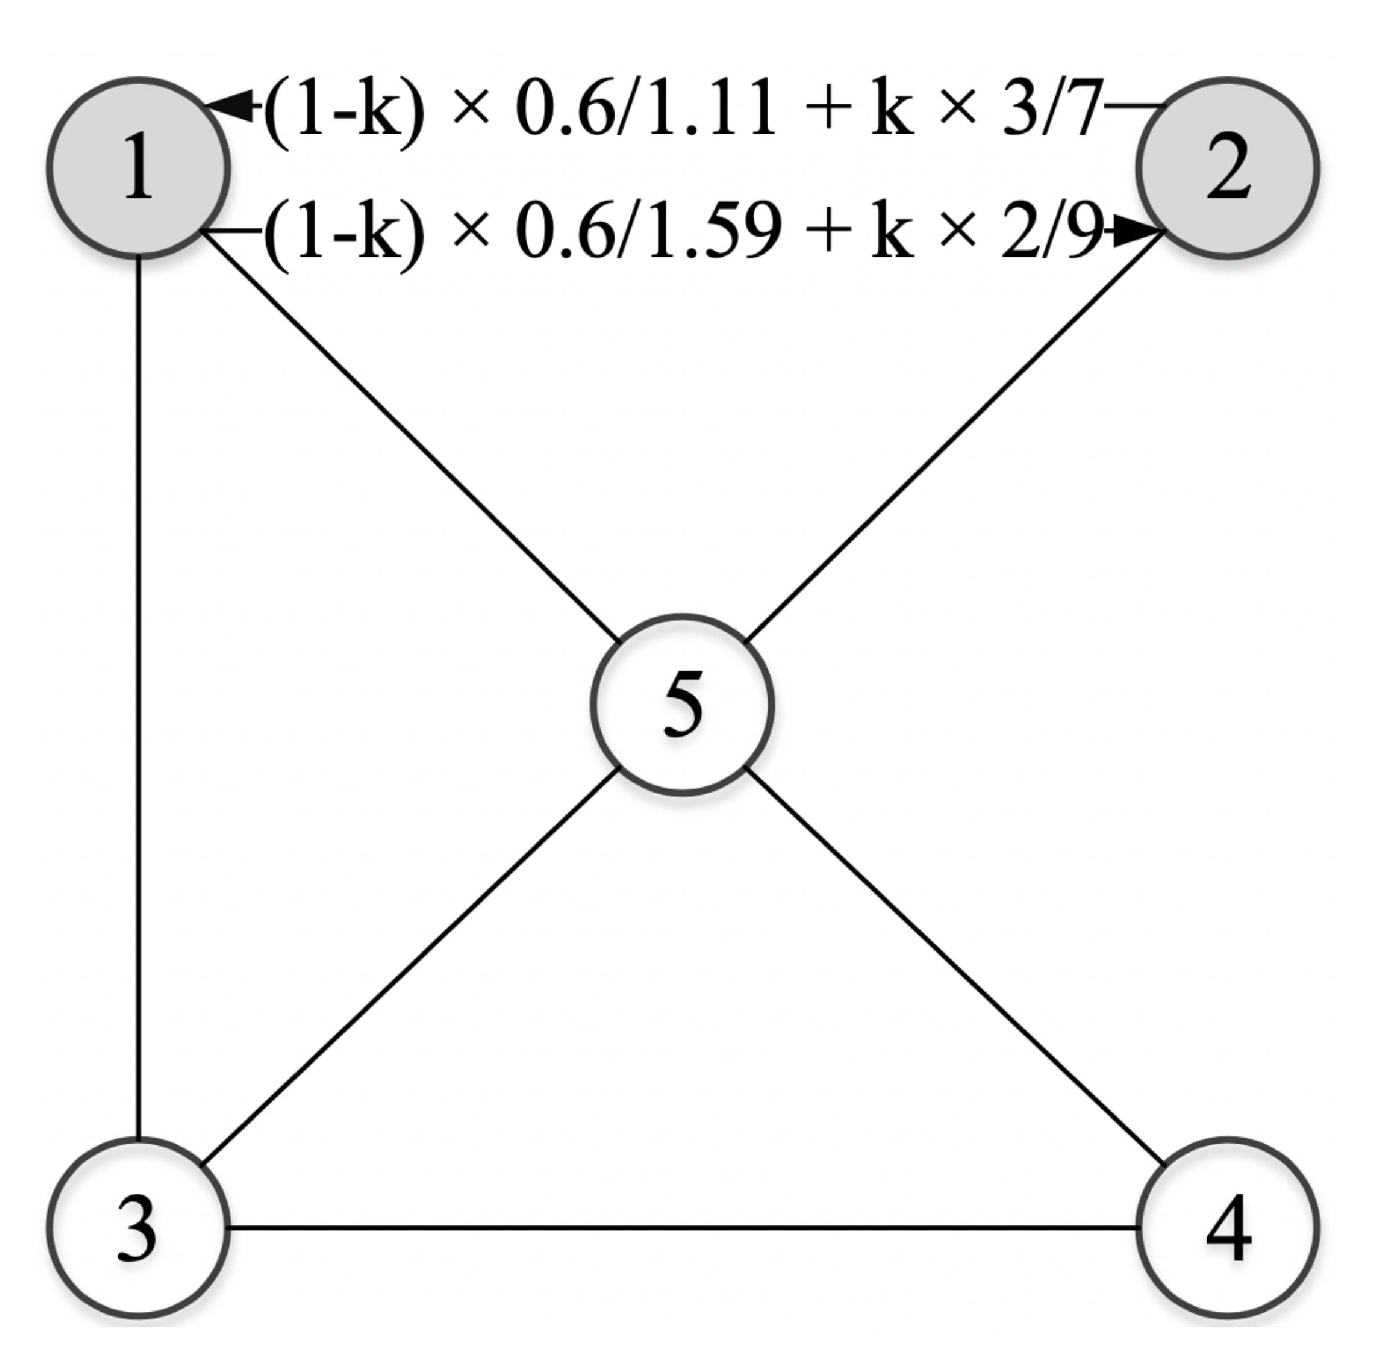
In the network shown in Figure 3, there are 5 nodes. The sum of the degree of all their adjacent nodes is , , , , and . Table 3 shows the similarities between nodes. In Figure 3, nodes 1 and 2, and nodes 3 and 4 have similar characteristics. So, they have the same similarities, both of which are , as shown in Table 3. This is consistent with our intuitive observation. Combining the similarity ratio and the degree ratio, Figure 3 depicts the calculation process of the trust-value between nodes 1 and 2.
2.5. Trust–PageRank Algorithm
Information is transmitted to adjacent nodes according to the trust-value. Nodes with higher trust-value receive more information. By introducing trust-value into PageRank to identify the influential nodes, the trust–PageRank (TPR) algorithm was constructed.
Definition 4.
In the process of the iterative voting of trust-PageRank, the influence of node i at time t is defined as
where denotes the trust-value of node j to node i obtained by Equation (6), n is the count of nodes in the network, represents the set of neighbors of node i, and α is the jump probability. In the experiments, we take .
The algorithm initializes the input network data, iteratively obtains the nodes’ similarity set, and then calculates the similarity and degree ratios according to the similarity and initialization sets. Then, the trust-value between the nodes is obtained, and is combined with the PageRank to count the TPR indicator value of each node. The specific steps of the algorithm are shown in Algorithm 1.
| Algorithm 1 Trust–PageRank Algorithm |
|
3. Experiments and Discussion
3.1. Preparation
Thirteen representative real networks were used to evaluate the TPR algorithm or estimate for parameter k, including two small-scale networks (Kite [29] and Karate), the email network (Email), the international E-road network (Euroroad), the power grid of the United States (Power Grid), the networks of protein–protein interactions (Protein, PDZBasem and Propro), U.S. political books network (Polbooks), football club network (Football), animal social network (Dolphins), website user network (Hamster), and metabolic network of the roundworm (Elegans), which were selected from distinct fields containing social, transportation, protein–protein interactions, correspondence, and other aspects for validation. The statistics of the networks are summarized in Table 4, all of which are available from KONECT or NETWORK.
We conducted the experiments on the Feiteng Server provided by Kirin Operating System, Feiteng 1500A CPU, 32 G memory, and 2 TB hard disk. Four existing algorithms were considered as baselines: DC, BC, PageRank, and HITS.
- (1)
- DC [12]: An intuitive algorithm based on network topology that judges the importance of nodes by counting the number of their neighboring nodes.
- (2)
- BC [14]: The importance of node i depends on the percentage of all shortest paths in a network that contain node i.
- (3)
- PageRank [18]: A web page sorting algorithm applied in the Google search engine.
- (4)
- HITS [20]: Each node has an authority value and a hub value, which affect each other as the indicator used to evaluate the influence of nodes.
3.2. Evaluation
3.2.1. SIR Spreading Model
The node identification method should produce influential nodes related to the actual propagation process as much as possible. However, most complex networks lack the influence ability label of nodes. Thus, we employ a mature epidemic transmission model, the SIR [16] model, to evaluate the performance and effectiveness of TPR; the SIR model has also been used as a criterion in other relevant papers [30,31]. There are three states in SIR: (1) susceptible: nodes in this state are infected by other nodes; (2) infected: the infected nodes infect other nodes with a probability of and return to the recovered state with the probability of ; (3) recovered: recovered from infected status, does not have the ability to infect other nodes, and cannot be infected. In the experiment, one node is selected as a seed node, and then t-step infections occur. The experiment will iterate many times, and the average numbers of infected nodes and recovered nodes after infection are taken as the propagation ability of the node, denoted as . The influence value of node i defined as
where is the number of iterations, and and represent the number of infected and recovered nodes, respectively. We set . Due to the presence of randomness in the SIR model, the whole process needs to run many times, each time requiring multiple iterations. Thus applying the SIR model over the large-scale network is time-consuming [31,32]. However we can still use it as a performance metric.
3.2.2. Kendall Correlation Coefficient
The Kendall correlation coefficient [33] is used to measure the correlation of multi-column grading variables, and is defined as
In the Kendall correlation coefficient, it is assumed that two element sets corresponding to the two sequences A and B are and , respectively. Only if and , or and , are the two elements considered to be consistent. In Equation (9), C and D represent the number of consistent pairs and inconsistent pairs in the two sorted sequence sets, respectively; N is the number of statistical objects. When , the larger the value of , the more consistent they are. indicates that the two sets are independent of each other; indicates that the ordering correlation between the two is opposite.
3.3. Estimate for Parameter k
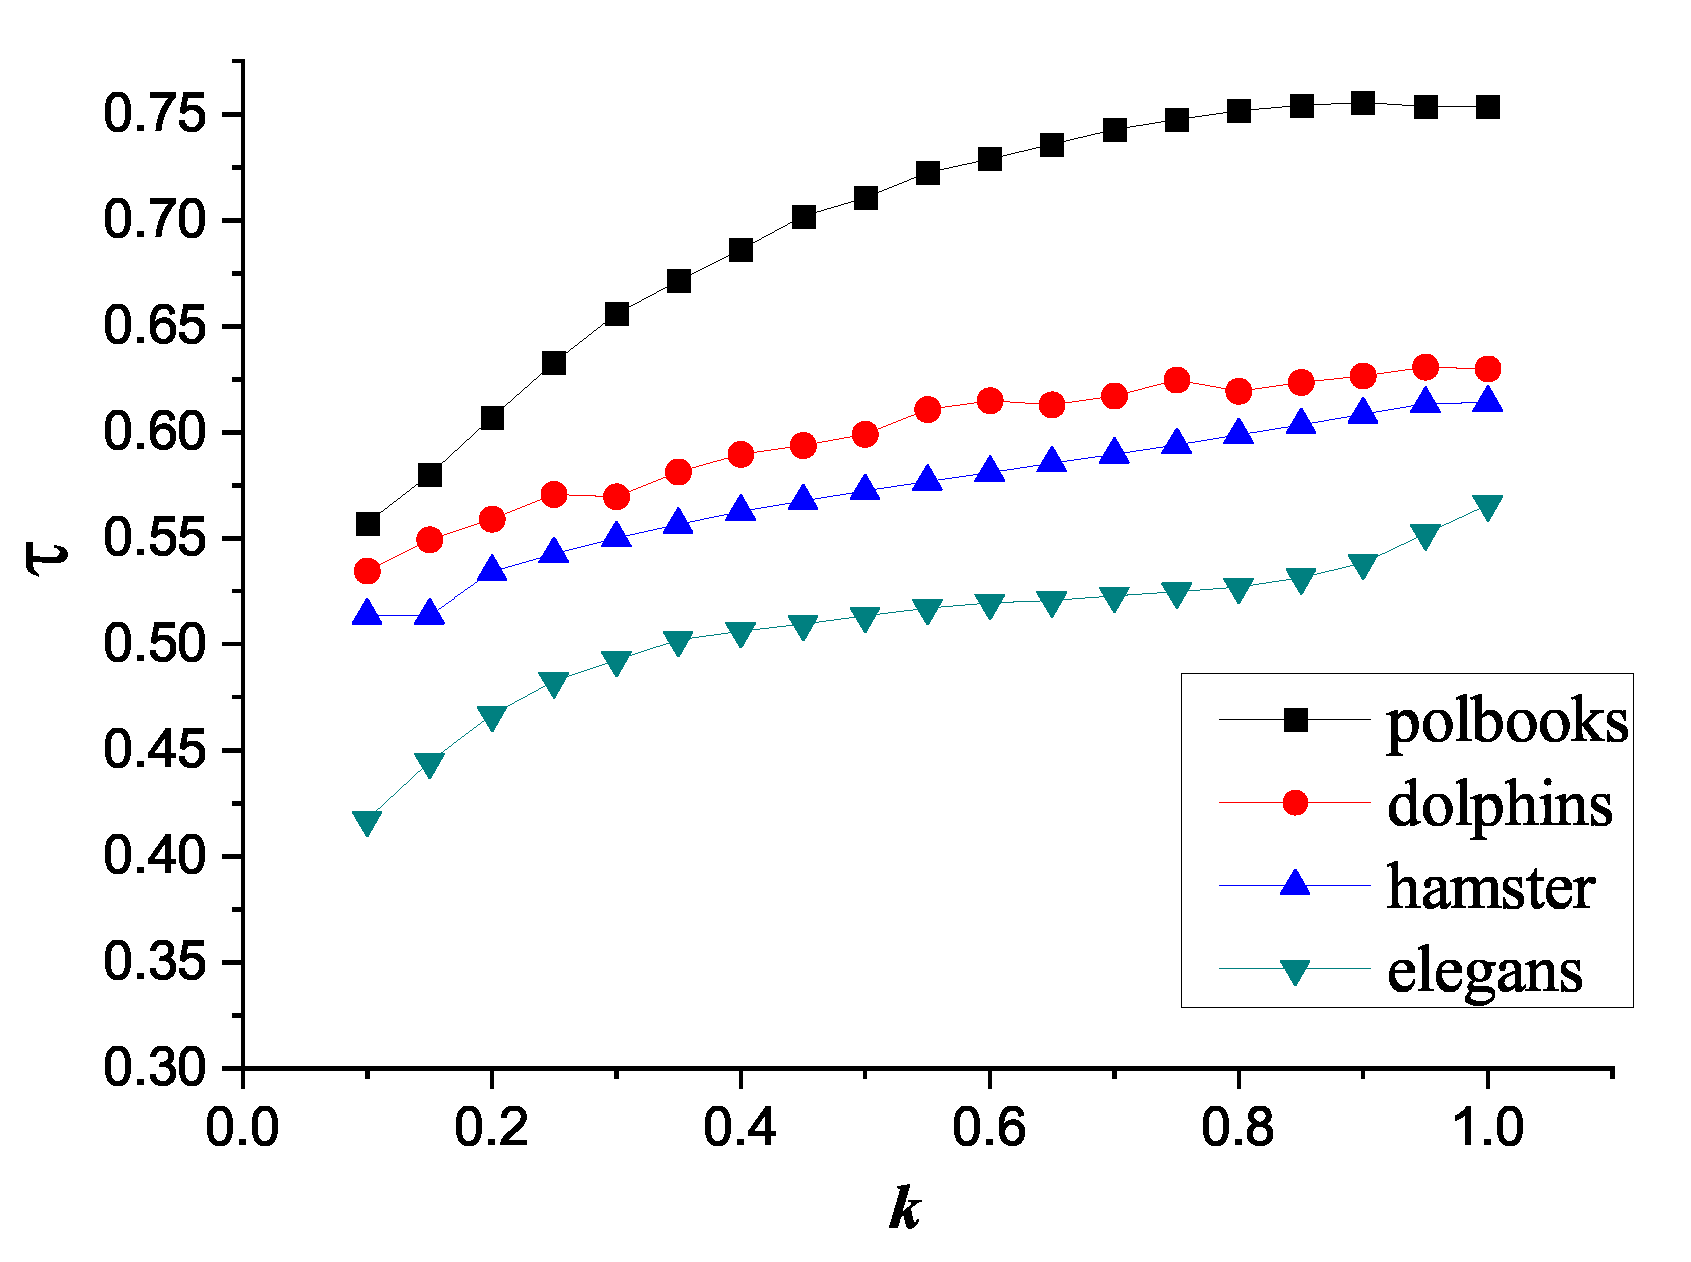
The trust-value proposed above consists of both the similarity ratio and the degree ratio. To determine their exact proportion in the trust-value to ensure the accuracy of the experimental results, we took parameter k as ranging from 0.1 to 1. The infection probability and recovery probability in the SIR model were set to 0.3 and 0.6, respectively, 10 steps were propagated, and 100 iterations were run. The Kendall correlation coefficients between the SIR and TPR algorithms were calculated in the PolBooks, Dolphins, Hamster, and Elegans networks. The experimental results are shown in Figure 4.
Figure 4 shows that in the Dolphins, Hamster, and Elegans networks, the values of the correlation coefficient increase slightly with the change in the value of the parameter k. In the PolBooks network, the maximum of is reached when k is between 0.85 and 0.9. To accurately evaluate the influence of nodes in the network and avoid adopting too many parameters in the experiments, the value of k was set to 0.85.
3.4. Preliminary Effectiveness Analysis
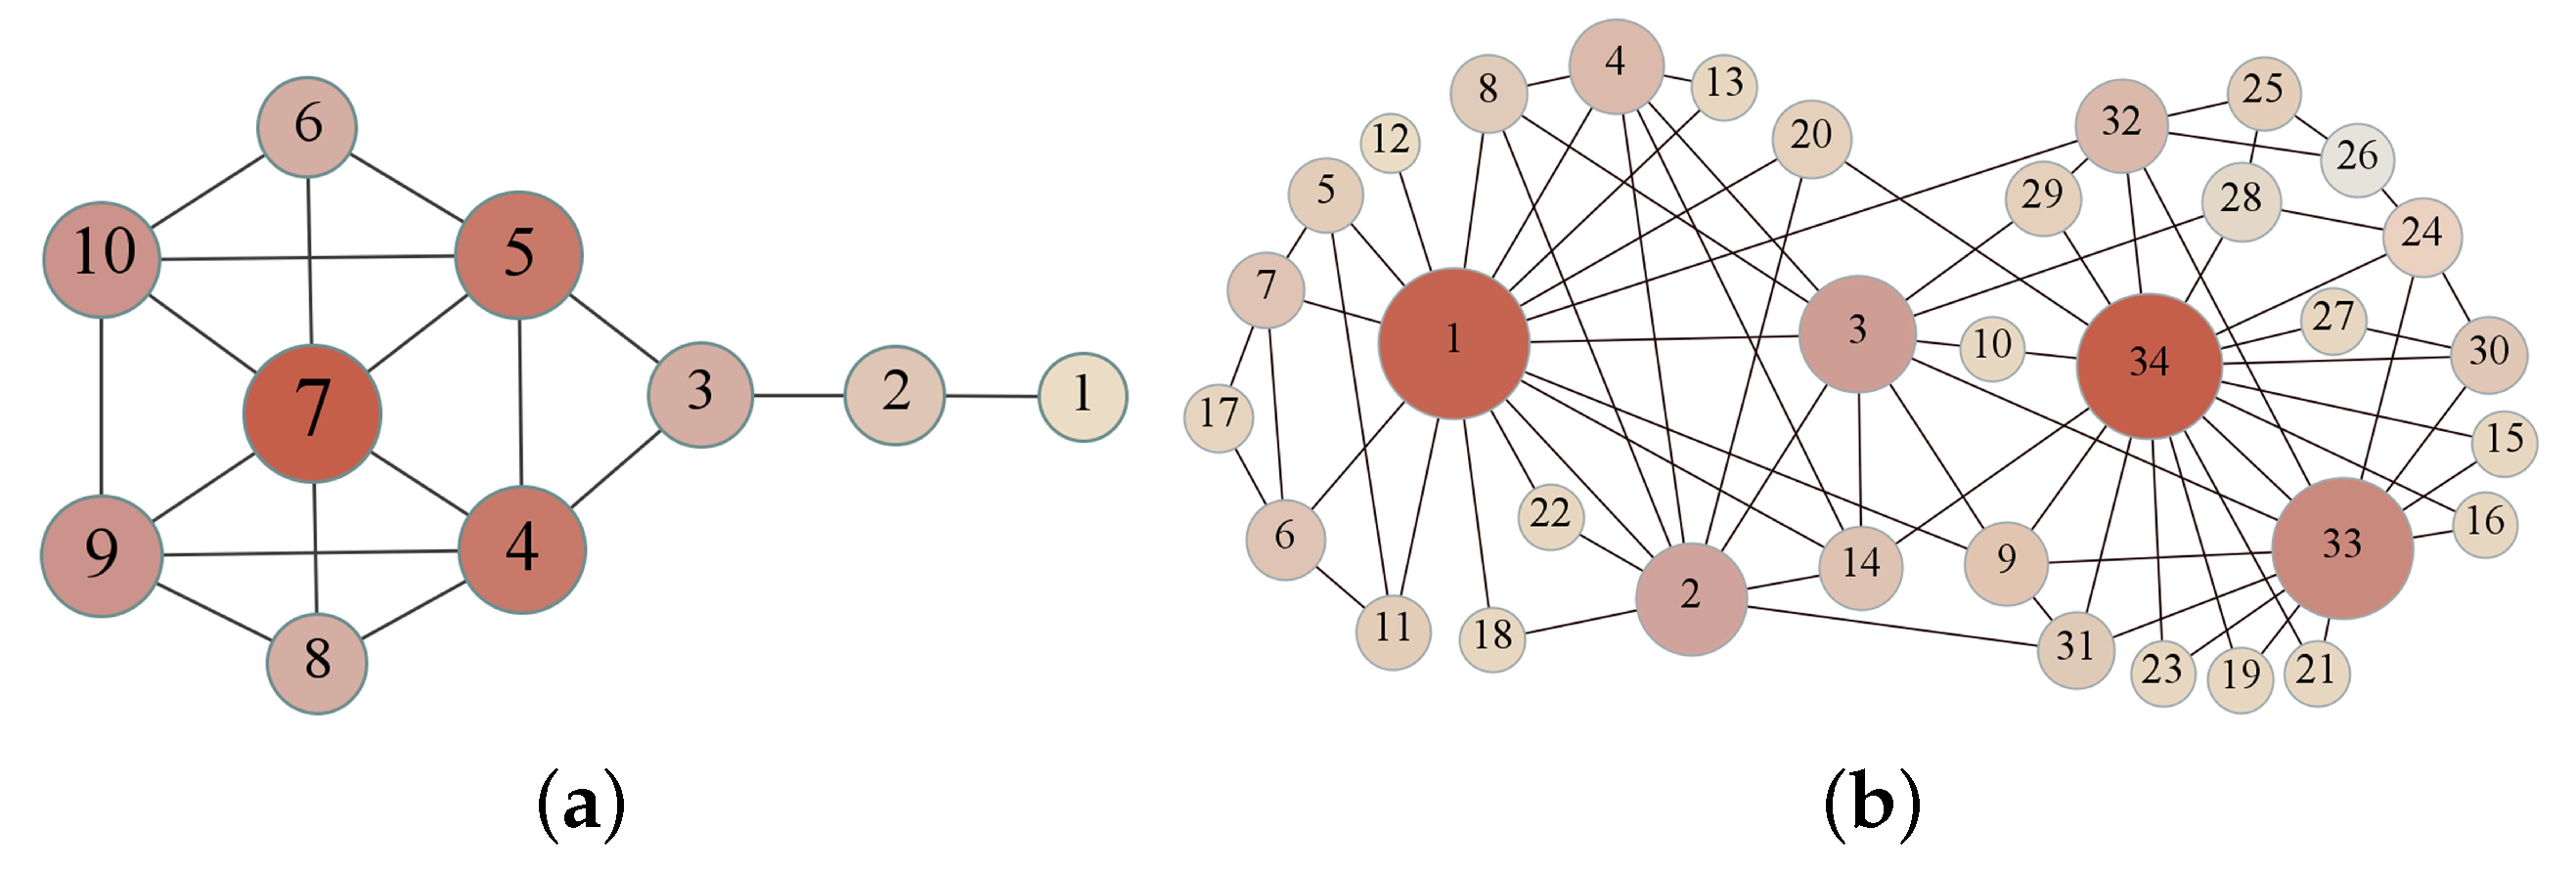
To clearly visualize the internal structure of the network, we selected small-scale networks such as Kite [29] and Karate, shown in Figure 5. Table 5 provides the outcome of the top 10 nodes as evaluated by TPR with DC, BC, PageRank, and HITS on Kite and Karate.
Table 5 shows that the results of these algorithms for the symmetric Kite network are similar. The influential nodes identified by TPR are consistent with DC. In addition, compared with PageRank, TPR considers nodes 6 and 8 as being more influential than node 2. From the perspective of TPR, the TPR value of node 2 derives from nodes 1 and 3, which have lower TPR value. Node 2 has a small degree, and its similarity with node 3 is not dominant compared to other neighboring nodes of node 3 (nodes 4 and 5). The nodes adjacent to node 6 have excellent ranking and higher TPR values, the degree of node 6 is higher and node 6 is more similar to its neighbors, as is node 8. In addition, node 2 only connects node 3 to a leaf node 1, whereas nodes 6 and 8 are more influential, intuitively, which also proves that TPR is more rational.
In the Karate network, the top 10 nodes selected by TPR are basically consistent with those selected by other algorithms, with the only difference in the ordering. The top 10 nodes picked by DC, PageRank, TPR are nodes 1, 2, 3, 4, 9, 14, 24, 32, 33, and 34, but BC does not select nodes 4 and 24 but rather nodes 6 and 20. HITS considers node 31 as more important than 24.
3.5. Analysis of SIR Spreading Model
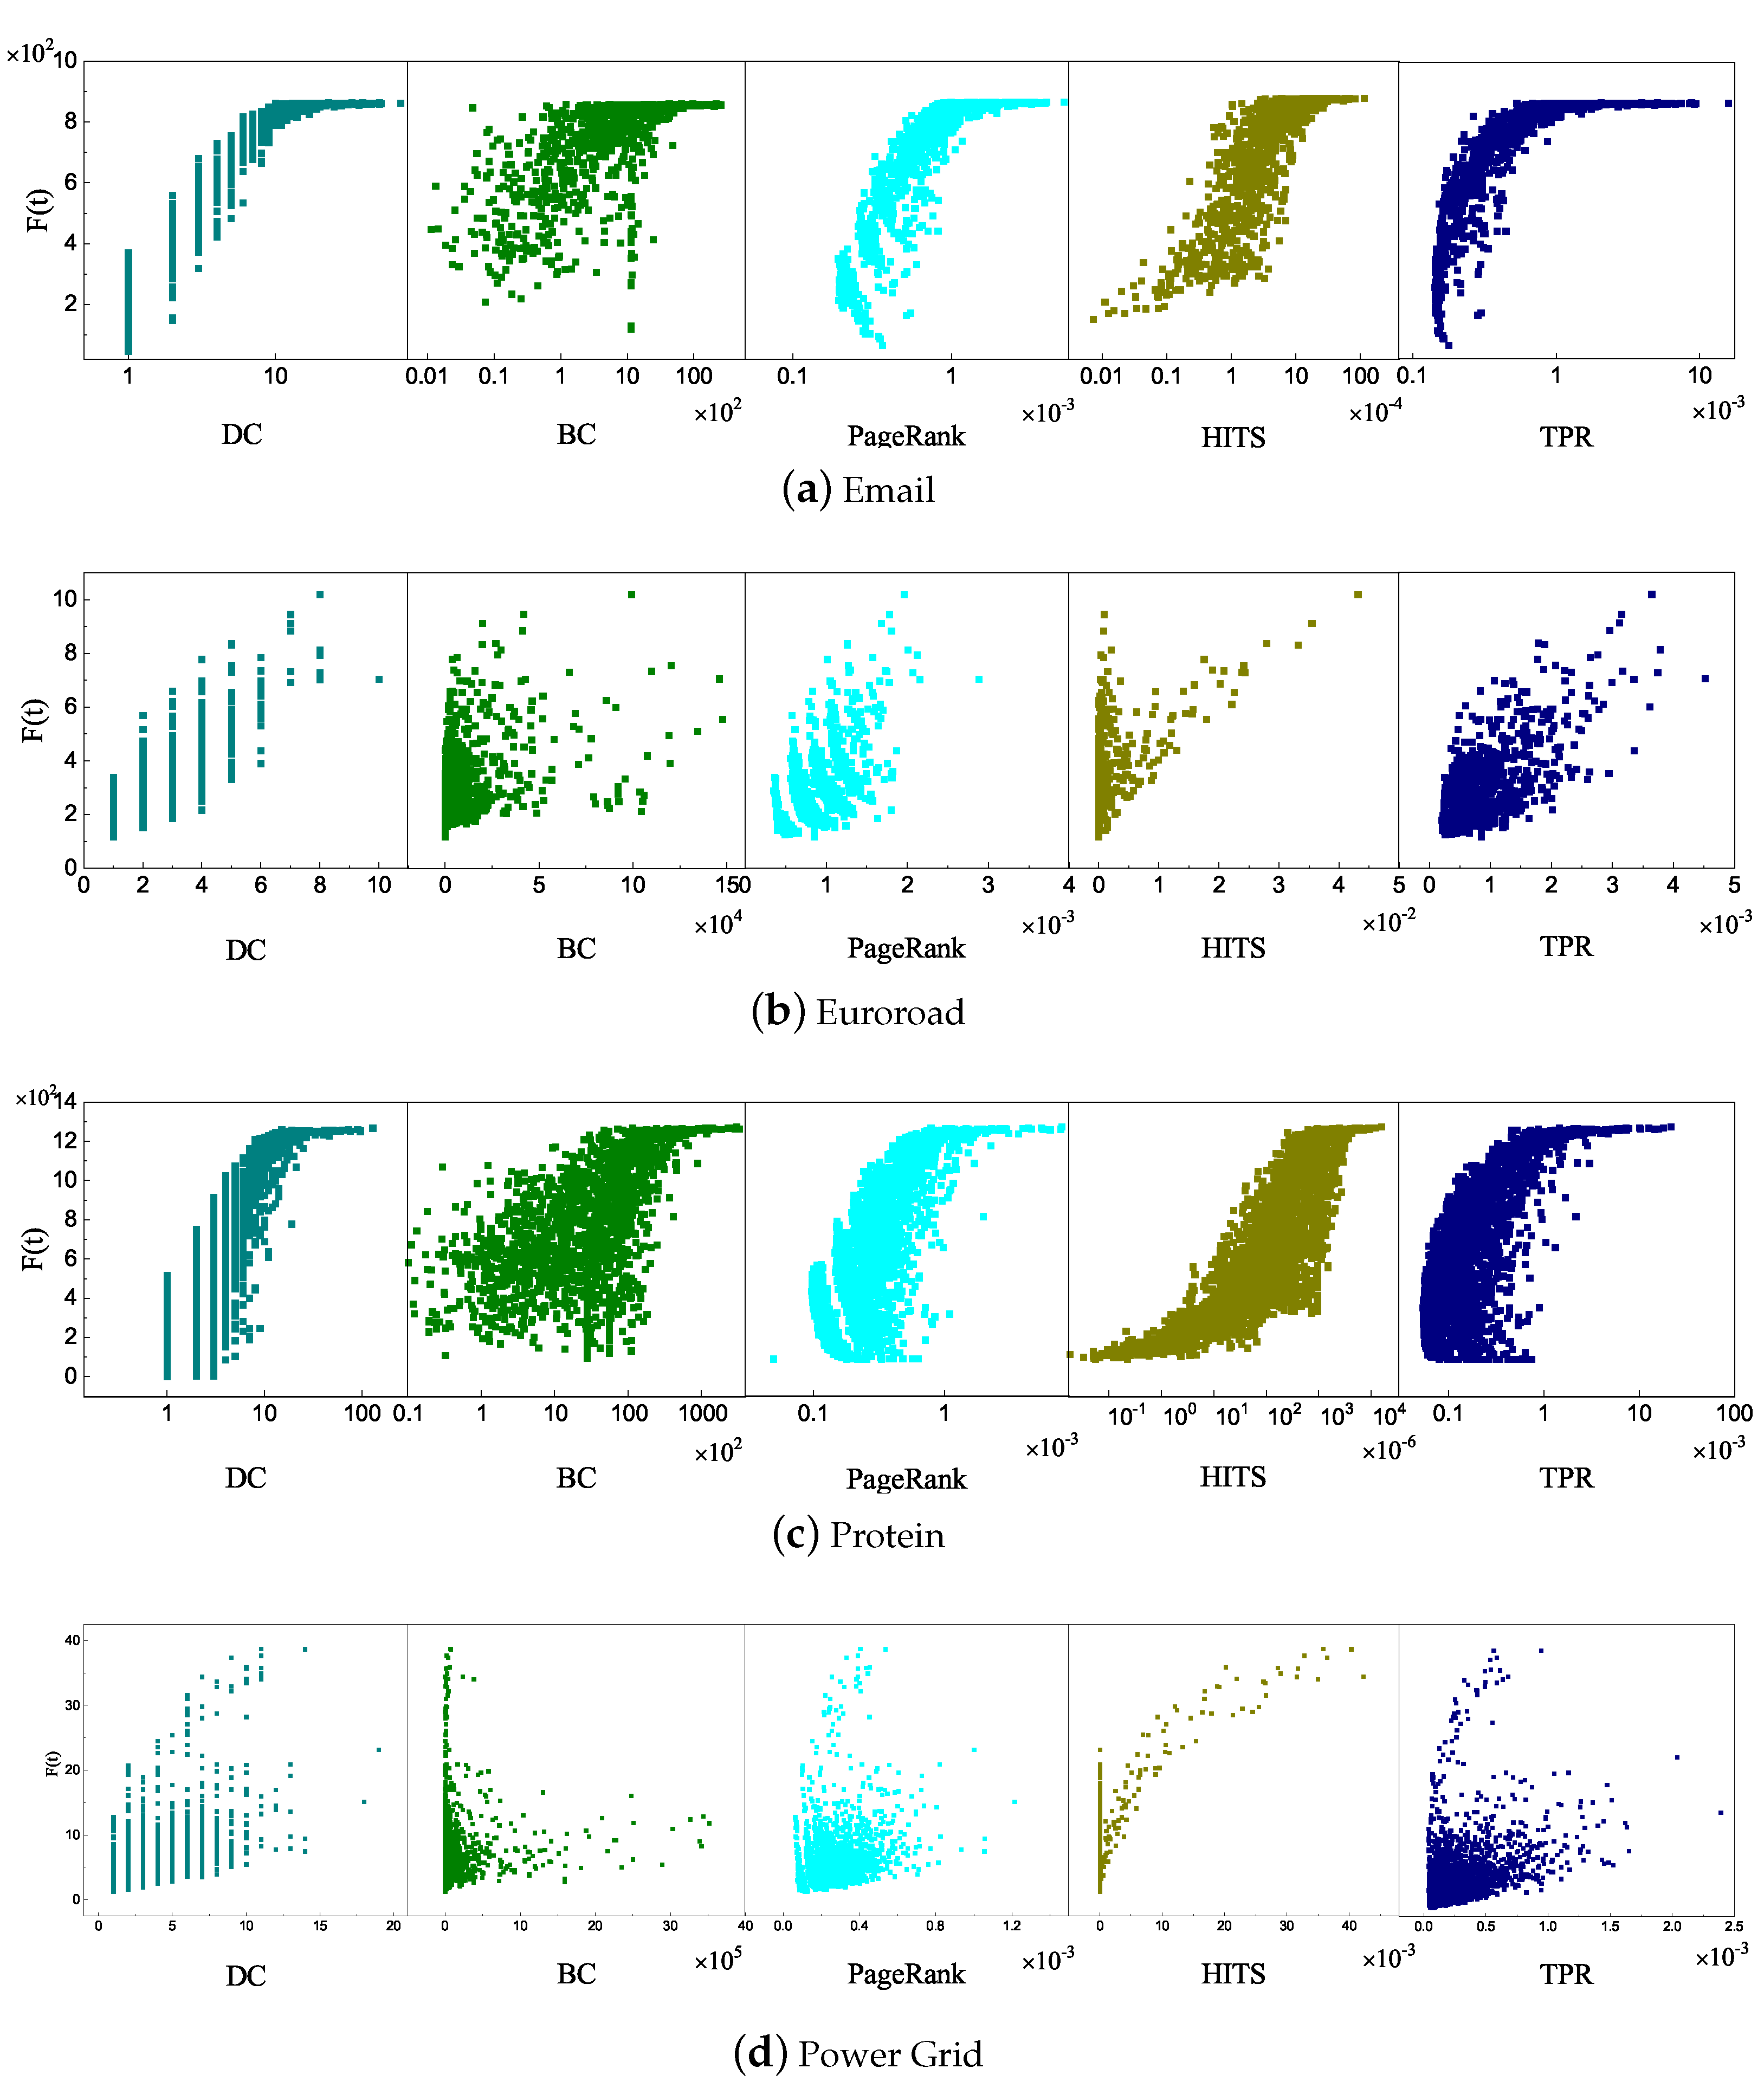
In the SIR propagation verification, since the propagation ability of a node is more representative in the initial propagation phase [13], in this paper, the seed node only propagates for 10 steps () instead of the whole infection reaching a steady state. First, in each iteration, the infected nodes infect their neighbor nodes with a probability of and return to recovery state with a probability of 1, which means . The TPR algorithm was compared with the DC, BC, PageRank, and HITS algorithms. The statistical results between the influence values of the nodes calculated by these algorithms and the nodes’ propagation ability by the SIR model are shown in Figure 6. In general, the stronger the positive correlation of the scatter graph, the closer the algorithm’s results are to the SIR model and the more appropriate the algorithm.
In the Email network (Figure 6a), DC, PageRank, HITS, and TPR algorithms can accurately reflect that the influence and SIR propagation ability of nodes are positively related. The distributions of nodes in DC, PageRank, and TPR algorithms are concentrated, whereas the distribution of the nodes in BC is more dispersed overall. In the Euroroad network (Figure 6b), each algorithm exhibits positive correlation characteristics. This feature is more obvious in TPR and PageRank, whereas DC cannot distinguish nodes with the same influence. BC performed poorly and the nodes gathered on the left side of the horizontal axis. In the HITS algorithm, some nodes with high propagation ability in the SIR model have low HITS values. The DC, PageRank, HITS, and TPR algorithms performed similarly in the Protein network (Figure 6c), and the distribution of nodes in the BC algorithm was relatively scattered. These algorithms performed similarly on the Euroroad and Power Grid networks (Figure 6d). From the above experimental results, in the Email, Euroroad, and Protein networks, the centrality value calculated by the TPR was more linearly consistent with the propagation ability obtained by the SIR model; that is, the nodes with similar influence in the SIR model have little difference from the influence in the TPR algorithm. In Power Grid, the result of the HITS algorithm was better than that of TPR.
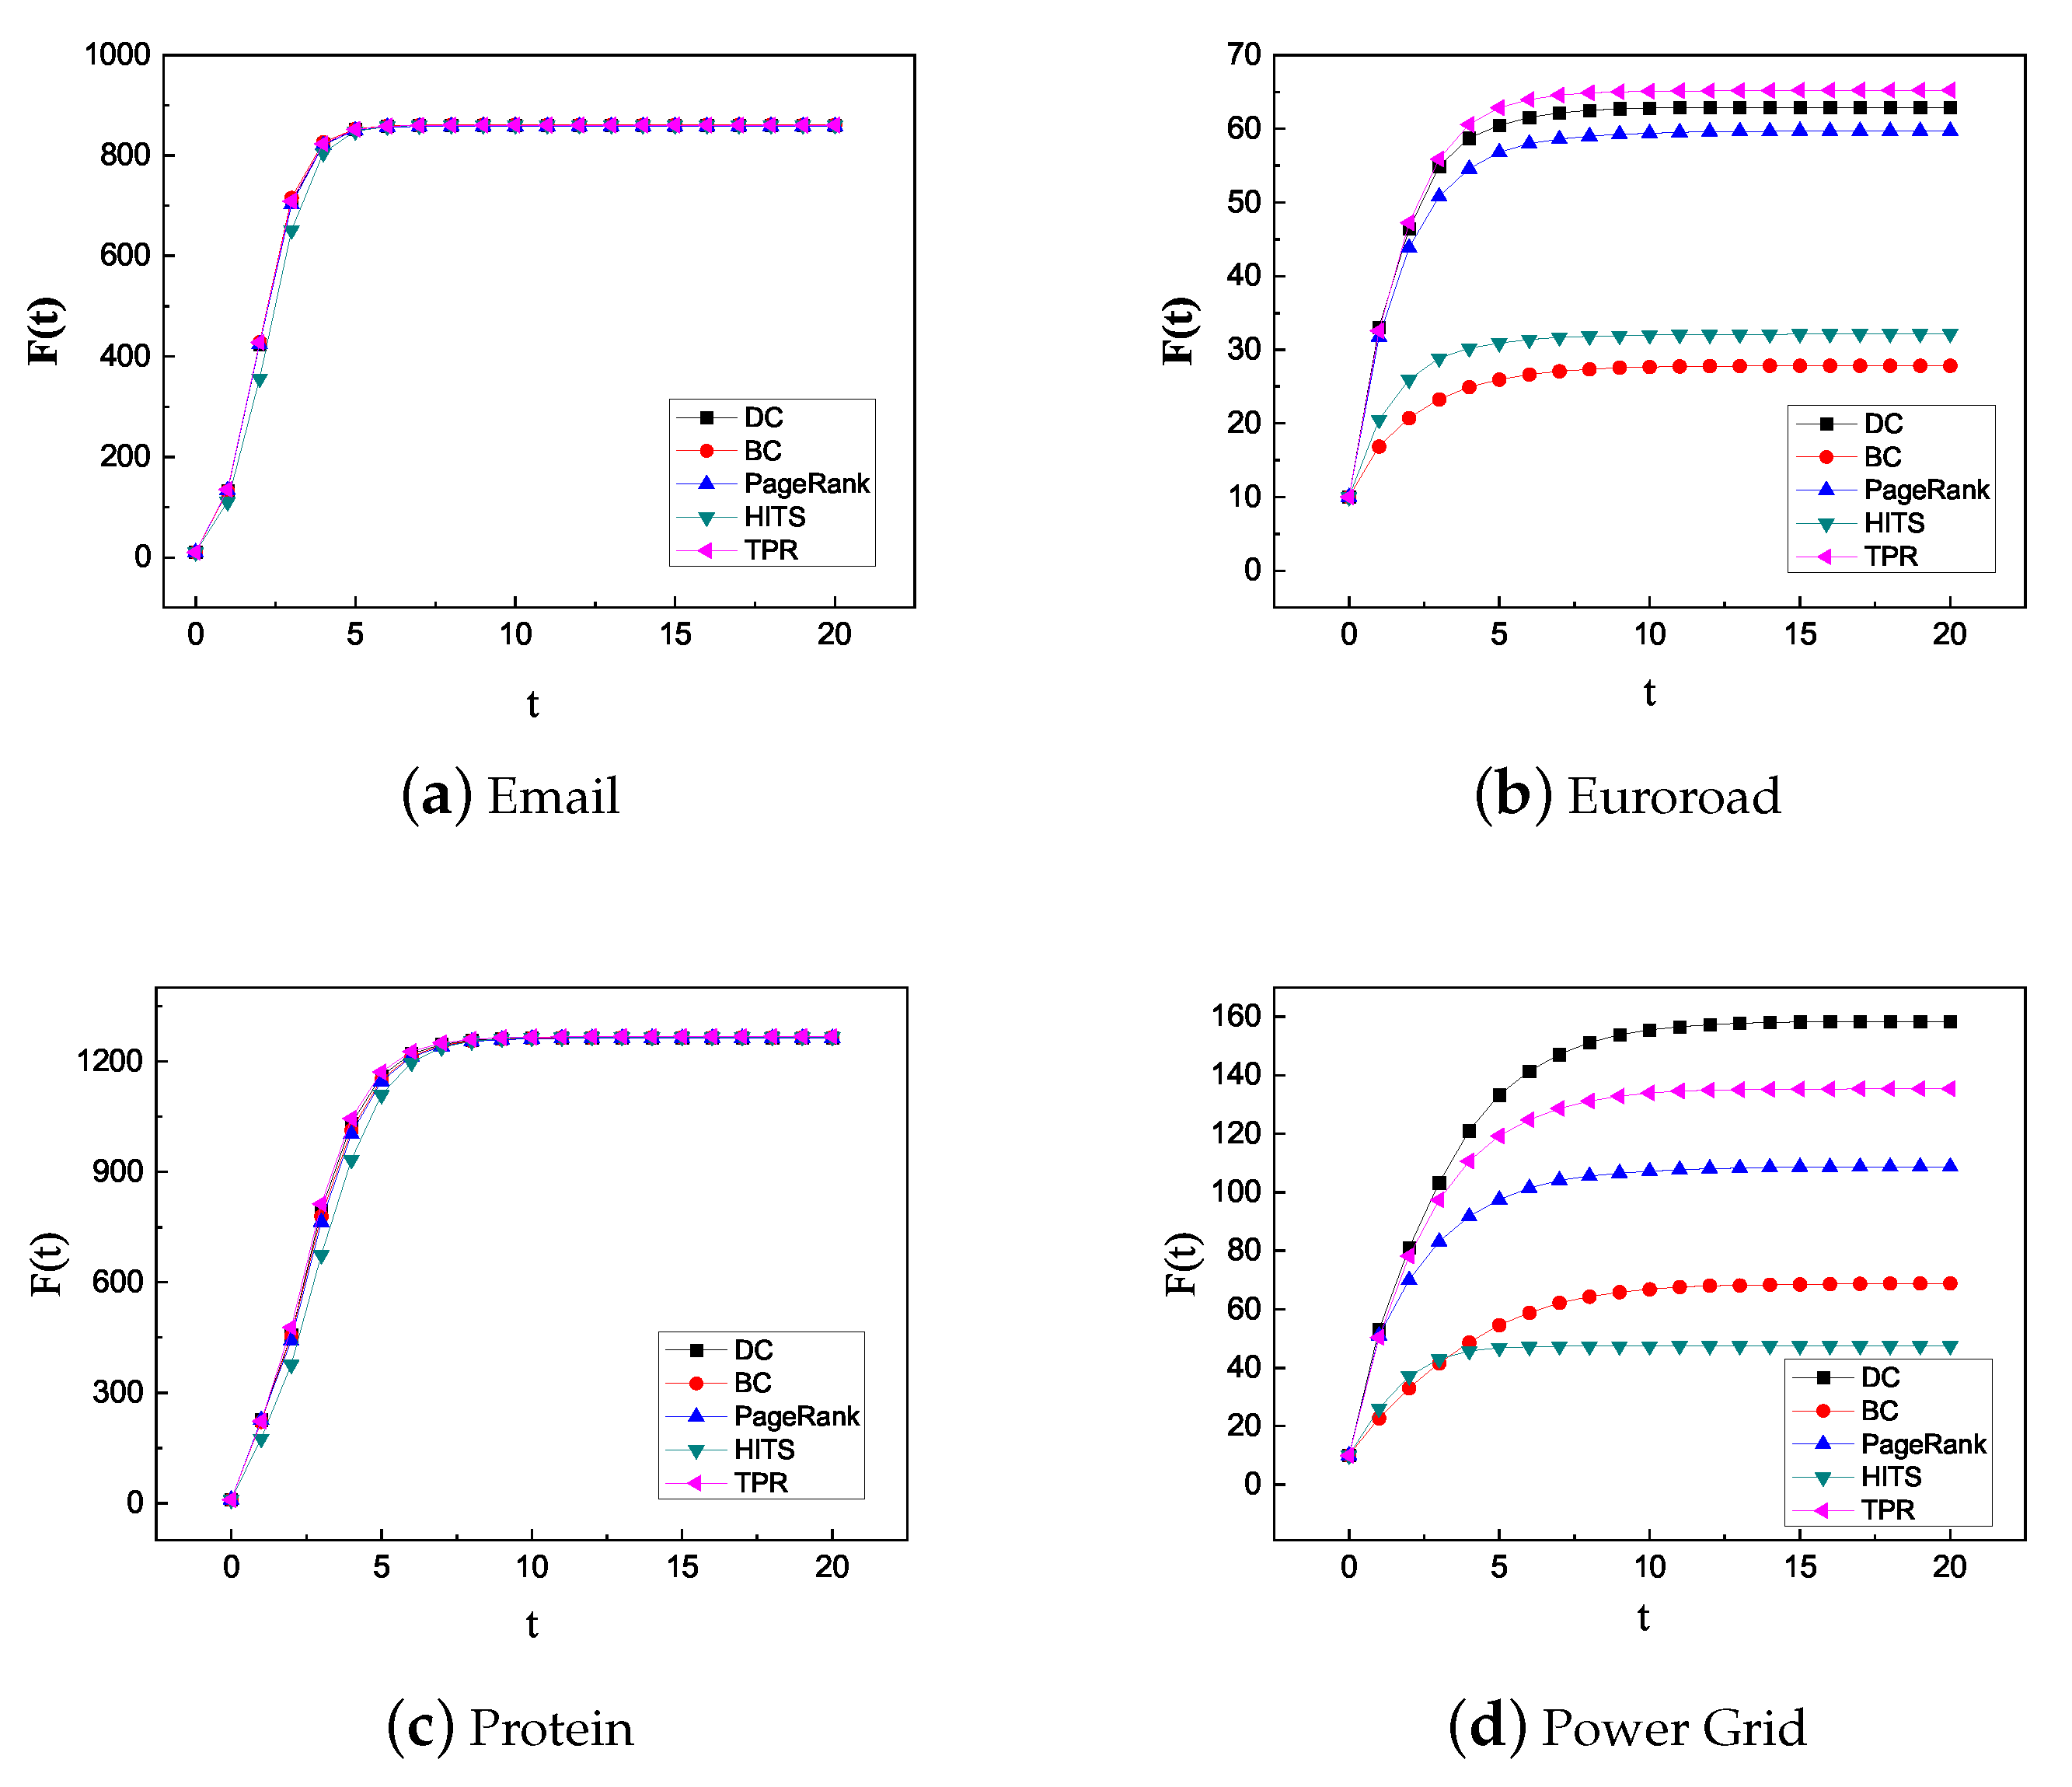
Then, to evaluate the infection ability of the influential nodes identified by each algorithm, the top 10 influential nodes identified by the DC, BC, PageRank, HITS, and TPR algorithms were selected as the seed nodes of the SIR model. The probability of infection was , the recovery probability was 1, 20 steps were propagated, and 100 iterations were performed. Finally, the total number of infected and recovery nodes in the network were counted to represent the propagation ability of the top 10 nodes selected by each algorithm. The higher the , the more influential the 10 selected seed nodes. The results are shown in Figure 7.
From Figure 7, in the Email (Figure 7a) and Protein (Figure 7c) networks, the top 10 nodes identified by each algorithm have similar propagation ability. When , the slope of the curves in DC, BC, PageRank, and TPR algorithms are equivalent, whereas the slope of the curve in the HITS algorithm is slightly smaller than those of the other algorithms. In the Euroroad network (Figure 7b), after the propagation of 20 steps, the numbers of infected and recovered nodes and the infection rate of the seed nodes in the network are TPR > DC > PageRank > HITS > BC. In the Power Grid network (Figure 7d), the top 10 nodes identified by the DC have strong abilities to spread. The number of infected nodes and the infection rate of the top 10 nodes are DC > TPR > PageRank > BC > HITS and DC > TPR > PageRank > HITS > BC, respectively.
In the above experimental results, when , the numbers of infected and recovery nodes of each algorithm increase. When , each algorithm is in a stable state, the function of the TPR algorithm has higher initial curve slope, and the growth rate is obvious in the Email, Euroroad, and Protein networks. TPR is second only to DC in Power Grid, indicating that the top 10 nodes identified by the TPR have advantages in initial propagation.
3.6. Analysis of Kendall Correlation Coefficient
To more clearly compare the algorithms, we applied the algorithms to the PolBooks, PDZBase, Football, and Propro networks, and compared the results obtained by each algorithm and the SIR model, then calculated the Kendall correlation coefficient, setting , . The Kendall coefficients between the ranking of the top 30% nodes obtained by the DC, BC, PageRank, HITS, TPR, and SIR models are shown in Table 6. The higher the Kendall coefficient, more effective the algorithm. The table shows that in the PDZBase, Football, and Propro networks, the TPR algorithm obtains higher correlation coefficient values than the other algorithms. In the PolBooks network, DC has obtained the highest correlation coefficient.
4. Conclusions
In this paper, we considered both the topology structure of networks and nodes’ attribute information to define the degree ratio and the similarity ratio, then the trust-value was proposed. Combined with PageRank, this paper proposed the trust–PageRank algorithm to identify influential nodes based on trust-value. In the experimental part, the TPR was first applied to the Kite and Karate networks to verify the effectiveness of the algorithm. To evaluate the accuracy and infection ability of the nodes identified by the TPR algorithm, eight real networks were selected, and the SIR model and Kendall correlation coefficients were used to evaluate the propagation rate and ability of to identify influential nodes in the networks. The influential nodes of each network identified by DC, BC, PageRank, HITS, and TPR algorithms were compared with the results obtained by the SIR model, and the correlation coefficients of ranking between the selected algorithms and the SIR model for the top 30% of nodes were calculated. The results showed that the TPR algorithm can effectively identify the influential nodes, and has advantages in the initial propagation of SIR and the identification of nodes with similar influence.
In general, we proposed an algorithm to identify influential nodes, not only considering the structure of network but also the attribute information of nodes. The accurate experimental results suggest that it should receive more attention and it may be helpful for controlling information dissemination in real-world networks, the spread of infectious diseases, etc. In addition, in some networks, nodes have certain features. For example, in social networks, people, as nodes, have features such as age, gender, and behaviors that may also affect trust-value, which are worthy of further attention.
Author Contributions
Conceptualization, J.S. and Y.W.; methodology, J.Z.; supervision, J.S. and B.W.; validation, J.Z. and Y.W.; writing, J.S. and Z.H. All authors have read and agreed to the published version of the manuscript.
Funding
This work was supported by the National Key Research and Development Program of China under grant no. 2018YFB1003602.
Conflicts of Interest
The authors declare no conflict of interest.
References
- Liben-Nowell, D.; Kleinberg, J. The link-prediction problem for social networks. J. Am. Soc. Inf. Sci. Technol. 2007, 58, 1019–1031. [Google Scholar] [CrossRef] [Green Version]
- Xu, R.; Mi, C.; Mierzwiak, R.; Meng, R. Complex network construction of Internet finance risk. Phys. A Stat. Mech. Its Appl. 2020, 540, 122930. [Google Scholar] [CrossRef] [Green Version]
- Tang, J.; Zhang, R.; Wang, P.; Zhao, Z.; Fan, L.; Liu, X. A discrete shuffled frog-leaping algorithm to identify influential nodes for influence maximization in social networks. Knowl.-Based Syst. 2020, 187, 104833. [Google Scholar] [CrossRef]
- Liu, Y.; Tang, M.; Zhou, T.; Do, Y. Identify influential spreaders in complex networks, the role of neighborhood. Phys. A Stat. Mech. Its Appl. 2016, 452, 289–298. [Google Scholar] [CrossRef] [Green Version]
- Wang, Y.; Wang, S.; Deng, Y. A modified efficiency centrality to identify influential nodes in weighted networks. Pramana 2019, 92, 68. [Google Scholar] [CrossRef]
- Pastor-Satorras, R.; Vespignani, A. Immunization of complex networks. Phys. Rev. E 2002, 65, 036104. [Google Scholar] [CrossRef] [PubMed] [Green Version]
- Feng, X.; Sharma, A.; Srivastava, J.; Wu, S.; Tang, Z. Social network regularized sparse linear model for top-n recommendation. Eng. Appl. Artif. Intell. 2016, 51, 5–15. [Google Scholar] [CrossRef]
- Lü, L.; Medo, M.; Yeung, C.H.; Zhang, Y.C.; Zhang, Z.K.; Zhou, T. Recommender systems. Phys. Rep. 2012, 519, 1–49. [Google Scholar] [CrossRef] [Green Version]
- Albert, R.; Albert, I.; Nakarado, G.L. Structural vulnerability of the North American power grid. Phys. Rev. E 2004, 69, 025103. [Google Scholar] [CrossRef] [Green Version]
- Ding, R.; Dong, H.B.; Zhang, Y.; Feng, X.-B. Fast Automatic Generation Method for Software Testing Data Based on Key-Point Path. J. Softw. 2016, 27, 814–827. [Google Scholar]
- Sun, P.G.; Quan, Y.N.; Miao, Q.G.; Chi, J. Identifying influential genes in protein–protein interaction networks. Inf. Sci. 2018, 454, 229–241. [Google Scholar] [CrossRef]
- Bonacich, P. Factoring and weighting approaches to status scores and clique identification. J. Math. Sociol. 1972, 2, 113–120. [Google Scholar] [CrossRef]
- Chen, D.; Lü, L.; Shang, M.S.; Zhang, Y.C.; Zhou, T. Identifying influential nodes in complex networks. Phys. A Stat. Mech. Its Appl. 2012, 391, 1777–1787. [Google Scholar] [CrossRef] [Green Version]
- Freeman, L.C. A set of measures of centrality based on betweenness. Sociometry 1977, 40, 35–41. [Google Scholar] [CrossRef]
- Newman, M.E. A measure of betweenness centrality based on random walks. Soc. Netw. 2005, 27, 39–54. [Google Scholar] [CrossRef] [Green Version]
- Li, Z.; Ren, T.; Ma, X.; Liu, S.; Zhang, Y.; Zhou, T. Identifying influential spreaders by gravity model. Sci. Rep. 2019, 9, 1–7. [Google Scholar] [CrossRef] [Green Version]
- Wen, X.; Tu, C.; Wu, M.; Jiang, X. Fast ranking nodes importance in complex networks based on LS-SVM method. Phys. A Stat. Mech. Its Appl. 2018, 506, 11–23. [Google Scholar] [CrossRef]
- Brin, S.; Page, L. The anatomy of a large-scale hypertextual web search engine. Comput. Netw. ISDN Syst. 1998, 30, 107–117. [Google Scholar] [CrossRef]
- Lü, L.; Zhang, Y.C.; Yeung, C.H.; Zhou, T. Leaders in social networks, the delicious case. PLoS ONE 2011, 6, e21202. [Google Scholar] [CrossRef] [PubMed] [Green Version]
- Kleinberg, J.M. Authoritative sources in a hyperlinked environment. J. ACM 1999, 46, 604–632. [Google Scholar] [CrossRef]
- Lü, L.; Zhou, T.; Zhang, Q.M.; Stanley, H.E. The H-index of a network node and its relation to degree and coreness. Nat. Commun. 2016, 7, 10168. [Google Scholar] [CrossRef] [Green Version]
- Liu, Q.; Zhu, Y.X.; Jia, Y.; Deng, L.; Zhou, B.; Zhu, J.X.; Zou, P. Leveraging local h-index to identify and rank influential spreaders in networks. Phys. A Stat. Mech. Its Appl. 2018, 512, 379–391. [Google Scholar] [CrossRef] [Green Version]
- Hirsch, J.E. An index to quantify an individual’s scientific research output. Proc. Natl. Acad. Sci. USA 2005, 102, 16569–16572. [Google Scholar] [CrossRef] [Green Version]
- REN, X.; Lü, L. Review of ranking nodes in complex networks. Chin. Sci. Bull. 2014, 59, 1175–1197. [Google Scholar] [CrossRef]
- Zhou, X.; Zhang, F.M.; Li, K.W.; Hui, X.B.; Wu, H.S. Finding vital node by node importance evaluation matrix in complex networks. Acta Phys. Sin. 2012, 61, 1–7. [Google Scholar]
- Gu, Y.; Zhu, Z. Node Ranking in Complex Networks based on LeaderRank and Modes Similarity. J. Univ. Electron. Sci. Technol. China 2017, 46, 441–448. [Google Scholar]
- Ghoshal, G.; Barabási, A.L. Ranking stability and super-stable nodes in complex networks. Nat. Commun. 2011, 2, 1–7. [Google Scholar] [CrossRef] [PubMed]
- Jeh, G.; Widom, J. SimRank: A measure of structural-context similarity. In Proceedings of the Eighth ACM SIGKDD International Conference on Knowledge Discovery and Data Mining, Edmonton, AB, Canada, 23–26 July 2002; pp. 538–543. [Google Scholar]
- Yu, H.; Liu, Z.; Li, Y.J. Key nodes in complex networks identified by multi-attribute decision-making method. Acta Phys. Sin. 2013, 62, 020204. [Google Scholar]
- Chen, G.; Zhou, S.; Liu, J.; Li, M.; Zhou, Q. Influential node detection of social networks based on network invulnerability. Phys. Lett. A 2020, 384, 126879. [Google Scholar] [CrossRef]
- Kumar, S.; Panda, B. Identifying influential nodes in Social Networks: Neighborhood Coreness based voting approach. Phys. A Stat. Mech. Its Appl. 2020, 553, 124215. [Google Scholar] [CrossRef]
- Malang, K.; Wang, S.; Phaphuangwittayakul, A.; Lv, Y.; Yuan, H.; Zhang, X. Identifying influential nodes of global terrorism network: A comparison for skeleton network extraction. Phys. A Stat. Mech. Its Appl. 2020, 545, 123769. [Google Scholar] [CrossRef]
- Kendall, M.G. A new measure of rank correlation. Biometrika 1938, 30, 81–93. [Google Scholar] [CrossRef]
Figure 1.
Hobby sets and the network of nodes’ similarity. (a) A network of nodes with hobby sets. (b) Each hobby set of one node is treated as a set of neighbor nodes.
Figure 1.
Hobby sets and the network of nodes’ similarity. (a) A network of nodes with hobby sets. (b) Each hobby set of one node is treated as a set of neighbor nodes.

Figure 2.
A network used to express the importance of degree ratio in the spread of information.

Figure 3.
Example of the calculation of trust-value.

Figure 4.
Trend in Kendall coefficient changes with the value of parameter k.

Figure 5.
Two small-scale networks.

Figure 6.
Comparison between the central value and the propagation ability of SIR. The horizontal axis represents the node influential value obtained by each algorithm and the vertical axis is the propagation capability of the corresponding node evaluated by the SIR propagation model.
Figure 6.
Comparison between the central value and the propagation ability of SIR. The horizontal axis represents the node influential value obtained by each algorithm and the vertical axis is the propagation capability of the corresponding node evaluated by the SIR propagation model.

Figure 7.
Growth of infected and recovered nodes for different networks.


Table 1.
Definitions of symbols.
| Symbol | Definition |
|---|---|
| The hobby set of node i. | |
| The similarity between nodes i and j. | |
| The sum of similarity between node v and its neighbor nodes. | |
| The adjacent nodes’ set of v. | |
| The number of node v’s neighbors. | |
| The ratio of the similarity between nodes i and j to the ratio of the sum of the similarity between node j and its neighbors. | |
| The sum of the degree of all adjacent nodes of node i. | |
| The ratio of the degree of node i to the sum of the degrees of all adjacent nodes of node j. | |
| The trust-value of node i to node j. |
Table 2.
The hobby sets of nodes v, 1, 2, 3, and 4.
| Hobby Set | Value |
|---|---|
| {basketball, pingpong, run} | |
| {basketball, run} | |
| {pingpong} | |
| {tennis} | |
| {run} |
Table 3.
The similarities of nodes. The short dash indicates that there is no edge between the two nodes.
Table 3.
The similarities of nodes. The short dash indicates that there is no edge between the two nodes.
| v | 1 | 2 | 3 | 4 | 5 | |
|---|---|---|---|---|---|---|
| 1 | - | 0.6 | 0.52 | - | 0.47 | 1.59 |
| 2 | 0.6 | - | - | - | 0.51 | 1.11 |
| 3 | 0.52 | - | - | 0.6 | 0.47 | 1.59 |
| 4 | - | - | 0.6 | - | 0.51 | 1.11 |
| 5 | 0.47 | 0.51 | 0.47 | 0.51 | - | 1.96 |
Table 4.
Data sets. and indicate the number of nodes and edges, respectively; and represent the average degree and the maximum degree, respectively; and is the average clustering coefficient.
Table 4.
Data sets. and indicate the number of nodes and edges, respectively; and represent the average degree and the maximum degree, respectively; and is the average clustering coefficient.
| Network | |||||
|---|---|---|---|---|---|
| Kite | 10 | 18 | 3.6 | 6 | 0.578 |
| Karate | 34 | 78 | 4.5888 | 17 | 0.588 |
| 1133 | 5451 | 9.622 | 71 | 0.254 | |
| Euroroad | 1174 | 1417 | 2.414 | 10 | 0.02 |
| Power Grid | 4941 | 6594 | 2.669 | 19 | 0.107 |
| Protein | 3133 | 6149 | 3.925 | 129 | 0.106 |
| PDZBase | 212 | 242 | 2.283 | 21 | 0.013 |
| Propro | 1870 | 2277 | 2.356 | 56 | 0.153 |
| Pollbooks | 105 | 441 | 8.4 | 25 | 0.488 |
| Football | 115 | 613 | 10.661 | 12 | 0.403 |
| Dolphins | 62 | 159 | 5 | 12 | 0.259 |
| Hamster | 2426 | 16631 | 13.711 | 273 | 0.231 |
| Elegans | 453 | 4596 | 20.291 | 639 | 0.124 |
Table 5.
The top 10 nodes of Kite and Karate.
| Kite | Karate | ||||||||||
|---|---|---|---|---|---|---|---|---|---|---|---|
| Sort | DC | BC | PageRank | HITS | TPR | sort | DC | BC | PageRank | HITS | TPR |
| 1 | 7 | 3 | 7 | 7 | 7 | 1 | 34 | 1 | 34 | 34 | 1 |
| 2 | 4 | 4 | 4 | 4 | 4 | 2 | 1 | 34 | 1 | 1 | 34 |
| 3 | 5 | 5 | 5 | 5 | 5 | 3 | 33 | 33 | 33 | 3 | 33 |
| 4 | 9 | 2 | 9 | 9 | 9 | 4 | 3 | 3 | 3 | 33 | 3 |
| 5 | 10 | 7 | 10 | 10 | 10 | 5 | 2 | 32 | 2 | 2 | 2 |
| 6 | 3 | 9 | 3 | 6 | 3 | 6 | 4 | 9 | 32 | 9 | 32 |
| 7 | 6 | 10 | 2 | 8 | 6 | 7 | 32 | 2 | 4 | 14 | 4 |
| 8 | 8 | 6 | 6 | 3 | 8 | 8 | 9 | 14 | 24 | 4 | 14 |
| 9 | 2 | 8 | 8 | 2 | 2 | 9 | 14 | 20 | 9 | 32 | 9 |
| 10 | 1 | 1 | 1 | 1 | 1 | 10 | 24 | 16 | 14 | 31 | 24 |
Table 6.
Kendall correlation coefficients.
| Data Sets | DC | BC | PageRank | HITS | TPR |
|---|---|---|---|---|---|
| PolBooks | 0.687 | 0.283 | 0.646 | 0.517 | 0.674 |
| PDZBase | 0.269 | 0.462 | 0.283 | 0.41 | 0.466 |
| Football | 0.114 | 0.133 | 0.216 | 0.19 | 0.307 |
| Propro | 0.411 | 0.411 | 0.4 | 0.14 | 0.543 |
Publisher’s Note: MDPI stays neutral with regard to jurisdictional claims in published maps and institutional affiliations. |
© 2020 by the authors. Licensee MDPI, Basel, Switzerland. This article is an open access article distributed under the terms and conditions of the Creative Commons Attribution (CC BY) license (http://creativecommons.org/licenses/by/4.0/).
Share and Cite
MDPI and ACS Style
Sheng, J.; Zhu, J.; Wang, Y.; Wang, B.; Hou, Z. Identifying Influential Nodes of Complex Networks Based on Trust-Value. Algorithms 2020, 13, 280. https://0-doi-org.brum.beds.ac.uk/10.3390/a13110280
AMA Style
Sheng J, Zhu J, Wang Y, Wang B, Hou Z. Identifying Influential Nodes of Complex Networks Based on Trust-Value. Algorithms. 2020; 13(11):280. https://0-doi-org.brum.beds.ac.uk/10.3390/a13110280
Chicago/Turabian StyleSheng, Jinfang, Jiafu Zhu, Yayun Wang, Bin Wang, and Zheng’ang Hou. 2020. "Identifying Influential Nodes of Complex Networks Based on Trust-Value" Algorithms 13, no. 11: 280. https://0-doi-org.brum.beds.ac.uk/10.3390/a13110280
Note that from the first issue of 2016, this journal uses article numbers instead of page numbers. See further details here.