
Influence of Land Use Change on the Surface Albedo and Climate Change in the Qinling-Daba Mountains


1
College of Geography and Environmental Science, Henan University, Kaifeng 475004, China
2
Key Laboratory of Geospatial Technology for the Middle and Lower Yellow River Regions (Henan University), Ministry of Education, Kaifeng 475004, China
*
Author to whom correspondence should be addressed.
Sustainability 2021, 13(18), 10153; https://0-doi-org.brum.beds.ac.uk/10.3390/su131810153
Submission received: 4 August 2021
/
Revised: 6 September 2021
/
Accepted: 7 September 2021
/
Published: 10 September 2021
(This article belongs to the Special Issue Land Cover/Land-Use Changes Impacts on Ecosystem)
Abstract
:Land use changes affect the surface radiative budget and energy balance by changing the surface albedo, which generates radiative forcing, impacting the regional and global climate. To estimate the effect of land use changes on the surface albedo and climate change in a mountainous area with complex terrain, we obtained MODIS data, identified the spatial–temporal characteristics of the surface albedo caused by land use changes, and then calculated the radiative forcing based on solar radiative data and the surface albedo in the Qinling-Daba mountains from 2000 to 2015. The correlation between the land use changes and the radiative forcing was analyzed to explore the climate effects caused by land use changes on a kilometer-grid scale in the Qinling-Daba mountains. Our results show that the primarily land use changes were a decrease in the cultivated land area and an increase in the construction land area, as well as other conversions between six land use types from 2000 to 2015. The land use changes led to significant changes in the surface albedo. Meanwhile, the radiative forcing caused by the land use had different magnitudes, strengths, and occurrence ranges, resulting in both warming and cooling climate change effects.
1. Introduction
According to the Fourth Assessment Report of the Intergovernmental Panel on Climate Change, human activities have affected the climate to various degrees in different ways. As an important representation of human activity, land use activity regulates the climate via land cover changes [1,2]. The land use change factors are related to both biogeochemical and biogeophysical processes. On the one hand, land use change increases carbon sinks through afforestation [3,4] from a biogeochemical point of view, playing an important role in increasing the absorption of a large amount of carbon [5,6], changing the terrestrial carbon exchange [7], and leading to the attenuation of global warming to a certain extent. On the other hand, land use change affects energy and water vapor exchange between land surface and atmosphere by changing surface albedo and surface roughness, which indirectly affects the surface radiation budget and energy balance, and has different impacts on regional and global climate [8]. However, biogeophysical researchers have offered a different explanation for global climate changes according to variations in the surface albedo [1,3,9,10,11,12,13]. It is believed that the loss of woodland, especially the conversion of temperate forests to cultivated land and pastures, increases the surface albedo [3,14,15], which causes, to some degree, a decrease in the net surface radiation and summer surface temperature at middle and high latitudes. According to Ridgwell [14], an increase of 0.04 in the canopy albedo of vegetation in designated cropland areas is equivalent to a summer surface air temperature reduction of 1 °C in North America and Eurasia. This counterbalances the climate warming caused by net greenhouse emissions, resulting in less climate warming than initially expected [8,12,16].
Globally, biogeochemical and biogeophysical effects of land use are on two ends of a seesaw, which goes up and down regionally with the net effect being very small [16,17,18]. In tropical areas, deforestation is believed to exacerbate climate warming by reducing evapotranspiration [3,19,20,21]. However, in temperate and cold temperate regions, summer evaporation in boreal forests is not as significant as in tropical forests and as forest was changed into pastures and crops, albedo showed a trend of increasing, which compensated for the loss of carbon sinks and alleviated climate warming to some extent. Thus, the impact of land use change on climate change is very complex [3,20]. Biogeophysical cooling appears to have surpassed the biogeochemical warming caused by increased carbon emissions via land cover changes, resulting in a cooling of the temperature across the entire Northern Hemisphere [10,12,22]. The impact of land use on climate change is very complex, involving interactions of the albedo, evaporation, carbon cycle, and other factors [9]. At present, the mechanism of the effect of albedo on climate change is still unclear or uncertain, especially in the ecological transition zone with its complex climate and vegetation distribution.
Albedo represents the ability of a surface to reflect incoming solar radiation, and radiative forcing is therefore used as an explanation for its impact on climate change [23]. It has been suggested that positive radiative forcing caused by the albedo could warm the Earth’s surface while negative radiative forcing could cool it [24]. Variations in the albedo and radiative forcing are therefore considered to be significant factors controlling regional and global climate change [25,26]. Land use change has been shown to alter albedo and induce variations in the radiative forcing [24]. In the Huang-Huai region of China, the urban area expanded by 60.58% from 2000 to 2015, resulting in a 0.3986 W·m−2 change in the average radiative forcing and showing a significant warming effect on the climate [24]. However, many studies on radiative forcing have primarily focused on relevant influencing factors, such as aerosols and clouds [27,28,29,30], snow [31], anthropogenic carbon emissions [32,33], and pasture management practices [23]. There are few empirical studies on the effects of land use changes on radiative forcing and climate from the perspective of the surface albedo, especially in an ecological transition zone with a complex climatic gradient and diverse human activities.
The Qinling-Daba mountains in China are located in an ecological transition zone between subtropical and warm temperate zones and are characterized by a complex environment and diversified altitudinal belts [34]. The land use has changed from woodland and grassland to construction land and cultivated land to meet the needs of China’s continuous urbanization in the Qinling region from 1980 to 2015 [35]. This provides an excellent area to study the intricate influence of albedo changes from different land covers on climate change. This paper explores the influence of land use on albedo and radiative forcing based on changes in the land use, surface albedo, and radiative forcing from 2000 to 2015 in the Qinling-Daba mountains. This study is of great significance to comprehensively weigh the impacts of human activities on ecosystems and formulate rational scientific policies to deal with climate change problems.
2. Study Area
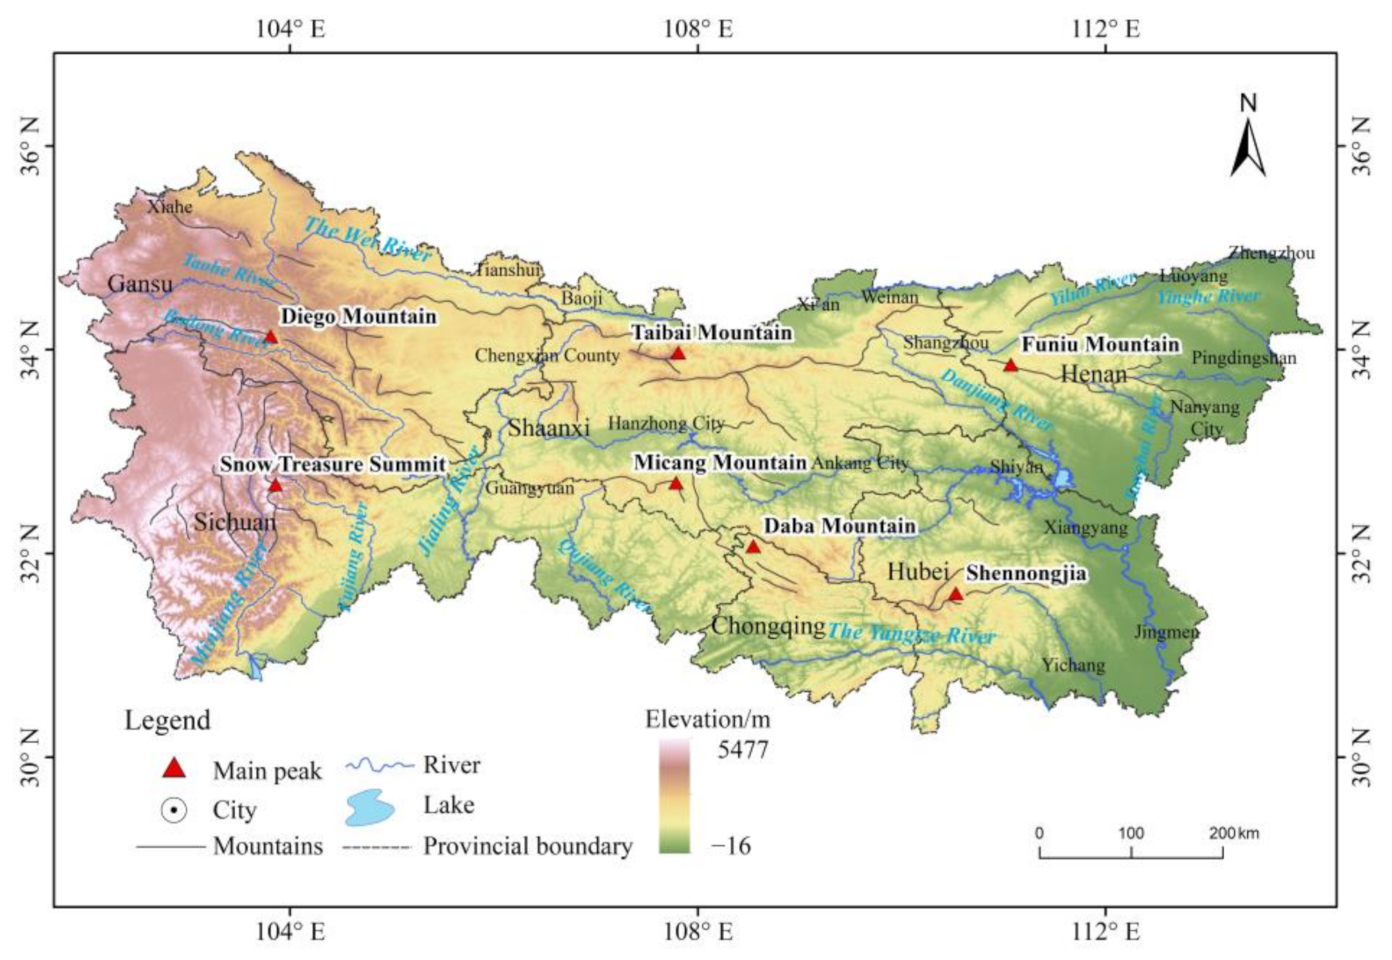
The Qinling-Daba mountains are located in Central China, range from 30° N to 37° N and from 101° E to 115° E, and span six provinces, namely, Gansu, Sichuan, Shaanxi, Chongqing, Henan, and Hubei. The Qinling-Daba mountains consist primarily of the Qinling mountains and the Daba mountains separated by the Han River Valley and include the Qinling mountains in Shaanxi Province, Funiu mountains in the East Qinling mountains, the Gannan mountains in the West Qinling mountains, northwestern Sichuan Province, and the Daba mountains (Figure 1). The Qinling-Daba mountains form a natural boundary between the warm temperate zone and the subtropical zone. The climate gradually takes on subtropical characteristics with more abundant precipitation and more sufficient solar radiation throughout the year [36] from northwest to southeast, and accordingly, the vegetation changes from a deciduous broad-leaved forest zone to an evergreen broad-leaved forest zone. West Qinling, however, is dominated by cold temperate grassland because of its higher altitude and drier climate in some valleys.
3. Materials and Methods
3.1. Data and Processing
3.1.1. Land Use Data
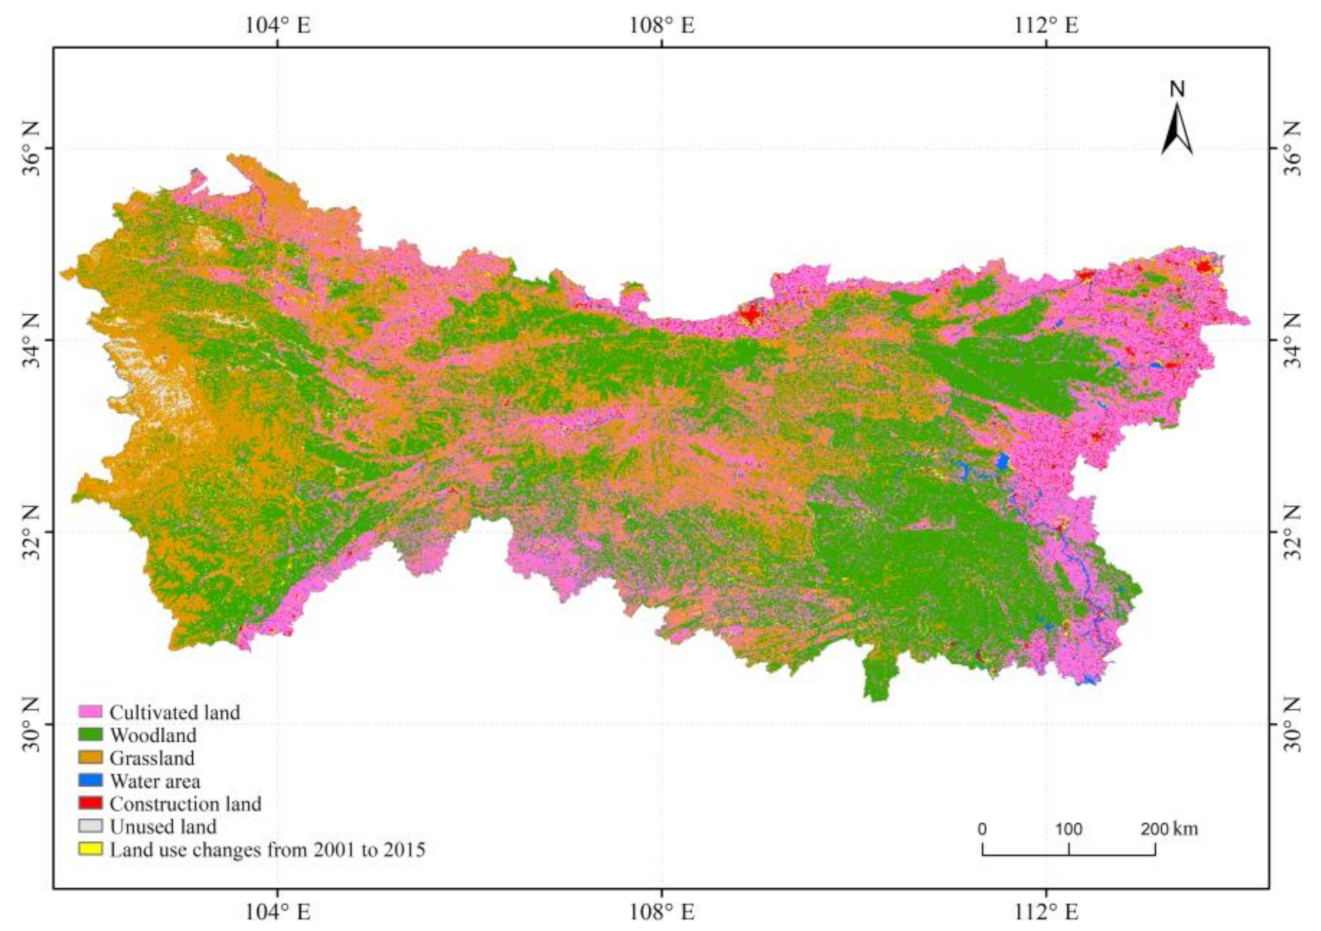
In this study, land use data from 2000, 2005, 2010, and 2015 were derived from the Resources and Environment Data Center of the Chinese Academy of Science (http://www.resdc.cn/ accessed on 23 April 2021) to explore land use changes. The land use data are raster data with a 1-km resolution, which include six first-level land cover types, i.e., cultivated land (paddy fields and dry fields), woodland (shrubbery, open woodland, etc.), grassland (natural grassland, improved grassland, mowed grassland, etc.), water area (lakes, reservoirs, ponds, beaches, etc.), construction land (urban land, rural settlements, traffic roads, etc.), and unused land (sandy land, swamp land, and bare land) (Figure 2). The coverage and area of the different land cover types were comprehensively compared and analyzed according to land use transfer matrices to reveal the spatiotemporal variation in the land use changes from 2000 to 2015 in the Qinling-Daba mountains.
3.1.2. Surface Albedo Data
The surface albedo data were derived from the sixth edition albedo product of MOD09A1, provided by the National Aeronautics and Space Administration (https://lpdaac.usgs.gov/ accessed on 23 April 2021). MOD09A1 data, which represented an eight-day period and a spatial resolution of 500 m average surface reflectance, were first averaged annually to obtain mean annual images for the year 2000, 2005, 2010, and 2015, and then converted into TIFF FORMAT with the support of MRT software. Reprojection, cropping, and scale conversion were carried out to obtain band 1, 2, 3, 4, 5, and 7 data. Based on the product, the surface albedo was calculated according to Equation (1) [37] and was then resampled to the same 1-km resolution as the land use data.
where Alb is the surface albedo and α1, α2, α3, α4, α5, and α7 are bands 1, 2, 3, 4, 5, and 7, respectively.
Alb = 0.160α1 + 0.291α2 + 0.243α3 + 0.116α4 + 0.112α5 + 0.081α7 − 0.0015
3.1.3. Solar Radiative Data
The solar radiative data were obtained from the Laboratory of Environmental Ecology, Seoul National University, South Korea, with a 0.05° spatial resolution and a daily temporal resolution (http://environment.snu.ac.kr/ accessed on 23 April 2021). The solar radiative data, as daily data, were preprocessed to eliminate the interference of clouds and aerosols and averaged annually to get annual solar radiation data from 2000 to 2015. The annual solar radiation data were converted into the same coordinate system (Krasovsky_1940_Albers) and resampled to the same 1-km resolution as the land use data and surface albedo data.
3.2. Methods
The processed surface albedo data and solar radiative data were integrated using a formula proposed by Tang et al. [38] to calculate the atmospheric top radiative forcing (RFTOA) over the Qinling-Daba mountains during the period of 2000–2015.
where RFTOA is the upper atmospheric radiative forcing; ΔRF(Alb) is the radiative forcing caused by the change in the albedo in W·m−2; RSDN is the surface solar radiative in W·m−2; Ta represents the atmospheric transport factor for surface radiative to the top of the atmosphere, with 0.854 as the global average value [39,40]; and ΔAlb is the dimensionless change in the albedo.
RFTOA = ΔRF(Alb)= − RSDN · Ta · ΔAlb
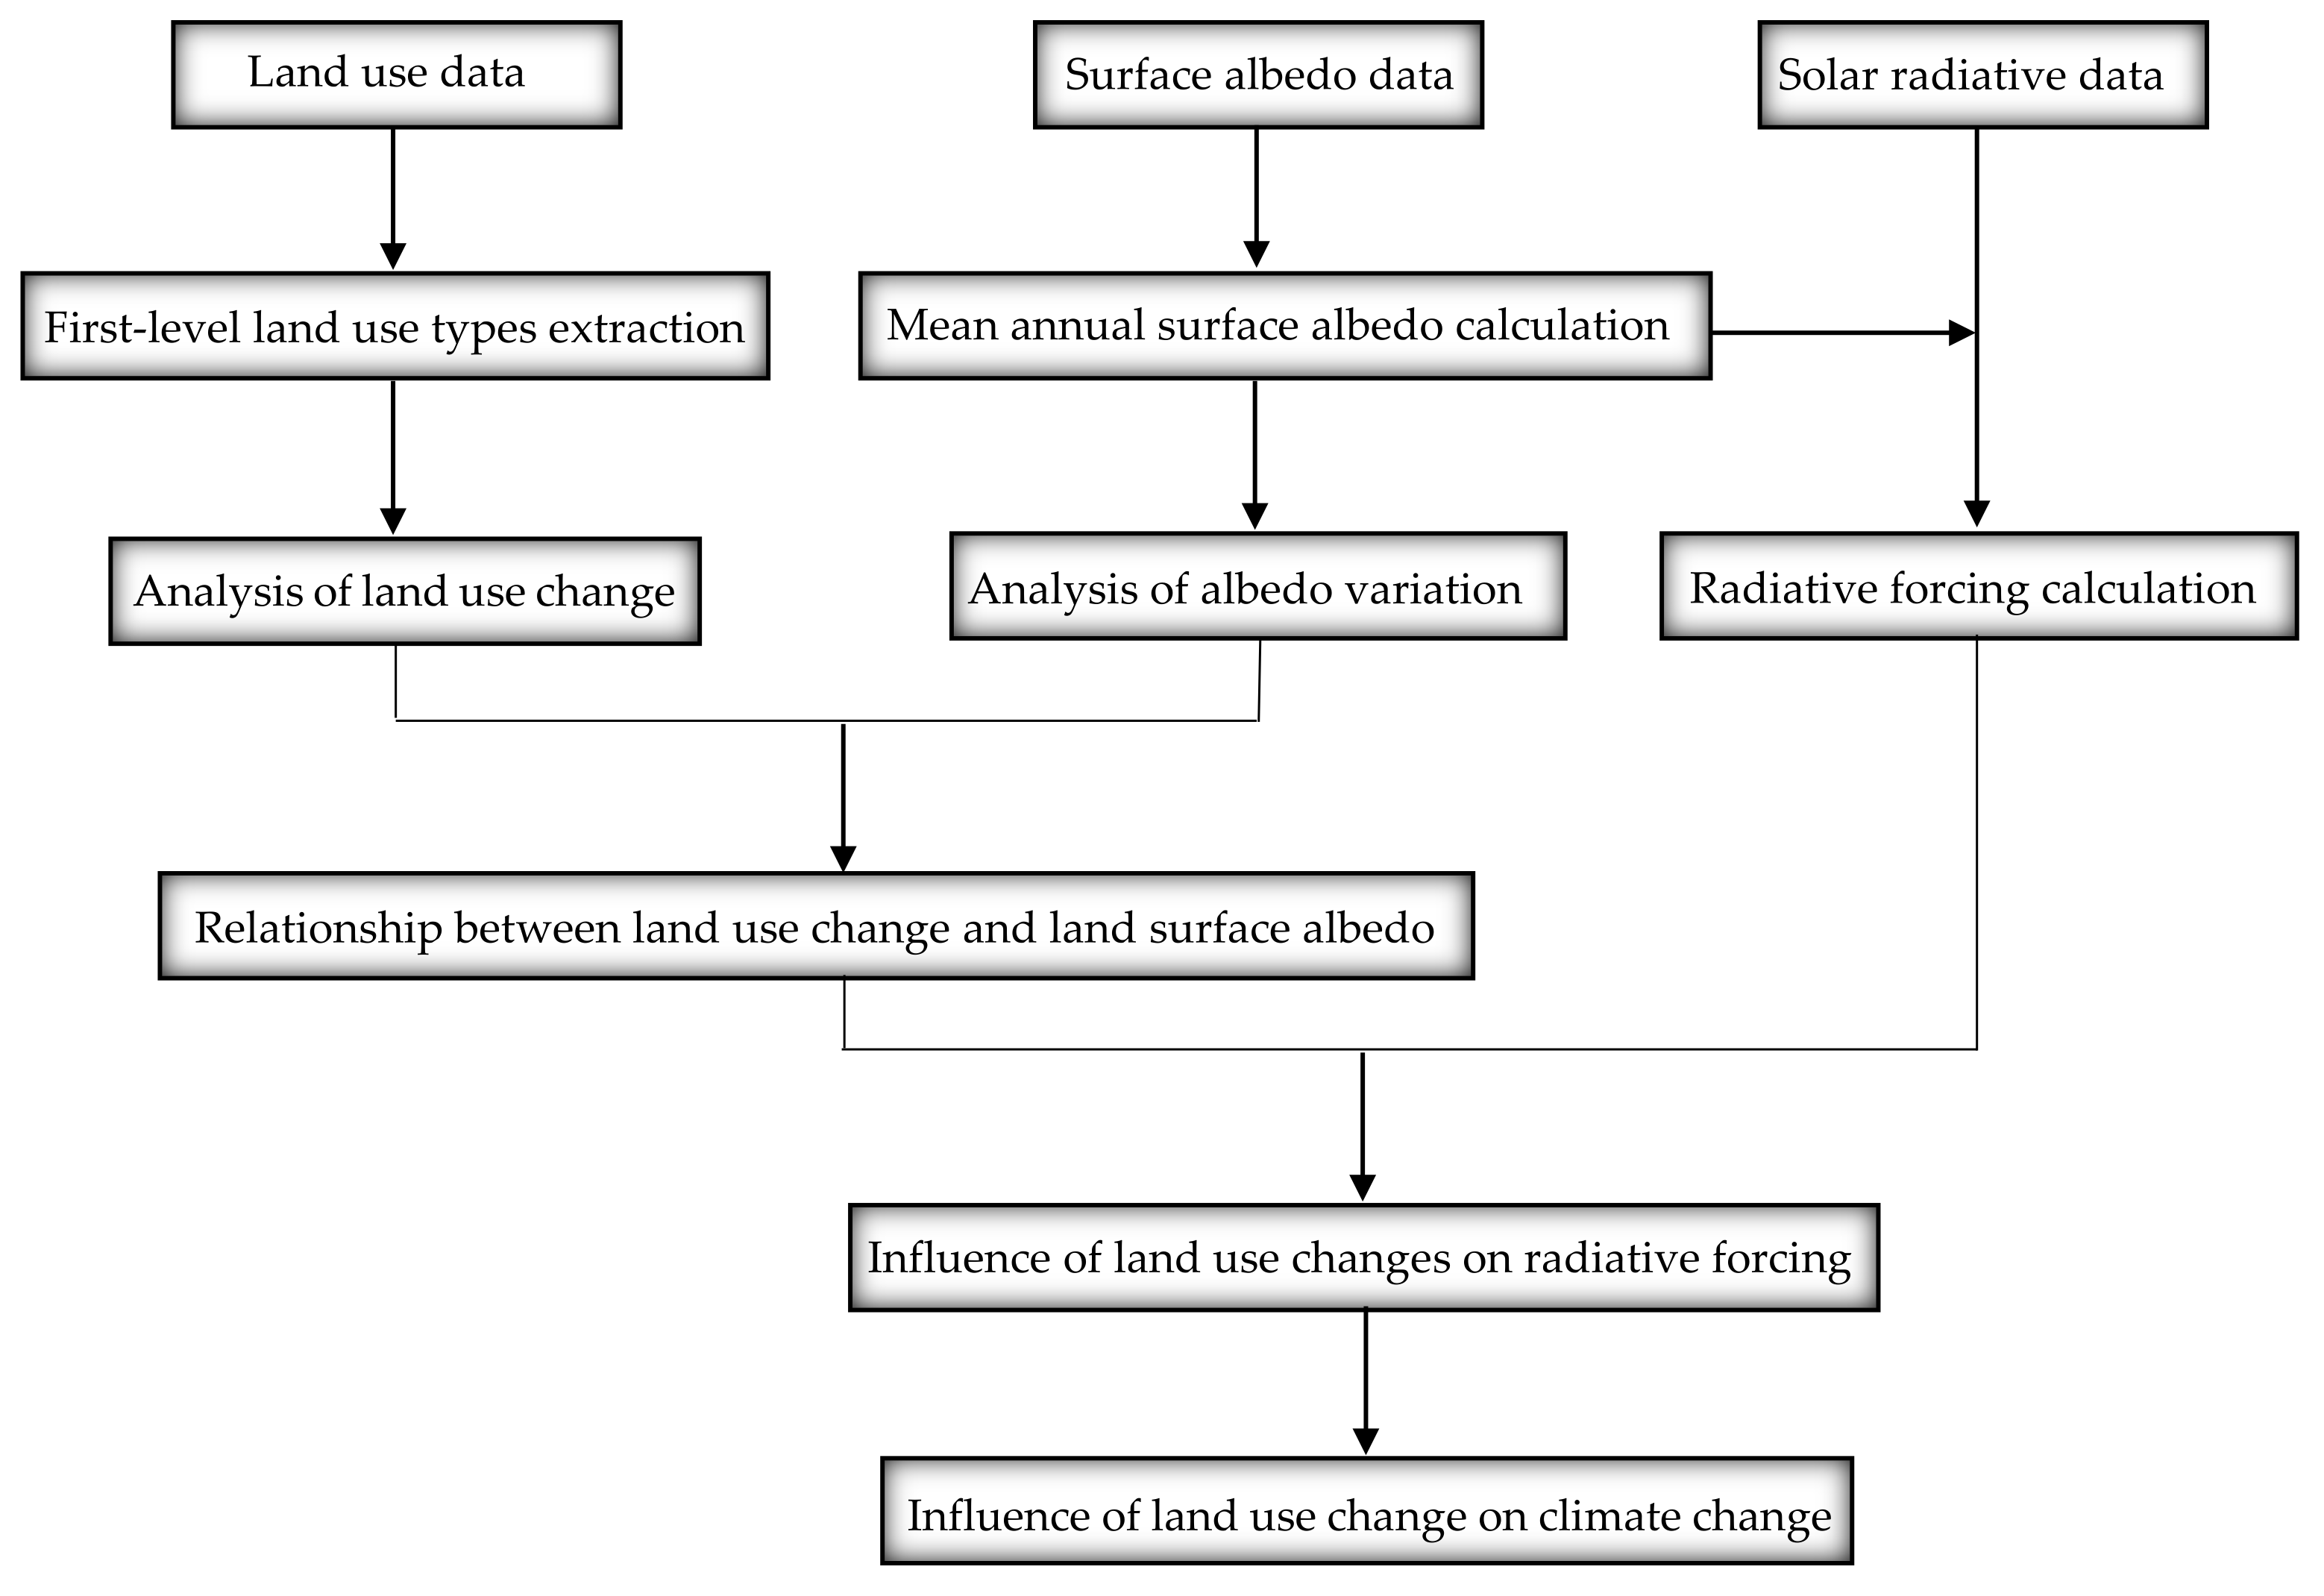
In this paper, as shown in Figure 3, we first identify the spatial–temporal characteristics of the first-level land use types based on the land cover data from 2000 to 2015. Then, we determine the variation in the albedo caused by the land use changes in 2000, 2005, 2010, and 2015 in the Qinling-Daba mountains. Finally, we analyze the correlation between the land use changes and the radiative forcing to explore the climate effects caused by land use changes on a kilometer-grid scale in the Qinling-Daba mountains.
4. Results
4.1. Changes in the Land Use in the Qinling-Daba Mountains from 2000 to 2015
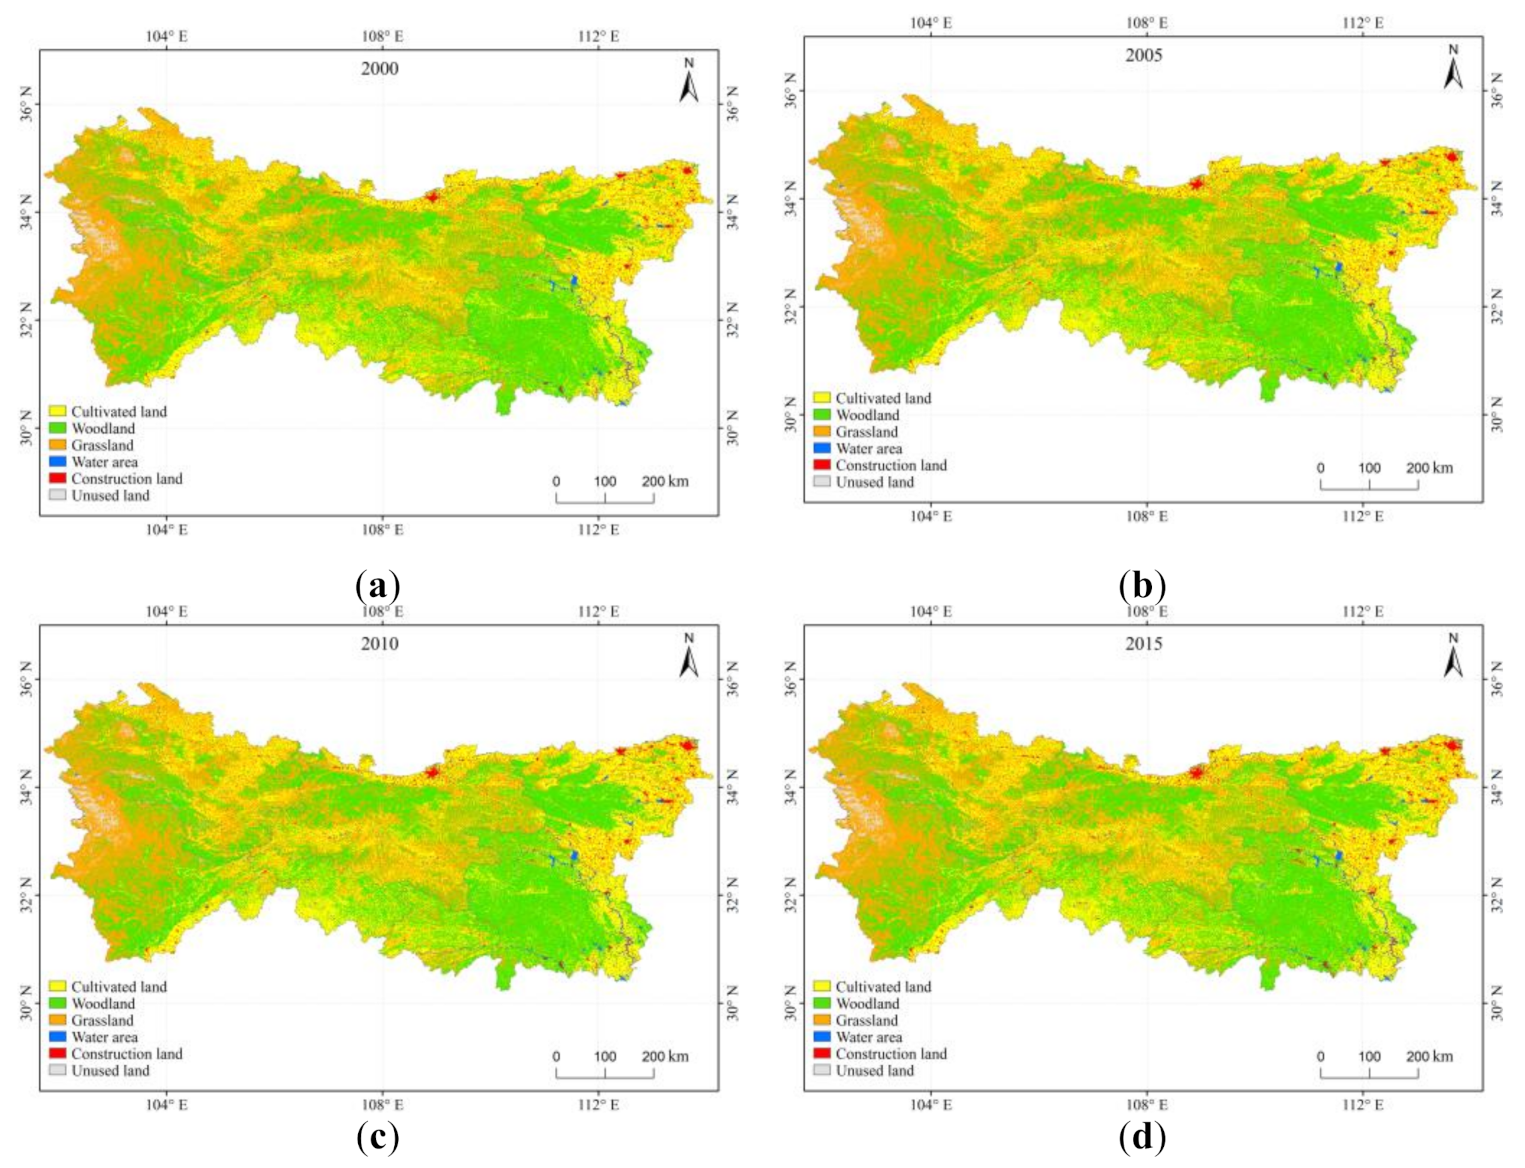
We compared the land use change map (Figure 4) and table (Table 1) in 2000, 2005, 2010, and 2015 and found that woodland, grassland, and cultivated land were the main land use types in the study area (2000–2015), accounting for more than 90% of the total land cover in the Qinling-Daba mountains. However, the different land use types showed different variations in amount and degree in the Qinling-Daba mountains from 2000 to 2015. In general, the land use area of the cultivated land and woodland decreased while that of the construction land and water area increased. Specifically, the cultivated land and woodland decreased by 3230.71 km2 (2.67%) and 400.58 km2 (0.24%), respectively, from 2000 to 2015. These decreases occurred primarily in the eastern part of the Qinling-Daba Mountains for the former and the West Qinling mountains for the latter. The construction land showed a rapidly increasing trend in the northern, eastern, and southern margins of the Qinling-Daba mountains with increments as high as 33.74% (2123.94 km2) from 2000 to 2015. Meanwhile, the water area increased by 606.47 km2 (13.95%) in the eastern part of the Qinling-Daba mountains.
Land use transfer matrices for the periods of 2000–2010 and 2010–2015 were extracted from the land use change map (Figure 4) to analyze the land use variation during the two time periods in the Qinling-Daba mountains. The year 2010 was chosen to separate the two periods because this year marked the turning point of the albedo and the radiative forcing according to their variations from 2000 to 2015.
As shown in Table 2 and Table 3, the cultivated land and woodland showed a decreasing trend from 2000 to 2010 and from 2010 to 2015. The cultivated land loss was primarily transformed into grassland, woodland, and construction land, which led to these three types increasing by 939.74 km2, 512.8 km2, and 804.5 km2, respectively, from 2000 to 2010 and 163.28 km2, 136.04 km2, and 1039.31 km2, respectively, from 2010 to 2015. The woodland loss was primarily converted into cultivated land and grassland. As a result, these two types increased by 197.8 km2 and 697.63 km2, respectively, from 2000 to 2010 and by 118.91 km2 and 36.29 km2, respectively, from 2010 to 2015.
Conversely, construction land, water area, and unused land presented obvious increasing trends with increments of 2123.94 km2 (33.74%), 606.47 km2 (13.95%), and 185.72km2 (5.33%), respectively, from 2000 to 2015. In conclusion, over the course of 15 years, the increase in the water area improved the growth of vegetation and agricultural production. The increase in the grassland area indicates that grassland restoration measures achieved remarkable results. At the same time, the total cultivated land area decreased to meet the growing demand for construction land.
4.2. Effects of Land Use Changes on Surface Albedo in the Qinling-Daba Mountains from 2000 to 2015
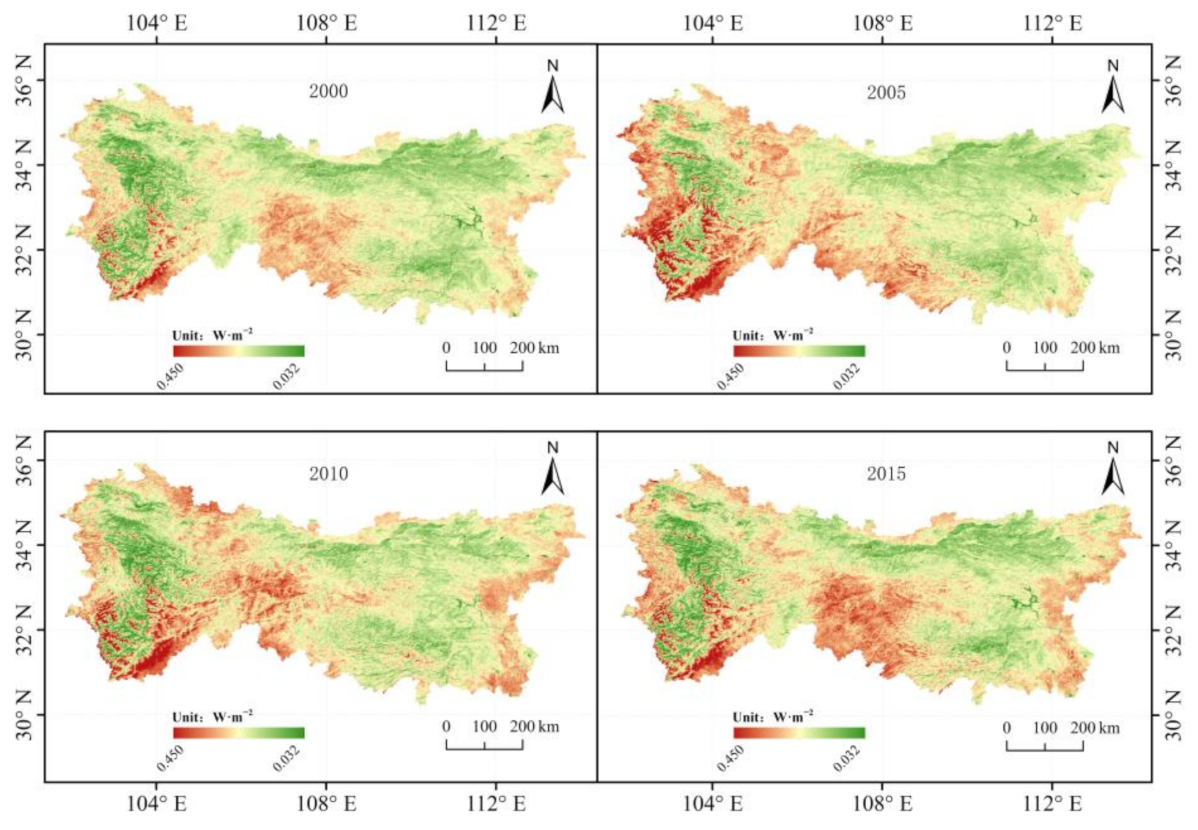
As shown in Figure 5, the surface albedo value ranged from 0.032 W·m−2 to 0.450 W·m−2 in the Qinling-Daba mountains from 2000 to 2015. The maximum surface albedo occurred in the southern part of the western Qinling-Daba mountains with values as high as 0.450 W·m−2, while the lowest surface albedo was 0.032W·m−2 in the central part of the Qinling-Daba mountains. The surface albedo presented a decreasing trend from 2000 to 2010 but an increasing trend from 2010 to 2015 (Figure 6). Specifically, the average surface albedo was 0.17 W·m−2 in 2000, decreased to 0.16 W·m−2 in 2005 and 0.15 W·m−2 in 2010, and then increased to 0.16 W·m−2 in 2015 in the Qinling-Daba mountains.
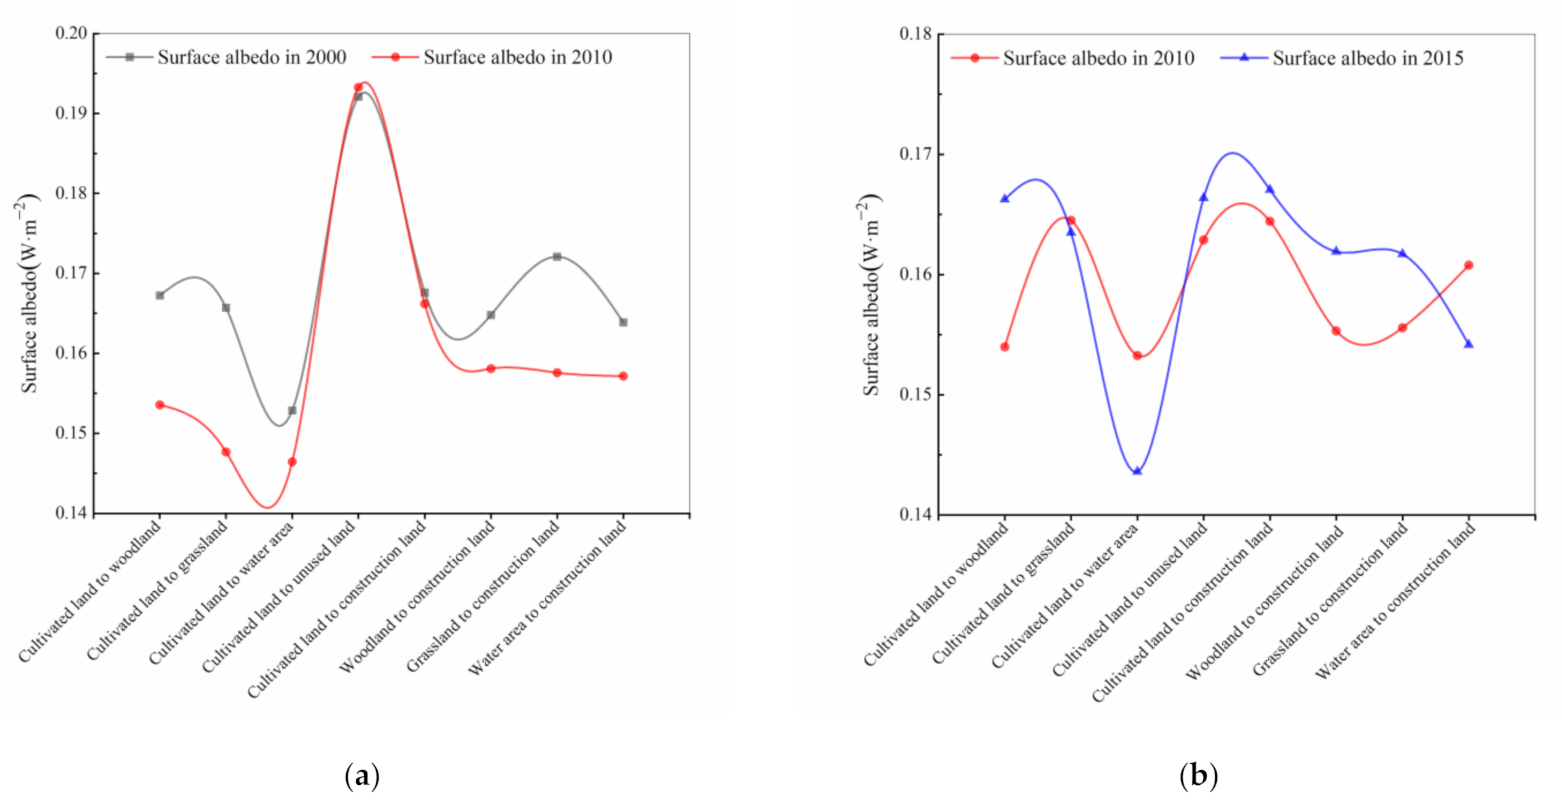
The albedo associated with different land uses was compared from 2000 to 2010 and from 2010 to 2015 to reveal changes in the albedo induced by land use changes. As shown in Figure 6, Table 4, when cultivated land was transferred to grassland, construction land, woodland, and water area, the surface albedo showed a decreasing trend. The albedos of these areas decreased from 0.165 W·m−2, 0.168 W·m−2, 0.167 W·m−2, and 0.153 W·m−2 to 0.148 W·m−2, 0.166 W·m−2, 0.154 W·m−2, and 0.146 W·m−2, respectively with decreases of 0.017 W·m−2, 0.002W·m−2, 0.013 W·m−2, and 0.007 W·m−2, respectively, from 2000 to 2010. As land use patterns such as cultivated land, woodland, grassland, and water area were transferred to construction land, the surface albedo also showed a decreasing trend with the reductions in the surface albedo being 0.002 W·m−2, 0.007 W·m−2, 0.014 W·m−2, and 0.007 W·m−2, respectively, from 2000 to 2010.
Variations in the surface albedo associated with land use changes from 2010 to 2015 were more complicated than those from 2000 to 2010. However, as cultivated land was transformed into construction land, woodland, and unused land, the surface albedo increased from 0.164 W·m−2, 0.153 W·m−2, and 0.163 W·m−2 to 0.167 W·m−2, 0.166 W·m−2, and 0.166 W·m−2, respectively, from 2010 to 2015. Conversely, when cultivated land changed into water area and grassland, the surface albedo decreased from 0.153 W·m−2 and 0.164 W·m−2 to 0.143 W·m−2 and 0.163 W·m−2, respectively. The surface albedo showed an increasing trend when cultivated land, woodland, and grassland change into construction land with increments of 0.003 W·m−2, 0.007 W·m−2, and 0.006 W·m−2, respectively. However, the surface albedo decreased by 0.007 W·m−2 when water area was converted into construction land.
4.3. Effect of Land Use Changes on Radiative Forcing in the Qinling-Daba Mountains from 2000 to 2015
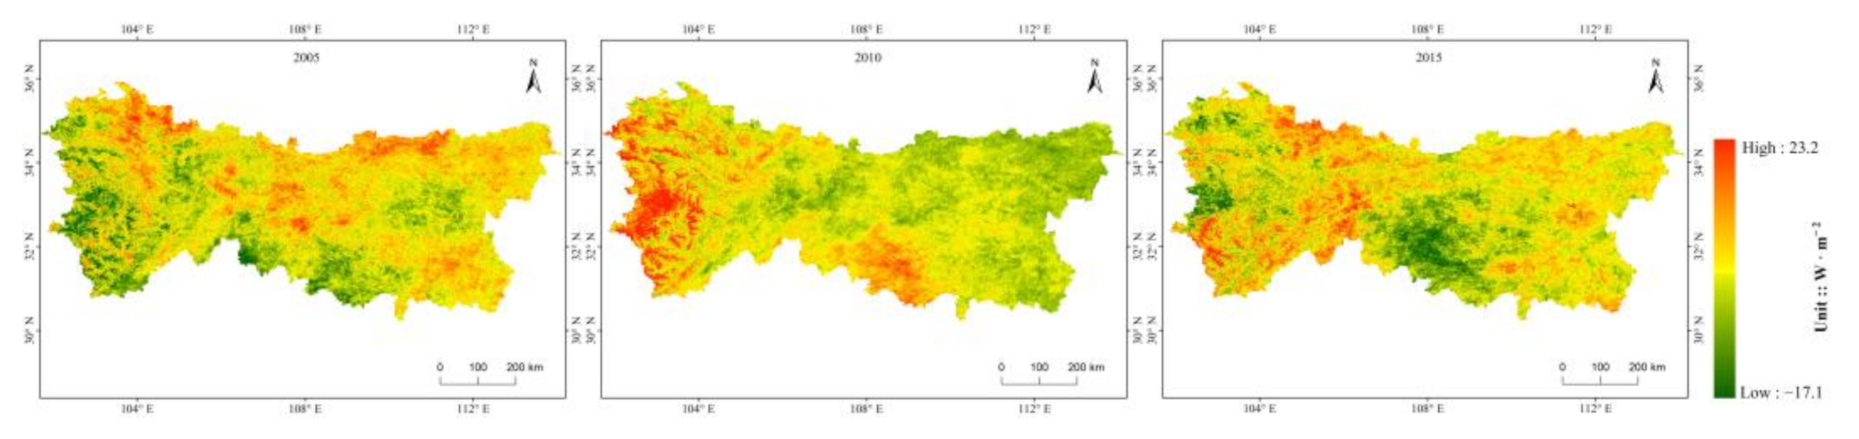
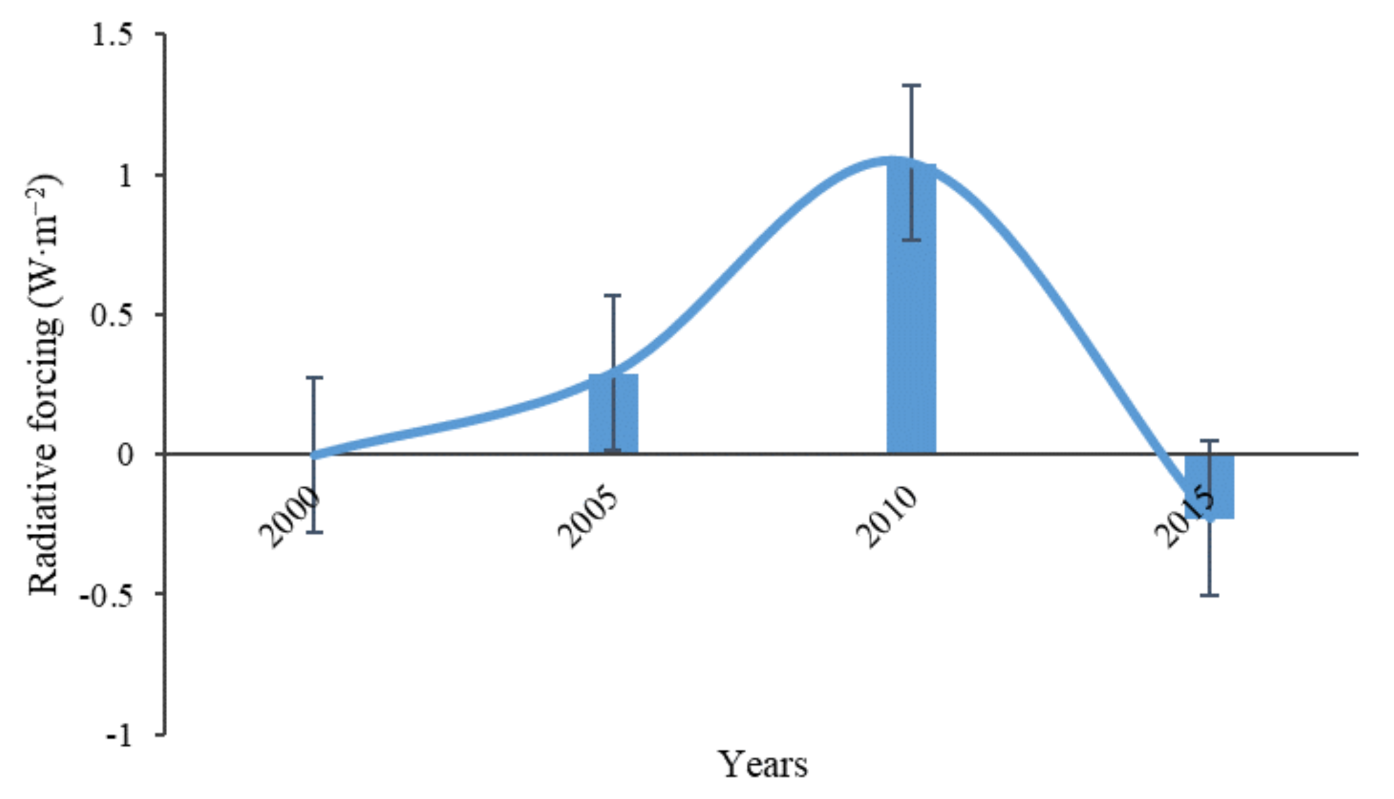
The radiative forcing presented complex variations from 2000 to 2015 in the Qinling-Daba mountains according to the spatial distribution map of the radiative forcing (Figure 7) calculated by Equation (1) and the statistical chart of the variations in the radiative forcing in different years (Figure 8). Specifically, the radiative forcing showed positive variations from 2000 to 2005 in the Qinling-Daba mountains, showing a warming effect. However, the radiative forcing varied greatly in different regions. It was positive in the northern part of the West Qinling mountains, the northern flank of the Qinling mountains, and the central part of the Qinling-Daba mountains and negative in the south and west regions of the West Qinling mountains and the southern flank of the Daba mountains.
The variation in the radiative forcing increased by 0.75 W·m−2 in 2010 relative to 2005, meaning that the warming effect became more obvious in the Qinling-Daba mountains, especially in the central and western parts of the West Qinling mountains and in the middle part of the southern flank of the Daba mountains, except in the middle and eastern parts of the Qinling mountains, where the variation in the radiative forcing was negative. In 2015, the radiative forcing decreased to −0.23 W·m−2, showing an overall cooling effect. Regionally, the most obvious cooling effect was concentrated in the central and southern parts of the Qinling-Daba mountains and the northwestern part of the West Qinling mountains.
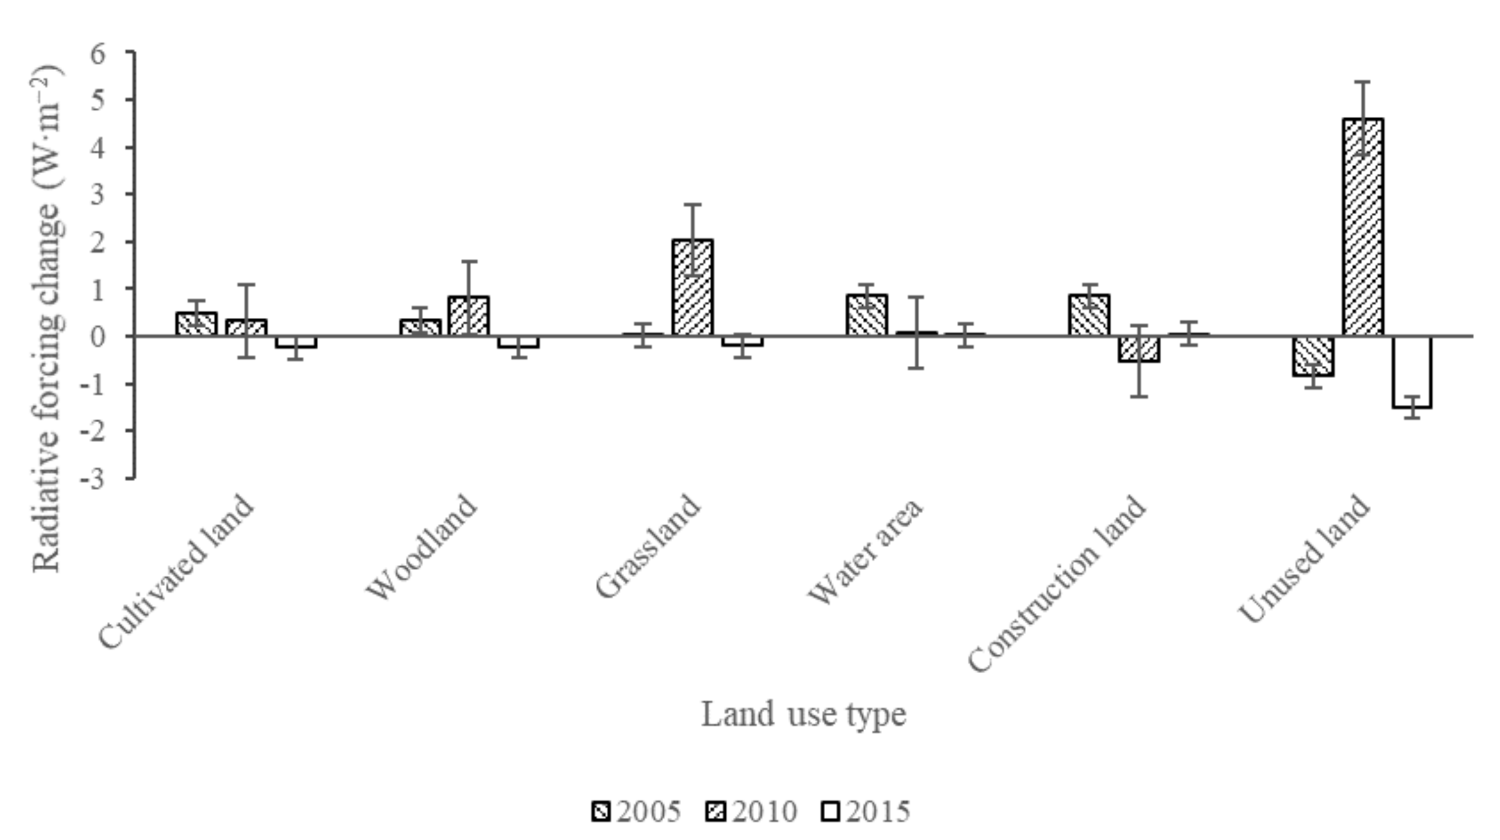
A comparison of the land use and radiative forcing shows that the radiative forcing was positive from 2005 and 2010 and negative in 2015 (Table 5, Figure 9), showing a warming effect from 2005 and 2010 and a cooling effect in 2015, as the cultivated land and woodland decreased and the grassland increased. Radiative forcing caused by the increase in the water area was positive in 2005, 2010, and 2015, showing a warming effect in these three years. The radiative forcing caused by the increase in construction had positive, negative, and positive changes, showing warming, cooling, and warming effects, in 2005, 2010, and 2015, respectively; meanwhile, the climatic effects of the unused land changes were opposite to those of the construction land in those three years.
5. Discussion
It was shown that decreases in the cultivated land and woodland and increases in the construction land and water area were the primary land use changes in the Qinling-Daba mountains from 2010 to 2015, with the former essentially being converted into the latter. This result is similar to the description in Zhang and Ren’s study on changes in the spatial–temporal patterns of land use in the Qinling-Daba mountains during the period of 1989–2010 [41]. It reflects the process of urbanization in the Qinling-Daba mountains, which is characterized by increasing construction land and the increasing occupation of cultivated land and woodland [42], which also led to the water area increasing [43,44].
Land use changes played an important role in the biogeophysical process by changing the surface albedo in the Qinling-Daba mountains from 2000 to 2015. The cultivated land decreased by 2038.13 km2, some of which was converted to grassland, leading to grassland increasing by 939.74 km2 and the surface albedo decreasing by 0.017 W·m−2 from 2000 to 2010. This is primarily because increasing the amount of grassland enhances the surface roughness coefficient [45], evapotranspiration [46], and latent heat flux [3], and the albedo decreases accordingly. The results were compared with the impact of land use change caused by forest change, cultivated land change, and grassland change on surface radiation in the world. Our results showed that the conversion of cultivated land to grassland resulted in a decreasing trend of surface albedo from 2000 to 2010, which is consistent with Hannes P et al.‘s study in Sierra Guadarrama in central Spain [8]. The construction land increased by 1266.84 km2 from 2010 to 2015, most of which were converted from cultivated land, woodland, and grassland. As a result, the albedo showed an increasing trend with increments of 0.003 W·m−2, 0.007 W·m−2, and 0.006 W·m−2. The surface albedo showed an increasing trend with land use types transferring from cultivated land, woodland, and grassland to construction land from 2010 to 2015, and the same trend was also found in China, the United States, India, and Brazil according to Zheng Y H et al.’s research in the relationships between land cover changes and surface albedo in the world [47]. The relationships between the enlarging construction land and the increasing albedo are very complex, and surface humidity, roughness, and energy balance change of land surface have been thought to be responsible for changes in surface albedo [16].
The surface albedo changes caused by land use changes had a significant effect on the radiative forcing and climate change in the Qinling-Daba mountains from 2000 to 2015. However, the relationships between the land use changes and climate change are very complex and still uncertain. The changes in the cultivated land, woodland, and grassland were positive forcings in 2005 and 2010, leading to a warming effect for the climate, while they were negative forcings in 2015, leading to a cooling effect. Overall, according to our research, the warming effect caused by land use changes was higher than the cooling effect in the Qinling-Daba mountains from 2000 to 2015, which is consistent with the general increasing trend in the global temperature. There is no doubt that the radiative forcing caused by land use changes has an impact on the climate [48], in addition to the warming effects brought on by greenhouse gases and aerosols [26]. However, the mechanism is very complicated at the regional scale, especially in complex mountainous areas [19,49], and needs to be further studied.
The resolution of land use data was 1 km, which is a little rough and there may be mixed pixels on a 1 km × 1 km surface leading to errors of land use change analysis. For instance, there were 0.13 km2 of construction land converted into unused land during 2000–2010 and 1.12 km2 of construction land converted into unused land during 2010–2015, these conversions may have been caused by errors and do not make sense for the correlative albedo change analysis. In fact, they are not the main land use transfer processes in this paper and were not used to analyze the change of surface albedo. If possible, more accurate land use data, such as 100 m or higher resolution data, could be used to improve the accuracy of land use changes in future studies.
6. Conclusions
In this study, we first analyzed the change in the land use during the period of 2000–2015. Then, we examined the variation in the albedo for the major land use change types based on the distribution of the surface albedo. Finally, we obtained the radiative forcing caused by the change in the different land use types to explore the influence of the land use change on the surface albedo and radiative forcing in the Qinling-Daba mountains. The following three conclusions can be drawn.
(1) The land use changes in the Qinling-Daba mountains primarily consisted of a decrease in the cultivated land and an increase in the construction land from 2000 to 2015. Specifically, cultivated land decreased by 2.67% and construction land increased by 33.74%. The decrease in the cultivated land was primarily accommodated by a conversion into woodland, grassland, water area, unused land, and construction land, while the increased construction land was primarily converted from cultivated land, woodland and grassland.
(2) Land use changes, which were primarily characterized by conversions between the six land use types, led to different changes in the surface albedo. The albedo presented a decreasing trend as cultivated land was converted to woodland, grassland, water area, and construction land from 2000 to 2010, whereas it increased as cultivated land, woodland, and grassland were converted to construction land from 2010 to 2015.
(3) Land use changes have a very significant effect on the radiative forcing in the Qinling-Daba mountains and can therefore impact climate change. The radiative forcing caused by changes in the cultivated land, woodland, and grassland were positive, showing a warming effect in 2005 and 2010, while the same land use changes presented an opposite climate effect in 2015. The changes in the water area showed warming effects in 2005, 2010, and 2015. The changes in the construction land were complex and showed warming, cooling, and warming changes in 2005, 2000, and 2015, respectively, while the changes in the unused land presented the opposite climatic effect to that of the construction land.
Author Contributions
Conceptualization, F.Z. and T.L.; methodology, X.L.; validation, W.Z.; data curation and visualization, W.L.; writing—original draft preparation, F.Z. and X.L.; writing—review and editing, F.Z. and T.L. All authors have read and agreed to the published version of the manuscript.
Funding
This research was funded by the National Natural Science Foundation of China (41601091) and Integrated Scientific Investigation of the North-South Transitional Zone of China (2017FY100900).
Data Availability Statement
The data that support the findings of this study are available from the authors upon reasonable request.
Acknowledgments
We thank Martha Evonuk for editing the English text of a draft of this manuscript.
Conflicts of Interest
The authors declare no conflict of interest.
References
- Pielke, R.A., Sr.; Pitman, A.; Niyogi, D.; Mahmood, R.; McAlpine, C.; Hossain, F.; Goldewijk, K.K.; Nair, U.; Betts, R.; Fall, S.; et al. Land use/land cover changes and climate: Modeling analysis and observational evidence. Wiley Interdiscip. Rev. Clim. Chang. 2011, 2, 828–850. [Google Scholar] [CrossRef]
- Dissanayake, D. Land use change and Its impacts on land surface temperature in Galle city, Sri Lanka. Climate 2020, 8, 65. [Google Scholar] [CrossRef]
- Bonan, G.B. Forests and Climate Change: Forcings, Feedbacks, and the Climate Benefits of Forests. Science 2008, 320, 1444–1449. [Google Scholar] [CrossRef] [PubMed] [Green Version]
- Luyssaert, S.; Schulze, E.D.; Börner, A.; Knohl, A.; Hessenmöller, D.; Law, B.E.; Ciais, P.; Grace, J. Old-growth forests as global carbon sinks. Nature 2008, 455, 213–215. [Google Scholar] [CrossRef]
- Andreae, M.O.; Artaxo, P.; Brandao, C.; Carswell, F.E.; Ciccioli, P.; Da Costa, A.L.; Culf, A.D.; Esteves, J.L.; Gash, J.H.; Grace, J.; et al. Biogeochemical cycling of carbon, water, energy, trace gases, and aerosols in Amazonia: The LBA-EUSTACH experiments. J. Geophys. Res. Atmos. 2002, 107, 1–25. [Google Scholar] [CrossRef] [Green Version]
- Pregitzer, K.S.; Euskirchen, E.S. Carbon cycling and storage in world forests: Biome patterns related to forest age. Glob. Chang. Biol. 2010, 10, 2052–2077. [Google Scholar] [CrossRef]
- Quesada, B.; Arneth, A.; Robertson, E.; de Noblet-Ducoudré, N. Potential strong contribution of future anthropogenic land-use and land-cover change to the terrestrial carbon cycle. Environ. Res. Lett. 2018, 13, 064023. [Google Scholar] [CrossRef]
- Schwaiger, H.P.; Bird, D.N. Integration of albedo effects caused by land use change into the climate balance: Should we still account in greenhouse gas units? For. Ecol. Manag. 2010, 260, 278–286. [Google Scholar] [CrossRef]
- Betts, R.A. Offset of the potential carbon sink from boreal forestation by decreases in surface albedo. Nature 2000, 408, 187–190. [Google Scholar] [CrossRef] [PubMed]
- Bathiany, S.; Claussen, M.; Brovkin, V.; Raddatz, T.; Gayler, V. Combined biogeophysical and biogeochemical effects of large-scale forest cover changes in the MPI Earth system model. Biogeosciences 2010, 7, 1383–1399. [Google Scholar] [CrossRef] [Green Version]
- Devaraju, N.; de Noblet-Ducoudré, N.; Quesada, B.; Bala, G. Quantifying the Relative Importance of Direct and Indirect Biophysical Effects of Deforestation on Surface Temperature and Teleconnections. J. Clim. 2018, 31, 3811–3829. [Google Scholar] [CrossRef]
- Brovkin, V.; Ganopolski, A.; Claussen, M.; Kubatzki, C.; Petoukhov, V. Modelling climate response to historical land cover change. Springer US 1999, 8, 509–517. [Google Scholar] [CrossRef] [Green Version]
- Li, Z.; Deng, X.; Shi, Q.; Ke, X.; Liu, Y. Modeling the Impacts of Boreal Deforestation on the Near-Surface Temperature in European Russia. Adv. Meteorol. 2013, 2013, 486962. [Google Scholar] [CrossRef]
- Ridgwell, A.; Singrayer, J.; Hetherington, A.L.; Valdes, P. Tackling future climate change by leaf albedo bio-geoengineering. Curr. Biol. 2009, 19, 146–150. [Google Scholar] [CrossRef] [Green Version]
- Culf, A.D.; Fisch, G.; Hodnett, M.G. The Albedo of Amazonian Forest and Ranch Land. J. Clim. 1995, 8, 1544–1554. [Google Scholar] [CrossRef] [Green Version]
- Brovkin, V.; Claussen, M.; Driesschaert, E.; Fichefet, T.; Kicklighter, D.; Loutre, M.F.; Matthews, H.D.; Ramankutty, N.; Schaeffer, M.; Sokolov, A. Biogeophysical effects of historical land cover changes simulated by six Earth system models of intermediate complexity. Clim. Dyn. 2006, 26, 587–600. [Google Scholar] [CrossRef]
- Davin, E.L.; Noblet-Ducoudré, N. Climatic Impact of Global-Scale Deforestation: Radiative versus Nonradiative Processes. J. Clim. 2010, 23, 97–112. [Google Scholar] [CrossRef]
- Matthews, H.D.; Weaver, A.J.; Meissner, K.J.; Gillett, N.P.; Eby, M. Natural and anthropogenic climate change: Incorporating historical land cover change, vegetation dynamics and the global carbon cycle. Clim. Dyn. 2004, 22, 461–479. [Google Scholar] [CrossRef]
- Nobre, C.A.; Sellers, P.J.; Shukla, J. Amazonian Deforestation and Regional Climate Change. J. Clim. 1991, 4, 957–988. [Google Scholar] [CrossRef] [Green Version]
- Defries, R.S.; Bounoua, L.; Collatz, G.J. Human modification of the landscape and surface climate in the next fifty years. Glob. Chang. Biol. 2002, 8, 438–458. [Google Scholar] [CrossRef]
- Bounoua, L.; DeFries, R.; Collatz, G.J.; Sellers, P.; Khan, H. Effects of Land Cover Conversion on Surface Climate. Clim. Chang. 2002, 52, 29–64. [Google Scholar] [CrossRef]
- Govindasamy, B.; Duffy, P.B.; Caldeira, K. Land use changes and northern hemisphere cooling. Geophys. Res. Lett. 2001, 28, 291–294. [Google Scholar] [CrossRef]
- Liu, J.; Worth, D.E.; Desjardins, R.L.; Haak, D.; McConkey, B.; Cerkowniak, D. Influence of two management practices in the Canadian Prairies on radiative forcing. Sci. Total Environ. 2021, 765, 142701. [Google Scholar] [CrossRef]
- Shenhui, Z.; Wenli, L.; Ke, W.; Yuxuan, Z.; Shiqi, Y.; Bin, Z.; Yaoping, C.; Lijun, W. Research on Surface Radiative Regulation of Urban Expansion in Huanghuai Plain in China from 2000 to 2015. J. Henan Univ. (Nat. Sci.) 2021, 51, 1–11. (In Chinese) [Google Scholar]
- Shi, S.; Zhu, B.; Lu, W.; Yan, S.; Fang, C.; Liu, X.; Liu, D.; Liu, C. Estimation of radiative forcing and heating rate based on vertical observation of black carbon in Nanjing, China. Sci. Total Environ. 2021, 756, 144135. [Google Scholar] [CrossRef]
- Srivastava, A.K.; Mehrotra, B.J.; Singh, A.; Singh, V.; Bisht, D.S.; Tiwari, S.; Srivastava, M.K. Implications of different aerosol species to direct radiative forcing and atmospheric heating rate. Atmos. Environ. 2020, 241, 117820. [Google Scholar] [CrossRef]
- Zhang, X.; Wang, H.; Che, H.Z.; Tan, S.C.; Yao, X.P.; Peng, Y.; Shi, G.Y. Radiative forcing of the aerosol-cloud interaction in seriously polluted East China and East China Sea. Atmos. Res. 2020, 252, 105405. [Google Scholar] [CrossRef]
- Chang, D.Y.; Yoon, J.; Lelieveld, J.; Park, S.K.; Yum, S.S.; Kim, J.; Jeong, S. Direct radiative forcing of biomass burning aerosols from the extensive Australian wildfires in 2019–2020. Environ. Res. Lett. 2021, 16, 044041. [Google Scholar] [CrossRef]
- Khan, R.; Kumar, K.R.; Zhao, T.; Ali, G. The contribution of different aerosol types to direct radiative forcing over distinct environments of Pakistan inferred from the AERONET data. Environ. Res. Lett. 2020, 15, 114062. [Google Scholar] [CrossRef]
- Peace, A.H.; Carslaw, K.S.; Lee, L.A.; Regayre, L.A.; Booth, B.B.B.; Johnson, J.S.; Bernie, D. Effect of aerosol radiative forcing uncertainty on projected exceedance year of a 1.5 degrees C global temperature rise. Environ. Res. Lett. 2020, 15, 0940a6. [Google Scholar] [CrossRef]
- Weihs, P.; Laimighofer, J.; Formayer, H.; Olefs, M. Influence of snow making on albedo and local radiative forcing in an alpine area. Atmos. Res. 2021, 255, 105448. [Google Scholar] [CrossRef]
- Liu, M.; Matsui, H. Aerosol radiative forcings induced by substantial changes in anthropogenic emissions in China from 2008 to 2016. Atmos. Chem. Phys. 2021, 21, 5965–5982. [Google Scholar] [CrossRef]
- Li, N.; Cui, Y.; Fu, Y.; Liu, X.; Run, Y.; Li, M.; Chen, L.; Xia, H.; Lu, H. Contribution of anthropogenic CO(2)in China to global radiative forcing and its offset by the ecosystem during 2000–2015. Ann. N. Y. Acad. Sci. 2021, 1488, 56–66. [Google Scholar] [CrossRef] [PubMed]
- Zhao, F.; Liu, J.; Zhu, W.; Zhang, B.; Zhu, L. Spatial variation of altitudinal belts as dividing index between warm temperate and subtropical zones in the Qinling-Daba Mountains. J. Geogr. Sci. 2020, 30, 642–656. [Google Scholar] [CrossRef]
- Guo, S.; Bai, H.; Meng, Q.; Zhao, T.; Huang, X.; Qi, G. Landscape pattern changes of woodland and grassland and its driving forces in Qinling Mountains. Acta Ecol. Sin. 2020, 40, 130–140. [Google Scholar]
- Yuanyuan, R. Vegetation Index Change and Its Driving Force Analysis in Daba Mountains. Master’s Thesis, Northwest University, Xian, China, 2012. [Google Scholar]
- Liang, S. Narrowband to broadband conversions of land surface albedo I: Algorithms. Remote Sens. Environ. 2001, 76, 213–238. [Google Scholar] [CrossRef]
- Tang, X.; Cui, Y.; Li, N.; Fu, Y.; Liu, X.; Run, Y.; Li, M.; Zhao, G.; Dong, J. Human activities enhance radiation forcing through surface albedo associated with vegetation in Beijing. Remote Sens. 2020, 12, 837. [Google Scholar] [CrossRef] [Green Version]
- Muñoz, I.; Campra, P.; Fernández-Alba, A. Including CO2-emission equivalence of changes in land surface albedo in life cycle assessment. Methodology and case study on greenhouse agriculture. Int. J. Life Cycle Assess. 2010, 15, 672–681. [Google Scholar] [CrossRef]
- Bright, R.M.; Cherubini, F.; Strømman, A.H. Climate impacts of bioenergy: Inclusion of carbon cycle and albedo dynamics in life cycle impact assessment. Environ. Impact Assess. Rev. 2012, 37, 2–11. [Google Scholar] [CrossRef]
- Zhang, J.; Ren, Z. Spatiotemporal pattern and terrain gradient effect of land use change in Qinling-Bashan mountains. Trans. Chin. Soc. Agric. Eng. 2016, 32, 250–257. [Google Scholar]
- Gen, G. In the process of city land use problems and solution approach--Taking Beijing city as an example. Master’s Thesis, Huazhong Normal University, Wuhan, China, 2015. [Google Scholar]
- Zhiyou, Y.; Jun, W.; Junpeng, S. Study on the Relationship between rainstorm and topography in Qinling Mountains. Shaanxi Meteorol. 2004, 1. (In Chinese) [Google Scholar]
- Qing-Ling, L.; Yan-Fang, L. Effect of Urbanization on the Water Landscape Pattern. Hubei Agric. Sci. 2016, 55, 1949–1956. [Google Scholar]
- Betts, R.A. Biogeophysical impacts of land use on present-day climate: Near-surface temperature change and radiative forcing. Atmos. Sci. Lett. 2001, 2, 39–51. [Google Scholar] [CrossRef]
- Bonan, G.B. Effects of land use on the climate of the United States. Clim. Chang. 1997, 37, 449–486. [Google Scholar] [CrossRef]
- Zheng, Y.H.; Huang, L.; Zhai, J. Impacts of land cover changes on surface albedo in China, the United States, India and Brazil. J. Remote Sens. 2020, 24, 917–932. [Google Scholar]
- Doughty, C.E.; Field, C.B.; McMillan, A.M. Can crop albedo be increased through the modification of leaf trichomes, and could this cool regional climate? Clim. Chang. 2011, 104, 379–387. [Google Scholar] [CrossRef]
- Henderson-Sellers, A.; Dickinson, R.E.; Durbidge, T.B.; Kennedy, P.J.; McGuffie, K.; Pitman, A.J. Tropical deforestation: Modeling local- to regional-scale climate change. J. Geophys. Res. 1993, 98, 7289–7315. [Google Scholar] [CrossRef]
Figure 1.
Map of the study area.

Figure 2.
Land use data in 2000 and land use changes in the Qinba mountains from 2001 to 2015.

Figure 3.
Flow chart of main methods in this study.

Figure 4.
Land use changes map for the Qinling-Daba mountains from 2000 to 2015. (a) Classification of land use in 2000; (b) Classification of land use in 2005; (c) Classification of land use in 2010; (d) Classification of land use in 2015.
Figure 4.
Land use changes map for the Qinling-Daba mountains from 2000 to 2015. (a) Classification of land use in 2000; (b) Classification of land use in 2005; (c) Classification of land use in 2010; (d) Classification of land use in 2015.

Figure 5.
Changes in the surface albedo in the Qinling-Daba mountains from 2000 to 2015.

Figure 6.
Albedo before and after land use changes from 2000 to 2010 (a) and from 2010 to 2015 (b).

Figure 7.
Change in the radiative forcing in different regions in the Qinling-Daba mountains from 2000 to 2015.
Figure 7.
Change in the radiative forcing in different regions in the Qinling-Daba mountains from 2000 to 2015.

Figure 8.
Variation in the radiative forcing in the Qinling-Daba mountains from 2000 to 2015.

Figure 9.
Relationship between the changes in the land use and radiative forcing from 2000 to 2015.


Table 1.
Land use changes in the Qinling-Daba mountains area from 2000 to 2015 in km2.
| Land Use Type | 2000 | 2005 | 2010 | 2015 |
| Cultivated land | 120,820.92 | 119,270.15 | 118,782.79 | 117,590.21 |
| Woodland | 166,513.10 | 166,300.86 | 166,356.31 | 166,112.52 |
| Grassland | 124,723.29 | 125,524.47 | 125,493.51 | 125,435.23 |
| Water area | 4347.12 | 4655.25 | 4772.90 | 4953.59 |
| Construction land | 6295.76 | 6881.25 | 7152.86 | 8419.70 |
| Unused land | 3483.51 | 3555.25 | 3622.24 | 3669.23 |
Table 2.
Land use changes transfer matrix in the Qinling-Daba mountains area from 2000 to 2010 in km2.
Table 2.
Land use changes transfer matrix in the Qinling-Daba mountains area from 2000 to 2010 in km2.
| 2000 Land Use Type | 2010 | |||||
|---|---|---|---|---|---|---|
| Cultivated Land | Woodland | Grassland | Water Area | Construction Land | Unused Land | |
| Cultivated land | 118,204.44 | 512.80 | 939.74 | 339.01 | 804.50 | 5.36 |
| Woodland | 197.80 | 165,367.82 | 697.63 | 102.45 | 77.06 | 68.92 |
| Grassland | 246.08 | 455.34 | 123,774.35 | 50.22 | 40.02 | 154.26 |
| Water area | 58.65 | 12.92 | 3.89 | 4244.57 | 21.28 | 1.00 |
| Construction land | 65.79 | 3.62 | 3.11 | 13.82 | 6209.30 | 0.13 |
| Unused land | 0.06 | 0.93 | 72.01 | 17.95 | 3392.56 | |
Table 3.
Land use changes transfer matrix in the Qinling-Daba mountains area from 2010 to 2015 in km2.
Table 3.
Land use changes transfer matrix in the Qinling-Daba mountains area from 2010 to 2015 in km2.
| 2010 Land Use Type | 2015 | |||||
|---|---|---|---|---|---|---|
| Cultivated Land | Woodland | Grassland | Water Area | Construction Land | Unused Land | |
| Cultivated land | 117,271.58 | 136.04 | 163.28 | 138.84 | 1039.31 | 21.98 |
| Woodland | 118.91 | 165,943.91 | 36.29 | 54.00 | 199.51 | 3.69 |
| Grassland | 106.04 | 27.96 | 125,224.66 | 25.44 | 82.32 | 26.89 |
| Water area | 15.84 | 1.33 | 4.76 | 4728.61 | 21.92 | |
| Construction land | 70.46 | 3.28 | 1.64 | 2.92 | 7073.44 | 1.12 |
| Unused land | 0.03 | 4.12 | 1.00 | 2.00 | 3614.89 | |
Table 4.
Albedo change associated with land use change during 2000–2015, unit:(W·m−2).
| Albedo Variation in Years | Albedo Variation during 2000–2010 (2000) (W·m−2) | Albedo Variation during 2000–2010 (2010) (W·m−2) | Albedo Variation during 2010–2015 (2010) (W·m−2) | Albedo Variation during 2010–2015 (2015) (W·m−2) | |
|---|---|---|---|---|---|
| Land Use Change | |||||
| Cultivated land to woodland | 0.167 | 0.154 | 0.153 | 0.166 | |
| Cultivated land to grassland | 0.165 | 0.148 | 0.164 | 0.163 | |
| Cultivated land to water area | 0.153 | 0.146 | 0.153 | 0.143 | |
| Cultivated land to unused land | 0.192 | 0.193 | 0.163 | 0.166 | |
| Cultivated land to construction land | 0.168 | 0.166 | 0.164 | 0.167 | |
| Woodland to construction land | 0.165 | 0.158 | 0.155 | 0.162 | |
| Grassland to construction land | 0.172 | 0.158 | 0.156 | 0.162 | |
| Water area to construction land | 0.164 | 0.157 | 0.161 | 0.154 | |
Table 5.
Changes in the radiative forcing for the different land use types compared with 2010.
| Land Use Type | 2005 (W·m−2) | 2010 (W·m−2) | 2015 (W·m−2) |
|---|---|---|---|
| Cultivated land | 0.49 | 0.33 | −0.24 |
| Woodland | 0.33 | 0.82 | −0.23 |
| Grassland | 0.02 | 2.04 | −0.20 |
| Water area | 0.85 | 0.08 | 0.03 |
| Construction land | 0.85 | −0.53 | 0.05 |
| Unused land | −0.84 | 4.60 | −1.50 |
Publisher’s Note: MDPI stays neutral with regard to jurisdictional claims in published maps and institutional affiliations. |
© 2021 by the authors. Licensee MDPI, Basel, Switzerland. This article is an open access article distributed under the terms and conditions of the Creative Commons Attribution (CC BY) license (https://creativecommons.org/licenses/by/4.0/).
Share and Cite
MDPI and ACS Style
Zhao, F.; Lan, X.; Li, W.; Zhu, W.; Li, T. Influence of Land Use Change on the Surface Albedo and Climate Change in the Qinling-Daba Mountains. Sustainability 2021, 13, 10153. https://0-doi-org.brum.beds.ac.uk/10.3390/su131810153
AMA Style
Zhao F, Lan X, Li W, Zhu W, Li T. Influence of Land Use Change on the Surface Albedo and Climate Change in the Qinling-Daba Mountains. Sustainability. 2021; 13(18):10153. https://0-doi-org.brum.beds.ac.uk/10.3390/su131810153
Chicago/Turabian StyleZhao, Fang, Xincan Lan, Wuyang Li, Wenbo Zhu, and Tianqi Li. 2021. "Influence of Land Use Change on the Surface Albedo and Climate Change in the Qinling-Daba Mountains" Sustainability 13, no. 18: 10153. https://0-doi-org.brum.beds.ac.uk/10.3390/su131810153
Note that from the first issue of 2016, this journal uses article numbers instead of page numbers. See further details here.