Monitoring and Analysis of Surface Deformation in Mining Area Based on InSAR and GRACE


1
NASG Key Laboratory of Land Environment and Disaster Monitoring, China University of Mining and Technology, Xuzhou 221116, China
2
School of Environment Science and Spatial Informatics, China University of Mining and Technology, Xuzhou 221116, China
3
Jiangsu Key Laboratory of Resources and Environmental Information Engineering, China University of Mining and Technology, Xuzhou 221116, China
*
Author to whom correspondence should be addressed.
Remote Sens. 2018, 10(9), 1392; https://0-doi-org.brum.beds.ac.uk/10.3390/rs10091392
Submission received: 14 July 2018
/
Revised: 21 August 2018
/
Accepted: 28 August 2018
/
Published: 1 September 2018
(This article belongs to the Special Issue Remote Sensing of Land Subsidence)
Abstract
:To determine the relationship between underground mining, groundwater storage change, and surface deformation, we first used two sets of ENVISAT data and one set of Sentinel-1A data to obtain surface deformation in eastern Xuzhou coalfield based on the temporarily coherent point interferometric synthetic aperture radar (TCPInSAR) technique. By comparison with underground mining activities, it indicated that the surface subsidence is mainly related to mine exploitation and residual subsidence in the goaf, while the surface uplift is mainly related to restoration of the groundwater level. The average groundwater storage change in the eastern Xuzhou coalfield from January 2005 to June 2017 was obtained through the Gravity Recovery and Climate Experiment (GRACE) data, and the results indicated that the groundwater storage changed nonlinearly with time. The reliability of the groundwater monitoring results was qualitatively validated by using measured well data from April 2009 to April 2010. Combining with time of mining and mine closing analysis, groundwater storage change within the research area had a strong correlation with drainage activity of underground mining. An analysis was finally conducted on the surface deformation and the groundwater storage change within the corresponding time. The results indicated that the groundwater storage variation in the research area has a great influence on the surface deformation after the mine closed.
1. Introduction
Among the approximately 7.0 billion m3/year groundwater runoff system in northern China, approximately 2.7 billion m3/year is related to various mining activities [1]. When the mining activity is located in or near a groundwater system, it will affect the hydrogeological condition and the natural cycle and evolution patterns of groundwater system [2,3]. During development and recovery in mining activities, the groundwater must be drained. Meanwhile, extraction of coal causes the generation of a large number of cracks in the rock formation (the cracks can even extend to the surface), which intercept and change the discharging condition of groundwater runoff and tighten the hydraulic connection of various aquifers. Moreover, the continuous supply of water through atmospheric precipitation and surface water causes more water inflow to the mine; as such, the mine becomes the discharging center of groundwater in the mining area [2]. Therefore, the process of mine exploitation and production is accompanied by changes in water circulation patterns in the groundwater system [3]. The drainage condition changes caused by the mine closing lead to new changes in the already-disturbed groundwater flow. The recharge of groundwater will alter the hydrodynamic conditions and, thus, can produce geologic hazards. For example, the recharge of groundwater changes the pore water pressure in rock formations and further changes the effective stress between collapsing solid skeletons, which will cause secondary surface subsidence in the already stabilized subsidence region [4,5]. Since the mining space is recharged with water, the rock pillar will become softened and damaged and eventually collapse, causing geologic hazards on the surface of the mining area [6]. When the groundwater level in the abandoned mine rises to the level of the tunnel connected to the adjacent mines, water will flow into the adjacent mines. When the water level rises, the lateral water pressure increases, and water eventually bursts into adjacent mines in the form of goaf water, causing the occurrence of water inrush accidents [7]. Therefore, studies on the relationship between underground mining activity, groundwater level variation in a mine during and after the mine exploitation, and surface deformation are of important significance. It is necessary to study the mechanism of mining overburden deformation under the effect of groundwater, improve the prediction and forecast model of mining subsidence, and prevent the occurrence of a geologic hazard.
To monitor and analyze the surface deformation caused by coal mining, traditional monitoring methods (such as leveling survey, global navigation satellite system, and three-dimensional laser scanning) can provide information of point deformation with high accuracy. However, the traditional monitoring methods have low spatial coverage and are, thus, difficult to effectively monitor the surface deformation of the entire mining area [8,9]. The differential interferometric synthetic aperture radar (DInSAR) technique has the advantages of all-day, all-weather, and high-space coverage, and it has been well applied on the aspects of earthquakes [10], volcanoes [11], glacier movements [12], and subsidence caused by the exploitation of urban groundwater [13] and mines [8,9,14]. The DInSAR technique can not only overcome the shortcomings of traditional methods, but can also obtain high-resolution surface deformation. The monitoring accuracy of DInSAR can reach the centimeter level [15]. However, because the DInSAR technique is seriously affected by atmospheric delay noise and spatio-temporal incoherence, it has limited capability to extract long-term surface deformation.
To overcome the shortcomings of the DInSAR technique, the persistent scatterer (PS) InSAR technique [16], the small baseline subset (SBAS) technique [17], interferometric point target analysis (IPTA) [18], the coherence pixel technique (CPT) [19], and the temporarily coherent point (TCP) InSAR technique [20,21,22,23] have been successively proposed. Moreover, these multi-temporal InSAR techniques have been fairly well applied in mining areas, such as the Nord/Pas-de-Calais coal basin, Northern France [24], Luxembourg region, French-German border [25], Azul mine, Brazil [26], La Union Mining District, Spain [27], and the Yulin mining area, China [28]. Along with the development of the SAR imaging technique, large-scale imaging models of SAR image, such as ScanSAR and Terrain Observation with Progressive Scans SAR (TOPSAR), make it possible to monitor long-term surface deformation over large regions.
To monitor and analyze groundwater level variation caused by coal mining, representative wells, springs, drill holes, and operating mines are selected for the field measurement [29]. Although traditional measurement methods can accurately measure variations in groundwater level, because hydrogeological conditions in mining areas are complicated, it is very difficult to reflect groundwater variation of the entire region through data from a limited measurement point. Moreover, the measurement location will be closed after the end of the exploitation of the mine. Therefore, after the mine is closed, it is very difficult to monitor groundwater variation in the mining area. The Gravity Recovery and Climate Experiment (GRACE) satellite was jointly developed by the National Aeronautics and Space Administration (NASA) of the United States and the German Aerospace Center and successfully launched in March 2002. The time-varying Earth gravity field detected by the GRACE satellite can be used to obtain the terrestrial water storage change based on the mass change of the Earth. Many studies using GRACE data to determine terrestrial water reserves confirm that the GRACE data is practical and effective for detecting groundwater storage change [30,31,32,33]. This shows a clear relation between surface deformation and groundwater storage change through the analysis of InSAR and GRACE data [34,35,36]. However, the studies that combine the InSAR and GRACE data to investigate the correlation between groundwater storage change and surface deformation caused by mining are very limited. The variation in the groundwater storage caused by mining activity is different from the variation of urban groundwater. The variation range of groundwater caused by mining is small, but the water loss is rapid, and the flow volume is large. Moreover, as mining activity continues, the goaf easily becomes the groundwater gathering center, therefore, it enhances water discharge. After a mine is closed, and the pumping activity stops, the groundwater rapidly rises and quickly fills the goaf. Although the spatial resolution of GRACE is low, the high signal-to-noise ratio of mass change caused by a large-amplitude groundwater storage change in a concentrated region can be detected by the GRACE data [36]. Some studies have indicated that when the same mass change is concentrated in a small region, it can be detected by GRACE [37,38]. Therefore, GRACE data can be a good source for monitoring the variation in the groundwater storage of a mining area.
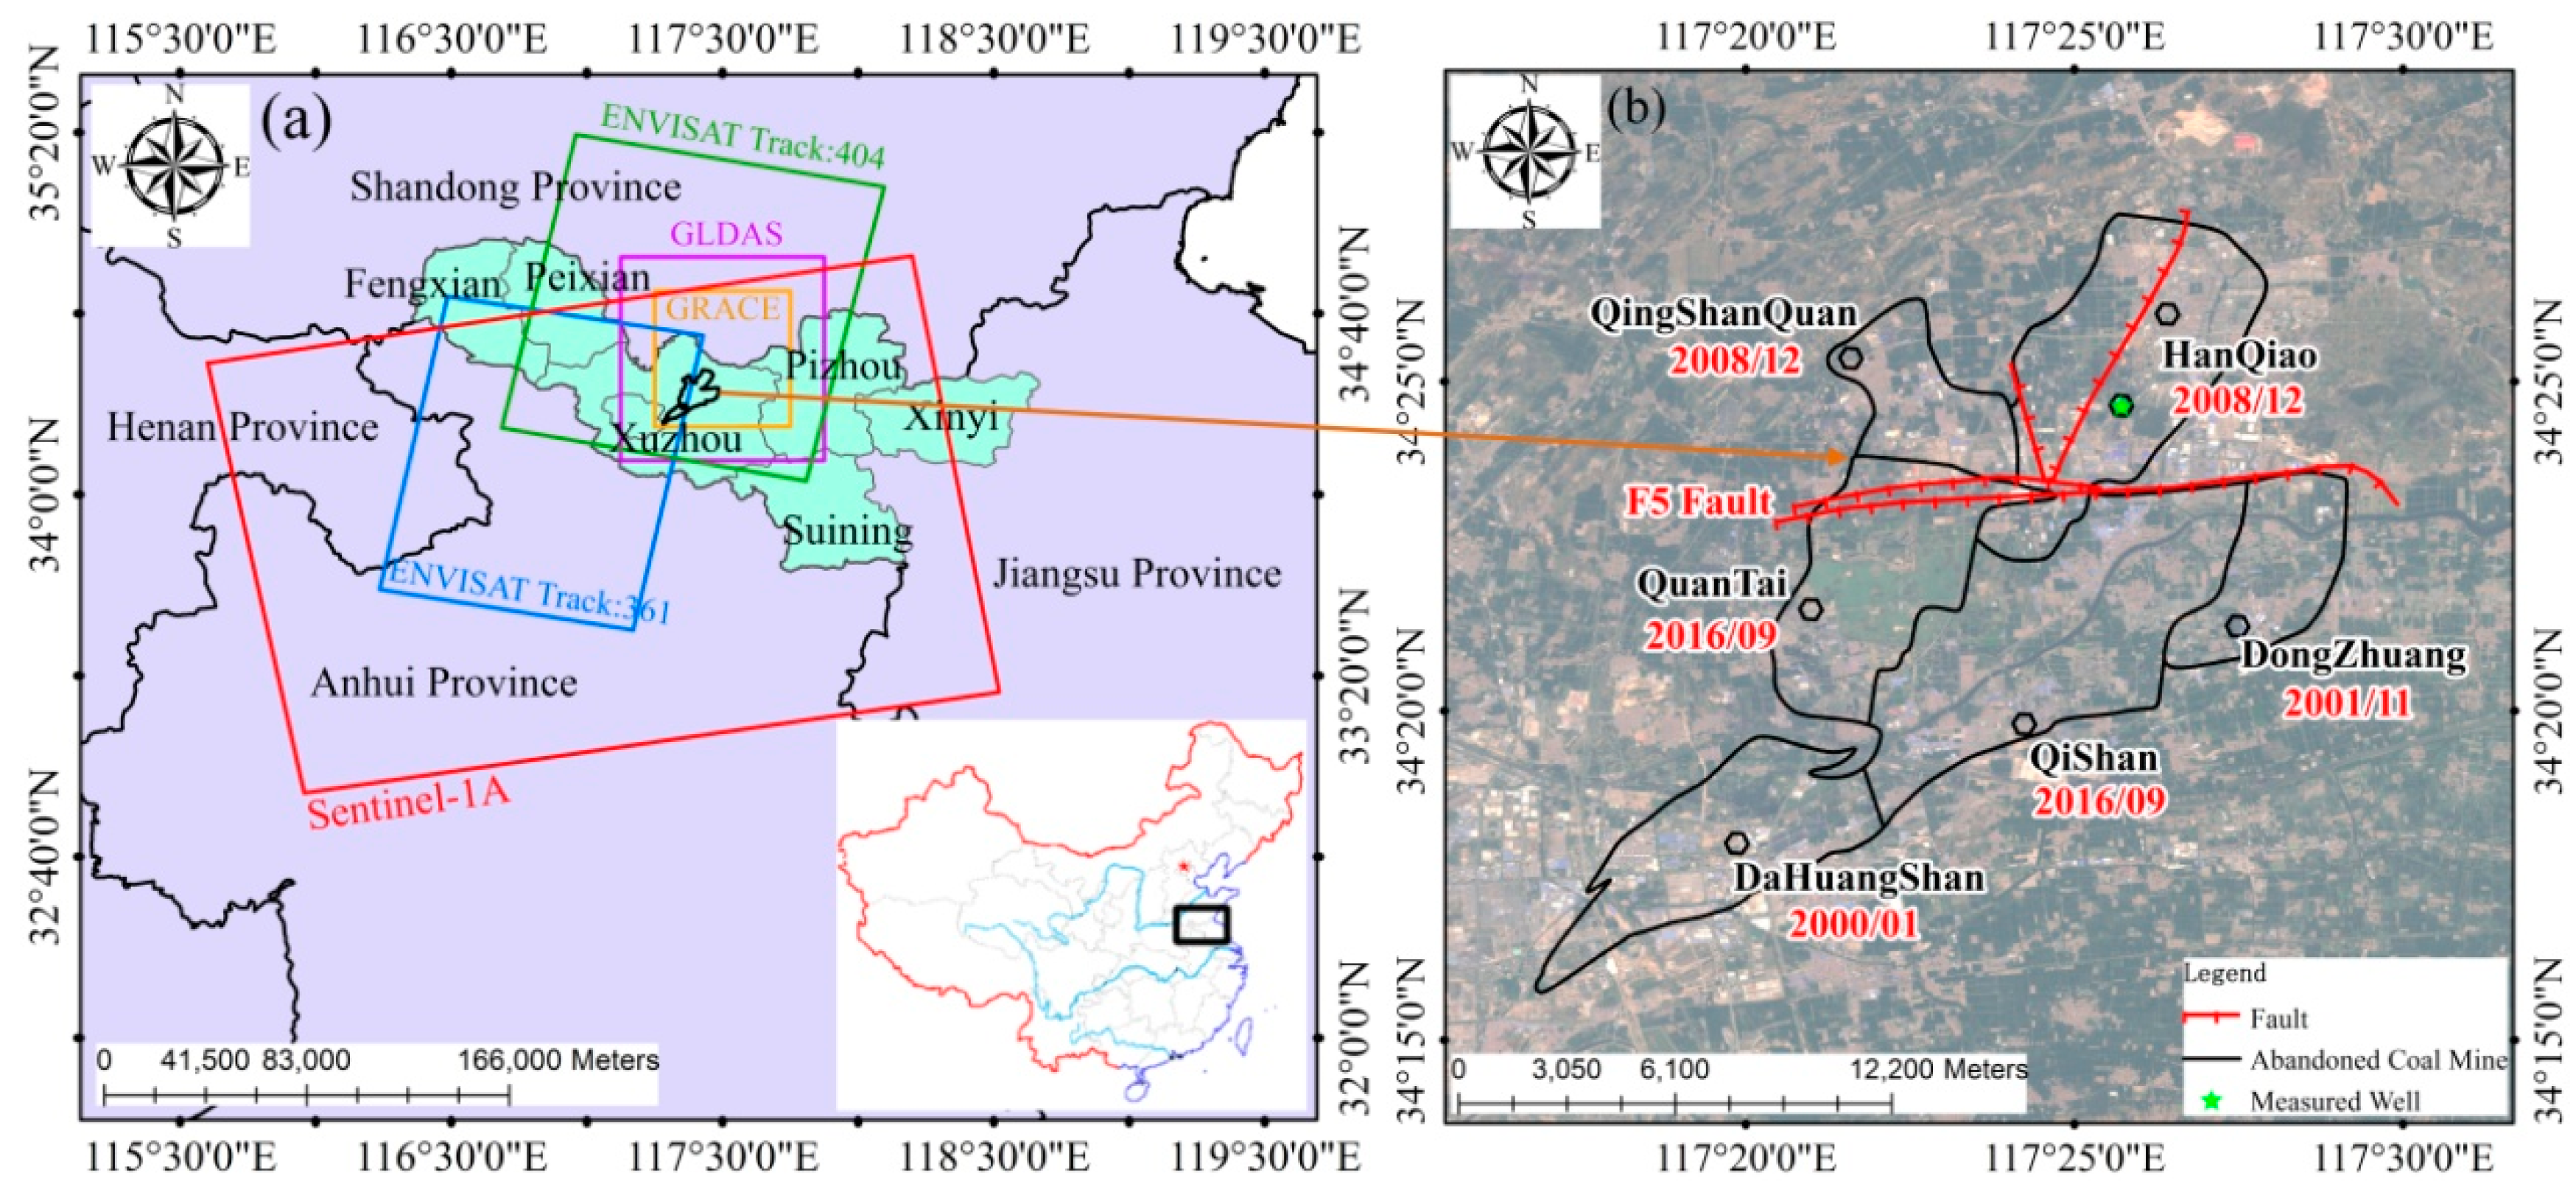
To determine the relationship between mining activity, variation in the groundwater storage, and surface deformation, we first used 13 scenes of descending ENVISAT data (track: 361, frame: 2925), 10 scenes of descending ENVISAT data (track: 404, frame: 2907), and 32 scenes of ascending Sentinel-1A data to obtain the line-of-sight (LOS) surface deformation in the eastern Xuzhou coalfield (Figure 1a) based on the TCPInSAR technique. Then, the GRACE data and Global Land Data Assimilation System (GLDAS) data are used to obtain the average variation of groundwater storage in the research area from January 2005 to June 2017 and the reliability of acquired groundwater results is verified by comparing with the measured groundwater level data. Finally, the relationship among mining activities, surface deformation, and groundwater storage variation are analyzed comprehensively and the correlation between the groundwater storage variation and surface deformation in the research area is discussed.
2. Background of Study Area
2.1. Eastern Xuzhou Coalfield
The Eastern Xuzhou coalfield is located in Jiawang district, which produces more than 4 million tons of raw coal annually. The F5 fault divides the Eastern Xuzhou coalfield into two mining areas—the south and the north (as shown in Figure 1b). The Jiawang mining area is north of the F5 fault and is approximately 38 km2. It is generally an incomplete syncline structure surrounded by mountains on three sides. The surrounding bedrock directly crops out at the surface. In addition to the two mines of the Qingshanquan and Hanqiao of the Xuzhou Coal Mining Group Corporation, there were more than 160 local coal mines. The mining history exceeds 100 year, and the coal mines that were successively exploited include the Lower Shihezi Formation Coal Mine 1 and 3, Shanxi Formation Coal Mine 7, and Taiyuan Formation Coal Mines 17, 20, and 21. Since the coal resources are depleted, the large and small coal mines in the mining area have all been closed. The Panjia’an mining area is situated south of the F5 fault, is approximately 57 km2, and is generally an incomplete syncline structure. The southern part is the outcrop area of coal strata and the northern part are adjacent to the Jiawang mining area. There were once several mines in Quantai, Qishan, Dongzhuang, and Dahuangshan, which are now all closed. The spatial distribution of mines and the mining closing date are reported on the Figure 1b.
2.2. Hydrogeologic Overview
The basement of the Eastern Xuzhou coalfield is of Cambrian and Ordovician karstic limestone. The limestone strata are exposed in the erosive low-mountain zone on the basin margin, where the infiltration of atmospheric precipitation is convenient, and water abundance is high. The upper layer of Ordovician limestone is deposited with the thin-limestone-layer-intercalated purple shale of the Benxi Formation, and the permeability is weak. It is overlaid by the Taiyuan Formation, which contains thirteen layers of karstic limestone. The upper layer of the Taiyuan Formation is of Permian age and is made of sandstone, sandy shale, shale, and coal seam, with some sandstone crack aquifers, and the water abundance is low.
The main aquifer of the Eastern Xuzhou coalfield is the Quaternary sandy-gravel strata, the six strata of sandstone-fissured aquifers of the Lower Shihezi Formation, the 13 strata of limestone dissolution fissure aquifers of the Taiyuan Formation, the limestone dissolution crack aquifer of the Benxi Formation, and the Ordovician limestone karst aquifer.
According to the incomplete statistics, there are a total of 109 water wells in this area, and the annual water withdrawal is as high as 21.764 million m3. In addition, the annual water discharging amount in the mining area is 45.608 million m3, and the total yearly water extraction amount from underground is approximately 67.372 million m3.
3. Datasets and Methods
3.1. Experimental Data
We collected a total of 55 SAR scenes. In particular, the 13 scenes of descending ENVISAT data (track: 361, frame: 2925) were acquired from 17 June 2006 to 2 February 2008; the 10 scenes of descending ENVISAT data (track: 404, frame: 2907) were acquired from 1 December 2009 to 12 October 2010; the 32 scenes of ascending Sentinel-1A data were acquired from 4 October 2016 to 15 January 2018. The images footprints are shown in Figure 1a, and the imaging parameters of different images are shown in Table 1.
The experiment adopted the 0.5° GRACE Mascons monthly solution data provided by the Center for Space Research (CSR) (http://www2.csr.utexas.edu/grace) [39] to obtain the mass change in the research area from January 2005 to June 2017. To eliminate the influences of soil moisture content and snow water equivalent, the GLDAS hydrologic model data was adopted based on the Noah land surface model (https://ldas.gsfc.nasa.gov/gldas/). The spatial resolution of these data is 0.25°, and it exhibits as the monthly solution on the temporal resolution.
3.2. TCPInSAR Technique
A feature of the TCPInSAR technique is that the selected TCP do not need to maintain coherence during the entire monitoring period and that the calculation of surface deformation does not need phase unwrapping [20,21,28]. The procedures of the TCPInSAR technique include selection of TCP, TCP network construction, estimation of arc segment ambiguity, elimination of arc segments with ambiguity, and deformation calculation. The code of TCPInSAR technique was provided by Zhang et al. [40].
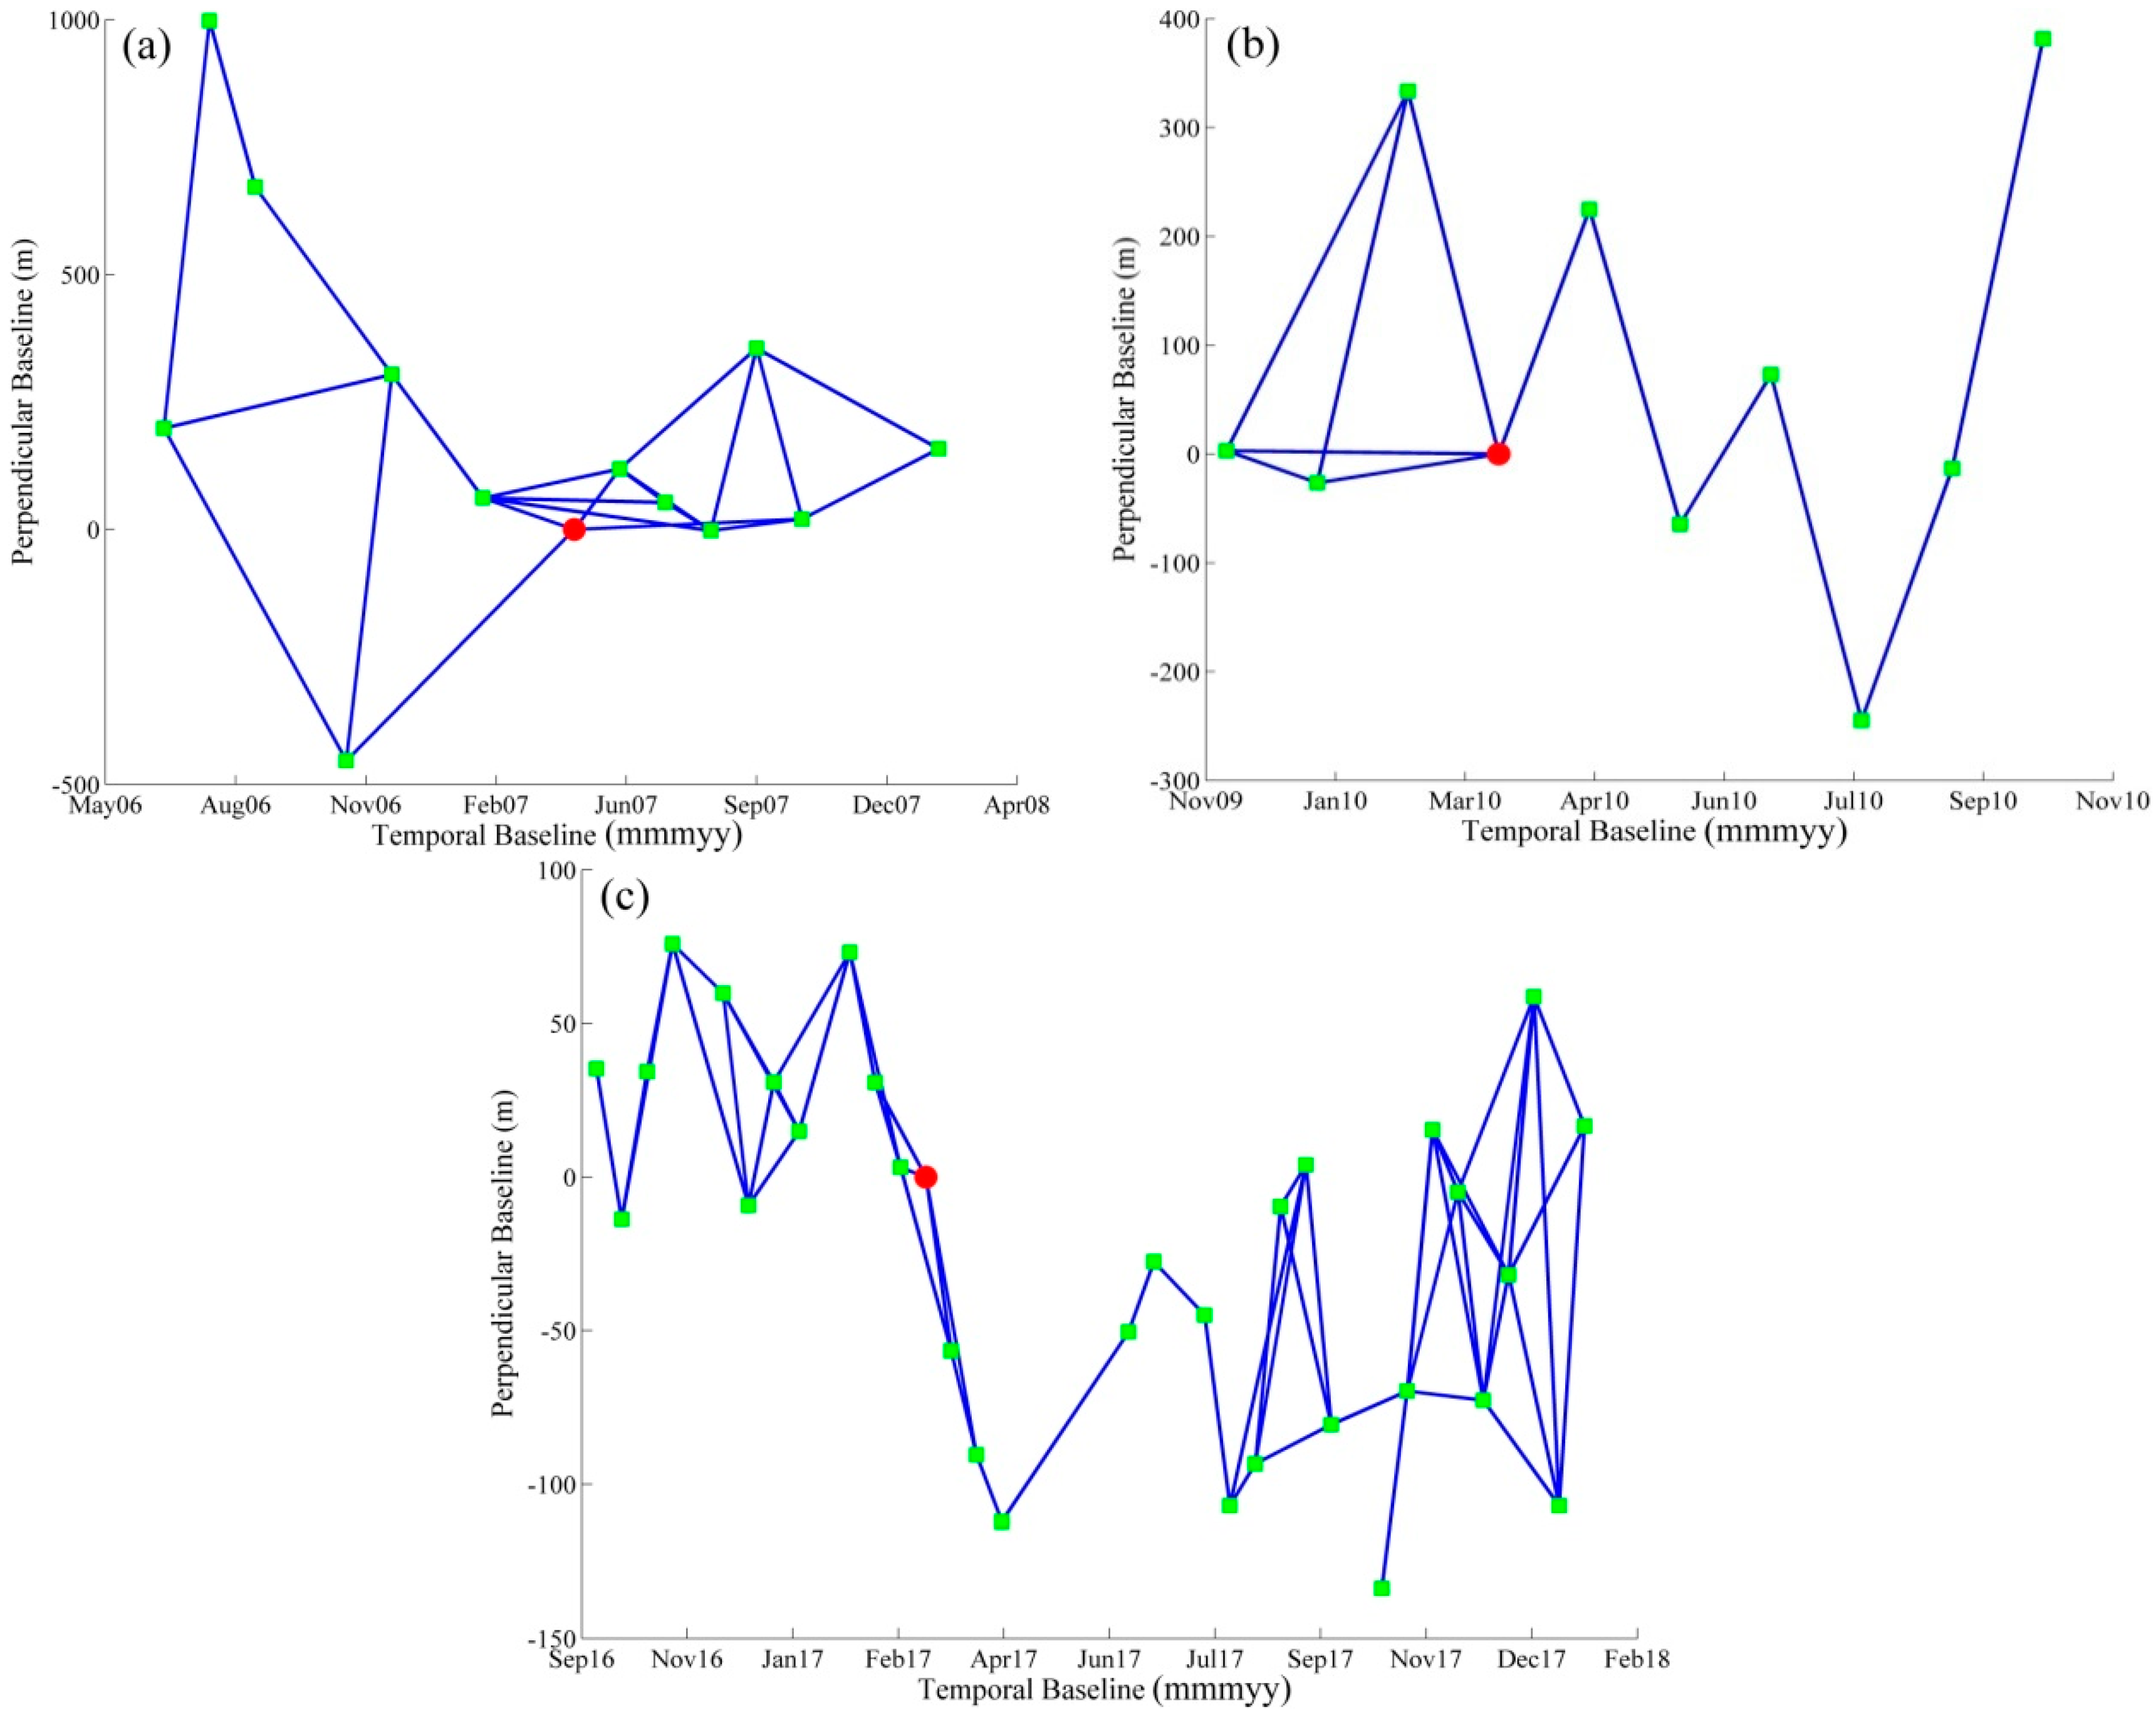
Firstly, three images on 28 April 2007, 16 March 2010, and 9 March 2017 of three groups’ images were selected as the master images, and other images were all registered and re-sampled with the master images. To reduce the influence of spatiotemporal incoherence, the maximum spatiotemporal baselines of the three groups SAR images were set to 176 days, 106 days, 60 days, and 1200 m, 504 m, and 150 m, respectively. A total of 91 interferometric pairs (Figure 2) in the three groups’ images were generated by GAMMA software. The terrain phase was eliminated by the Shuttle Radar Topography Mission (SRTM) digital elevation model (DEM) 3 arc second data provided by the NASA [41]. In order to improve the orbit accuracy of the ENVISAT data, the DORIS precise orbit data provided by the European Space Agency (ESA) were adopted.
In the original TCPInSAR technique, the TCP is extracted through statistical analysis of the offset information of pixel points. Because the computation was complicated and required a great deal of time, the experiment adopted the coherence information of the interferometric map to select the TCP. To reduce the influence of atmospheric noise and the number of arc segments with ambiguity and increase the number of local arc segments, the TCPInSAR technique adopts the local Delaunay triangulation to construct the arc segments between TCPs [21].
In the ith interferogram, the wrapped phase of a TCP (l, m) can be expressed as:
where is the wrap operator; is the phase caused by the surface deformation; is the phase caused by the terrain error; is the phase caused by the atmospheric delay; is the phase caused by the orbit error; is the phase caused by Doppler centroid difference; and is the noise phase, which includes the phase caused by the systematic thermal noise and incoherence.
The phase difference at the arc constructed by TCP (l, m) and TCP (l′, m′) can be expressed as:
where is the difference of the topography residuals at two TCPs (l, m) and (l′, m′); is the corresponding coefficient; is the perpendicular baseline; is the wavelength; is the slant range from the sensor to the ground; is the incidence angle; ∆V is the differential deformation rate vector; is the corresponding coefficient; and includes differential phase related to atmospheric artifact, orbital error, Doppler centroid difference, and other noise [23,24].
The observation model for arcs can be expressed with Equation (3) [22,23]:
where is a phase differences vector between two adjacent TCPs in a total of I interferograms; A is the design matrix include height-to-phase conversion factors and time combination matrix; and W is a stochastic vector.
Here, parameters ∆V and ∆hl,m,l′,m′ can be calculated with the least-squares method [22,23]. However, because some arc segments have phase ambiguity and there is lack of a priori knowledge on the statistical model of ambiguity, Zhang et al. [22,23,40] proposed to use the method of variance component estimation to evaluate the accuracy of the design parameters and used a least-squares estimator to eliminate the arc segments with ambiguity from the initial solution. Finally, the retained arc segments are used to estimate the ultimate solution based on the least-squares method.
3.3. Calculation of Groundwater Storage Change
To determine the variation of groundwater storage in the research area, the 0.5° GRACE Mascons monthly solution was adopted obtained from the CSR [39] to obtain the terrestrial water storage change from January 2005 to June 2017. The change in terrestrial water storage retrieved from the GRACE data is the total change in groundwater, snow cover, ice sheets, soil moisture, vegetation water, and surface runoff. In particular, snow cover, ice sheets, soil moisture, vegetation water, and surface runoff are all classified as surface water. The groundwater storage change can be obtained by the total change of terrestrial water subtracted by the change of surface water. The influence of surface runoff, ice sheets and vegetation water in the research area were neglected when calculating the groundwater storage change because they are small.
where ∆GWS is the change of groundwater storage; ∆TWS is the change of terrestrial water storage, which can be obtained from the GRACE data; ∆SMS is the change of soil moisture on the surface; and ∆SIS is the snow water equivalent. The 0–0.1 m, 0.1–0.4 m, 0.4–1 m, and 1–2 m soil data and snow data provided by the 0.25° × 0.25° GLDAS-Noah hydrological model were adopted to obtain the change in soil moisture and snow water equivalent from January 2005 to June 2017 in the research area. To ensure that the spatial resolution of terrestrial water storage change obtained by GRACE data is consistent with the surface water storage change obtained by GLDAS data, the kriging interpolation was adopted to resample the GLDAS data with the same resolution as the GRACE data.
4. Results
4.1. InSAR Results
In order to analyze the results of InSAR monitoring, we have statistically analyzed the deformation of the entire monitoring area during the three monitoring periods through the number of coherent points (NCP), average deformation rate (ADR), and standard deviation (SD). The results are shown in Table 2. According to the theory of mining subsidence, the area is defined as stable when the surface deformation is less than 10 mm [2]. However, the magnitude of surface deformation caused by groundwater level change is usually less than the surface deformation caused by mining. Combining the statistical information in Table 2, when the average deformation rate is between −5 to 5 mm/year, the area is defined as stable. Statistical information of the deformation outside the boundary of the mining area (OBMA) is also shown in Table 2, which reflects the accuracy of the monitoring results to a certain extent. The detailed deformation of each monitoring period in the study area is analyzed below.
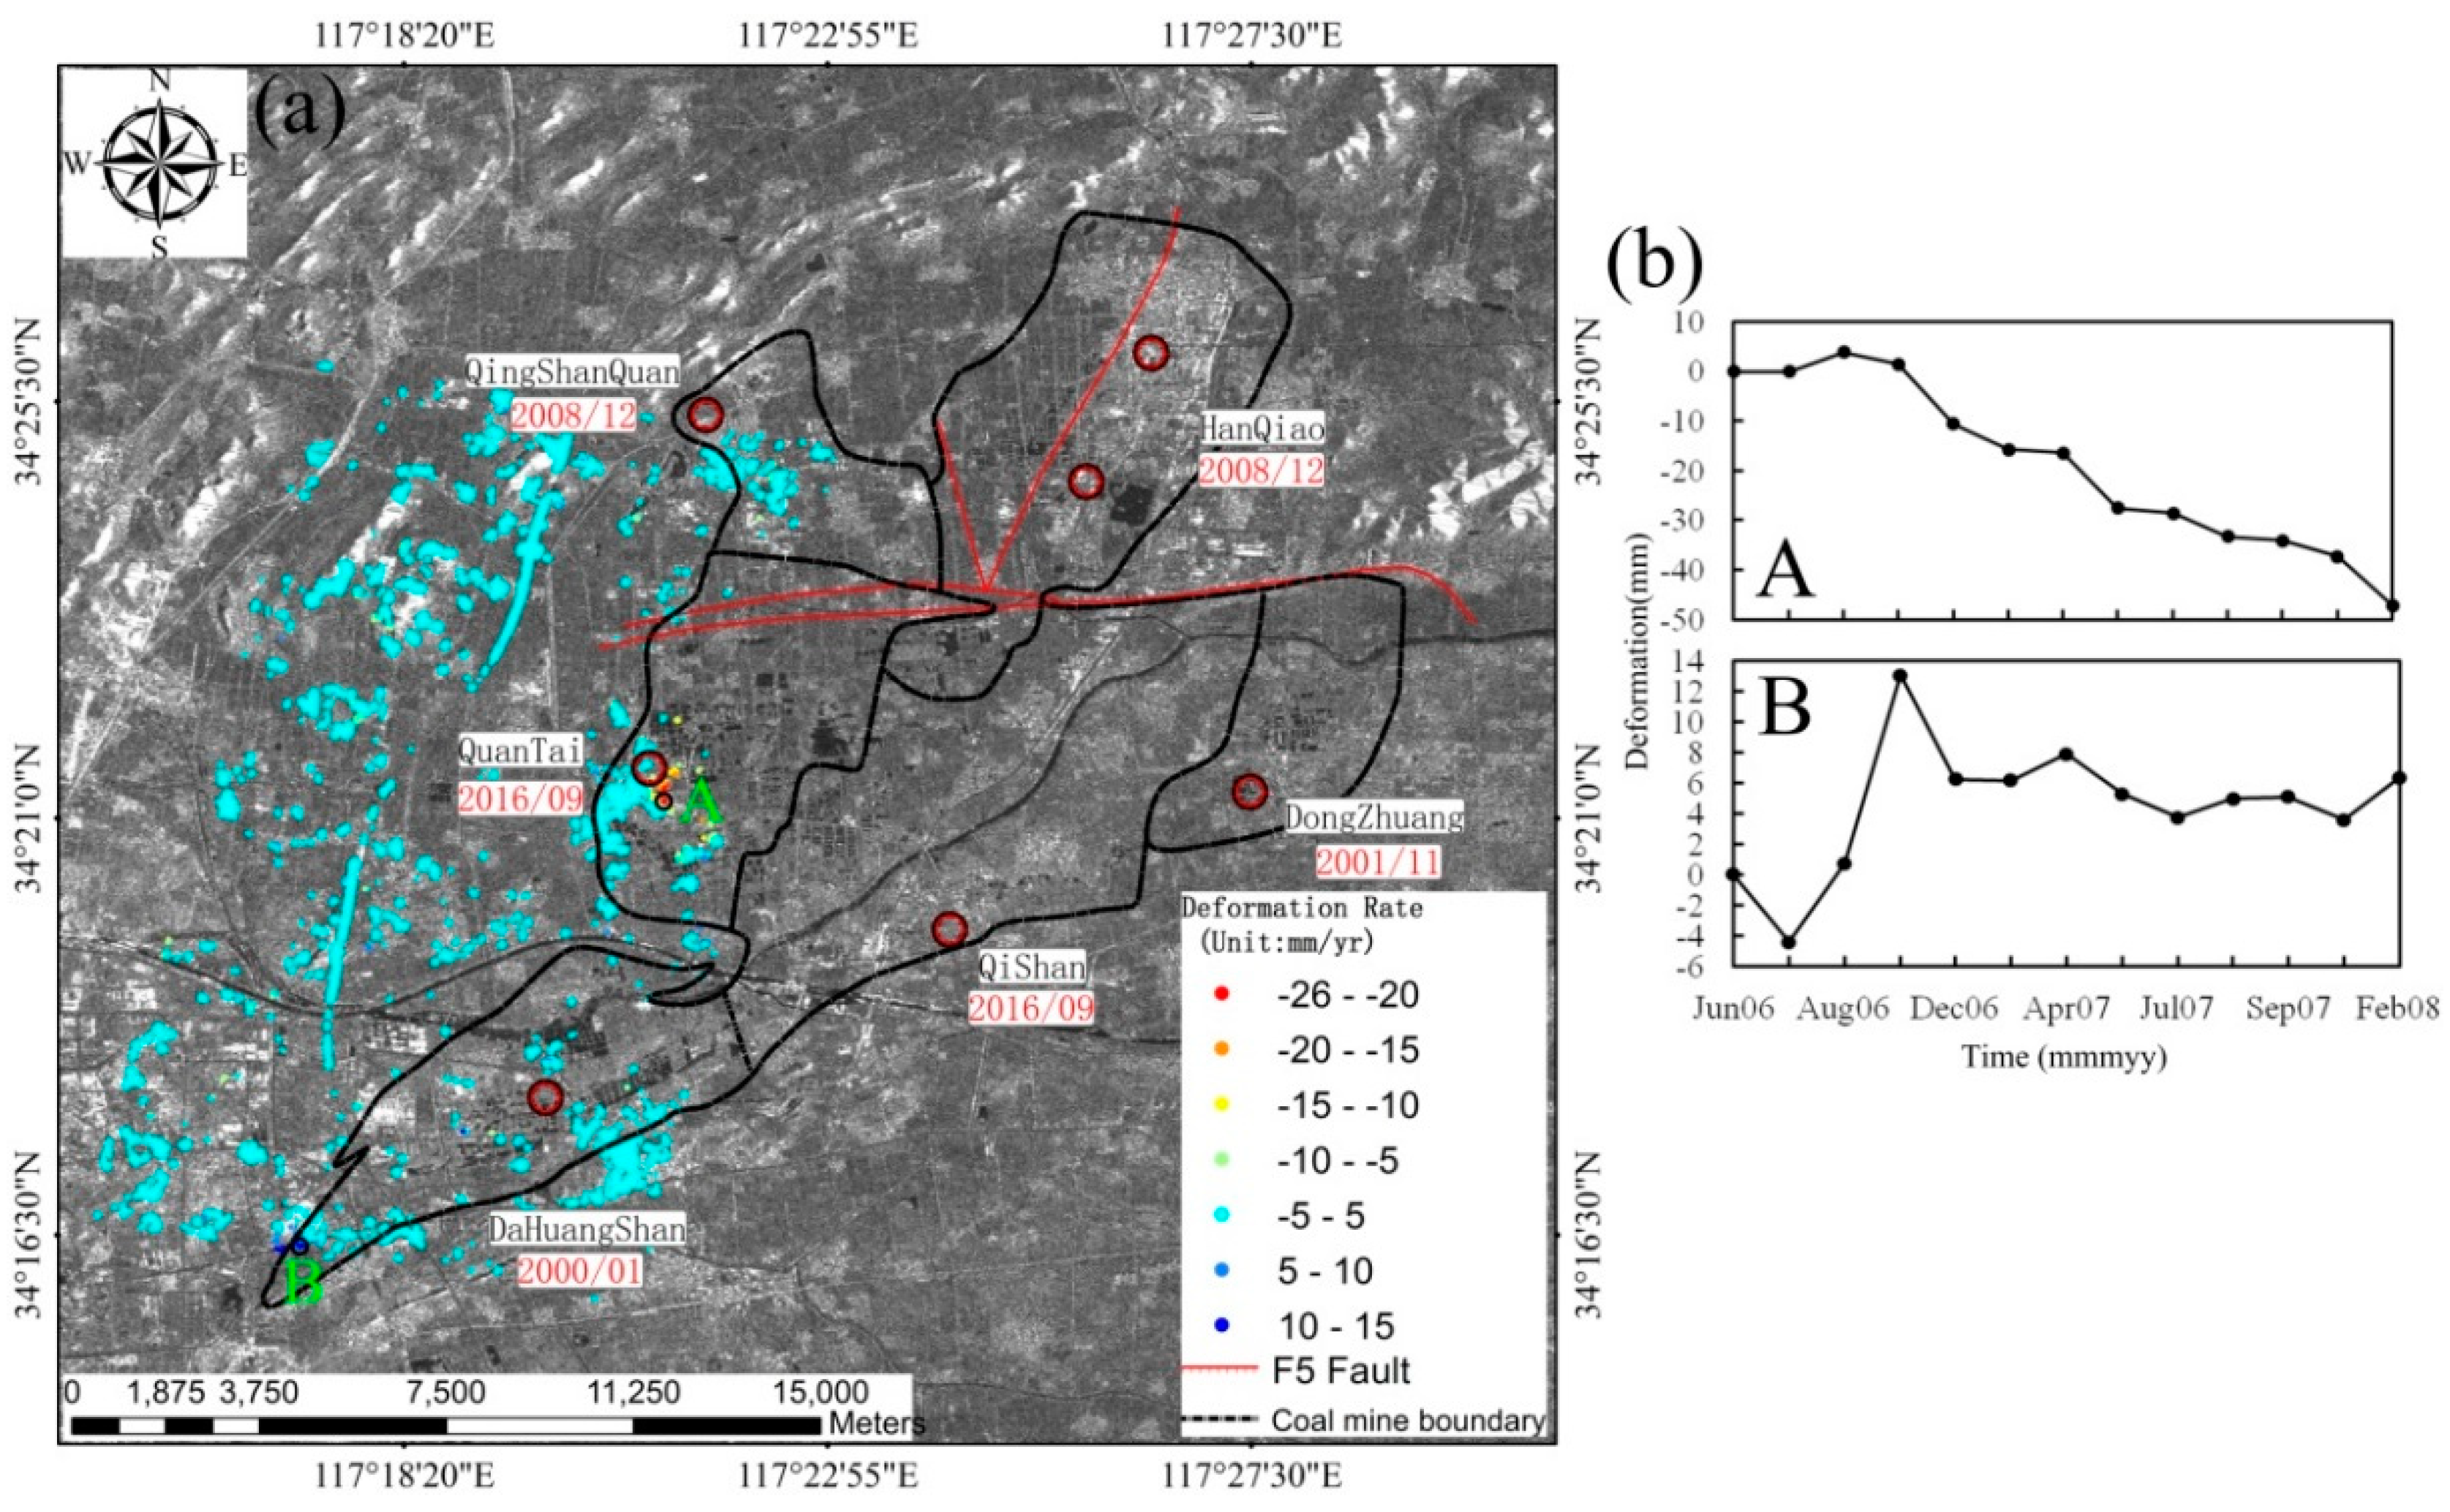
Figure 3 shows the LOS deformation for the eastern Xuzhou coalfield obtained with 13 scenes of descending ENVISAT data from June 2006 to February 2008. Since the SAR image cannot cover the entire research area, the deformation results were partly covering the regions of the Qingshanquan, Quantai, and Dahuangshan mines. As shown in Figure 3a, the areas outside the mining area boundary were stable, and the deformations were concentrated in the areas of the Quantai mine and southwest of the Dahuangshan mine. Only part of the area of the Qingshanquan mine was in the subsiding condition. The deformation was mainly concentrated in the Eastern Xuzhou coalfield. There is a preferable spatial correlation between surface deformation and the mining area. The maximum subsidence rate located in the Quantai mine was −25.6 mm/year, and the maximum uplift rate located in the Dahuangshan mine was 10.3 mm/year. Figure 3b shows the LOS time-series deformation in locations with rapid deformation in the mining area. The LOS time-series deformation was obtained by averaging TCPs in a black circle of Figure 3a.
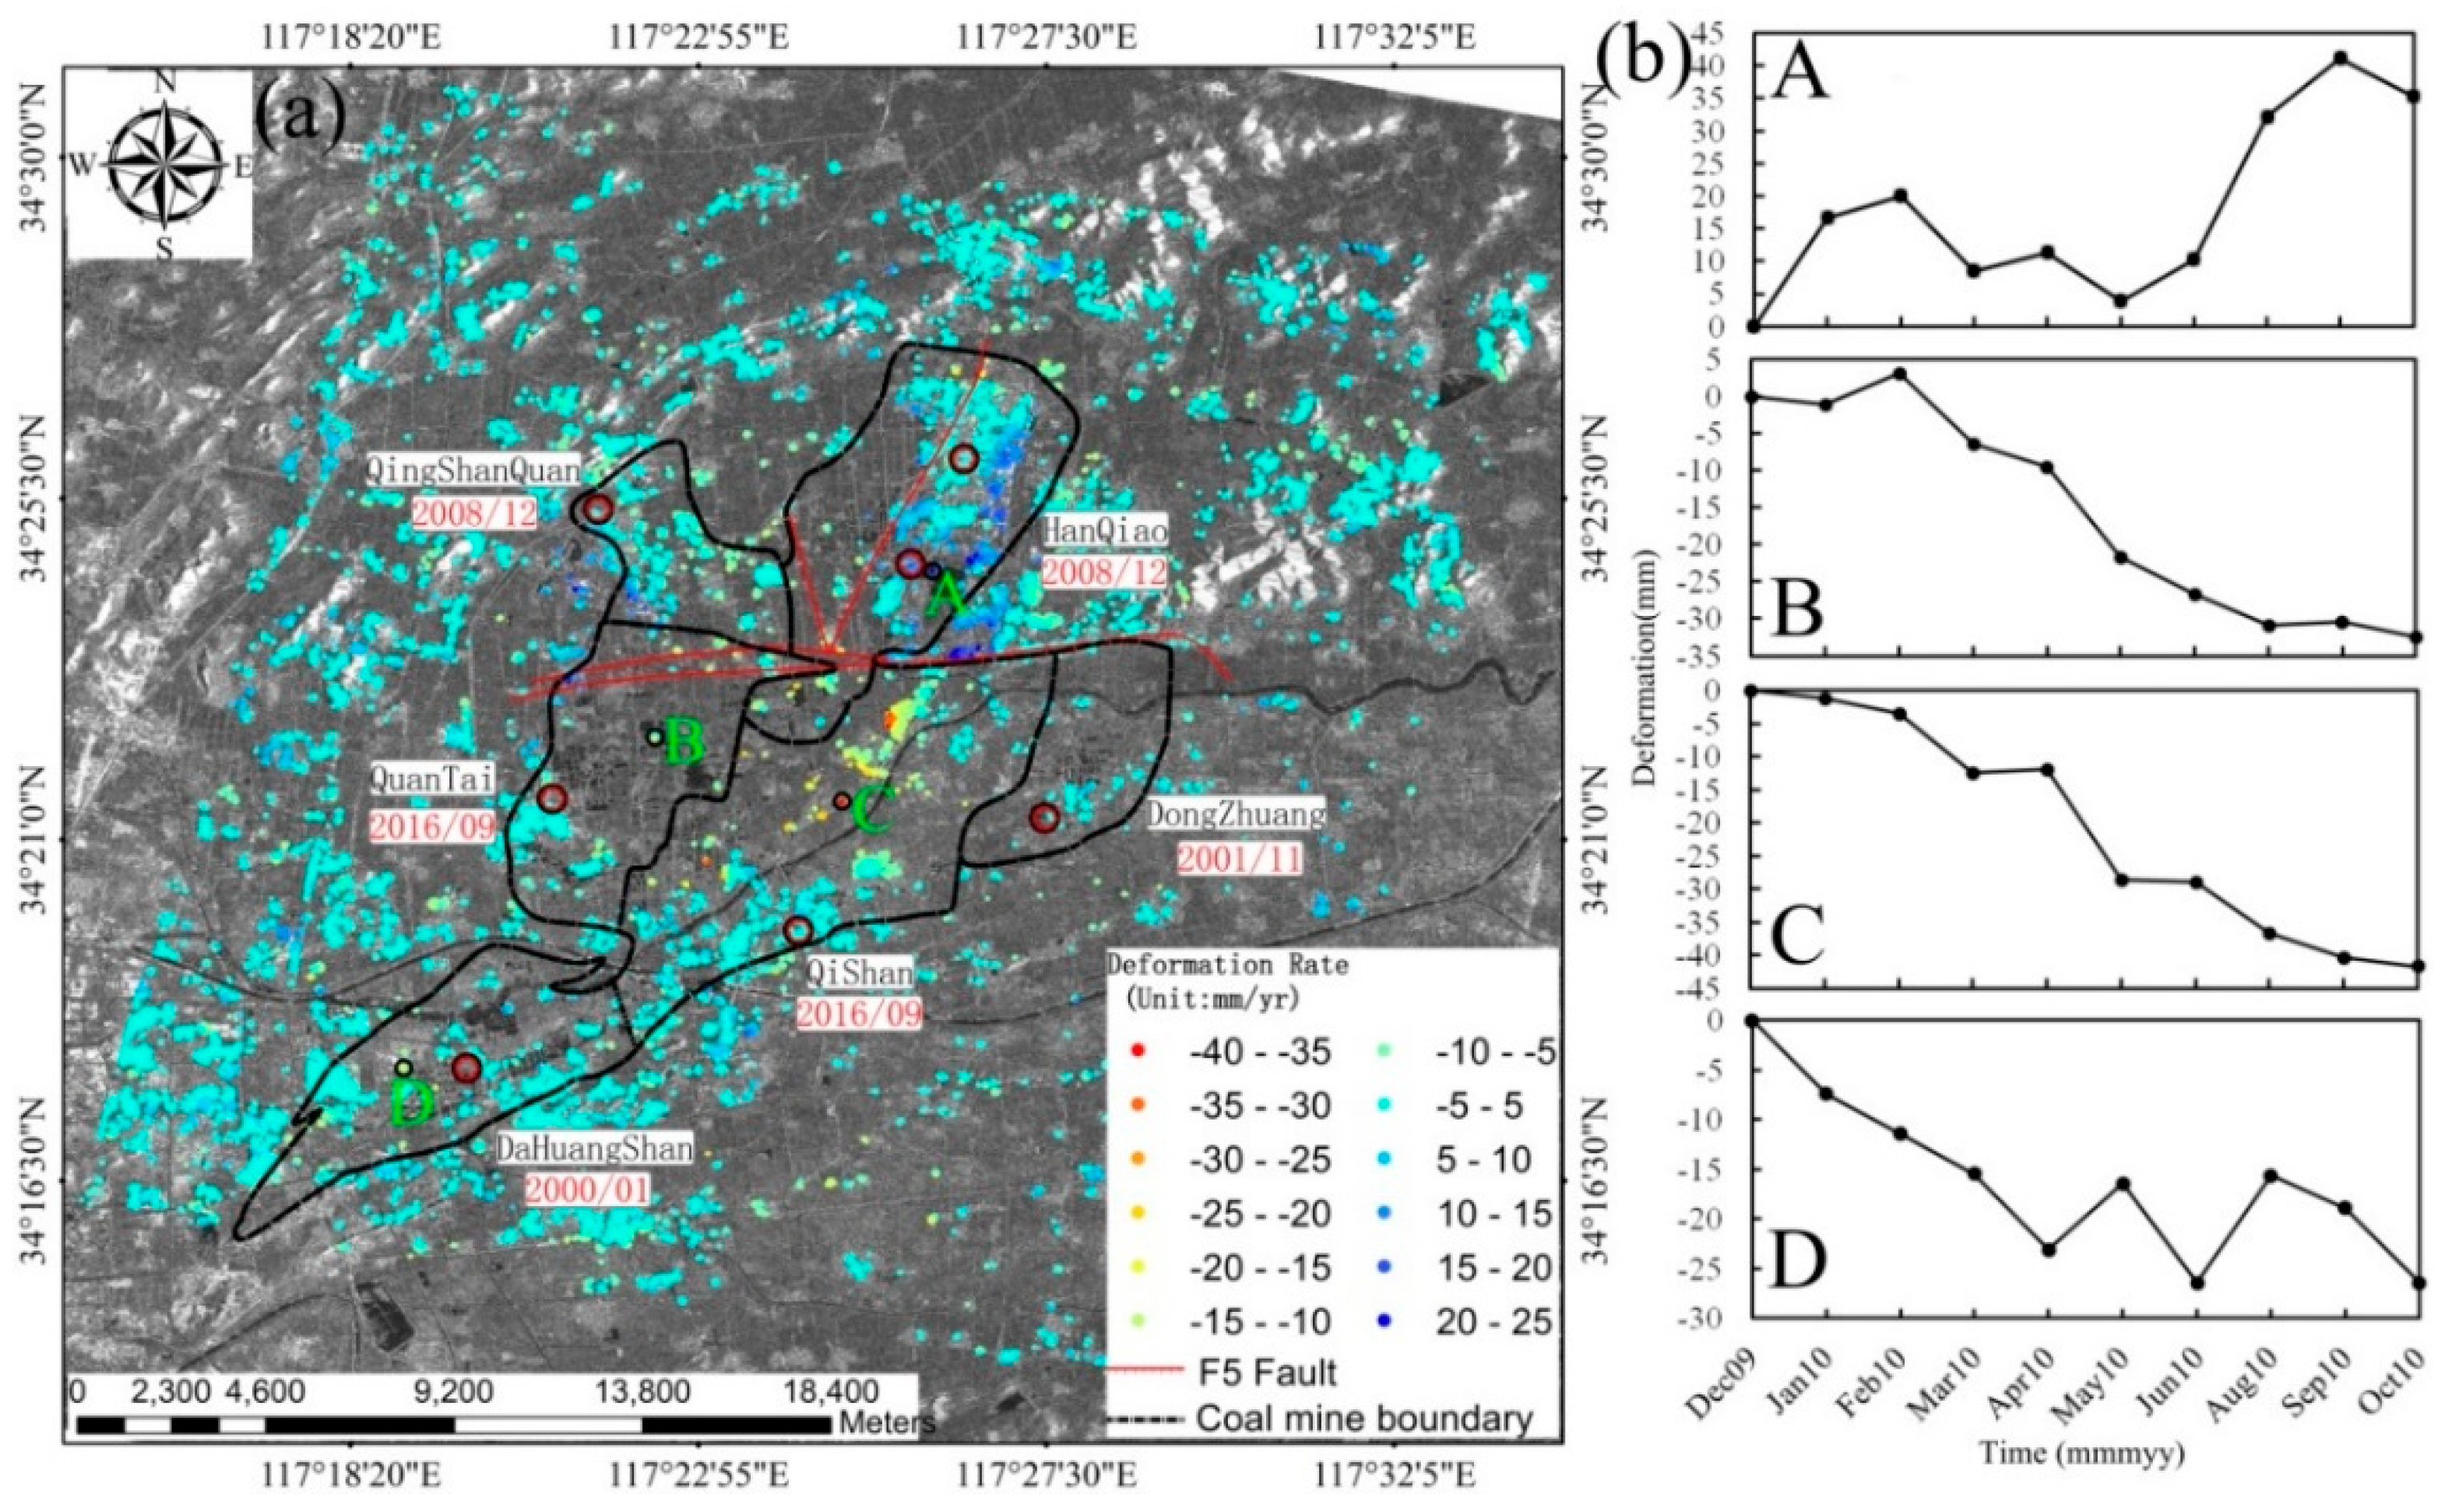
Figure 4 shows the LOS deformation in the eastern Xuzhou coalfield obtained from 10 scenes of ENVISAT images from December 2009 to October 2010. According to Figure 4a, most of the areas outside the mining area boundary were stable, except for the uplift phenomenon occurring near the F5 fault in the south of the Hanqiao mine and the southwest of the Qingshanquan mine (for the reasons see the Section 5). Some slow deformation phenomena appeared in the mountainous areas outside the mining area boundary. These slow deformations are related to the residual error of the DEM. The deformation was mainly concentrated in the Eastern Xuzhou coalfield. There is a preferable spatial correlation between the surface deformation and the mining area. The maximum subsidence rate in the territory of the Qishan mine was −39.5 mm/year, and the maximum uplift rate in the territory of the Hanqiao mine was 24.9 mm/year. By comparing this result with the results for October 2006 to February 2008, it can be seen that the subsidence phenomenon appeared in the southwestern region of the Dahuangshan mine, and the subsidence velocity reached −20.3 mm/year. The Quantai mine was still dominated by subsidence. However, an uplift phenomenon occurred near the F5 fault in the Quantai mining area. One year after the Qingshanquan mine was closed, an uplift phenomenon appears in the southwestern region of the Qingshanquan mine, while most regions in the northeast were still dominated by slow subsidence. Although the Hanqiao mine and the Qingshanquan mine were closed at the same time, there was an obvious difference in the situation of surface deformation. The range and velocity of surface uplift in the Hanqiao mine were obviously larger than that in the Qingshanquan mine (for the reasons see Section 5). In the Qishan mine, the surface is dominated by subsidence. Eight years after the Dongzhuang mine was closed, the overall deformation of the mining area was slow.
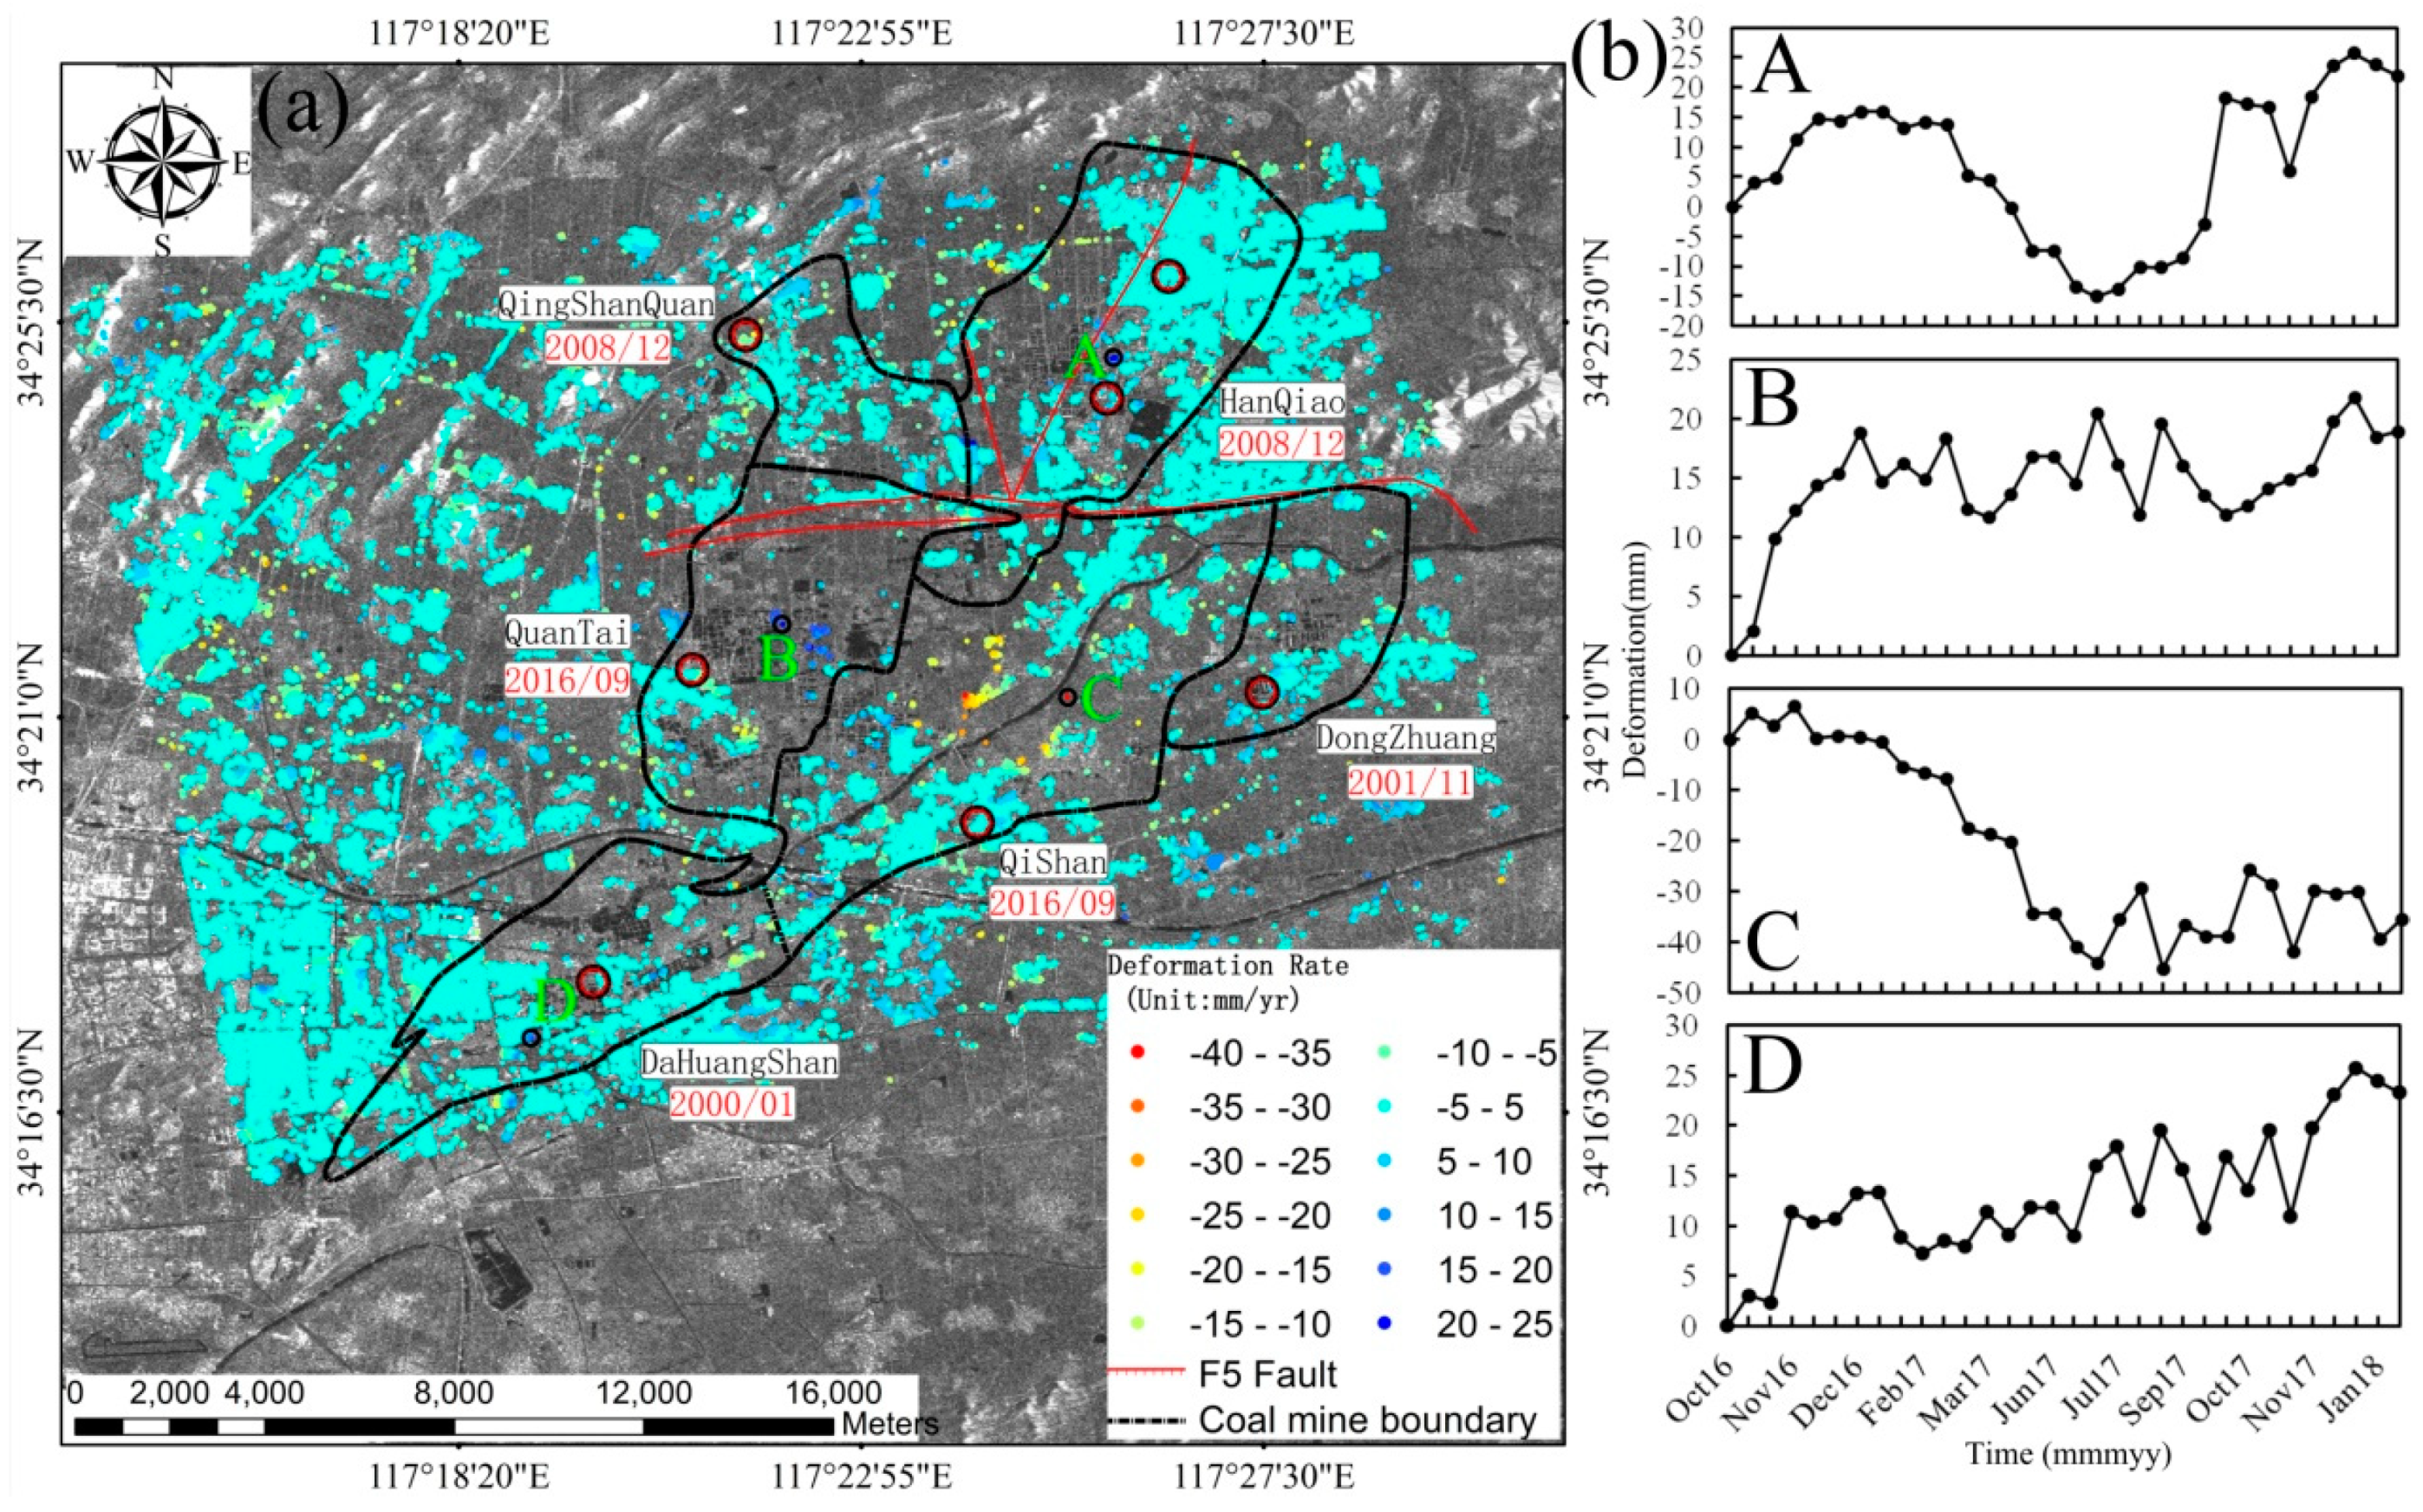
Figure 5 shows the LOS deformation obtained from 32 scenes of Sentinel-1A data from October 2016 to January 2018. As showed in Figure 5a, most of the areas outside the mining area boundary were stable, except for the subsidence phenomenon in the western area. The subsidence area was located in the rural-urban fringe zone of the Tongshan district, Xuzhou. According to the planning of new urbanization and rural-urban development integration in Xuzhou (2015–2020) [42] promulgated by the Xuzhou government, the subsidence of the region may be caused by the compaction of soil due to buildings constructed or/and the water use of industry and agriculture. The deformation was mainly concentrated in the Eastern Xuzhou coalfield. There is a preferable spatial correlation between surface deformation and mining area. The maximum subsidence rate occurring in the Qishan mine was −39.8 mm/year, and the maximum uplift rate occurring in the Hanqiao mine was 24.1 mm/year. The comparison with the results from December 2009 to October 2010 indicates that the overall deformation in the Dahuangshan mine was insignificant. Only part of it displayed uplift, and max rate was 15.7 mm/year. The overall deformation of Qingshanquan mine was insignificant during the eight years after the mine was closed. Eight years after the Hanqiao mine was closed, the range of surface uplift region noticeably decreased. Most of the region became stable, and the maximum uplift rate also declined by 0.8 mm/year. However, the surface deformation of the Dongzhuang mine was dominated by uplift of 14 mm/year. After the Qishan mine was closed in September 2016, due to the influence of residual subsidence in the goaf, the surface in the mining area was still dominated by subsidence. Although the Quantai and Qishan mines were closed at the same time, an apparent uplift phenomenon appeared in the Quantai mine (for the reasons see Section 5).
4.2. GRACE Results
The mass change of the Eastern Xuzhou coalfield was caused jointly by the mining and drainage activity of the groundwater. However, the annual raw coal yield (more than 4 million tons) in the research area was approximately 6% of the mass of the extracted annual groundwater (67.372 million tons). Therefore, the influence of underground mining activity was neglected, when the mass change in the research area was obtained from the combined GRACE and GLDAS data.
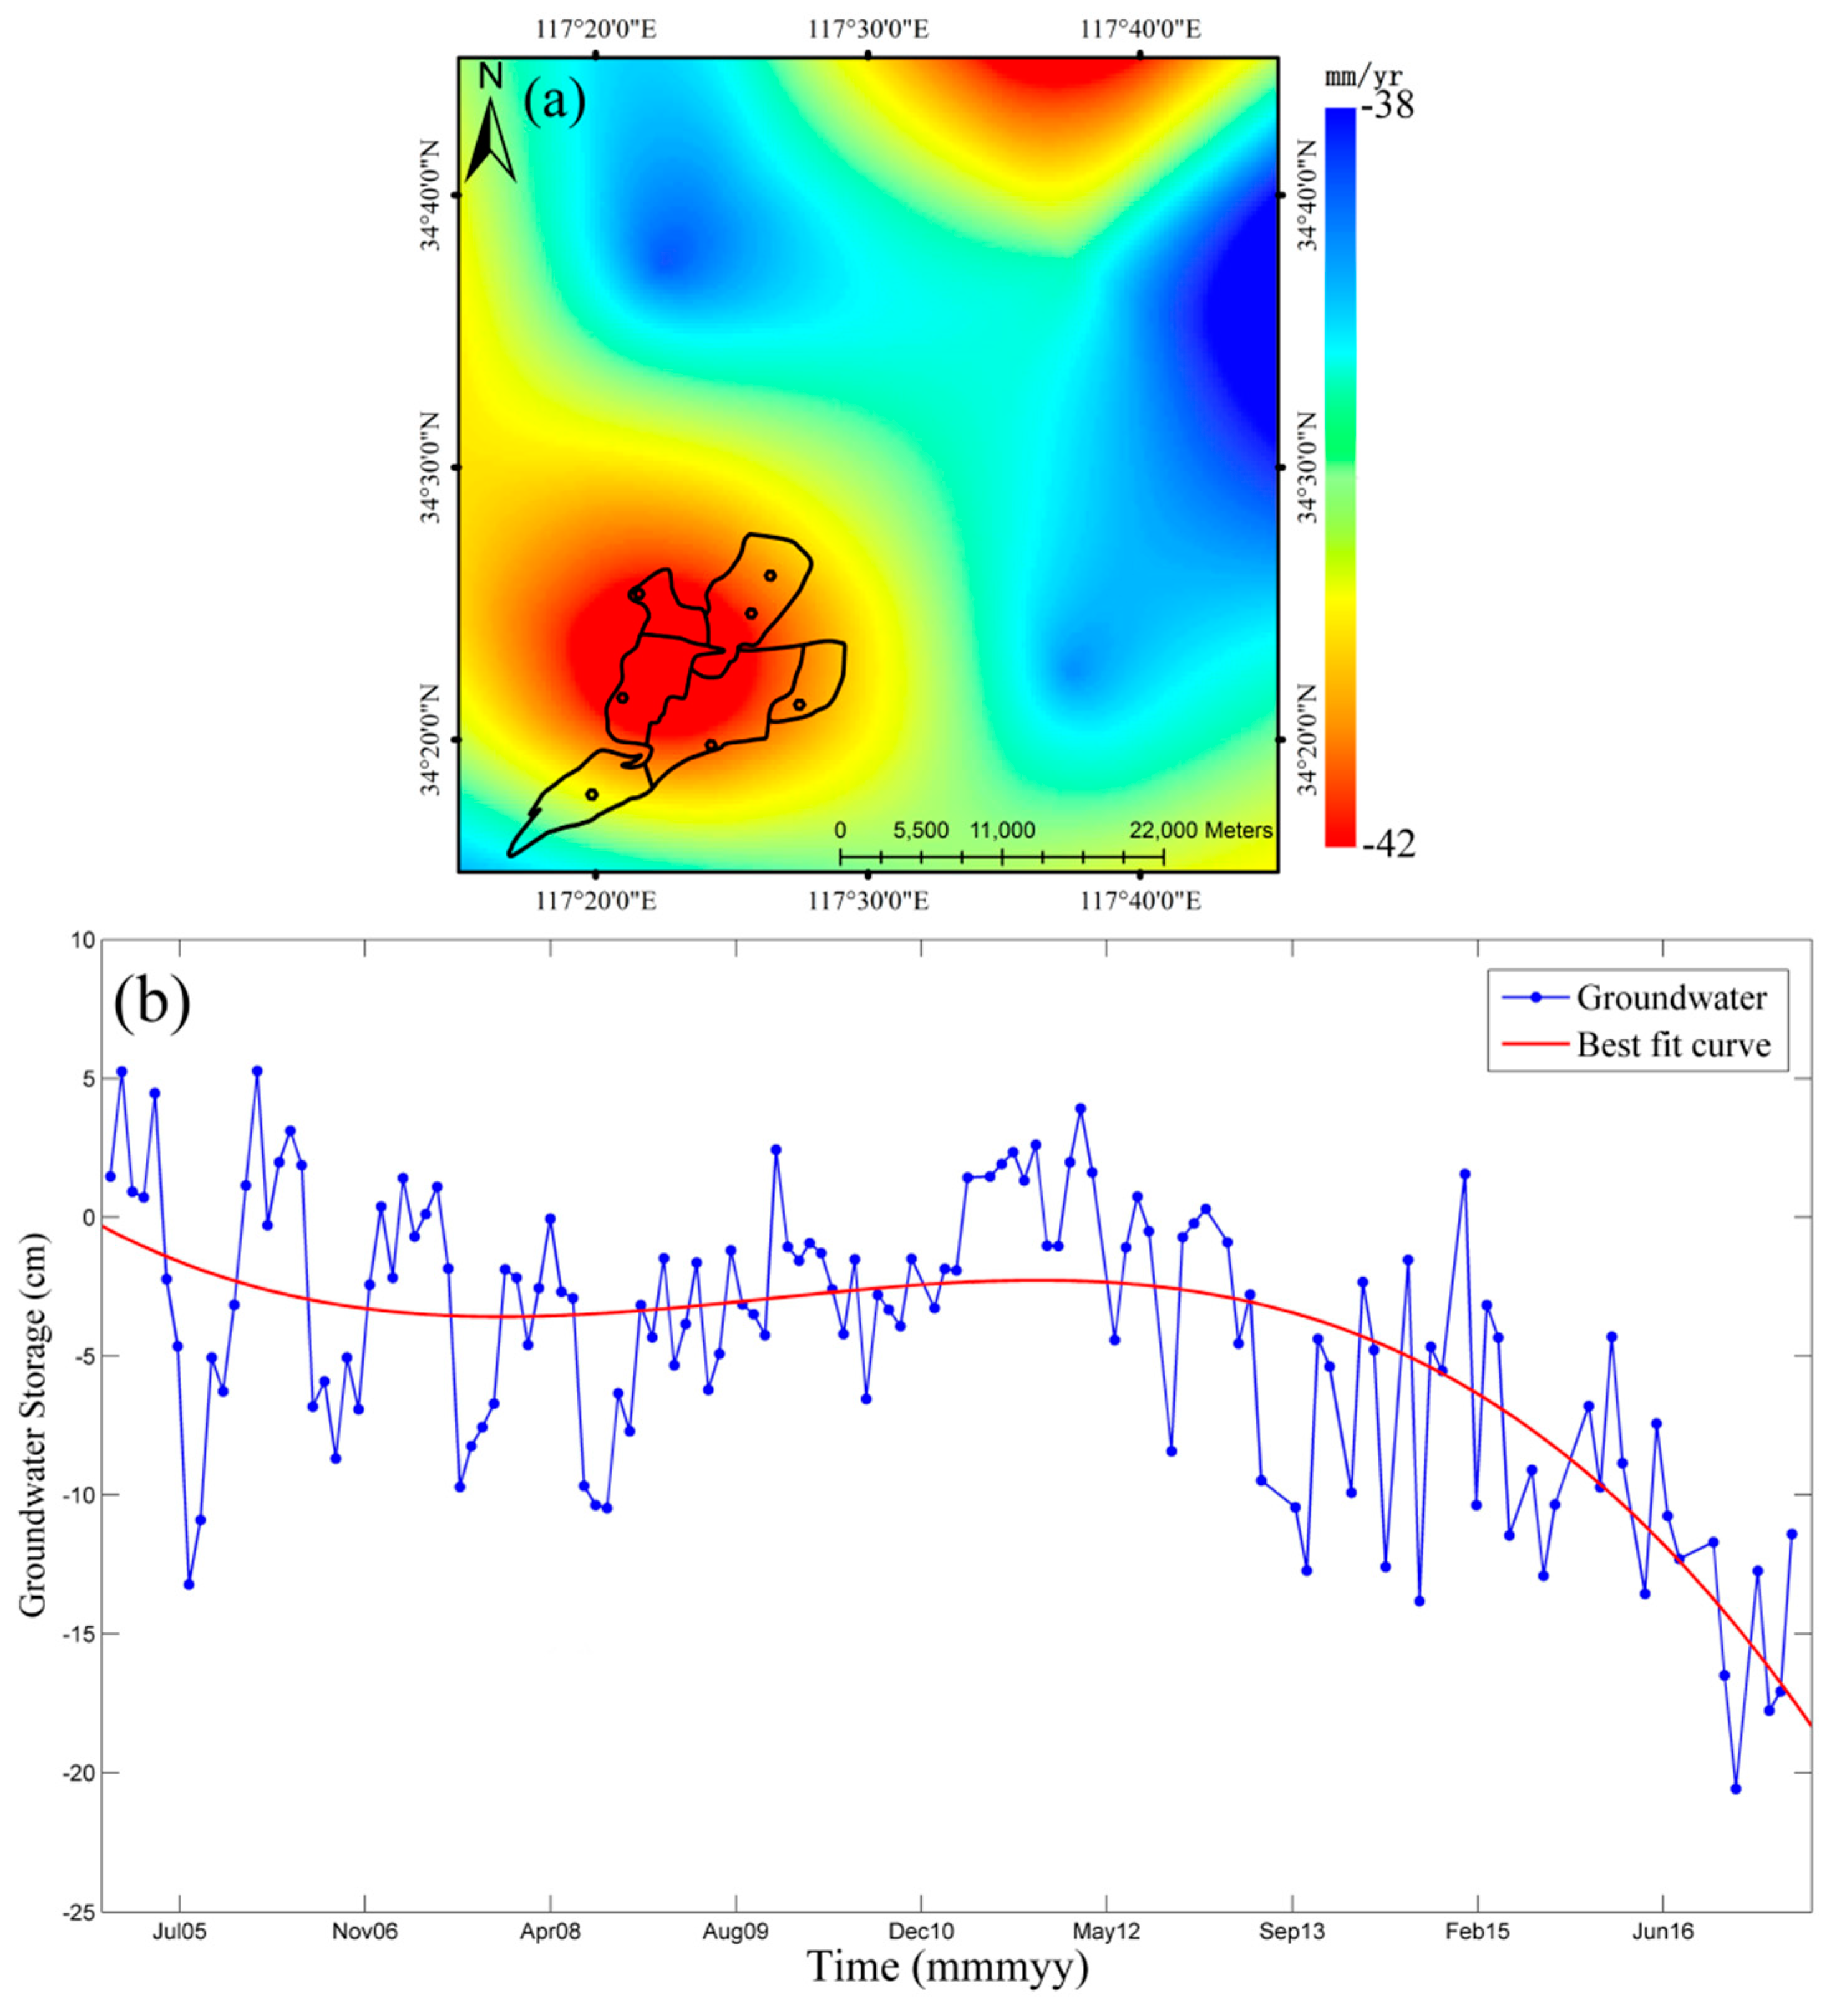
The groundwater storage change obtained by GRACE and GLDAS from January 2005 to June 2017 was shown in Figure 6. The mean long term trend of the groundwater storage change was 41 mm/year in the Eastern Xuzhou coalfield (Figure 6a). The time series of the groundwater storage change in the Eastern Xuzhou coalfield was shown in Figure 6b which exhibited a non-linear trend. From 2005 to 2008, the groundwater storage in the research area exhibited a downtrend. In 2008–2011, the regional groundwater storage exhibited a slow uptrend. However, after 2011, the regional groundwater storage exhibited a steep decreasing trend. Then, after 2017, the mass change again had an uptrend. Due to the lack of GRACE data, the variation in the subsequent groundwater storage cannot be monitored.
5. Discussion
5.1. The Relationship between Underground Mining, Groundwater Level Change, and Surface Deformation
In order to analyze the relationship between surface deformation and underground mining activities, the influence of the change of groundwater level on the surface deformation after the mine closure, we have statistically analyzed the surface deformation of each mining area during the three monitoring periods (I: 2006/06–2008/02,II: 2009/12–2010/10, III: 2016/10–2018/01) through maximum subsidence rate (MSR), maximum uplifting rate (MUR), ADR, SD (as shown in Table 3), and then the typical deformation of each mining area is analyzed by combining the time of mining and mine closing.
5.1.1. Dahuangshan Mine
After a major casualty accident from mine water inrush in the Dahuangshan mine in January 2000, the mine was sealed and the drainage activity stopped which made the level of groundwater rise [43]. After six years of the mine closure, although the groundwater storage in the entire Eastern Xuzhou coalfield exhibited a downtrend during October 2006 to February 2008 (Figure 6b), the surface uplift phenomenon appeared in the Dahuangshan mine (Figure 3b). It was possibly caused by the restoration of the local groundwater level. However, 10 years after the Dahuangshan mine closed, although the groundwater storage in the entire Eastern Xuzhou coalfield exhibited an uptrend during December 2009 to October 2010 (Figure 6b), continuous subsidence of the surface occurred in the southwestern region of the mining area (Figure 4b). The reason is that after the mine was closed, there are two main factors controlling the surface deformation, that is, the change of groundwater level and the residual deformation in the goaf. Since the groundwater level was restored in the Dahuangshan mine, the long-term water erosion reduced the friction of the fractured rock mass, which leads to the further compaction of fractured rock mass [4,5], thus, the goaf was activated and the surface subsidence was accelerated. However, After November 2016, the groundwater storage in the entire Eastern Xuzhou coalfield exhibited a uptrend again (Figure 6b), and a surface continuous uplift phenomenon appeared again during the period from October 2016 to January 2018 in the Dahuangshan mine (Figure 5b), the reason may be that the effective stresses on the soils decreases due to the further rise of the groundwater level, which makes the soil loose [44].
5.1.2. Qingshanquan and Hanqiao Mines
Although the groundwater storage in the entire Eastern Xuzhou coalfield exhibited a uptrend from December 2009 to October 2010 (Figure 6b), a slow subsidence occurred instead of an uplift in the Qingshanquan mine (Figure 4a) because only one year passed since the mine was closed. Therefore, the residual subsidence of mining has more influence on the surface deformation than the uplift caused by the groundwater level rising. Although the Hanqiao and the Qingshanquan mines were closed at the same time, the range and velocity of surface uplift in the Hanqiao mine are obviously larger than that in the Qingshanquan mine (Figure 4a). The reason is that the Hanqiao mine is located at the center of the Jiawang coal-bearing basin, and the mine water of different coal mines and underground runoff converge to the Hanqiao mine through various channels [45]. Therefore, after both mines were closed, the groundwater restoration was faster in the Hanqiao mine. When the Hanqiao mine was affected by the groundwater restoration, the response time of surface deformation was short. Therefore, a large area of uplift appeared within a short time in the Hanqiao mine after the mines were closed, while the influence of residual mining subsidence is smaller. The cause of uplift across the mining area boundary is that the influence of the groundwater recovery exceeds the mining area boundary after the Hanqiao and Qingshanquan mines were closed. However, the F5 fault plays a controlling role in groundwater flow [46], so the uplift phenomenon in the vicinity of the F5 fault in the south of the Hanqiao mine and the southwest of the Qingshanquan mine appears (Figure 4a).
After November 2016, the groundwater storage in the entire Eastern Xuzhou coalfield exhibited an uptrend (Figure 6b). Although the surface deformation of the Hanqiao mine was dominated by uplift during the period from October 2016 to January 2018 (Figure 5a), a subsidence phenomenon of the surface appeared from April to September in 2017 (Figure 5b). The reason is that long-term water erosion reduced the friction of the fractured rock mass, which leads to the further compaction of fractured rock mass [4,5]. Thus, the surface subsidence rate is greater than the uplift rate. After September 2017, the surface uplifted again due to the continuous rebound of the groundwater level (Figure 5b).
5.1.3. Quantai and Qishan Mines
Although the groundwater storage in the entire Eastern Xuzhou coalfield exhibited a downtrend during October 2006 to February 2008 (Figure 6b), it is not the main reason of the surface subsidence of Quantai mine. The surface continuous subsidence appeared because of the exploitation of Quantai mine (Figure 3b). However, before the closure of the Quantai mine, an uplift phenomenon occurred near the F5 fault in Quantai mining area from December 2009 to October 2010 (Figure 4a). The reason is that the groundwater went up and gushed into the Quantai mining area when the Qingshanquan mine was closed and drainage was stopped in December 2008, and due to the presence of the F5 fault there was no water gushing out [46]. Meanwhile, the Quantai and Qishan mines’ surface subsidence is mainly caused by the exploitation of the mine (Figure 4).
After the drainage facilities were stopped in September 2016, an uplift phenomenon and a subsidence phenomenon appeared in Quantai and Qishan mines, respectively (Figure 5a). The reason is that the Quantai mine stopped the exploitation before September 2016. However, in order to prevent the occurrence of water inrush accidents in the Qishan mine, the drainage facility in Quantai was stopped until all wells in the Qishan mine were closed [46]. Therefore, during the period from October 2016 to January 2018, the residual subsidence in Quantai mine was smaller than in the Qishan mine. When the influence of the uplift caused by groundwater is stronger than the residual subsidence, the surface showed the uplift phenomenon (in the Quantai mine (Figure 5b)); instead, the surface showed the subsidence phenomenon (in the Qishan mine (Figure 5b)).
5.2. The Relationship between Groundwater Storage Change and Underground Mining
Since the spatial resolution of GRACE data is low, it can only reflect the change of the average groundwater storage in the Eastern Xuzhou coalfield. Therefore, we comprehensively analyze the relationship between underground coal mining activities and groundwater storage change in the whole coalfield.
From 2005 to 2008, except the Dahuangshan and the Dongzhuang mines, which were closed in 2000 and 2001, respectively, mining activities and a large amount of drainage activities were ongoing in all mines in the entire Eastern Xuzhou coalfield. Therefore, the groundwater storage in the entire region exhibited a downtrend during this period (as showed in Figure 6b). From 2008 to 2011, because the Qingshanquan and the Hanqiao mines were closed in December 2008, and the pumping was stopped. Since the Hanqiao mine is located at the center of the entire basin [45], the restoration speed and flow amount of groundwater are both large, which caused the mass of the groundwater inflow to be greater than the mass of groundwater drainage in the Quantai and the Qishan mines. Therefore, groundwater storage slowly increased. After 2011, the increase of the groundwater level in the abandoned Hanqiao mine enhanced the water head pressure and caused the mine water to burst into the Qishan mine through faults and weak aquifers, leading to the occurrence of a major water inrush hazard in the Qishan mine, and the water inflow reached 13,800 m3/h [47,48]. To ensure the safety of the coal mine, more than 0.2 million m3 mine water was extracted daily from the abandoned Hanqiao coal mine and the Qishan coal mine [47]. Moreover, after the Quantai mine was closed, the rise of the water level threatened the safe production of the adjacent Qishan coal mine. Therefore, before the Qishan mine was closed, the drainage activity continued in the Quantai mine [46], and the mass of the groundwater in the entire region decreased again. After 2017, the mass had an uptrend again. The reason is that in September 2016, the mines in the entire eastern Xuzhou had been closed, and the groundwater storage mostly recovered. However, due to the lack of GRACE data in September and October 2016, we are not sure whether the groundwater recovered immediately or there was a time delay after the closure of the mine.
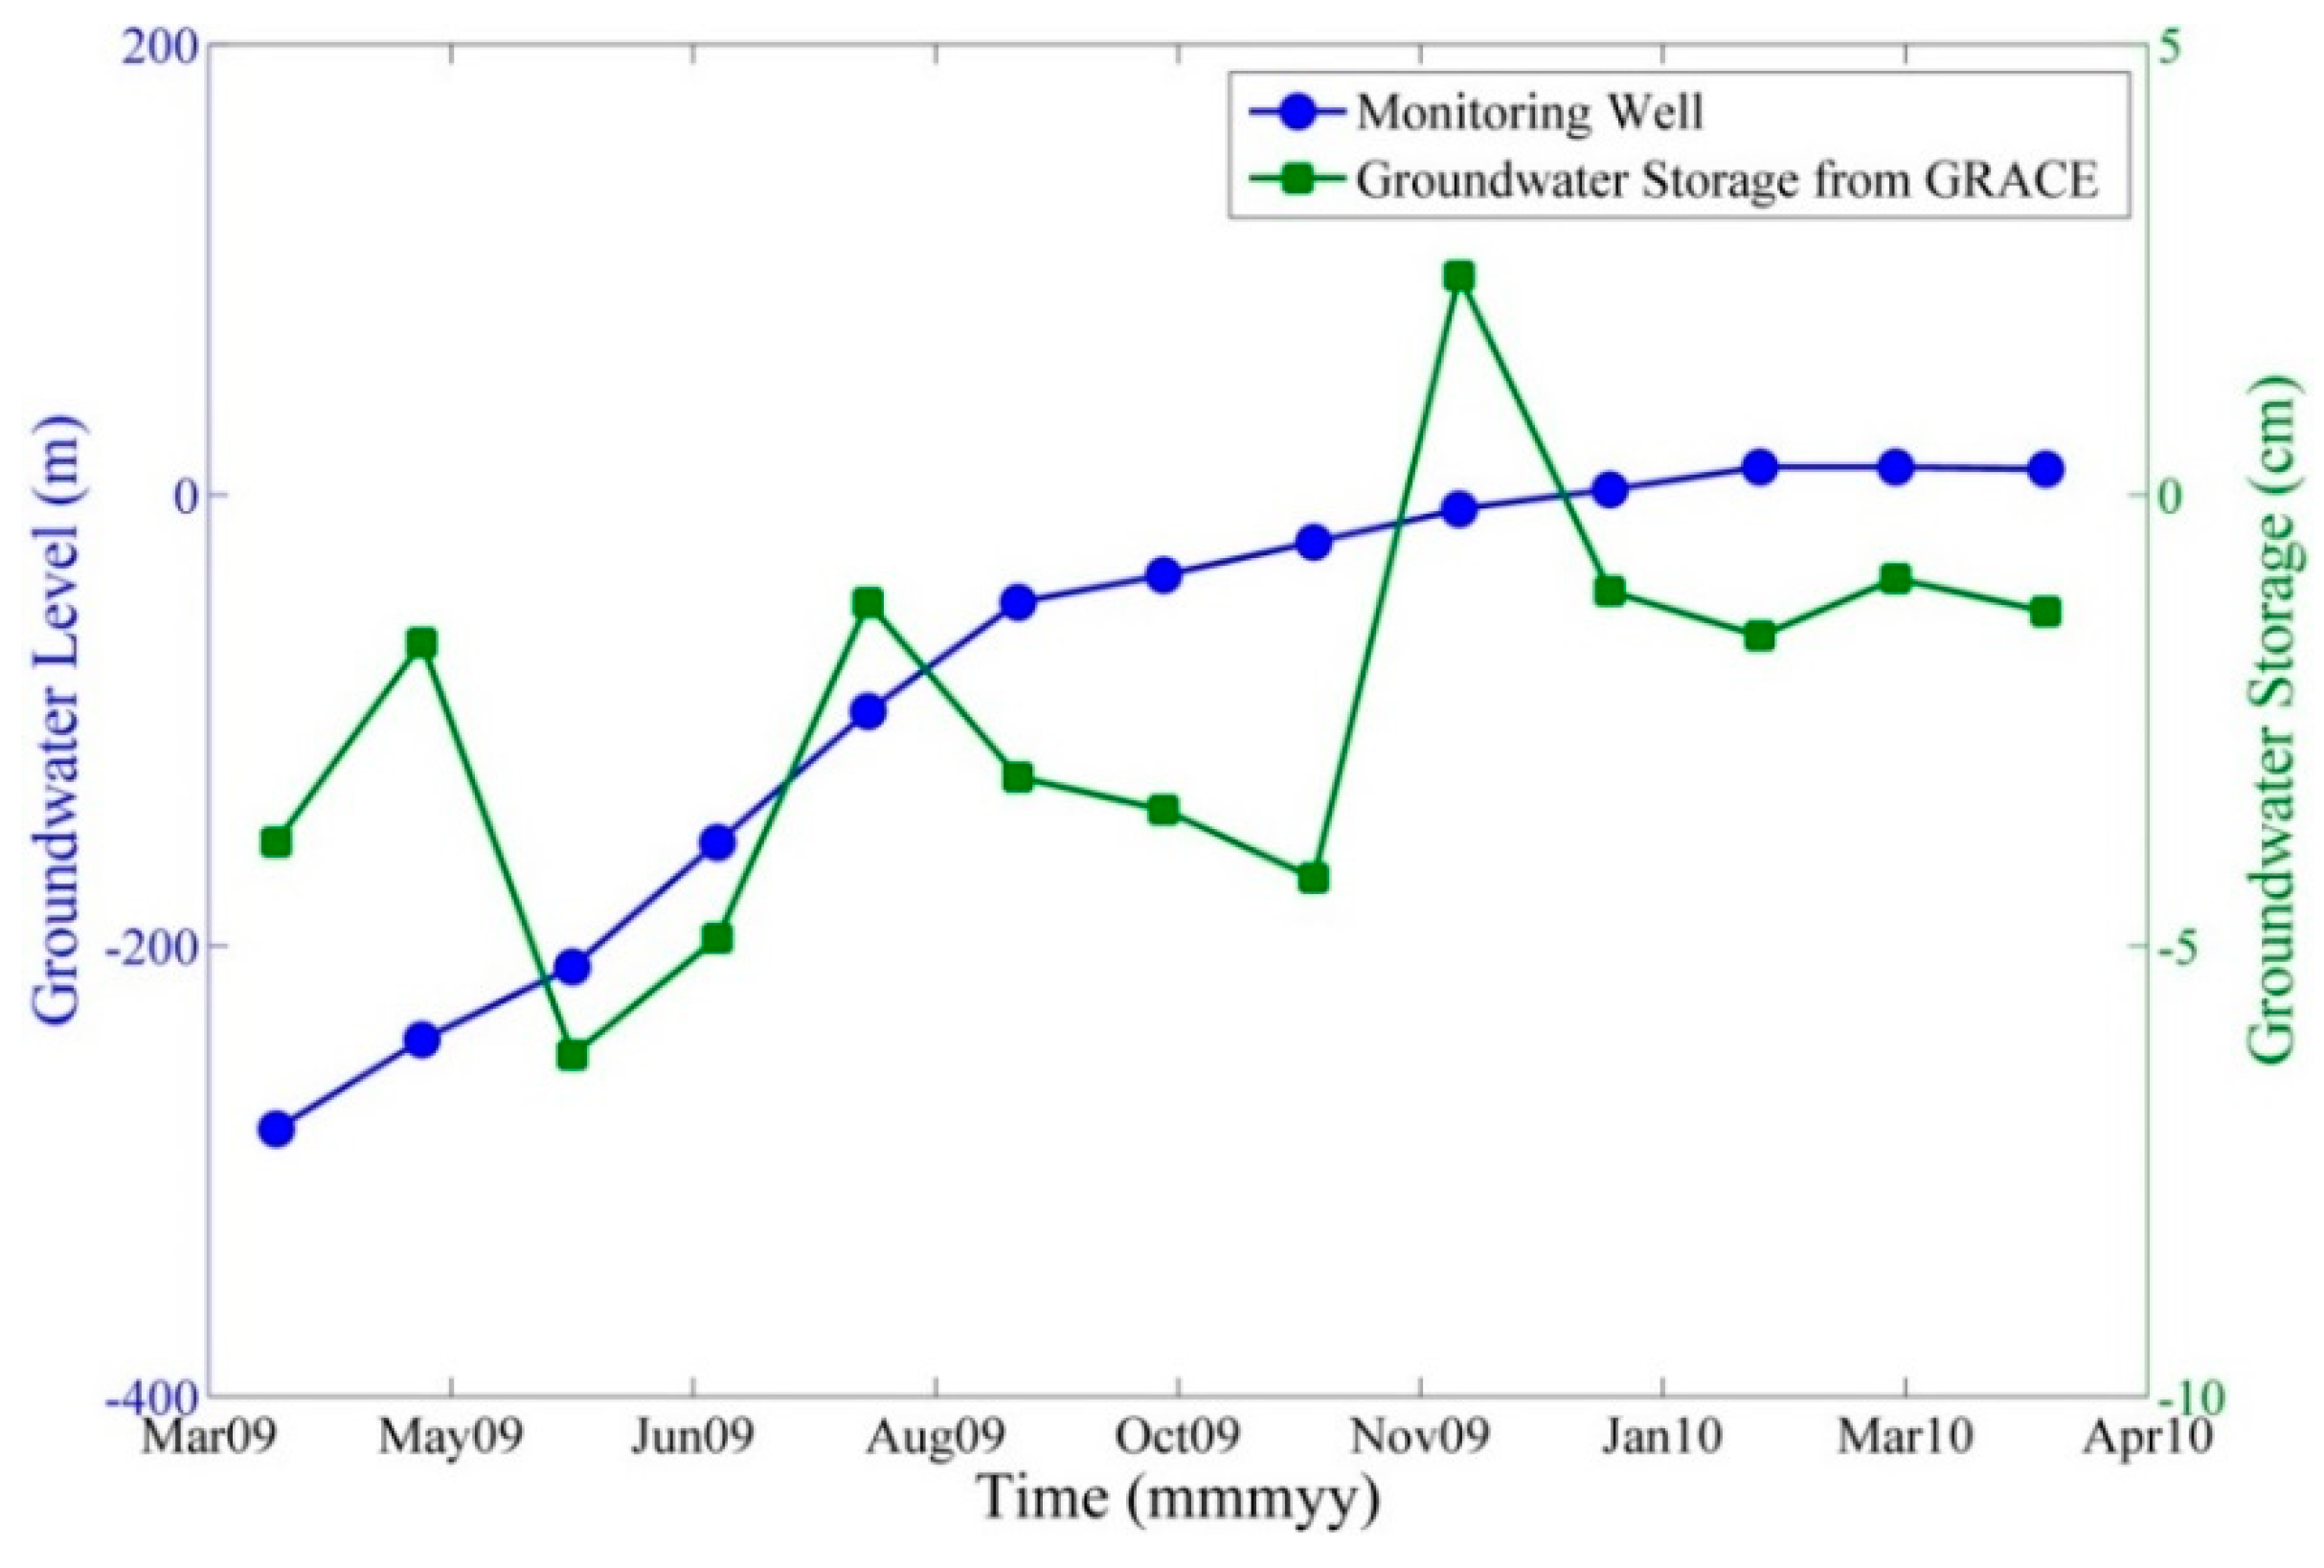
To verify the reliability of groundwater storage change in the research area obtained by combining the GRACE and GLDAS data, the groundwater level data was collected in the Hanqiao mine from April 2009 to April 2010 (measured well location is shown in Figure 1b) [49]. Since the equivalent water height comparable to the GRACE results can only be obtained by multiplying the variation in the groundwater level by the porosity of soil [50], we only qualitatively compared their variation trend and did not make any quantitative comparison. According to Figure 7, the agreement between the variation trends of two datasets is good, and both exhibit the uptrend. The groundwater storage change obtained by the GRACE data is reliable, and the correlation coefficient of two datasets is 0.51. The following are possible reasons that cause the low correlation coefficients between two datasets: (1) the resolution of the GRACE data is too low, while the area of the research region is small, which reduces the signal-to-noise ratio; (2) the GRACE data reflect the overall change of groundwater storage in the research area, while the data of the measured water level only reflects the change of groundwater level in the Hanqiao mine; and (3) there are not only underground drainage activities in the research area, but also underground mining activities.
5.3. The Relationship between Surface Deformation and Groundwater Storage Change in the Eastern Xuzhou Coalfield
The regional mass change is mainly concentrated in the Eastern Xuzhou coalfield. Therefore, for the convenience of analyzing the correlation between the surface deformation and the groundwater storage change, masking was performed on the InSAR monitoring results for locations outside the mining boundary, only TCP with a deformation rate outside −5–5 mm/year was statistical analyzed through NCP, MSR, MUR, ADR, and SD. The results are shown in Table 4. Since the change of groundwater level causes the surface deformation to usually have a retardance [51], by combining the InSAR monitoring results and the actual mining activities, the times were extended forward by one year while analyzing the groundwater storage change.
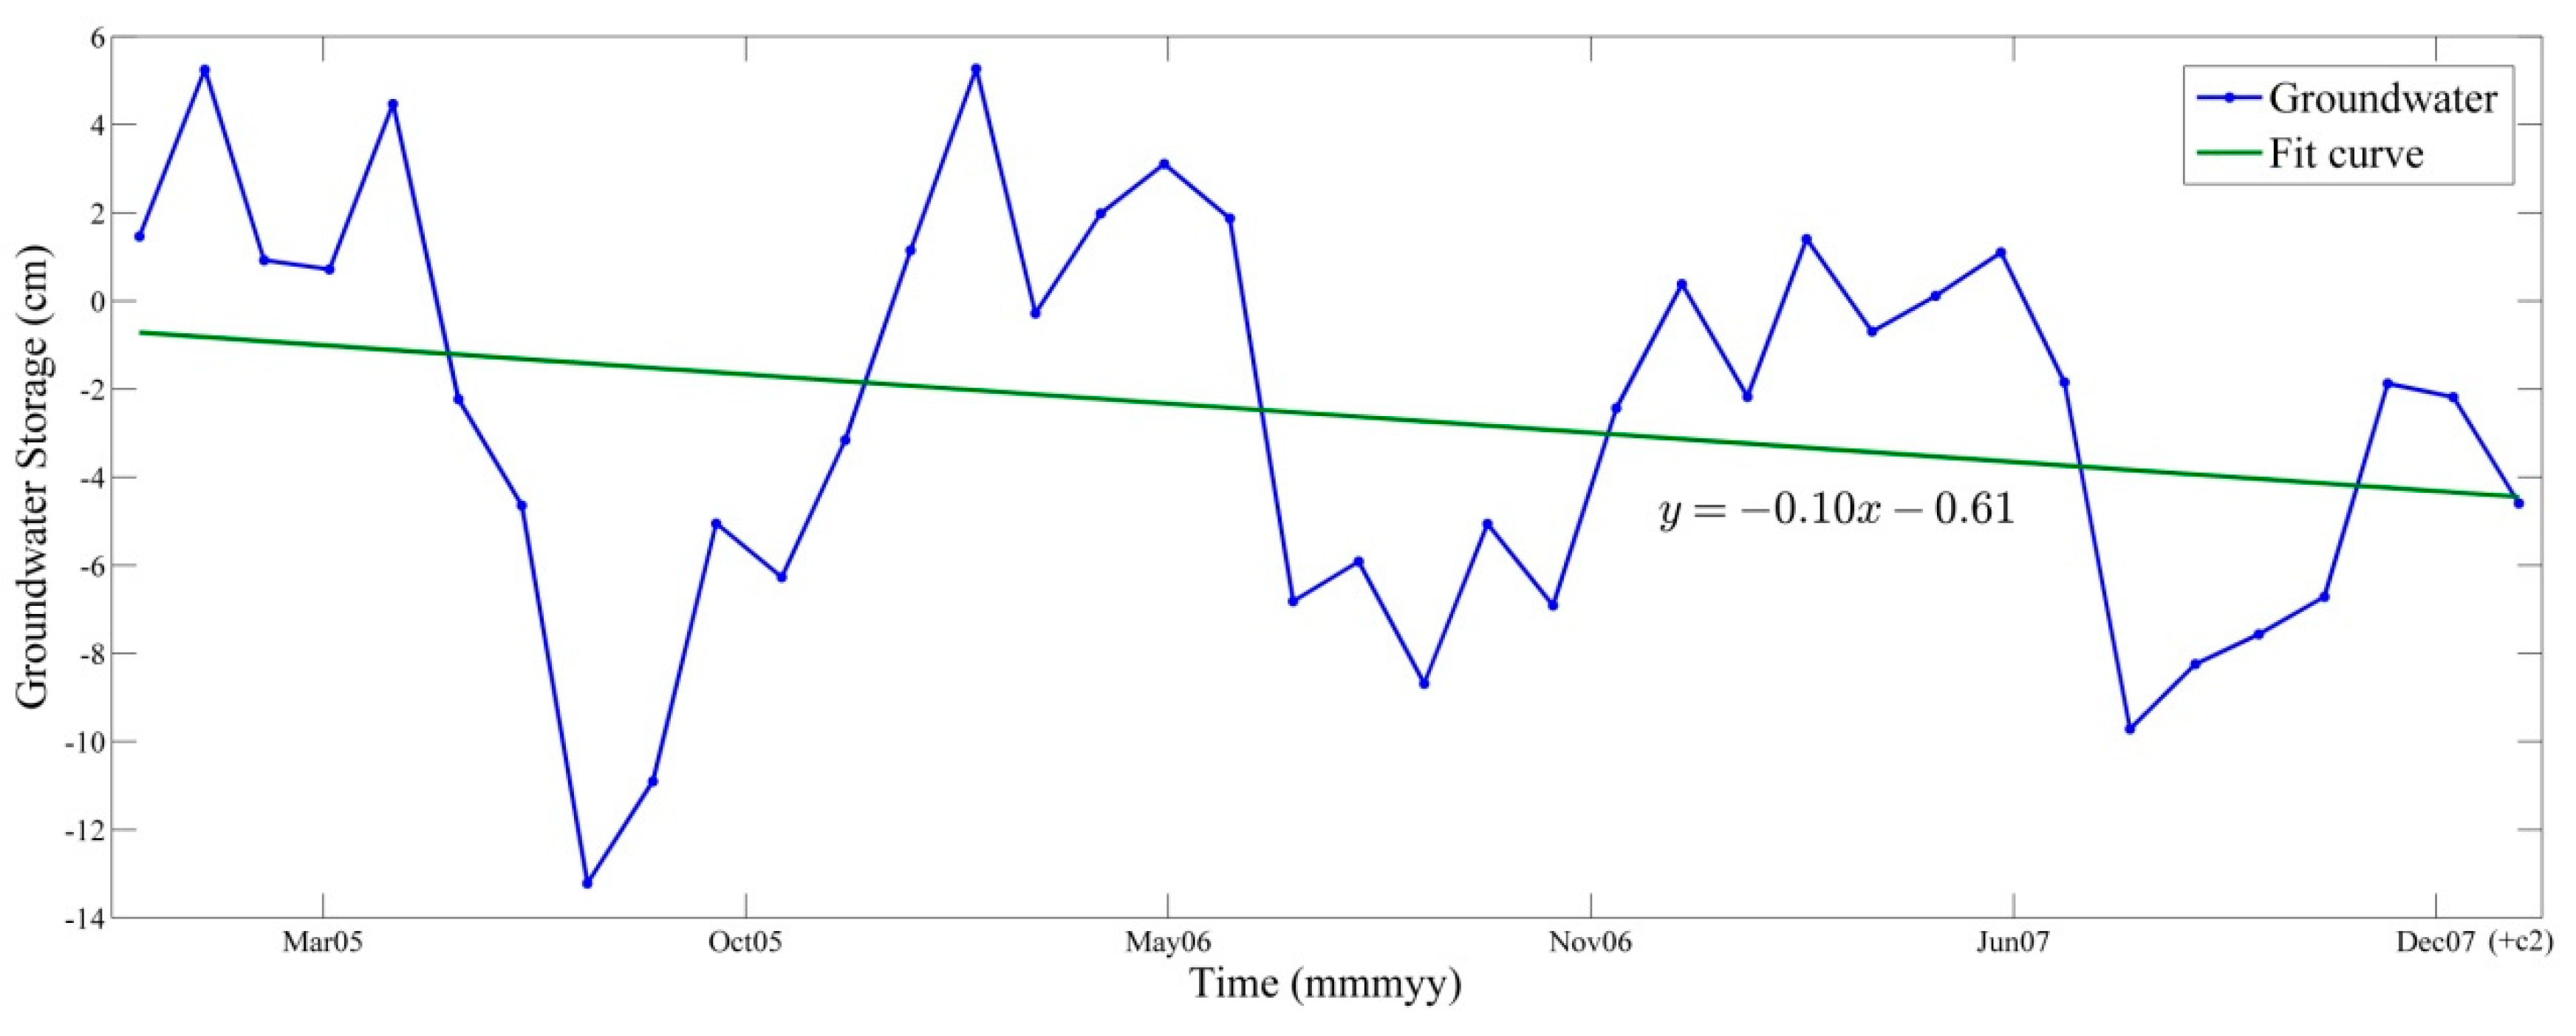
According to Table 4, the average deformation rate in the monitored area during June 2006 to February 2008 was −6.2 mm/year. The deformation of the monitoring area was dominated by subsidence. Through the regression analysis on the groundwater storage obtained from January 2005 to February 2008, the groundwater storage variation rate (GSVR) during the entire period was −1.0 mm/year (Figure 8). During this period, Only Dahuangshan and Dongzhuang mines were closed. Therefore, although the trend of surface deformation and groundwater storage change is consistent, the main controlling factor of overall average deformation in the mining area was mine exploitation. The contribution of groundwater storage change to surface deformation is very small. Since the SAR data did not cover the entire research area, the estimated ADR may be smaller than the actual situation.
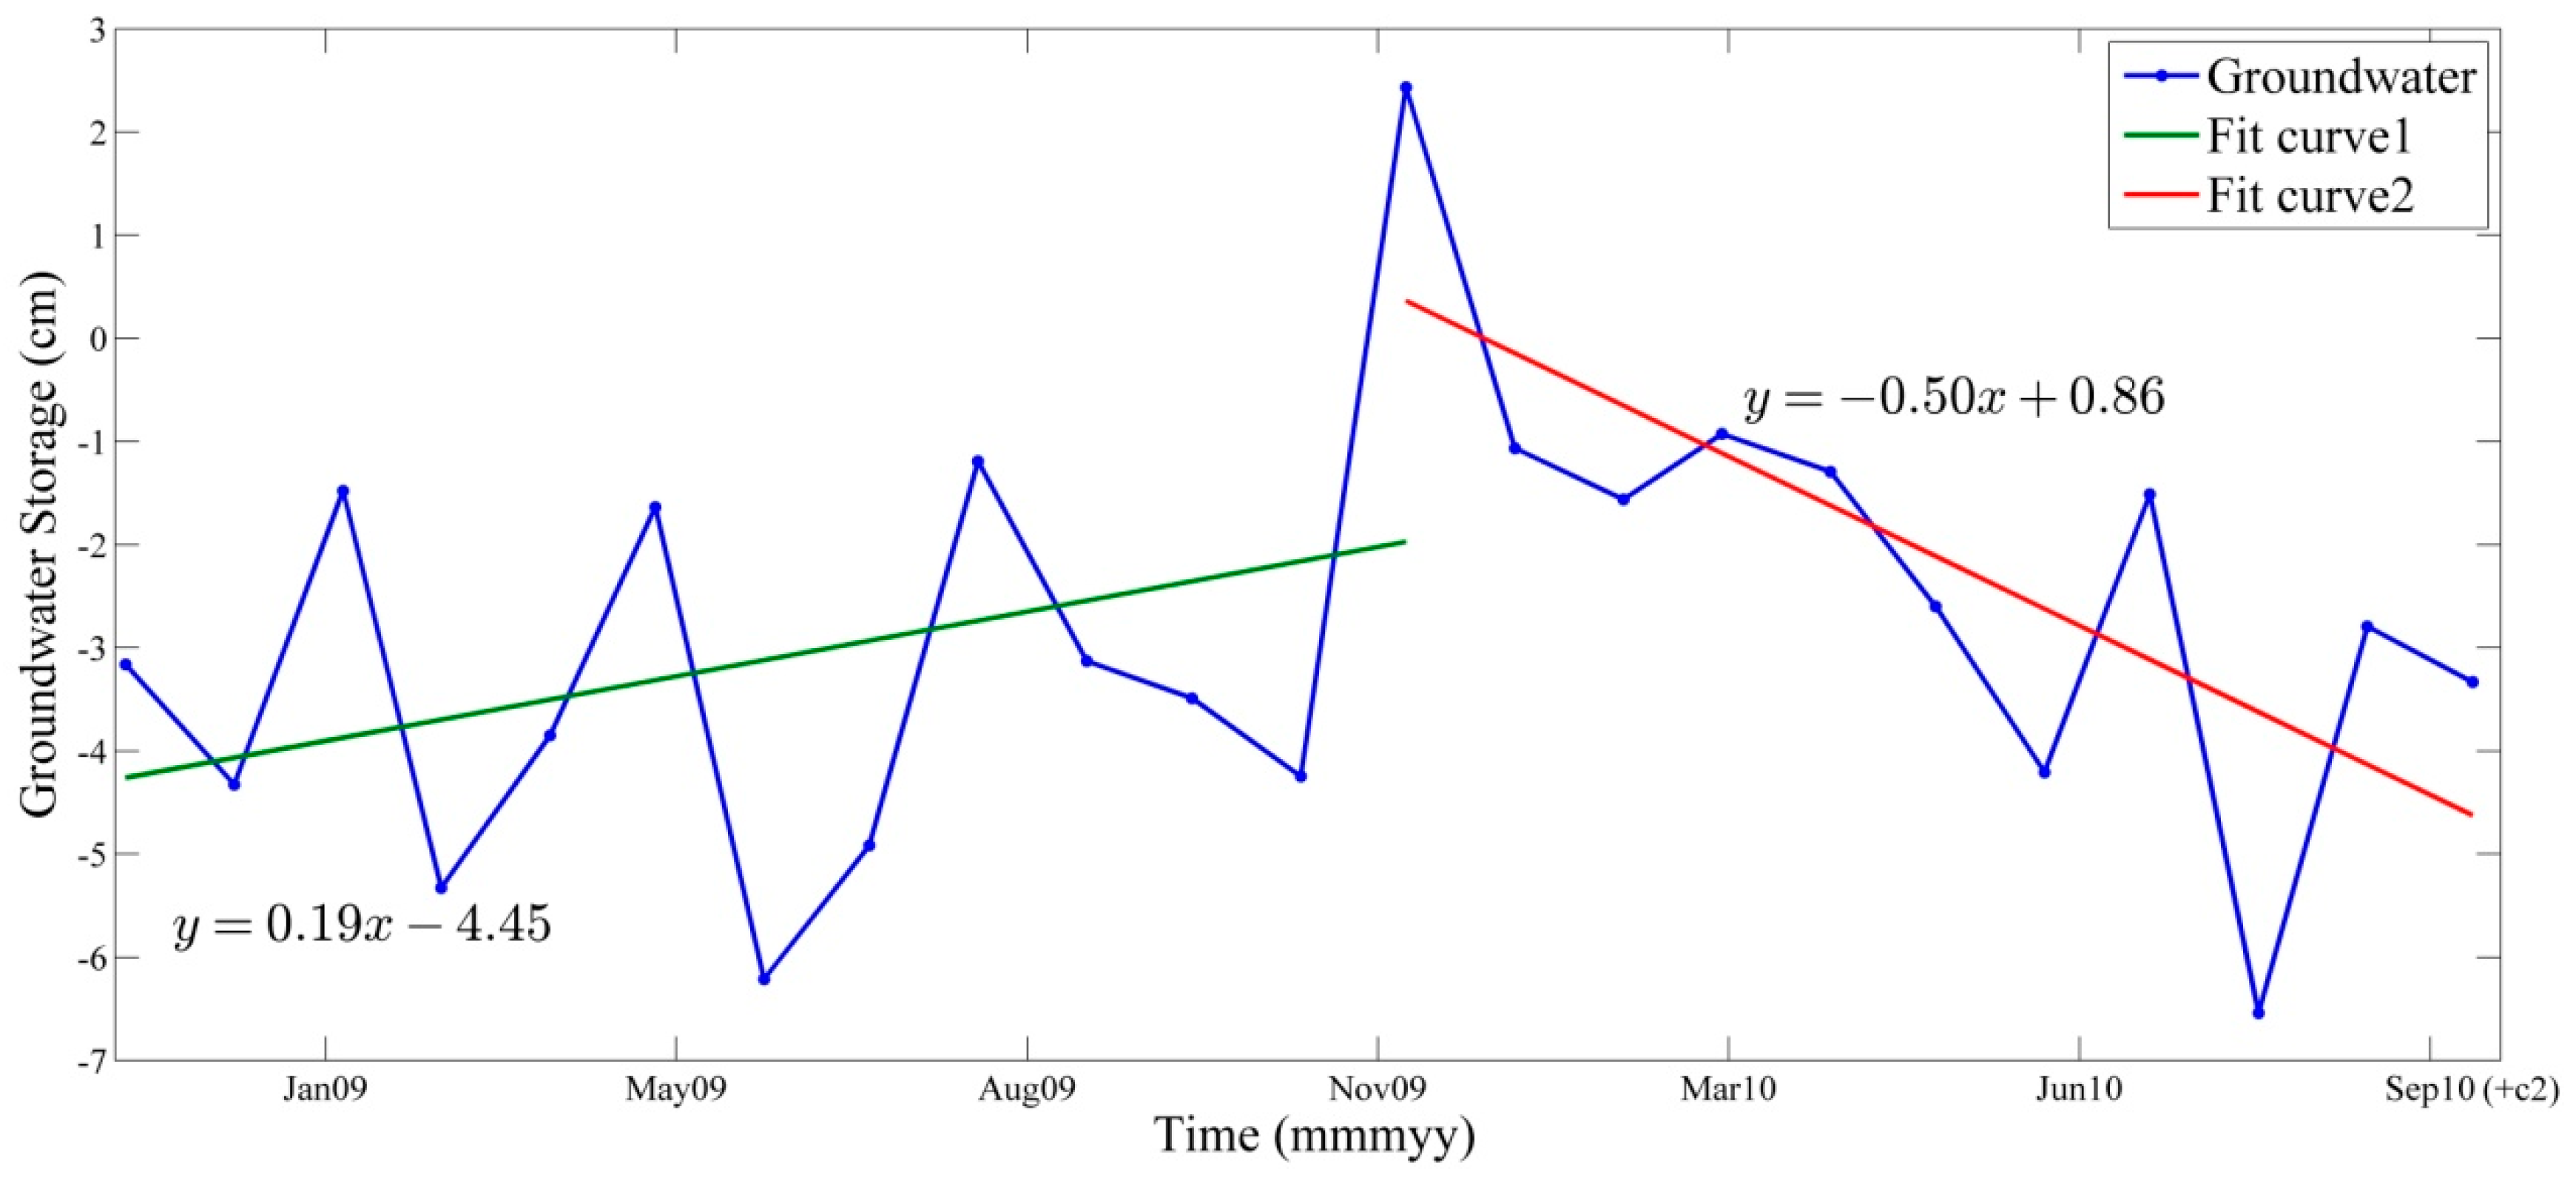
The research area had an average deformation rate of −0.2 mm/year during December 2009 to October 2010. The uplift and subsidence of the monitoring area were evenly matched. Through the regression analysis on the groundwater storage change obtained from December 2008 to October 2010, the groundwater storage change rate is 1.9 mm/year from December 2008 to December 2009 and −5.0 mm/year from December 2009 to October 2010 (Figure 9). Due to the groundwater changes that cause surface deformation, which usually has retardance [51], SAR image monitoring time should correspond to the GSVR analysis time from December 2008 to December 2009, as shown in Table 4. During this period, only Quantai and Qishan mines were being exploited, and the local groundwater recovered rapidly and caused a wide range of uplift after the Hanqiao mine was closed [45] (Figure 4a). Therefore, the subsidence caused by coal mining and the uplift caused by groundwater rebound were evenly matched. The estimated ADR of the whole mining area is small.
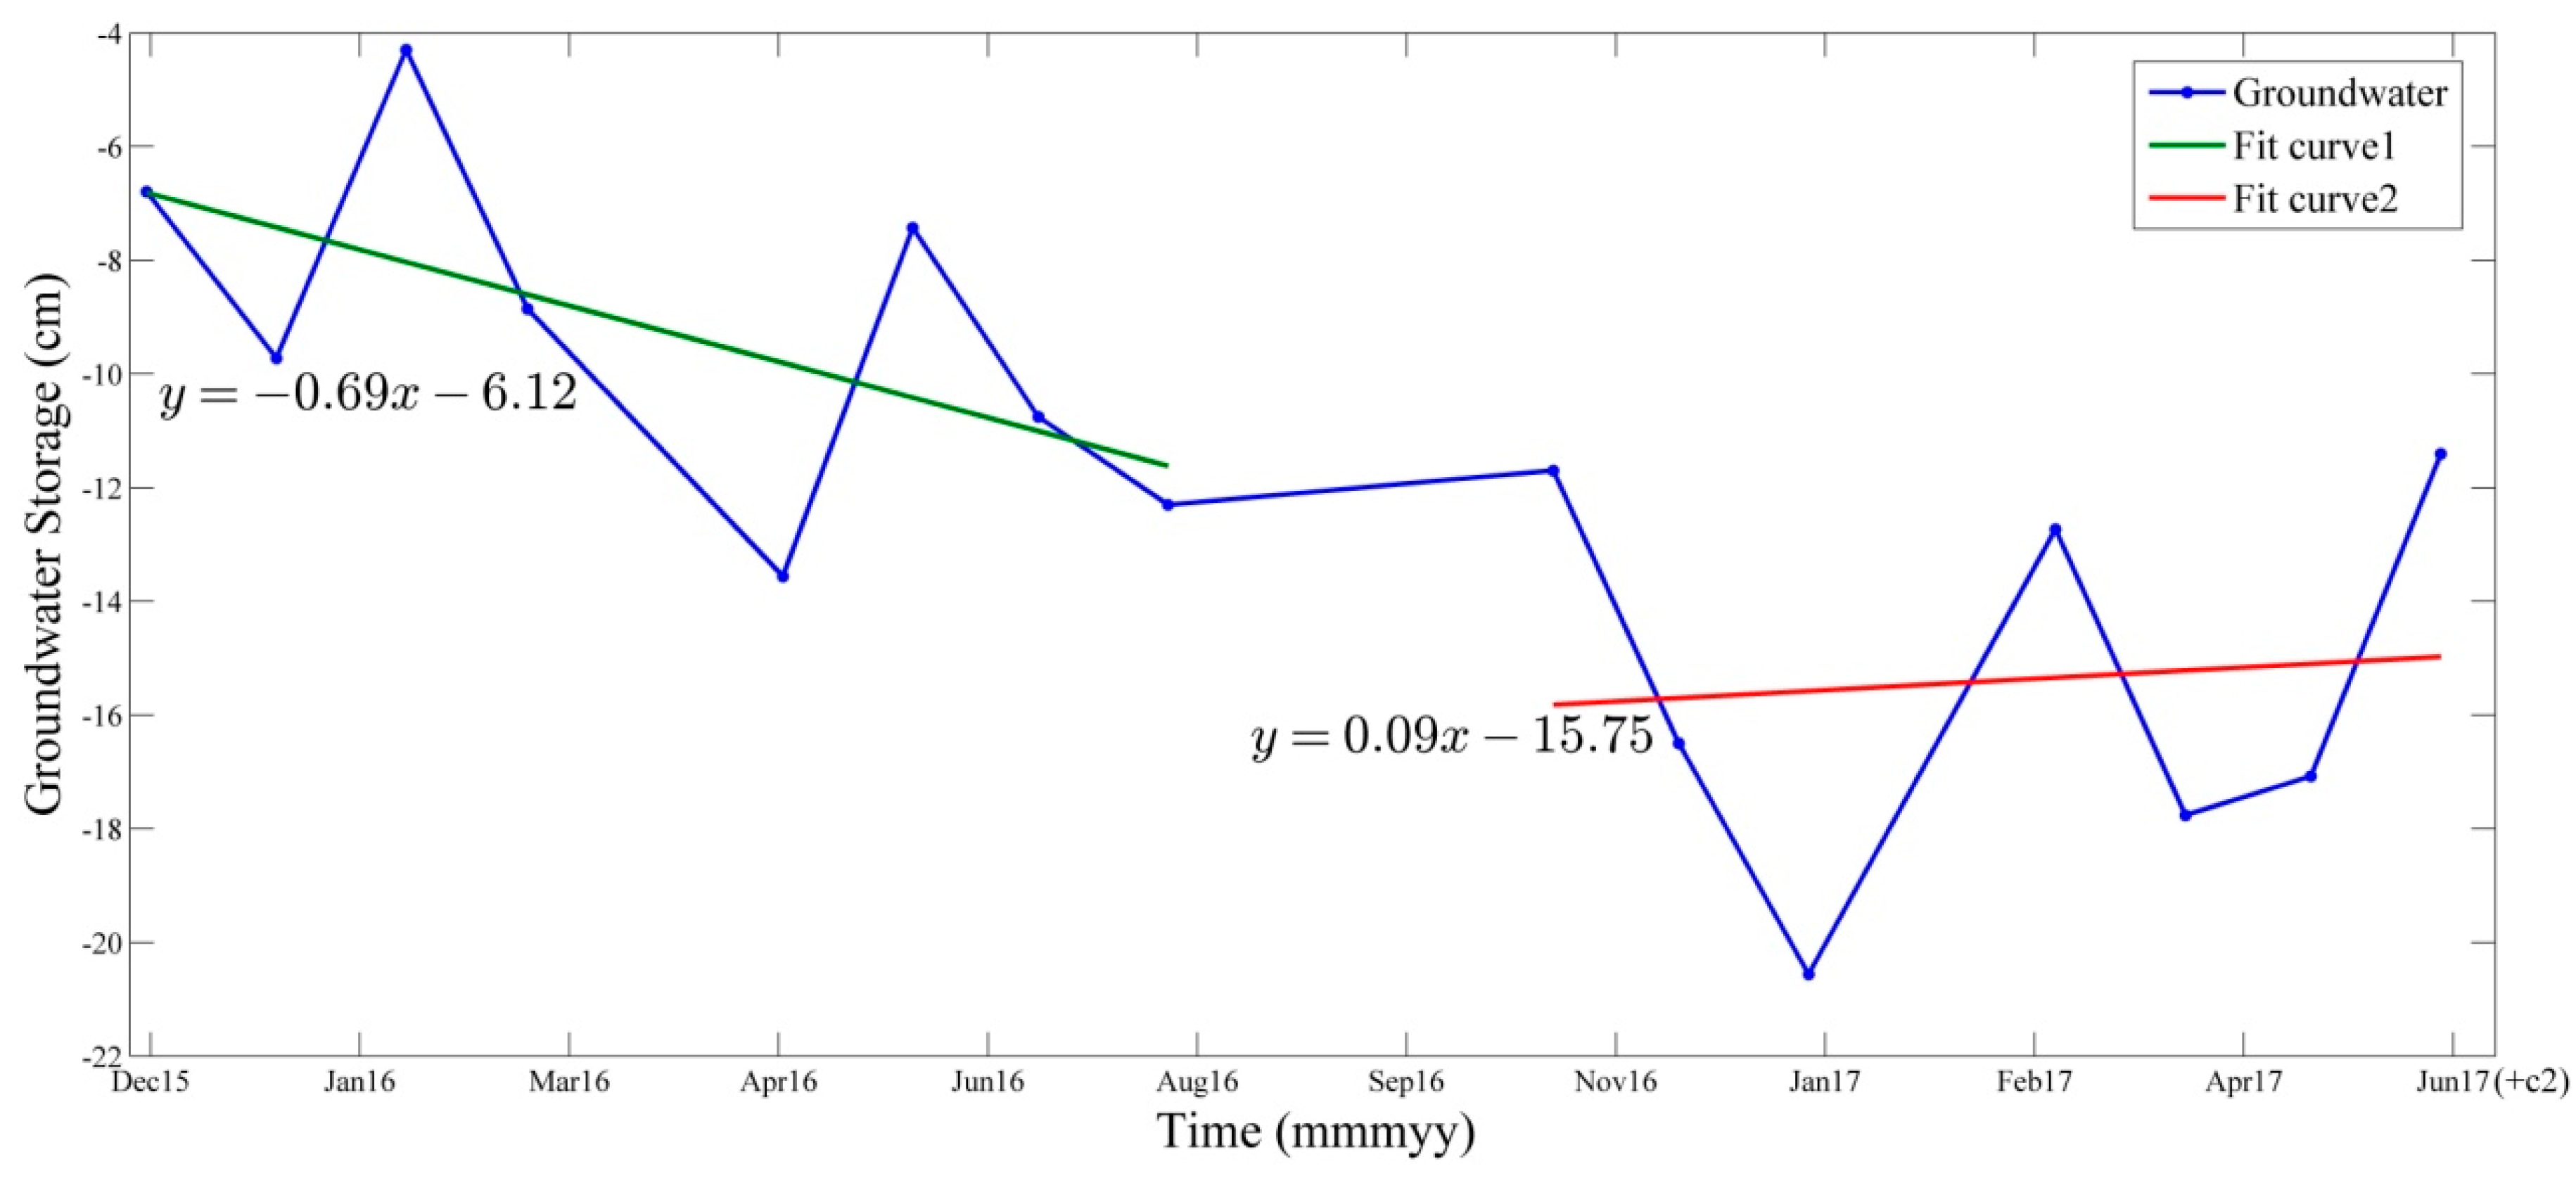
Through the regression analysis of the groundwater storage change from December 2015 to June 2017, it can be seen that the variation rate of groundwater storage was −6.9 mm/year from December 2015 to August 2016 (the GRACE data for October and November 2015 and September 2016 were absent) and 0.9 mm/year from November 2016 to June 2017 (because the GRACE data do not include the data for October 2016) (Figure 10). There are two trends in the change of groundwater storage during this period. Combined with previous analysis, the surface deformation caused by the groundwater storage change could be delayed of about one year. Therefore, in order to obtain the surface deformation in the corresponding groundwater storage change, the Sentinel-1A data are divided into two parts according to the cut-off time of GRACE data. Figure 11 shows the LOS annual average deformation rate. According to Table 4, the monitoring results from October 2016 to June 2017 generally indicated subsidence, and the subsidence rate was −2.5 mm/year. The overall subsidence of the research area during the period from October 2016 to June 2017 should correspond to the GSVR from December 2015 to August 2016. Although all the mines were closed after September 2016, the ADR increased compared with the previous stage. The reason is that the Qishan and Quantai mines were closed only for half a year, which is greatly affected by residual subsidence, and the groundwater in the whole mining area continues to decline. Therefore, the subsidence of the entire mining area is the combined effect of residual subsidence and groundwater reserves reduction. The deformation in the entire region was stable during June 2017 and January 2018, and the average deformation rate was 0.1 mm/year. The overall stable of the research area during the period from June 2017 and January 2018 should correspond to the GSVR from November 2016 to June 2017, as shown in Table 4. Corresponding to this SAR monitoring period, the groundwater has recovered in the entire mining area. And the residual subsidence decreases with the increase of time. Therefore, the deformation of the entire mining area is relatively stable because the uplift caused by groundwater rebound offset the residual subsidence caused by the goaf.
6. Conclusions
Through 13 scenes of ENVISAT data from 17 June 2006 to 2 February 2008, 10 scenes of ENVISAT data from 1 December 2009 to 12 October 2010, and 32 scenes of Sentinel-1A data from 4 October 2016 to 15 January 2018, the experiment successfully obtained the surface deformation for mines under exploitation, the goaf, and the closed mine in the research area based on the TCPInSAR technique. According to the InSAR monitoring results, mining activity, and groundwater variation, the main reasons causing the surface subsidence were underground mining and residual subsidence in the goaf, and the main reason for the surface uplift was groundwater rise following mine closure.
By combining the GRACE data and GLDAS data, the average groundwater storage change was obtained in the research area from January 2005 to June 2017, which was nonlinear with time. Moreover, through the measured well data from April 2009 to April 2010, the reliability of the groundwater storage change results was qualitatively validated. The analysis combining the time of mining and mine closing indicates that there was a very strong correlation between the drainage activity of underground mining and the groundwater storage change.
By analyzing the InSAR monitoring results and the results of groundwater storage change obtained by the GRACE data, the correlation between groundwater storage change and surface deformation can be better understood. During the period of coal mining, the change of groundwater storage has little effect on surface deformation in the study area, and mining activity is the main factor of surface deformation. After the closure of the mine, the surface deformation mainly depends on two factors: the residual subsidence and the groundwater storage change. The recovery of groundwater will result in the surface uplift, which may also cause the goaf activation and accelerate the residual subsidence.
Since the measured data of surface deformation in the research area cannot be collected, the InSAR monitoring results were only qualitatively analyzed. The statistical analysis is biased because there are no coherent points in some regions of InSAR monitoring results due to the influence of incoherence. GRACE data could detect large signal changes in a small region; however, because the GRACE data had low resolution, the influence of noise and signal leakage reduced the accuracy of the monitoring results.
Author Contributions
M.Z. designed and performed research; K.D. and H.F. analyzed the results. M.Z. and S.D. wrote the paper.
Funding
This research was funded by the Fundamental Research Funds for the Central Universities grant number [2018BSCXB15] and the Postgraduate Research and Practice Innovation Program of Jiangsu Province grant number [KYCX18_1950].
Acknowledgments
The research work is supported by the Fundamental Research Funds for the Central Universities (no. 2018BSCXB15), the Postgraduate Research and Practice Innovation Program of Jiangsu Province (no. KYCX18_1950).
Conflicts of Interest
The authors declare no conflict of interest.
References
- Xi’an Research Institute of China Coal Research Institute. Study on Karst Groundwater Resources and Prediction and Management of Karst Water in North China; Xi’an Research Institute of China Coal Research Institute: Xi’an, China, 1989. (In Chinese) [Google Scholar]
- Deng, K.; Tan, Z.; Jiang, Y.; Dai, H.; Shi, Y.; Xu, L. Deformation Monitoring and Subsidence Engineering; China University of Mining and Technology Publisher: Xuzhou, China, 2014. (In Chinese) [Google Scholar]
- Hu, W.; Li, Z.; Wang, C. Geological environmental hazards caused by abandoned mine. Coal Geol. Explor. 2002, 30, 33–35. (In Chinese) [Google Scholar]
- Helm, P.R.; Davie, C.T.; Glendinning, S. Numerical modelling of shallow abandoned mine working subsidence affecting transport infrastructure. Eng. Geol. 2013, 154, 6–19. [Google Scholar] [CrossRef]
- Salmi, E.F.; Nazem, M.; Karakus, M. The effect of rock mass gradual deterioration on the mechanism of post-mining subsidence over shallow abandoned coal mines. Int. J. Rock Mech. Min. Sci. 2017, 91, 59–71. [Google Scholar] [CrossRef]
- Hu, W.; Zhou, J.; Yan, L. Study on environment and safety disasters from abandoned coalmines. J. XI’AN Univ. Sci. Technol. 2010, 30, 436–440. [Google Scholar]
- Zhao, T. Integrated Control Technology of Orot Water in North China; China Coal Industry Publishing House: Beijing, China, 2006. (In Chinese) [Google Scholar]
- Fan, H.; Gao, X.; Yang, J.; Deng, K.; Yu, Y. Monitoring mining subsidence using a combination of phase-stacking and offset-tracking methods. Remote Sens. 2015, 7, 9166–9183. [Google Scholar] [CrossRef]
- Huang, J.; Deng, K.; Fan, H.; Yan, S. An improved pixel-tracking method for monitoring mining subsidence. Remote Sens. Lett. 2016, 7, 731–740. [Google Scholar] [CrossRef]
- Fialko, Y.; Simons, M.; Agnew, D. The complete (3-D) surface displacement field in the epicentral area of the 1999 m w 7.1 hector mine earthquake, California, from space geodetic observations. Geophys. Res. Lett. 2001, 28, 3063–3066. [Google Scholar] [CrossRef]
- Lu, Z.; Fielding, E.; Patrick, M.R.; Trautwein, C.M. Estimating lava volume by precision combination of multiple baseline spaceborne and airborne interferometric synthetic aperture radar: The 1997 eruption of okmok volcano, Alaska. IEEE Trans. Geosci. Remote Sens. 2003, 41, 1428–1436. [Google Scholar]
- Wang, Y.; Wang, L.; Zhang, Y.; Yang, T. Investigation of snow cover change using multi-temporal PALSAR InSAR data at Dagu Glacier, China. In Proceedings of the 2015 IEEE Geoscience Remote Sensing Symposium, Milan, Italy, 12 November 2015; pp. 747–750. [Google Scholar]
- Dai, K.; Liu, G.; Li, Z.; Li, T.; Yu, B.; Wang, X. Extracting vertical displacement rates in Shanghai (China) with multi-platform SAR images. Remote Sens. 2015, 7, 9542–9562. [Google Scholar] [CrossRef]
- Fan, H.; Cheng, D.; Deng, K.; Chen, B.; Zhu, C. Subsidence monitoring using D-InSAR and probability integral prediction modelling in deep mining areas. Surv. Rev. 2015, 47, 438–445. [Google Scholar] [CrossRef]
- Bamler, R. Synthetic aperture radar interferometry. Inverse Probl. 1998, 14, 12–13. [Google Scholar] [CrossRef]
- Ferretti, A.; Prati, C.; Rocca, F. Nonlinear subsidence rate estimation using permanent scatterers in differential SAR interferometry. IEEE Trans. Geosci. Remote Sens. 2000, 38, 2202–2212. [Google Scholar] [CrossRef]
- Berardino, P.; Fornaro, G.; Lanari, R. A new algorithm for surface deformation monitoring based on small baseline differential SAR interferograms. IEEE Trans. Geosci. Remote Sens. 2003, 40, 2375–2383. [Google Scholar] [CrossRef]
- Werner, C.; Wegmuller, U.; Strozzi, T. Interferometric point target analysis for deformation mapping. In Proceedings of the Geoscience Remote Sensing Symposium, Toulouse, France, 21–25 July 2003; pp. 4362–4364. [Google Scholar]
- Blanco-Sánchez, P.; Mallorquí, J.J.; Duque, S. The Coherent Pixels Technique (CPT): An advanced DInSAR technique for nonlinear deformation monitoring. Pure Appl. Geophys. 2008, 165, 1167–1193. [Google Scholar] [CrossRef]
- Zhang, L.; Ding, X.; Lu, Z. Ground settlement monitoring based on temporarily coherent points between two SAR acquisitions. ISPRS J. Photogramm. Remote Sens. 2011, 66, 146–152. [Google Scholar] [CrossRef]
- Zhang, L.; Ding, X.; Lu, Z. Modeling PSInSAR time series without phase unwrapping. IEEE Trans. Geosci. Remote Sens. 2011, 49, 547–556. [Google Scholar] [CrossRef]
- Zhang, L.; Ding, X.; Lu, Z. Deformation Rate Estimation on Changing Landscapes Using Temporarily Coherent Point INSAR. Fringe 2012, 697, 426–428. [Google Scholar]
- Zhang, L.; Lu, Z.; Ding, X.; Jung, H.S.; Feng, G.; Lee, C.W. Mapping ground surface deformation using temporarily coherent point SAR interferometry: Application to Los Angeles basin. Remote Sens. Environ. 2012, 117, 429–439. [Google Scholar] [CrossRef]
- Guéguen, Y.; Deffontaines, B.; Fruneau, B. Monitoring residual mining subsidence of Nord/Pas-de-Calais coal basin from differential and Persistent Scatterer Interferometry (Northern France). J. Appl. Geophys. 2009, 69, 24–34. [Google Scholar] [CrossRef]
- Samsonov, S.; D’Oreye, N.; Smets, B. Ground deformation associated with post-mining activity at the French–German border revealed by novel InSAR time series method. Int. J. Appl. Earth Obs. Geoinf. 2013, 23, 142–154. [Google Scholar] [CrossRef]
- Pinto, C.; Paradella, W. Applying persistent scatterer interferometry for surface displacement mapping in the Azul open pit manganese mine (Amazon region) with TerraSAR-X StripMap data. J. Appl. Remote Sens. 2015, 9, 095978. [Google Scholar] [CrossRef] [Green Version]
- Herrera, G.; Tomás, R.; Lopez-Sanchez, J. Advanced DInSAR analysis on mining areas: La Union case study (Murcia, SE Spain). Eng. Geol. 2007, 90, 148–159. [Google Scholar] [CrossRef] [Green Version]
- Fan, H.; Xu, Q.; Hu, Z.; Du, S. Using temporarily coherent point interferometric synthetic aperture radar for land subsidence monitoring in a mining region of western China. J. Appl. Remote Sens. 2017, 11, 026003. [Google Scholar] [CrossRef]
- Ministry of Coal Industry. The Regulation of the Long Term Observation of Surface Water, Groundwater and Sampling of Water Resources for Geological Exploration of Coal Resources; China Coal Industry Publishing House: Beijing, China, 1981. (In Chinese) [Google Scholar]
- Strassberg, G.; Scanlon, B.; Rodell, M. Comparison of seasonal terrestrial water storage variations from GRACE with groundwater-level measurements from the High Plains Aquifer (USA). Geophys. Res. Lett. 2007, 34. [Google Scholar] [CrossRef] [Green Version]
- Luo, Z.; Li, Q.; Zhong, P. Water storage variations in Heihe river recovered from GRACE temporal gravity field. Acta Geod. Cartogr. Sin. 2012, 41, 676–681. [Google Scholar]
- Xie, X.W.; Xu, C.J.; Gong, Z.; Li, W. Groundwater storage changes in Shan-Gan-Jin plateau derived from GRACE. Bull. Surv. Mapp. 2018, 1, 133–137. [Google Scholar]
- Scanlon, B.; Zhang, Z.; Reedy, R. Hydrologic implications of GRACE satellite data in the Colorado River Basin. Water Resour. Res. 2015, 51, 9891–9903. [Google Scholar] [CrossRef]
- Castellazzi, P.; Martel, R.; Rivera, A. Groundwater depletion in Central Mexico: Use of GRACE and InSAR to support water resources management. Water Resour. Res. 2016, 52, 5985–6003. [Google Scholar] [CrossRef]
- Du, Z.; Ge, L.; Ng, H.M. Time series interferometry integrated with groundwater depletion measurement from GRACE. In Proceedings of the IEEE Geoscience Remote Sensing Symposium, Beijing, China, 10–15 July 2016; pp. 1166–1169. [Google Scholar]
- Guo, J.; Lv, Z.; Yao, C. Surface subsidence analysis by multi-temporal InSAR and GRACE: A case study in Beijing. Sensors 2016, 16, 1495. [Google Scholar] [CrossRef] [PubMed]
- Longuevergne, L.; Wilson, C.R.; Scanlon, B. GRACE water storage estimates for the Middle East and other regions with significant reservoir and lake storage. Hydrol. Earth Syst. Sci. Discuss. 2012, 17, 4817–4830. [Google Scholar] [CrossRef] [Green Version]
- Tourian, M.J.; Elmi, O.; Chen, Q. A space-borne multi-sensor approach to monitor the desiccation of Lake Urmia in Iran. Remote Sens. Environ. 2015, 156, 349–360. [Google Scholar] [CrossRef]
- Save, H.; Bettadpur, S.; Tapley, B.D. High-resolution CSR GRACE RL05 mascons. J. Geophys. Res. Solid Earth 2016, 121, 7547–7569. [Google Scholar] [CrossRef]
- Zhang, L. Temporarily Coherent Point SAR Interferometry. Ph.D. Thesis, The Hong Kong Polytechnic University, Hong Kong, China, 2011. [Google Scholar]
- Farr, T.; Rosen, P.; Caro, E.; Crippen, R.; Duren, R.; Hensley, S. The Shuttle Radar Topography Mission. Rev. Geophys. 1998, 45, 361. [Google Scholar] [CrossRef]
- Xuzhou Government. The Planning of New Urbanization and Rural-Urban Development Integration in Xuzhou (2015–2020); Xuzhou Government: Xuzhou, China, 2016. (In Chinese)
- Case Analysis of “1.11” Heavy Casualties in Dahuangshan Coal Mine of Xuzhou Mining Group. Coal Mine Safety Net. 2015. Available online: http://www.mkaq.org/html/2015/07/15/311601.shtml (accessed on 16 July 2018). (In Chinese).
- Budhu, M.; Adiyaman, I. Mechanics of land subsidence due to groundwater pumping. Int. J. Numer. Anal. Methods Géoméch. 2010, 34, 1459–1478. [Google Scholar] [CrossRef]
- Xu, H.; Wan, W. Comprehensive water control technology in Jiawang mining area of Xuzhou coalfield. Coal Sci. Technol. Mag. 2006, 2, 27–28. (In Chinese) [Google Scholar]
- Liu, H.; Pei, D. Optimization and implementation of the drainage system in the Quantai coal mine. Coal Sci. Technol. Mag. 2016, 4, 127–130. (In Chinese) [Google Scholar]
- Qian, B.; Feng, Q.; Li, T. Comprehensive evaluation of underground water quality of JiaWang abandoned mining area based on gray clustering method. Water Sav. Irrig. 2014, 6, 50–53. [Google Scholar]
- Pei, D.; Chen, Z. Comprehensive treatment and long term prevention of “2.6” water inrush disaster in Qishan Coal Mine. Coal Sci. Technol. Mag. 2013, 4, 128–130. (In Chinese) [Google Scholar]
- Gao, B. Groundwater Chemical Characteristics of JiaWang Coal Field in Response to Mine Closure. Ph.D. Thesis, China University of Mining and Technology, Xuzhou, China, 2014. (In Chinese). [Google Scholar]
- Wang, Z.; Chao, F.; Jiang, W. Combination GRACE and TRMM estimate of water storage capacity and flood potential in Afghanistan. Geomat. Inf. Sci. Wuhan Univ. 2016, 41, 58–65. (In Chinese) [Google Scholar]
- Cuenca, M.C.; Hooper, A.J.; Hanssen, R.F. Surface deformation induced by water influx in the abandoned coal mines in Limburg, The Netherlands observed by satellite radar interferometry. J. Appl. Geophys. 2013, 88, 1–11. [Google Scholar] [CrossRef]
Figure 1.
Overview of the research area. (a) Geographical location of the research area. The red, blue, green, purple, and orange rectangular boxes are, respectively, the coverage range of the Sentinel-1A data, the ENVISAT (track: 361, frame: 2925 and track: 404, frame: 2907) data, the GLDAS data and the GRACE data; (b) mining area distribution map. The base map in Figure 1b is the Landsat8 optical image.

Figure 2.
Spatiotemporal baseline map of interferometric pairs of three image sets. The red dot denotes the master images, the green square denotes the slave images. (a) Interferometric pairs of ENVISAT data (track: 361, frame: 2925); (b) interferometric pairs of ENVISAT data (track: 404, frame: 2907); (c) interferometric pairs of Sentinel-1A.

Figure 3.
The LOS deformation from June 2006 to February 2008. (a) The LOS annual average deformation rate. The red-black circles show the locations of the main wells in the mining area. The black circles show the location of the pixels whose time-series are showed in (b), and the base map is the intensity image of ENVISAT obtained on 16 March 2010. (b) The LOS time-series deformation.

Figure 4.
The LOS deformation from December 2009 to October 2010. (a) The LOS annual average deformation rate. The red-black circles are the locations of the main wells in the mining area. The black circles show the location of the pixels whose time-series are showed in (b), and the base map is the intensity image of ENVISAT obtained on 16 March 2010. (b) The LOS time-series deformation.

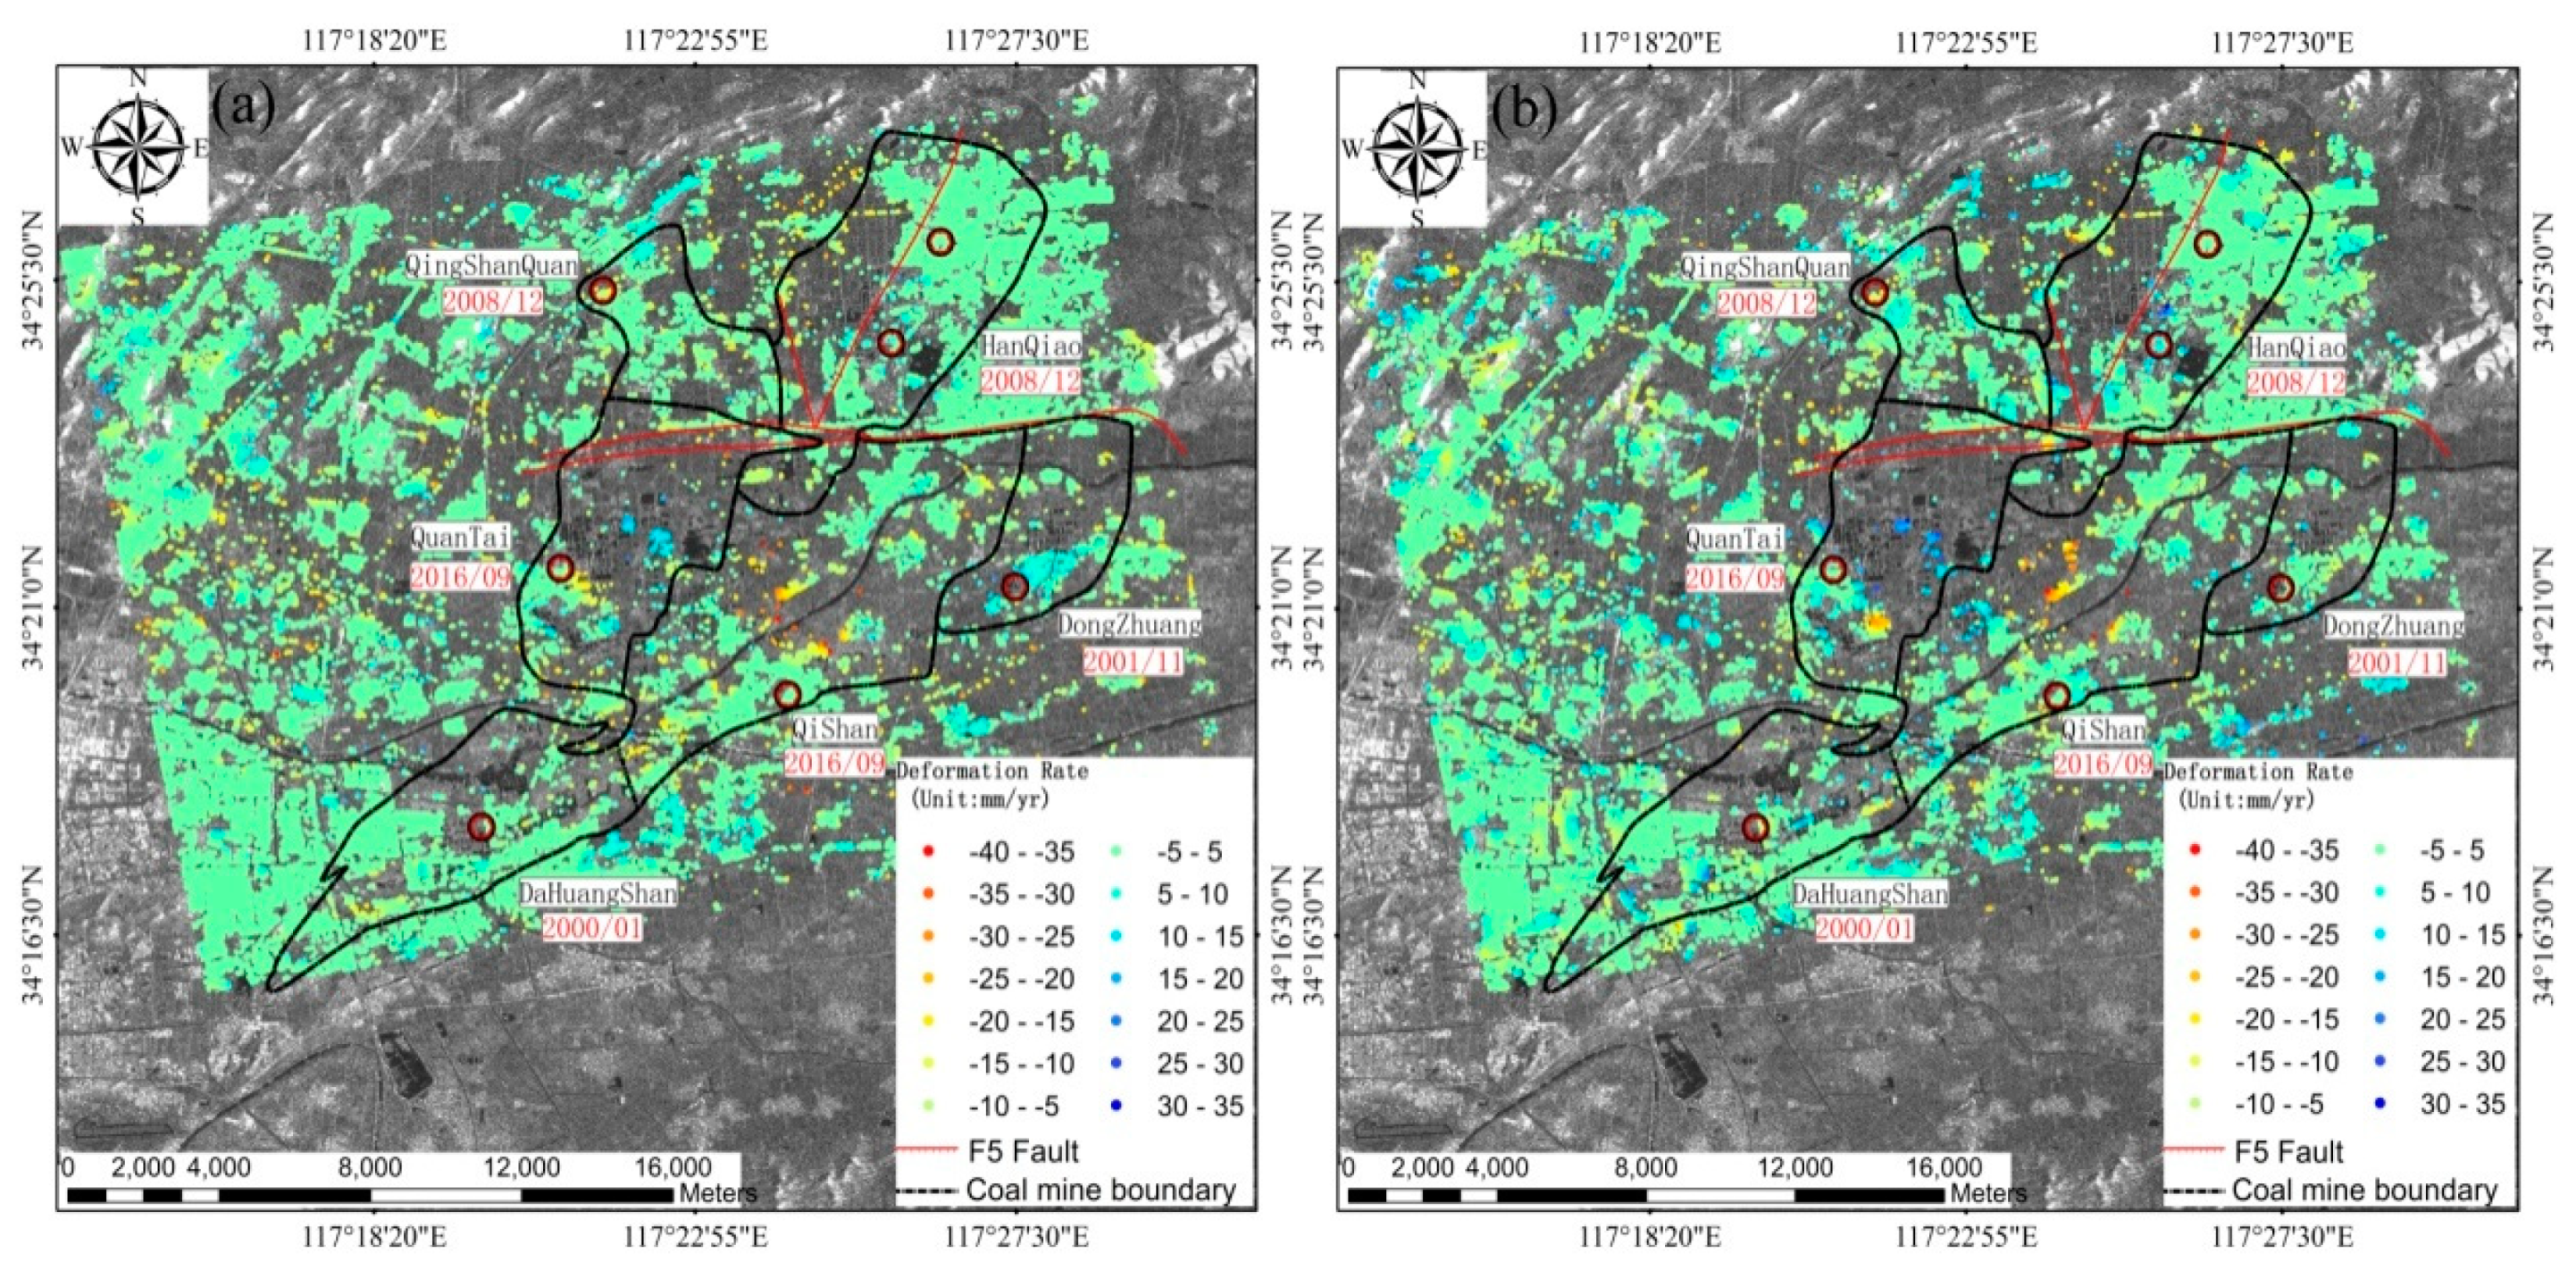
Figure 5.
The LOS deformation from October 2016 to January 2018. (a) The LOS annual average deformation rate. The red-black circles show the locations of the main wells in the mining area. The black circles show the location of the pixels whose time-series are showed in (b), and the base map is the intensity image of ENVISAT obtained on 16 March 2010. (b) The LOS time-series deformation.

Figure 6.
(a) Spatial pattern of the groundwater storage change trend obtained by GRACE and GLDAS. The black line represents the abandoned coal mine. (b) Time series variation in the groundwater storage of the research area.
Figure 6.
(a) Spatial pattern of the groundwater storage change trend obtained by GRACE and GLDAS. The black line represents the abandoned coal mine. (b) Time series variation in the groundwater storage of the research area.

Figure 7.
Validation of GRACE results.

Figure 8.
Variation in groundwater storage from January 2005 to February 2008.

Figure 9.
Variation in groundwater storage from December 2008 to October 2010.

Figure 10.
Variation in groundwater storage from December 2015 to June 2017.

Figure 11.
(a) The LOS annual average deformation rate from October 2016 to June 2017; and (b) the LOS annual average deformation rate from June 2017 to January 2018. The red-black circles show the locations of the main wells in the mining area, and the base map is the intensity image of ENVISAT obtained on March 16, 2010.


Table 1.
Imaging parameters of SAR images.
| Incidence Angle | Resolution (Azimuth × Range) | Repeat Cycle | Wavelength/Band | Polarization Mode | Number of Images | |
|---|---|---|---|---|---|---|
| ENVISAT(Track:361) | 33.7° | 3.93 m × 7.80 m | 35 days | 0.056 m/C | VV | 13 |
| ENVISAT(Track:404) | 22.8° | 4.05 m × 7.80 m | 35 days | 0.056 m/C | VV | 10 |
| Sentinel-1A | 39.2° | 13.94 m × 2.33 m | 12 days | 0.056 m/C | VH | 32 |
Table 2.
Statistical information of deformation in the study area.
| InSAR Monitoring Time | NCP | ADR (mm/year) | SD (mm/year) | NCP-OBMA | ADR-OBMA (mm/year) | SD-OBMA (mm/year) |
|---|---|---|---|---|---|---|
| 2006/06–2008/02 | 14,555 | 0.0 | 2.5 | 11,378 | 0.0 | 2.0 |
| 2009/12–2010/10 | 59,568 | 0.1 | 4.8 | 44,123 | 0.2 | 4.2 |
| 2016/10–2018/01 | 135,920 | 0.0 | 3.5 | 86,741 | 0.0 | 3.4 |
Table 3.
Statistical information of deformation of each mining area.
| Mining Area | Closing Time | MSR (mm/year) | MUR (mm/year) | ADR (mm/year) | SD (mm/year) | ||||||||
|---|---|---|---|---|---|---|---|---|---|---|---|---|---|
| I | II | III | I | II | III | I | II | III | I | II | III | ||
| Dahuangshan | 2000/01 | −8.1 | −20.3 | −16.8 | 10.3 | 10.5 | 15.7 | 1.6 | −0.7 | −0.4 | 2.3 | 3.3 | 2.8 |
| Dongzhuang | 2001/11 | - | −7.5 | −12.5 | - | 7.8 | 14.1 | - | 1.1 | 0.9 | - | 2.3 | 3.5 |
| Qingshanquan | 2008/12 | −6.7 | −16.7 | −17.7 | 3.5 | 20.1 | 14.4 | −1.6 | −1.6 | 0.7 | 1.8 | 4.5 | 3.5 |
| Hanqiao | 2008/12 | - | −25.0 | −18.4 | - | 24.9 | 24.1 | - | 3.5 | 0.4 | - | 6.8 | 2.6 |
| Quantai | 2016/09 | −25.6 | −21.6 | −17.9 | 8.6 | 21.2 | 21.5 | −1.2 | 0.3 | −0.1 | 4.6 | 5.3 | 5.3 |
| Qishan | 2016/09 | - | −39.5 | −39.8 | - | 14.1 | 17.9 | - | −2.5 | −1.0 | - | 6.8 | 4.9 |
Table 4.
Deformation information and groundwater storage variation rate.
| SAR Imaging Time | NCP | MSR (mm/year) | MUR (mm/year) | ADR (mm/year) | SD (mm/year) | GSVR (mm/year) | Corresponding GRACE Period |
|---|---|---|---|---|---|---|---|
| 2006/06–2008/2 | 339 | −25.6 | 10.3 | −6.2 | 7.5 | −1.0 | 2005/1–2008/2 |
| 2009/12–2010/10 | 4769 | −39.5 | 24.9 | −0.2 | 10.8 | 1.9 | 2008/12–2009/12 |
| 2016/10–2017/6 | 8856 | −39.6 | 24.6 | −2.5 | 8.9 | −6.9 | 2015/12–2016/8 |
| 2017/6–2018/1 | 12647 | −40.0 | 34.1 | 0.1 | 9.8 | 0.9 | 2016/11–2017/6 |
© 2018 by the authors. Licensee MDPI, Basel, Switzerland. This article is an open access article distributed under the terms and conditions of the Creative Commons Attribution (CC BY) license (http://creativecommons.org/licenses/by/4.0/).
Share and Cite
MDPI and ACS Style
Zheng, M.; Deng, K.; Fan, H.; Du, S. Monitoring and Analysis of Surface Deformation in Mining Area Based on InSAR and GRACE. Remote Sens. 2018, 10, 1392. https://0-doi-org.brum.beds.ac.uk/10.3390/rs10091392
AMA Style
Zheng M, Deng K, Fan H, Du S. Monitoring and Analysis of Surface Deformation in Mining Area Based on InSAR and GRACE. Remote Sensing. 2018; 10(9):1392. https://0-doi-org.brum.beds.ac.uk/10.3390/rs10091392
Chicago/Turabian StyleZheng, Meinan, Kazhong Deng, Hongdong Fan, and Sen Du. 2018. "Monitoring and Analysis of Surface Deformation in Mining Area Based on InSAR and GRACE" Remote Sensing 10, no. 9: 1392. https://0-doi-org.brum.beds.ac.uk/10.3390/rs10091392
Note that from the first issue of 2016, this journal uses article numbers instead of page numbers. See further details here.