The Reliability of Global Remote Sensing Evapotranspiration Products over Amazon

 , ,
, ,
Abstract
:
1. Introduction
2. Materials and Methods
2.1. Five Long-Term Global Remote Sensing ET Products Covering the Period 1982 to 2011
2.2. Eddy Covariance Data
2.3. Evapotranspiration Calculation Using Water Balance Method
2.4. Climate Drivers of ET
2.5. Vegetation Greenness Proxy
2.6. Land Cover Change
3. Results and Discussions
3.1. Validation of the Global Remote Sensing ET Products
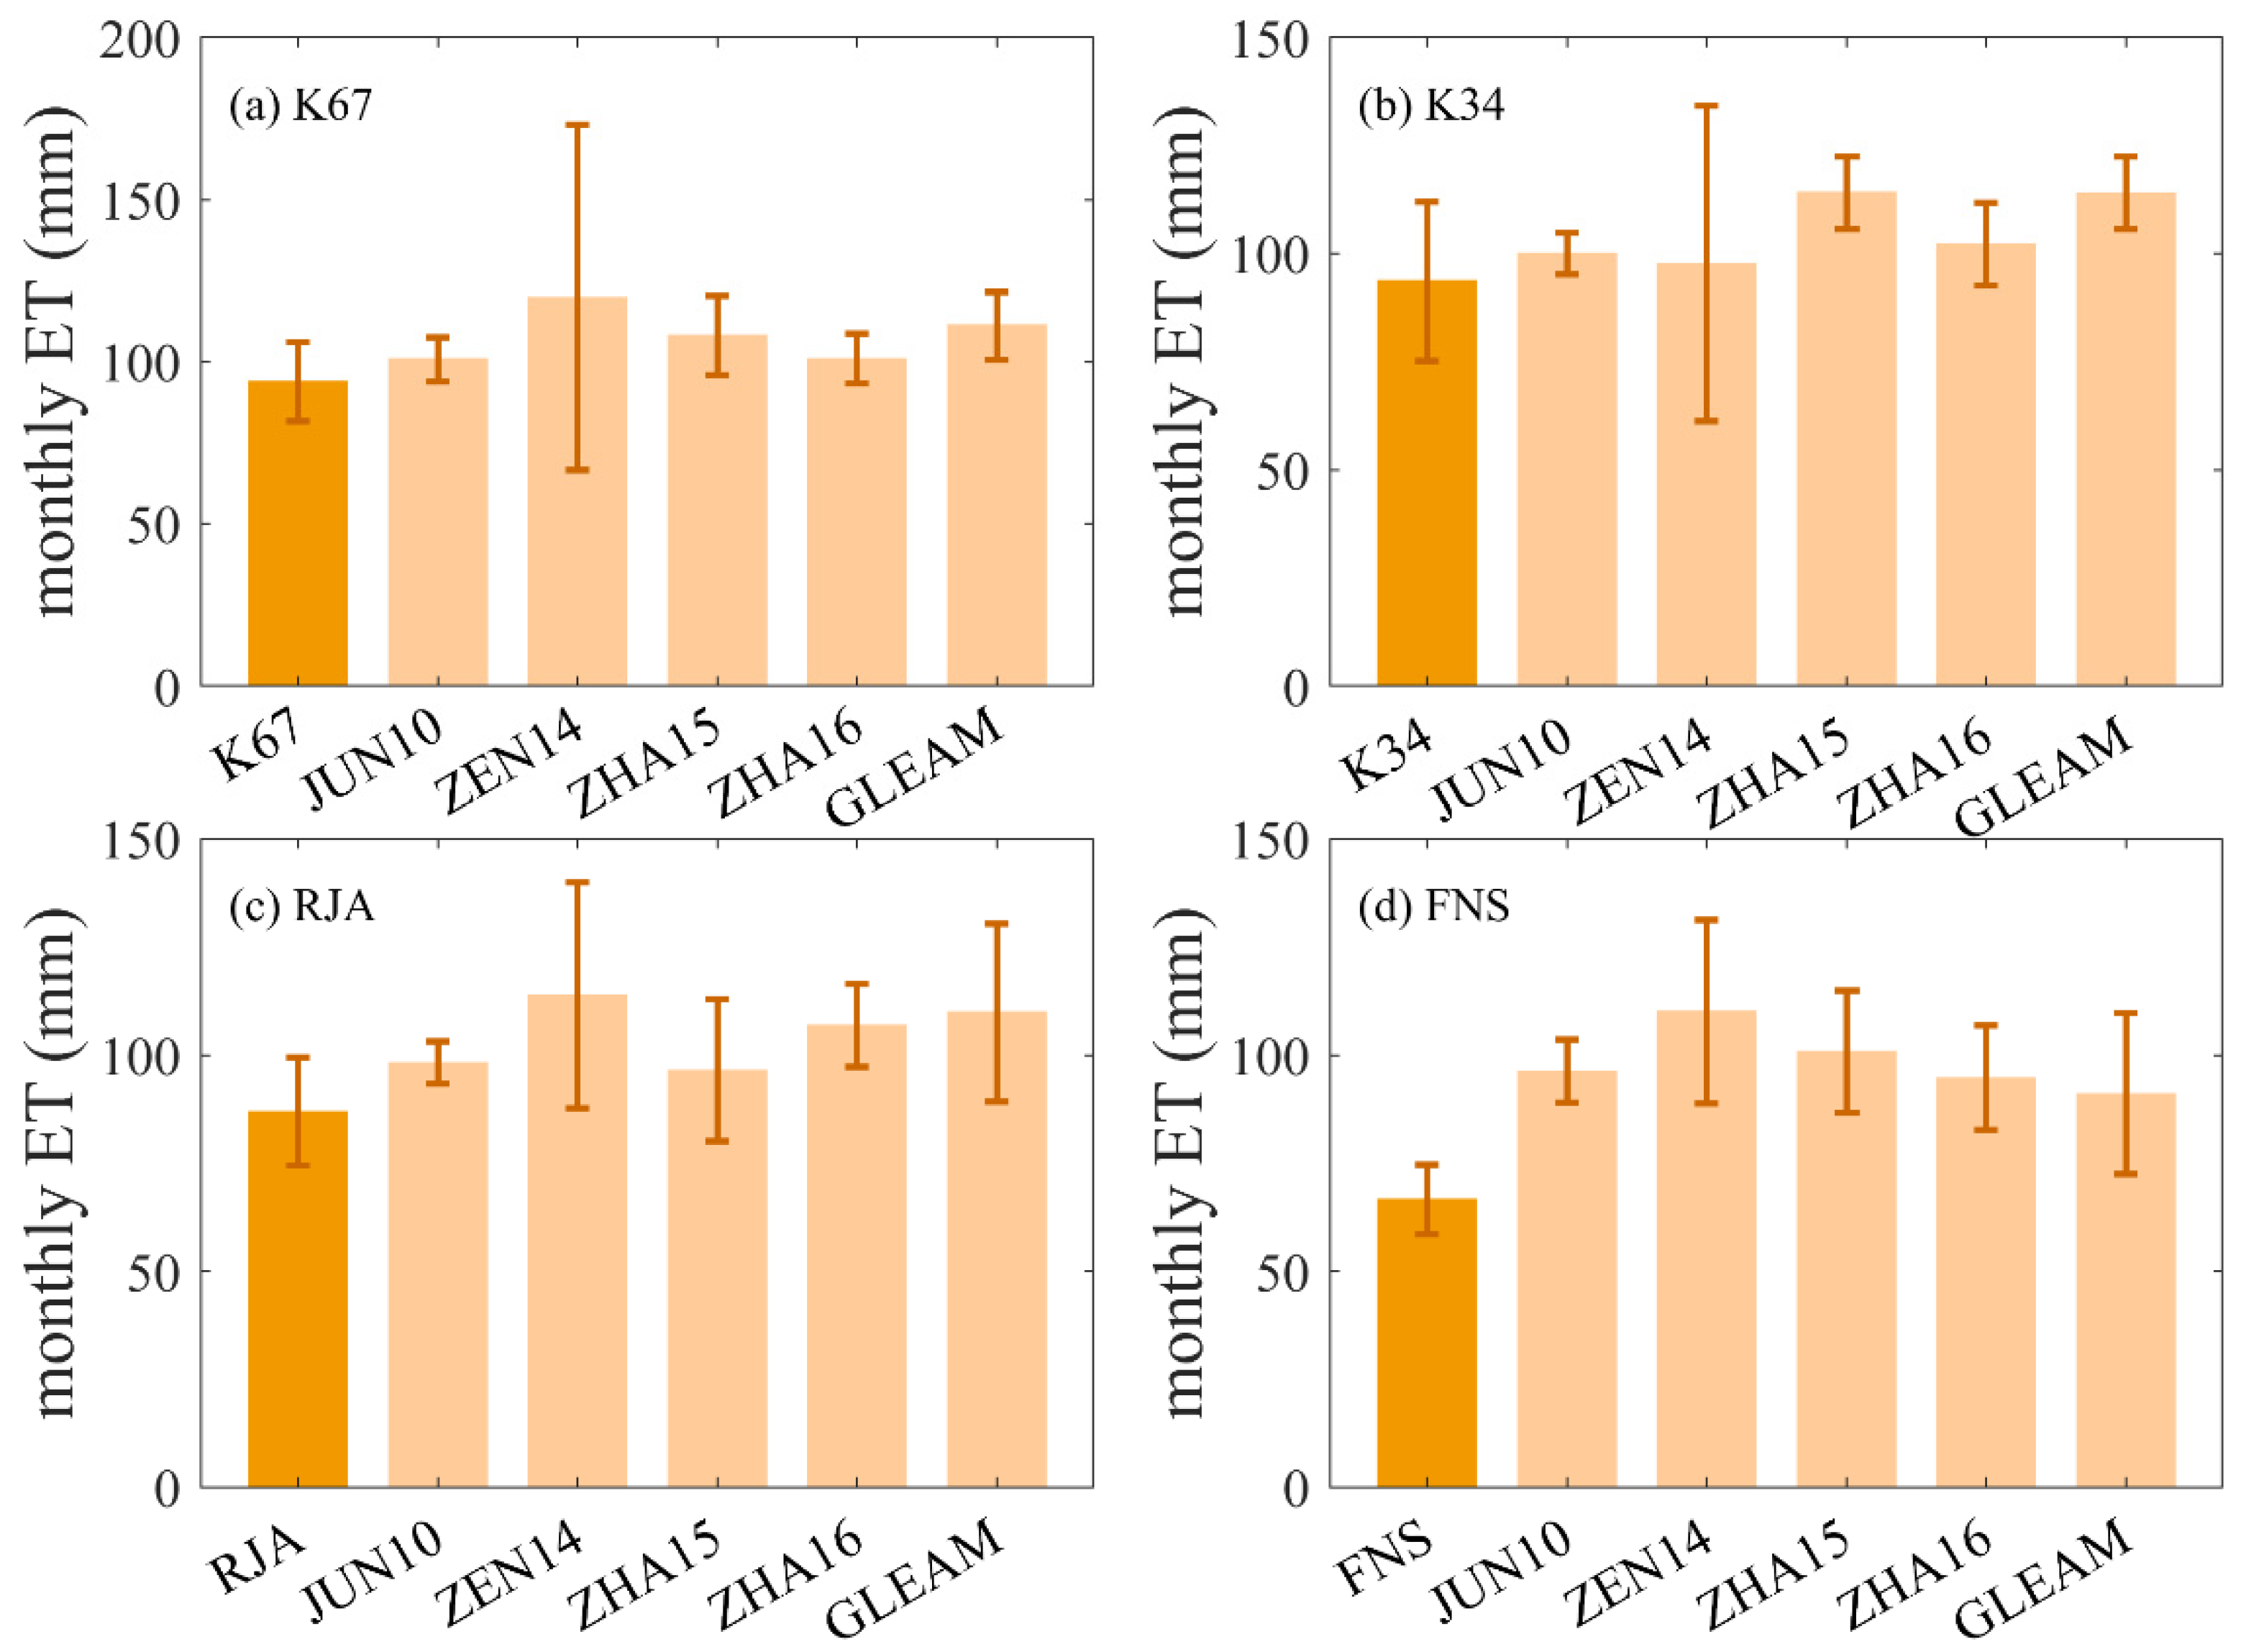
3.1.1. Validation Using Eddy Covariance Data at Site Level
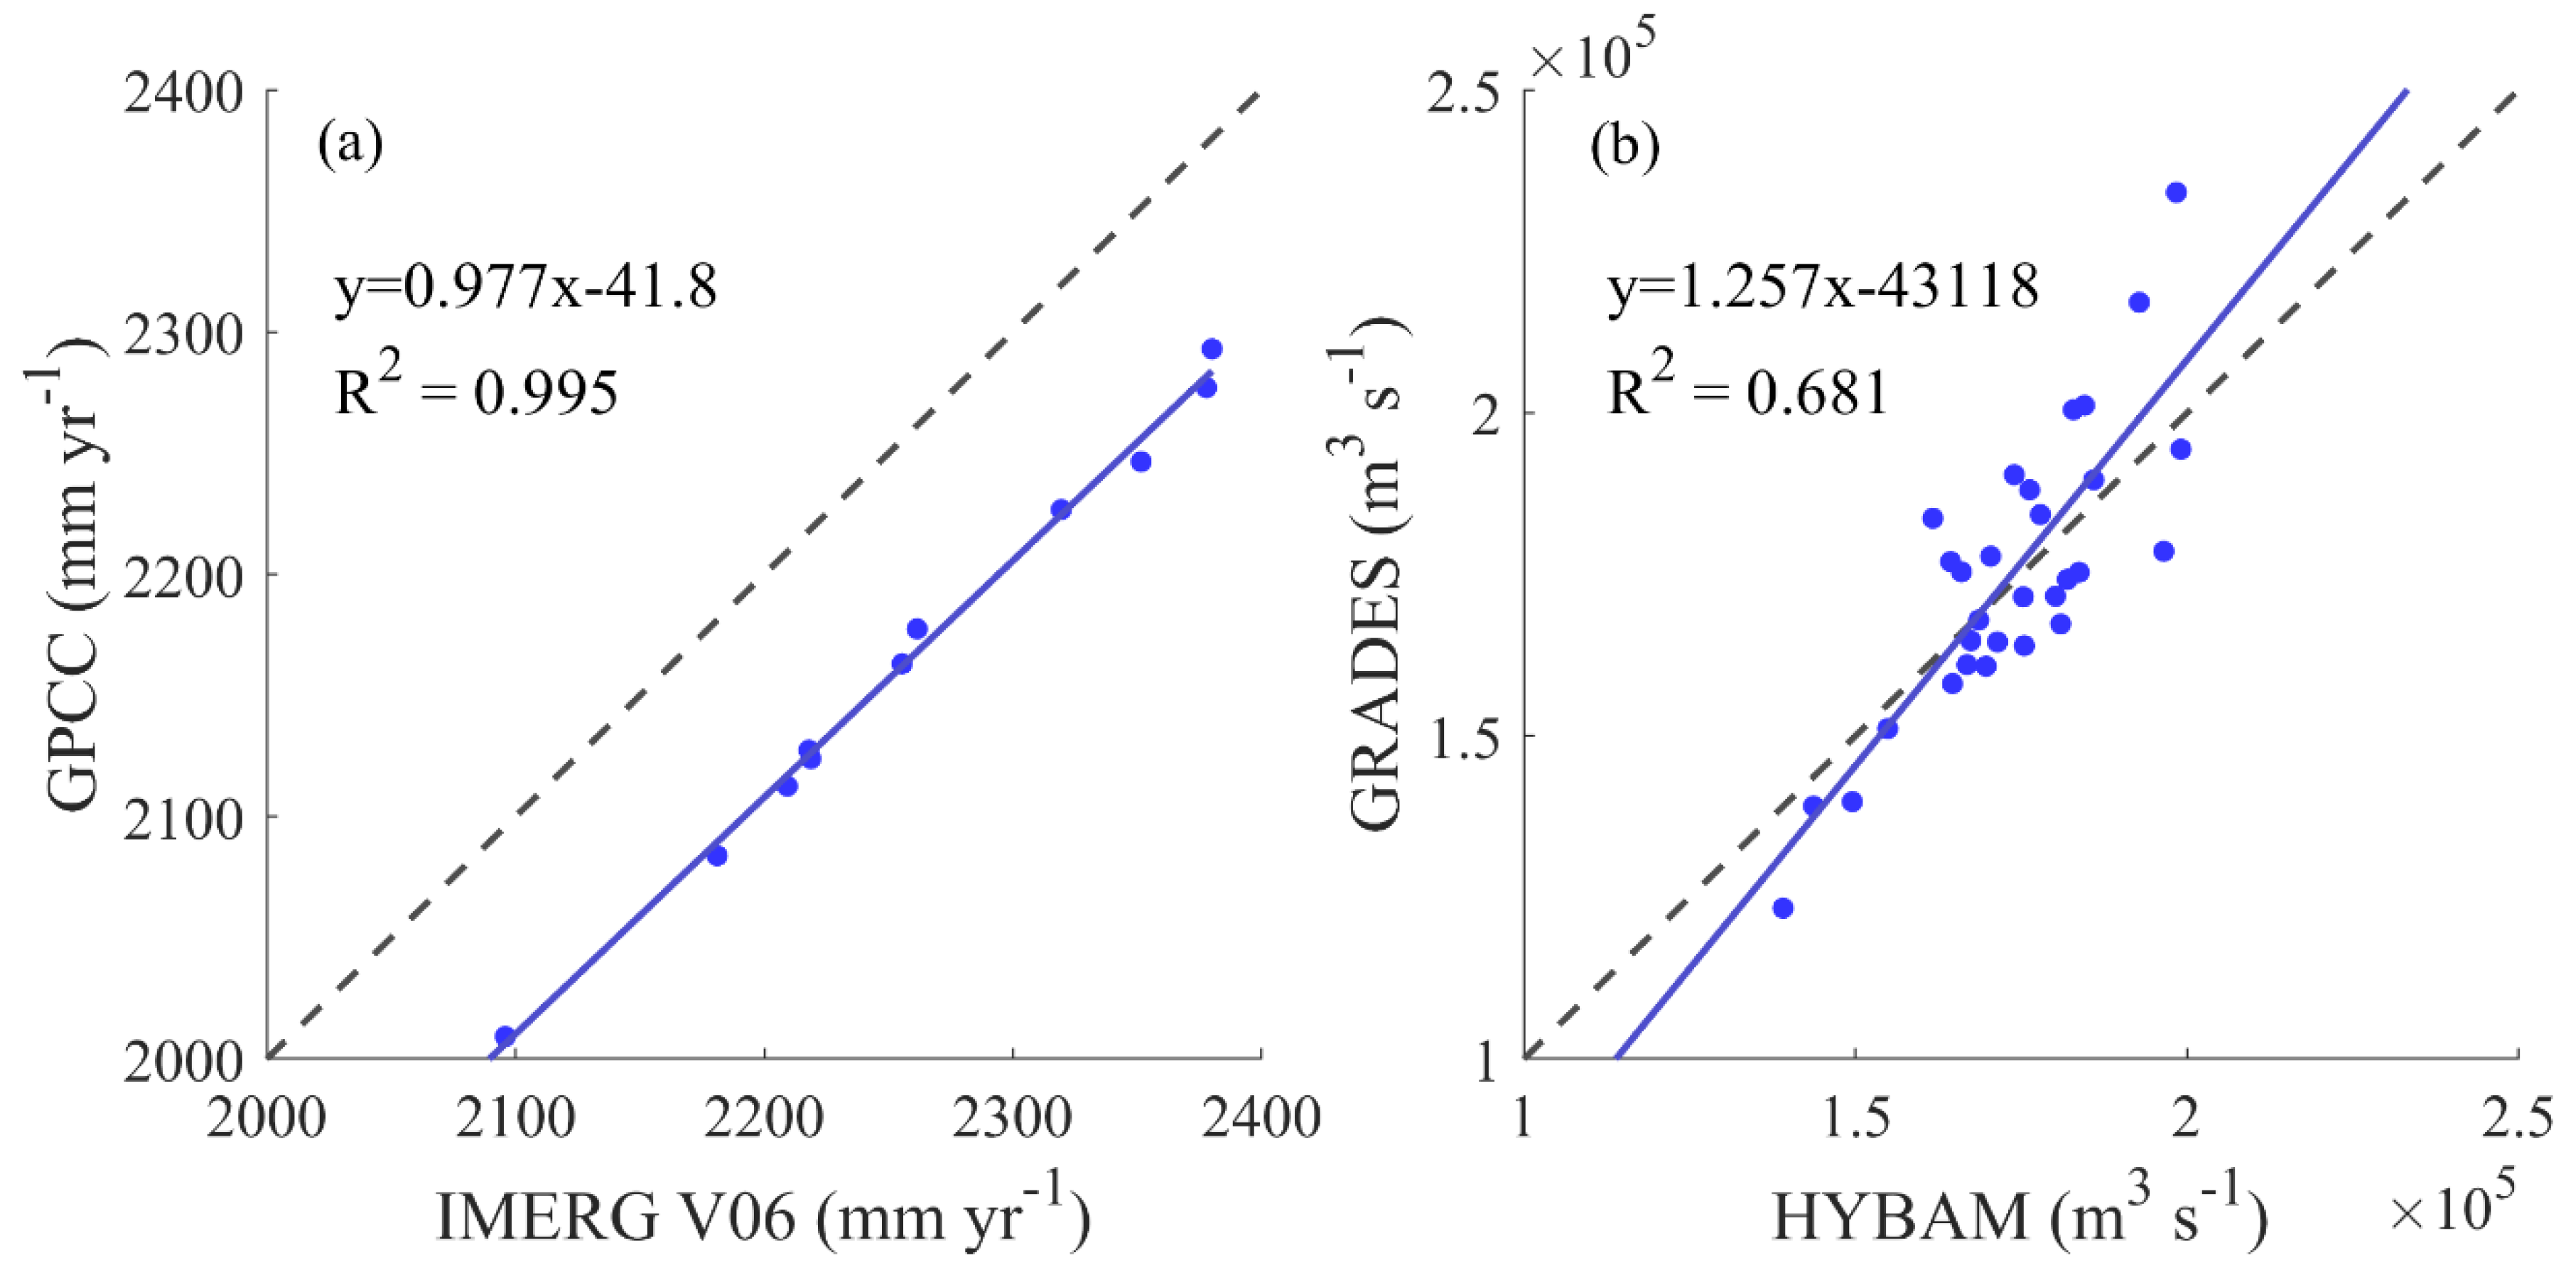
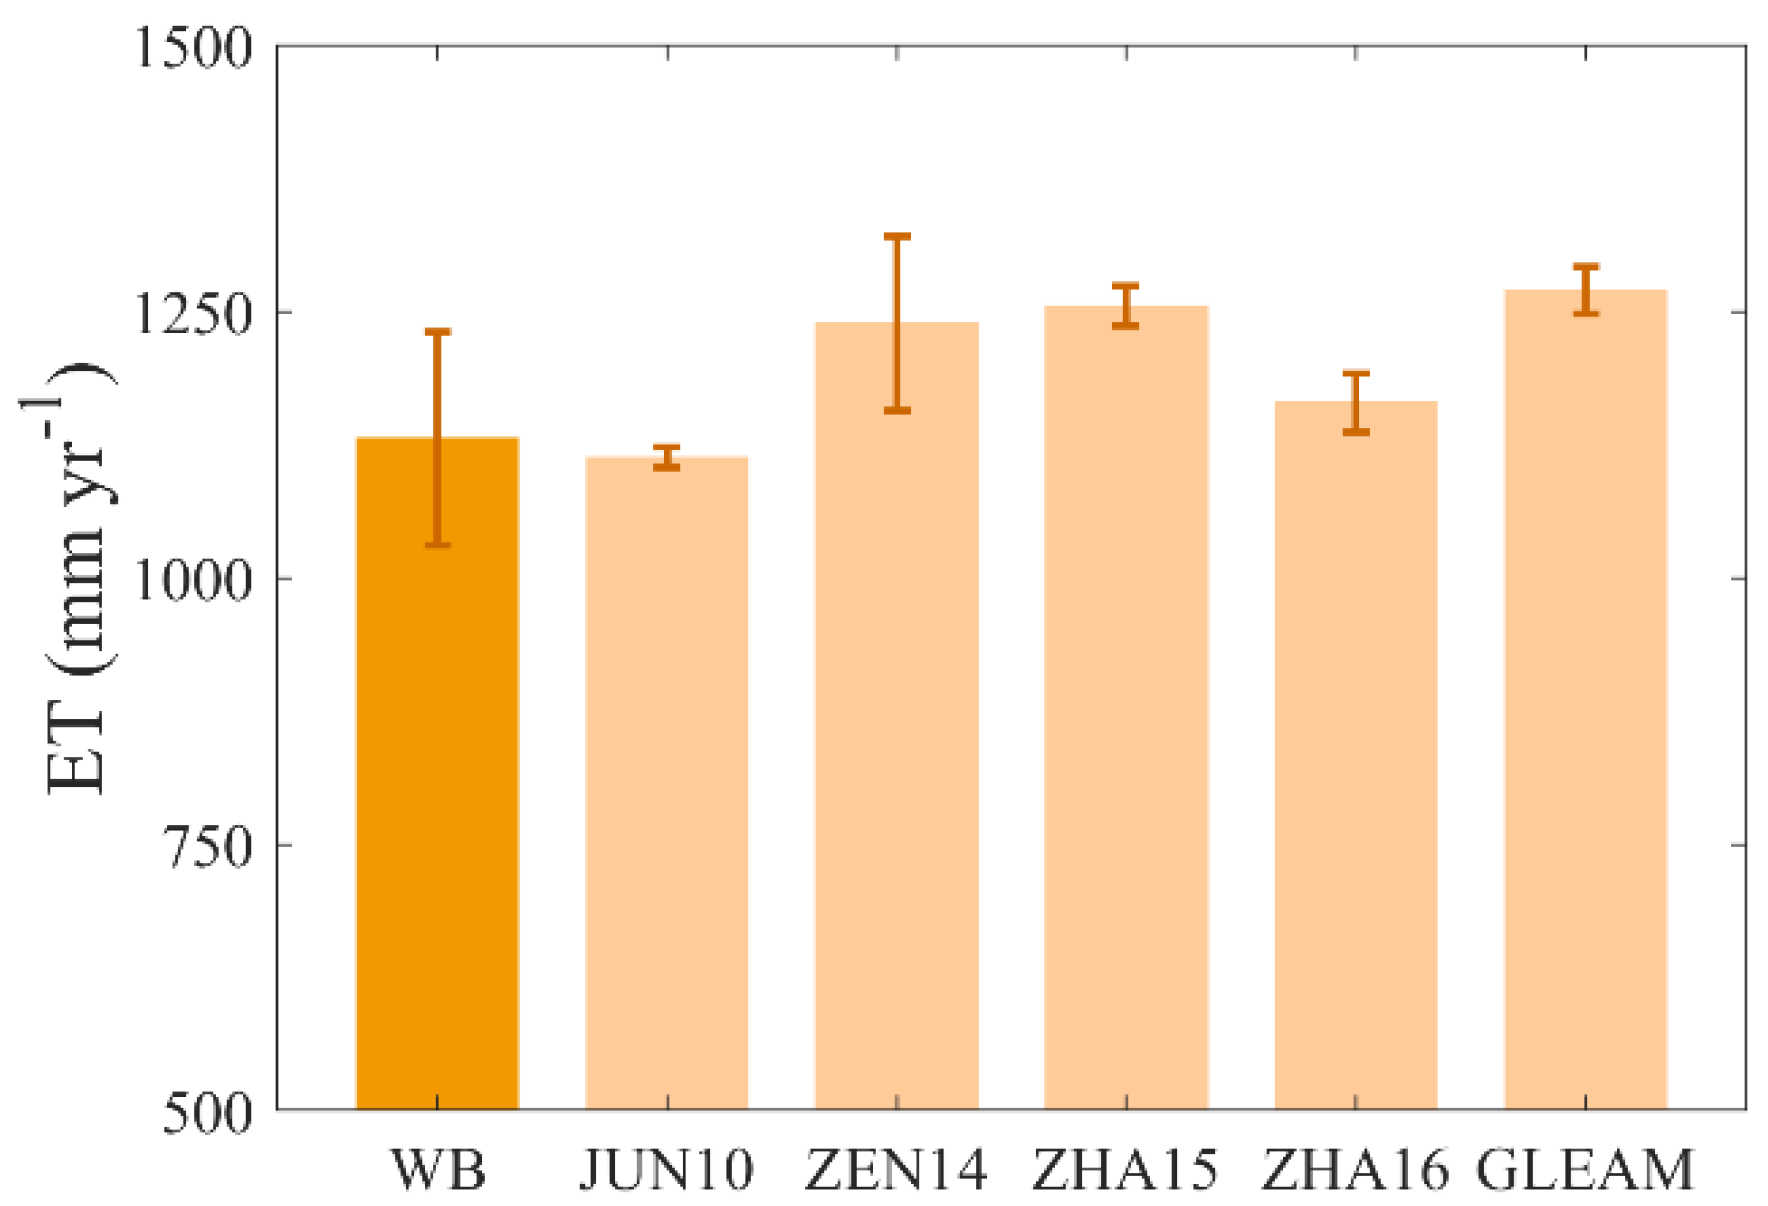
3.1.2. Validation Using Water Balance Method at Watershed Scale
3.2. Changes of ET for 1982–2011 from the Global Remote Sensing ET Products
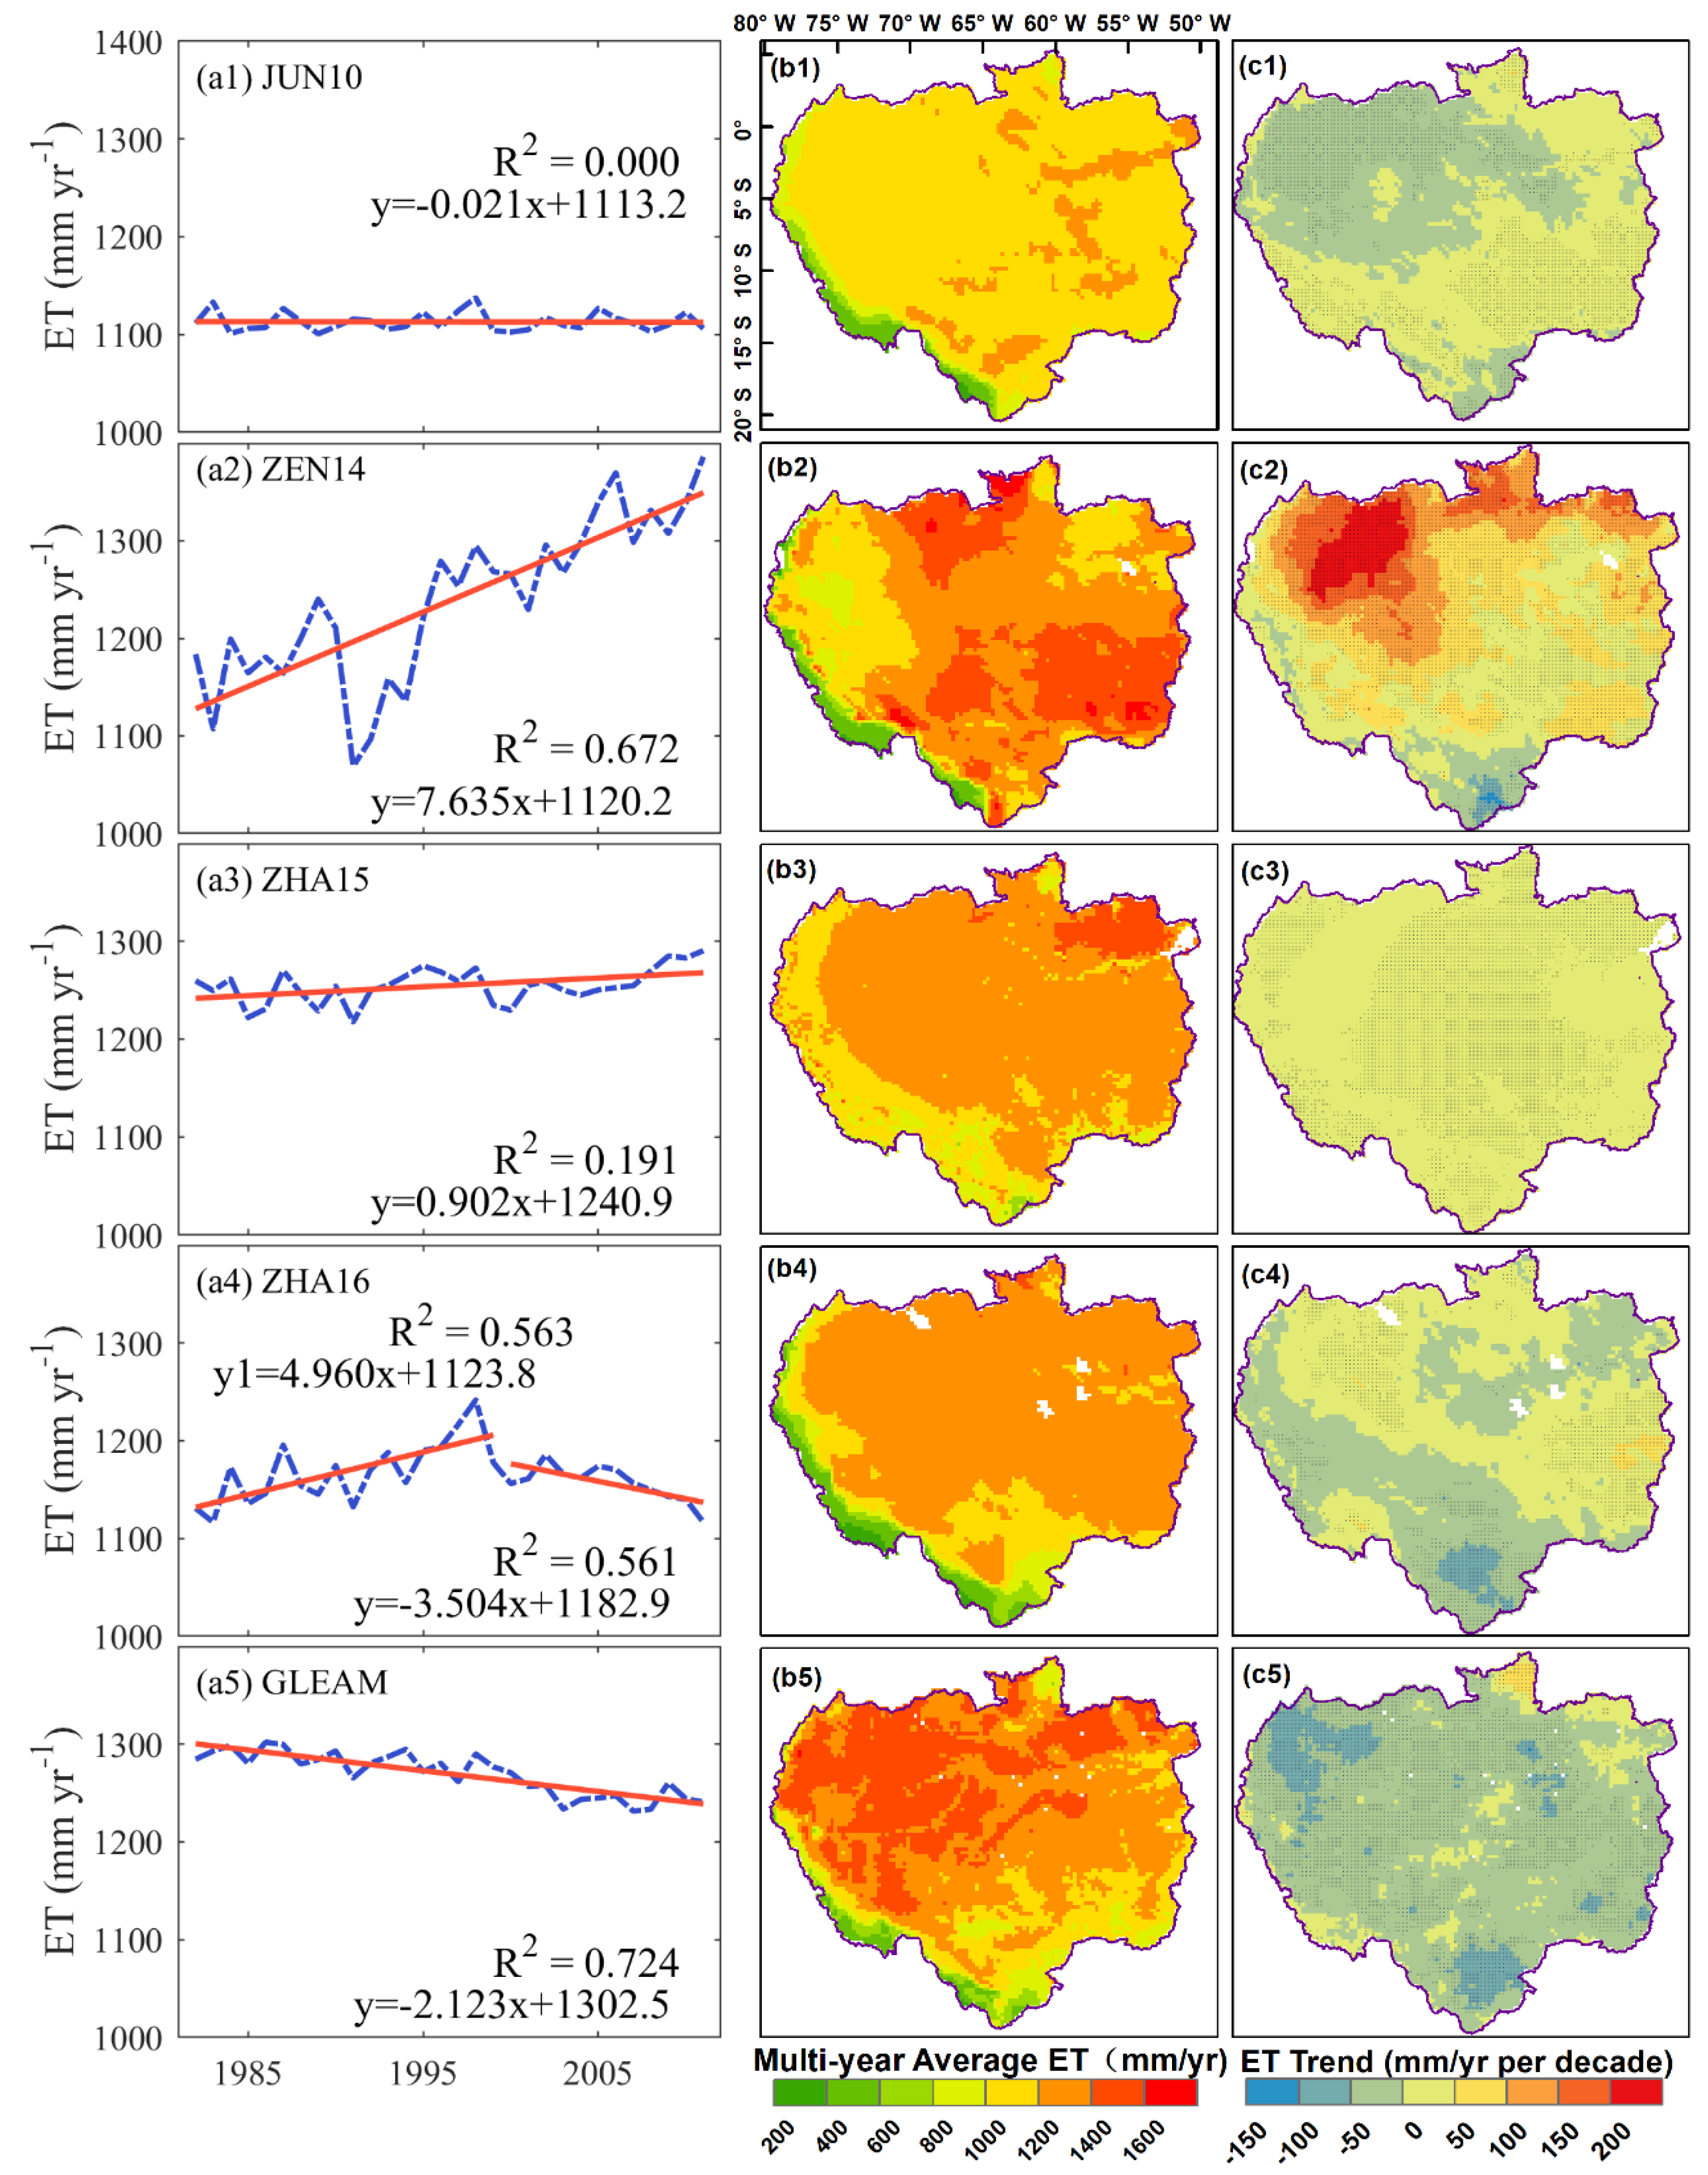
3.2.1. Inconsistent Estimates of the Trend of ET
3.2.2. Spatial Pattern of ET
3.2.3. Spatial Pattern of ET Trend
3.3. H1: Brightening Leads to Higher ET—Not Evident across Different Products
3.4. H2: Warming Results in the Increase in ET—Evident in All Five Products
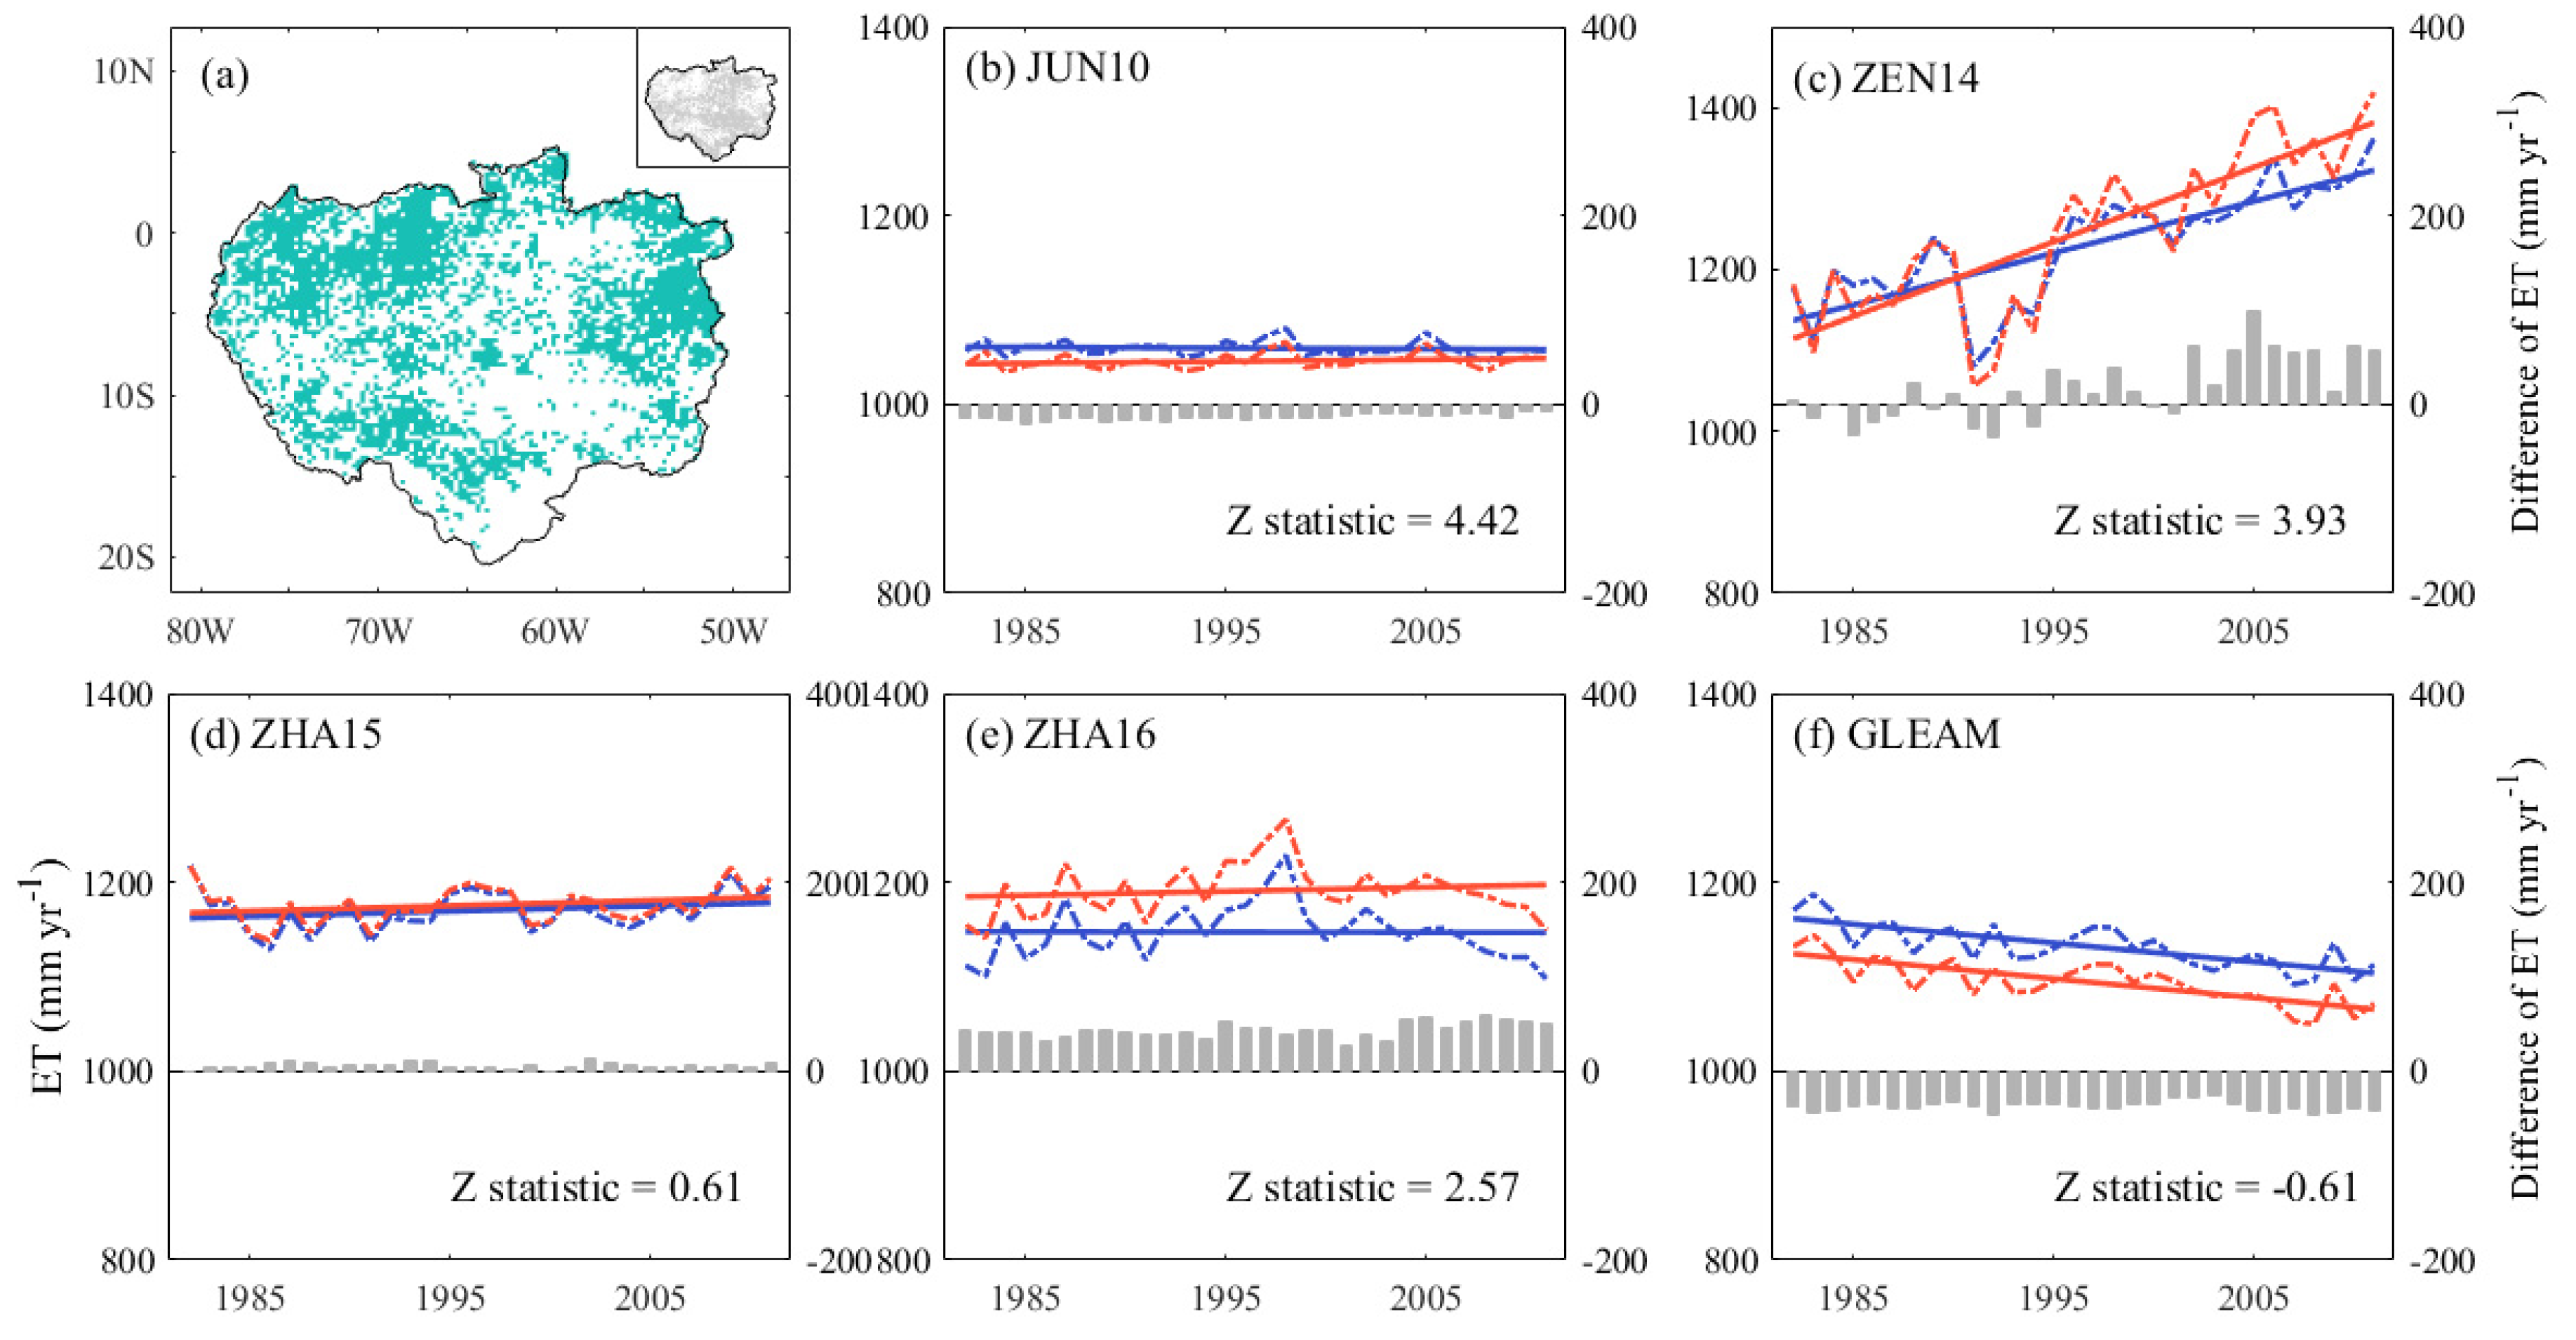
3.5. H3: Vegetation Greening Promotes Increase in ET—Evident in Two Products
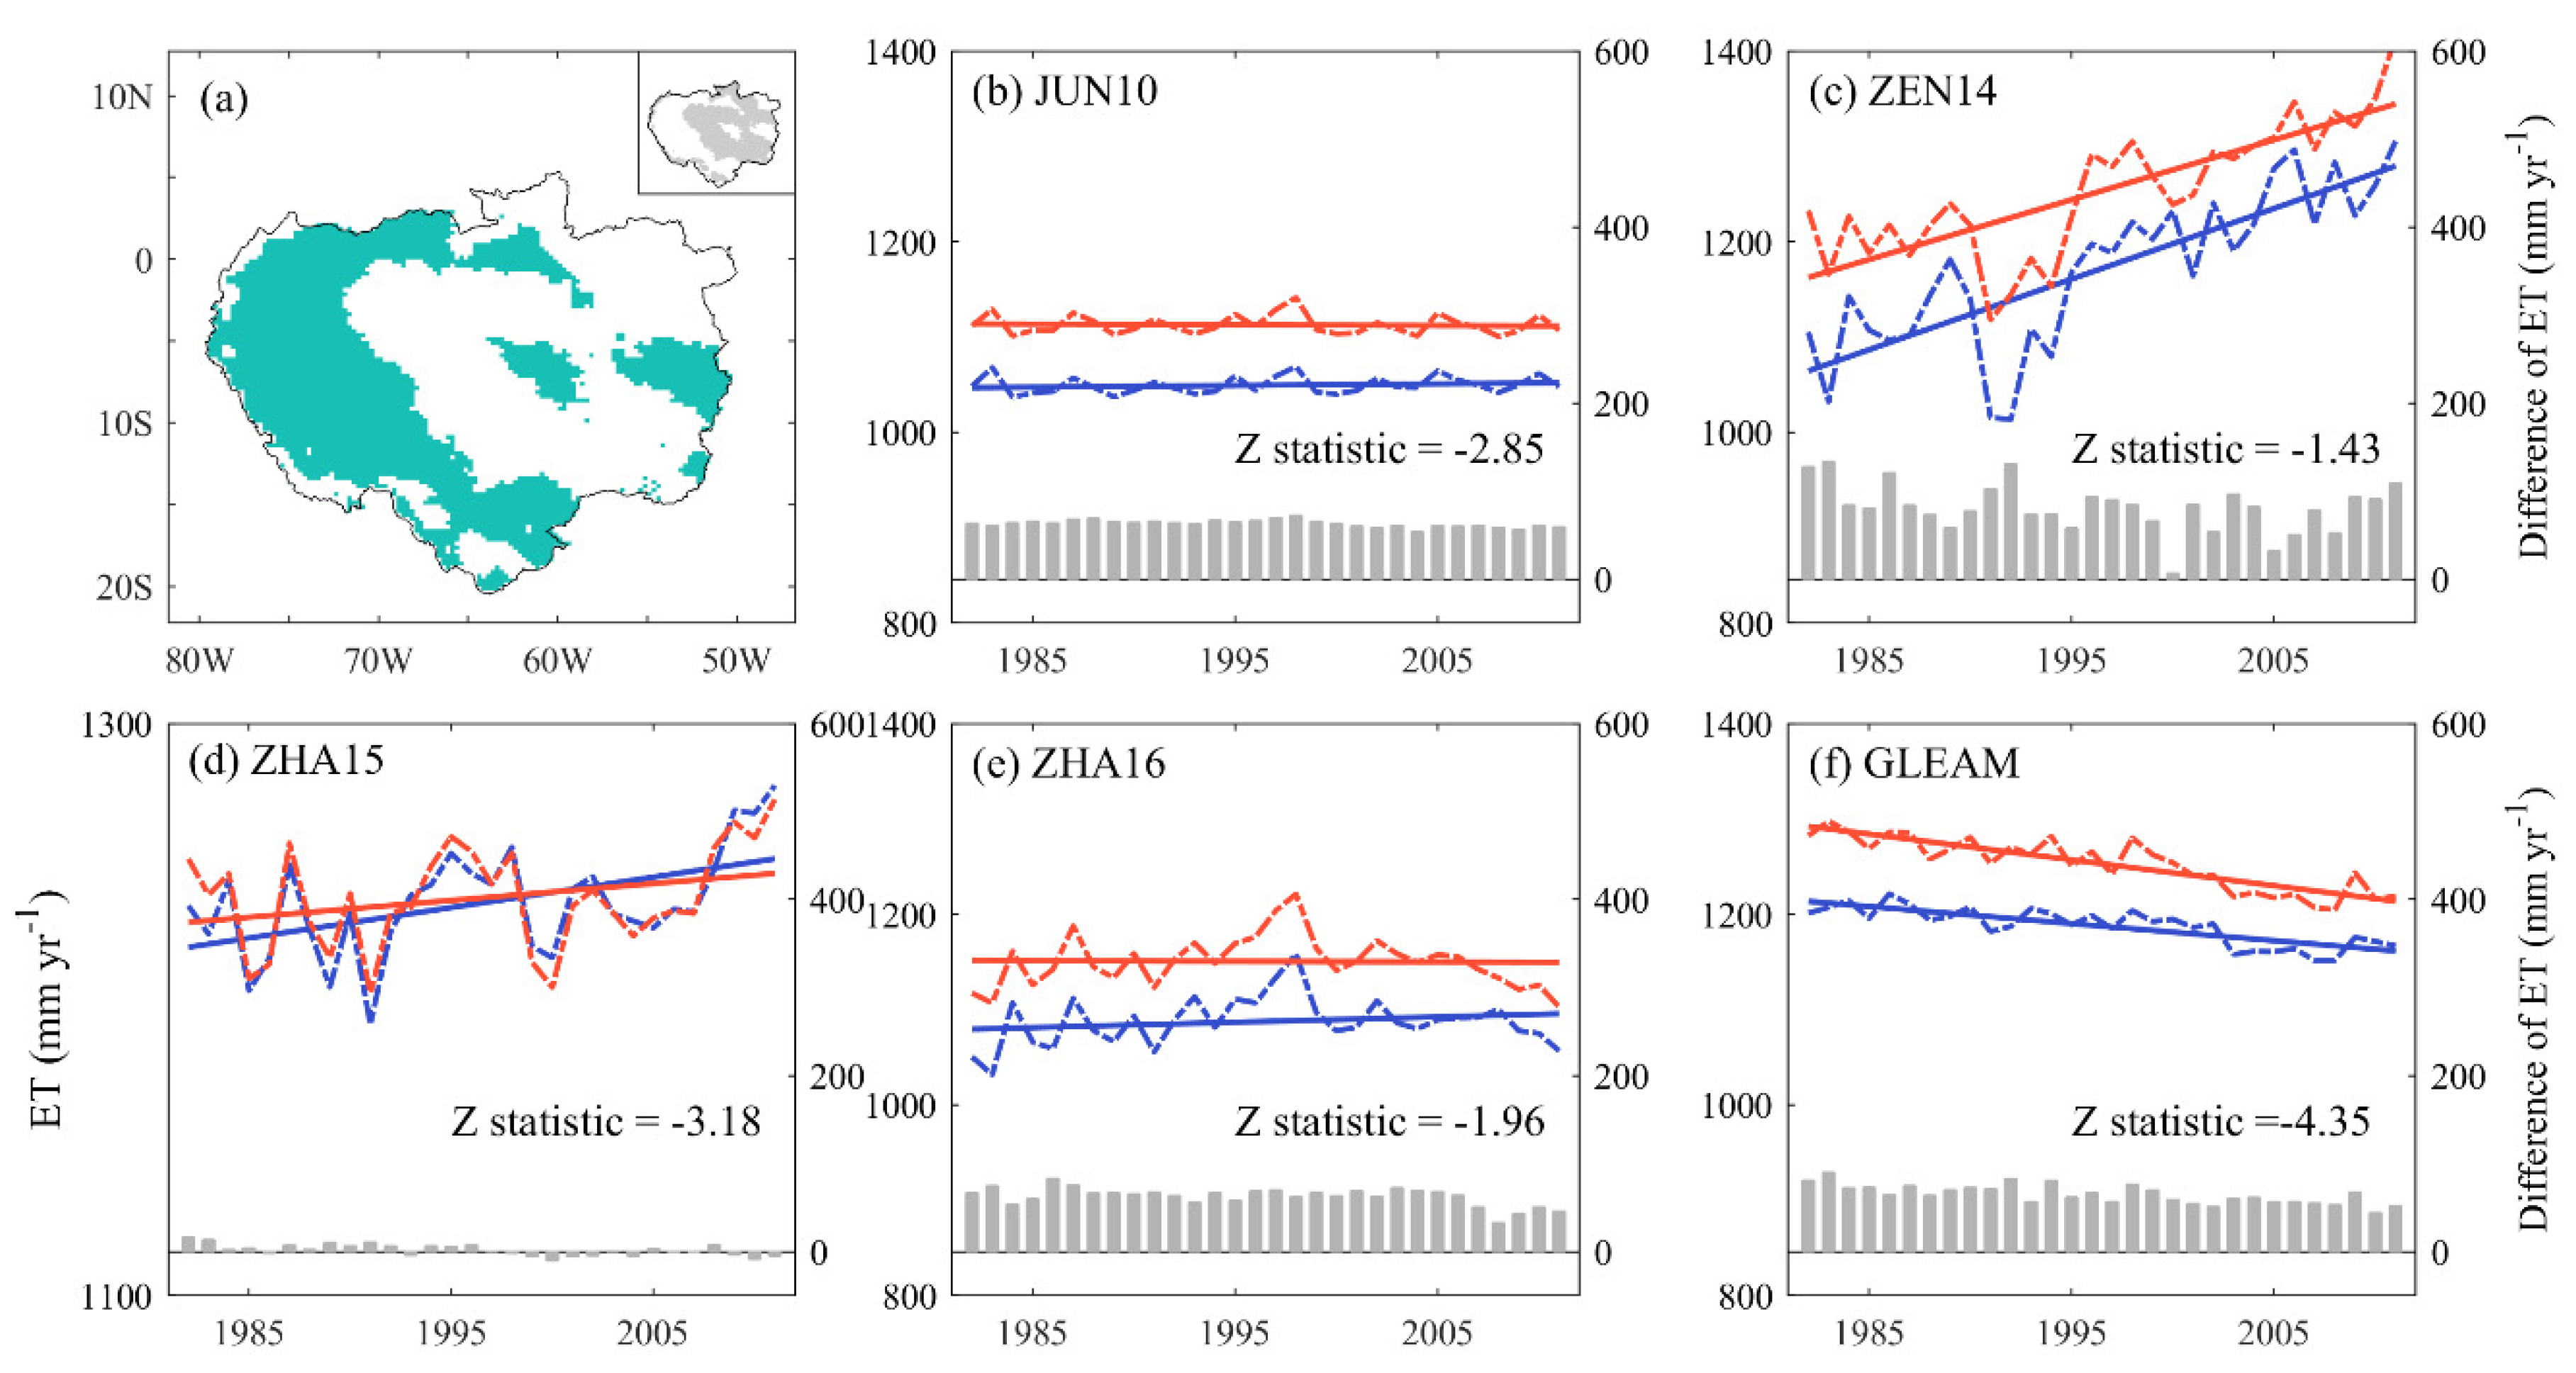
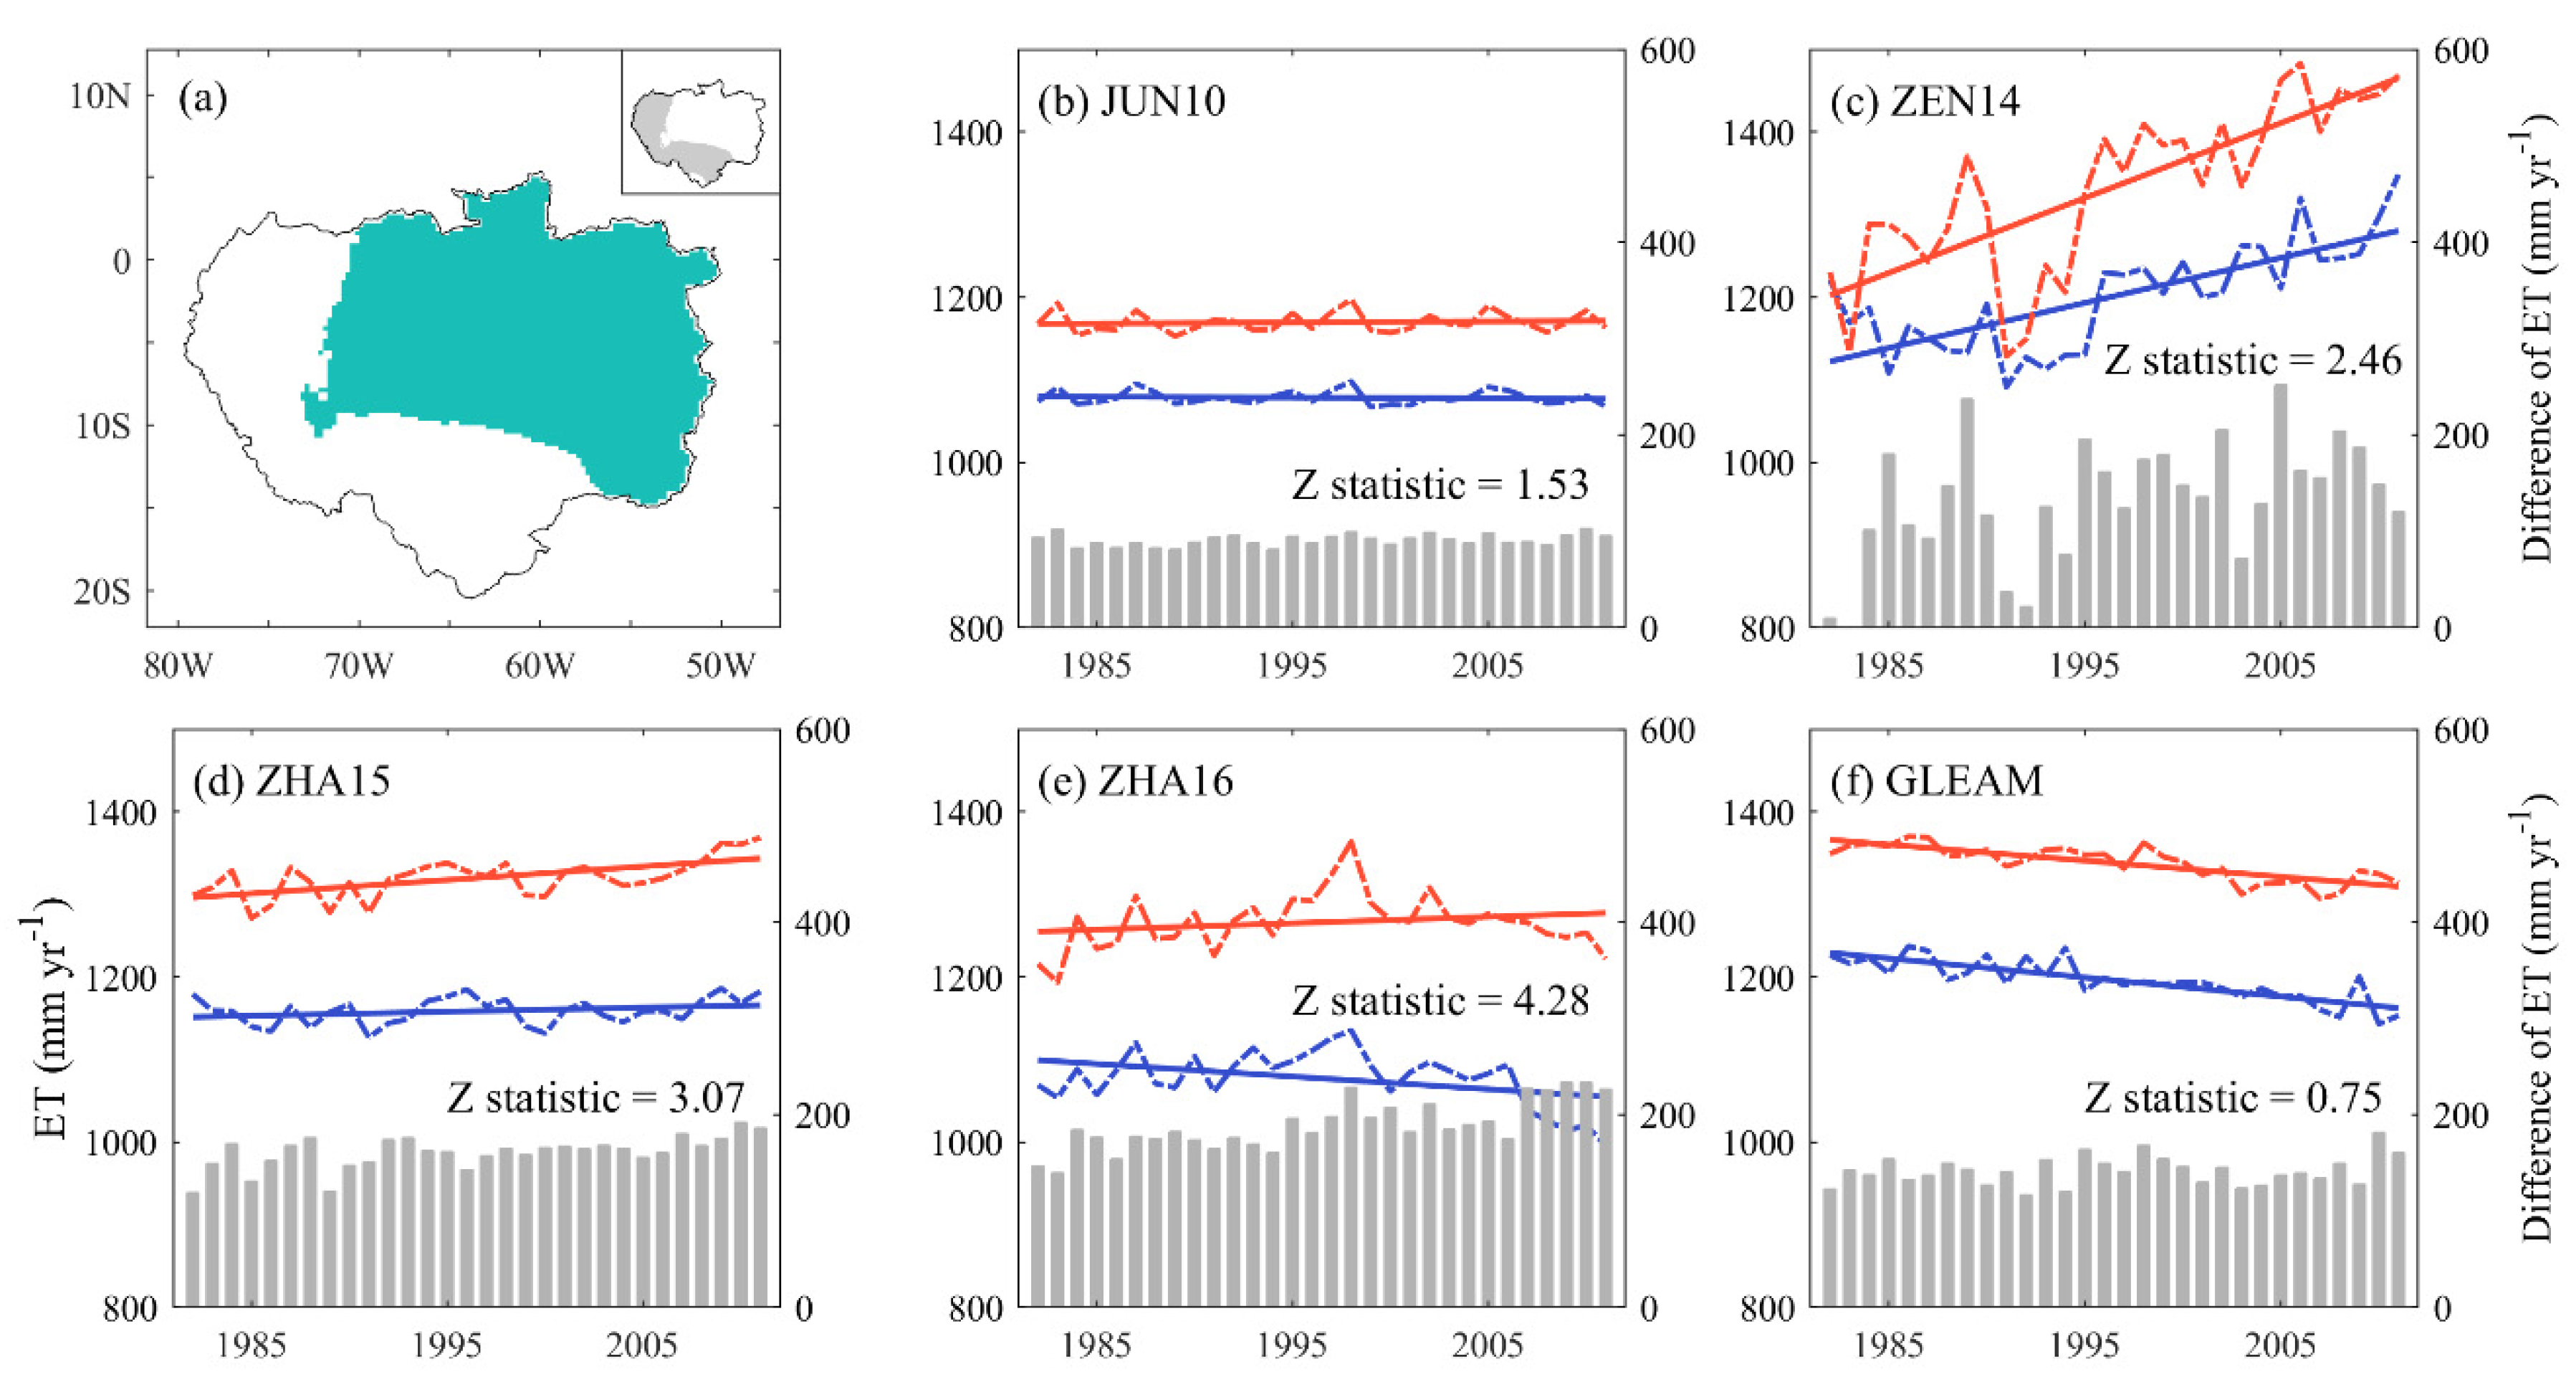
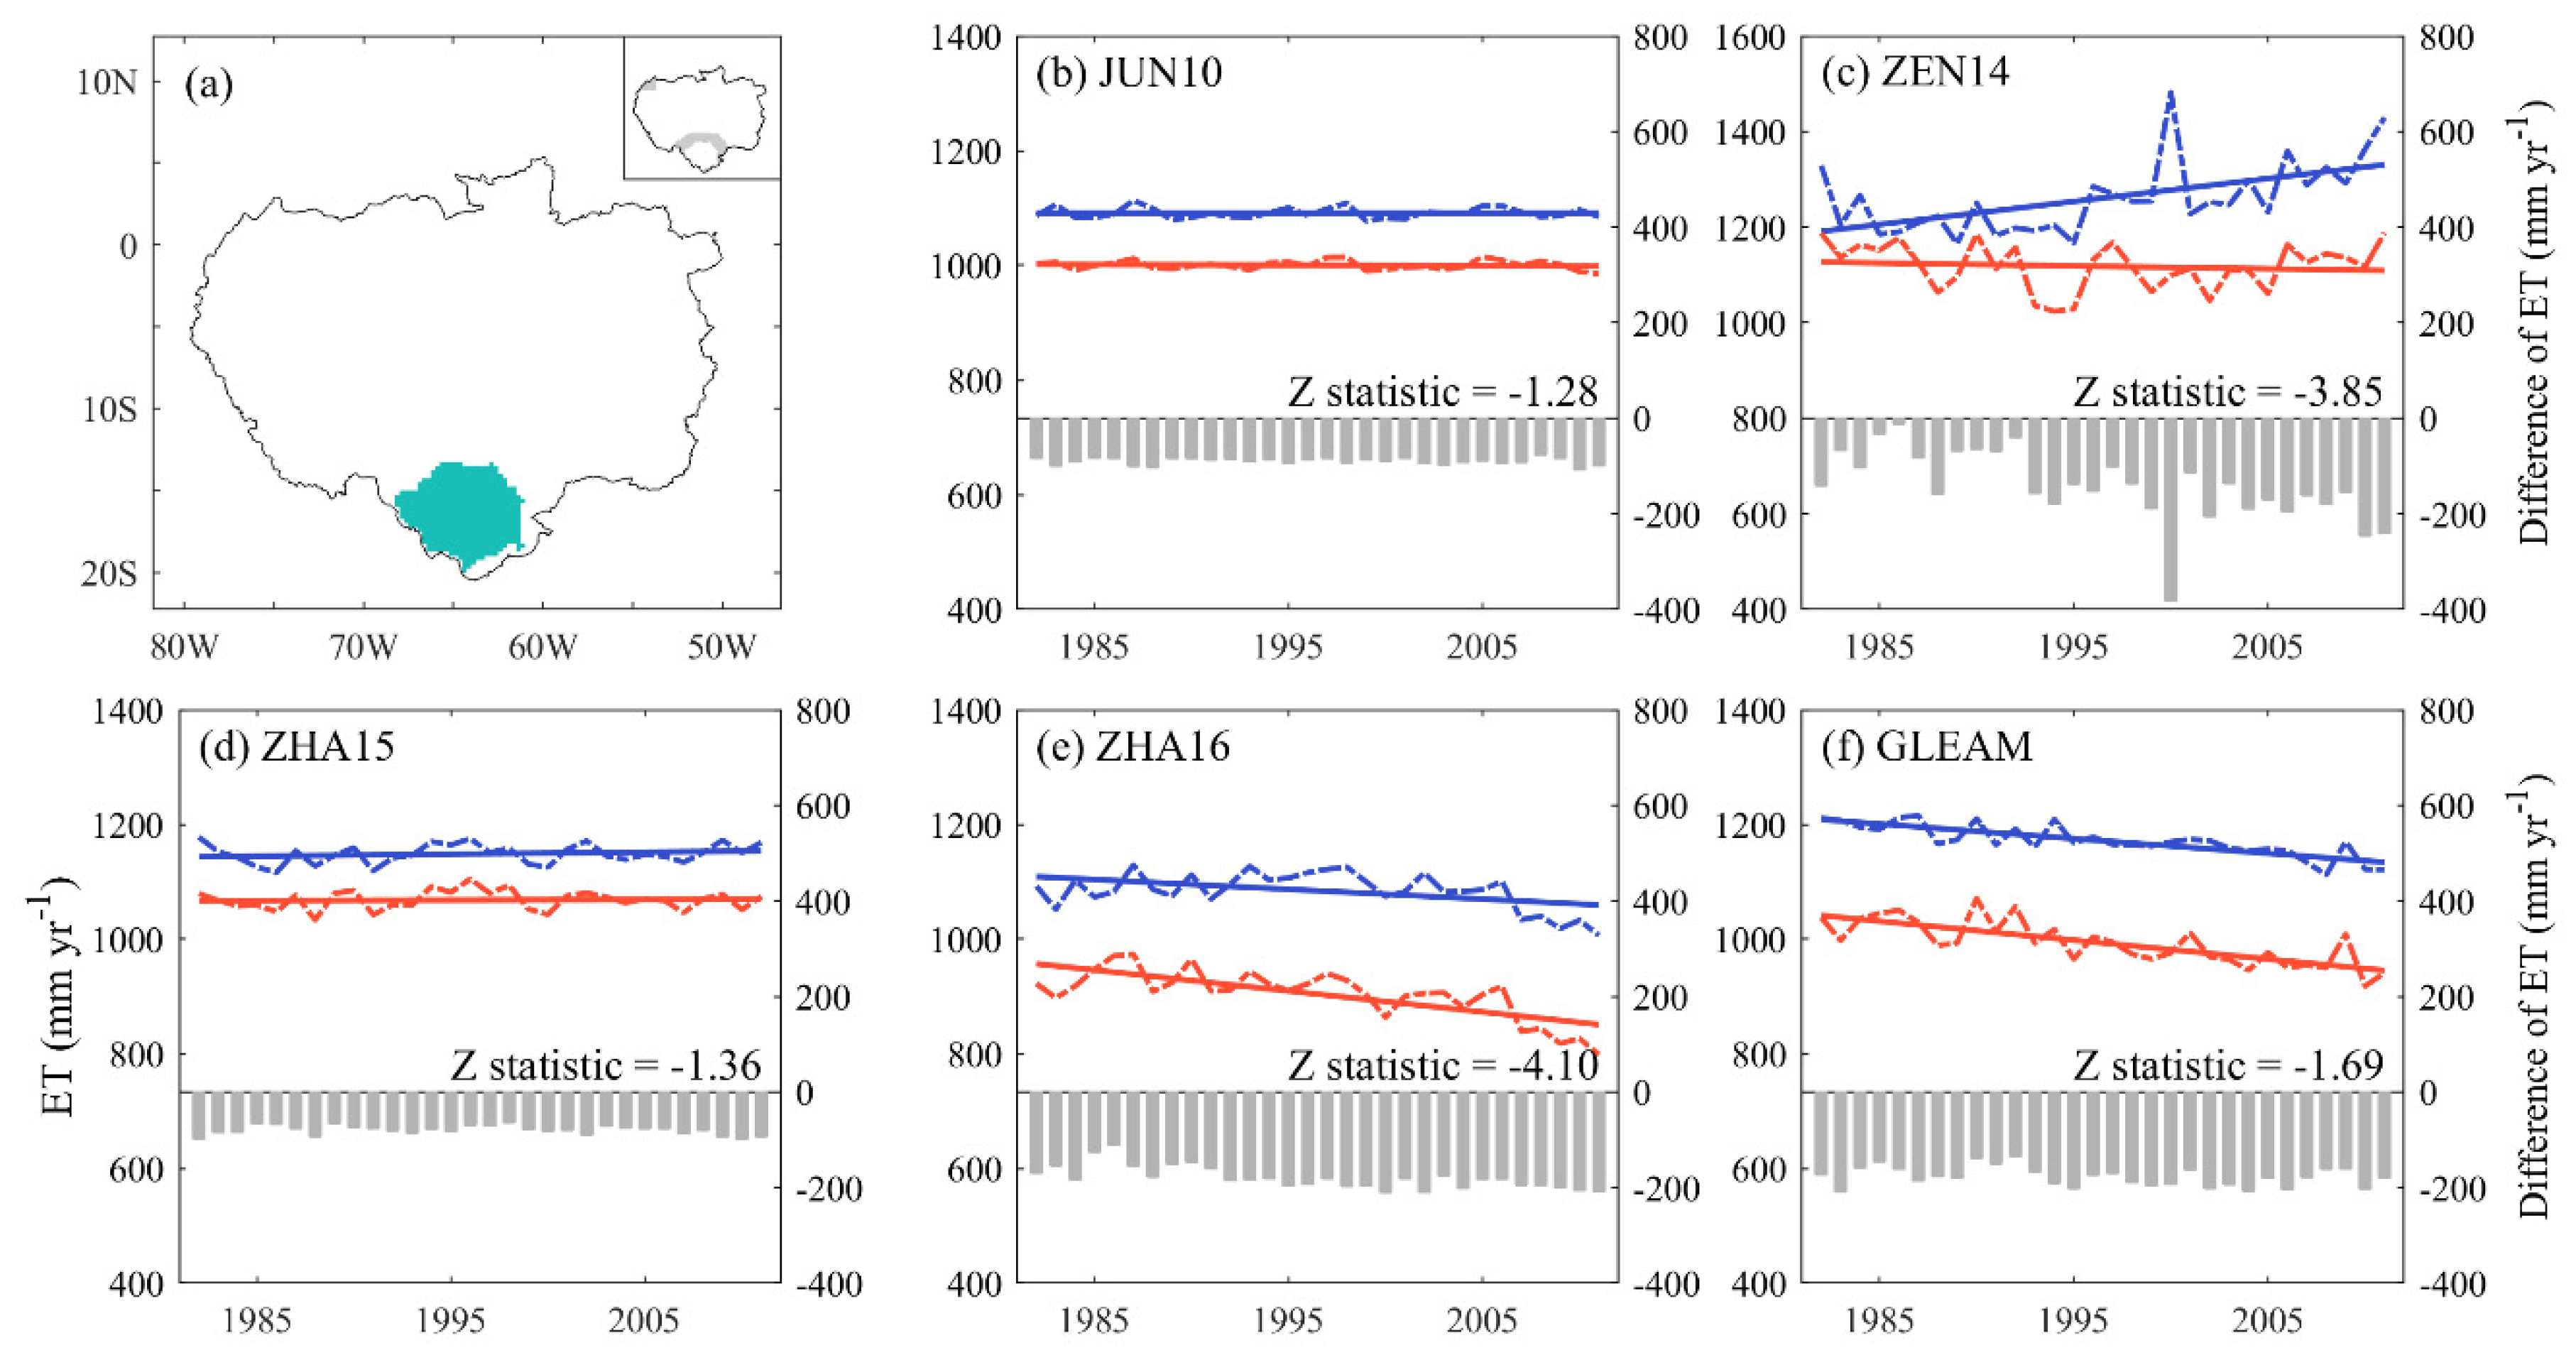
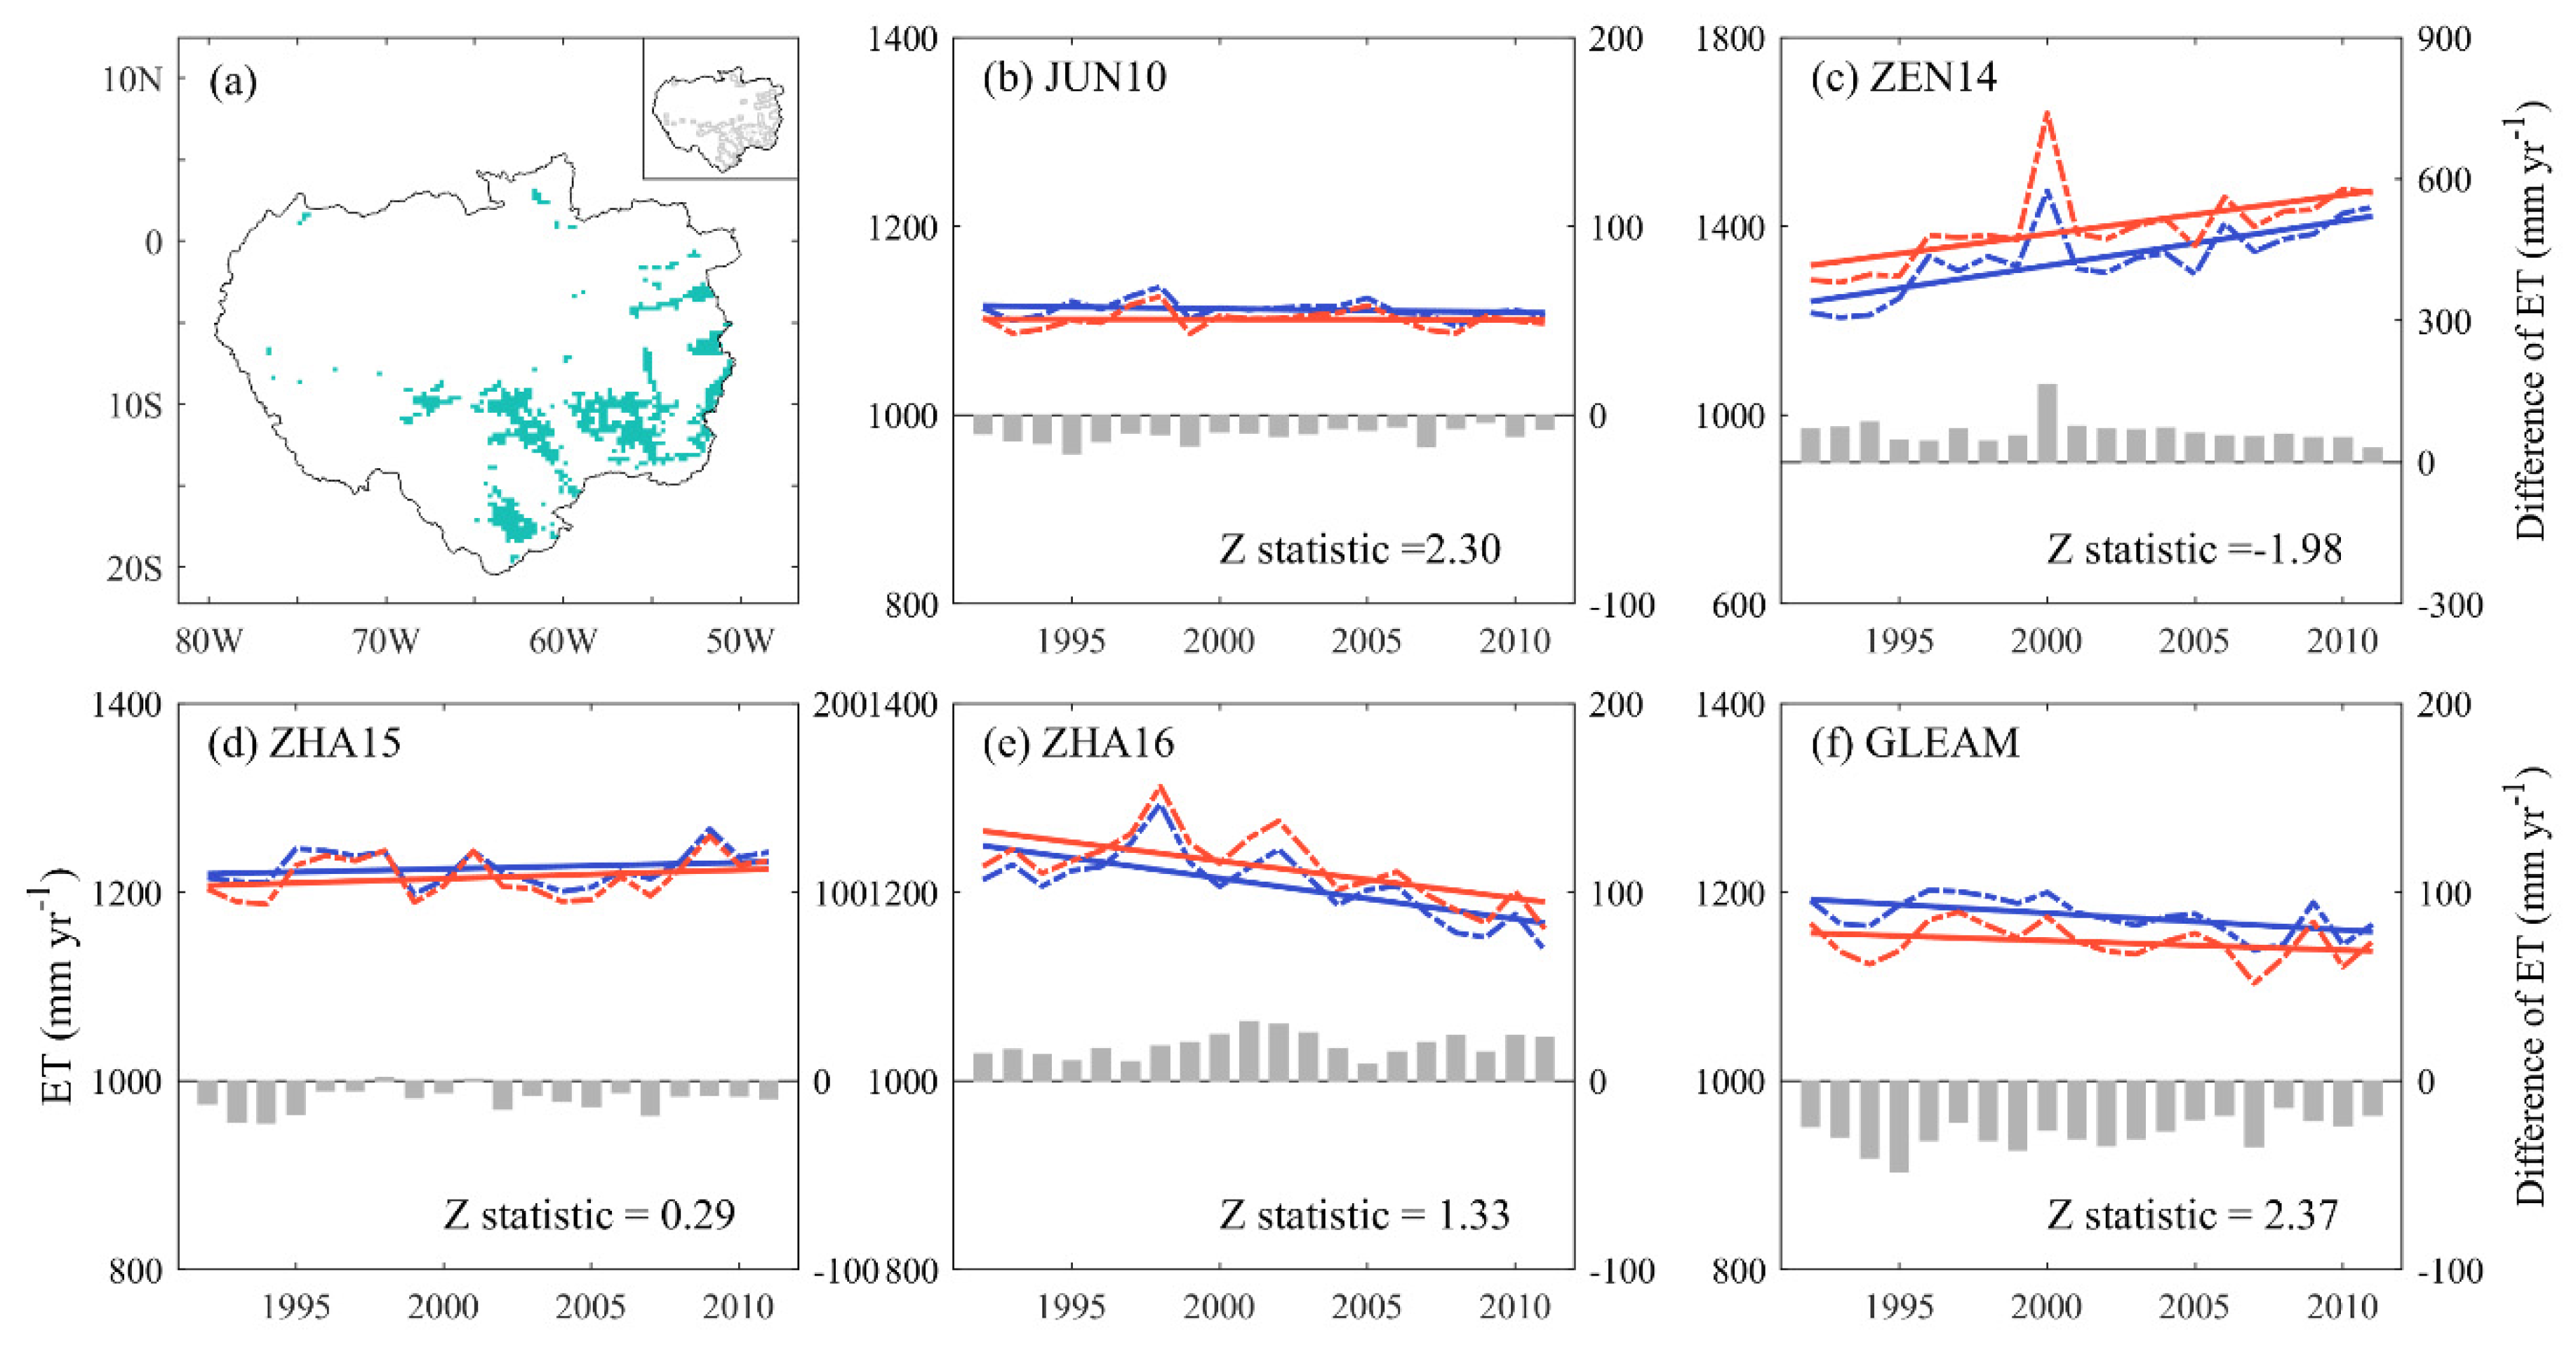
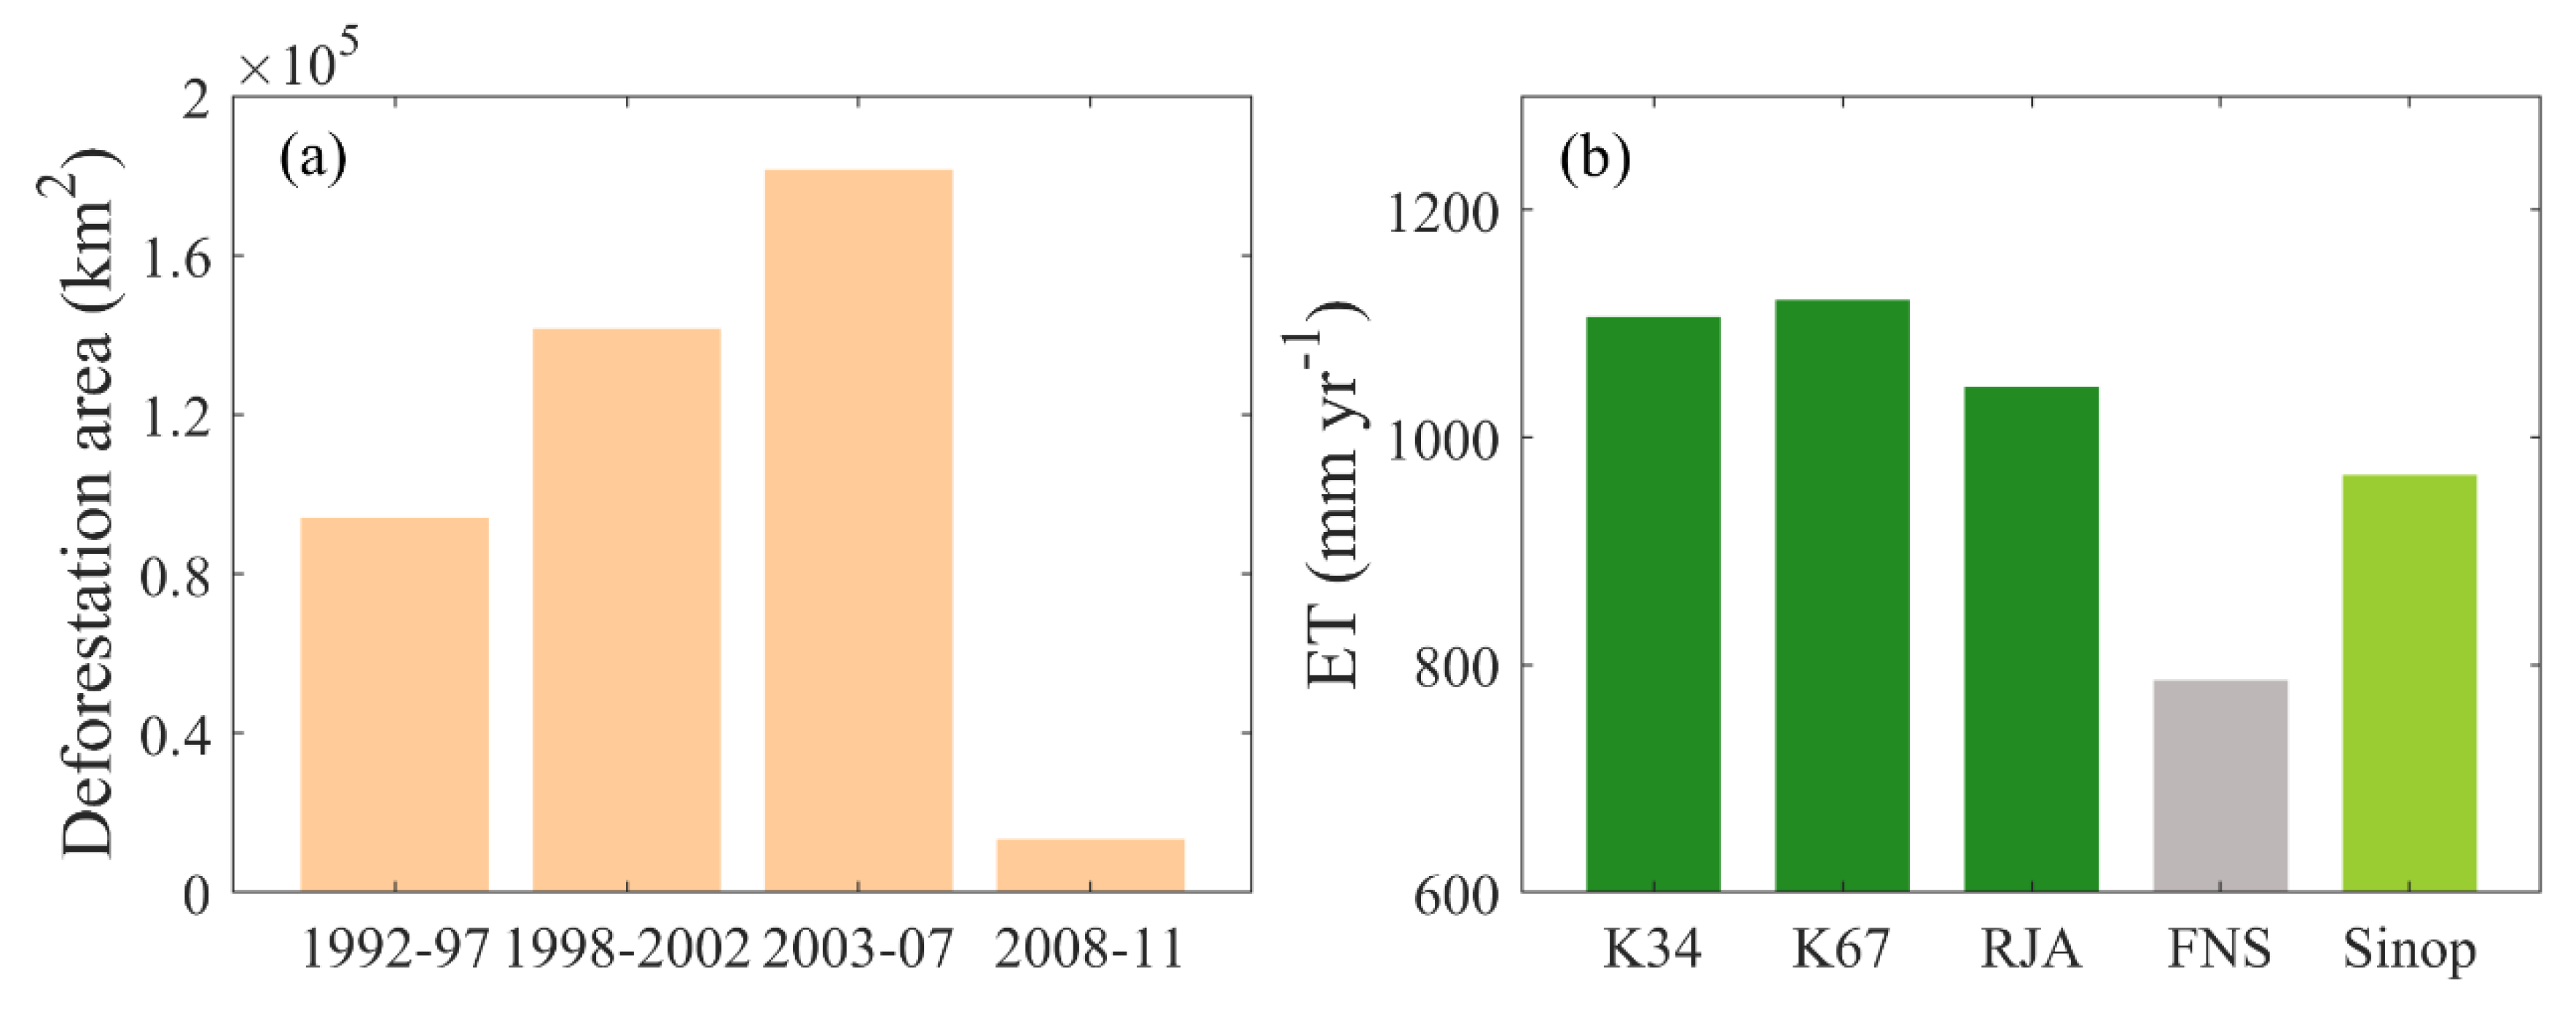
3.6. H4: Deforestation Results in a Decrease in ET—Not Evident across All Five Products
4. Conclusions
Author Contributions
Funding
Acknowledgments
Conflicts of Interest
References
- Jung, M.; Reichstein, M.; Ciais, P.; Seneviratne, S.I.; Sheffield, J.; Goulden, M.L.; Dolman, A.J. Recent decline in the global land evapotranspiration trend due to limited moisture supply. Nature 2010, 467, 951–954. [Google Scholar] [CrossRef] [PubMed]
- Bonan, G.B.; Doney, S.C. Climate, ecosystems, and planetary futures: The challenge to predict life in Earth system models. Science 2018, 359, 6375. [Google Scholar] [CrossRef] [PubMed] [Green Version]
- Fisher, J.B.; Whittaker, R.J.; Malhi, Y. ET come home: Potential evapotranspiration in geographical ecology. Glob. Ecol. Biogeogr. 2011, 20, 1–18. [Google Scholar] [CrossRef]
- Spracklen, D.V.; Arnold, S.R.; Taylor, C.M. Observations of increased tropical rainfall preceded by air passage over forests. Nature 2012, 489, 282–285. [Google Scholar] [CrossRef] [PubMed]
- Wang, K.; Dickinson, R.E. A review of global terrestrial evapotranspiration: Observation, modeling, climatology, and climatic variability. Rev. Geophys. 2012, 50, RG2005. [Google Scholar] [CrossRef]
- Kool, D.; Agam, N.; Lazarovitch, N. A review of approaches for evapotranspiration partitioning. Agric. For. Meteorol. 2014, 184, 56–70. [Google Scholar] [CrossRef]
- Karam, H.N.; Bras, R.L. Climatological basin-scale Amazonian evapotranspiration estimated through a water budget analysis. J. Hydrometeorol. 2008, 9, 1048–1060. [Google Scholar] [CrossRef]
- Swann, A.L.S.; Koven, C.D. A direct estimate of the seasonal cycle of evapotranspiration over the Amazon River basin. J. Hydrometeorol. 2017, 18, 2173–2185. [Google Scholar] [CrossRef] [Green Version]
- Paca, V.; Espinoza-Dávalos, G.E.; Hessels, T.; Moreira, D.M.; Comair, G.F.; Bastiaanssen, W.G. The spatial variability of actual evapotranspiration across the Amazon River Basin based on remote sensing products validated with flux towers. Ecol. Process. 2019, 8, 1–20. [Google Scholar] [CrossRef] [Green Version]
- Billah, M.M.; Goodall, J.; Narayan, U.; Reager, J.; Lakshmi, V.; Famiglietti, J. A methodology for evaluating evapotranspiration estimates at the watershed-scale using GRACE. J. Hydrol. 2015, 523, 574–586. [Google Scholar] [CrossRef] [Green Version]
- Lakshmi, V.; Small, E.E.; Hong, S.; Chen, F. The influence of the land surface on hydrometeorology and ecology: New advances from modeling and satellite remote sensing. Hydrol. Res. 2011, 42, 95–112. [Google Scholar] [CrossRef] [Green Version]
- Lakshmi, V.; Fayne, J.; Bolten, J. A comparative study of available water in the major river basins of the world. J. Hydrol. 2018, 567, 510–532. [Google Scholar] [CrossRef] [PubMed]
- Zeng, Z.Z.; Peng, L.Q.; Piao, S.L. Response of terrestrial evapotranspiration to Earth’s greening. Curr. Opin. Environ. Sustain. 2018, 33, 9–25. [Google Scholar] [CrossRef]
- Mueller, B.; Hirschi, M.; Jimenez, C.; Ciais, P.; Dirmeyer, P.A.; Dolman, A.J.; Fisher, J.B.; Jung, M.; Ludwig, F.; Maignan, F.; et al. Benchmark products for land evapotranspiration: LandFlux-EVAL multi-data set synthesis. Hydrol. Earth Syst. Sci. 2013, 17, 3707–3720. [Google Scholar] [CrossRef] [Green Version]
- Da Rocha, H.R.; Manzi, A.O.; Shuttleworth, J. Evapotranspiration. Geophys. Monogr. Ser. 2009, 186, 261–272. [Google Scholar]
- Betts, A.K.; Ball, J.H.; Bosilovich, M.; Viterbo, P.; Zhang, Y.; Rossow, W.B. Intercomparison of water and energy budgets for five Mississippi subbasins between ECMWF reanalysis (ERA-40) and NASA Data Assimilation Office fvGCM for 1990–1999. J. Geophys. Res. 2003, 108, 8618. [Google Scholar] [CrossRef]
- Marengo, J.A. Characteristics and spatio-temporal variability of the Amazon River Basin Water Budget. Clim. Dyn. 2005, 24, 11–22. [Google Scholar] [CrossRef]
- Zeng, N. Seasonal cycle and interannual variability in the Amazon hydrologic cycle. J. Geophys. Res. 1999, 104, 9097–9106. [Google Scholar] [CrossRef]
- Huntington, T.G. Evidence for intensification of the global water cycle: Review and synthesis. J. Hydrol. 2006, 319, 83–95. [Google Scholar] [CrossRef]
- Zhang, K.; Kimball, J.S.; Nemani, R.R.; Running, S.W.; Hong, Y.; Gourley, J.J.; Yu, Z. Vegetation greening and climate change promote multidecadal rises of global land evapotranspiration. Sci. Rep. 2015, 5, 15956. [Google Scholar] [CrossRef]
- Zhang, Y.; Pena-Arancibia, J.L.; McVicar, T.R.; Chiew, F.H.S.; Vaze, J.; Liu, C.; Pan, M. Multi-decadal trends in global terrestrial evapotranspiration and its components. Sci. Rep. 2016, 6, 19124. [Google Scholar] [CrossRef] [PubMed] [Green Version]
- Hasler, N.; Avissar, R. What Controls Evapotranspiration in the Amazon Basin. J. Hydrometeorol. 2007, 8, 380–395. [Google Scholar] [CrossRef]
- Wild, M.; Gilgen, H.; Roesch, A. From Dimming to Brightening: Decadal Changes in Solar Radiation at Earth’s Surface. Science 2005, 308, 847–850. [Google Scholar] [CrossRef] [PubMed] [Green Version]
- Bullock, E.L.; Woodcock, C.E.; Souza, C.J.; Olofsson, P. Satellite-based estimates reveal widespread forest degradation in the Amazon. Glob. Chang. Biol. 2020, 26, 2956–2969. [Google Scholar] [CrossRef] [PubMed]
- Malhi, Y.; Roberts, J.T.; Betts, R.A. Climate change, deforestation, and the fate of the Amazon. Science 2008, 319, 169–172. [Google Scholar] [CrossRef] [PubMed] [Green Version]
- Baker, T.R.; Phillips, O.L.; Malhi, Y. Increasing biomass in Amazonian forest plots. Philos. Trans. R. Soc. Lond. Ser. B Biol. Sci. 2004, 359, 353–365. [Google Scholar] [CrossRef] [PubMed]
- Huntingford, C.; Zelazowski, P.; Galbraith, D. Simulated resilience of tropical rainforests to CO2-induced climate change. Nat. Geosci. 2013, 6, 268–273. [Google Scholar] [CrossRef]
- Zhu, Z.; Piao, S.; Myneni, R.B.; Huang, M.; Zeng, Z.; Canadell, J.G.; Cao, C. Greening of the Earth and its drivers. Nat. Clim. Chang. 2016, 6, 791–795. [Google Scholar] [CrossRef]
- Zeng, Z.; Wang, T.; Zhou, F.; Ciais, P.; Mao, J.; Shi, X.; Piao, S. A worldwide analysis of spatiotemporal changes in water balance based evapotranspiration from 1982 to 2009. J. Geophys. Res. Atmos. 2014, 119, 1186–1202. [Google Scholar] [CrossRef]
- Miralles, D.G.; Holmes, T.R.H.; De Jeu, R.A.M.; Gash, J.H.; Meesters, A.G.C.A.; Dolman, A.J. Global land–surface evaporation estimated from satellite-based observations. Hydrol. Earth Syst. Sci. 2011, 15, 453–469. [Google Scholar] [CrossRef] [Green Version]
- Martens, B.; Miralles, D.G.; Lievens, H.; van der Schalie, R.; de Jeu, R.A.; Fernández-Prieto, D.; Beck, H.E.; Dorigo, W.; Verhoest, N. GLEAM v3: Satellite-based land evaporation and root-zone soil moisture. Geosci. Model. Dev. 2017, 10, 1903–1925. [Google Scholar] [CrossRef] [Green Version]
- Mu, Q.; Heinsch, F.A.; Zhao, M.; Running, S.W. Development of a global evapotranspiration algorithm based on MODIS and global meteorology data. Remote Sens. Environ. 2007, 111, 519–536. [Google Scholar] [CrossRef]
- Saleska, S.R.; da Rocha, H.R.; Huete, A.R.; Nobre, A.D.; Artaxo, P.; Shimabukuro, Y.E. LBA-ECO CD-32 Flux Tower Network Data Compilation, Brazilian Amazon: 1999–2006; Dataset; Oak Ridge National Laboratory Distributed Active Archive Center: Oak Ridge, TN, USA, 2013. Available online: http://daac.ornl.gov (accessed on 13 November 2019).
- Vourlitis, G.L.; de Souza Nogueira, J.; de Almeida Lobo, F. Variations in evapotranspiration and climate for an Amazonian semi-deciduous forest over seasonal, annual, and El Niño cycles. Int. J. Biometeorol. 2015, 59, 217–230. [Google Scholar] [CrossRef] [PubMed]
- Huffman, G.; Bolvin, D.; Braithwaite, D.; Hsu, K.; Joyce, R.; Xie, P. Integrated Multi-satellitE Retrievals for GPM (IMERG), Version 4.4; NASA’s Precipitation Processing Center. 2014. Available online: ftp://arthurhou.pps.eosdis.nasa.gov/gpmdata/ (accessed on 31 March 2015).
- Schneider, U. GPCC Full Data Reanalysis Version 6.0 at 0.5°: Monthly Land-Surface Precipitation from Rain-Gauges built on GTS-based and Historic Data. 2011. Available online: https://opendata.dwd.de/climate_environment/GPCC/html/download_gate.html (accessed on 30 November 2019).
- Schneider, U.; Becker, A.; Finger, P. GPCC’s new land surface precipitation climatology based on quality-controlled in situ data and its role in quantifying the global water cycle. Theor. Appl. Climatol. 2014, 115, 15–40. [Google Scholar] [CrossRef] [Green Version]
- Becker, A.; Finger, P.; Meyer-Christoffer, A. A description of the global land-surface precipitation data products of the Global Precipitation Climatology Centre with sample applications including centennial (trend) analysis from 1901–present. Earth Syst. Sci. Data 2013, 5, 921–998. [Google Scholar] [CrossRef]
- Lin, P.; Pan, M.; Beck, H.E.; Yang, Y.; Yamazaki, D.; Frasson, R. Global reconstruction of naturalized river flows at 2.94 million reaches. Water Resour. Res. 2019, 55, 6499–6516. [Google Scholar] [CrossRef] [Green Version]
- Copernicus Climate Change Service (C3S) (2019): C3S ERA5-Land Reanalysis. Copernicus Climate Change Service. Available online: https://cds.climate.copernicus.eu/cdsapp#!/home (accessed on 3 July 2020).
- Bowen, I.S. The ratio of heat losses by conduction and by evaporation from any water surface. Phys. Rev. 1926, 27, 779–787. [Google Scholar] [CrossRef] [Green Version]
- University of East Anglia Climatic Research Unit; Harris, I.C.; Jones, P.D. CRU TS4.03: Climatic Research Unit (CRU) Time-Series (TS) Version 4.03 of High-Resolution Gridded Data of Month-by-Month Variation in Climate (Jan. 1901–Dec. 2018). Centre for Environmental Data Analysis Dataset. 2019. Available online: https://catalogue.ceda.ac.uk/uuid/10d3e3640f004c578403419aac167d82 (accessed on 24 December 2019).
- Myneni, R.B.; Hoffman, S.; Knyazikhin, Y.; Privette, J.L.; Glassy, J.; Tian, Y.; Wang, Y.; Song, X.; Zhang, Y.; Smith, G.R.; et al. Global products of vegetation leaf area and fraction absorbed PAR from year one of MODIS data. Remote Sens. Environ. 2002, 83, 214–231. [Google Scholar] [CrossRef] [Green Version]
- Zhu, Z.C.; Bi, J.; Pan, M. Global data sets of vegetation Leaf Area Index (LAI)3g and Fraction of Photosynthetically Active Radiation (FPAR)3g derived from Global Inventory Modeling and Mapping Studies (GIMMS) Normalized Difference Vegetation Index (NDVI3g) for the period 1981 to 2011. Remote Sens. 2013, 5, 927–948. [Google Scholar]
- Fearnside, P.M. Deforestation in Brazilian Amazonia: History, rates and consequences. Conserv. Biol. 2005, 19, 680–688. [Google Scholar] [CrossRef]
- ESA. Land Cover CCI Product User Guide Version 2. Technical Report. 2017. Available online: maps.elie.ucl.ac.be/CCI/viewer/download/ESACCI-LC-Ph2-PUGv2_2.0.pdf (accessed on 18 November 2019).
- Mann, H.B. Non-parametric tests against trend. Econ. J. Econ. Soc. 1945, 13, 245–259. [Google Scholar]
- Kendall, M.G. Rank Correlation Methods; Griffin: London, UK, 1975. [Google Scholar]
- Maeda, E.E.; Ma, X.; Wagner, F. Evapotranspiration seasonality across the Amazon River basin. Earth Syst. Dyn. Discuss. 2017, 8, 439–454. [Google Scholar] [CrossRef] [Green Version]
- Zhang, Y.; Pan, M.; Sheffield, J.; Siemann, A.L.; Fisher, C.K.; Liang, M.; Beck, H.E.; Wanders, N.; MacCracken, R.F.; Houser, P.R.; et al. A Climate Data Record (CDR) for the global terrestrial water budget: 1984–2010. Hydrol. Earth Syst. Sci. 2018, 22, 241–263. [Google Scholar] [CrossRef] [Green Version]
- Pan, M.; Sahoo, A.K.; Troy, T.J.; Vinukollu, R.K.; Sheffield, J.; Wood, E.F. Multisource estimation of long-term terrestrial water budget for major global river basins. J. Clim. 2012, 25, 3191–3206. [Google Scholar] [CrossRef]
- Jasechko, S.; Sharp, Z.D.; Gibson, J.J.; Birks, S.J.; Yi, Y.; Fawcett, P.J. Terrestrial water fluxes dominated by transpiration. Nature 2013, 496, 347–350. [Google Scholar] [CrossRef]
- Good, S.P.; Noone, D.; Bowen, G. Hydrologic connectivity constrains partitioning of global terrestrial water fluxes. Science 2015, 349, 175–177. [Google Scholar] [CrossRef] [Green Version]
- Lian, X.; Piao, S.L.; Huntingford, C. Partitioning global land evapotranspiration using CMIP5 models constrained by observations. Nat. Clim. Chang. 2018, 8, 640–646. [Google Scholar] [CrossRef]
- Brutsaert, W. Hydrology: An Introduction; Cambridge University Press: Cambridge, UK, 2005. [Google Scholar]
- Rui, X.F. Evaporation and Transpiration. In Principles of Hydrology, 6th ed.; China Water Power Press: Beijing, China, 2013; pp. 122–126. [Google Scholar]
- Sheffield, J.; Wood, E.F.; Roderick, M.L. Little change in global drought over the past 60 years. Nature 2012, 491, 435–438. [Google Scholar] [CrossRef]
- Katul, G.G.; Oren, R.; Manzoni, S.; Higgins, C.; Parlange, M.B. Evapotranspiration: A process driving mass transport and energy exchange in the soil–plant–atmosphere–climate system. Rev. Geophys. 2012, 50, RG3002. [Google Scholar] [CrossRef] [Green Version]
- Asner, G.P.; Scurlock, J.M.O.; Hicke, J.A. Global synthesis of leaf area index observations: Implications for ecological and remote sensing studies. Glob. Ecol. Biogeogr. 2003, 12, 191–205. [Google Scholar] [CrossRef] [Green Version]
- Narayan, U.; Lakshmi, V.; Jackson, T. High resolution change estimation of soil moisture using L-band radiometer and radar observations made during SMEX02 experiments. IEEE Trans. Geosci. Remote Sens. 2006, 44, 1545–1554. [Google Scholar] [CrossRef]
- Narayan, U.; Lakshmi, V. Characterizing sub-pixel variability of low-resolution radiometer derived soil moisture using high resolution radar data. Water Resour. Res. 2008, 44, 06425. [Google Scholar] [CrossRef] [Green Version]
- Fang, B.; Lakshmi, V.; Bindlish, R.; Jackson, T.; Cosh, M.; Basara, J. Passive Microwave Soil moisture downscaling using vegetation index and surface temperature. Vadose Zone J. 2013, 12, 1–19. [Google Scholar] [CrossRef]
- Fang, B.; Lakshmi, V.; Bindlish, R.; Jackson, T. Downscaling of SMAP soil moisture using land surface temperature and vegetation data. Vadose Zone J. 2018, 17, 1–15. [Google Scholar] [CrossRef] [Green Version]
- Fang, B.; Lakshmi, V.; Jackson, T.; Bindlish, R.; Colliander, A. Passive/active microwave soil moisture change disaggregation using SMAPVEX12 data. J. Hydrol. 2019, 574, 1085–1098. [Google Scholar] [CrossRef]


| Product | Algorithm | Ground-based Measurements | Drivers | Spatial Resolution | Temporal Resolution | Period |
|---|---|---|---|---|---|---|
| JUN10 | Machine learning (MTE) | EC | P, Ta, fAPAR | 0.5° × 0.5° | monthly | 1982–2011 |
| ZEN14 | Machine learning (MTE) | WB | P, Ta, R, PS, Vp, W, Fw, Ff, NDVI | 0.5° × 0.5° | monthly | 1982–2013 |
| ZHA15 | P–LSH | - | Ta, R, Vp, W, CO2, NDVI | 8 km × 8 km | monthly | 1982–2013 |
| ZHA16 | PML model Gash model | WB, EC, field experiments for validation | P, Ta, Vp, R, W, LAI, Ve, Va | 0.5° × 0.5° | monthly | 1981–2012 |
| GLEAM | Revised Priestley–Taylor Equation | EC, soil moisture sensors for validation | R, P, Ta, SWE, VOD, SM | 0.25° × 0.25° | daily | 1980–2012 |
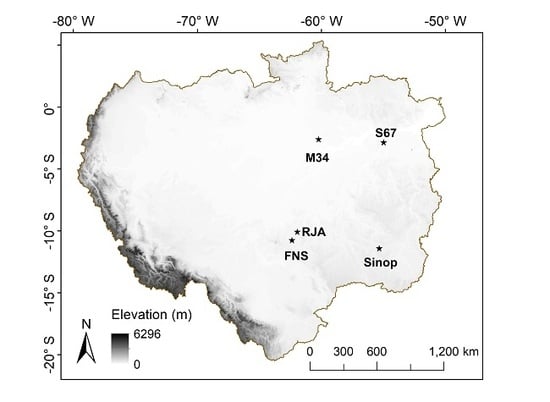
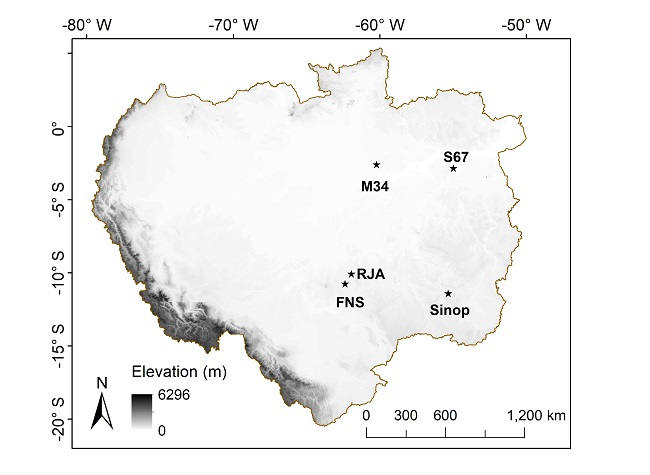
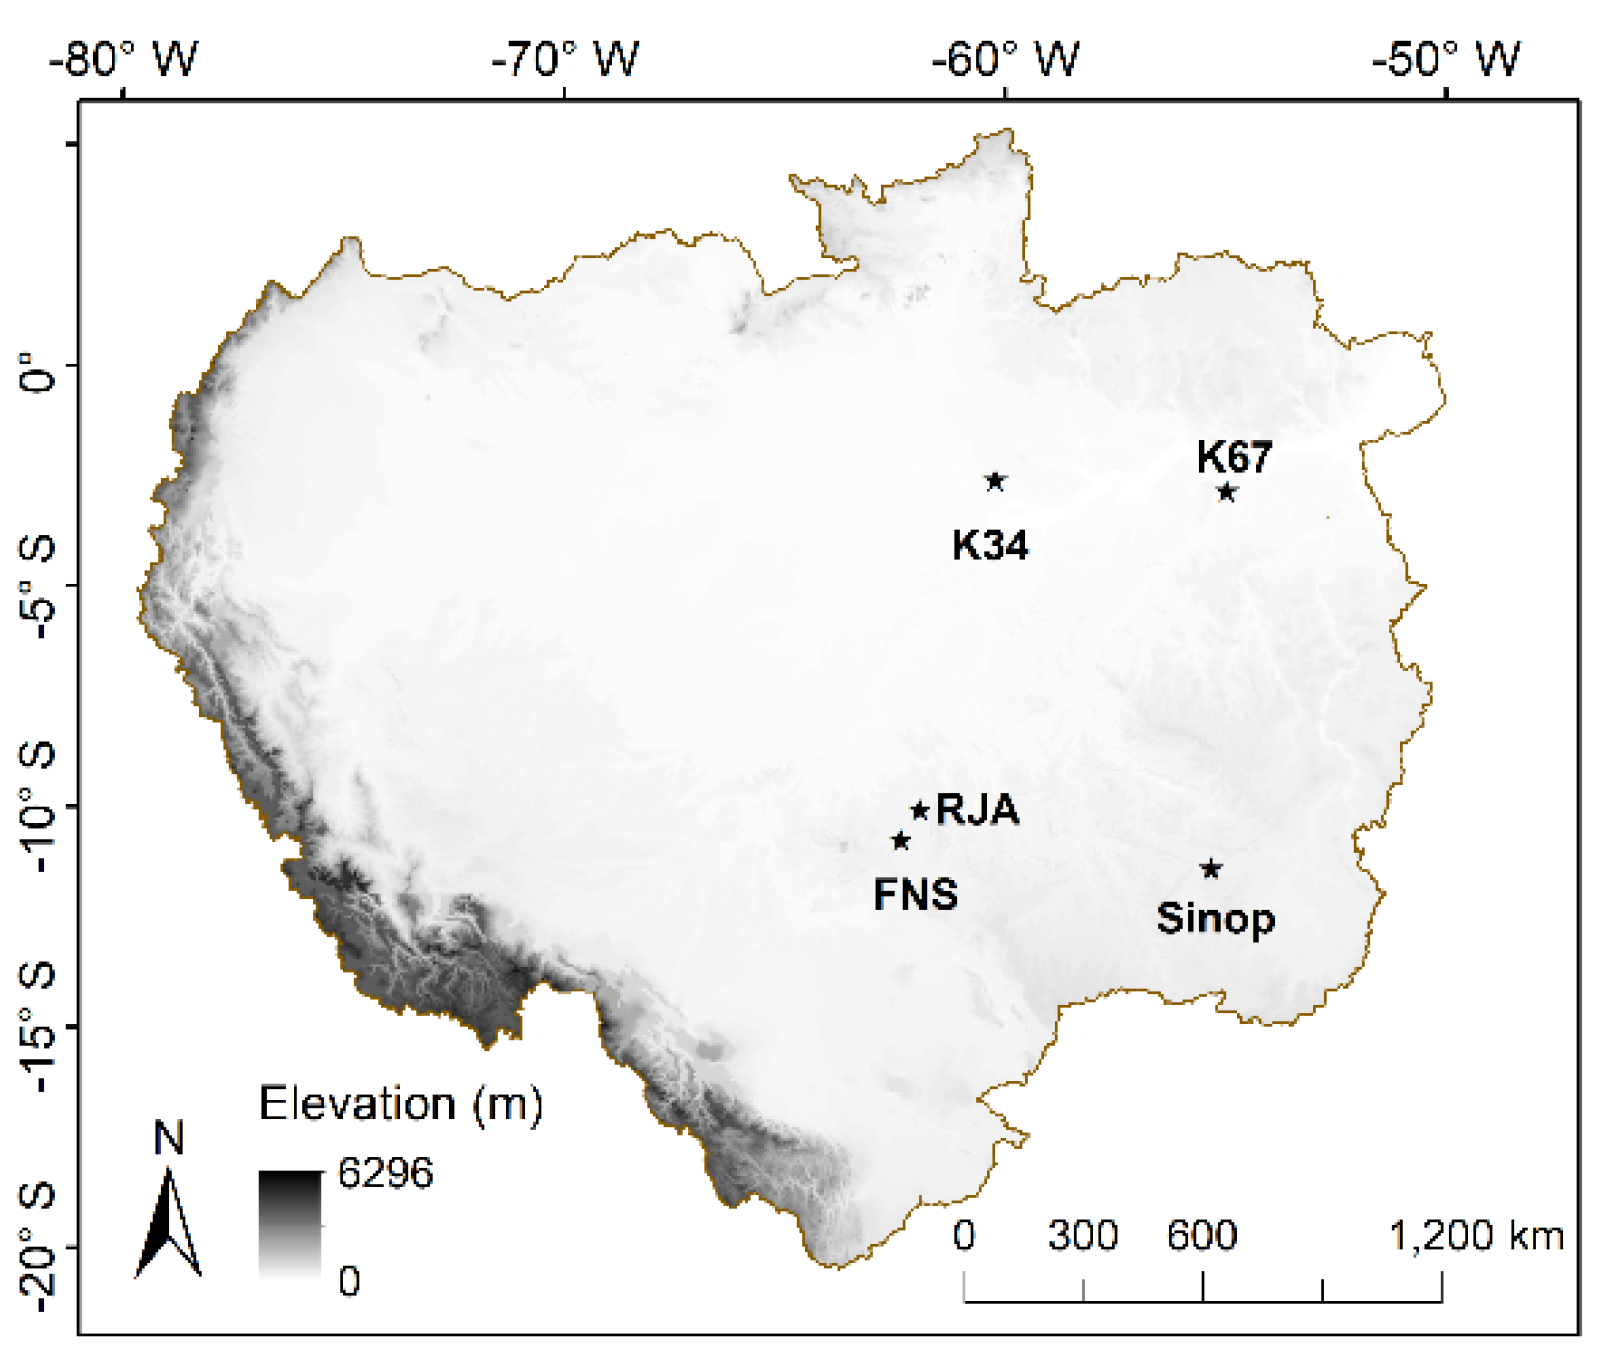
| Site name | Vegetation Description | Latitude | Longitude | Period of Data used |
|---|---|---|---|---|
| Santarém km 67 (K67) | Tropical Moist Forest | 2.86° S | 54.96° W | Jan 2002–Jan 2006 |
| Manaus KM34 (K34) | Tropical Rainforest | 2.61° S | 60.21° W | Jul 1999–Oct 2006 |
| Reserva Jaru (RJA) | Tropical Dry Forest | 10.08° S | 61.93° W | Mar 1999–Nov 2002 |
| Fazenda Nossa Senhora (FNS) | Pasture | 10.76° S | 62.36° W | Feb 1999–Mar 2002 |
| Sinop-Mato Grosso (Sinop) | Semi-deciduous Forest | 11.41° S | 55.32° W | 2000–2006 |
© 2020 by the authors. Licensee MDPI, Basel, Switzerland. This article is an open access article distributed under the terms and conditions of the Creative Commons Attribution (CC BY) license (http://creativecommons.org/licenses/by/4.0/).
Share and Cite
Wu, J.; Lakshmi, V.; Wang, D.; Lin, P.; Pan, M.; Cai, X.; Wood, E.F.; Zeng, Z. The Reliability of Global Remote Sensing Evapotranspiration Products over Amazon. Remote Sens. 2020, 12, 2211. https://0-doi-org.brum.beds.ac.uk/10.3390/rs12142211
Wu J, Lakshmi V, Wang D, Lin P, Pan M, Cai X, Wood EF, Zeng Z. The Reliability of Global Remote Sensing Evapotranspiration Products over Amazon. Remote Sensing. 2020; 12(14):2211. https://0-doi-org.brum.beds.ac.uk/10.3390/rs12142211
Chicago/Turabian StyleWu, Jie, Venkataraman Lakshmi, Dashan Wang, Peirong Lin, Ming Pan, Xitian Cai, Eric F. Wood, and Zhenzhong Zeng. 2020. "The Reliability of Global Remote Sensing Evapotranspiration Products over Amazon" Remote Sensing 12, no. 14: 2211. https://0-doi-org.brum.beds.ac.uk/10.3390/rs12142211