Assessing the Influence of Tourism-Driven Activities on Environmental Variables on Hainan Island, China


1
Interfaculty Department of Geoinformatics–Z_GIS, University of Salzburg, Schillerstrasse 30, 5020 Salzburg, Austria
2
School of Surveying and Geospatial Sciences, The Technical University of Kenya, Haile Selassie Avenue, Nairobi P.O. Box 52428-00200, Kenya
3
School of Land Science and Technology, China University of Geosciences (Beijing), Haidian District, Beijing 100083, China
*
Author to whom correspondence should be addressed.
Remote Sens. 2020, 12(17), 2813; https://0-doi-org.brum.beds.ac.uk/10.3390/rs12172813
Submission received: 4 June 2020
/
Revised: 26 August 2020
/
Accepted: 27 August 2020
/
Published: 30 August 2020
(This article belongs to the Special Issue Google Earth Engine and Cloud Computing Platforms: Methods and Applications in Big Geo Data Science)
Abstract
:Tourism is a primary socio-economic factor on many coastal islands. Tourism contributes to the livelihoods of the residents, but also influences natural resources and energy consumption and can become a significant driver of land conversion and environmental change. Understanding the influence of tourist-related activities is vital for sustainable tourism development. We chose Hainan Island in South China as a research area to study the influence of tourist-driven activities on environmental variables (as Land Surface Temperatures (LST) and related ecosystem variables) during the period of 2000 to 2019. In Hainan, the local economy relies heavily on tourism, with an ever-growing influx of tourists each year. We categorised location-based points of interest (POIs) into two classes, non-tourism sites and tourism-related sites, and utilised satellite data from the cloud-based platform Google Earth Engine (GEE) to extract LST and Normalized Difference Vegetation Index (NDVI) data. We analysed the LST variations, NDVI changes and the land use/land cover (LULC) changes and compared the relative difference in LST and NDVI between the tourism-related sites and non-tourism-related sites. The main findings of this study were: (1) The median LST in the tourism-related sites was relatively higher (1.3) than the LST in the non-tourism-related sites for the 20 years. Moreover, every annual mean LST of tourism-related sites was higher than the LST values in non-tourism-related sites, with an average difference of 1.2 °C for the 20 years and a maximum difference of 1.7 °C. We found higher annual LST anomalies for tourist-related sites compared to non-tourism sites after 2010, which indicated the likely positive differences in LST above the average LST during 20 years for tourism-related sites when compared against the non-tourism related sites, thus highlighting the potential influence of tourism activities on LST. (2) The annual mean NDVI value for tourism-related sites was significantly lower than for non-tourism places every year, with an average NDVI difference of 0.26 between the two sites. (3) The land cover changed significantly: croplands and forests reduced by 3.5% and 2.8% respectively, while the areas covered by orchards and urban areas increased by 2% and 72.3% respectively. These results indicate the influence of the tourism-driven activities includes the relatively high LST, vegetation degradation and land-use conversion particular to urban cover type. The outcome of this work provides a method that combines cloud-based satellite-derived data with location-based POIs data for quantifying the long-term influence of tourism-related activities on sensitive coastal ecosystems. It contributes to designing evidence-driven management plans and policies for the sustainable tourism development in coastal areas.
1. Introduction
Globally, coastal ecosystems are recognised for their rich biodiversity, abundant natural resources and ambient atmosphere, which makes them attractive for tourism, education and leisure activities. Human activities in these areas focus on the exploitation of natural resources, development of marine transport and food production. Unfortunately, these activities contribute to the degradation of aquatic and terrestrial ecosystems. Human activities are a significant cause of the irreversible loss of biodiversity, vegetation degradation, changes in land surface temperature and water and soil pollution [1,2,3]. Tourism-related activities might include the expansion of accommodation facilities, growth of farmlands and other food production industries, development of transport and energy infrastructure to support trade, and tourism and leisure activities. It is universally acknowledged that tourism positively impacts economic development by providing employment opportunities, promoting the development of other supporting industries, and fostering the transformation of socio-economic structures [4,5,6]. The tourism industry is, therefore, a major source of revenue, employment, and a foreign exchange earner for the local economy in many countries [7,8]. However, the tourism-based development is a double-edged sword as it both positively influences the livelihoods of local communities while also adversely affecting the local ecosystem and environment [9,10,11,12].
Research on the influence of tourism on the environment has predominantly focused on integrated tourism management [13,14], the influence of tourism on forest reserves [15,16], the link between tourism and urbanisation [5], wild habitats preservation [17,18,19] and land use and land cover (LULC) transformation [20]. Tourism development could also affect air quality and increase climate variabilities [21,22,23,24]. The current Coronavirus disease (Covid-19) pandemic continues to threaten global tourism development by limiting the flow of tourist into traditional attractions [25,26]. Interestingly, the Covid-19 related restrictions have provided an opportunity for the restoration of environment, for instance, preliminary studies have associated improved air quality, reduced water pollution, reduction in land surface temperature (LST) and noise level in many countries [25,26,27,28]. Theoretical frameworks have been developed to assess the environmental impact of human tourism activities, e.g., carbon emission, heavy-metal concentrations and Urban Heat Island (UHI) effects [29]. However, there is seldom research that compares the specific influence of tourism-related activities on multiple onsite environmental and ecological effects.
In studying the influence of human activities on LST changes and related ecological effects, commonly, the general influence of human activities is considered rather than attributing the changes to specific anthropogenic activity. There are a few examples that have attempted to link LST to LULC, human settlement construction, urban sprawl and UHI, and to connect land cover changes and Surface Urban Heat Island (SUHI) [30,31,32,33,34,35,36,37,38,39,40]. Similarly, the correlation between the urbanization-driven land cover change and LST patterns was analysed in a case study in an inner-city area of Hanoi [30]. In addition, Xiao and Weng found out that changes in LST were mainly associated with the changes in the construction material [31]. The research on urban heat island and LST continues to be of global interest [32,33,34]. The mutual relationships between the LST, vegetation and human settlements were assessed in a rapidly urbanising city: Phoenix city in the USA [35]. In addition, the relationship between LST, UHI, urbanisation and socio-economic and socio-ecological variables has also been studied [36,37,38]. Furthermore, it has been shown that there is a positive link between LST rising and the general human modification activities defined in the Human Modification datasets [39]. By adopting Google Earth Engine (GEE) to process the huge and increasing Earth Observation (EO) Big Data, the long-term and large-scale spatio-temporal SUHI changes were monitored and their connection with land cover change was studied in the six metropolitan areas in the U.S., which also pave a way for a global service on SUHI monitoring [40].
Considering the ensuing studies, few studies have focused on the specific influence of tourism-related activities on the LST and its related ecological effects. The purpose of the current study is therefore to assess the influence of tourism-related activities on LST and related ecological effects, by comparing the difference of the ecological variables in locations characterized by tourism and non-tourism related activities. The motivation of this work is in the fact that coastal islands, despite being attractive tourist destinations due to their unique seaside views and warm temperatures, are extremely vulnerable to degradation resulting from the impact of tourists [41,42,43]. Marginal fluctuations in LST in the coastal islands can have far-reaching effects on the indigenous biodiversity of the islands. In addition, tourism-related pollution and degradation of indigenous vegetation can affect the carbon sequestration potential of the coastal forests and thus aggravate the influence of climate change. Therefore, the research on identifying the ecological influence of tourism activities on coastal islands is imperative to environment conservation and sustainable ecosystem development.
In this study, we focused on the specific influence of tourism-related activities on the LST and their related ecological effects. We chose Hainan Island (Hainan province) as the research area as it is one of the most popular tourist destinations in China. Apart from this work, related studies on the island have looked at the influence of tourism-related activities on the urbanisation process and the environment in Sanya, a tourist destination city on Hainan Island [20]. Another study looked at the patterns of urban heat islands during peak tourism seasons in Sanya city [44]. Data constraints have limited previous studies to single cities or small areas of the island. Cloud-based platforms like GEE provide multi-source data catalogues for geospatial analysis and the extensive computational capabilities to deal with a variety of societal and environmental issues at large scales [45]. We used GEE and a desktop-based GIS tools for data processing and analysis in this research. Location-based points of interest (POIs) data can be used for sensing human activities, land use management and other location-based applications [46,47], and in particular, POI data was used to identify tourism related sites in this study. Specifically, we used the spatio-temporal LST, Normalized Difference Vegetation Index (NDVI), and land-use change data to assess the ecological effects resulting from tourism-related activities on the entire Hainan Island. We adopted LST and NDVI data from Moderate Resolution Imaging Spectroradiometer (MODIS) archives within GEE and combined these with land cover data for further analysis. POIs from the Amap platform were classified into two classes to represent tourism-related sites and non-tourism-related sites. For the tourism-related POIs, four sub-classes were used to analyse the relative influence of various categories of tourism-related place types on LST.
2. Study Area and Data Source
2.1. Study Area
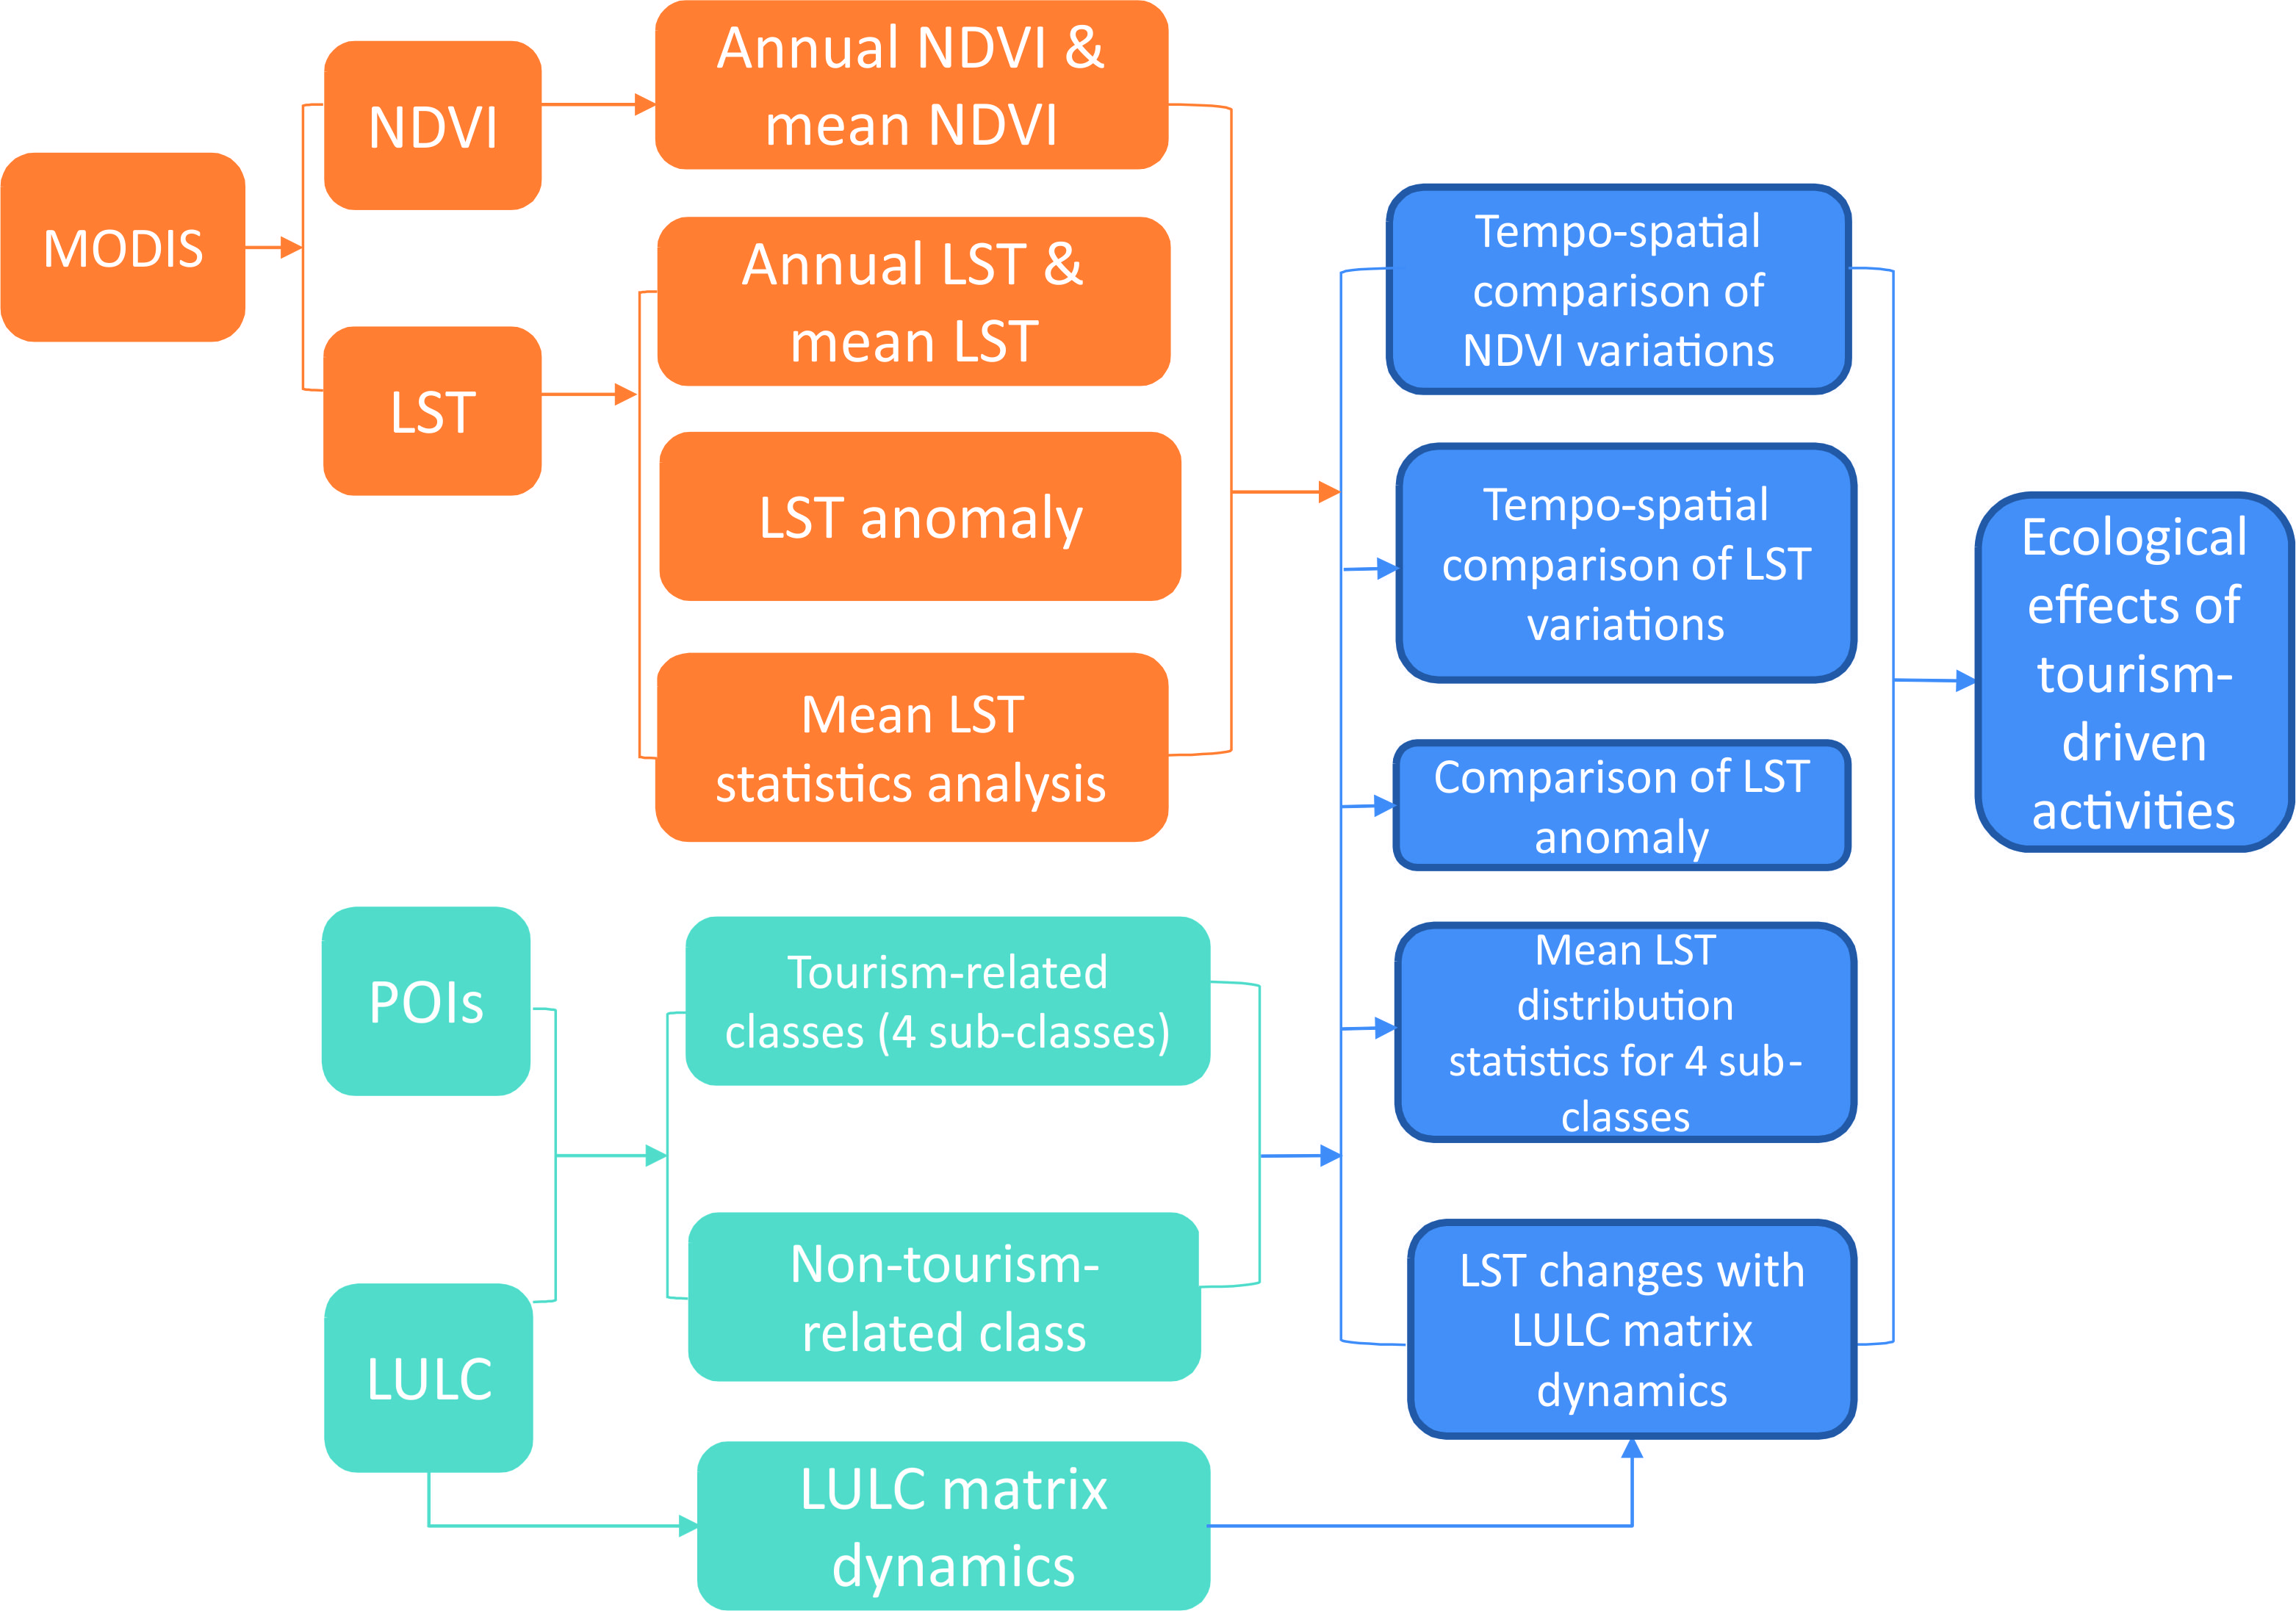
Hainan Island is the second-largest island in China and is the southernmost province of China (Figure 1). Hainan Island, with an area of approximately 35,354 km2 and a population of about 9.34 million people (in 2018), lies within latitudes 18°10′–20°10′N and longitudes 108°37′–111°03′E. Hainan’s development and rapid economic growth are dependent on the flourishing tourism sector [44]. In the past decade, the annual number of tourists visiting Hainan rose from 10 million in 2000 to 76 million in 2018 [48]. Tourism earnings for the whole island in 2018 was 950.16 million CNY, which accounted for nearly 20% of the Gross Domestic Products (4832.05 million CNY) [48]. The increase in domestic and international tourists has led to an increase in tropical fruit planting, construction of residential real estate and hotels, increasing numbers of restaurants, recreation facilities, the modernisation of transport and energy production infrastructure to host the needs of eating, living, shopping, recreation and travel of tourists, as well as new immigration.
2.2. Data Source
The primary datasets in this work are MODIS Terra LST products, MODIS Terra Vegetation Indices (VI) products, Land use/land cover data, and POIs from the Amap platform (http://wap.amap.com) [49,50,51,52]. The LST and VI products from MODIS data were pre-processed in GEE. A combination of POIs and land-use data was used for sampling the tourist and non-tourism-related sites. Administration data were used mainly to provide geographic referencing of the study area. The 19 years of population distribution data in Hainan Island were collated from annual yearbooks of the National Bureau of Statistics. The primary datasets in this study are outlined in Table 1.
The MODIS Terra Land Surface Temperature and Emissivity 8-Day archive in GEE was used to calculate the long-term mean LST image and the annual mean LST images for the period of 2000 to 2019. The MODIS Terra Vegetation Indices 16-Day products from GEE were the primary data source to calculate the annual mean NDVI images and the long-term mean NDVI image by pixel for the research period. The POIs data and land use/cover data were used to categorise the tourism-related sites and non-tourism-related sites. POI data were extracted from the Amap Open Platform, one of the largest navigation map websites in China. These POIs provided location-based geographic information and other detailed information for each geographic element on the map. Land use data for the year 2000 and 2018, from the Resource and Environment Data Cloud Platform of the Chinese Academy of Sciences, were used to analyse the land-use changes and extract sites with changing land use patterns driven by tourism development.
3. Methodology
3.1. Data Pre-Processing
3.1.1. Retrieval of NDVI and LST Images from GEE
LST and NDVI products were retrieved from the archives of GEE. The pre-processing step included filtering the required data from the LST and NDVI archives in GEE and clipping the data to the outline of the study area. In each case, the data were filtered from January 2000 to December 2019. For both the LST and the NDVI, annual mean images and long-term mean images for each product were calculated. In addition, the long-term per pixel mean LST was calculated to aid in computing the annual LST anomalies.
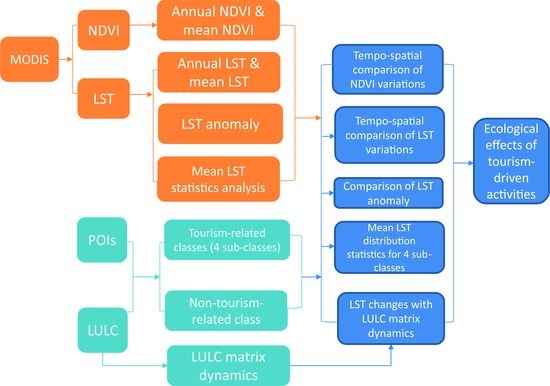
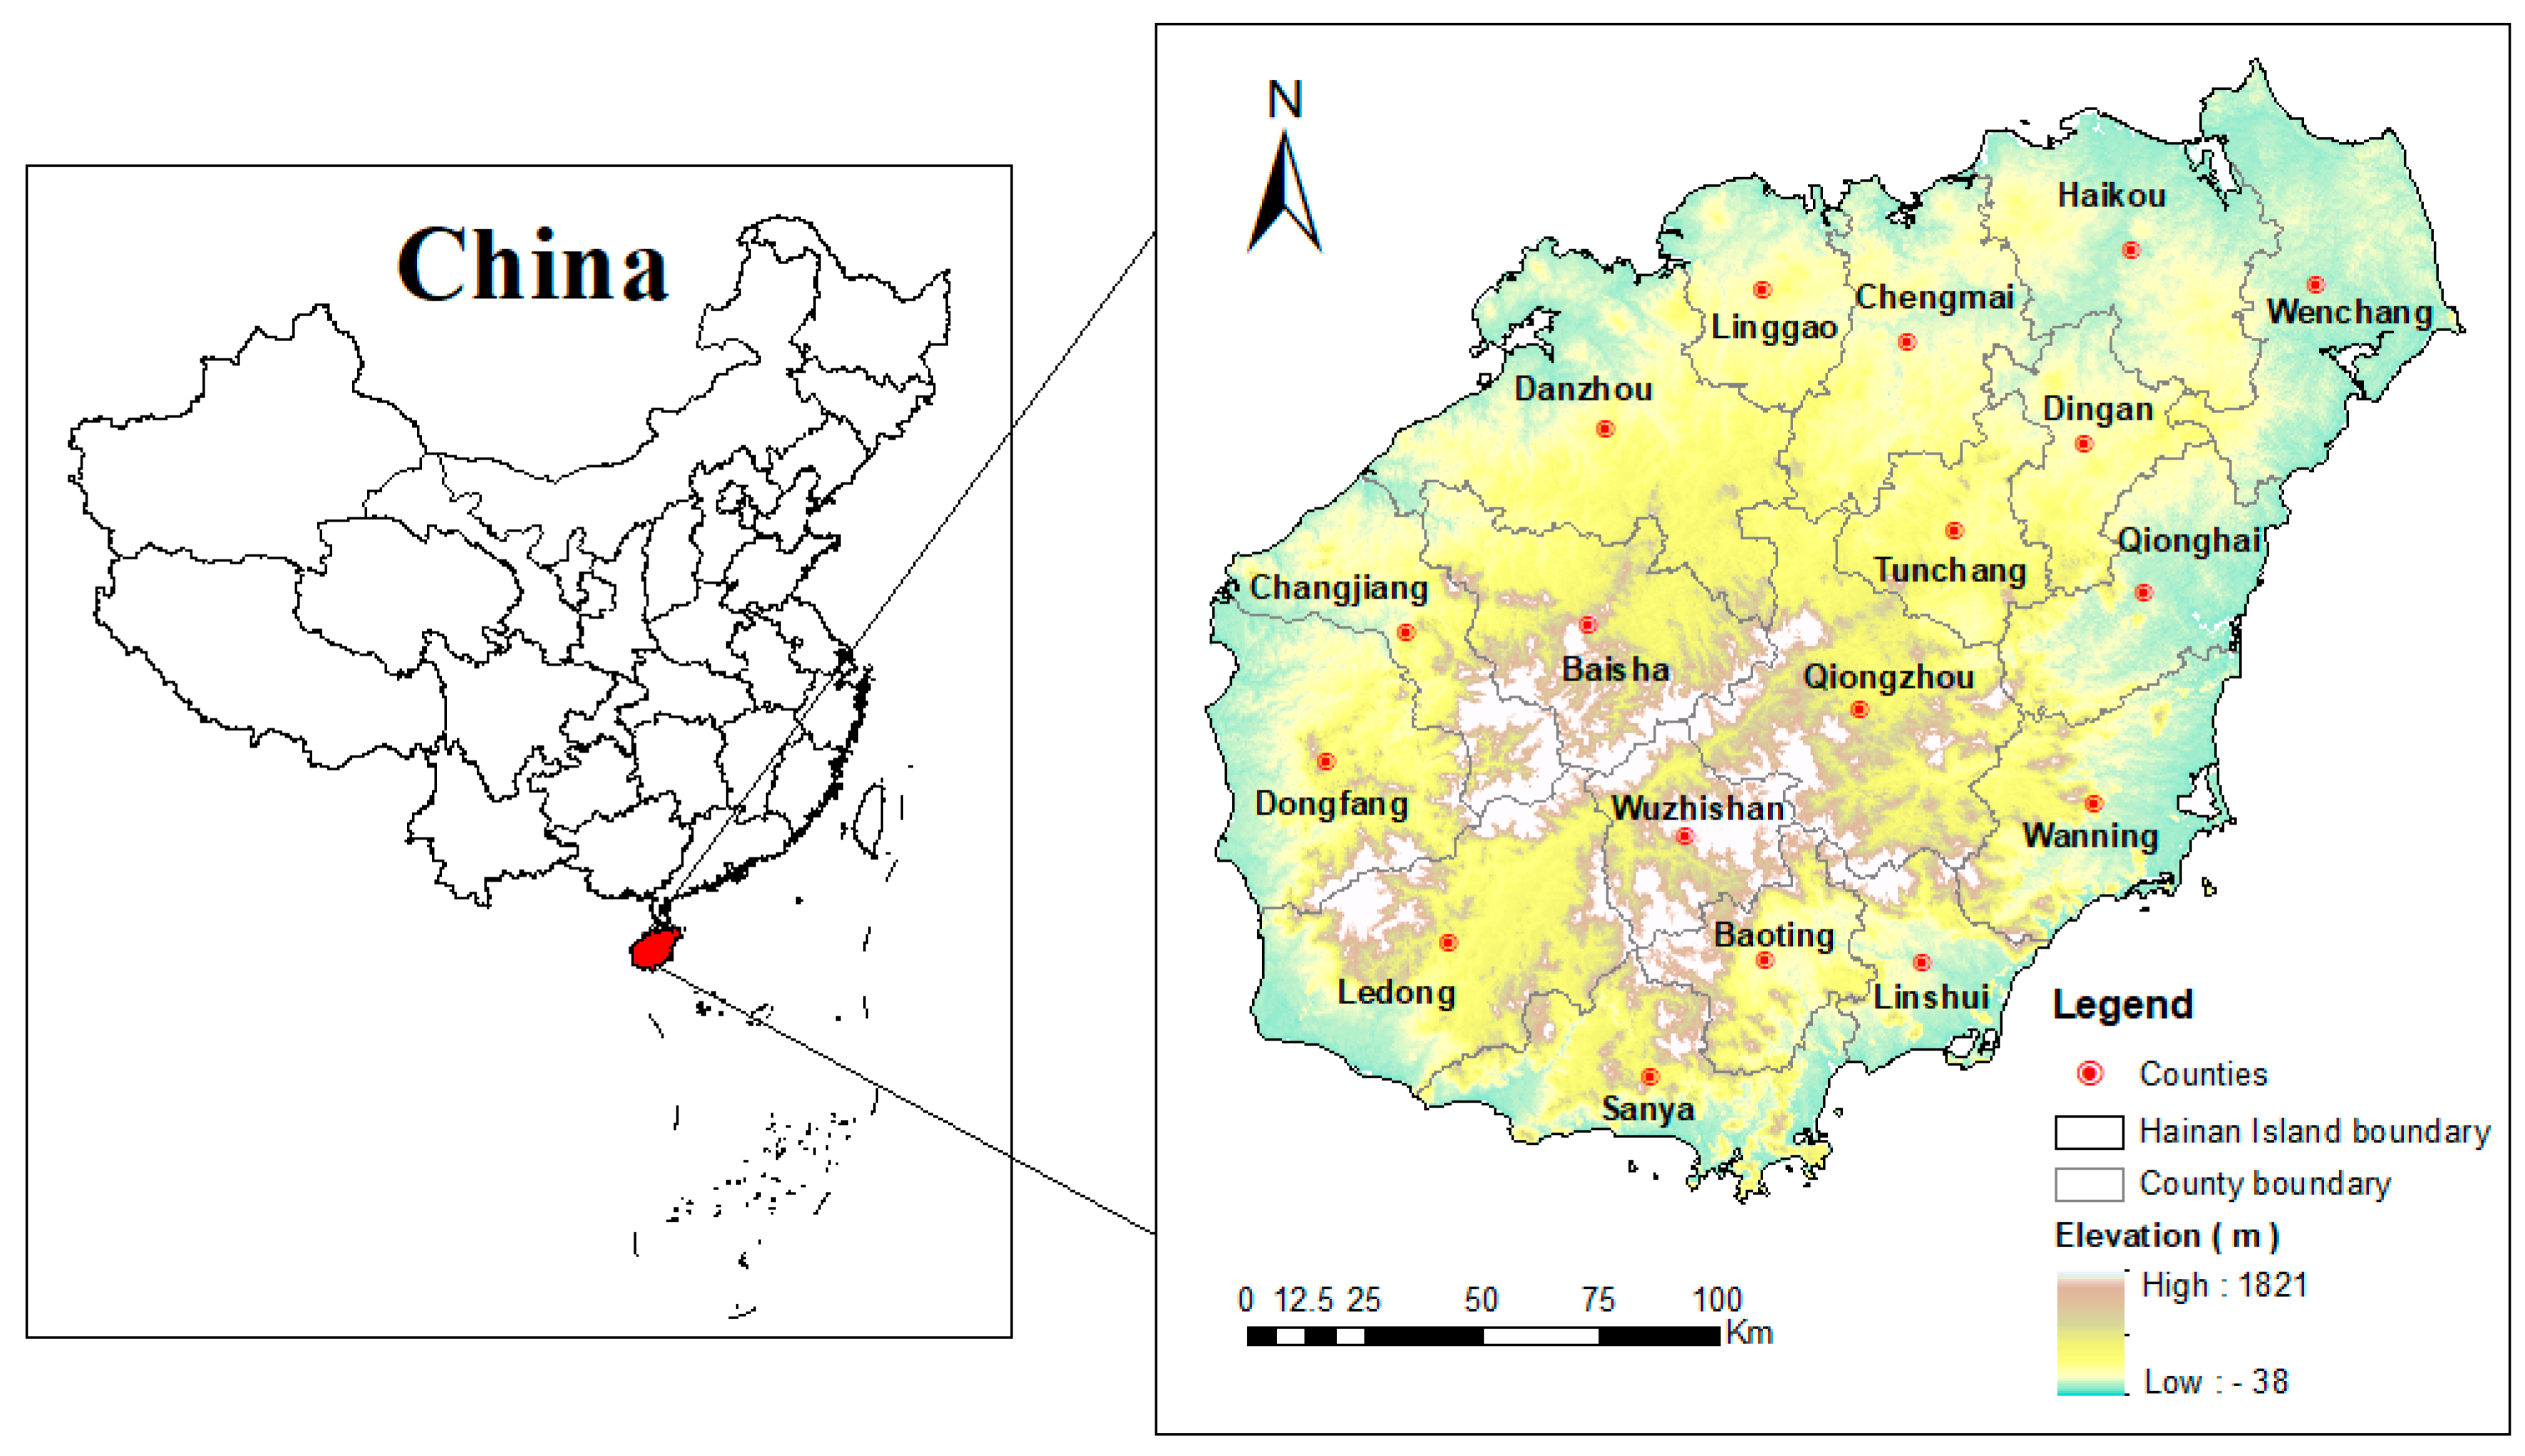
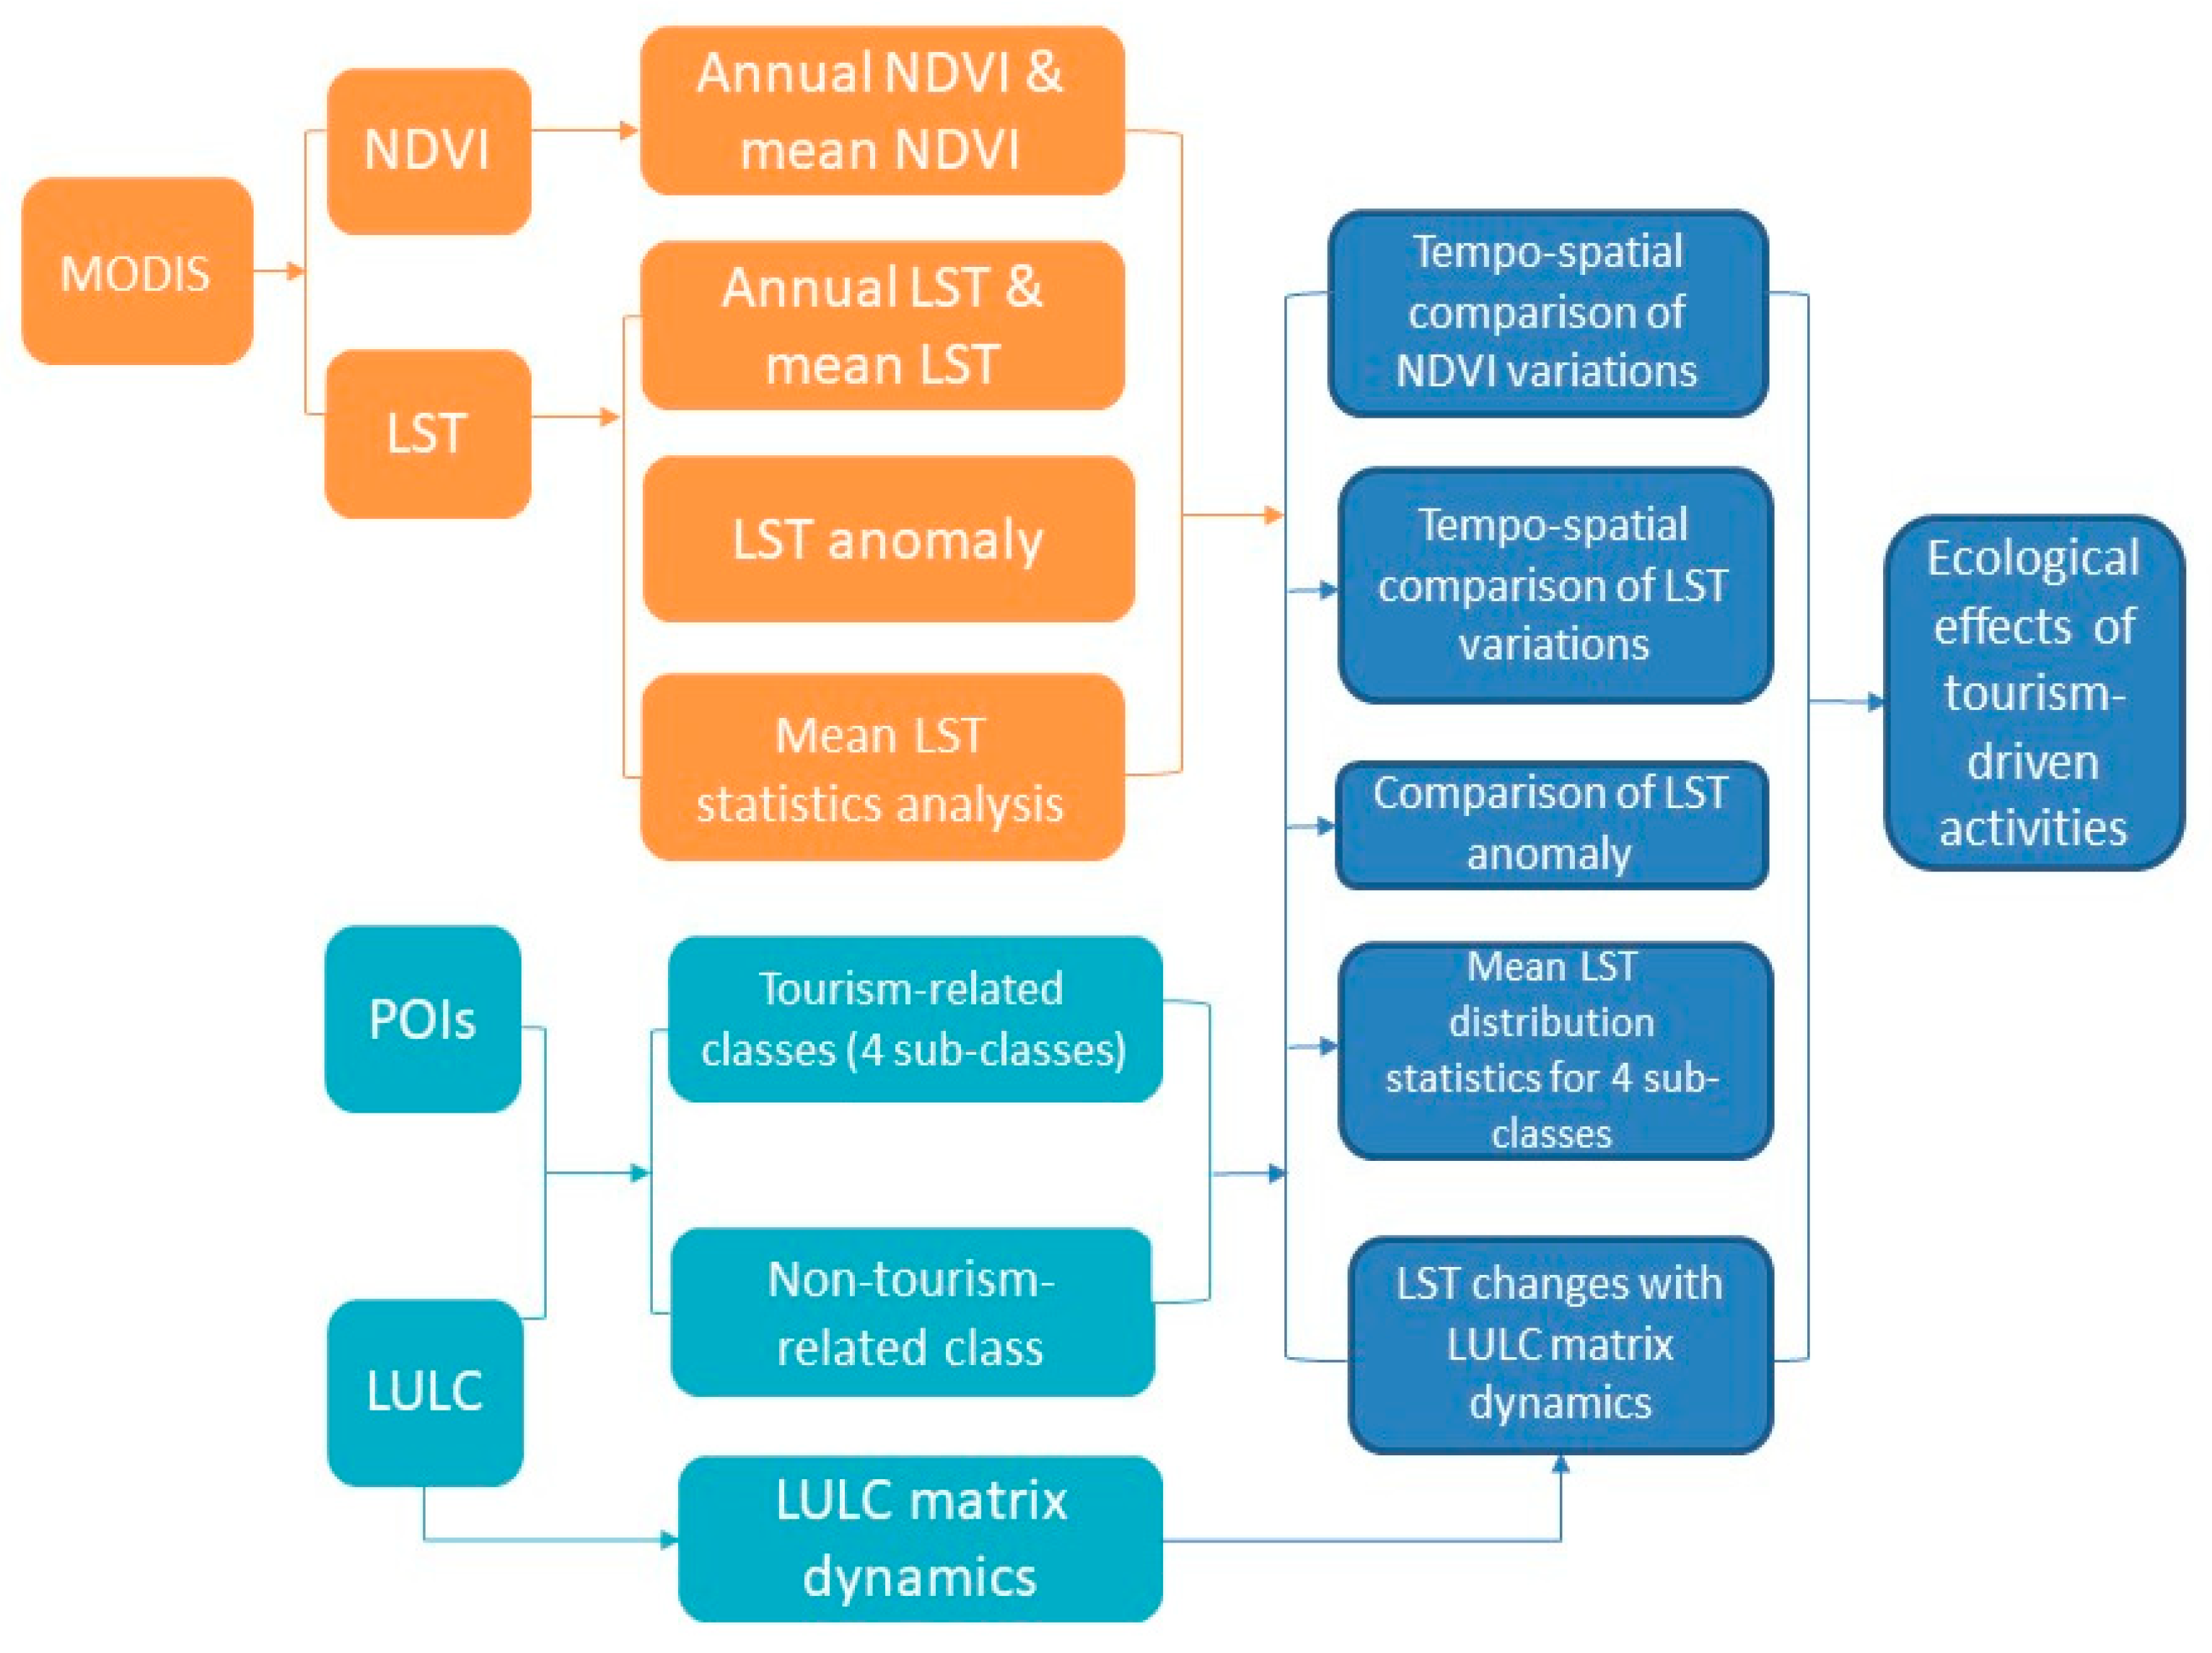
Specifically, we used MODIS Terra 8-day LST as the source of LST data. For the NDVI, we used MODIS Terra Vegetation 16-day indices in GEE. 913 LST images were retrieved and used as part of the LST image collection, and 457 NDVI images were retrieved and used as part of the NDVI image collection. The LST anomaly images were calculated based on the long-term mean and annual mean images, which is illustrated in the following Section 3.3. The pre-data processing steps are indicated by the orange boxes in the workflow schema shown in Figure 2.
3.1.2. Classification of POIs into Tourism-Related and Non-Tourism-Related Sites
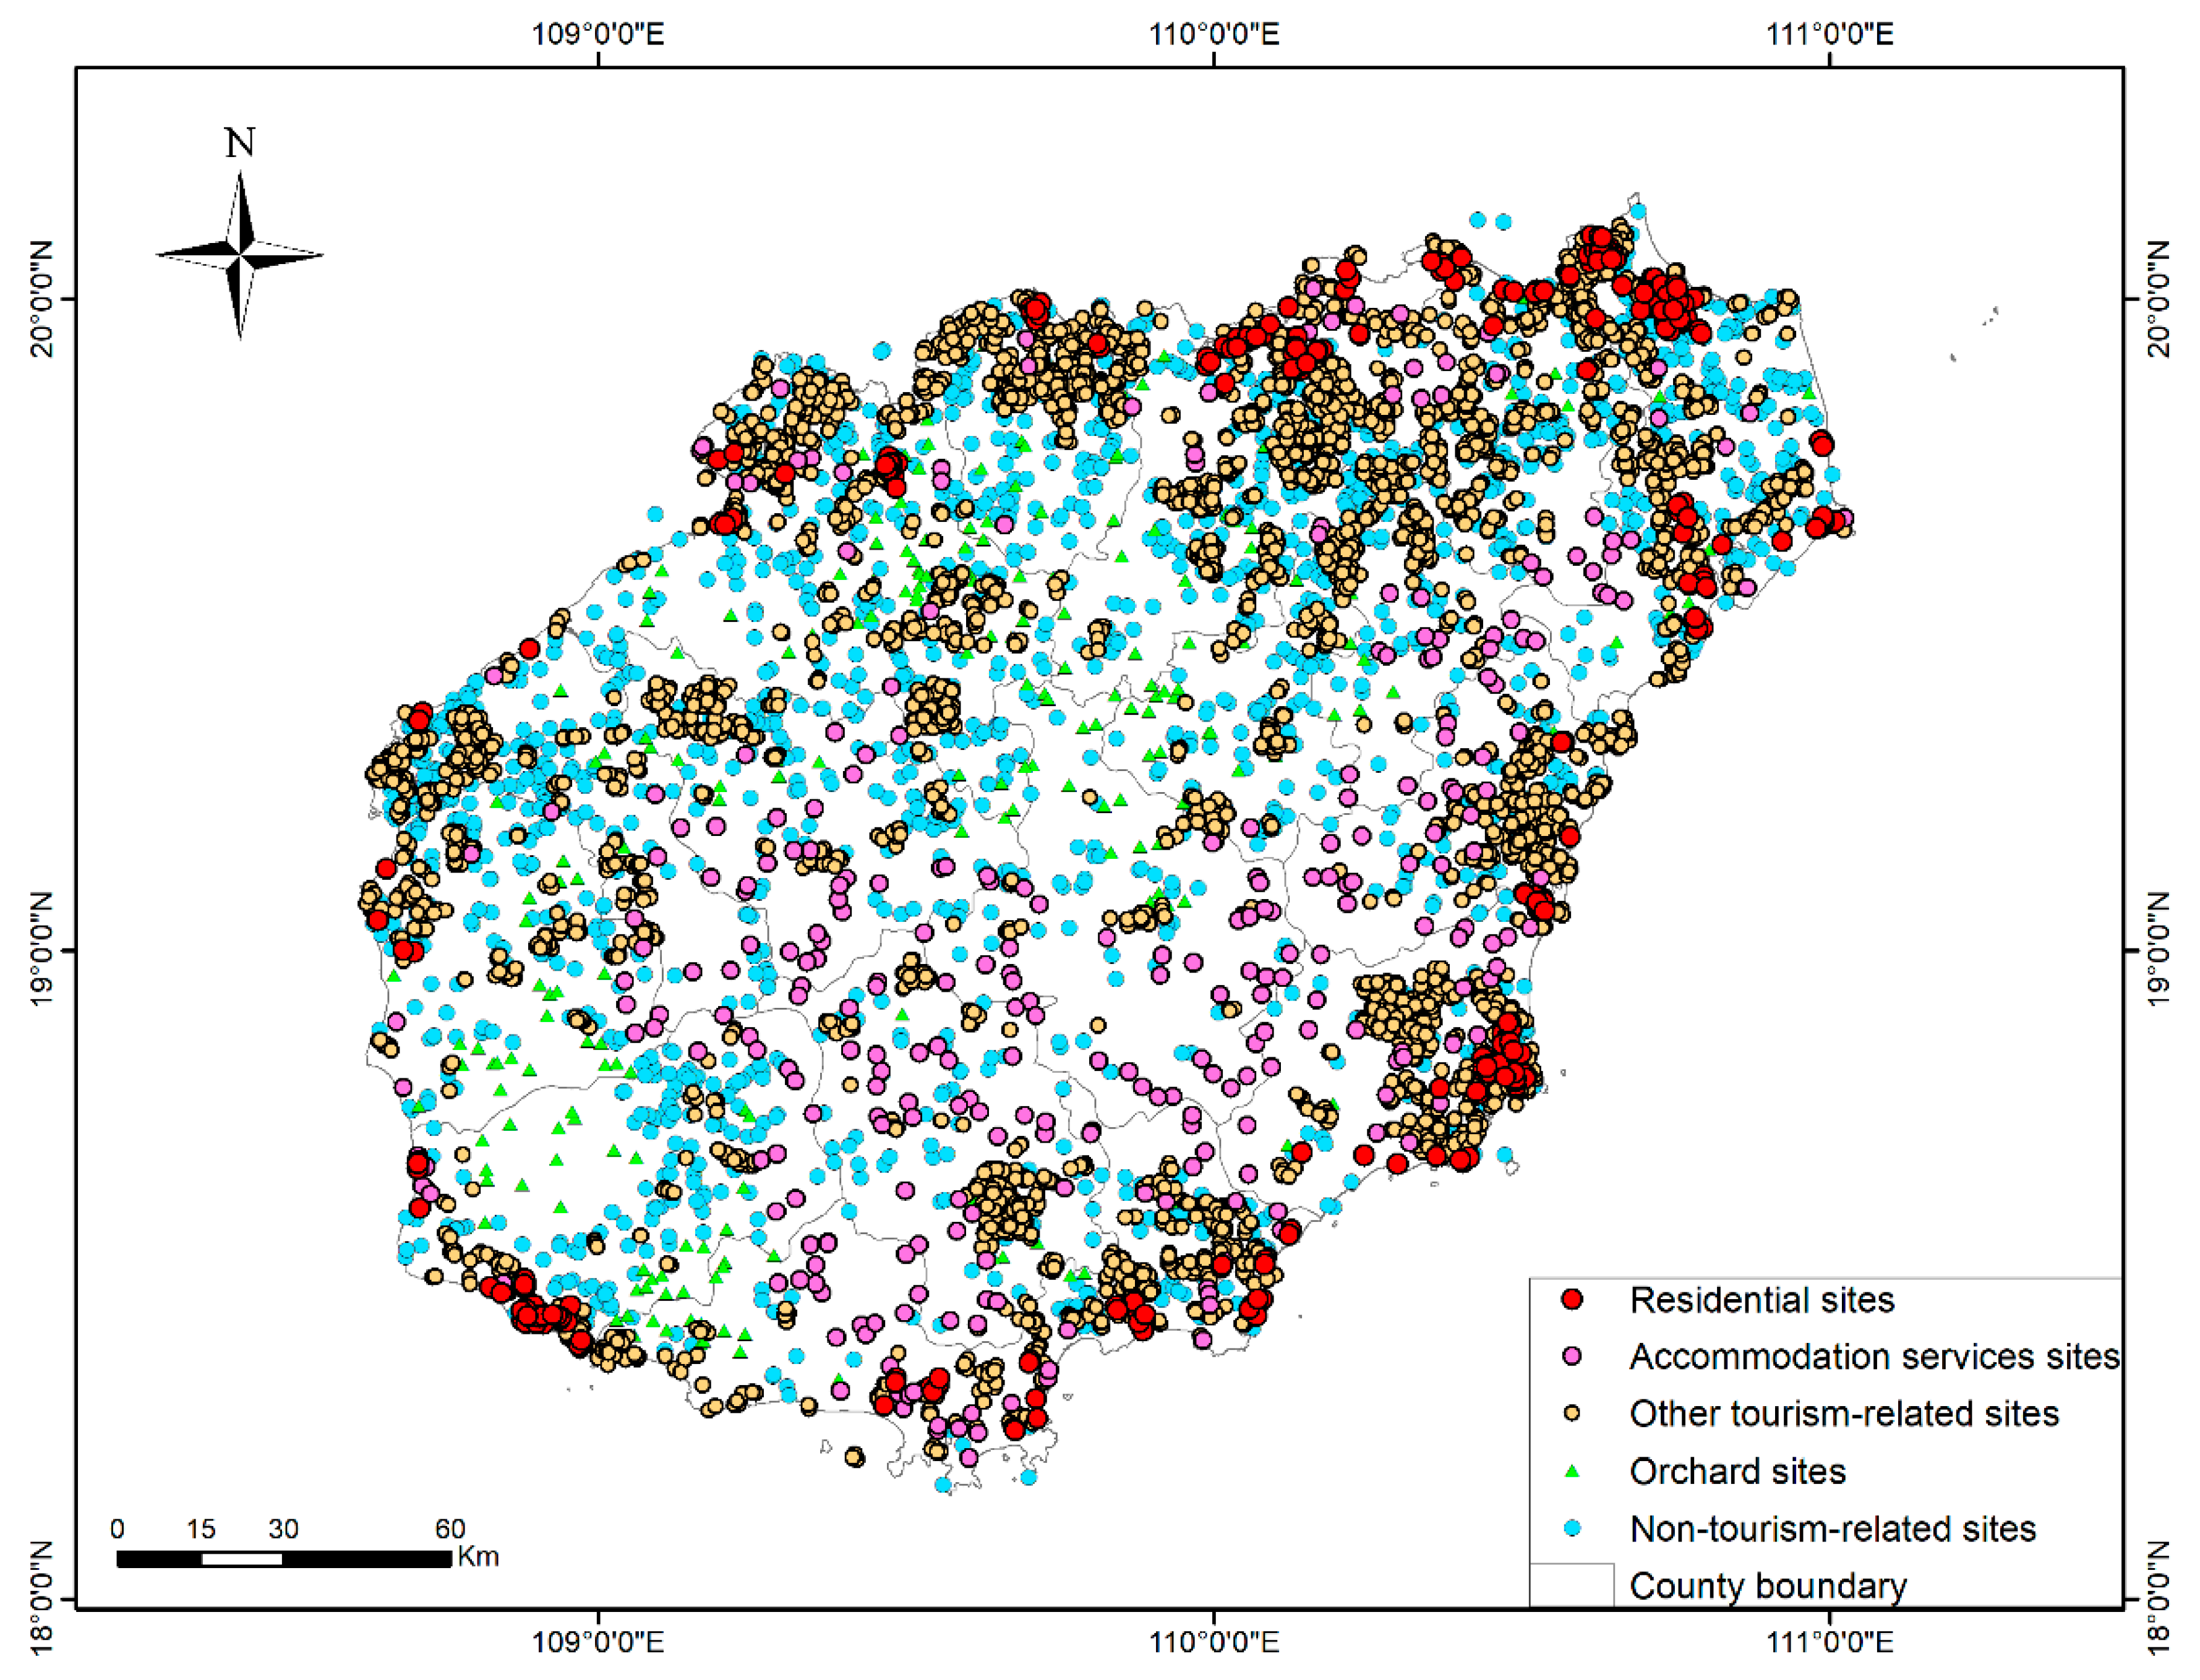
Two main place types were categorised from the POIs data; these were tourism-related sites and non-tourism-related sites. In addition, the tourism-related POIs were further divided into four sub-classes. The categorisation of the tourism-related sites and non-tourism-related sites was based on the intersection between POIs and land-use classes. According to the functions of POIs and the land-use data, we defined four sub-classes: ‘residential sites along shorelines’, ‘accommodation service sites’, ‘other tourism-related sites’ and ‘orchard’ sites (Table 2). The first three sub-classes mainly encompass POIs for which information was filtered using tourism-related keywords.
Specifically, ‘orchard sites’ are the land-use patches that were converted from cultivated land and forest land in 2000 into orchards in 2018 to meet the tourists’ demand for tropical fruits, according to the previous study in Hainan [20]. The ‘Residential sites along shorelines’ sub-class contains the construction sites of real estate to facilitate the housing of the “migratory-bird tourists” or “migratory-bird population”, who purchased apartments in Hainan and regularly spent the winter months in Hainan but left again in summer each year; this category of tourist is classified as new immigration. Based on the previous study in which residential sites were identified [20], we extracted the ‘residential sites along shorelines’ from the residential POIs within the 10 km buffer along the shoreline and the construction lands which were previously farmlands in the plains along the shoreline. The ‘accommodation service sites’ sub-class includes hotels and other accommodation facilities for hosting short-term tourists. The ‘Accommodation service sites’ sub-class sites were filtered from the POIs information using keywords related to accommodation. The ‘Other tourism-related sites’ sub-class contains the sites that facilitate tourists’ dining, shopping, entertainment and transportation needs. These sub-class sites were chosen from the POIs that contained ‘cultural service places’, ‘museums’, ‘theatres’, ‘shopping centres’, ‘city parks’, ‘transportation’ and other related keywords. ‘Orchard’ sites were extracted from the random points on the land use patches in 2000 and 2018 based on the land use/cover data. The ‘Orchard’ sites sub-class represents the sites where land was transformed from cultivated land and forest in 2000 into orchard in 2018, in order to meet the tourists’ demand for tropical fruits, according to the previous study [20]. There were 2319 tourism-driven sites (including 1879 ‘other tourism-related sites’, 179 ‘residential sites along shorelines’ and 152 ‘accommodation service sites’ 109 ‘orchard sites’) and 1493 non-tourism-driven sites (Table 2).
3.2. LST Variations
We calculated the mean annual temperature from 2000 to 2019 and the long-term mean temperature image for the 20 years from all 913 images. The long-term mean LST was mapped to identify the LST spatial distribution on Hainan Island. The LST variations for the two classes and the four sub-classes of sites were plotted to show the correlation of the LST with tourism-related activities in the 20 years. Specifically, the mean annual LST for the sites of both classes were plotted for each year using line charts to show the LST difference in each year and the LST variations within the two groups for the whole period. The mean temperature distribution of the four sub-class sites in the 20-year period was plotted to compare the relative LST differences within the four function-defined tourism-related sites, which highlights the influence of various types of tourism-related human activities on the LST.
3.3. LST Annual Anomalies and Trends
The long-term mean LST image was calculated based on all 913 8-day LST images from 2000 to 2019. An anomaly is when the conditions depart from average conditions for a chosen area at a given research period. Anomalies have been used to analyse interannual variations of temperature, vegetation and precipitation from long-term mean situations [53]. In this study, annual anomaly images were computed by subtracting the long-term mean LST from the annual mean LST. Therefore, the pixel-based anomaly indicated the geographic variation of each annual LST image from the 20-year mean LST in the study area. The POI data were then used to extract annual LST anomaly data for each tourism-related and non-tourism-related point and then the average annual anomalies for both two groups were plotted, thus allowing for analysis and visualisation of the 20-year changes in the LST anomalies in the tourism and non-tourism-related sites. In addition, trendlines were plotted to show the general trend of changes in LST within tourism-related sites and in non-tourism related sites respectively.
3.4. NDVI Variations
The 457 16-day NDVI images from 2000 to 2019 were used to calculate the long-term mean and annual mean NDVI images for each year in the analysed period. The annual mean NDVI values for the two classes (the tourism-related and non-tourism-related sites) in each year were plotted in a line chart to compare the NDVI discrepancy with the influence of the tourism-related activities in the same year and to show the changing trends in the annual mean NDVI over the 20 year period. The long-term mean NDVI distribution was mapped to show the spatial vegetation variation on Hainan Island in the examined 20 year period.
3.5. LULC Matrix Dynamics
To understand the land-use change dynamics in the study areas, a simple land cover change matrix was computed in Quantum GIS (QGIS) software using the Semi-Automatic Classification Plugin (SCP). The aim of this step was to assess the potential link between tourism-related developments and land cover changes in the study area. The 10 land cover classes included cropland, dense forest, shrubland, sparse forest, orchard, grassland, water, urban area, bare land and wetland. We were particularly interested in the dynamics of land cover transformations in the orchard, urban area and cropland classes. We assumed that land use/land cover transformations from forest and shrubland into orchard was to meet the increasing demand for food and the tropical fruit products consumed by tourists [20]. On the other hand, the transformation of croplands into artificial surfaces was assumed to be indicative of the fast urbanisation, partly boosted by the increasing accommodation demands of new immigrants and “migratory-bird tourists”. They mainly purchased apartments on the plains along the coastline [20,44]. Accordingly, the land use matrix transformation related to the orchard, cropland and urban areas were considered as the indicators of the influence of the tourism-driven activities. We compared the land cover changes and the LST changes on the transformation of land-use types.
3.6. Accuracy Assessment
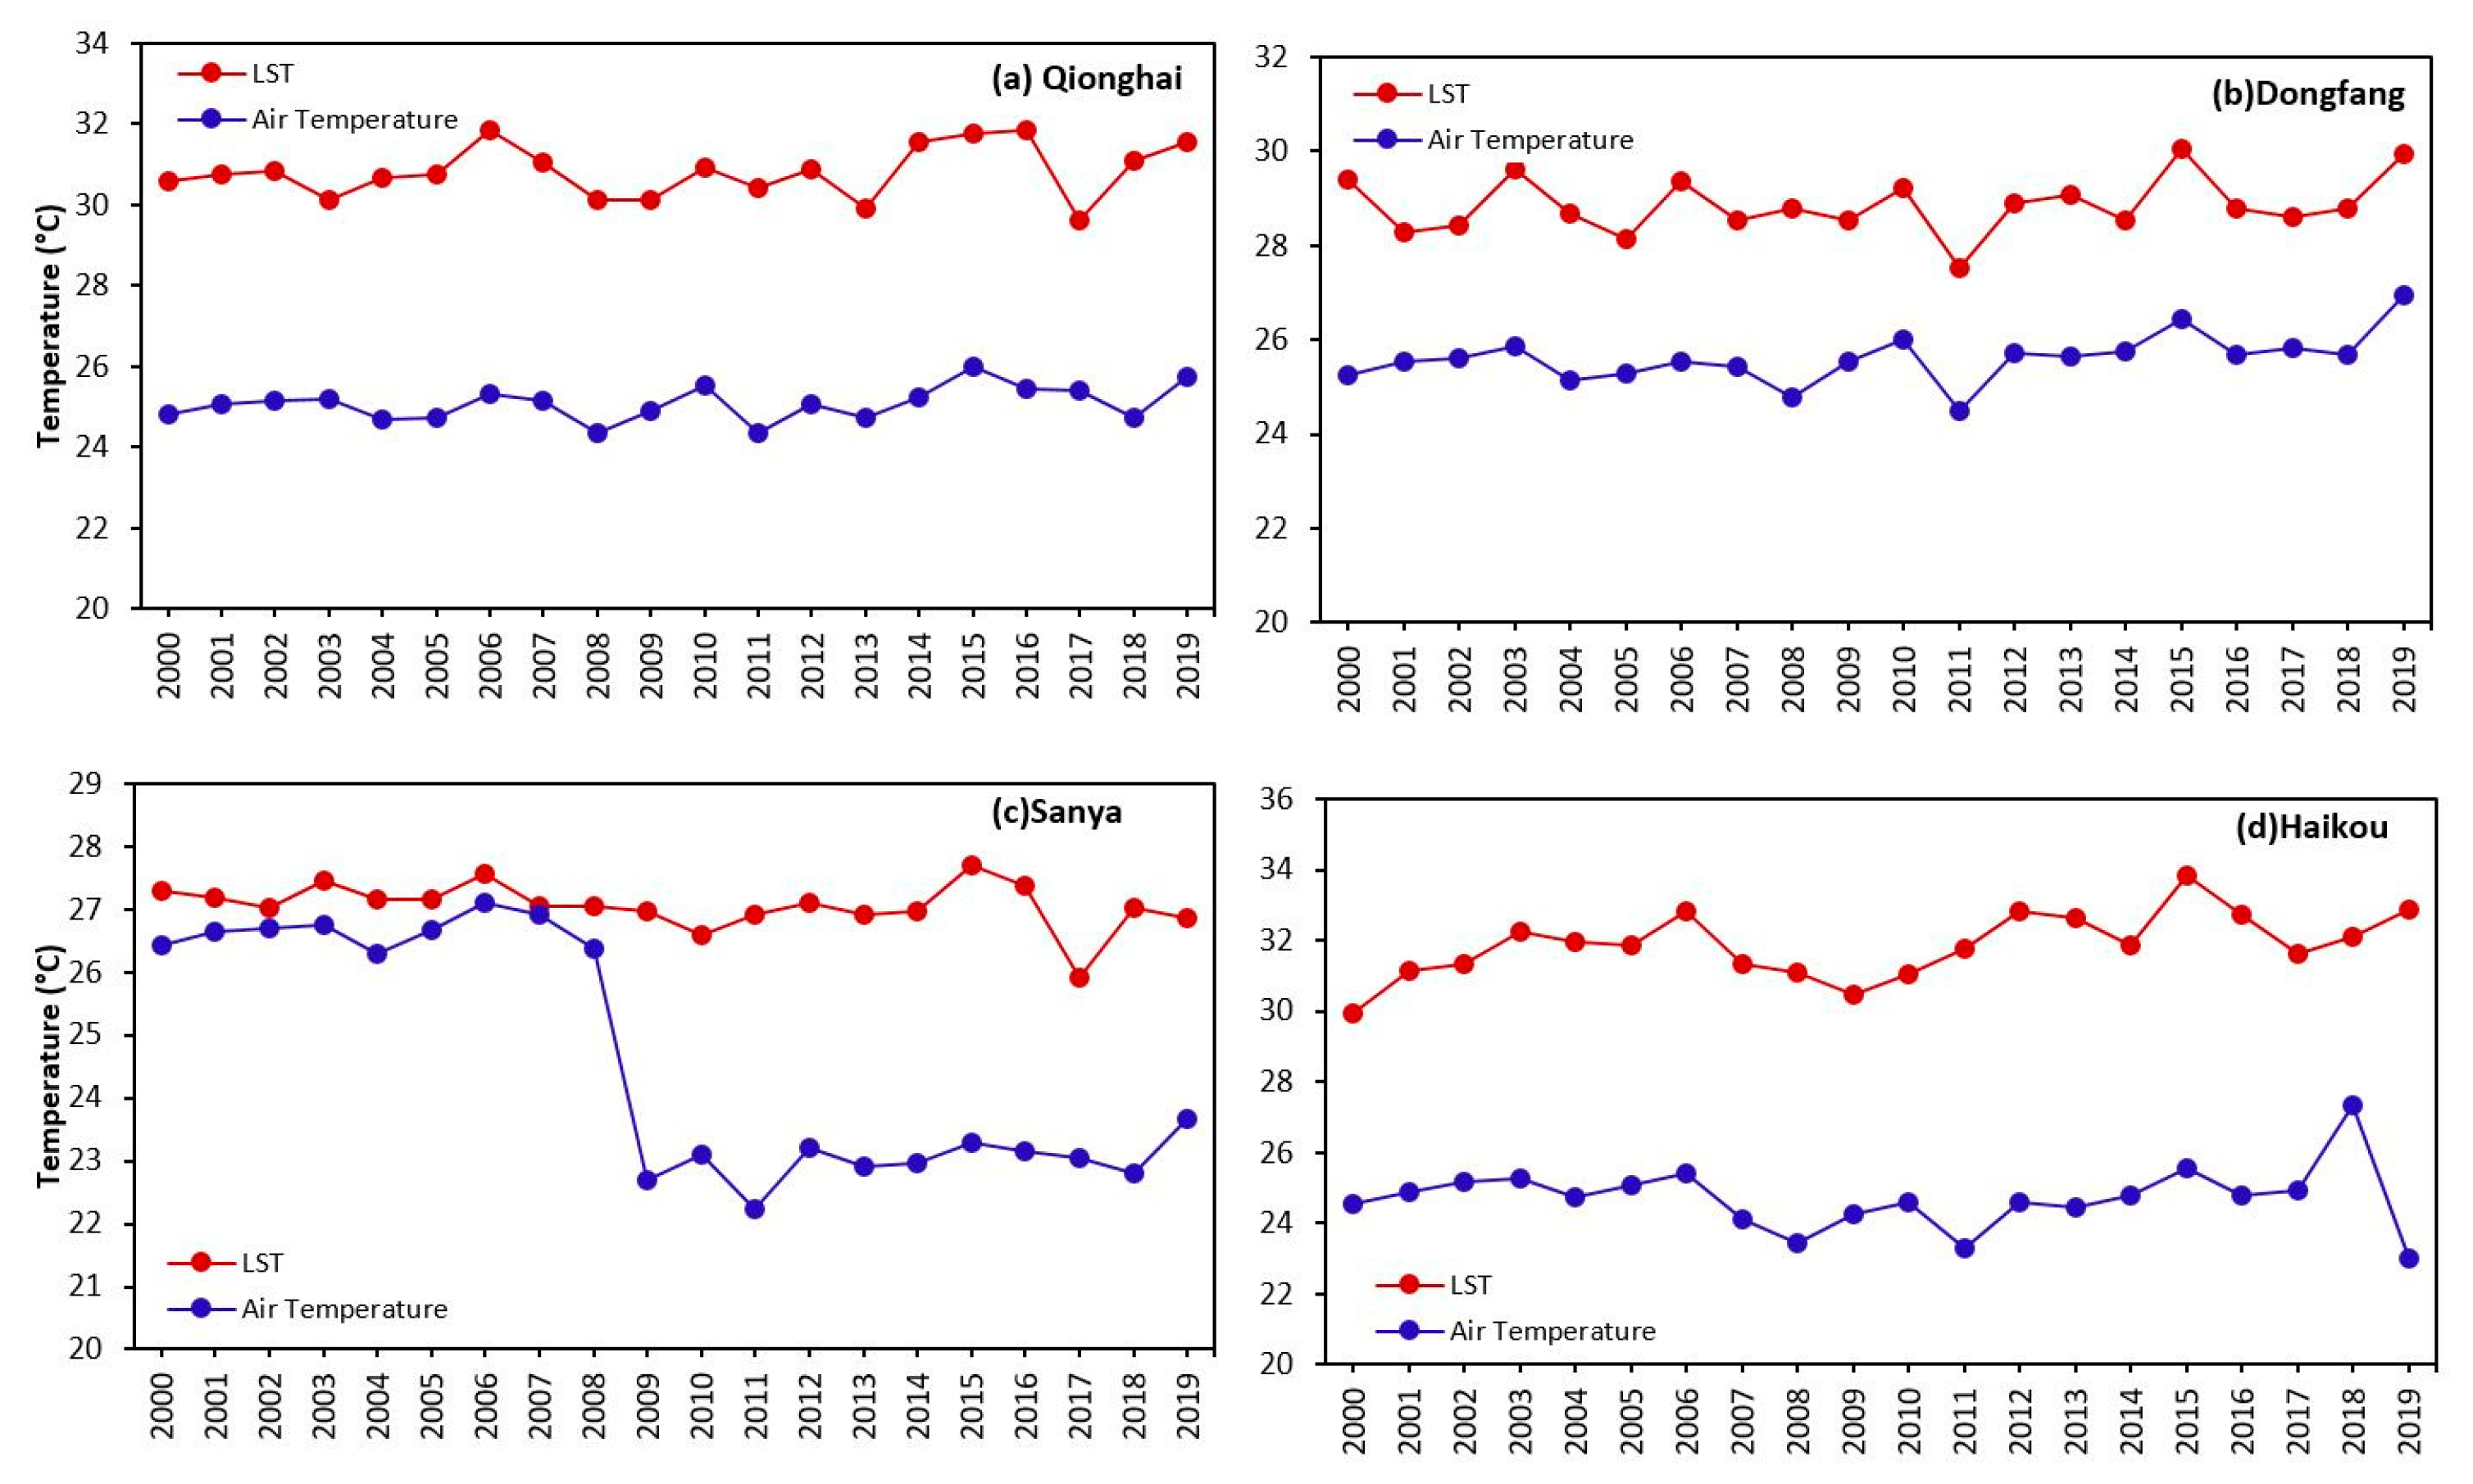
To assess the accuracy of the LST data, which were extracted and calculated from the MODIS archives on GEE, we used in situ air temperature data from four weather stations in Hainan Island. The specific stations were Dongfang, Haikou, Sanya and Qionghai within the island. Air temperature data were available as daily mean values. The daily temperature was aggregated to yearly mean values to make them comparable with the annual mean LST data derived from MODIS. We then extracted LST values from the 20 annual mean LST images at the locations of the four stations. The extracted LST values were then compared against the annual in situ air temperature at the same station. Pearson correlation and root mean square error (RMSE) were used to analyse the accuracy between the two datasets.
For each of the four stations, in situ air temperature was generally lower compared to the MODIS derived LST values. The comparison of in situ air temperature and MODIS derived LST revealed Pearson correlation coefficients of 0.73 (Dongfang station), 0.2 (Haikou station), 0.56 (Qionghai station) and 0.40 (Sanya station), implying a marginal to high positive correlation between satellite-derived LST and observed in situ temperature. Root mean square error (RMSE) values for the variation of LST and in situ temperature in the four stations were 3.28 °C, 7.25 °C, 5.73 °C and 2.97 °C in Dongfang, Haikou, Qionghai and Sanya stations, respectively.
The comparison of MODIS derived LST values with in situ air temperature measurements from four sites on Hainan Island revealed a reasonable agreement between the two data sets (Figure 3), while all four stations showed large variability in yearly mean air temperature and LST values. However, an exact match of both variables could not be expected as LST and air temperature represent different values and variables. In the case of Sanya Station (Figure 3), we observed a significant drop in the air temperatures between 2008 and 2009. While we could not directly explain this abrupt change from the data, other studies have shown a significant negative trend in temperature data from the Sanya station when compared to the data from other stations in South China [54]. For a direct comparison of MODIS LST data with in situ land surface temperature measurements, extensive field campaigns would be necessary, while this approach is not feasible when looking to conduct a study covering a long time period.
4. Results
4.1. Hainan Island Population Changes
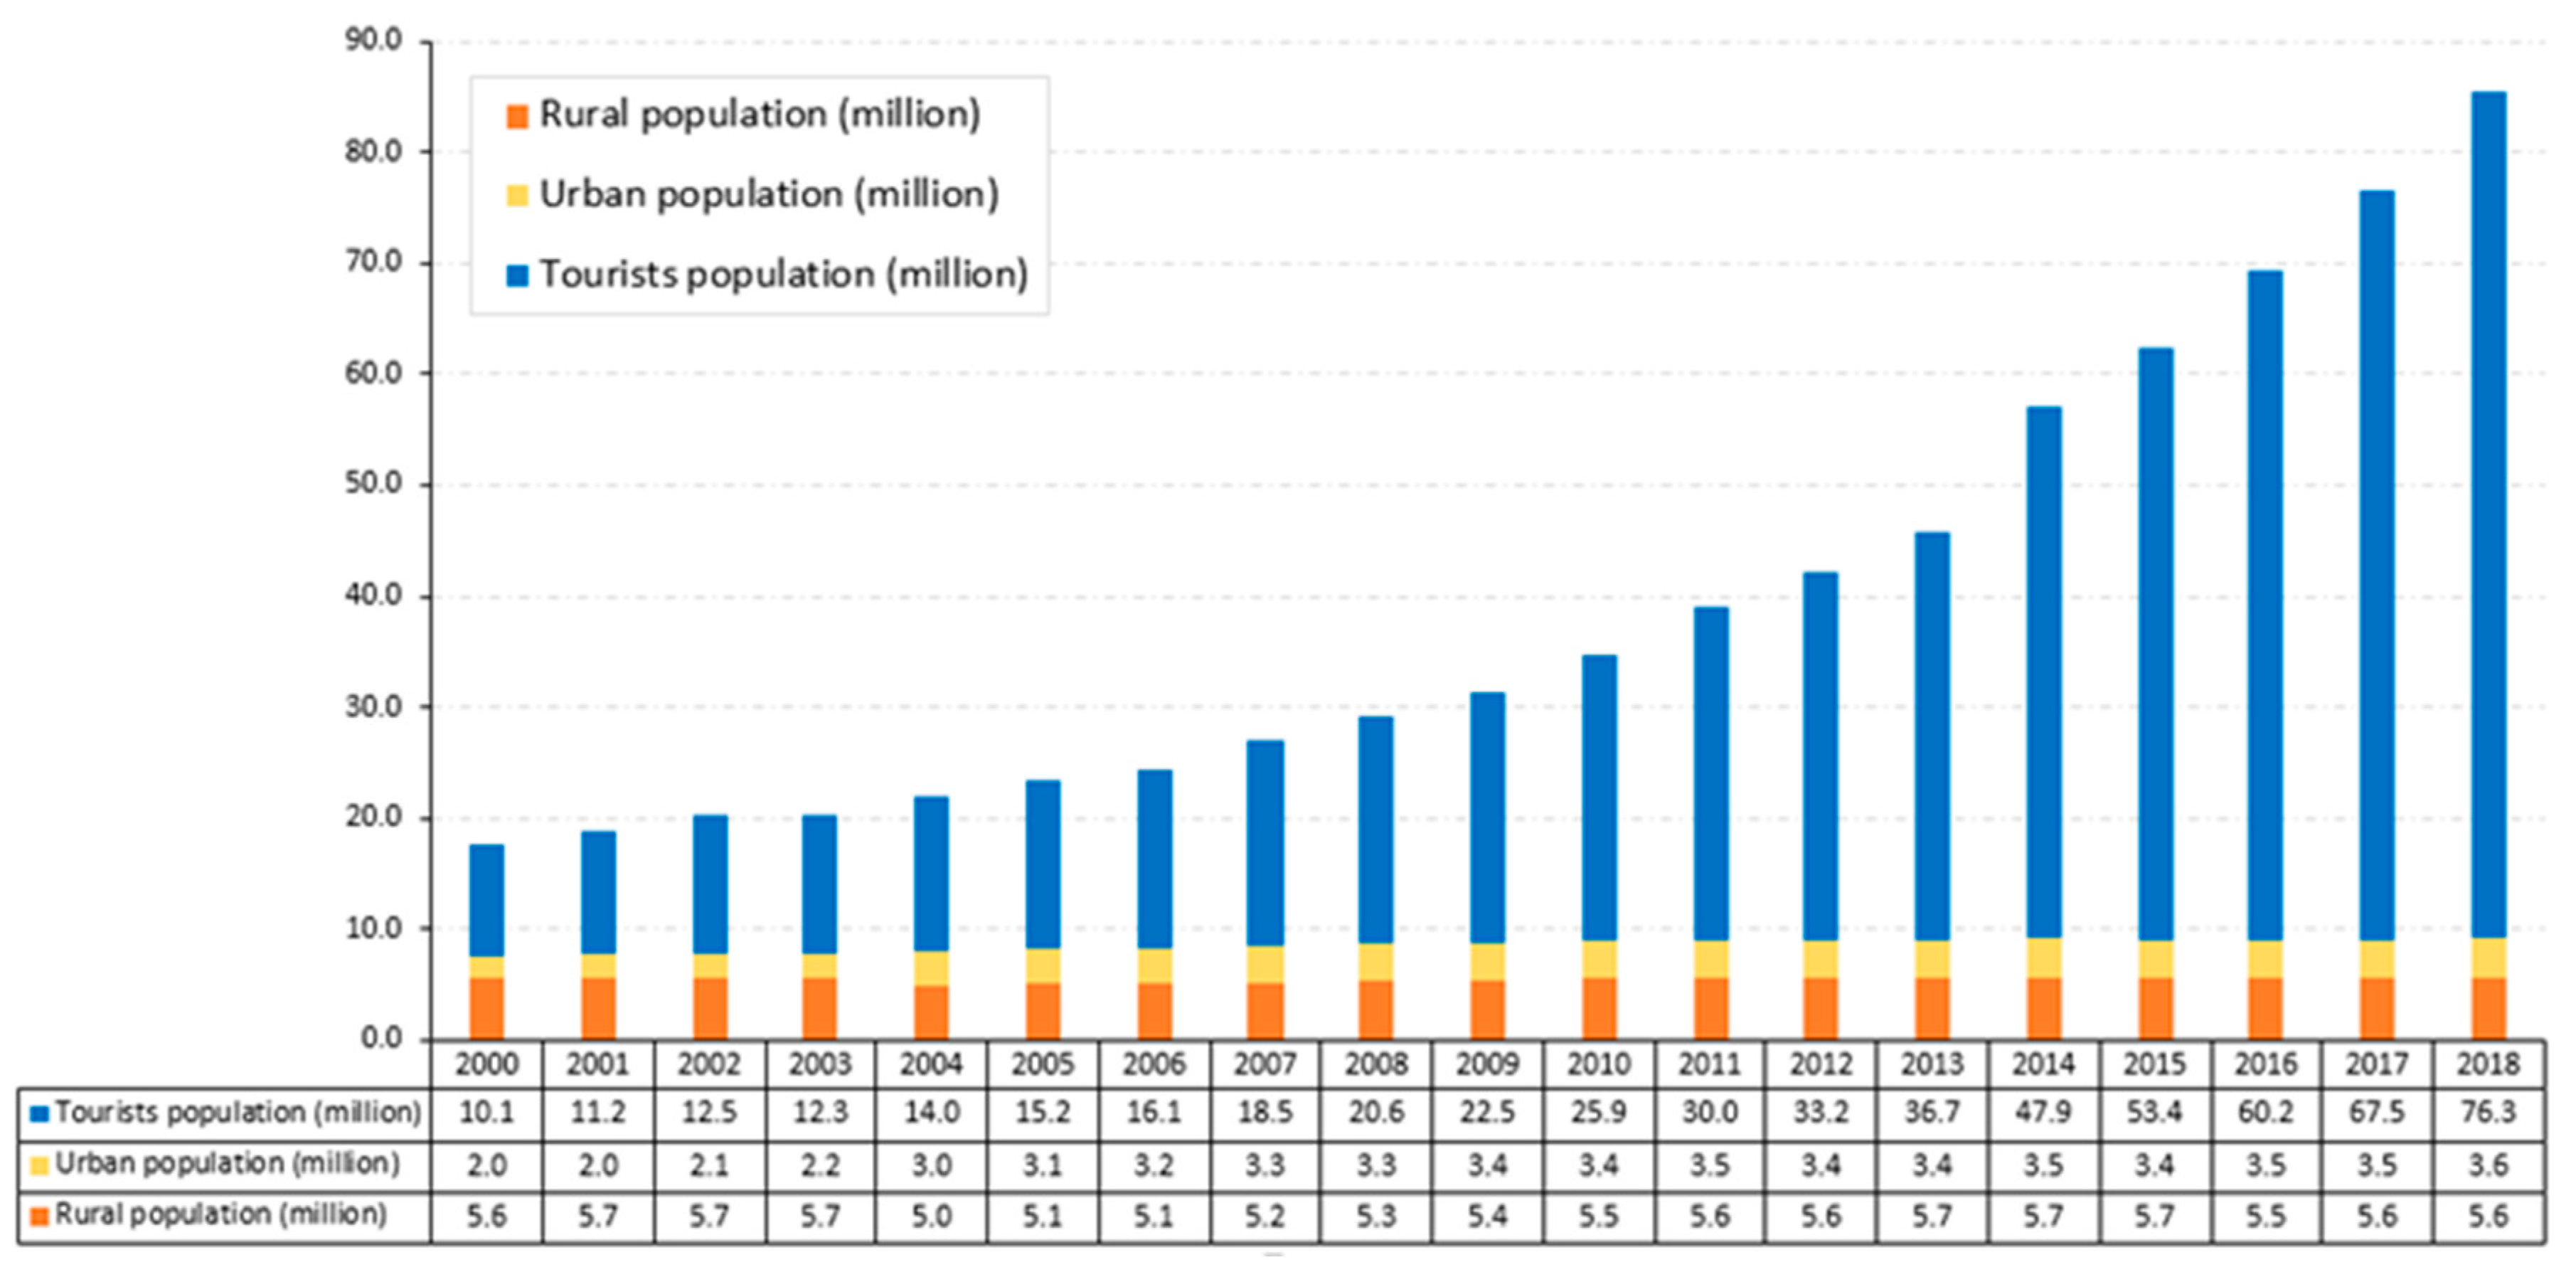
From the annual Statistics Yearbooks (listed in Table 1) published by the Chinese National Bureau of Statistics (2000 to 2018), we collated and tabulated the annual population data of the Hainan region (Figure 4). The population of Hainan Island includes the rural, urban and tourist population. The rural population remained stable for the duration of the study, while the urban population increased from about 2 million people in 2000 to 3.6 million in 2018. According to the yearbook, the changes in the urban population could partially be attributed to the “migratory-bird migration” population, whereby the owners only reside in their private apartments during the winter season. There was a relatively drastic increase in the tourist population, with a growth from about 10.1 million in 2000 to 76.3 million in 2018. The tourist population in 2018 was more than eight times that of the local population. Inevitably, the rise of tourist population and development of tourism-related infrastructure in the region would be expected to contribute to environmental changes, including vegetation changes, variation in the land surface temperature and other variables of the local ecosystem.
4.2. LST Variations
4.2.1. Function-Defined POIs Categories
As described in Section 3.1.2, we classified the random points into two classes (the tourism-related class and the non-tourism-related class) and four sub-classes within the tourism-related class (residential sites along shorelines, accommodation services sites, other tourism-related sites and orchards) (Figure 5). As shown in Figure 5, the residential sites are mainly distributed on the plains along the shoreline, and orchard sites are in the central platform areas, which is consistent with the findings of other researcher’s studies [20].
4.2.2. LST Variations between Tourism-Related and Non-Tourism-Related Categories
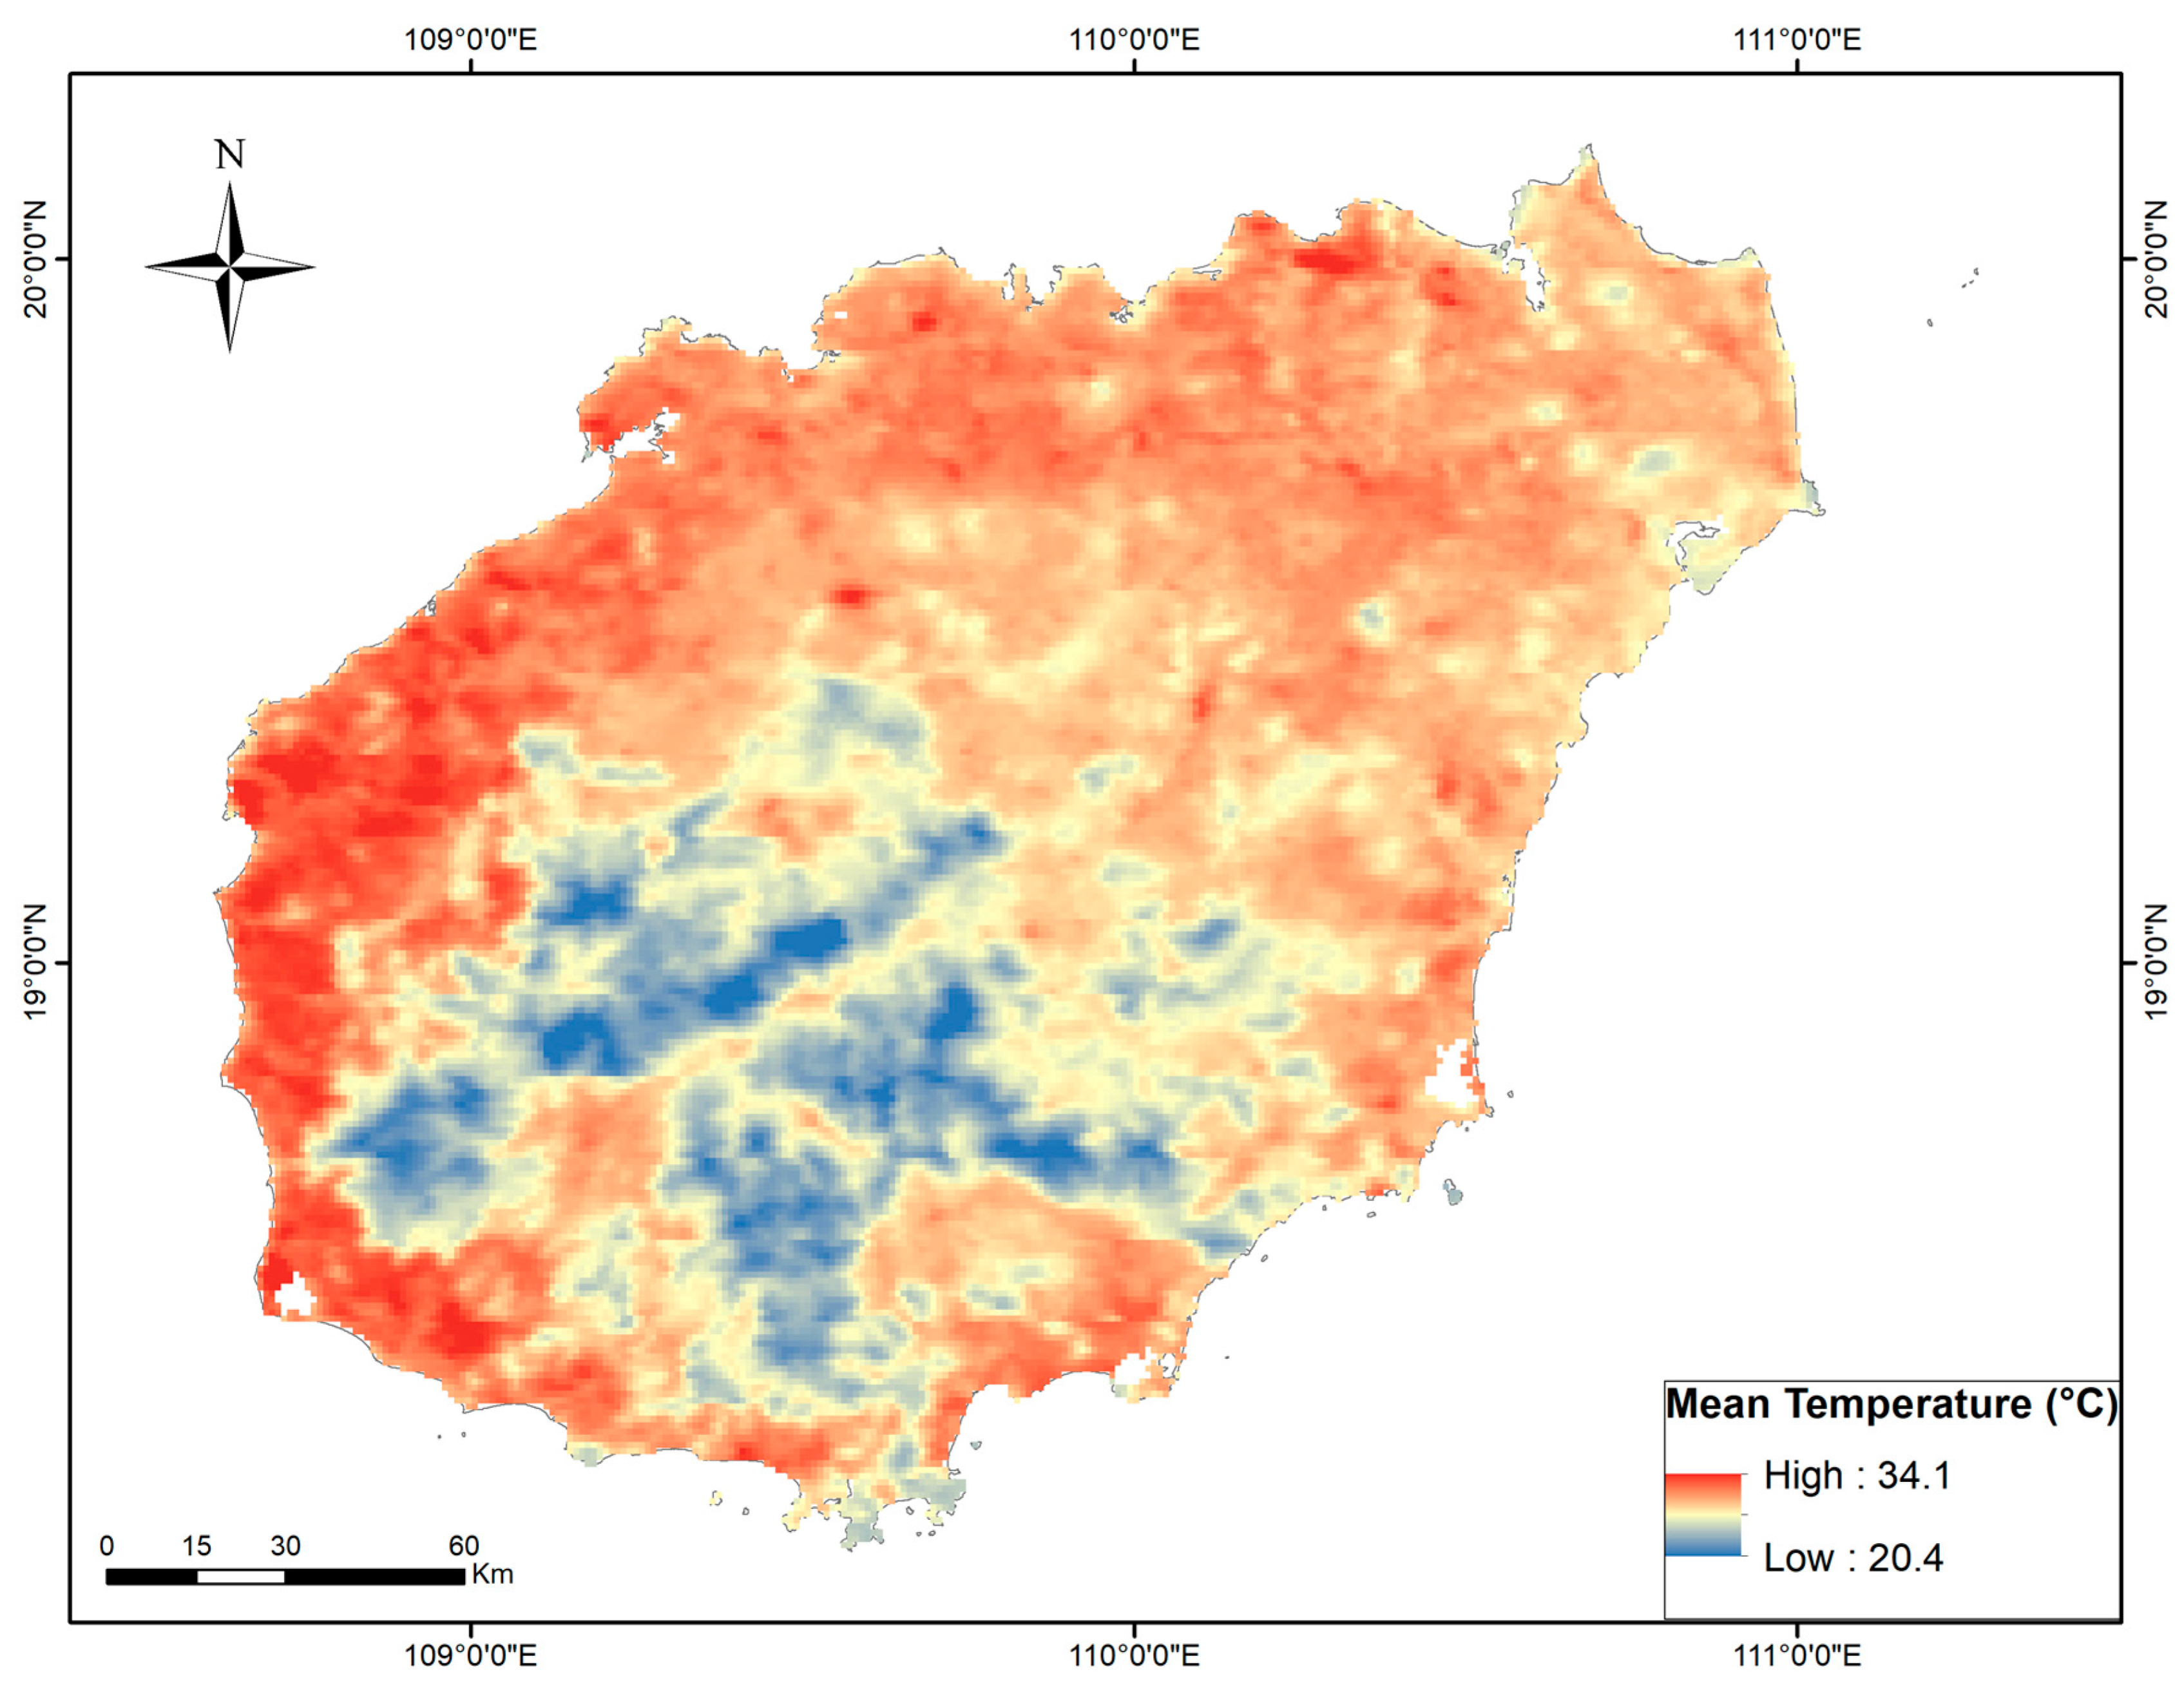
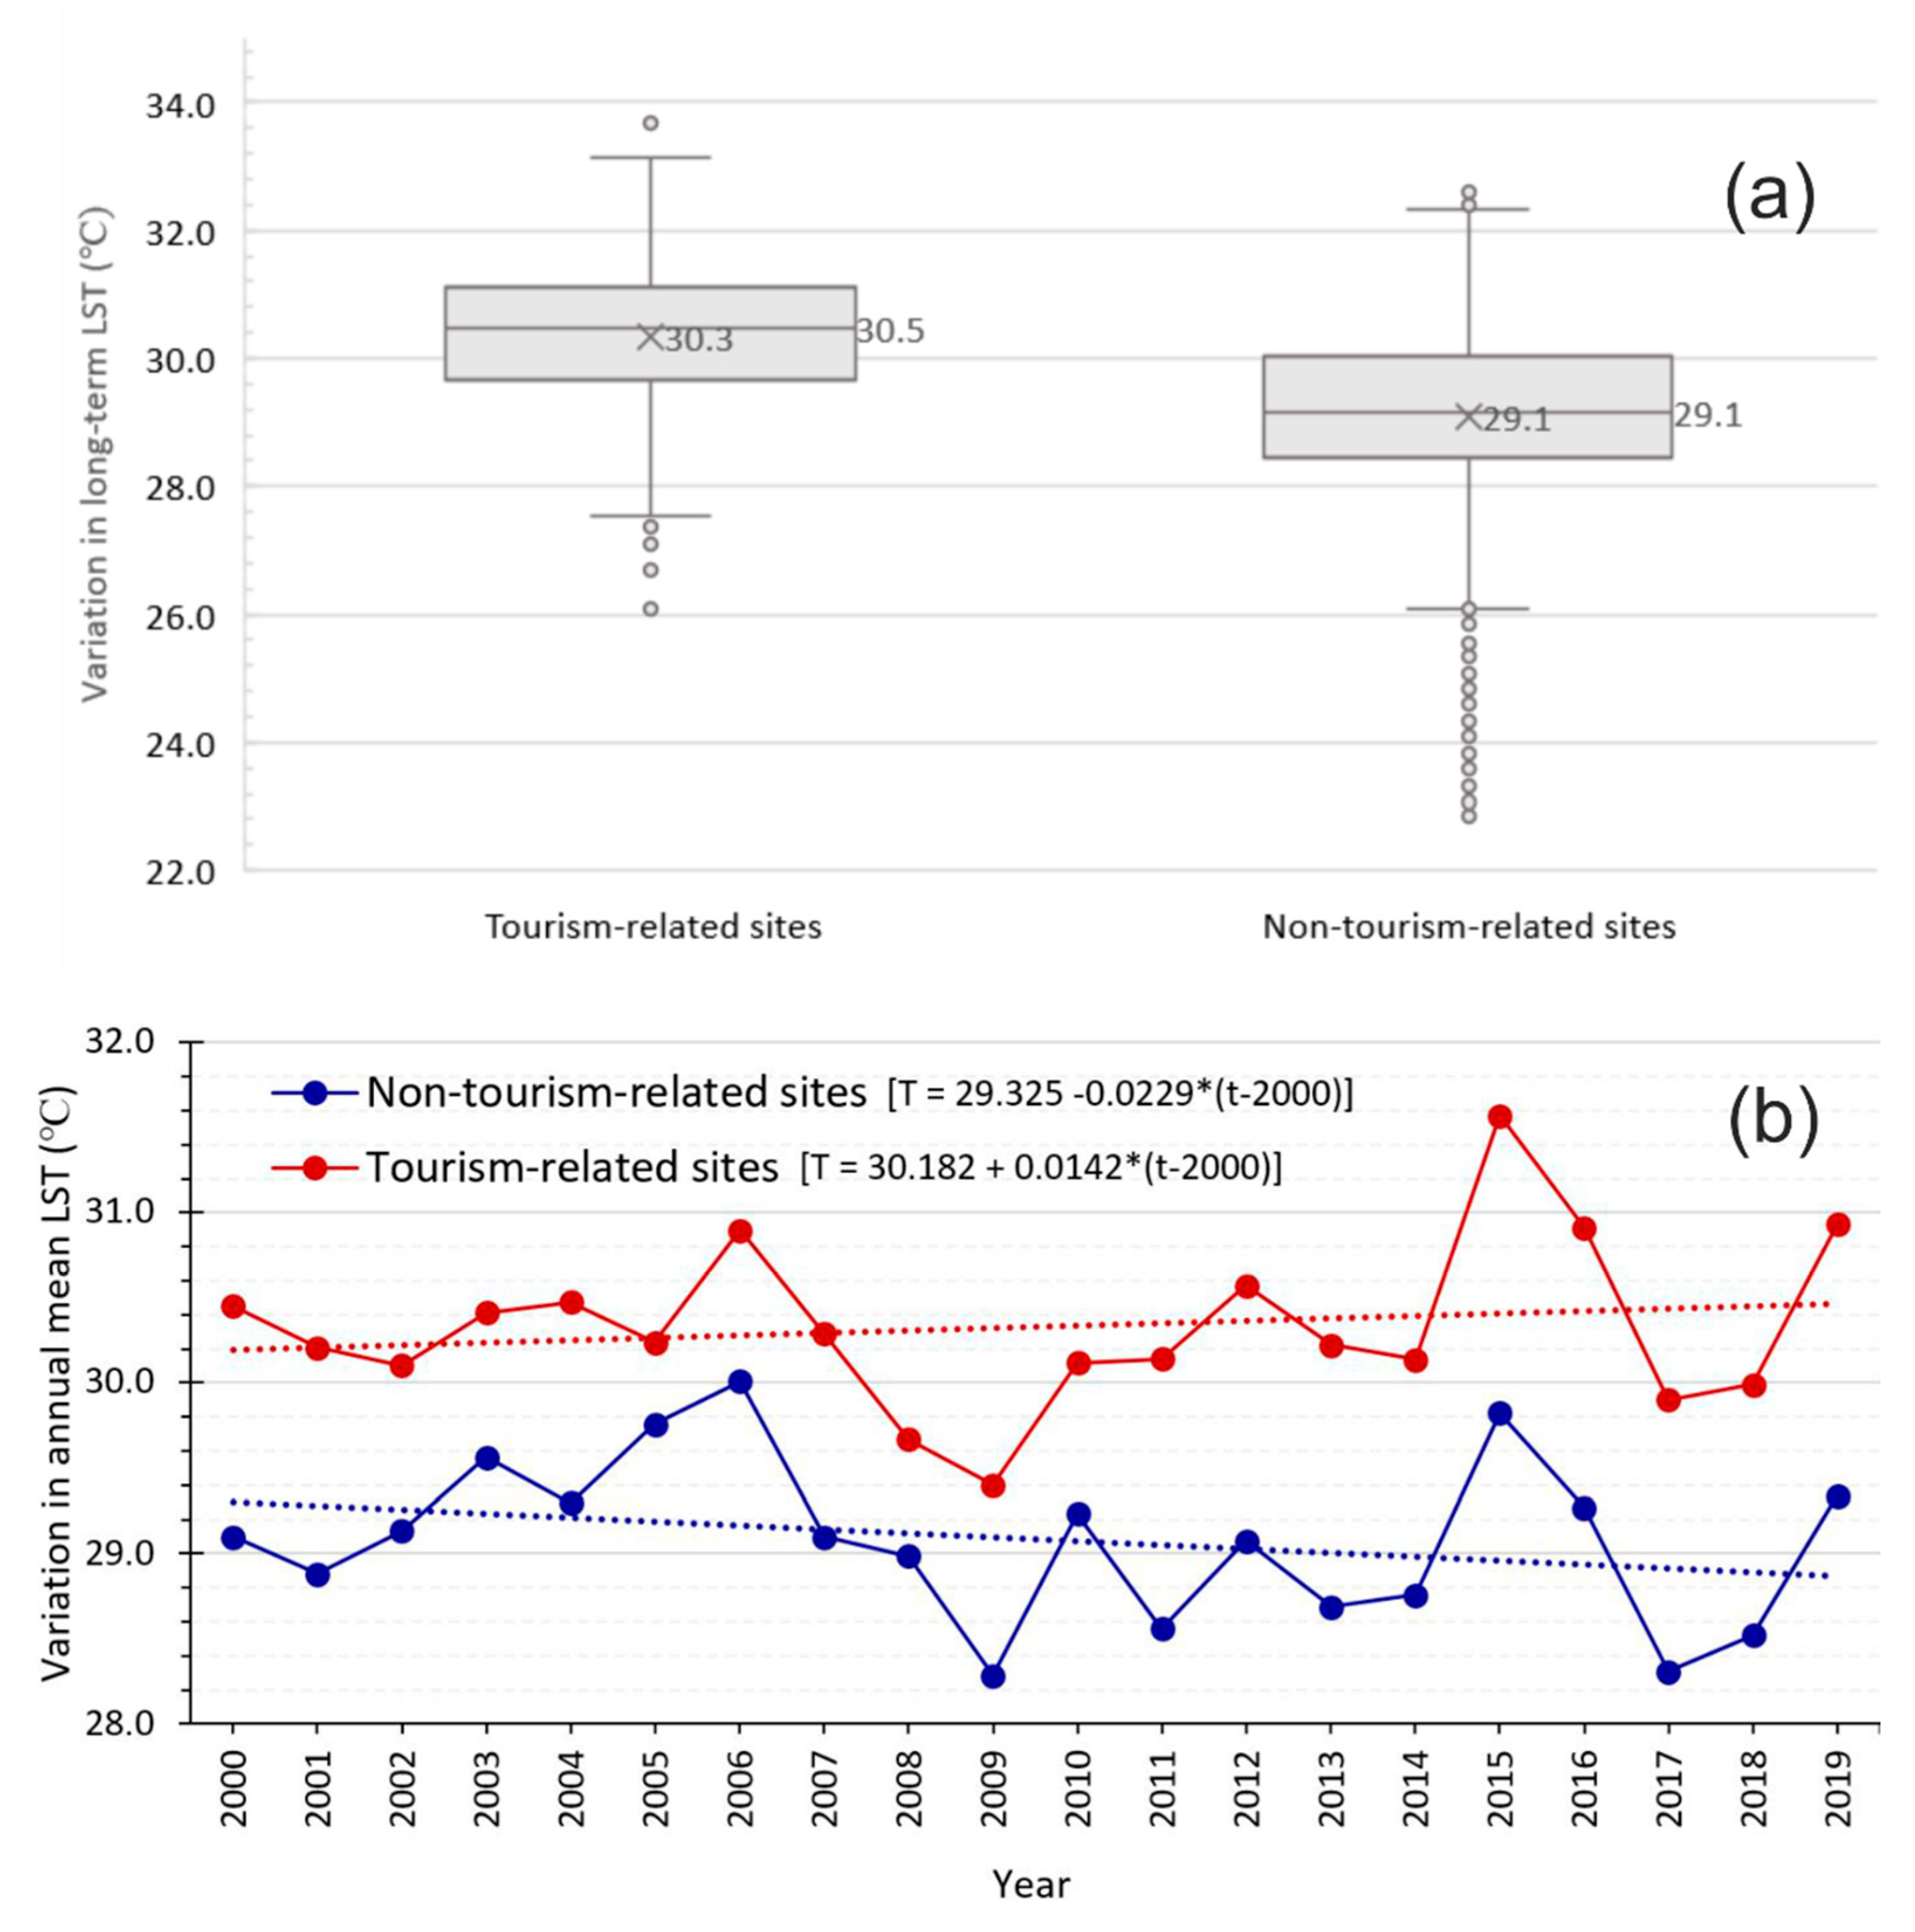
Figure 6 represents the long-term mean LST for the period from 2000 to 2019. We observed that most areas in the hinterlands of the island had a relatively lower mean LST in the past 20 years compared to the areas along the shoreline, which had a relatively higher LST in the period 2000 to 2019. We plotted the statistical distribution of the mean LST in the 20 years for the tourism-related and non-tourism-related sites in Figure 7a. A box and whisker plot (Figure 7a) illustrated the LST values distribution for all POIs on the two types of sites, and the maximum, the 3rd quartile, the median, the 1st quartile and the minimum LST values were represented and marked by the short lines and the box boundary of the Figure 7a. We found that both the mean and the median LST value for tourism-related sites were relatively higher than those of non-tourism-related sites. The median LST difference was 1.3 °C, with 30.5 °C for tourism-related sites and 29.2 °C for the non-tourism-related sites, with the standard deviation of 1.1 °C and 1.5 °C for the tourism-related and the non-tourism-related sites, separately. In Figure 7b, the LST values in tourism sites were consistently higher than those values of non-tourism sites for every year of the 20-year research period. The annual mean LST in tourism-related sites ranges from 29.4 °C to 31.6 °C, while for non-tourism-related sites, it ranges from 28.3 °C to 30 °C. The LST annual mean average difference between the two groups for the 20 years was 1.2 °C, and the max difference was 1.7 °C in the year 2015. The trendlines for the annual temperature variation in the sampling locations showed that, while there was a positive trend of change in annual temperature in the tourism-related sites, the trend of variation in annual temperature in non-tourism related points from 2000–2019 was marginally negative.
4.2.3. LST Variations within the Four Sub-Classes of Tourism-Related Sites
The mean LST statistics (Figure 8) for the research period was plotted for the four sub-classes. The mean LST in the past 20 years in ‘other tourism-related sites’, which encompass leisure, entertainment, transportation and dining activities, had the highest value of 30.4 °C. The mean LST in the ‘residential sites along shorelines’ (30.2 °C), which represented the residential communities along the shoreline, was higher than the mean LST in the ‘accommodation-related services sites’ (30.0 °C), which represents the accommodation facilities for tourists. The mean LST in the ‘orchard sites’ had the lowest LST (28.8 °C) of the four sub-classes of tourism-related sites.
4.3. Annual LST Anomalies
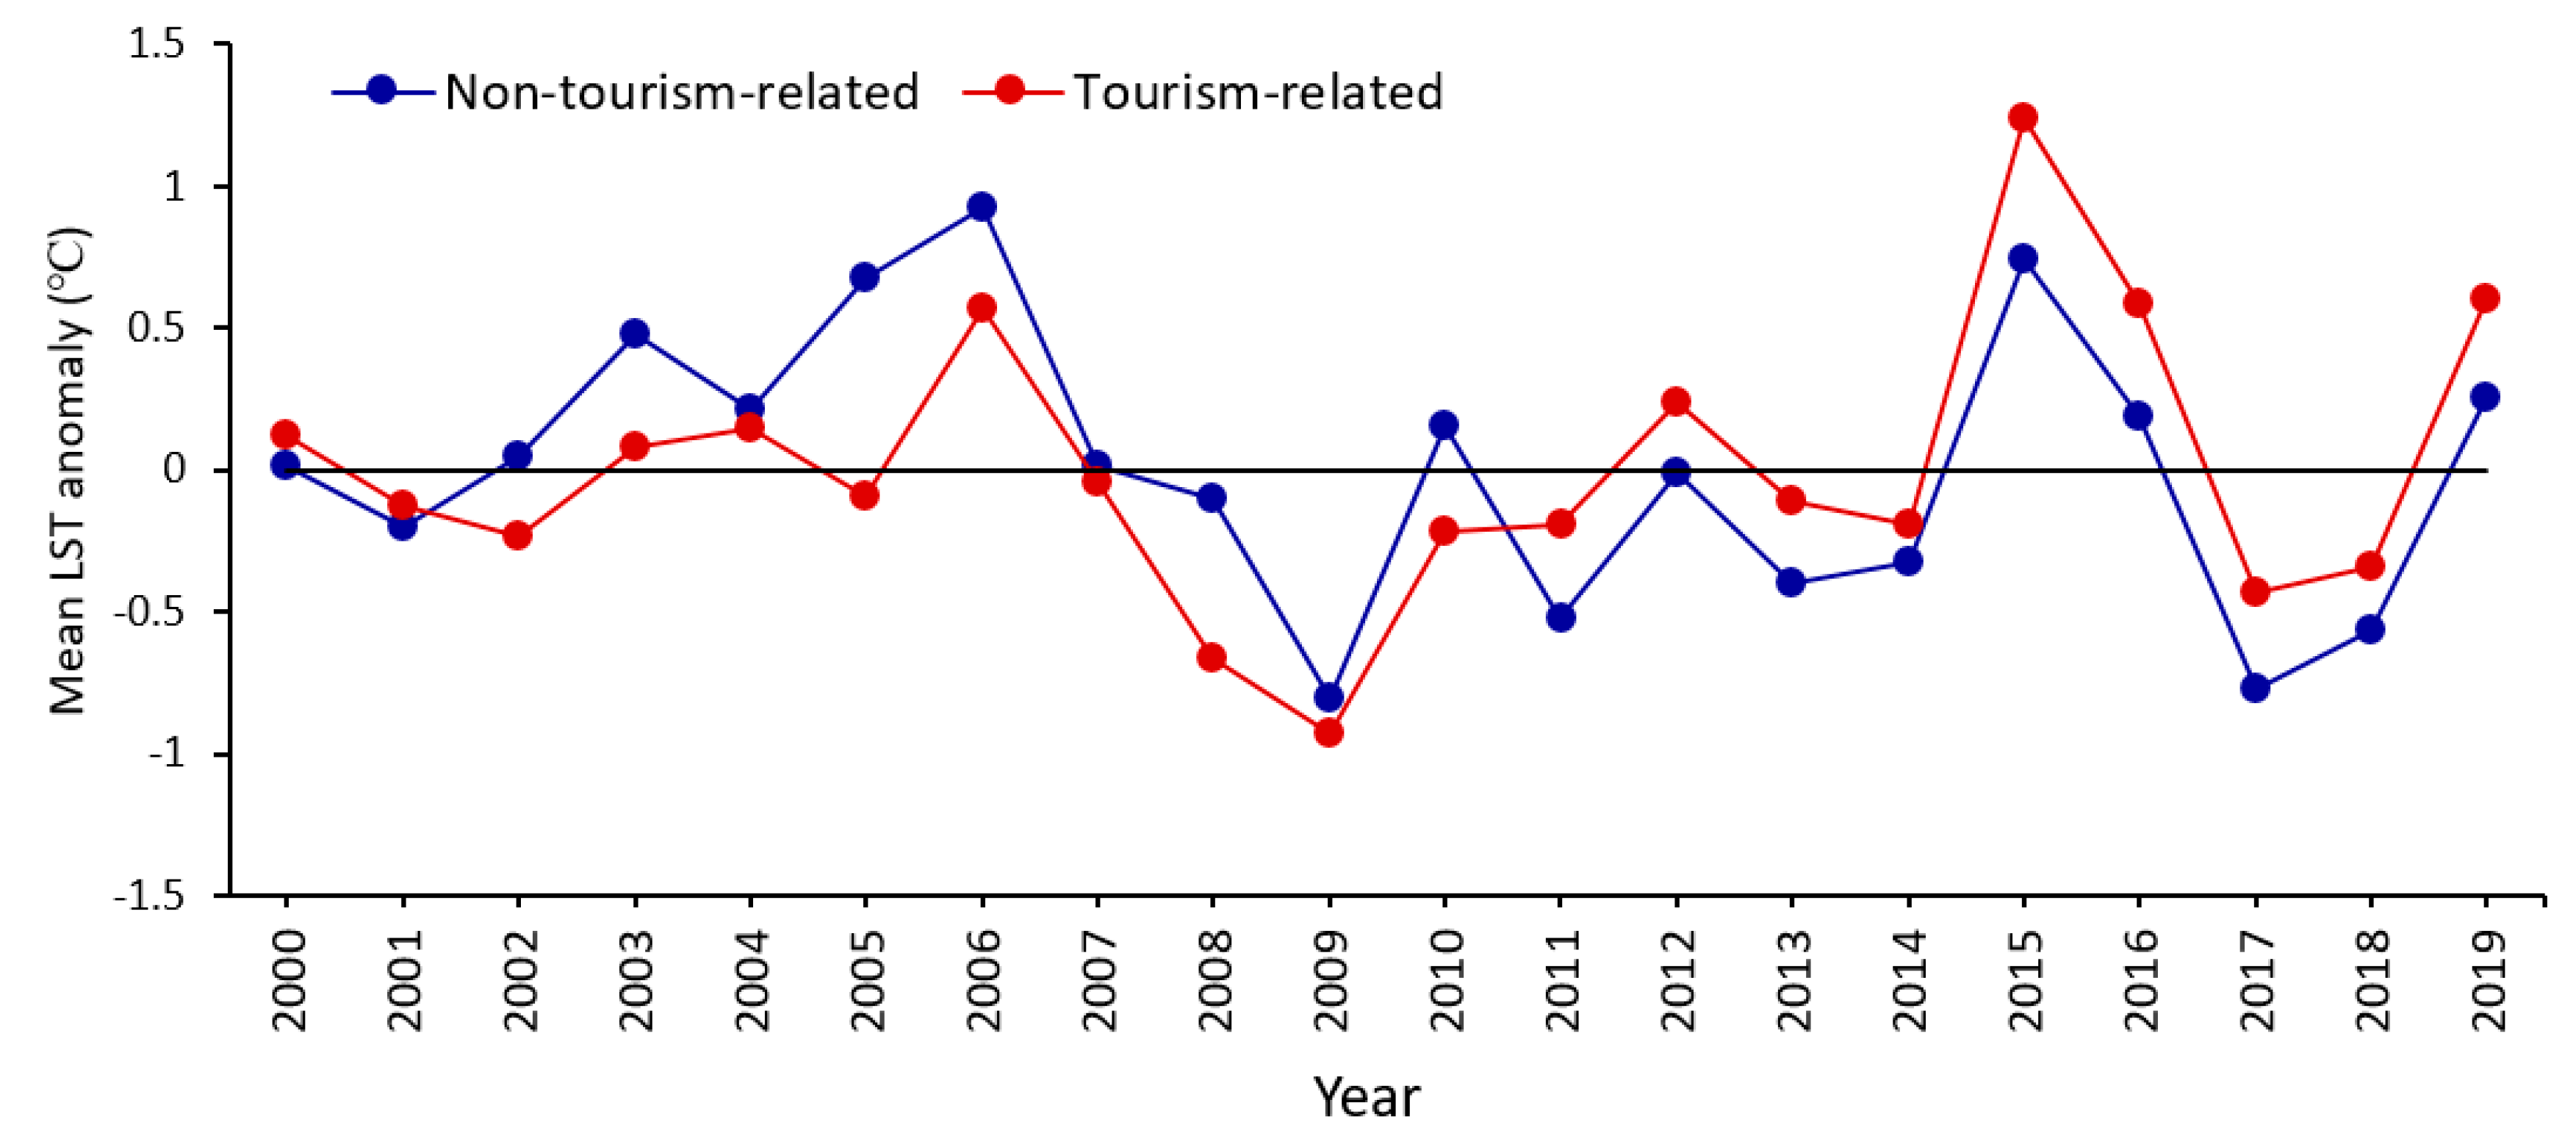
From the plot of temporal variations of annual LST anomalies (Figure 9), we observed that prior to the year 2011, the LST anomalies at tourism-related places were generally below the mean LST anomalies for the non-tourism-related sites. However, after 2011, the annual LST anomalies for the tourism-related sites remained higher than the anomalies of non-tourism-related sites, with the difference in the anomalies between the tourism and non-tourism-related sites ranging from 0.1 °C to 0.5 °C. The highest difference was recorded in 2015, and the mean annual difference was 0.3 °C. This indicated that, for all tourism-related sites in the study area, the annual mean LST were generally higher than the corresponding values of non-tourism-related sites when both were compared against their respective twenty-year mean values.
4.4. NDVI Variations between Tourism-Related and Non-Tourism-Related Sites
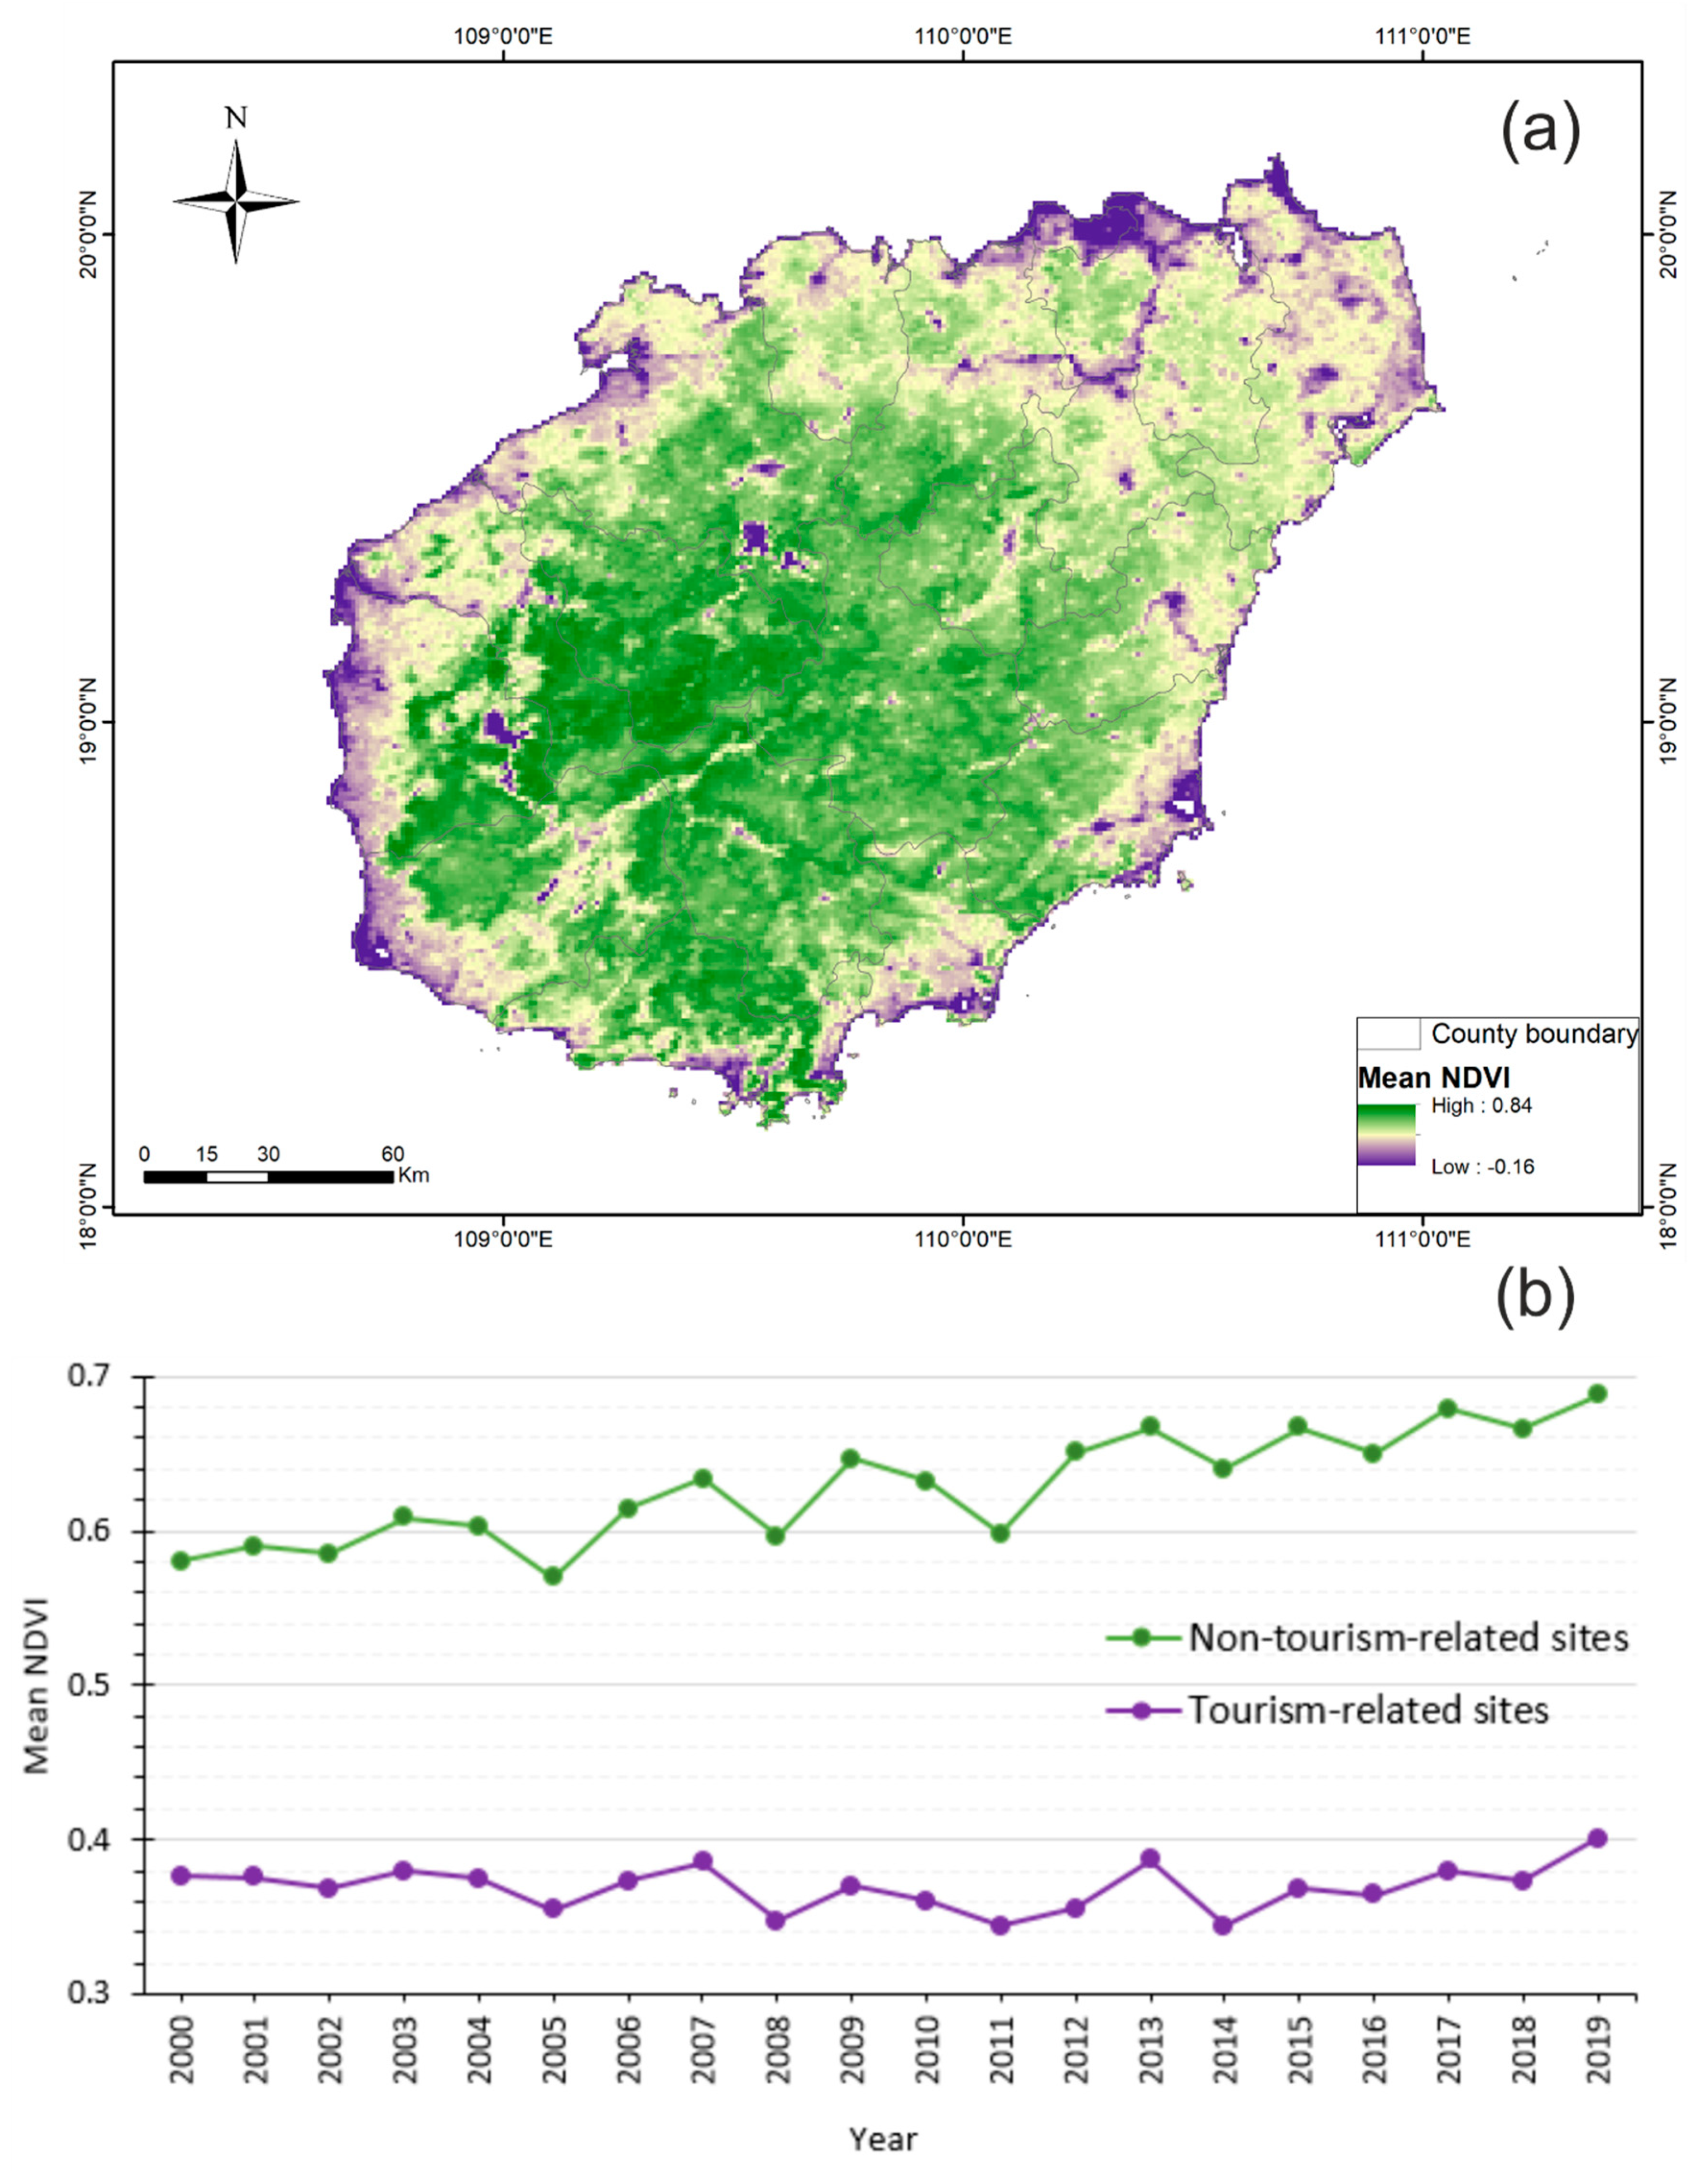
Figure 10a represents the long-term mean NDVI values at each pixel from all images within the period from 2000 to 2019. From the map, we observed that the vegetation loss was predominant along the shoreline in the Hainan region. In addition, the sites of tourism-related activities consistently had relatively lower NDVI values compared to the non-tourism-related places (Figure 10b). The annual mean NDVI for tourism-related places ranged from 0.34 to 0.4, while the annual mean NDVI for non-tourism-related sites ranged from 0.57 to 0.69. The average NDVI difference between the two groups was 0.26. The minimum difference (0.20) between the two classes was in the year 2000, and the highest NDVI discrepancy (0.30) was in 2017. While the vegetation in non-tourism-related sites expanded in the past 20 years with the peak value of 0.69 in 2019, the NDVI values in tourism-related sites remained below 0.41.
4.5. LULC and LST Changes
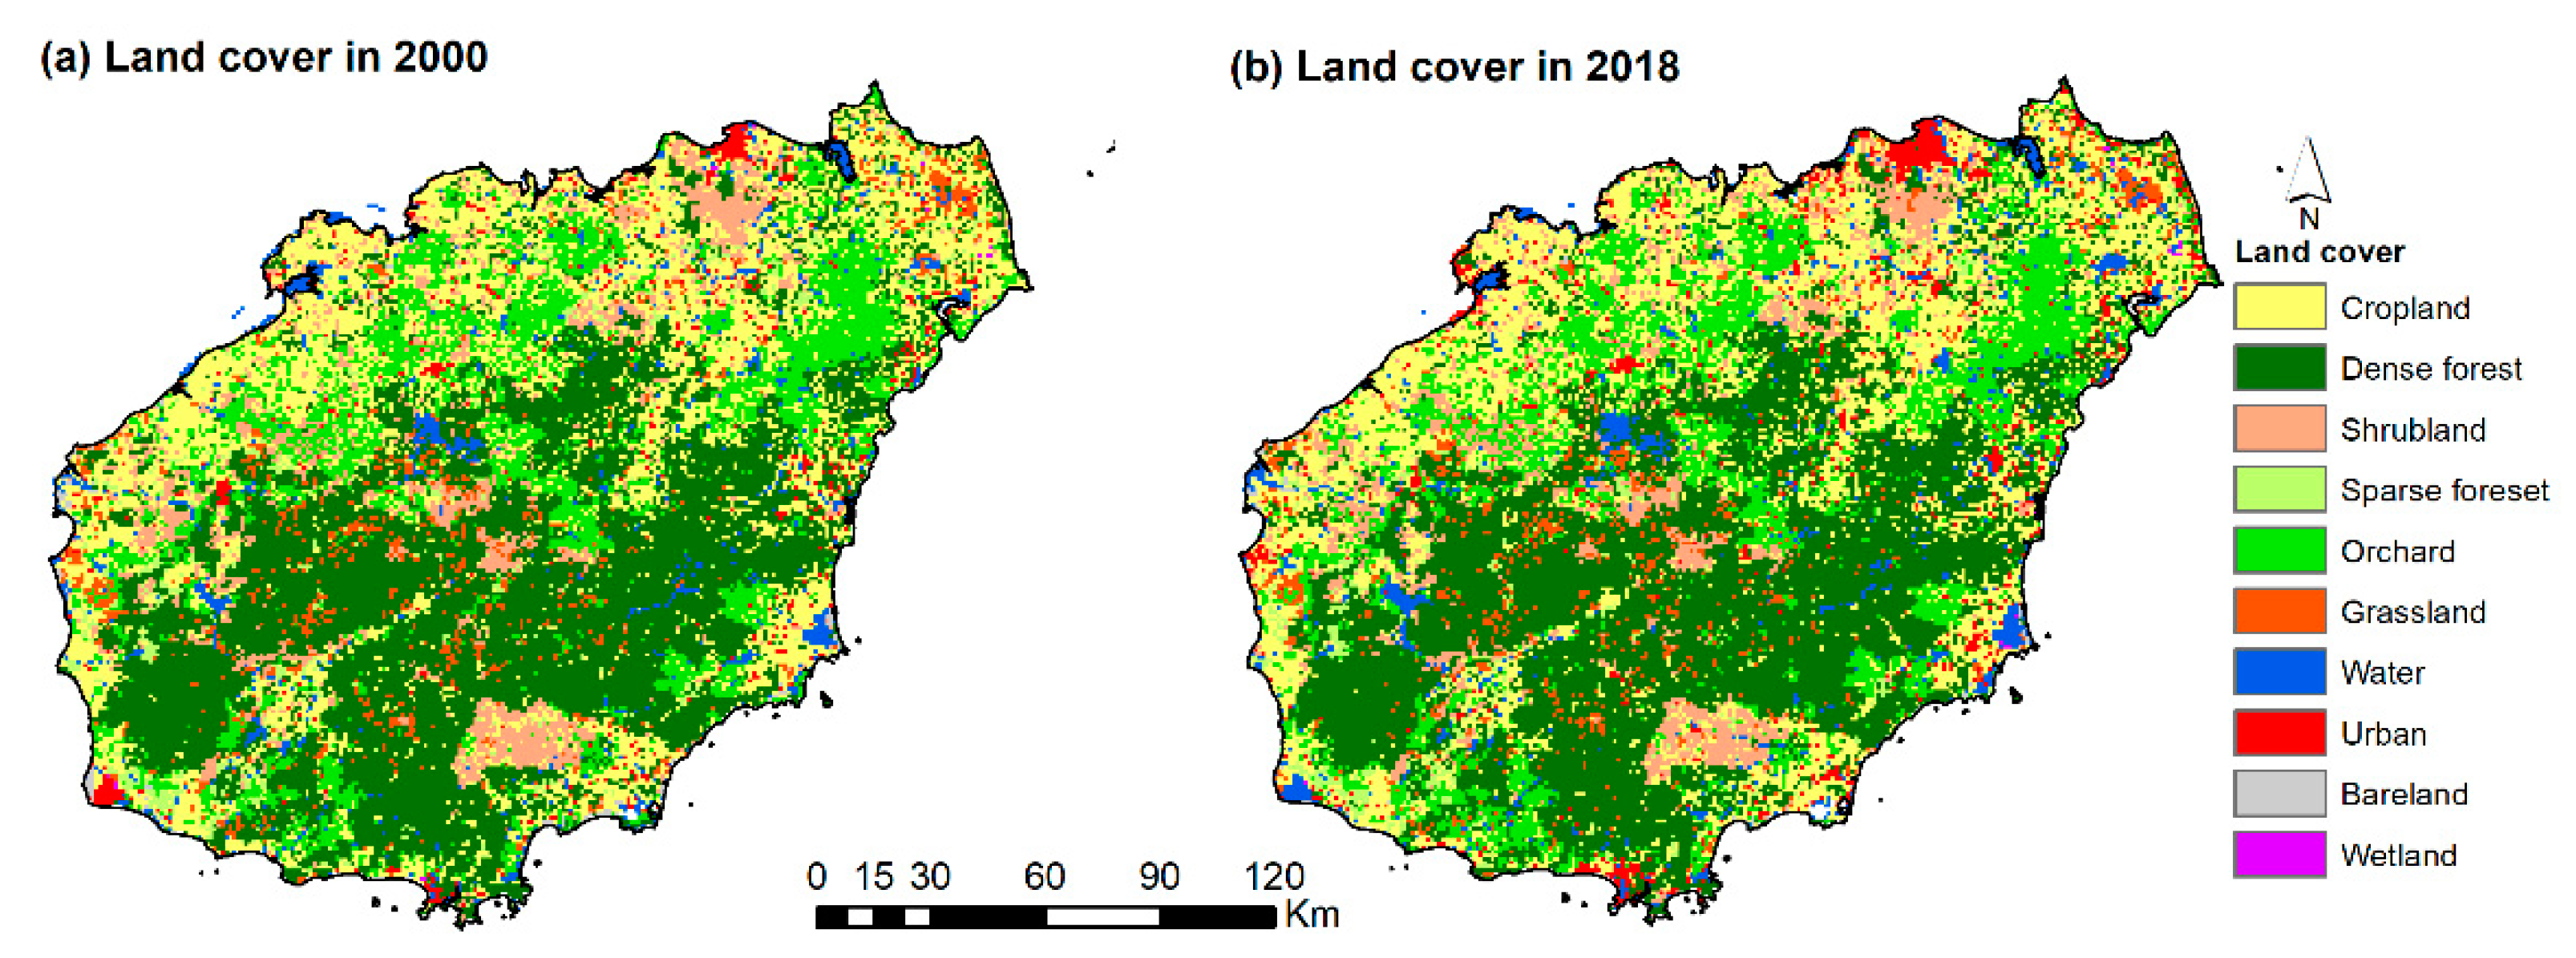
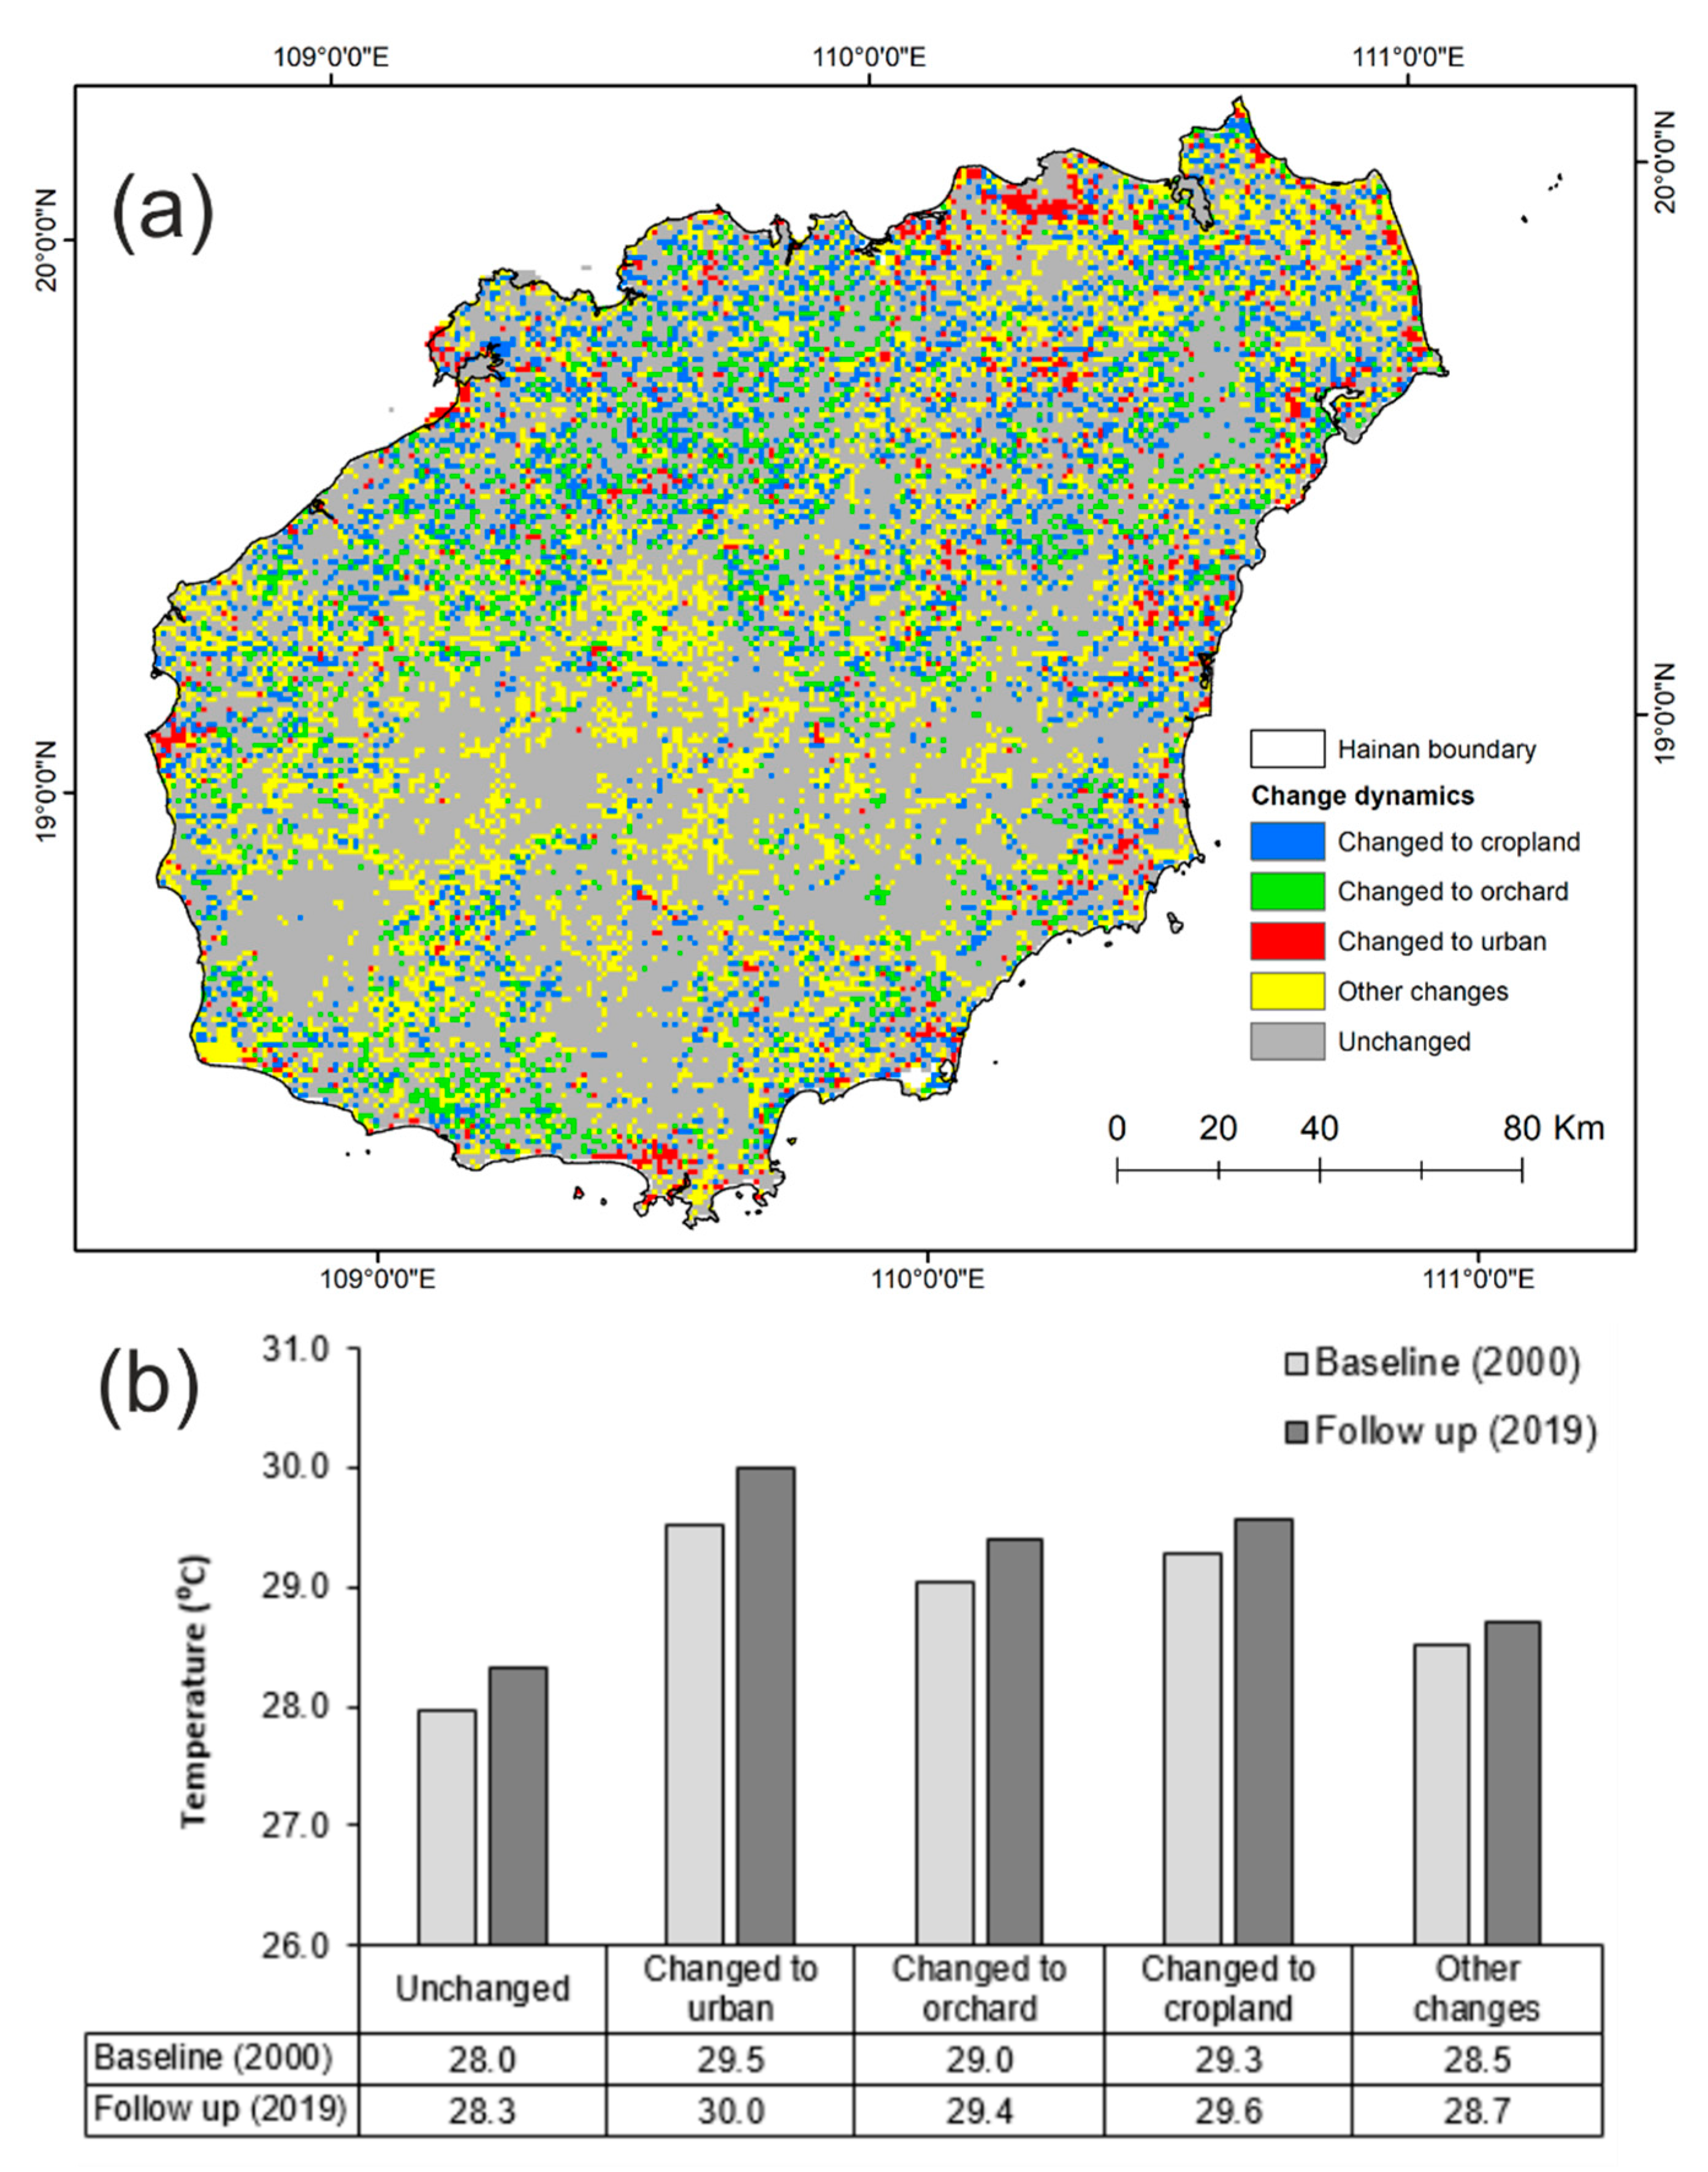
Table 3 outlines the land cover change matrix between 2000 and 2018, and the land cover in the 2 years are compared in Figure 11. From the results, we observed that cropland and dense forest decreased by 313 km2 and 328 km2, respectively, between 2000 and 2018. On the other hand, land-use classes that expanded during the same period were urban areas, water surface and orchard areas with positive changes of 313 km2, 209 km2, and 100 km2, respectively. There was a net transformation of about 16 km2 of croplands to orchards and a net transformation of about 245 km2 of cropland to urban areas. In the same period, about 65 km2 of the initial 86 km2 of shrubland was converted to urban areas, while 103 km2 of the initial 185 km2 of dense forest was also converted to urban areas. This reveals the influence of urban infrastructure on cropland, shrubland and forest cover. Orchards have mainly expanded from cropland and dense forests to meet the fruit demands of the tourism sector. The results were consistent with the land-use change research in Sanya city of Hainan [20]. Accordingly, the tourism-driven land-use dynamics mainly affected the cropland, orchards and urban areas. We mapped the tourism-driven land-use dynamics (Figure 12a) and compared the LST of 2010 and 2019 (Figure 12b). It was difficult to quantify the LST dynamics on the land dynamics every year for the long-term research, so we only used the LST in 2000 and 2019 to compare the LST changes to show the potential influence of tourism on the transformation of land-use types (Figure 12b). As can be seen in Figure 12b, the LST of the three land-use types transformed by tourism (cropland, orchard and urban land) in 2019 had increased compared with the LST of the original land-use types in 2000. Specifically, the LST difference was 0.5 °C, which was an increase from 29.5 °C to 30.0 °C that occurred when the land-use type was converted to urban land. The positive LST changes were 0.4 °C and 0.3 °C for the orchard and cropland changes.
4.6. Ecological Effects of Tourism-Related Activities
As shown in Figure 7a, the long-term median LST in the tourism-related sites was 1.3 °C higher than the LST in non-tourism-related sites. The annual mean LST of tourism-related sites was consistently higher than the respective annual LST values in non-tourism-related sites, with the average annual difference being about 1.2 °C. The LST differences were also noted in the various tourism-related sub-classes (other tourism-related sites, the residential sites along shorelines, the accommodation services sites and orchards). The long-term median LST in the four tourism-related sub-classes were 30.5 °C for the other tourism-related sites, 30.0 °C for the residential sites along shorelines, 29.9 °C for accommodation services sites, and 28.7 °C for the orchard sites. The annual mean NDVI values in the tourism-related sites were generally lower than the respective values in the non-tourism-related places for each year. On average, the NDVI difference between non-tourism-related sites and tourism-related sites was 0.26, with the minimum and maximum annual NDVI difference of 0.2 in 2000 and 0.3 in 2017. In terms of LST anomaly, higher annual LST anomalies were noted in tourism-related sites, compared to the non-tourism-related sites every year from 2011 onwards. The mean annual LST anomaly difference between tourism-related sites and non-tourism-related sites in the period between 2011 to 2019 was 0.3 °C. The land cover changed significantly: croplands and forests were reduced by 313 km2 and 375 km2, respectively, while the orchards and urban areas increased by 100 km2 and 542 km2, respectively. This indicates a tourism-driven conversion of cropland and forest into orchards and urban areas to meet the demands for tropical fruits and accommodation.
The comparison of LST variations between the tourism-related and non-tourism-related sites showed a significant variation between these two sets of places. It can thus be assumed that the type of tourism-related development had a potential influence on the land surface temperature. Similarly, the lower NDVI values in the tourism-related sites compared to the non-tourism-related counterparts could be indicative of the potential vegetation degradation resulting from the expansion of tourism-related activities in the region. In addition, the land-use changes indicate that the urban areas are expanding with the forest shrinking. In sensitive coastal ecosystems, minor variations in temperature and in the vegetation cover characteristics are inevitably expected to influence the biodiversity of these landscapes, mainly through habitat loss and the variation of the temperatures beyond the optimum levels that are conducive for different organisms to survive.
The higher LST, vegetation loss and land-use conversion in tourism-related sites highlighted the human disturbance on the coastal ecosystem. At the shorelines of the island, higher long-term mean LST and lower long-term NDVI were noted for the duration of the study. To bring this into perspective, the Hainan region hosts one-third of the total mangrove forest areas of China [51]; hence, the inter-tidal estuarine ecosystem is currently extremely vulnerable to any human influence. The reduction of plants and psammolittoral organisms (coral reefs, mangroves and seaweed) have been recorded in other studies [51,52,55,56]. The tourism-related activities along the shoreline, if left unchecked, could further degrade the inter-tidal areas where the vulnerable plants and psammolittoral organisms live. In the interest of sustainable tourism development, policy should focus on the preservation of the local ecosystem when developing the tourism-related industries. The results of this study showed that even though the areas along the shorelines are the most critical in terms of providing habitat for vulnerable organisms, they are also the most affected in terms of land surface temperatures, vegetation loss and land-use changes. This calls for more attention to be paid toward approving tourism-related construction and developments along the shorelines.
5. Conclusions
This study aimed to assess the long-term spatio-temporal influence of specific human activities on the ecological variables. Specifically, the study focused on the influence of the tourism-related human activities on the variation of LST, NDVI and land-use changes. We adopted a combination of satellite-derived products from the cloud-based Google Earth Engine, land cover data and place-based POIs to analyse the spatio-temporal variations of ecological variables in tourism-related sites and non-tourism-related sites. In order to highlight the influence of tourism-related activities, we mainly used the POIs with geographic information to categorise random sites into tourism-related and non-tourism-related sites and four function-defined tourism-related sites, in order to compare the influence on the variation of LST and NDVI changes of different tourism-related activities.
The findings illustrated the relative influence of tourism-related activities on land surface temperature (LST), vegetation (NDVI) and land cover dynamics (LULC). Firstly, in terms of LST, the long-term median LST for 20 years in the tourism-related sites (30.5 °C) was relatively higher than that of the non-tourism-related sites (29.2 °C). Similarly, every annual mean LST of tourism-related sites was higher than the LST values in non-tourism-related sites during the research period, with an average difference of 1.2 °C for the 20 years and a maximum difference of 1.7 °C. The general trend of change in the annual mean LST in the tourism-related sites was positive, while that in the non-tourism related sites was negative, indicating that tourism-related sites were likely to have higher LST values when compared against the non-tourism related sites. Furthermore, we observed higher annual LST anomalies for tourist-related sites, compared to non-tourism sites, especially after 2010, indicating the annual LST values for tourism-related sites were likely to be relatively farther from the long-term average LST in comparison to the LST anomalies for non-tourism related sites. The results highlighted the disproportionate rise in LST in tourism-related sites and the high influence of tourism activities particularly after the year 2010. These results are similar to previous studies that have found a link between increasing surface temperatures and the related human activity developments, including the patterns and the changes of LULC, human settlement, UHI, SUHI, urbanization, construction, general human activities etc. [30,31,32,33,34,35,36,37,38,39,40].
Secondly, the mean NDVI value in tourism-related sites was significantly lower than that in non-tourism places every year, with an average NDVI difference of 0.26 between the two categories of sites. This may be explained by the fact that tourism development, particularly the development of accommodation, transport and energy infrastructure to support tourism activities, is usually associated with clearing or modification of indigenous vegetation. Vegetation is therefore likely to be vulnerable to degradation and exploitation in the tourism-related sites than it is in non-tourism-related sites [51,57,58]. Vegetation is an important ecological indicator when assessing the environment influence by tourism development [57,58,59]. Thus, the relatively lower NDVI values in tourism-related sites may be indicative of the adverse effects of tourist-related development on the ecosystem.
Thirdly, between 2000 and 2018, the land cover changed significantly with croplands and forests by 313 km2 (3.5%) and 375 km2 (2.8%), respectively. On the other hand, the areas which were covered by orchards and urban areas increased by 100 km2 (2%) and 542 km2 (72%), respectively. This finding agreed with the previous finding conducted in one city of Hainan, where the orchard conversion by fruit demanding of tourists was highlighted [20]. In addition, the relatively rapid conversion of coastal lands to urban cover to serve the interests of tourists has also been documented [20].
Finally, in this study the identified spatial hotspots with higher LST and vegetation degradation are mainly distributed along the Hainan Island shorelines. This reinforces previous studies that have found that most of the valuable plants and psammolittoral organisms (mangroves, seaweed and coral reefs) along the shoreline suffered a severe reduction [51,52,53,56]. By identifying the geographic variabilities in the LST, NDVI and LULC characterization in the island, the output from this study could inform targeted land management and sustainable tourism development. In particular, tourism development plans could pay attention to the offshore biodiversity degradation, and the potential effect of tourism-development projects on carbon sequestration potential of the island ecosystem. The diverse LST for the four function-defined sub-classes sites provides evidences for the tourism management department to develop eco-friendly tourism programs and reduce the tourists’ accommodation and infrastructure constructions.
Overall, the main contribution of this study was to identify the specific spatial and temporal influence of tourism-related activities on environmental variables, particularly vegetation and land cover dynamics, but also probably LST. In spite of the results from this work, it should be noted that apart from human activities, there are other factors which also contribute to changes in LST and NDVI. Such factors may include climate change, precipitation and season change in the tidal characteristics. In our analysis, we only considered annual variations in LST and NDVI as a way of mitigating for the probably influence of seasonal changes in precipitation and other natural factors. In addition, when assessing the influence on the long-term LST changing trends, we calculated the LST anomalies which shows the difference from the average or the baseline temperature, and the higher LST anomalies after year of 2011 in tourism sites allowed us to highlight the greater influence from tourism activities compared from the non-tourism activities. When choosing POI data to locate the tourism and non-tourism sites, the POIs were randomly selected within every classes to reduce the bias that could be brought by uneven distribution of samples data.
However, the following limitations were highlighted in this research. Firstly, while the satellite-derived products in this work were available at a high spatial (1 km) and temporal resolution (8 day for LST and 16 day for NDVI), the tourist population data were only available at a regional and annual scale, thus limiting the rigorous comparison of the population dynamics and the LST and NDVI changes. Secondly, there were limitations in the accuracy of the satellite-derived LST. The LST data were aggregated to annual raster data and thus could not be expected to be comparable to measured air-temperature data which were aggregated from daily field measurements. Generally, temperature data from the satellite-derived approaches underestimate measured turbulent heat fluxes and anthropogenic heat fluxes, etc.; accordingly, it is necessary to compare these with the date from in situ measurements [60,61,62,63]. Furthermore, LULC referenced maps used in this study were acquired from satellites images, which could yield a classification error because of the images acquisition time in different seasons or its own accuracy of satellite image [64,65,66]. Although the field-based verification on Hainan Island for LULC was not actualized in this study, emergence of finer resolution LULC dataset could be adopted in the future to improve the accuracy of land cover mapping. Another limitation was the lack of data to show temporal changes in the POIs, hence denying us the chance to tease out any potential influence of the tourist population on the changes in the points of interest. Future studies could focus on mining the POI data for further analysis of the social structure of urban ecosystems. Other future directions could also explore the links between the daily variation of ecological variables and the daily dynamics of tourist populations.
Author Contributions
L.C., M.X. and F.O. conceived the study. L.C. and F.O. analysed the data, visualized the results. L.C. developed the original draft manuscript. F.O. reviewed and edited it. M.X. and B.C. contributed to the POI data pre-processing and the POI data description. T.B. supervised the work and revised the manuscript. All authors have read and agreed to the published version of the manuscript.
Funding
The work is partially funded by the Austrian Science Fund (FWF) through the Doctoral College GIScience at the University of Salzburg (DK W1237-N23).
Acknowledgments
The authors appreciate Open Access Funding by the Austrian Science Fund (FWF). The first author is grateful to the support from the Chinese Scholarship council. The first author thanks Angela Hof and Mattia Marconcini for the discussion. The first author thanks Rongrong Wu, Dainius Masiliūnas, Zhaoming Zhang and Guojin He for their support. The authors gratefully acknowledge constructive remarks by academic editors and anonymous reviewers.
Conflicts of Interest
The authors declare no conflict of interest.
References
- Conesa, H.M.; Jiménez-Cárceles, F.J. The Mar Menor lagoon (SE Spain): A singular natural ecosystem threatened by human activities. Mar. Pollut. Bull. 2007, 54, 839–849. [Google Scholar] [CrossRef] [PubMed]
- Frenot, Y.; Gloaguen, J.; Masse, L.; Lebouvier, M. Human activities, ecosystem disturbance and plant invasions in subantarctic Crozet, Kerguelen and Amsterdam Islands. Biol. Conserv. 2001, 101, 33–50. [Google Scholar] [CrossRef]
- Vitousek, P.M.; Mooney, H.A.; Lubchenco, J.; Melillo, J.M. Human Domination of Earth’s Ecosystems. Science 1997, 277, 494–499. [Google Scholar] [CrossRef] [Green Version]
- Gugushvili, T.; Salukvadze, G.; Salukvadze, J. Fragmented development: Tourism-driven economic changes in Kazbegi, Georgia. Ann. Agrar. Sci. 2017, 15, 49–54. [Google Scholar] [CrossRef]
- Qian, J.; Feng, D.; Zhu, H. Tourism-driven urbanization in China’s small town development: A case study of Zhapo Town, 1986–2003. Habitat Int. 2012, 36, 152–160. [Google Scholar] [CrossRef]
- Telfer, D.J. Food purchases in a five-star hotel: A case study of the Aquila Prambanan Hotel, Yogyakarta, Indonesia. Tour. Econ. 1996, 2, 321–338. [Google Scholar] [CrossRef]
- Binns, T.; Nel, E. Tourism as a local development strategy in South Africa. Geogr. J. 2002, 168, 235–247. [Google Scholar] [CrossRef]
- Wu, T.-P.; Wu, H.-C.; Liu, S.-B.; Hsueh, S.-J. The relationship between international tourism activities and economic growth: Evidence from China’s Economy. Tour. Plan. Dev. 2018, 15, 365–381. [Google Scholar] [CrossRef]
- Kuo, N.-W.; Chen, P.-H. Quantifying energy use, carbon dioxide emission, and other environmental loads from island tourism based on a life cycle assessment approach. J. Clean. Prod. 2009, 17, 1324–1330. [Google Scholar] [CrossRef]
- Day, J.; Cai, L. Environmental and energy-related challenges to sustainable tourism in the United States and China. Int. J. Sustain. Dev. World Ecol. 2012, 19, 379–388. [Google Scholar] [CrossRef]
- Holden, A. Environment and Tourism, 3rd ed.; Routledge: New York, NY, USA, 2016. [Google Scholar]
- Duffy, R. A Trip Too Far: Ecotourism, Politics and Exploitation, 1st ed.; Earthscan: London, UK; New York, NY, USA, 2002. [Google Scholar]
- Tang, Z. An integrated approach to evaluating the coupling coordination between tourism and the environment. Tour. Manag. 2015, 46, 11–19. [Google Scholar] [CrossRef]
- Gössling, S. Global environmental consequences of tourism. Glob. Environ. Chang. 2002, 12, 283–302. [Google Scholar] [CrossRef]
- Makame, M.K.; Boon, E.K. Sustainable Tourism and Benefit-Sharing in Zanzibar: The Case of Kiwengwa-Pongwe Forest Reserve. J. Hum. Ecol. 2008, 24, 93–109. [Google Scholar] [CrossRef]
- Svoronou, E.; Holden, A. Ecotourism as a Tool for Nature Conservation: The Role of WWF Greece in the Dadia-Lefkimi-Soufli Forest Reserve in Greece. J. Sustain. Tour. 2005, 13, 456–467. [Google Scholar] [CrossRef]
- Hawkins, J.P.; Roberts, C.; Kooistra, D.; Buchan, K.; White, S. Sustainability of scuba diving tourism on coral reefs of Saba. Coast. Manag. 2005, 33, 373–387. [Google Scholar] [CrossRef]
- Petrosillo, I.; Zurlini, G.; Corlianò, M.; Zaccarelli, N.; Dadamo, M. Tourist perception of recreational environment and management in a marine protected area. Landsc. Urban Plan. 2007, 79, 29–37. [Google Scholar] [CrossRef]
- Spalding, M.; Burke, L.; Wood, S.A.; Ashpole, J.; Hutchison, J.; Zu Ermgassen, P.S.E. Mapping the global value and distribution of coral reef tourism. Mar. Policy 2017, 82, 104–113. [Google Scholar] [CrossRef]
- Wang, J.; Liu, Y. Tourism-led land-use changes and their environmental effects in the southern coastal region of Hainan Island, China. J. Coast. Res. 2013, 29, 1118–1125. [Google Scholar] [CrossRef]
- Wang, L.; Fang, B.; Law, R. Effect of air quality in the place of origin on outbound tourism demand: Disposable income as a moderator. Tour. Manag. 2018, 68, 152–161. [Google Scholar] [CrossRef]
- Ruiz-Guerra, I.; Molina-Moreno, V.; Cortés-García, F.J.; Núñez-Cacho, P. Prediction of the impact on air quality of the cities receiving cruise tourism: The case of the Port of Barcelona. Heliyon 2019, 5, e01280. [Google Scholar] [CrossRef] [Green Version]
- Hamilton, J.M.; Tol, R.S.J. The impact of climate change on tourism in Germany, the UK and Ireland: A simulation study. Reg. Environ. Chang. 2007, 7, 161–172. [Google Scholar] [CrossRef] [Green Version]
- Kaján, E.; Saarinen, J. Tourism, climate change and adaptation: A review. Curr. Issues Tour. 2013, 16, 167–195. [Google Scholar] [CrossRef]
- Ateljevic, I. Transforming the (tourism) world for good and (re)generating the potential ‘new normal’. Tour. Geogr. 2020, 22, 467–475. [Google Scholar] [CrossRef]
- Cheer, J.M. Human flourishing, tourism transformation and COVID-19: A conceptual touchstone. Tour. Geogr. 2020, 22, 514–524. [Google Scholar] [CrossRef]
- Mandal, I.; Pal, S. COVID-19 pandemic persuaded lockdown effects on environment over stone quarrying and crushing areas. Sci. Total Environ. 2020, 732, 139281. [Google Scholar] [CrossRef] [PubMed]
- Paital, B. Nurture to nature via COVID-19, a self-regenerating environmental strategy of environment in global context. Sci. Total Environ. 2020, 729, 139088. [Google Scholar] [CrossRef]
- Li, G.; Yang, X.; Liu, Q.; Zheng, F. Destination island effects: A theoretical framework for the environmental impact assessment of human tourism activities. Tour. Manag. Perspect. 2014, 10, 11–18. [Google Scholar] [CrossRef]
- Tran, D.X.; Pla, F.; Latorre-Carmona, P.; Myint, S.W.; Caetano, M.; Kieu, H.V. Characterizing the relationship between land use land cover change and land surface temperature. ISPRS J. Photogramm. Remote Sens. 2017, 124, 119–132. [Google Scholar] [CrossRef] [Green Version]
- Xiao, H.; Weng, Q. The impact of land use and land cover changes on land surface temperature in a karst area of China. J. Environ. Manag. 2007, 85, 245–257. [Google Scholar] [CrossRef]
- Buyantuyev, A.; Wu, J. Urban heat islands and landscape heterogeneity: Linking spatiotemporal variations in surface temperatures to land-cover and socioeconomic patterns. Landsc. Ecol. 2010, 25, 17–33. [Google Scholar] [CrossRef]
- Weng, Q.; Lu, D.; Schubring, J. Estimation of land surface temperature–vegetation abundance relationship for urban heat island studies. Remote Sens. Environ. 2004, 89, 467–483. [Google Scholar] [CrossRef]
- Zhou, D.; Zhao, S.; Zhang, L.; Sun, G.; Liu, Y. The footprint of urban heat island effect in China. Sci. Rep. 2015, 5, 11160. [Google Scholar] [CrossRef] [PubMed]
- Jenerette, G.D.; Harlan, S.L.; Brazel, A.; Jones, N.; Larsen, L.; Stefanov, W.L. Regional relationships between surface temperature, vegetation, and human settlement in a rapidly urbanizing ecosystem. Landsc. Ecol. 2007, 22, 353–365. [Google Scholar] [CrossRef]
- Fu, P.; Weng, Q. A time series analysis of urbanization induced land use and land cover change and its impact on land surface temperature with Landsat imagery. Remote Sens. Environ. 2016, 175, 205–214. [Google Scholar] [CrossRef]
- Huang, G.; Zhou, W.; Cadenasso, M. Cadenasso, Is everyone hot in the city? Spatial pattern of land surface temperatures, land cover and neighborhood socioeconomic characteristics in Baltimore, MD. J. Environ. Manag. 2011, 92, 1753–1759. [Google Scholar] [CrossRef]
- Zhang, X.; Estoque, R.C.; Murayama, Y. An urban heat island study in Nanchang City, China based on land surface temperature and social-ecological variables. Sustain. Cities Soc. 2017, 32, 557–568. [Google Scholar] [CrossRef]
- Chu, L.; Oloo, F.; Bergstedt, H.; Blaschke, T. Assessing the link between human modification and changes in land surface temperature in Hainan, China using image archives from google earth engine. Remote Sens. 2020, 12, 888. [Google Scholar] [CrossRef] [Green Version]
- Ravanelli, R.; Nascetti, A.; Cirigliano, R.V.; Di Rico, C.; Leuzzi, G.; Monti, P.; Crespi, M. Monitoring the impact of land cover change on surface urban heat island through Google Earth Engine: Proposal of a global methodology, first applications and problems. Remote Sens. 2018, 10, 1488. [Google Scholar] [CrossRef] [Green Version]
- Qiu, P.H.; Xu, S.J.; Xie, G.Z.; Tang, B.; Bi, H.; Yu, L. Analysis of the ecological vulnerability of the western Hainan Island based on its landscape pattern and ecosystem sensitivity. Acta Ecol. Sin. 2007, 27, 1257–1264. [Google Scholar] [CrossRef]
- Herbeck, L.S.; Unger, D.; Krumme, U.; Liu, S.; Jennerjahn, T.C. Typhoon-induced precipitation impact on nutrient and suspended matter dynamics of a tropical estuary affected by human activities in Hainan, China. Estuar. Coast. Shelf Sci. 2011, 93, 375–388. [Google Scholar] [CrossRef]
- Jones, P.D.; Lister, D.H.; Li, Q. Urbanization effects in large-scale temperature records, with an emphasis on China. J. Geophys. Res. Atmos. 2008, 113, D16. [Google Scholar] [CrossRef]
- Zhang, J.; Wu, L. Modulation of the urban heat island by the tourism during the Chinese New Year holiday: A case study in Sanya City, Hainan Province of China. Sci. Bull. 2015, 60, 1543–1546. [Google Scholar] [CrossRef] [Green Version]
- Gorelick, N.; Hancher, M.; Dixon, M.; Ilyushchenko, S.; Thau, D.; Moore, R. Google Earth Engine: Planetary-scale geospatial analysis for everyone. Remote Sens. Environ. 2017, 202, 18–27. [Google Scholar] [CrossRef]
- Jiang, S.; Alves, A.; Rodrigues, F.; Joseph, F., Jr.; Pereira, F.C. Mining point-of-interest data from social networks for urban land use classification and disaggregation. Comput. Environ. Urban Syst. 2015, 53, 36–46. [Google Scholar] [CrossRef] [Green Version]
- Yao, Y.; Li, X.; Liu, X.; Liu, P.; Liang, Z.; Zhang, J.; Mai, K. Sensing spatial distribution of urban land use by integrating points-of-interest and Google Word2Vec model. Int. J. Geogr. Inf. Sci. 2017, 31, 825–848. [Google Scholar] [CrossRef]
- Hainan Provincial Bureau of Statistics & Survey Office of the National Bureau of Statistics in Hainan. Hainan Statistics Yearbook; China Statistics Press: Beijing, China, 2018. Available online: http://www.stats.gov.cn/tjsj/ndsj/2018/indexeh.htm (accessed on 5 May 2020).
- Wan, Z.; Hook, S.; Hulley, G. MOD11A2 MODIS/Terra Land Surface Temperature/Emissivity 8-Day L3 Global 1 km SIN Grid V006; NASA EOSDIS Land Processes DAAC: Washington, WA, USA, 2015. [CrossRef]
- Didan, K. MOD13A2 MODIS/Terra Vegetation Indices 16-Day L3 Global 1 km SIN Grid V006; NASA EOSDIS Land Processes DAAC: Washington, WA, USA, 2015. [CrossRef]
- Qiu, Y.-W.; Yu, K.-F.; Zhang, G.; Wang, W.-X. Accumulation and partitioning of seven trace metals in mangroves and sediment cores from three estuarine wetlands of Hainan Island, China. J. Hazard. Mater. 2011, 190, 631–638. [Google Scholar] [CrossRef]
- Wu, S.; Zhang, W. Current status, crisis and conservation of coral reef ecosystems in China. Proc. Int. Acad. Ecol. Environ. Sci. 2012, 2, 1–11. [Google Scholar]
- Los, S.O.; Collatz, G.J.; Bounoua, L.; Sellers, P.J.; Tucker, C.J. Global Interannual Variations in Sea Surface Temperature and Land Surface Vegetation, Air Temperature, and Precipitation. J. Clim. 2001, 14, 1535–1549. [Google Scholar] [CrossRef]
- Li, M.-F.; Li, Y.-P.; Guo, P.-T. Recent variations in daily extremes of temperature and precipitation in Hainan Island of South China. ARPN J. Eng. Appl. Sci. 2015, 10, 6583–6592. [Google Scholar]
- Zhang, Q.; Shi, Q.; Chen, G.; Fong, T.C.W.; Wong, D.C.C.; Huang, H.; Wang, H.; Zhao, M. Status monitoring and health assessment of Luhuitou fringing reef of Sanya, Hainan, China. Chin. Sci. Bull. 2006, 51, 81–88. [Google Scholar] [CrossRef]
- Roder, C.; Wu, Z.; Richter, C.; Zhang, J. Coral reef degradation and metabolic performance of the scleractinian coral Porites lutea under anthropogenic impact along the NE coast of Hainan Island, South China Sea. Cont. Shelf Res. 2013, 57, 123–131. [Google Scholar] [CrossRef]
- Schlacher, T.A.; De Jager, R.; Nielsen, T. Vegetation and ghost crabs in coastal dunes as indicators of putative stressors from tourism. Ecol. Indic. 2011, 11, 284–294. [Google Scholar] [CrossRef]
- Cheng, Z.; Zhang, J.; Shangguang, T. Relationship between tourism development and vegetation environment in Luya Mountain Nature Reserve: Tourism influencing index and some indices analysis. Acta Ecol. Sin. 2003, 23, 703–711. [Google Scholar]
- Zhang, J.-T.; Xiang, C.; Li, M. Effects of tourism and topography on vegetation diversity in the subalpine meadows of the Dongling Mountains of Beijing, China. Environ. Manag. 2012, 49, 403–411. [Google Scholar] [CrossRef]
- Frey, C.; Parlow, E.; Vogt, R.; Harhash, M.; Wahab, M.A. Flux measurements in Cairo. Part 1: In situ measurements and their applicability for comparison with satellite data. Int. J. Climatol. 2011, 31, 218–231. [Google Scholar] [CrossRef]
- Frey, C.; Parlow, E.; Vogt, R.; Harhash, M.; Wahab, M.A. Validation of satellite observed thermal emission with in-situ measurements over an urban surface. Remote Sens. Environ. 2006, 104, 201–210. [Google Scholar]
- Parlow, E.; Vogt, R.; Feigenwinter, C. The urban heat island of Basel–seen from different perspectives. DIE ERDE J. Geogr. Soc. Berlin 2014, 145, 96–110. [Google Scholar]
- Chrysoulakis, N.; Grimmond, C.S.B.; Feigenwinter, C.; Lindberg, F.; Gastellu-Etchegorry, J.-P.; Marconcini, M.; Mitraka, Z.; Stagakis, S.; Crawford, B.; Olofson, F.; et al. Urban energy exchanges monitoring from space. Sci. Rep. 2018, 8, 11498. [Google Scholar] [CrossRef] [Green Version]
- Liu, J.; Zhang, Z.; Xu, X.; Kuang, W.; Zhou, W.; Zhang, S.; Li, R.; Yan, C.; Yu, N.; Wu, S.; et al. Spatial patterns and driving forces of land use change in China during the early 21st century. J. Geogr. Sci. 2010, 20, 483–494. [Google Scholar] [CrossRef]
- Ning, J.; Liu, J.; Kuang, W.; Xu, X.; Zhang, S.; Yan, C.; Li, R.; Wu, S.; Hu, Y.; Du, G.; et al. Spatiotemporal patterns and characteristics of land-use change in China during 2010–2015. J. Geogr. Sci. 2018, 28, 547–562. [Google Scholar] [CrossRef] [Green Version]
- Liu, J.; Zhang, Z.; Zhuang, D. A study on the spatial-temporal dynamic changes of land-use and driving forces analyses of China in the 1990s. Geogr. Res. 2003, 22, 1–12. [Google Scholar]
Figure 1.
Map of Hainan Island together with the county boundary and relative elevation change.

Figure 2.
The research workflow (the steps shown in orange are carried out in GEE, and the steps shown in blue with a desktop-based Geographic Information Systems (GIS) platform).
Figure 2.
The research workflow (the steps shown in orange are carried out in GEE, and the steps shown in blue with a desktop-based Geographic Information Systems (GIS) platform).

Figure 3.
Comparison of annual variation of MODIS derived Land Surface Temperatures (LST) and air temperature from four weather stations on Hainan Island.
Figure 3.
Comparison of annual variation of MODIS derived Land Surface Temperatures (LST) and air temperature from four weather stations on Hainan Island.

Figure 4.
Population figures for Hainan Island from 2000 to 2018 (The data source is the Annual Statistics Yearbook from National Bureau of Statistics of China (2000 to 2018) listed in Table 1).
Figure 4.
Population figures for Hainan Island from 2000 to 2018 (The data source is the Annual Statistics Yearbook from National Bureau of Statistics of China (2000 to 2018) listed in Table 1).

Figure 5.
The spatial distribution of two classes and four sub-classes sites.

Figure 6.
The mean temperature by pixel in the study area for period from 2000 to 2019 (the areas shaded in blue represented the relatively low temperature locations while the pixels shaded in red represented the relatively high temperature locations).
Figure 6.
The mean temperature by pixel in the study area for period from 2000 to 2019 (the areas shaded in blue represented the relatively low temperature locations while the pixels shaded in red represented the relatively high temperature locations).

Figure 7.
Annual LST variation in tourism-related and in non-tourism-related sites: ((a) Box and Whisker plots of long-term (20-year) variation of LST showing relatively high mean (30.3 °C) and median (30.5 °C) LST in tourism-related sites against a mean and median of 29.1 °C in non-tourism related sites. (b) Annual mean LST variation showing positive and negative trends of change in tourism-related sites and in non-tourism related sites, respectively).

Figure 8.
The statistics of the mean LST for the four function-defined tourism-related sites.

Figure 9.
The annual LST anomaly variations for the tourism-related and non-tourism-related sites.

Figure 10.
Normalized Difference Vegetation Index (NDVI) variations from 2000 to 2019 ((a)-The long-term mean NDVI variation; (b)-The annual mean NDVI variation).
Figure 10.
Normalized Difference Vegetation Index (NDVI) variations from 2000 to 2019 ((a)-The long-term mean NDVI variation; (b)-The annual mean NDVI variation).

Figure 11.
The land cover comparison in 2000 and 2018.

Figure 12.
Land cover matrix dynamics and LST changes: ((a) The land cover matrix dynamics; (b) The LST changes on the different land cover transformation).
Figure 12.
Land cover matrix dynamics and LST changes: ((a) The land cover matrix dynamics; (b) The LST changes on the different land cover transformation).


Table 1.
Overview of the primary datasets.
| Theme | Data Type/Images Numbers | Resolution/Scale | Time | Source |
|---|---|---|---|---|
| MOD11A2.006 Terra Land Surface Temperature and Emissivity 8-Day Global 1 km | Satellite imagery/913 imageries | 1000 m | 2000–2019 | U.S. Geological Survey (USGS) and hosted in GEE archive |
| MOD13A2.006 Terra Vegetation Indices 16-Day Global 1 Km | Satellite imagery/457 imageries | 1000 m | 2000–2019 | U.S. Geological Survey (USGS) and hosted in GEE archive |
| Land use/land cover data in China | Satellite Imagery | 1000 m | 2000 and 2018 | Resource and Environment Data Cloud Platform of the Chinese Academy of Sciences |
| National boundary Towns and Cities | Vector/Polygon /Point | 1:1,000,000 | 2015 | Resource and Environment Data Cloud Platform of the Chinese Academy of Sciences |
| POIs | Vector/Point | 2019 | Amap Open Platform | |
| Population statistics in Hainan | Numbers | 2000–2018 | Annual Hainan Statistics Yearbook from the National Bureau of Statistics in Hainan (2000 to 2018) |
Table 2.
The function-defined classification of sites.
| Class | Sub-Classes | The Function/Descriptions of Sub-Classes |
|---|---|---|
| Tourism-related sites | Residential sites along shorelines | Residential real estate along the shoreline hosting new immigration & tourists which located within 10 km buffer of shoreline |
| Accommodation service sites | Tourism-related accommodation services, including hotels and other accommodation facilities | |
| Other tourism-related sites | Recreation, shopping, dining, transportation and other commercial sites. | |
| Orchard sites | Transformed from forest and cultivated land into orchard | |
| Non-tourism-related sites | Unchanged land-use type, original residential sites, transportation, leisure places, etc. |
Table 3.
The land cover changes between 2000 and 2018 (* represents land cover classes that increased in size in 2018 in comparison to their baseline areas in 2000).
Table 3.
The land cover changes between 2000 and 2018 (* represents land cover classes that increased in size in 2018 in comparison to their baseline areas in 2000).
| Land Cover Classes in The Follow-Up Year (2018) | ||||||||||||
|---|---|---|---|---|---|---|---|---|---|---|---|---|
| Land Cover | Cropland | Dense forest | Shrubland | Sparse Forest | Orchard | Grassland | Water | Urban | Bareland | Wetland | Area (Km2) | |
| Baseline land cover (2000) | Cropland | 4728 | 1254 | 581 | 246 | 1057 | 184 | 318 | 526 | 16 | 8 | 8918 |
| Dense Forest | 1283 | 10,037 | 291 | 202 | 629 | 428 | 246 | 185 | 5 | 0 | 13,306 | |
| Shrubland | 553 | 337 | 1139 | 49 | 179 | 76 | 66 | 86 | 5 | 1 | 2491 | |
| Sparse forest | 246 | 175 | 59 | 287 | 118 | 36 | 33 | 28 | 2 | 0 | 984 | |
| Orchard | 1041 | 451 | 212 | 76 | 2831 | 72 | 142 | 138 | 8 | 0 | 4971 | |
| Grassland | 174 | 440 | 74 | 39 | 76 | 327 | 47 | 36 | 2 | 2 | 1217 | |
| Water | 253 | 197 | 39 | 19 | 110 | 30 | 485 | 70 | 7 | 2 | 1212 | |
| Urban | 281 | 82 | 21 | 13 | 66 | 13 | 66 | 207 | 1 | 0 | 750 | |
| Bareland | 42 | 4 | 7 | 6 | 5 | 10 | 17 | 10 | 24 | 0 | 125 | |
| Wetland | 4 | 1 | 0 | 0 | 0 | 0 | 1 | 6 | 0 | 3 | 15 | |
| Area (km2) | 8605 | 12,978 | 2423 | 937 | 5071 | 1176 | 1421 | 1292 | 70 | 16 | 33,989 | |
| Change | −313 | −328 | −68 | −47 | 100 * | −41 | 209 * | 542 * | −55 | 1 * | ||
© 2020 by the authors. Licensee MDPI, Basel, Switzerland. This article is an open access article distributed under the terms and conditions of the Creative Commons Attribution (CC BY) license (http://creativecommons.org/licenses/by/4.0/).
Share and Cite
MDPI and ACS Style
Chu, L.; Oloo, F.; Chen, B.; Xie, M.; Blaschke, T. Assessing the Influence of Tourism-Driven Activities on Environmental Variables on Hainan Island, China. Remote Sens. 2020, 12, 2813. https://0-doi-org.brum.beds.ac.uk/10.3390/rs12172813
AMA Style
Chu L, Oloo F, Chen B, Xie M, Blaschke T. Assessing the Influence of Tourism-Driven Activities on Environmental Variables on Hainan Island, China. Remote Sensing. 2020; 12(17):2813. https://0-doi-org.brum.beds.ac.uk/10.3390/rs12172813
Chicago/Turabian StyleChu, Lixia, Francis Oloo, Bin Chen, Miaomiao Xie, and Thomas Blaschke. 2020. "Assessing the Influence of Tourism-Driven Activities on Environmental Variables on Hainan Island, China" Remote Sensing 12, no. 17: 2813. https://0-doi-org.brum.beds.ac.uk/10.3390/rs12172813
Note that from the first issue of 2016, this journal uses article numbers instead of page numbers. See further details here.