Article

A GIS-Based Landslide Susceptibility Mapping and Variable Importance Analysis Using Artificial Intelligent Training-Based Methods

1
Department of Physical Geography and Ecosystem Science, Lund University, 223-62 Lund, Sweden
2
Department of Earth Sciences, Institute for Advanced Studies in Basic Sciences (IASBS), Zanjan 45137-66731, Iran
3
Center for Research in Climate Change and Global Warming (CRCC), Zanjan 45137-66731, Iran
4
Center for Middle-Eastern Studies, Lund University, 223-62 Lund, Sweden
*
Author to whom correspondence should be addressed.
Submission received: 17 November 2021 / Revised: 16 December 2021 / Accepted: 31 December 2021 / Published: 4 January 2022

Abstract

:
Landslides often cause significant casualties and economic losses, and therefore landslide susceptibility mapping (LSM) has become increasingly urgent and important. The potential of deep learning (DL) like convolutional neural networks (CNN) based on landslide causative factors has not been fully explored yet. The main target of this study is the investigation of a GIS-based LSM in Zanjan, Iran and to explore the most important causative factor of landslides in the case study area. Different machine learning (ML) methods have been employed and compared to select the best results in the case study area. The CNN is compared with four ML algorithms, including random forest (RF), artificial neural network (ANN), support vector machine (SVM), and logistic regression (LR). To do so, sixteen landslide causative factors have been extracted and their related spatial layers have been prepared. Then, the algorithms were trained with related landslide and non-landslide points. The results illustrate that the five ML algorithms performed suitably (precision = 82.43–85.6%, AUC = 0.934–0.967). The RF algorithm achieves the best result, while the CNN, SVM, the ANN, and the LR have the best results after RF, respectively, in this case study. Moreover, variable importance analysis results indicate that slope and topographic curvature contribute more to the prediction. The results would be beneficial to planning strategies for landslide risk management.

1. Introduction

Landslides as the most occurring geo-hazard lead to severe landscape damage all over the world [1]. The international databases on the casualties of the landslides reported more than 3876 landslides during the period 1995–2014 in 128 countries around the world, which caused 11,689 injuries and 163,658 deaths [2]. It is therefore important and necessary to investigate the landslide susceptibility mapping for improving disaster management and mitigation strategies [3].
The Zanjan province of Iran experiences a high number of landslides annually due to its mainly mountainous topography, diverse geological and morphological structures, and different climatic conditions, which cause considerable damage to the region. However, the development of big industries and large infrastructure projects is notable in this region. Consequently, investigating landslides and planning mitigation strategies are major problems facing the case study area for sustainable development. Moreover, little effort has been made to assess or predict these landslides. The only study for producing landslide susceptibility maps in the Zanjan province has been conducted by Boroumandi, et al., (2015) which is based on low-resolution data and a multi-criteria decision making (MCDM) approach [4]. Therefore, more studies are needed for this important issue.
Due to the various influencing factors, landslides are considered complicated natural disasters [4,5,6,7]. The main idea of landslide susceptibility maps (LSMs) is to forecast areas that are susceptible to landslides based on the influencing factors. Influencing factors primarily include lithology (e.g., soil/rock type), geomorphological characterization (e.g., slope, aspect), climate and hydrologic settings, and infrastructures [8,9]. Methods to produce LSMs usually consider a set of causative factors, depending on the physical characteristics and the area of landslides [10]. The relationship between influencing factors and landslide susceptibility is complicated and remains unknown in Zanjan, which is worthy of more effort in landslide susceptibility modeling and mapping.
Previous research has reported the ability of machine learning (ML) methods [6,11], and recently deep learning (DL) methods as a subclass of ML, in recognizing susceptible areas to landslides in different regions [12,13]. It has been indicated that the performance of ML methods could be different with respect to the region, input influencing factors, the accuracy of input data, etc. So in order to produce the most proper LSM, different ML techniques need to be examined. In particular, the potential of CNNs in this field based on causative factors has not been fully explored yet, especially by comparing its performance with the conventional machine learning algorithms. Herein, the performance of the convolutional neural network (CNN), random forest (RF), artificial neural network (ANN), support vector machine (SVM), and logistic regression (LR) are compared in producing LSM due to the complexity of influencing factors. Comparing the performance of different methods in landslide susceptibility mapping can provide analysts with guidance for the selection of the appropriate one for the study area in Zanjan. Moreover, the priority of the causative factors has been investigated, which is a crucial issue in decision-making to manage and decrease the influence of casualties related to this hazard.

2. Literature Review

The approaches of producing LSMs based on influencing factors are categorized into multi-criteria decision analysis (MCDA), statistical methods, and ML techniques based on the literature. MCDA methods have been widely employed for generating LSMs, while detailed data of selected sites and weighting information of landslide occurrence factors considering experts’ opinions are required (e.g., [14]). In contrast, ML techniques can be used to learn and predict the association of the landslides’ positions and their associated causative factors (e.g., [15,16,17]). ML techniques do not need statistical assumptions and also can model the nonlinear character of landslides [9,12]. Therefore, ML, especially DL techniques, have been attracting more attention in landslide studies.
In the literature, a series of studies have implemented different ML algorithms for LSM in different countries. For example, Chen et al., (2017) compared maximum entropy (MaxEnt), support vector machines (SVM), and artificial neural networks (ANN) for producing LSM in the Wanyuan area of China. The results showed that the ANN obtains more precise outcomes in comparison with other techniques in terms of area under the curve (AUC). Pham et al. (2017) investigated the efficiency of ensemble ML methods for landslide susceptibility assessment by conducting the case study in Himalayan area of India. The results indicated that machine learning ensemble techniques can significantly improve the performance of base classifiers [18]. Pourghasemi and Rahmati (2018) investigated the performance of ten different ML approaches for achieving LSM in the Ghaemshahr Region of Iran. It is indicated that RF achieved the best performance compared with other ML models [6]. Pourghasemi et al. (2018) attempted to produce landslide susceptibility maps for Jumunjin Country in South Korea with three ML algorithms, namely Logistic Regression (LR), LogitBoost (LB), and NaïveBayes (NB) [19]. Kavzoglu et al. (2019) applied ML techniques, including bagging, random forest (RF), rotation forest (RotFor) and support vector machines (SVM), to landslide susceptibility analysis by conducting a case study in the Mackaregion of Trabzon, Turkey [20]. Nguyen et al. (2019) developed three novel hybrid machine learning models for landslide susceptibility modeling and validated them in the study area of the Van Chan district of Yen Bai province, Vietnam [21]. It was determined that Best First Decision Trees-based Rotation Forest (RFBFDT) achieved the best performance. Achour and Pourghasemi (2020) explored how ML techniques can increase the accuracy of landslide susceptibility maps in the vicinity of the A1 Highway corridor at Ain Bouziane, Algeria. By evaluating the landslide susceptibility using three ML methods, namely support vector machine (SVM), random forest (RF), and boosted regression tree (BRT), the RF model achieved the highest predictive accuracy [22]. Di Napoli et al., (2020) presented an approach based on the ensemble of artificial neural networks for landslide susceptibility mapping and tested it in the Monterosso al Mare area, Cinque Terre National Park, Northern Italy. The efficacy and suitability of the proposed approach was confirmed in land management [23]. Huang et al. (2020) compared the ML models represented by binary logistic regression (BLR), support vector machine (SVM), Multilayer Perceptron (MLP), back-propagation neural network (BPNN) and C5.0 decision trees (C5.0 DT) with the heuristic model analytic hierarchy process (AHP), and the statistical models like general linear model (GLM) and information value (IV) model for landslide susceptibility prediction and mapping. By applying the above-mentioned models to the study area of Shicheng County in China, the results showed that C5.0 DT yielded the highest prediction accuracy [24]. Orhan et al. (2020) utilized five machine learning models, including logistic regression (LR), artificial neural network (ANN), support vector machine (SVM), classification and regression tree (CART), and random forest (RF), to produce landslide susceptibility maps in the Arhavi-Kabisre river basin of Turkey [25]. Ali et al. (2021) conducted a comparison study on producing LSM between fuzzy MCDM and ML methods in the Kysuca river basin of Slovakia. The results concluded that RF is an optimal and promising model for landslide susceptibility in the study area [26]. Youssef and Pourghasemi (2021) evaluated the capabilities of seven advanced ML techniques for landslide susceptibility modeling and mapping in the Abha Basin of the Asir Region in Saudi Arabia. It was determined that RF produced the best performance [17].
Recently, DL methods have been successfully used for producing LSMs. For instance, Wang et al. (2019) developed a CNN framework for generating LSM and tested it in the case study area of Yanshan County in China [27]. The work of Bui et al. (2020) introduced a Deep Learning Neural Network (DLNN) for LSM and compared its suitability with ML methods in the study area of the Kon Tum Province, Vietnam. The results indicated that the suggested algorithm had better results in comparison with the other four ML models used, including ANN, SVM, decision tree (DT), and the RF [28]. Van Dao et al. (2020) developed an explicit DL neural network model for the prediction of landslide susceptibility at the Muong Lay district, Vietnam. The results validated the efficiency of the developed method [29]. Mandal et al. (2021) compared a DL algorithm convolutional neural network model (CNN) with three typical ML algorithms represented by the random forest model (RF), artificial neural network (ANN), and bagging model for LSM in the Rorachu river basin of Sikkim Himalaya, India. The results showed that CNN achieved the best performance [30]. Kavzoglu et al. (2021) proposed an ensemble DL architecture based on Convolutional Neural Network (CNN), Recurrent Neural Network (RNN), and Long Short-Term Memory (LSTM) for LSM. The ensemble form CNN-RNN-LSTM was demonstrated to be of the highest modeling performance by testing it in Trabzon province, Turkey [31]. In the study of Ngo et al. (2021), two DL algorithms, namely recurrent neural network (RNN) and CNN, were applied for producing LSM on a national scale in Iran. Both of them presented a promising performance on this large scale [13].
In summary, the review of previous studies demonstrates that this research is not the first to employ CNNs for generating LSMs; however, the potential of CNNs in this field based on different causative factors has not been fully explored yet, especially by comparing its performance with the conventional ML algorithms and prioritizing the causative factors of landslides.

3. Study Area and Data

In this section, first, the case study area and its characteristics will be described. Then, the employed landslide causative factors and their data sources and accuracy will be explained.

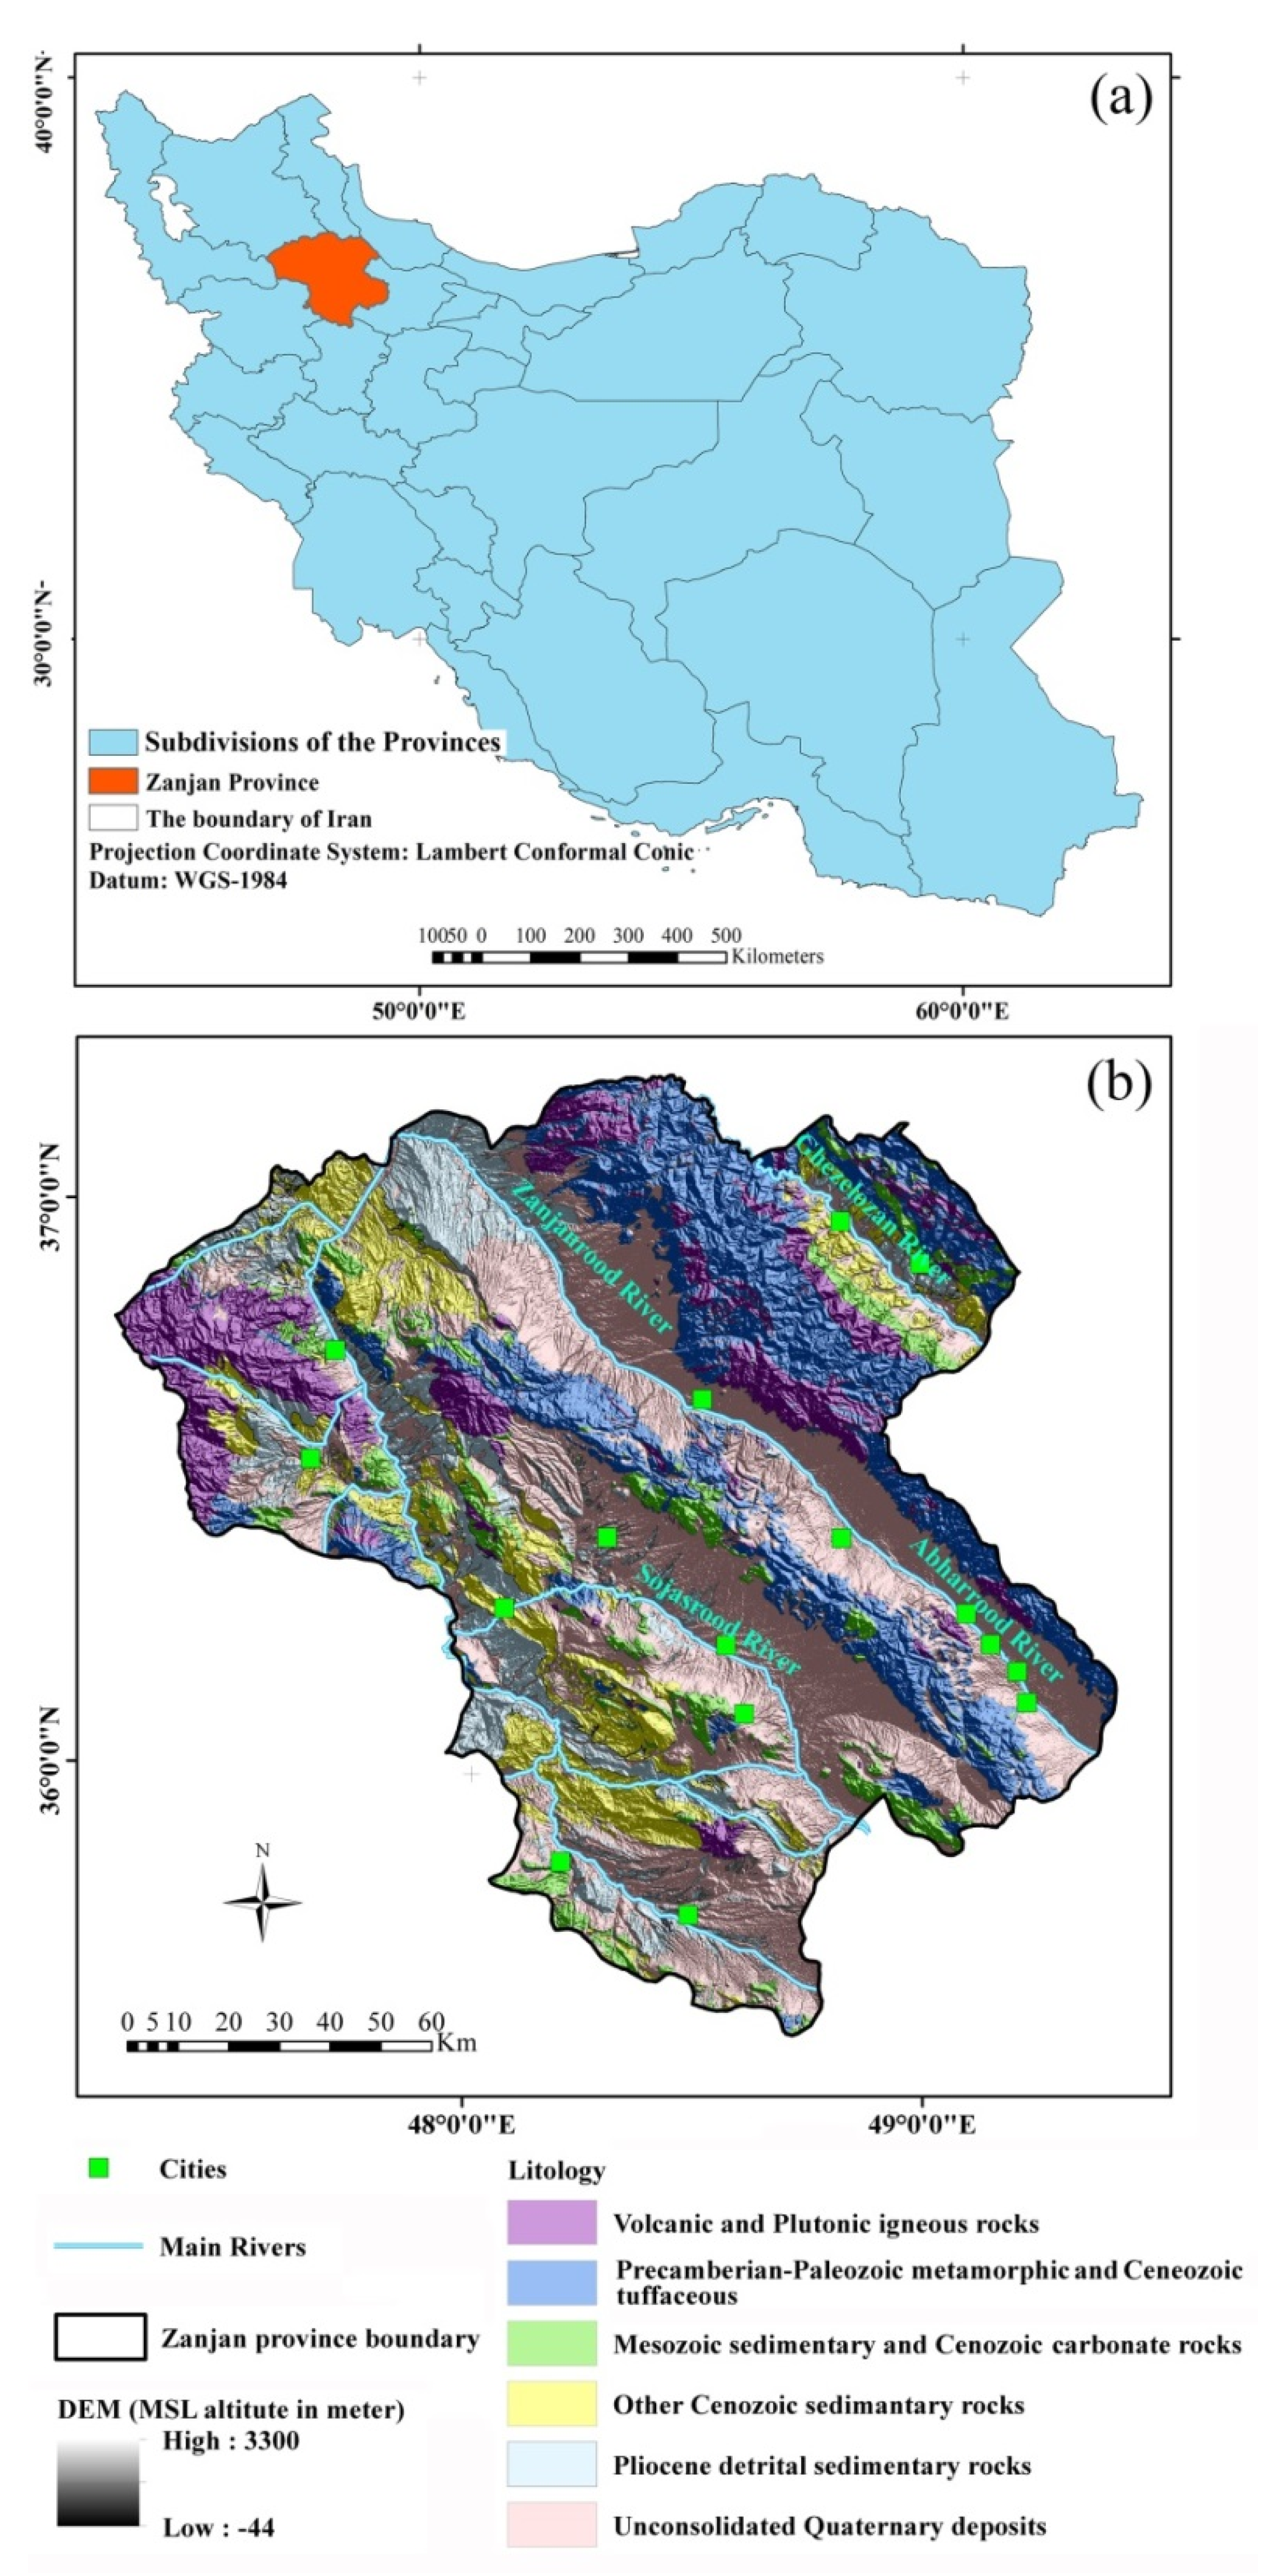
3.1. The Case Study Area

Zanjan province in northwest Iran is the case study area (Figure 1) of this research. The area of Zanjan province is approximately 22,000 km2 and it has a population of approximately 900,000. As shown in Figure 1, Zanjan province has two mountainous and plain regions in terms of land appearance. In terms of topography, it is a mountainous region that has been formed as a high plateau. The region has independent plains due to the breakdown of major rivers. The roughness of the province is divided into the mountains of North Zanjan and the mountains of South Zanjan. In terms of geographical divisions, the North Zanjan Mountains are a continuation of the Alborz Mountains in Iran and the South Zanjan Mountains are part of the Central Single Mountains. The direction of the mountains is naturally continuous from northwest to southeast, and the valley of the Zanjan River is the longest valley in the region. The northern heights of Zanjan province as part of the western Alborz have a mountainous morphology. Most of the wastewater of these heights is discharged to the Caspian Sea through the Ghezel Ozon and Sefidrud rivers. The climate of the province is affected by two important factors, namely the entry of huge moisture and heat fronts, and the topographic condition and altitude. The predominant climatic type of the province is semi-arid ultra-cold (52%) and cold (18%), which covers about 70% of the province. The average rainfall of the province during 1996–2021 is about 300 mm per year. Moreover, in Figure 1 the classification of lithological structure is presented based on the average stability and resistance characteristic of rock units which is respectively from higher resistance to lower resistance in the aspect of landslide occurrence probability in the legend. Due to special lithological conditions, topographic structure and land slope, especially in rural areas, Zanjan province experiences landslides that cause considerable financial losses each year. Figure 2 illustrates the histogram of previous landslides and their related areas. As can be seen in Figure 2, the number of landslides and their related area in the province is substantial and causes significant damage to individuals and the government annually.

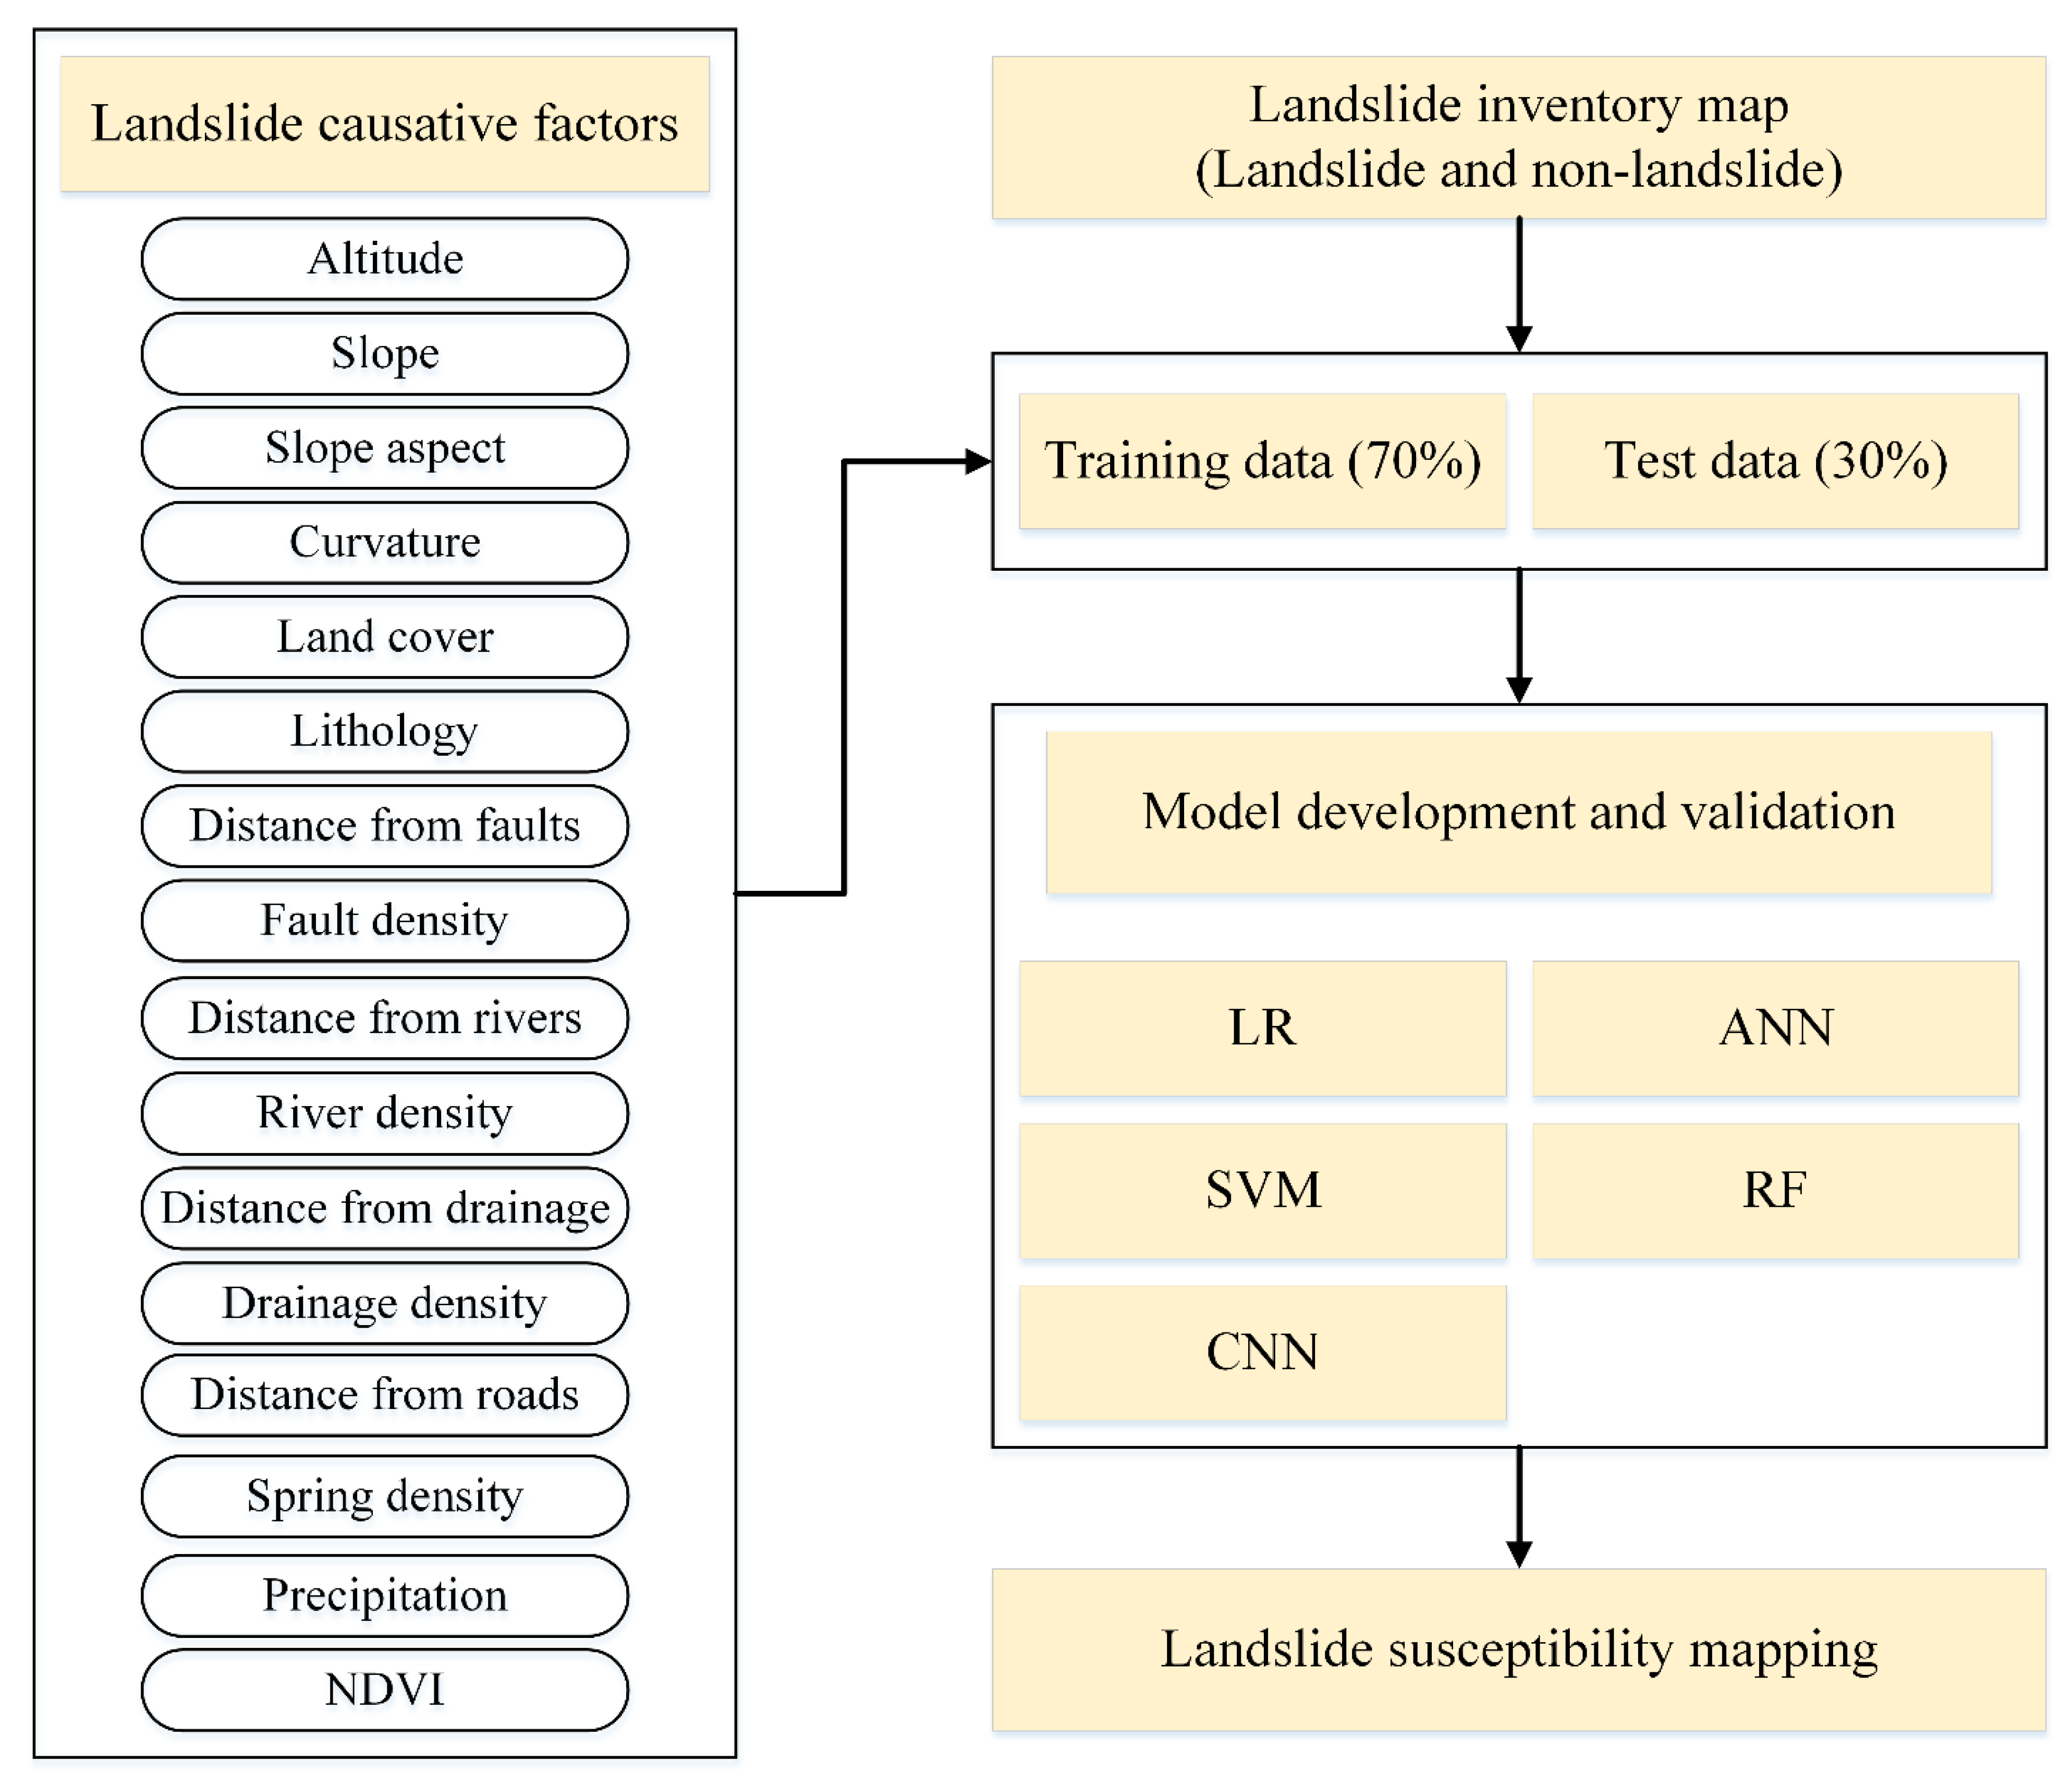
3.2. The Causative Factors of Landslides

Sixteen causative factors of landslides were prepared, containing altitude, slope, aspect, topographic curvature, land use, lithology, distance from lineaments, lineaments density, distance from faults, the density of faults, distance from roads, springs density, river density, distance from rivers, NDVI, and precipitation. These factors are selected based on the literature [8,19,20,32,33,34]. The processed data of this research and their sources are presented in Table 1.

3.2.1. Altitude

Altitude controls the direction of the waterways and the density of the drainage networks and has a significant effect on soil moisture and the gradient of slope [35]. To produce the altitude layer, a DEM of the study area is created using a contour map of the 1:25,000 scale. Figure 3 shows all factor maps used in this research and Figure 3a presents the generated altitude map.

3.2.2. Slope

The slope controls the shear forces acting on hill slopes and is one of the critical causative factors in occurring landslides (Dou et al. 2015). Theoretically, the risk of landslides increases in areas with higher slope, and decrease to zero in areas with a slope below 5 [36]. The map of the slope is produced based on DEM, as presented in Figure 3b.

3.2.3. Slope Aspect

The aspect of the slope, together with the sunlight exposure affects the soil moisture [36]. In the northern hemisphere, the south and west directions are exposed to sunlight for a longer period than the north and east directions. As a result, more sunlight radiation causes evapotranspiration to increase and soil moisture to decrease. But the north slopes will have lower temperatures due to less sunlight. Figure 3c shows the slope aspect map.

3.2.4. Topographic Curvature

Total topography curvature is the change in slope of the topographic surface along a small arc of the curve. This factor is found as a triggering factor in landslides influencing the mass motion velocity and direction [37]. The factor map of total curvature is presented in Figure 3d.

3.2.5. Land Use

Land use indirectly affects slope stability. For example, vegetation affects hydrological processes due to the effect of hydraulic conductivity [38]. Therefore, in the regions with low vegetation, landslides are expected to occur. Figure 3e shows the land use/cover map of Zanjan province. Land uses are shown from low risk to high risk, respectively.

3.2.6. Lithology

Lithology and its diverse structures often lead to differences in the stability and resistance of rocks, as well as the diversity of soil [39]. The stronger rocks, such as igneous and metamorphic, provide more resistance to the forces in comparison with the weaker rocks, such as most sedimentary rocks, and therefore are less disposed to landslides [4,40]. The geological structure of Zanjan province has a diversity of rocks. Using geological quadrangle maps of the Zanjan province along with Landsat 8 images, six classes of lithological units were considered in this study (Figure 3f). The classification is based on average stability and resistance characteristic of rock units which respectively from higher resistance to the lower one.

3.2.7. Distance from Faults and the Density of Faults

The development of cracks and shear fractures along the fault zones, formation of fault damage zones, and fault rocks have a serious role in the stability of rocks and their water infiltration physical characteristics. Moreover, tectonic activities have an accelerating effect on the landslides occurrence [41]. The related map of the faults is presented in Figure 3g.

3.2.8. Distance from Rivers and the Density of Rivers

Many landslides are caused by the underflow of slopes (collapse of unstable slopes) due to surface erosion by runoff. This action increases the impact of the destructive shear forces which results in slope instability adjacent to the river channels [42]. The map of rivers is displayed in Figure 3h.

3.2.9. Distance from Roads

Human activities such as road constructions in mountainous areas are one of the most effective factors of landslides in sloping areas. The distance map of roads was generated using the Euclidean distance method from the road network which is shown in Figure 3i.

3.2.10. The Density of Lineaments

Lineaments are linear sequences that include faults, joints, and fissures or the boundary between formations on the earth’s surface and have different dimensions and orientations [43]. The presence of lineaments in an area causes more water to penetrate into the joints and cracks, thereby increasing the likelihood of landslides [44]. In order to extract the lineaments in the study area, directional edge detection filters of 0°, 45°, 90°, and 135° were applied on the 10-m resolution Sentinel 2 satellite images and also to the 30-m resolution DEM of the study area. The employed directional derivative filter is stated in Equation (1).
f = f x c o s   θ + δ f δ y s i n   θ
where δ f δ x shows the derivative of f in the x-direction, δ f δ y is the derivative of f in the y-direction and θ   shows the direction of the filter.
To be more precise, the resultant lineament map was then edited visually. Figure 3j shows the resultant lineaments.

3.2.11. The Density of Springs

The water infiltration of the springs in the surrounding sediments decreases the stress and shear strength of the slopes. Consequently, as the humidity increases, the pressure of the pore water also increases. Therefore, the likelihood of landslides is increased [45]. The map of springs is shown in Figure 3k.

3.2.12. NDVI

The presence of vegetation in slopes strengthens the hillsides and resistance to landslides [39]. In this research, vegetation density was computed employing the normalized difference vegetation index (NDVI) from Sentinel 2B (with the resolution of 10 m) satellite images using Equation (2) [36].
N D V I = N I R R E D N I R + R E D
where NIR and RED represent red bands and near-infrared in the spectrum of electromagnetic, correspondingly. The NDVI index differs between −1 to 1. Higher values imply denser vegetation. In contrast, sparse vegetation is identified by lower values of NDVI. Figure 4 shows the red band and infrared band of sentinel 2 optical images along with a related NDVI map of the study area.

3.2.13. Precipitation

Rain or snow infiltrates inside rocks and soil masses increases mass weight and increases landslide probability [36]. Herein, firstly, the annual precipitation of the synoptic stations produced from the Meteorological Organization of Iran and the Regional Water Company of Zanjan province and its neighboring provinces was collected. Next, the annual average of precipitation for 15 years (from 2003 to 2018) was calculated. Using inverse distance weighted (IDW) and Kriging interpolation methods, the precipitation maps were prepared. Comparing the error rates, it was found that the Kriging method has a lower error than the IDW method here. Therefore, according to Figure 4a, the rainfall map is prepared by the Kriging method and the results are categorized into five classes.
After calculating all the causative factors, we implement multicollinearity analysis to examine the correlations between these causative factors by calculating the variance inflation factor (VIF). VIF of one variable represents how well the variable is explained by other variables, which has been widely used for multicollinearity analysis in different applications (e.g. [46,47]). By calculating VIF values of each factor, they are within the range between one and two and all are far less than 10. This suggests that there is no multicollinearity among these causative factors.

3.3. Landslide Inventory Map

The landslide inventory map (LIM) is employed to train ML methods in this research, which is created by the forest and watershed management organization (FWMO) of Zanjan province. This map is created using the interpretation of aerial photos, Google Earth images, satellite image archives, and field mapping. Mentioned approaches are frequently used to produce the LIM for a large region [48]. Here, the landslides in the inventory map are recorded as points. In our study, we verified this map using accessible aerial photos and Landsat images, and also the morphological shape of the area. Finally, 2513 landslide points and 3287 non-landslide points are generated.

4. Methodology

Figure 5 presents the study methodology, which consists of the following steps. First, the landslide causative factors calculated based on various datasets in Section 3.2 along with the landslides from the LIM are used to train the models. Second, four conventional ML models, including RF, LR, SVM, and ANN, and CNN as one of the typical DL methods are used for landslide susceptibility prediction. Third, several commonly used evaluation measures are used to assess the prediction performance, which is elaborated in Section 4.1. In addition, the variable (or feature) importance is evaluated for each model based on the permutation-based variable accuracy importance methods, which is introduced in Section 4.2.

4.1. Machine Learning Algorithms

4.1.1. Logistic Regression (LR)

Logistic regression [49] is a multivariate technique that considers multiple physical parameters that may affect the probability of landslide occurrence. The dependent variable can only have two values as occurrence or not. So, LR is well suited in describing and validating the relationship between categorical outcome variables (landslide or non-landslide) and independent variables (landslide causative factors). For landslide susceptibility mapping, LR aims to find the best-fitting model to describe the relationship of the occurrence or not of landslides with the independent variables.

4.1.2. Artificial Neural Network (ANN)

ANN is a computational mechanism that generates new information by analyzing and processing relations in the input data as a generic nonlinear function approximation algorithm which has been widely used for landslide susceptibility mapping (e.g., [50,51]). The back-propagation training algorithm, as the most frequently used ANN method, was used in this study. This method searches for the minimum error values in weight space using the method of gradient descent. The weights which minimize the error values produce the best solution for the learning process. Here, multilayer perceptron (MLP), a type of ANN, was used which includes at least three layers of nodes: an input layer, a hidden layer, and an output layer. The first step is coding the factors affecting the landslide as the input layer. In this study, all causative factors in Figure 3 are considered as the number of neurons in the input layer and one neuron as the output neuron for the neural network. Trial and error methods are also used to determine the number of neurons in the hidden layers.

4.1.3. Support Vector Machine (SVM)

SVM is a supervised machine learning classification method that can be used with linearly non-separable and high dimensional datasets. It has been extensively and effectively used for a range of classification and regression problems [52]. It is based on the statistical approach to determine an optimal hyperplane with a maximum margin for separating two classes, such as landslide and non-landslide. Its performance is affected by the kernel function, which can be linear, radial basis function (RBF), sigmoid, or polynomial function. In this study, the RBF kernel is selected for the SVM model that is applied to calculate the landslide susceptibility index, the performance of which is influenced by the value of the kernel width gamma. In addition, the regularization parameter C also affects the performance of SVM. The two optimal hyper-parameters are obtained using the grid search method, which is considered one of the most reliable optimization techniques.

4.1.4. Random Forest (RF)

Random forest was first proposed by Breiman (2001) as a significant ensemble machine learning method, and has been widely used to deal with classification or regression issues in many fields (e.g., [53,54,55]). When solving classification problems, many classification trees are generated and aggregated to compute a classification. A single decision tree is a weak classifier, which normally has either a high variance or high bias. RF attempts to achieve a balance between two types of errors by increasing the diversity among the classification trees. The bagging technique is used to resample the data with a replacement for the training model. When splitting a node, only a random subset of the features is taken into account to make trees more random. By building multiple decision trees and merging them, more accurate and stable predictions can be generated. The number of trees and the number of predictive variables used to split the nodes are two main required hyperparameters. In summary, each tree in the random forest carries out a class prediction and the class with the most votes is determined as the prediction of the model. In this study, two hyperparameters, namely the number of trees and the number of features to be selected for the best split, are tuned with the grid search method.

4.1.5. Convolutional Neural Network (CNN)

Deep learning methods have recently attracted more attention and achieved remarkable success in many fields. The convolutional neural network (CNN), as a type of deep learning model for processing data that has a grid pattern (e.g., image), has been recognized as one of the most successful and widely used DL algorithms [56], and was gradually used in the latest landslide susceptibility studies. As a class of artificial neural networks, CNN is designed to automatically and adaptively learn features through backpropagation by using convolution layers, pooling layers, and fully connected layers. Compared with a fully connected neural network where each neuron in one layer is connected to all neurons in the next layer, the neurons within any given layer in CNN will only connect to a small region of the layer preceding it [57].
A typical CNN architecture is comprised of an input layer, the repetition of a stack of multiple convolutional layers, and a pooling layer, followed by one or more fully connected layers, and an output layer. The input layer is an m × n matrix in which every element corresponds to a feature value. The input data thus can be represented as a two-dimensional map. A convolution layer is a fundamental component of the CNN architecture that consists of several convolutional units, and the parameters of each unit are optimized by a back-propagation algorithm [27,58]. The aim of the convolutional layer is to extract different features of the input layer. The purpose of the pooling layer is to decrease the computational power required to process the data by dimensionality reduction. Max pooling is the most popular form of pooling operation. Hence, compared with the conventional ML methods that directly classify the input data and cannot uncover more representative features from these data, CNN can automatically and adaptively learn features from the input data to further improve classification accuracies. Once the features are created via the convolutional layers and the pooling layers, they are mapped to the final outputs of the network by fully connected layers. Since the CNN model requires 2D images as the inputs, the data on landslide causative factors is incapable of fitting the input of the CNN model. The two-dimensional data representation method is introduced to address this issue [27].

4.2. Evaluation Measures

The evaluation measures are important in determining the performance of classification and managing the classifier modeling. In this study, binary classification methods are developed to predict landslide susceptibility. Six statistical measures including sensitivity/recall/true positive rate, specificity, accuracy, precision, and receiver operating characteristics (ROC) curves are utilized to gauge the classification capability. Readers can refer to Orhan et al., 2020 for more detail about these statistical measures. Generally, the following equations are used to calculate these measures:
Sensitivity   =   TP     TP   +   FN    
Specificity   =   TN     TN + FP    
Accuracy   =   TN   +   TP     TN   + T P + F N + F P  
Precision =   TP     TP   +   FP    
False -positive   rate   =   FP T N + F P  
F 1 measure   = 2 × T P 2 × T P + F N + F P  
In which P indicates the number of landslides in total, N shows the number of non-landslides points; true positive (TP) and true negative (TN) are the numbers of samples that are classified correctly; false positive (FP) and false-negative (FN) are the numbers of samples which are misclassified.
The ROC curves have been extensively used to evaluate the performance of prediction in the ML methods (e.g., [27,59]). The ROC curve is generated using the plot of two parameters, including true positive rate and false positive rate, to display the performance of a classification model at different classification thresholds. The area under the curve (AUC) is also the index of model performance. A ROC curve for a good classifier usually rises sharply near the starting point and reaches approximately the maximum value of 1, which quantifies how well the model is capable of distinguishing between classes.

4.3. Feature Importance

The feature (or variable) importance assessment in ML studies facilitates the variable selection and supports meaningful interpretation. Nevertheless, it remains a complicated issue because of variation of the feature importance, interactions, and correlations among the features [60,61]. On the one hand, the importance of one feature could vary with the selected evaluation criterion, which results in the consequence that superfluous features of a certain classifier may be helpful for another classifier. On the other hand, the relevance of the two features could change in the context of other features.
Various methods have been suggested to measure the feature importance in recent years [62,63,64]. Herein, a widely employed method, namely permutation-based variable accuracy importance (PVAI), is used to assess the importance of features for various classifiers. The rationale of the method is that the importance of a feature is calculated based on comparing the variation in the performance of a classifier when the feature is randomly permuted in the test dataset. If the performance decreases more under the variation of a feature, its importance degree is higher.
In this work, the PVAI method is implemented to measure the importance of each feature for the five machine learning models. Specifically, each feature is permuted 10 times in the test dataset. The importance is measured by the reduction in accuracy. The decrease in sensitivity is taken as a measurement of the feature importance.

5. Results and Discussion

In this section, first, the performance of employed methods will be discussed. Then, the results of variable importance will be demonstrated, and finally, the susceptibility maps resulting in different methods will be presented.

5.1. Model Performance Comparison

The five introduced machine learning methods in the methodology are utilized to conduct landslide susceptibility analysis. We compare their performance with respect to the above-mentioned evaluation measures. First, the whole dataset including landslide and non-landslide points is randomly split into 4060 training data points (70%) and 1740 test data points (30%). Second, grid search with 10-fold cross-validation is employed to tune the hyperparameters of each classifier using training data. Moreover, the same test and training data are employed in all models to have comparable performance evaluation results.
Table 2 presents the model performance on the five machine learning models in terms of the evaluation measures in this case study. Concerning the performance for the classification of landslides, the RF model achieves the highest performance (precision = 85.6%), which is closely followed by the CNN model (accuracy = 83.88%), which is then followed by the ANN model (precision = 83.36%), SVM model (precision = 82.69%), and LR model (precision = 82.43%). It should be noted that, with regard to recall, the best performance is achieved by the LR model (recall = 97.8%), followed by the CNN model (recall = 97.24%), the RF model (96.86%), the SVM model (96.75%), and the ANN model (96.04%). This is mainly due to the lowest false-negative by the LR model. For the classification of non-landslides, the best results were attained by the RF method, with a specificity value of 89.82%. Moreover, the specificity of CNN, ANN, SVM, and LR were equal to 88.78%, 88.37%, 88.01%, and 87.93%, respectively. Considering the classification of both landslides and non-landslides, the RF model (accuracy = 92.53%) outperforms other models in terms of accuracy, followed by the CNN model (accuracy = 91.95%), the LR model (accuracy = 91.55%), the ANN model (accuracy = 91.26%), and the SVM model (accuracy = 91.26%). The same conclusion can be reached in terms of the F1 measure. The model performance is also evaluated in terms of the ROC curve and the AUC, as presented in Figure 6. It can be observed that the highest AUC value belongs to the RF model (AUC = 0.967). The ACU values of the CNN, ANN, SVM, and LR were also equal to 0.956, 0.946, 0.944, and 0.934, respectively. It is notable to say that the results here don’t mean RF is the best machine learning method for all prediction/classification tasks. The conclusion mainly indicates that RF can achieve the promising result of landslide susceptibility mapping in this study.
Overall, five ML models achieve promising performance on the prediction of LSM. Among them, the RF model has achieved the best performance, especially in identifying the landslides, which is reliable according to the conclusions from previous studies [6,26]. The CNN model ranks with the second-best performance, outperforming the other three conventional ML models LR, ANN, and SVM.

5.2. Variable Importance Analysis

The feature importance (FI) measurement has been commonly used for different purposes, such as feature engineering to reduce the number of variables, or detecting the most related variable for prediction within a dataset. In this study, the significance of each causative factor is evaluated using the permutation-based approach. This is executed by permuting each factor 10 times in the test dataset and reporting the resultant differences in accuracy.
Figure 7 illustrates the feature importance for the five machine learning models with boxplots. It can be found that slope and topographic curvature have very high PVAIs for all five ML classifiers. In particular, the most important causative factor, slope, achieves the highest PVAI values in the five classifiers. The topographic curvature is at the next level. The PVAI values of other features are much smaller than slope and curvature. Table 3 displays the top five most important variables that are ranked based on the mean of PVAI values of variables for each classifier. It should be noted that the ranks of other variables are different for the five machine learning models, except for slope and curvature. For example, the third most important variables are land use for the LR and ANN models, however, geology is the third most important for the SVM, RF, and CNN models. It is worth noting that the results about the importance of landslide causative factors have been obtained computationally here. As can be seen, slope and curvature, which indicate the instability of the terrain, are the most important factors in all ML methods in this study with the area near km2. However, datasets such as soil type, soil moisture, subsidence and so on, which are essential in the study of smaller scales, are not available in the whole case study area here. Accordingly, it is necessary to pay attention to the geological characteristics of soil type, soil moisture, and other causative factors rose on smaller scales for more accurate studies. Besides, from a physical point of view, the decision requires additional information.

5.3. Produced LSMs

After evaluating and comparing the performance of the five landslide prediction methods, all five models are used for generating LSMs. The production of LSMs is comprised of three main steps. First, the selected landslide causative factors are calculated for each pixel in the entire study area. Second, landslide susceptibility indexes (LSIs) are predicted for each pixel with the constructed models. Third, the landslide susceptibility indexes are reclassified into five classes by the natural breaks method, including very low susceptible, low susceptible, medium susceptible, high susceptible, and very high susceptible. After assigning LSI to each pixel, the landslide susceptibility maps can be generated in an ArcGIS environment for visualization. Figure 8 shows the LSMs generated by the CNN model and the four conventional ML models. As seen in this figure, the very high susceptible areas and the very low susceptible locations have similar distributions for the different models.
The distribution of landslide susceptibility classes in all five models is examined by calculating the percentages of susceptibility classes, as displayed in Figure 9. In the LSM generated using the LR model, 45.47% and 38.82% of the pixels belong to very low and very high susceptibility classes, respectively, while 3.33%, 2.84%, and 9.54% of the pixels belong to low, medium, and high susceptibility classes accordingly. Regarding the LSM produced by the ANN model, 39.09% and 58.22% of the pixels belong to very low and very high susceptibility classes, respectively, while 0.75%, 0.99%, and 0.94% of the pixels belong to low, medium, and high susceptibility classes respectively. With regard to the LSM generated using the SVM model, 45.74% of the area of case study located in the very low susceptibility class, while 3.2%, 16.77%, 7.17%, and 27.12% of the area placed in the low, medium, high and very high susceptibility, respectively. Furthermore, in terms of the RF model, the LSM is comprised of 37.31% of the pixels in the very low susceptibility category, 11.62% of the pixels in the low susceptibility class, 11.58% of the pixels in the medium susceptibility class, 19.61% of the pixels in the high susceptibility class, and 19.88% of the pixels in the very high susceptibility class. According to the LSM calculated using the CNN model, 39.1% and 34.18% of the study areas are covered by the very low susceptibility class and very high class correspondingly., while 10.47%, 4.99%, and 11.26% of the study areas consist of the low, medium, and high susceptibility classes in order.
In summary, it can therefore be concluded that most areas are located in the very high and very low classes, which demonstrates that a relative consistency is observed between landslides and non-landslide regions for all methods.
Furthermore, the results of all methods are approximately compatible with the morphological structure of the case study area since the susceptibility is high in high-slope and high-altitude areas and it is low in the plains and the areas with slopes below 5% (related DEM of the region is presented in Figure 1). Meanwhile, the results of RF and CNN are more compatible with the morphological structure of the case study area since the medium susceptible areas have occurred in the boundary between the valleys and mountains area, while in the LR, ANN, and SVM methods the number of pixels in high-susceptible and low-susceptible classes is more considerable. Moreover, the comparison of these training-based methods and the results of MCDM in the study of Boroumandi, Khamehchiyan, and Nikoudel (2015) shows using more related causative factors in GIS modelling, higher spatial resolution digital earth data (Sentinel 2B), and training-based AI techniques improve the results of the model significantly. The results of this current research are therefore more compatible with the nature of the landslide phenomenon and the morphological shape of the case study area. Consequently, using train-based AI techniques in such spatial problems that inventory map is accessible, have more reliable and accurate results.

6. Conclusions

An important requirement for decreasing or even avoiding landslide damages is by conducting an appropriate landslide susceptibility map. The existing studies on landslide susceptibility mapping are mainly concentrated on conventional machine learning algorithms, while deep learning techniques have been explored less in this field, especially based on landslide causative factors. Herein, the CNN method as a deep learning algorithm and four conventional machine learning models (i.e., LR, ANN, SVM, RF) were applied to generate landslide susceptibility mapping in the Zanjan province of Iran. Landslide is a complicated process that is influenced by various conditioning and triggering factors. Based on literature, in this study 16 causative factors were selected and used to systematically examine the potential influencing factors. The main contributions of this research are summarized below.
First, the performance of the CNN model and the four conventional ML models were examined and compared in terms of several evaluation measures. The results indicated that the RF yields the best performance (precision = 85.6%, AUC = 0.967), and the CNN (precision = 83.88%, AUC = 0.956) outperforms than the other three conventional ML models (i.e., LR, ANN, SVM). Although CNN, as a DL artificial intelligence technique, progressively presents significant potential in image processing and natural language processing, it is advantageous and required to explore its prediction capability in landslide susceptibility assessments, especially to process the data in a tabular form.
Second, the feature importance is evaluated based on the permutation-based variable accuracy importance approach for the five models. The variable importance results indicate that slope and topographic curvature are most important for each model, while the ranks of other variables based on the PAVI values are different for the models.
Third, LSMs were produced based on the constructed models to help decision-makers in landslide management and risk analysis. The LSMs revealed that the majority of the study areas are identified as having very low and very high susceptibility. The findings also indicate that the ML methods could be useful techniques to identify the susceptible areas. To put it briefly, the results of this work could be helpful for decision-makers and planners while planning the land use in the areas susceptible to landslides.

Author Contributions

P.Z. and Z.M. designed the model and the computational framework and analyzed the data and also carried out the implementation. M.K. and M.A. performed the analyses and calculations related to the data and geological background of the manuscript. P.Z. and Z.M. wrote the manuscript with input from all authors. A.M. conceived the study and was in charge of overall direction and planning. All authors have read and agreed to the published version of the manuscript.

Funding

This research was funded partly by the Environmental Management in the Middle East (EMME) project, Commission’s Erasmus+ Program, grant number 598189 and the APC was funded by the library of Lund university.

Data Availability Statement

The link below includes the code of this research and its related document of license. https://0-doi-org.brum.beds.ac.uk/10.6084/m9.figshare.16400175.v1, accessed on 1 November 2021.

Conflicts of Interest

The authors declare that they have no conflict of interest.

References

  1. Liu, Y.; Liao, M.; Shi, X.; Zhang, L.; Cunningham, C. Potential loess landslide deformation monitoring using L-band SAR interferometry. Geo-Spat. Inf. Sci. 2016, 19, 273–277. [Google Scholar] [CrossRef]
  2. Haque, U.; Da Silva, P.F.; Devoli, G.; Pilz, J.; Zhao, B.; Khaloua, A.; Wilopo, W.; Andersen, P.; Lu, P.; Lee, J.; et al. The human cost of global warming: Deadly landslides and their triggers (1995–2014). Sci. Total Environ. 2019, 682, 673–684. [Google Scholar] [CrossRef] [PubMed]
  3. Betts, H.; Basher, L.; Dymond, J.; Herzig, A.; Marden, M.; Phillips, C. Development of a landslide component for a sediment budget model. Environ. Model. Softw. 2017, 92, 28–39. [Google Scholar] [CrossRef]
  4. Boroumandi, M.; Khamehchiyan, M.; Nikoudel, M.R. Using of analytic hierarchy process for landslide hazard zonation in Zanjan Province, Iran. In Engineering Geology for Society and Territory; Springer: Cham, Switzerland, 2015; Volume 2, pp. 951–955. [Google Scholar]
  5. Tsangaratos, P.; Ilia, I. Comparison of a logistic regression and Naïve Bayes classifier in landslide susceptibility assessments: The influence of models complexity and training dataset size. Catena 2016, 145, 164–179. [Google Scholar] [CrossRef]
  6. Pourghasemi, H.R.; Rahmati, O. Prediction of the landslide susceptibility: Which algorithm, which precision? Catena 2018, 162, 177–192. [Google Scholar] [CrossRef]
  7. Gerzsenyi, D.; Albert, G. Landslide inventory validation and susceptibility mapping in the Gerecse Hills, Hungary. Geo-Spat. Inf. Sci. 2021, 24, 498–508. [Google Scholar] [CrossRef]
  8. Broeckx, J.; Vanmaercke, M.; Duchateau, R.; Poesen, J.N. A data-based landslide susceptibility map of Africa. Earth-Sci. Rev. 2018, 185, 102–121. [Google Scholar] [CrossRef]
  9. Kornejady, A.; Pourghasemi, H.R. Producing a Spatially Focused Landslide Susceptibility Map Using an Ensemble of Shannon’s Entropy and Fractal Dimension (Case Study: Ziarat Watershed, Iran). In Spatial Modeling in GIS and R for Earth and Environmental Sciences; Elsevier: Amsterdam, The Netherlands, 2019; pp. 689–732. [Google Scholar]
  10. Hervás, J.; Bobrowsky, P. Mapping: Inventories, susceptibility, hazard and risk. In Landslides–Disaster Risk Reduction; Springer: Berlin/Heidelberg, Germany, 2019; pp. 321–349. [Google Scholar]
  11. Maleki, J.; Masoumi, Z.; Hakimpour, F.; Coello, C.A.C. A spatial land-use planning support system based on game theory. Land Use Policy 2020, 99, 105013. [Google Scholar] [CrossRef]
  12. Masoumi, Z.; van Genderen, J.L.; Mesgari, M.S. Modelling and predicting the spatial dispersion of skin cancer considering environmental and socio-economic factors using a digital earth approach. Int. J. Dig. Earth 2020, 13, 661–682. [Google Scholar] [CrossRef]
  13. Ngo, P.T.T.; Panahi, M.; Khosravi, K.; Ghorbanzadeh, O.; Kariminejad, N.; Cerda, A.; Lee, S. Evaluation of deep learning algorithms for national scale landslide susceptibility mapping of Iran. Geosci. Front. 2021, 12, 505–519. [Google Scholar]
  14. Masoumi, Z.; Van Genderen, J.L.; Maleki, J. Fire Risk Assessment in Dense Urban Areas Using Information Fusion Techniques. ISPRS Int. J. Geo-Inf. 2019, 8, 579. [Google Scholar] [CrossRef] [Green Version]
  15. Dickson, M.E.; Perry, G.L.W. Identifying the controls on coastal cliff landslides using machine-learning approaches. Environ. Model. Softw. 2016, 76, 117–127. [Google Scholar] [CrossRef]
  16. Chen, W.; Pourghasemi, H.R.; Kornejady, A.; Zhang, N. Landslide spatial modeling: Introducing new ensembles of ANN, MaxEnt, and SVM machine learning techniques. Geoderma 2017, 305, 314–327. [Google Scholar] [CrossRef]
  17. Youssef, A.M.; Pourghasemi, H.R. Landslide susceptibility mapping using machine learning algorithms and comparison of their performance at Abha Basin, Asir Region, Saudi Arabia. Geosci. Front. 2021, 12, 639–655. [Google Scholar] [CrossRef]
  18. Pham, B.T.; Bui, D.T.; Prakash, I.; Dholakia, M.B. Hybrid integration of Multilayer Perceptron Neural Networks and machine learning ensembles for landslide susceptibility assessment at Himalayan area (India) using GIS. Catena 2017, 149, 52–63. [Google Scholar] [CrossRef]
  19. Pourghasemi, H.R.; Gayen, A.; Park, S.; Lee, C.W.; Lee, S. Assessment of landslide-prone areas and their zonation using logistic regression, logitboost, and naïvebayes machine-learning algorithms. Sustainability 2018, 10, 3697. [Google Scholar] [CrossRef] [Green Version]
  20. Kavzoglu, T.; Colkesen, I.; Sahin, E.K. Machine learning techniques in landslide susceptibility mapping: A survey and a case study. In Landslides: Theory, Practice and Modelling; Springer: Cham, Switzerland, 2019; pp. 283–301. [Google Scholar]
  21. Nguyen, V.V.; Pham, B.T.; Vu, B.T.; Prakash, I.; Jha, S.; Shahabi, H.; Shirzadi, A.; Ba, D.N.; Kumar, R.; Chatterjee, J.M.; et al. Hybrid machine learning approaches for landslide susceptibility modeling. Forests 2019, 10, 157. [Google Scholar] [CrossRef] [Green Version]
  22. Achour, Y.; Pourghasemi, R.H. How do machine learning techniques help in increasing accuracy of landslide susceptibility maps? Geosci. Front. 2020, 11, 871–883. [Google Scholar] [CrossRef]
  23. Di Napoli, M.; Carotenuto, F.; Cevasco, A.; Confuorto, P.; Di Martire, D.; Firpo, M.; Pepe, G.; Raso, E.; Calcaterra, D. Machine learning ensemble modelling as a tool to improve landslide susceptibility mapping reliability. Landslides 2020, 17, 1897–1914. [Google Scholar] [CrossRef]
  24. Huang, F.; Cao, Z.; Guo, J.; Jiang, S.H.; Li, S.; Guo, Z. Comparisons of heuristic, general statistical and machine learning models for landslide susceptibility prediction and mapping. Catena 2020, 191, 104580. [Google Scholar] [CrossRef]
  25. Orhan, O.; Bilgilioglu, S.S.; Kaya, Z.; Ozcan, A.K.; Bilgilioglu, H. Assessing and mapping landslide susceptibility using different machine learning methods. Geocarto Int. 2020, 1–26. [Google Scholar] [CrossRef]
  26. Ali, S.A.; Parvin, F.; Vojteková, J.; Costache, R.; Linh, N.T.T.; Pham, Q.B.; Vojtek, M.; Gigović, L.; Ahmad, A.; Ghorbani, M.A. GIS-based landslide susceptibility modeling: A comparison between fuzzy multi-criteria and machine learning algorithms. Geosci. Front. 2021, 12, 857–876. [Google Scholar] [CrossRef]
  27. Wang, Y.; Fang, Z.; Hong, H. Comparison of convolutional neural networks for landslide susceptibility mapping in Yanshan County, China. Sci. Total Environ. 2019, 666, 975–993. [Google Scholar] [CrossRef] [PubMed]
  28. Bui, D.T.; Tsangaratos, P.; Nguyen, V.-T.; Van Liem, N.; Trinh, P.T. Comparing the prediction performance of a Deep Learning Neural Network model with conventional machine learning models in landslide susceptibility assessment. Catena 2020, 188, 104426. [Google Scholar] [CrossRef]
  29. Van Dao, D.; Jaafari, A.; Bayat, M.; Mafi-Gholami, D.; Qi, C.; Moayedi, H.; Van Phong, T.; Ly, H.B.; Le, T.T.; Trinh, P.T.; et al. A spatially explicit deep learning neural network model for the prediction of landslide susceptibility. Catena 2020, 188, 104451. [Google Scholar]
  30. Mandal, K.; Saha, S.; Mandal, S. Applying deep learning and benchmark machine learning algorithms for landslide susceptibility modelling in Rorachu river basin of Sikkim Himalaya, India. Geosci. Front. 2021, 12, 101203. [Google Scholar] [CrossRef]
  31. Kavzoglu, T.; Teke, A.; Yilmaz, E.O. Shared Blocks-Based Ensemble Deep Learning for Shallow Landslide Susceptibility Mapping. Remote Sens. 2021, 13, 4776. [Google Scholar] [CrossRef]
  32. Gupta, S.K.; Shukla, D.P.; Thakur, M. Selection of weightages for causative factors used in preparation of landslide susceptibility zonation (LSZ). Geomat. Nat. Hazards Risk 2018, 9, 471–487. [Google Scholar] [CrossRef] [Green Version]
  33. Lombardo, L.; Mai, M. Presenting logistic regression-based landslide susceptibility results. Eng. Geol. 2018, 244, 14–24. [Google Scholar] [CrossRef]
  34. Zhou, C.; Yin, K.; Cao, Y.; Ahmed, B.; Li, Y.; Catani, F.; Pourghasemi, H.R. Landslide susceptibility modeling applying machine learning methods: A case study from Longju in the Three Gorges Reservoir area, China. Comput. Geosci. 2018, 112, 23–37. [Google Scholar] [CrossRef] [Green Version]
  35. Yilmaz, I. Landslide susceptibility mapping using frequency ratio, logistic regression, artificial neural networks and their comparison: A case study from Kat landslides (Tokat—Turkey). Comput. Geosci. 2009, 35, 1125–1138. [Google Scholar] [CrossRef]
  36. Dou, J.; Bui, D.T.; Yunus, A.P.; Jia, K.; Song, X.; Revhaug, I.; Xia, H.; Zhu, Z. Optimization of causative factors for landslide susceptibility evaluation using remote sensing and GIS data in parts of Niigata, Japan. PLoS ONE 2015, 10, e0133262. [Google Scholar] [CrossRef] [Green Version]
  37. Kornejady, A.; Ownegh, M.; Bahremand, A. Landslide susceptibility assessment using maximum entropy model with two different data sampling methods. Catena 2017, 152, 144–162. [Google Scholar] [CrossRef]
  38. Van Westen, C.J.; Castellanos, E.; Kuriakose, S.L. Spatial data for landslide susceptibility, hazard, and vulnerability assessment: An overview. Eng. Geol. 2008, 102, 112–131. [Google Scholar] [CrossRef]
  39. Pradhan, A.M.; Kang, H.S.; Kim, K.Y. Mapping Climate Change, Landslide Hazards, and Vulnerability: A Case Study from Seoul, South Korea. In Proceedings of the Geotechnical and Structural Engineering Congress 2016, Phoenix, AZ, USA, 14–17 February 2016. [Google Scholar]
  40. Ilia, I.; Tsangaratos, P. Applying weight of evidence method and sensitivity analysis to produce a landslide susceptibility map. Landslides 2016, 13, 379–397. [Google Scholar] [CrossRef]
  41. Li, G.; West, A.; Densmore, A.L.; Jin, Z.; Zhang, F.; Wang, J.; Hilton, R.G. Distribution of earthquake-triggered landslides across landscapes: Towards understanding erosional agency and cascading hazards. In Fault-Zone Guided Wave, Ground Motion, Landslide and Earthquake Forecast; De Gruyter: Berlin, Germany, 2018; pp. 160–190. [Google Scholar]
  42. Haigh, M.; Rawat, J.S. Landslide Disasters: Seeking Causes—A Case Study from Uttarakhand, India. In Management of Mountain Watersheds; Springer: Dordrecht, The Netherlands, 2012; pp. 218–253. [Google Scholar]
  43. Dar, I.A.; Sankar, K.; Dar, M.A. Remote sensing technology and geographic information system modeling: An integrated approach towards themapping of groundwater potential zones in Hardrock terrain, Mamundiyar basin. J. Hydrol. 2010, 394, 285–295. [Google Scholar] [CrossRef]
  44. Magesh, N.S.; Chandrasekar, N.; Soundranayagam, J.P. Delineation of groundwater potential zones in Theni district, Tamil Nadu, using remote sensing, GIS and MIF techniques. Geosci. Front. 2012, 3, 189–196. [Google Scholar] [CrossRef] [Green Version]
  45. Boualla, O.; Mehdi, K.; Fadili, A.; Makan, A.; Zourarah, B. GIS-based landslide susceptibility mapping in the Safi region, West Morocco. Bull. Eng. Geo. Environ. 2019, 78, 2009–2026. [Google Scholar] [CrossRef]
  46. Zhao, P.; Kwan, M.P.; Zhou, S. The uncertain geographic context problem in the analysis of the relationships between obesity and the built environment in Guangzhou. Int. J. Environ. Res. Public Health 2018, 15, 308. [Google Scholar] [CrossRef] [Green Version]
  47. Wang, Y.; Feng, L.; Li, S.; Ren, F.; Du, Q. A hybrid model considering spatial heterogeneity for landslide susceptibility mapping in Zhejiang Province, China. Catena 2020, 188, 104425. [Google Scholar] [CrossRef]
  48. Guzzetti, F.; Mondini, A.C.; Cardinali, M.; Fiorucci, F.; Santangelo, M.; Chang, K.-T. Landslide inventory maps: New tools for an old problem. Earth-Sci. Rev. 2012, 112, 42–66. [Google Scholar] [CrossRef] [Green Version]
  49. Cabrera, A.F. Logistic regression analysis in higher education: An applied perspective. In Higher Education: Handbook of Theory and Research; Springer: Cham, Switzerland, 1994; Volume 10, pp. 225–256. [Google Scholar]
  50. Lee, S.; Ryu, J.H.; Won, J.S.; Park, H.J. Determination and application of the weights for landslide susceptibility mapping using an artificial neural network. Eng. Geol. 2004, 71, 289–302. [Google Scholar] [CrossRef]
  51. Can, R.; Kocaman, S.; Gokceoglu, C. A Convolutional Neural Network Architecture for Auto-Detection of Landslide Photographs to Assess Citizen Science and Volunteered Geographic Information Data Quality. ISPRS Int. J. Geo-Inf. 2019, 8, 300. [Google Scholar] [CrossRef] [Green Version]
  52. Cervantes, J.; Garcia-Lamont, F.; Rodríguez-Mazahua, L.; Lopez, A. A comprehensive survey on support vector machine classification: Applications, challenges and trends. Neurocomputing 2020, 408, 189–215. [Google Scholar] [CrossRef]
  53. Breiman, L. Random forests. Mach. Learn. 2001, 45, 5–32. [Google Scholar] [CrossRef] [Green Version]
  54. Son, N.T.; Chen, C.F.; Chen, C.R.; Minh, V.Q. Assessment of Sentinel-1A data for rice crop classification using random forests and support vector machines. Geocarto Int. 2018, 33, 587–601. [Google Scholar] [CrossRef]
  55. Pun, L.; Zhao, P.; Liu, X. A multiple regression approach for traffic flow estimation. IEEE Access 2019, 7, 35998–36009. [Google Scholar] [CrossRef]
  56. LeCun, Y.; Bengio, Y.; Hinton, G. Deep learning. Nature 2015, 521, 436–444. [Google Scholar] [CrossRef]
  57. O’Shea, K.; Nash, R. An introduction to convolutional neural networks. arXiv 2015, arXiv:1511.08458. [Google Scholar]
  58. Yamashita, R.; Nishio, M.; Do, R.K.G.; Togashi, K. Convolutional neural networks: An overview and application in radiology. Insights Imaging 2018, 9, 611–629. [Google Scholar] [CrossRef] [Green Version]
  59. Hong, H.; Tsangaratos, P.; Ilia, I.; Liu, J.; Zhu, A.X.; Chen, W. Application of fuzzy weight of evidence and data mining techniques in construction of flood susceptibility map of Poyang County, China. Sci. Total Environ. 2018, 625, 575–588. [Google Scholar] [CrossRef]
  60. Xu, L.; Li, J.; Brenning, A. A comparative study of different classification techniques for marine oil spill identification using RADARSAT-1 imagery. Remote Sens. Environ. 2014, 141, 14–23. [Google Scholar] [CrossRef]
  61. Hagenauer, J.; Helbich, M. A comparative study of machine learning classifiers for modeling travel mode choice. Expert Syst. Appl. 2017, 78, 273–282. [Google Scholar] [CrossRef]
  62. Strobl, C.; Boulesteix, A.L.; Zeileis, A.; Hothorn, T. Bias in random forest variable importance measures: Illustrations, sources and a solution. BMC Bioinform. 2007, 8, 25. [Google Scholar] [CrossRef] [PubMed] [Green Version]
  63. Gregorutti, B.; Michel, B.; Saint-Pierre, P. Correlation and variable importance in random forests. Stat. Comput. 2017, 27, 659–678. [Google Scholar] [CrossRef] [Green Version]
  64. Kumar, I.E.; Venkatasubramanian, S.; Scheidegger, C.; Friedler, S. Problems with Shapley-value-based explanations as feature importance measures. In Proceedings of the International Conference on Machine Learning, Vienna, Austria, 12–18 July 2020; pp. 5491–5500. [Google Scholar]
Figure 1. The case study area. (a) Iran boundary and related political boundaries and provinces, (b) Zanjan province and its topographic and lithological structure.
Remotesensing 14 00211 g001
Figure 2. The number of landslides in Zanjan province based on their area.
Remotesensing 14 00211 g002
Figure 3. Spatial layers of landslide factors, showing: (a) map of the altitude, (b) map of the slope, (c) map of the slope aspect, (d) map of the topography curvature, (e) map of the land use, (f) map of the lithology structure, (g) map of the faults, (h) map of the river, (i) map of the roads, (j) lineaments, (k) map of the springs, (l) precipitation map.
Remotesensing 14 00211 g003
Figure 4. Sentinel red and infrared bands along with NDVI resultant map: (a) Red band image, (b) Infrared band, and (c) The NDVI factor map.
Remotesensing 14 00211 g004
Figure 5. Framework for landslide susceptibility map.
Remotesensing 14 00211 g005
Figure 6. The ROC curves related to five employed methods using the test data.
Remotesensing 14 00211 g006
Figure 7. Assessed importance values of the landslide causative factors employing the five machine learning models: (a) LR; (b) ANN; (c) SVM; (d) RF; (e) CNN, X-axis demonstrates the values of PVAI and Y-axis shows the landslide causative factors.
Remotesensing 14 00211 g007
Figure 8. LSMs produced by the five methods in Zanjan province: (a) LR, (b) ANN, (c) SVM, (d) RF, and (e) CNN.
Remotesensing 14 00211 g008aRemotesensing 14 00211 g008b
Figure 9. The distribution of each class per generated LSMs.
Remotesensing 14 00211 g009
Table 1. Employed information and their sources in the current research.
InformationRelated Factor MapsSourceScale/Resolution
Digital Elevation Model (DEM)Altitude, Aspect, Slope, Plan curvature, Profile curvatureNational Cartographic Center of Iran1:25,000
LithologyLithologyGeological Survey & Mineral Explorations of Iran (GSI)/Land sat8 images1: 50,000
30 m
Land useLand useNational Cartographic Center of Iran/Land sat8 images1:25,000
30 m
FaultsDistance from faultsInstitute for Advanced Studies in Basic Sciences1:50,000
RiversDistance from riverNational Cartographic Center of Iran (NCC)1:25,000
RoadsDistance from roadsNCC1:25,000
SpringsDistance from springsZanjan regional water company1:10,000
NDVINDVISentinel 2 satellite images10 m
Lineament densityLineament densitySentinel 2 satellite images/DEM10 m
PrecipitationPrecipitationZanjan regional water company/Iran Meteorological Organization1:10,000
Table 2. The performance of five employed methods in the terms of evaluation measures.
Measures/MethodsLRANNSVMRFCNN
TP624631626648635
TN969957962962965
FP133126131109122
FN1426212118
Precision82.43%83.36%82.69%85.6%83.88%
Recall97.8%96.04%96.75%96.86%97.24%
Specificity87.93%88.37%88.01%89.82%88.78%
Accuracy91.55%91.26%91.26%92.53%91.95%
F1-measure89.46%89.25%89.17%90.88%90.07%
Table 3. Top Five most important features for each classifier.
MethodsLRANNSVMRFCNN
Top-5 most important featuresSlopeSlopeSlopeSlopeSlope
CurvatureCurvatureCurvatureCurvatureCurvature
Land useLand useGeologyGeologyGeology
PrecipitationGeologyLand useLineament densityRiver density
NDVIPrecipitationNDVIPrecipitationPrecipitation
Publisher’s Note: MDPI stays neutral with regard to jurisdictional claims in published maps and institutional affiliations.

