1. Introduction
Among all geological hazards typifying the Italian territory, landslides and floods are certainly the most frequent and dangerous for the population. About 2580 floods/landslide events, causing 50,593 fatalities, occurred from AD 1279 to 2002 [
1].
In southern Italy, floods and landslide casualties are most abundant in Campania, Calabria, and Sicily, where intense local precipitation can trigger flash floods and/or landslides [
1].
In Calabria Region, between Bagnara Calabra and Scilla towns, several translational landslides affecting in the superficial and altered part of the metamorphic and igneous substratum, evolved to mud flows and reached the coastline area [
2,
3]. During intense rainfalls, the landslide masses frequently occurring at the headwater are often fluidized by the stream waters during their downward movement. Furthermore, the presence of road cuts and associated drainage structures also may significantly impact on the surface/subsurface flow favouring the occurrence of shallow landslides [
4,
5]. The high incidence of these events is testified by the presence of alluvial fans along the whole coastline of the Tyrrhenian Sea. In addition, they can be directly fed by debris-flows [
6] which are widespread on the territory likely in relation to sudden morphological transition from deep and narrow valleys to the coastal zone.
Within this framework, the role of flooding events in the evolution of coastal areas characterized by pocket beaches (i.e., small beaches bordered by cliffs or steep slopes) was studied. The sediments deposited by flooding events at river mouths as well as those produced by the sea waves action on cliffs is essential for their preservation. This problem is particularly significant for coastal areas, such as those of the Calabria Region, which have suffered a decrease in river load over time, also due to the structures placed along the riverbeds to mitigate the risk of river flooding. Flooding events feed the coastal system in a fiumara-like system. Those with a recurrence time of 5 years continuously feed the beaches, while those taking place over a long time (identified as exceptional, recurrence time of 15 years) can favour a marked progradation of delta for tens of meters from the coastline. These events are responsible for the deposition of about 30–40 thousand of cubic meters of sediments, mainly made up of gravel and sand [
7,
8,
9]. Following a preliminary analysis [
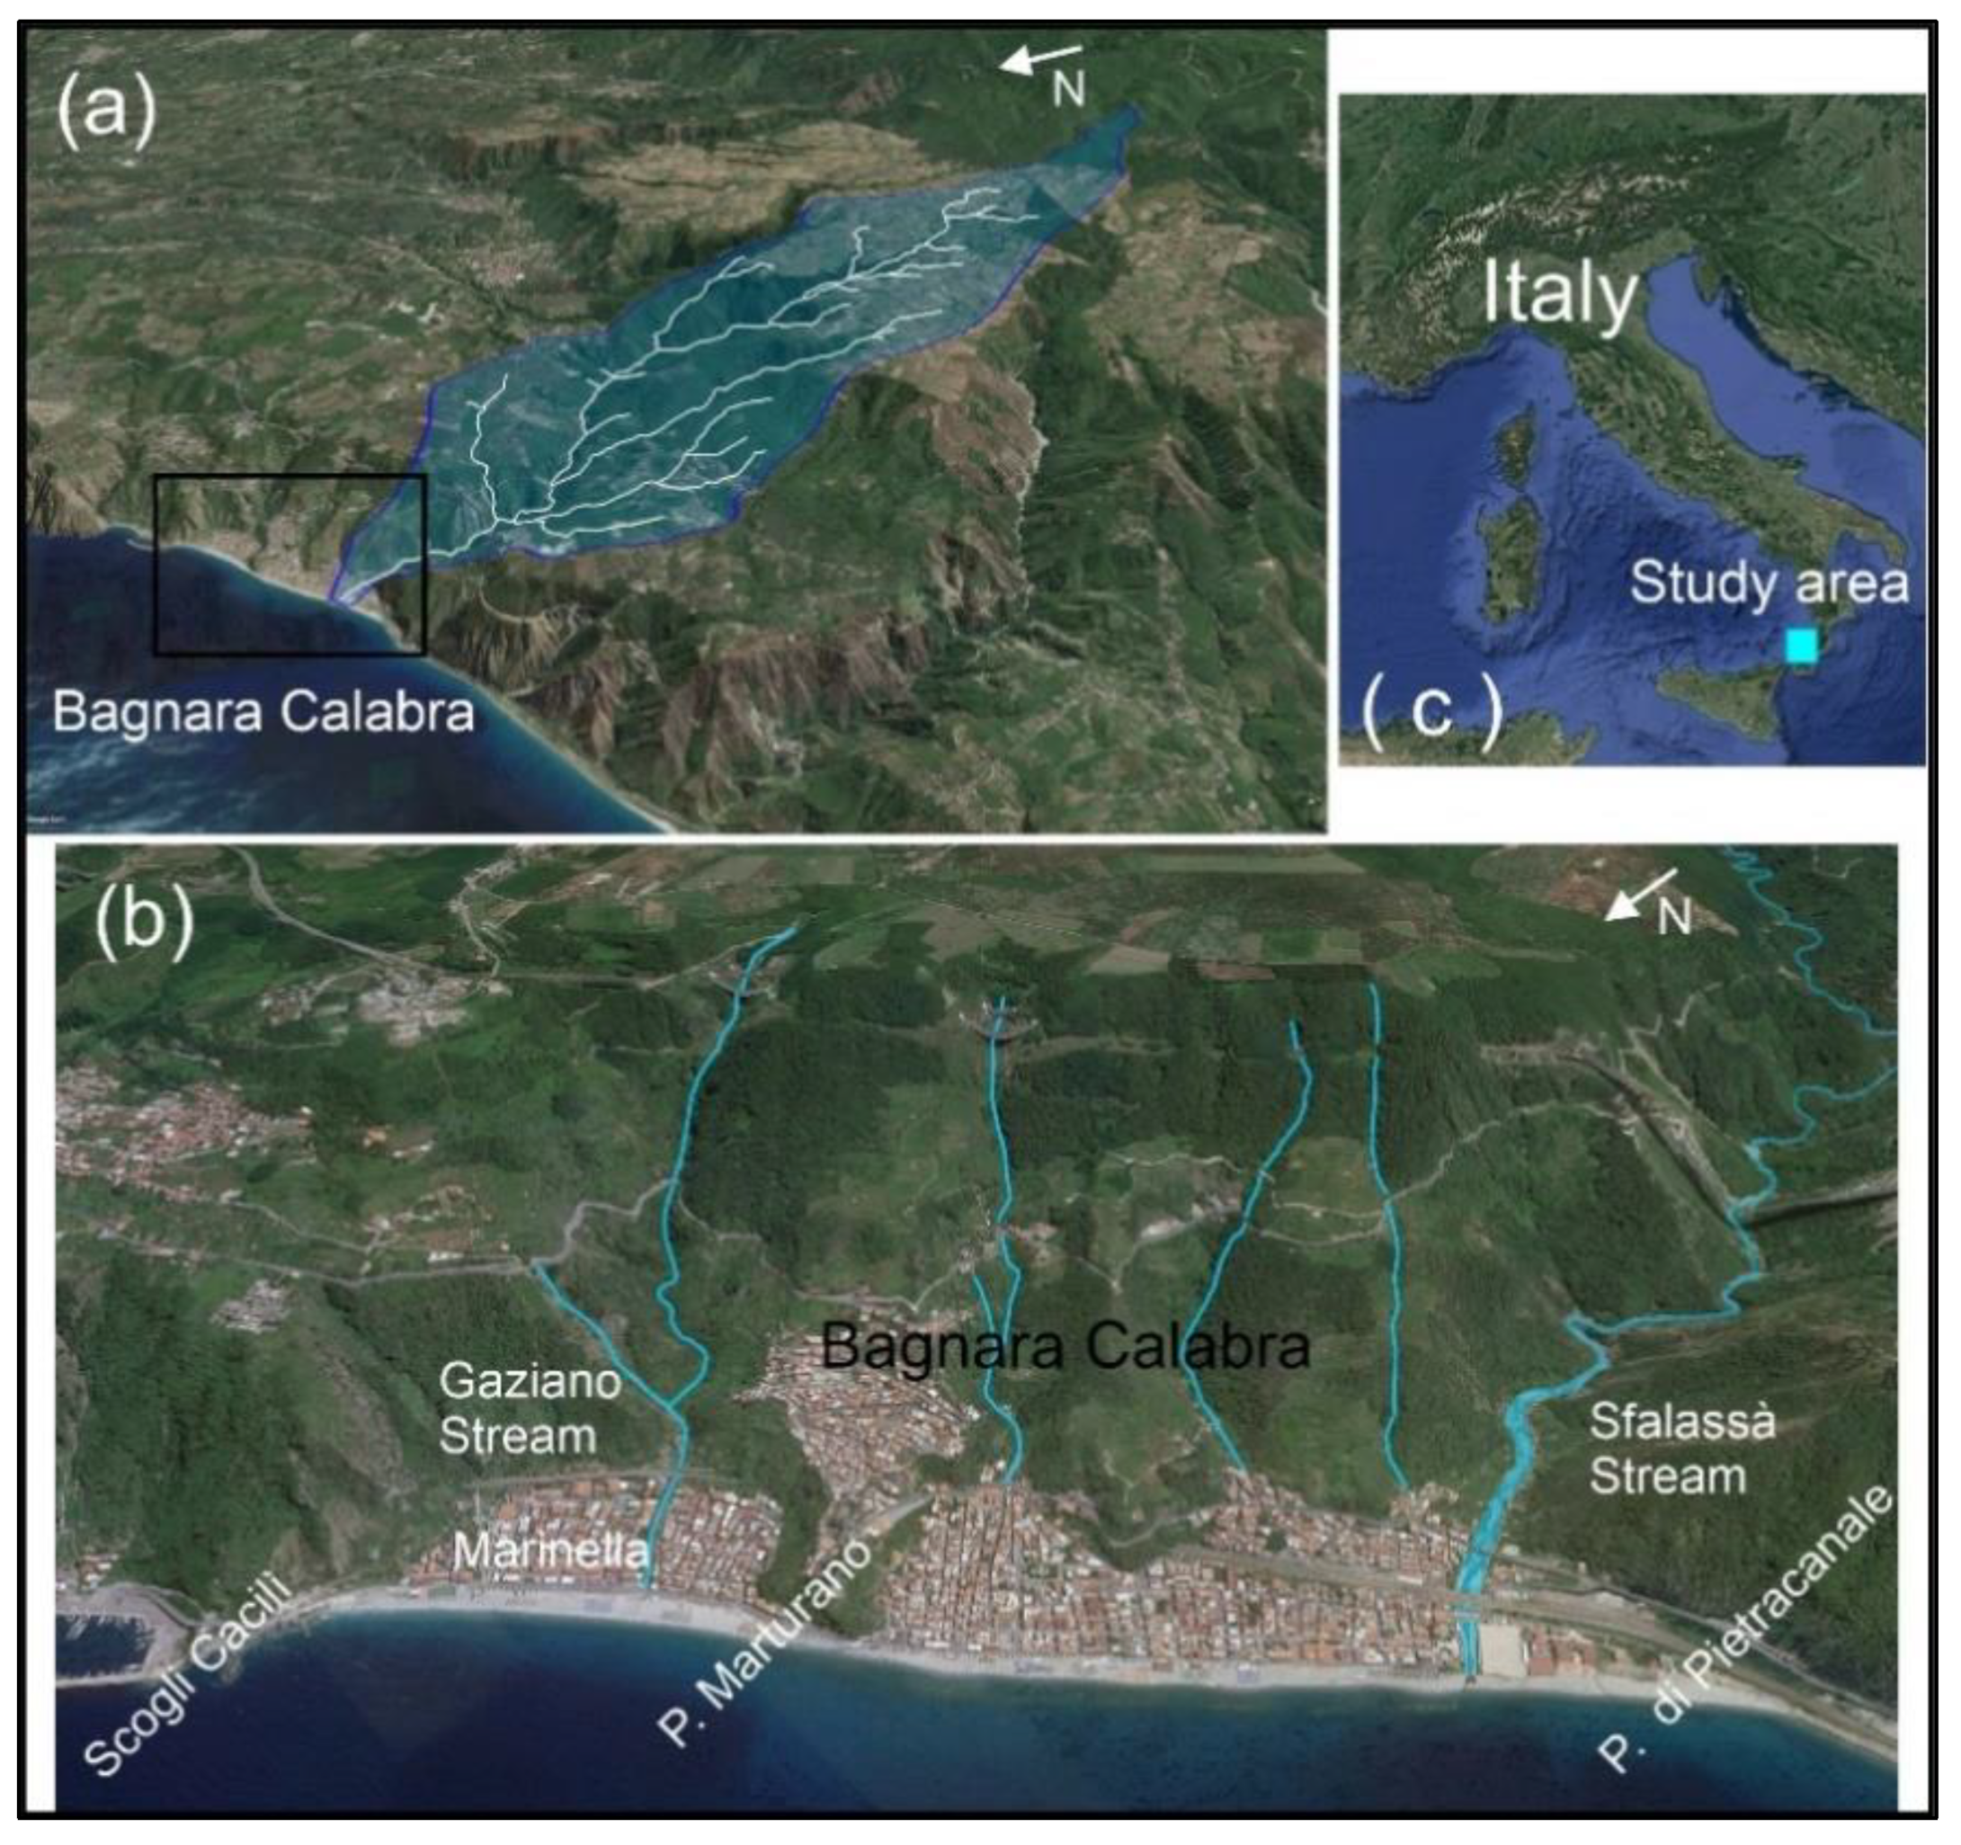
10], we described the fan delta formation at Sfalassà Stream mouth (Bagnara Calabra, Southern Italy) (
Figure 1) related to the flooding event occurred on 2 November 2015 and its rapid dismantling by storm surges.
At this aim, the data provided by ground-based (radar system, meteorological station), satellite and drone observing systems [
11,
12,
13,
14,
15] together with those recovered during the field surveys were used. These data integrated with historical maps are commonly used to reconstruct the shoreline evolution using the potentiality of Geographic information system algorithms [
16,
17]. In the last decades, a large number of techniques were developed to detect deltas from satellite imagery [
18]; due to the limited extent of the study area, manual delineation of the coastline was adopted [
19]. Compared to computer aided classification techniques, manual operation takes advantage of the digitiser’s knowledge on the morphological characteristics of the area. Furthermore, following the relationship between the spatial-temporal scale and the type of geological studies proposed by [
19], we used the Sentinel 2 images, because they are considered a good tool for local/microscale studies and also because they are freely available, differently from the RapidEyeis and GeoEye images.
The quantitative analysis of Sentinel 2 images and visual analysis of photographs showed that the fan delta of Sfalassà Stream was dismantled in about 3 months by three main sea storms occurred from 25 to 28 November 2015, from 3 to 8 January and from 12 to 18 January 2016. Furthermore, the comparison of beach morphology surveyed before and just after the event made it possible to compute the volume of sediment deposited by the Sfalassà Stream on 2 November 2015.
2. Study Area
The Sfalassà basin is part of the Costa Viola mountains that extend for about 80 km
2 along the SW coast of the Calabria Region. This basin crosses the municipality of Bagnara Calabra before flowing into the Tyrrhenian Sea (
Figure 1).
Bagnara Calabra, is part of the Calabrian-Peloritane geodynamic Domain, mostly Hercynian and Alpine polymetamorphic [
20] and igneous rocks [
21] overlain by Mesozoic marine sedimentary units [
22]. Extensional faulting linked to the roll-back of the Ionian-Tyhrrenian slab and trench retreat [
23,
24] was considered, in combination with climatic oscillations, the leading cause of Quaternary uplift of this region that was recorded by a suite of raised marine terraces [
22,
25,
26,
27,
28,
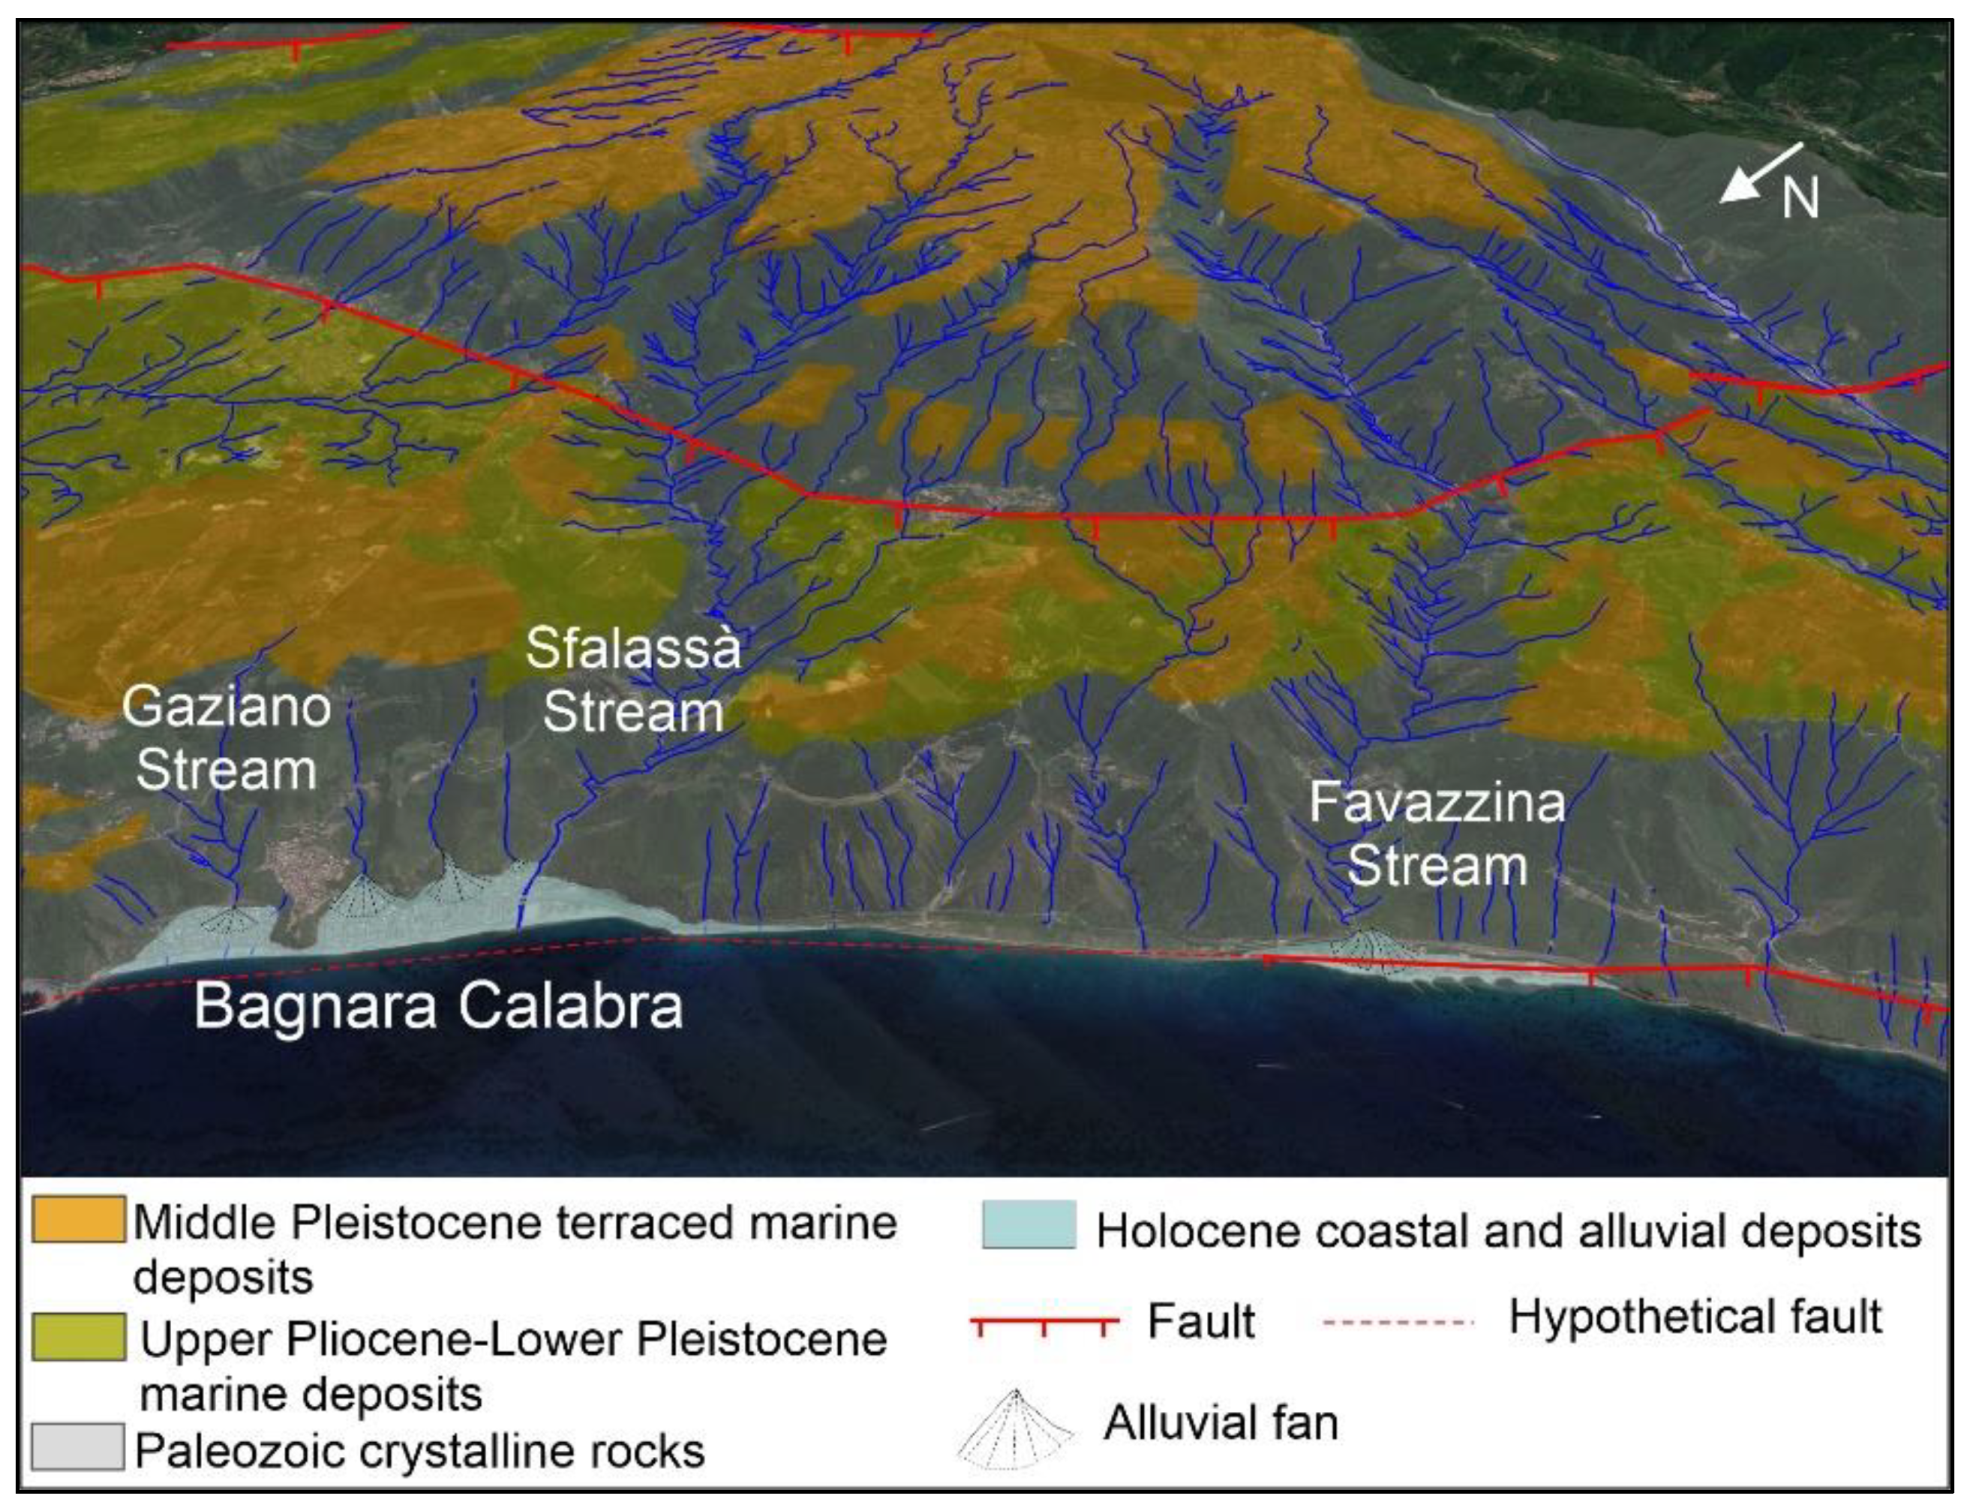
29]. Because of this uplift, the study area is characterized by the narrow and steep watercourses, among which the main Favazzina and Sfalassà basins carved into metamorphic rocks in response to tectono-eustatic base level forcing (
Figure 2).
The coastal system is fed both by the sediments of the Sfalassà Stream, whose sediment volume is decreased over time, and by minor streams. This system is characterized by small pocket beaches encompassed between the Pietracanale, Marturano and Cacili headlands.
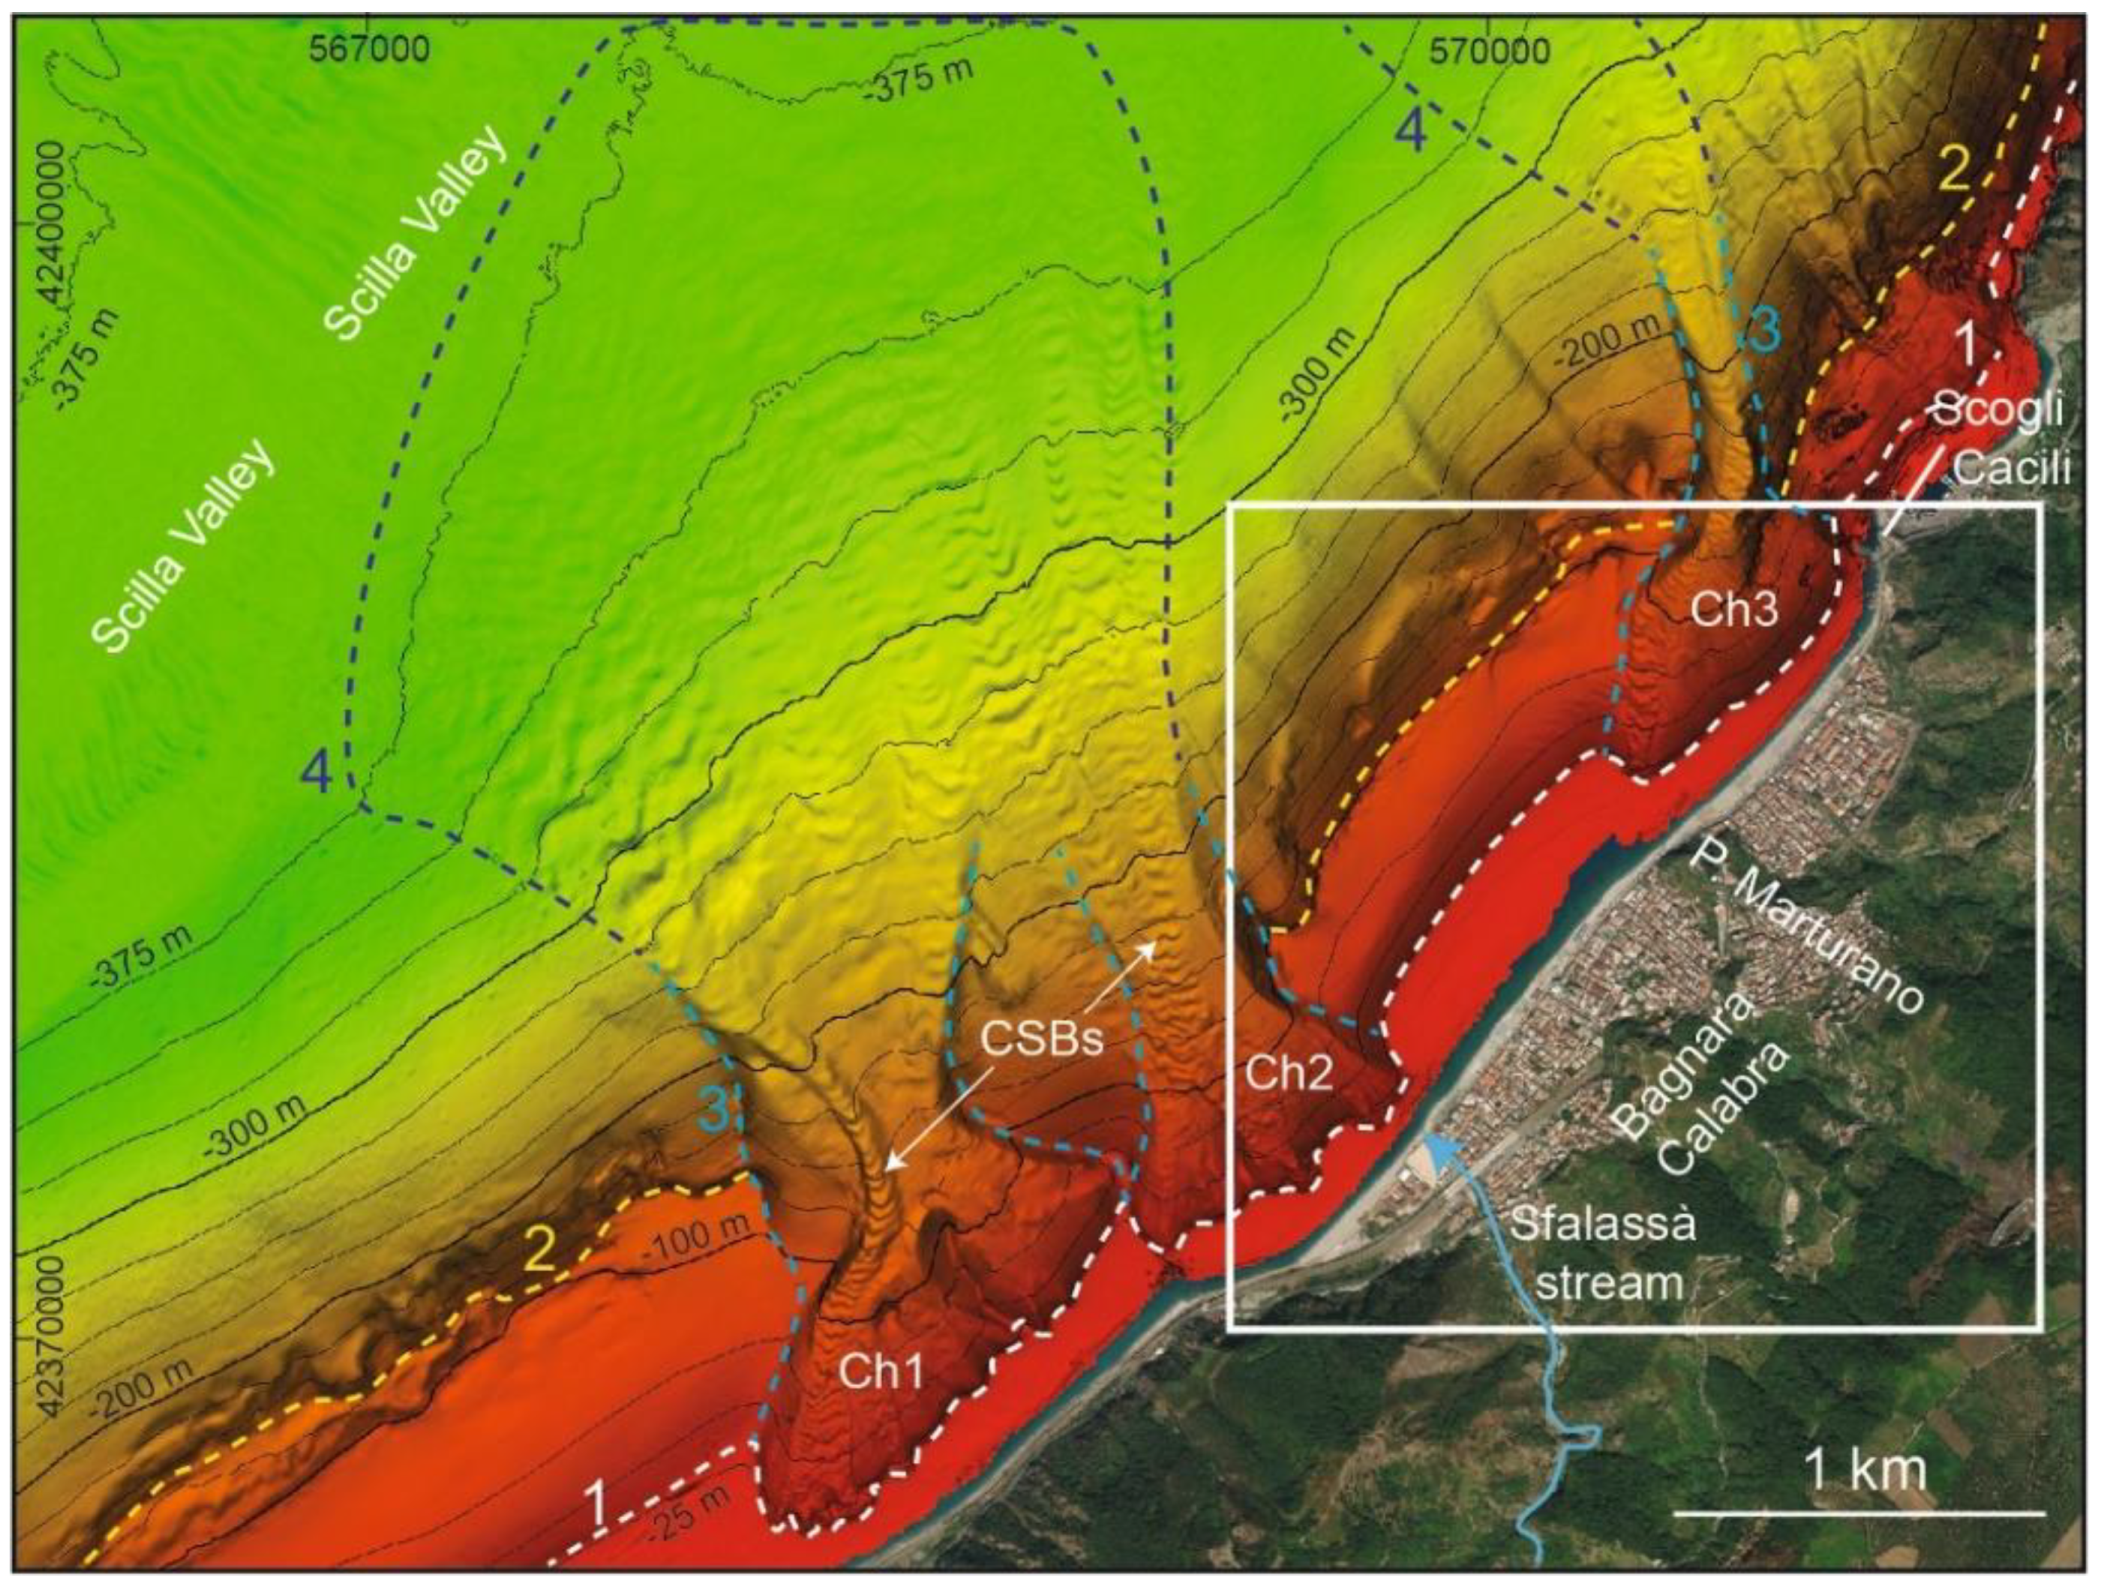
As the submarine area is concerned, the continental shelf is very narrow (<1 km) or almost absent, as observed along the whole Calabrian margin [
30] and seaward shifts to a steep continental slope (
Figure 3).
The shelf break is generally located around 100 m of depth. Still, it is markedly shallower (<15 m of depth), where it is deeply carved by three main submarine channels, (Ch1–3 in
Figure 3). Ch1–2 are located southward of the Sfalassà Stream, while Ch3 occurs northward of P. Marturano [
31]. Coaxial trains of crescent-shaped bedforms (CSBs) are found on the channel floor, indicating recent sedimentary activity. The channel headwall morphology results from the coalescence of several landslide scars at hundreds of meters scale, testifying that this area is prone to frequent mass movements [
31]. The slope failures affect the edge of a nearshore submarine depositional terrace (NSDT in
Figure 3), i.e., a sedimentary wedge formed during the present sea level highstand [
8], thus suggesting a very recent age for their formation. At depths higher than 200 m, the channels progressively evolve in fan-shaped depositional features, mainly in relation to a marked decrease of slope gradients from values >10° to values <5°. These features extend down to 375 m of depth, partially fill the Scilla Valley, where they interact with bedforms fields formed by strong bottom currents coming from the nearby Messina Strait (
Figure 3) [
32].
3. Materials and Methods
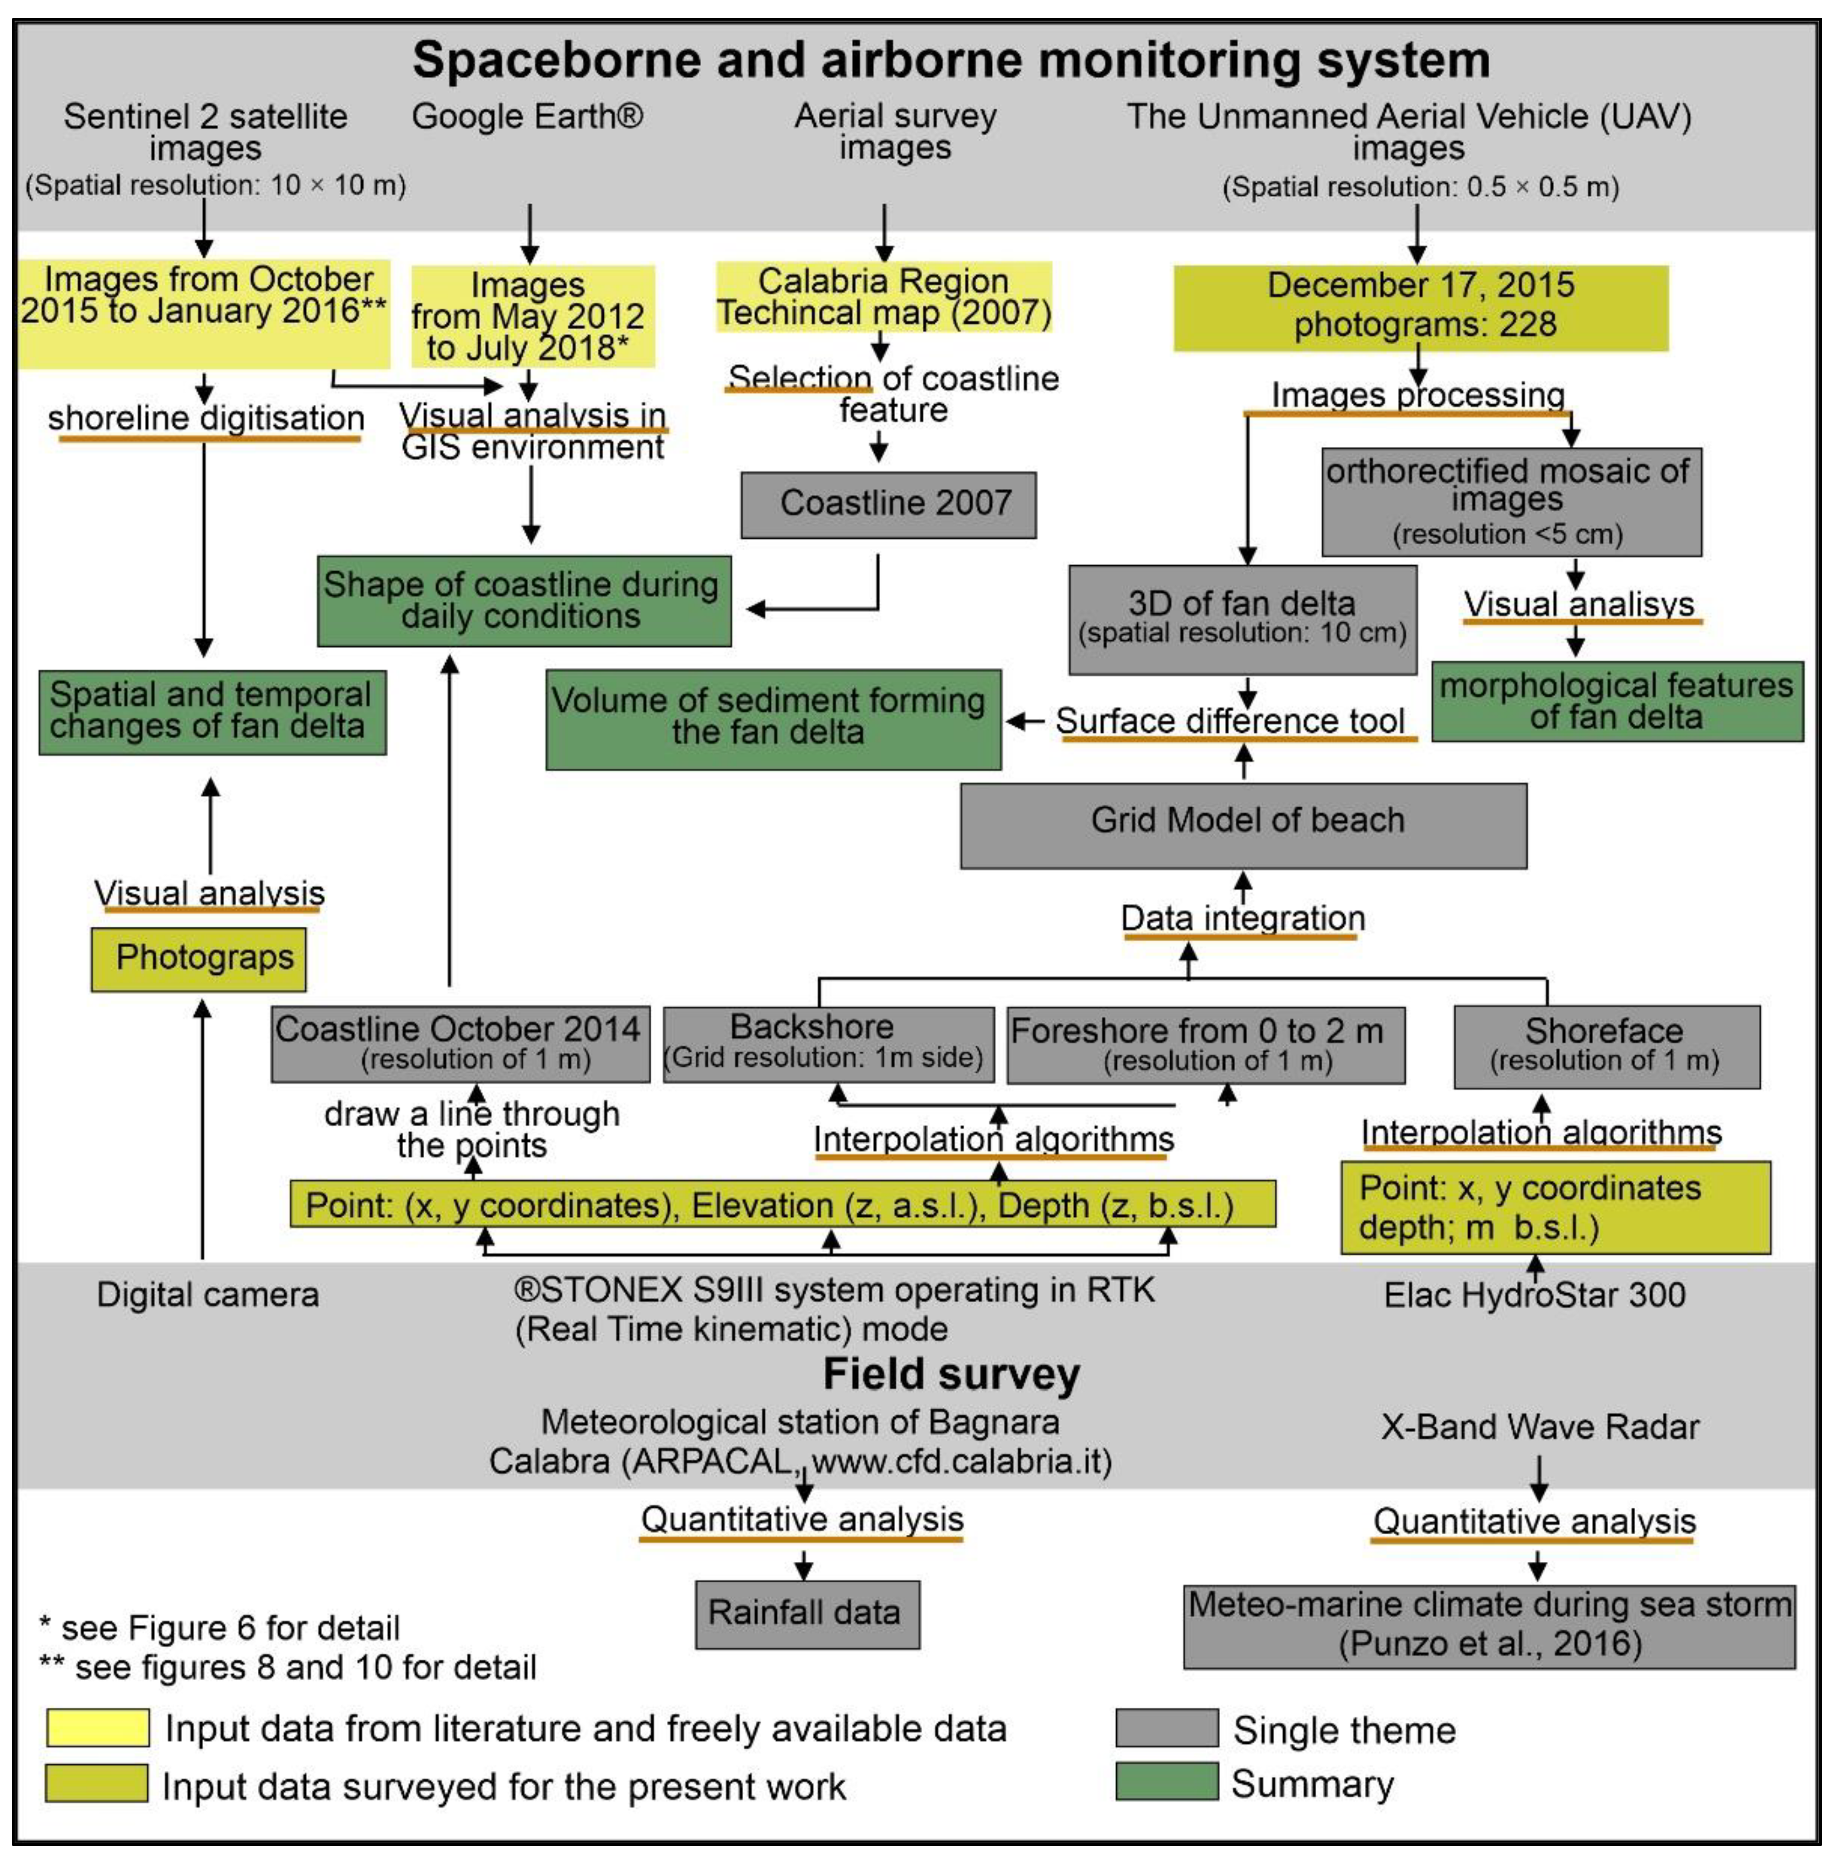
In the present work, space-borne and airborne remotely sensed images have provided a suitable dataset to monitor the evolution of the Sfalassà fan delta, as the product of flooding event occurred at Bagnara Calabra on 2 November 2015, and its subsequent dismantling by the sea storms. This dataset was integrated with field surveys data about the shape of the coastline and of backshore, foreshore and shoreface morphology (
Figure 4). Furthermore, the location of a meteorological station in the study area, made it possible to have data on the exceptional meteoric event that occurred in the first days of November 2015. In this area was also temporary installed a radar mobile recording the sea state during storm surges [
33]. The methodology implemented in this work (
Figure 4), based mainly on spatial analysis and algorithms available in a Geographic Information System (GIS), aims to highlight the importance to know the driving factors which modify the coastal environment in both daily (daily stands for absence of flooding or storm surge events) condition and after flooding and/or storm surge events.
Four steps were followed to compute monothematic data (grey boxes in
Figure 4) and five for summary data (green boxes in
Figure 4). The first four steps are:
- -
Selection of the Sentinel 2 images, Google Earth images and Calabria Region technical maps.
- -
Digitalization of coastlines from Sentinel 2 images, selection of coastline from Calabria Region technical map and drawing of the coastline surveyed in 2014.
- -
Image processing of the Unmanned Aerial Vehicle to orthorectify and mosaic the images and to create the 3D model of the fan delta.
- -
Interpolation of backshore height and seabed depth points, measured during field surveys, to define spatially continuous data (gridded data).
The five steps for data summary are:
- -
Visual analysis of images to identify the shape of coastline during daily conditions.
- -
Quantitative analysis of Sentinel 2 image to map the spatial-temporal changes of fan delta.
- -
Sum of the backshore height and bathymetric depth grids to define a grid model of beach before the flooding event.
- -
Use of the surface difference tool algorithm to calculate the volume between the 3D Model of the fan delta and the beach grid collected before the flash-flood event.
- -
Visually analysis of Unmanned Aerial Vehicle images to identify the main morphological features of the Sfalassà fan delta.
Furthermore, oblique photos provided information on the evolution of the fan delta when cloud cover in the Sentinel 2 image prevented the view of the study area. The rainfall and sea climate data helped to identify the characteristics of rainfall events that generally precede flood events and the characteristics of storm events able to dismantling a fan delta, respectively.
The single dataset and the procedures applied to integrate the information collected for the present study, were described in the following sub-paragraphs.
3.1. Free Satellite and Drone Images
The first step of this analysis was the identification of coastline shape during daily conditions. At this aim, a visual examination of four Google Earth
® images covering a time interval from 2012 to 2018 was realized. According to [
15] and reference therein, before using this data, the planimetric accuracy of the single image was improved through a new geo-referencing process. At this aim, the coordinates of Ground Control Points (GCP: corner of tennis court, parking space, buildings and streets) read on 1:5000 technical map of Calabrian Region, were attributed to the same elements in the Google Earth images. This geo-referencing process was provided images with a root mean square error (RMS) of 1.2 m.
The Sentinel 2 satellite images were also analysed to monitor the spatial and temporal change of the fan delta. Aiming at this, the images on 3 October 2015, 12 November 2015, 22 December 2015 and 1 January 2016 were downloaded by the Copernicus site (
https://sentinels.copernicus.eu/web/sentinel/sentinel-data-access, accessed on 2 October 2021). Images successive to these data were also available but the extensive cloud cover prevented their use. For each images the coastline was digitized, and the rates of shoreline change were calculated using DSAS [
34], an extension of ArcGIS software rel.10.8.2 (ESRI, Redlands, CA, USA). In this work, the shoreline position was defined as the water line at the time of the image because the study area is located is in a microtidal environment [
35]. This program made it possible to easily create 26 perpendicular transects, spaced every 10 m, to measure the changes between two successive coastlines; however, only those between 12 November 2015 and 22 December 2015 were used because for the others the rate of change was lower than the spatial resolution (pixel dimension: 10 × 10 m) of Sentinel 2 images.
AEROPIX, the Unmanned Aerial Vehicle (UAV), enabled high resolution data to be collect immediately after the formation of the Sfalassà fan delta. The high spatial resolution (pixel dimension: 0.5 × 0.5 cm) of the images made possible to identify the main morphological characteristics of the fan delta and to build a 3D model. AEROPIX is a multirotor with a maximum take-off weight of 8.45 kg, its main features are listed in the
Appendix A Table A1. During the survey, made on 17 December 2015 (9:00 a.m.–12:00 p.m.), 228 photograms were acquired. The weather conditions were favourable, with a weak wind (intensity of about 2–3 knots NW) and light cloud cover. After an initial test phase to check the functionality of the system, two photogrammetric flights in semi-automatic mode were performed. The system ensured a photogram overlap of at least 80%. The maximum altitude reached was 100 m above the ground. The aerial activities were preceded by the placing of 20 photogrammetric targets (Ground control points—GCP, dimension 30 × 30 cm) positioned at the start and end of the strips and uniformly distributed along the block of strips for a correct image orientation and to preventing deformation. The coordinates of GCP were measured with TOPCON differential GPS, linked to the vertices of the IGM95 national geodetic network, with an accuracy of less than 2 cm. The procedure for making UAV images usable for environmental studies involves two steps: internal (camera calibration) and exterior orientation (image rotation). The internal orientation defines the image center, considered to be the point of intersection of the camera’s optical axis with the camera’s sensing plane, focal length and lens distortions. The exterior orientation is the position and orientation of the camera when the image was taken, so representing the relationship between the ground and the image. To facilitate this orientation, tie points (same objects visible in multiple images) and Ground Control Points (easily identifiable objects placed on the ground with known coordinates) were used. These two calibrations enabled images to be oriented and georeferenced. After these procedures, a dense matching technique was used to represent the shape of objects sited in the study area with dense point clouds useful to structure a photo-realistic representation of the surveyed area [
36]. Finally, the semi-global approach was used to generate a points cloud from stereo-pairs of images that were successively merged into a single dataset. All the processing phases were made with Photomod software rel.7.2 (Racurs, Moscow Russian,). An orthorectified mosaics, (all elements are in a map-like projection) with a spatial resolution lower than 5 cm, and a Digital Elevation Model (DEM), with a spatial resolution less than 10 cm and a Mean Square Error (MSE) of 0.3 m for elevation values, are the outcomes.
3.2. Field Survey Data
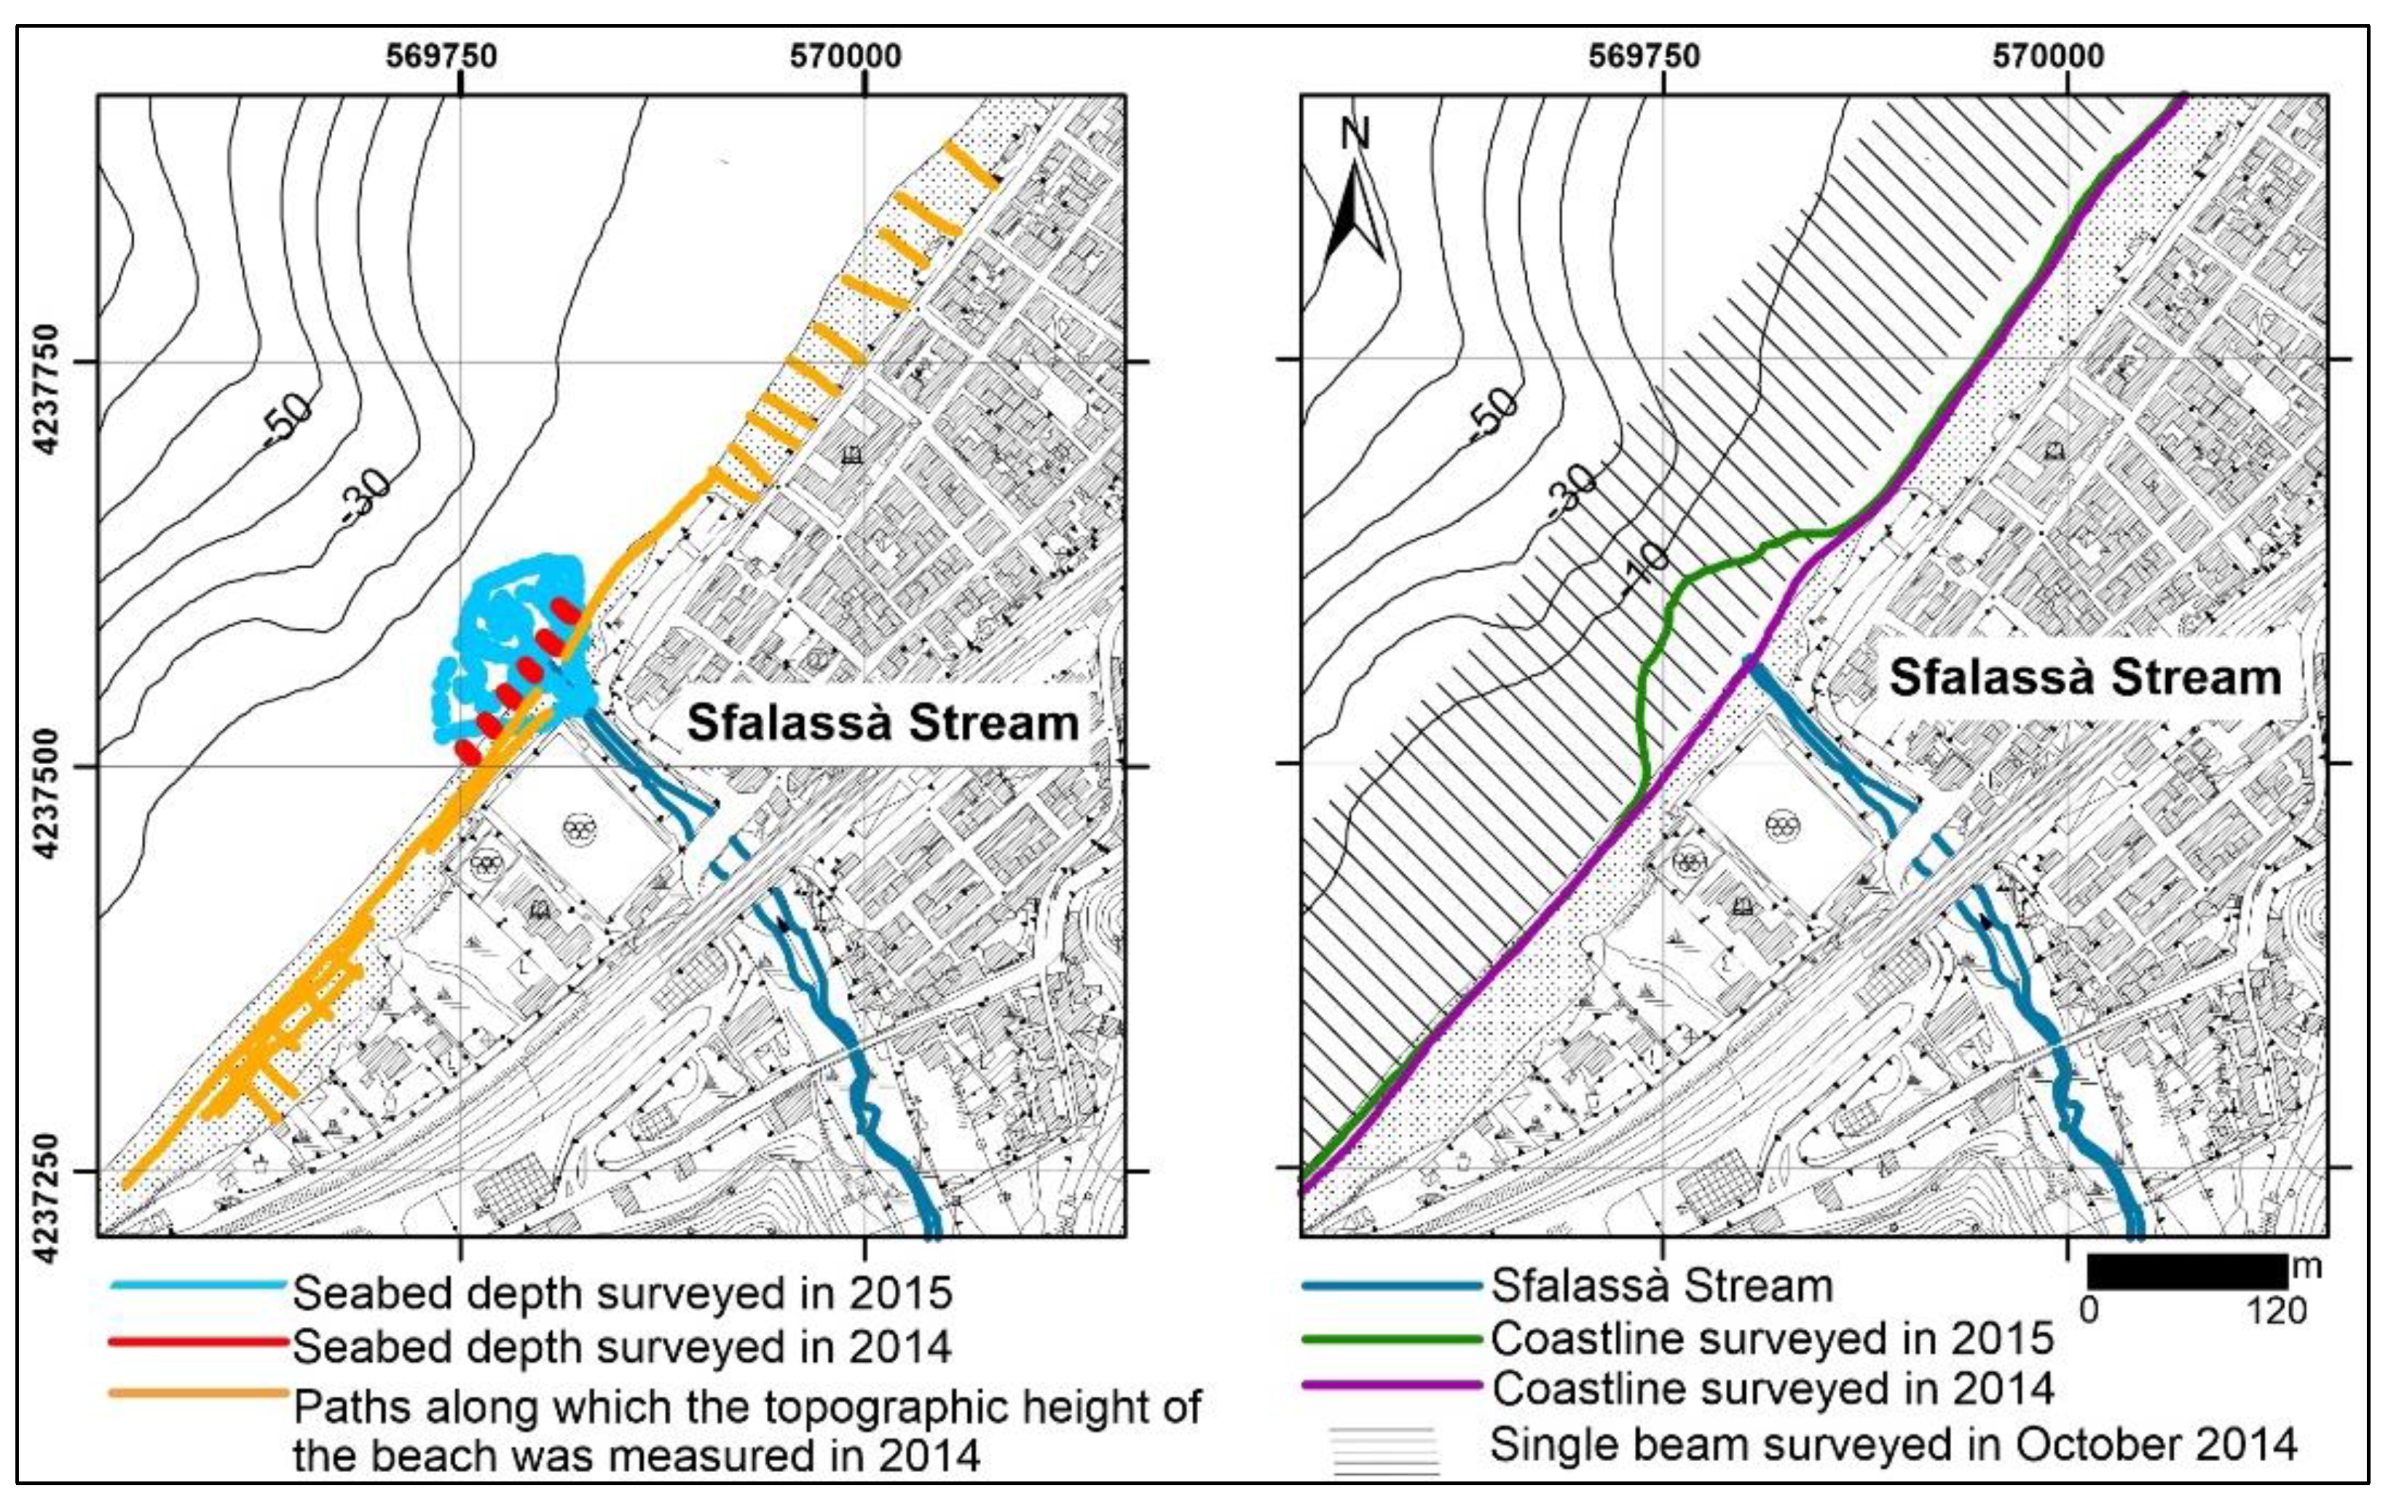
The coastline of 15 October 2014, the depth of the seabed from 0 to −2 and the backshore morphology prior to the formation of the Sfalassà fan delta were surveyed with the
®STONEX S9III system (STONEX, Paderno Dugnano, Milano, Italy) (In the
Appendix A Table A2) operating in RTK (Real Time kinematic) mode connected to a permanent Global Navigation Satellite System (GNSSNetwork) in the reference system WGS84, UTM-33N. The Network Real Time Kinematic (NRTK) service used for the surveys at Bagnara Calabra, provided by “Regione Calabria”, is based on 17 permanent GNSS stations (In the
Appendix A Table A3). This system acquires a great number of points in a short period ensuring a centimetric scale accuracy (In the
Appendix A Table A2). It combines data from several widely spaced permanent reference stations that regularly communicate position measures to the roving receiver improving the accuracy of acquisition in terms of position (x, y coordinates) and height (z: elevation or depth). The coastline of October 2014 was delineated by using a spatial algorithm, available in a Geographic Information System (GIS) environment, that trace a line through all points surveyed with an equidistance of 1 m. The morphology of backshore was surveyed along 18 sections, 3 parallel and 15 orthogonal to the coastline, in October 2014. The geographical position and the height, varying between 0 m and 3.5 m a.s.l. were measured in 865 points (
Figure 5) then processed with the “minimum-curvature splines with tension” interpolation method [
37], to generate the 3D model of the backshore. This gridding method is like an elastic plate that approximates the natural morphology of land surface passing through all the input data. The oscillations and anomalous inflexion points, possibly generated during the gridding process were automatically removed by adding some weights to the elastic-plate flexure equation [
37]. The grid has a cell-size of 1 m sides and a MSE of 0.03 m.
In October 2014, the depth of the seabed from 0 and about 2 m was measured along 6 transects spaced 20 m apart and perpendicular to the coast (
Figure 5). By using a graduated pole connected to the GNSS receiver head the easting, northing positions and z depth were recorded for each sounding (total number: 607). The measures have a MSE of ±0.8 cm on both planimetric and altimetric resolution.
A Single Beam survey was realized using the Elac HydroStar 300 for the deeper zones in October 2014. This instrument works with a dual operating frequency of 30/200 KkHz and it can survey the seabed at depth up to 120 m. Its technical features are reported in the
Appendix A Table A4. Data georeferencing was ensured by the Hemisphere Vector V103 Compass GPS system, consisting of a double antenna that provides positioning data but also acts as a gyrocompass (In the
Appendix A Table A5). The data were acquired using the QINSy-QPS software rel. 7.0 (Zeist, Netherlands), along evenly spaced transects perpendicular to the coast, corrected for tidal variation and processed to generate both the digital model of the seabed and the contour lines with 1 m spacing. The survey covered an area of about 0.3 km
2 from Bagnara Calabra to a depth of about 30 m, the measurements are characterised by a MSE = ±0.5. The algorithm applied to the backshore data, was also used to generate a bathymetric grid with a cell of 1 m sides. The seabed and backshore grids together with the 3D fan delta represented the input data to calculate the volume of sediment deposited by the Sfalassà Stream during the flooding event. To this end, two steps were necessary: first, the topography of the seabed and the backshore were summed; second, the algorithm “
surface difference tool”, available in the GIS environment, was used to calculate the volume between the pre- and post-2015 flood event.
3.3. Meteo-Marine Climate
An X-Band Wave Radar (Bridge Master 25 KW antenna with a 2.4 m antenna), installed on the Hotel Victoria roof in the central part of the Bagnara Calabra village, acquired data during the sea storm occurred from 24 to 27 February 2015. This event, although outside the time frame studied, made it possible to identify the sea state near the coast during the winter storm surge. The system configuration (rotation time of the antenna: 1.97 s, antenna height: 20 m a.s.l.) ensures an acquisition range of 2200 m and an investigated angular sector of 180° with a spatial resolution of 5 m. The radar data, analysed by [
33] consisted of 32 individual images with an interval of 1.97 s between successive images. These authors managed the images sequence to compensate them by distortions introduced by the radar acquisition process [
38] and capture the wave spectrum and the sea state parameters (direction, period and the wavelength of the dominant waves) from the 3D spectrum of a raw radar sequence [
39]. In detail, they used the dispersion function of sea gravity waves to extract the wave signal from the background noise and to reconstruct the sea state parameters. The Normalized Scalar Product (NSP), i.e., the most accurate among the different inversion procedures developed in recent years was applied to the sequence of marine radar images of Bagnara Calabra (for detail see [
33]).
3.4. Rainfall Data
The study area, as the whole western part of the Calabria Region, is exposed to more annual rainfall, mainly due to cyclones developing in the western Mediterranean area, than the eastern side which suffers more intense rainstorms [
40]. The geographical position, located in the central part of the Mediterranean area, and physiography, i.e., mountains stretched along southeast-northeast direction, are the main causes. The mountains force the humid air to move upwards and cause the precipitation on the windward side [
41]. The Calabria Region is in fact, one of the wettest regions of southern Italy, with average annual rainfall of 1151 mm in comparison to the national average of 970 mm. In detail, the mountain area is characterized by a cumulative value of annual precipitation of about 2000 mm, this value decreases, although it remains high, to about 500 mm in the coastal area. The wettest months are from October to March, in this time window about 70–80% of annual precipitation falls, only 10% occurs in summer [
42] but is very intense in fact, the rain that generally falls in some months may occur in few days [
43,
44]. Very recently, Greco et al. [
45] analyse 459 events from 2002 to 2015, pointing out that the intense rainfalls prevails during the summer (34%) and the autumn (48%). The rainfall data of 2 November 2015 event was recorded by the meteorological station of Bagnara Calabra, one of the stations managed by the Regional Agency for Environmental Protection of Calabria [
46].
4. Results
4.1. Free Satellite and Drone Images
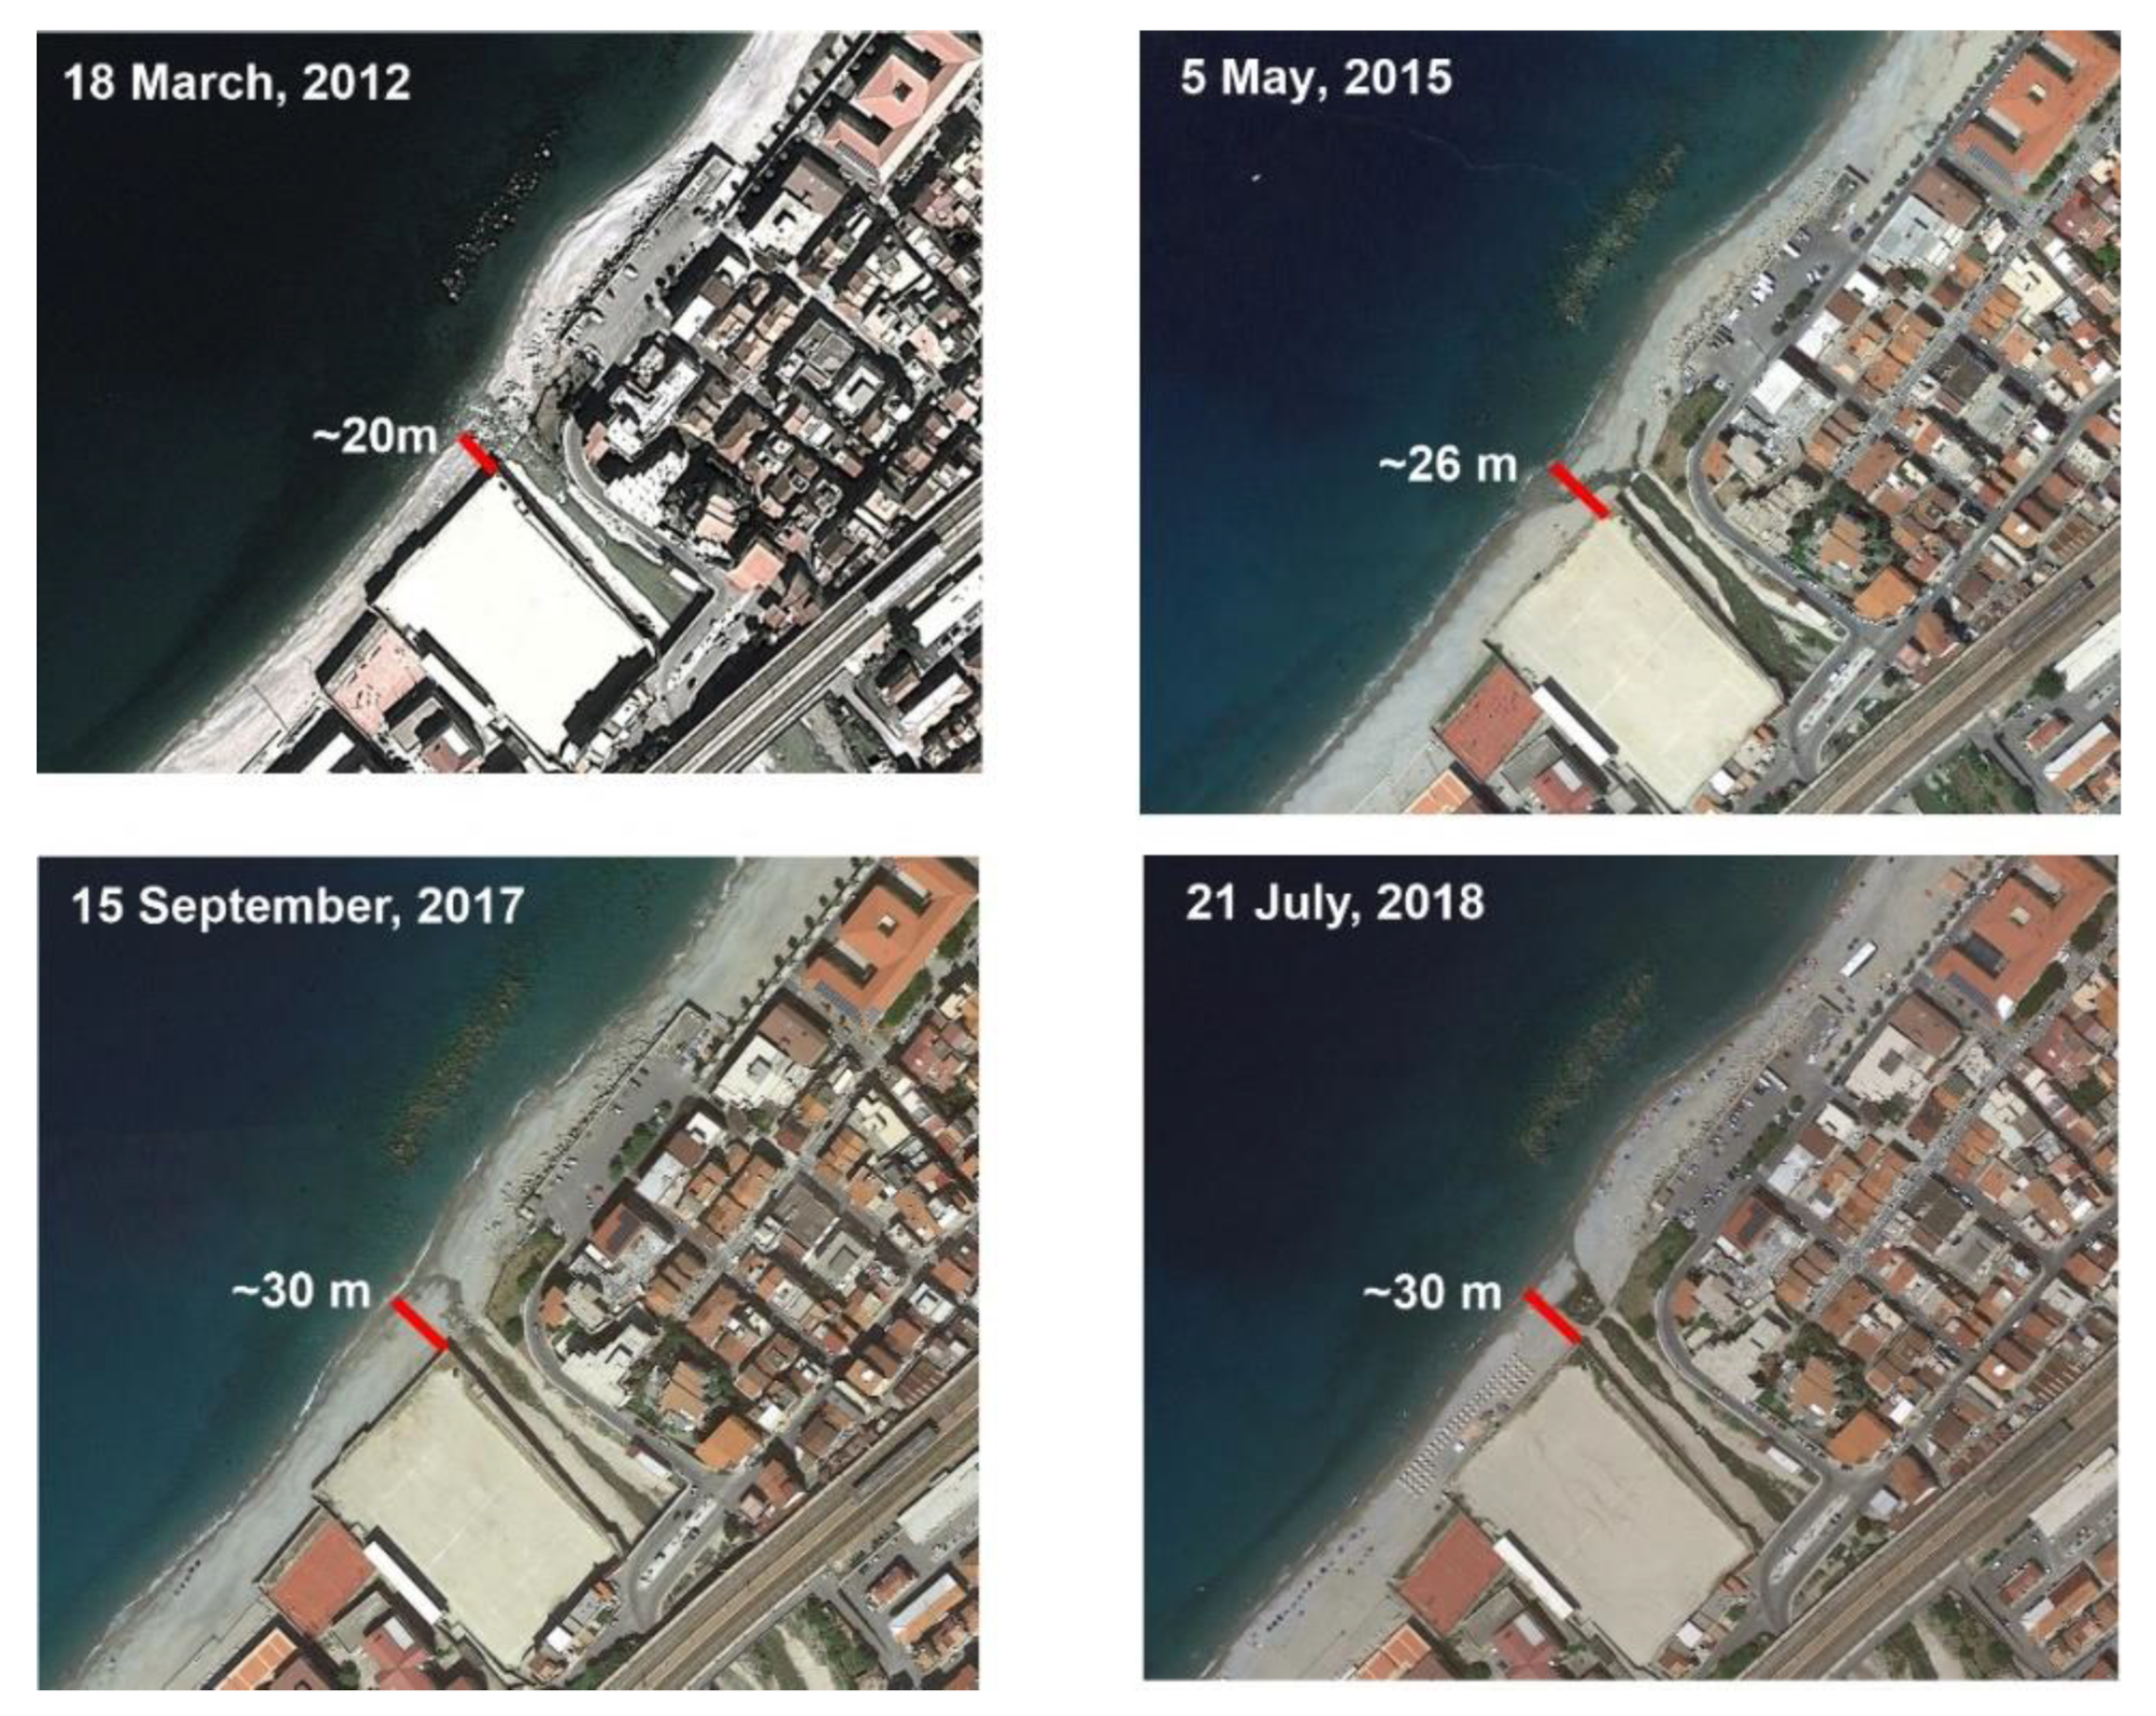
The visual analysis of Google Earth images pointed out a straight coastline shape in all seasons for several years. The shape of the Sfalassà Stream mouth slightly changed during years and the extension of the backshore varied from 20 to 30 m (
Figure 6).
High-resolution drone images of the fan delta allowed us to identify its distinctive morphological features. The fan delta stands out clearly from the narrow beach, occupying an area of about 10,400 m
2 and is characterised by a branch of canals diverging southward from the Sfalassà Stream mouth, depositional lobes and levees (
Figure 7).
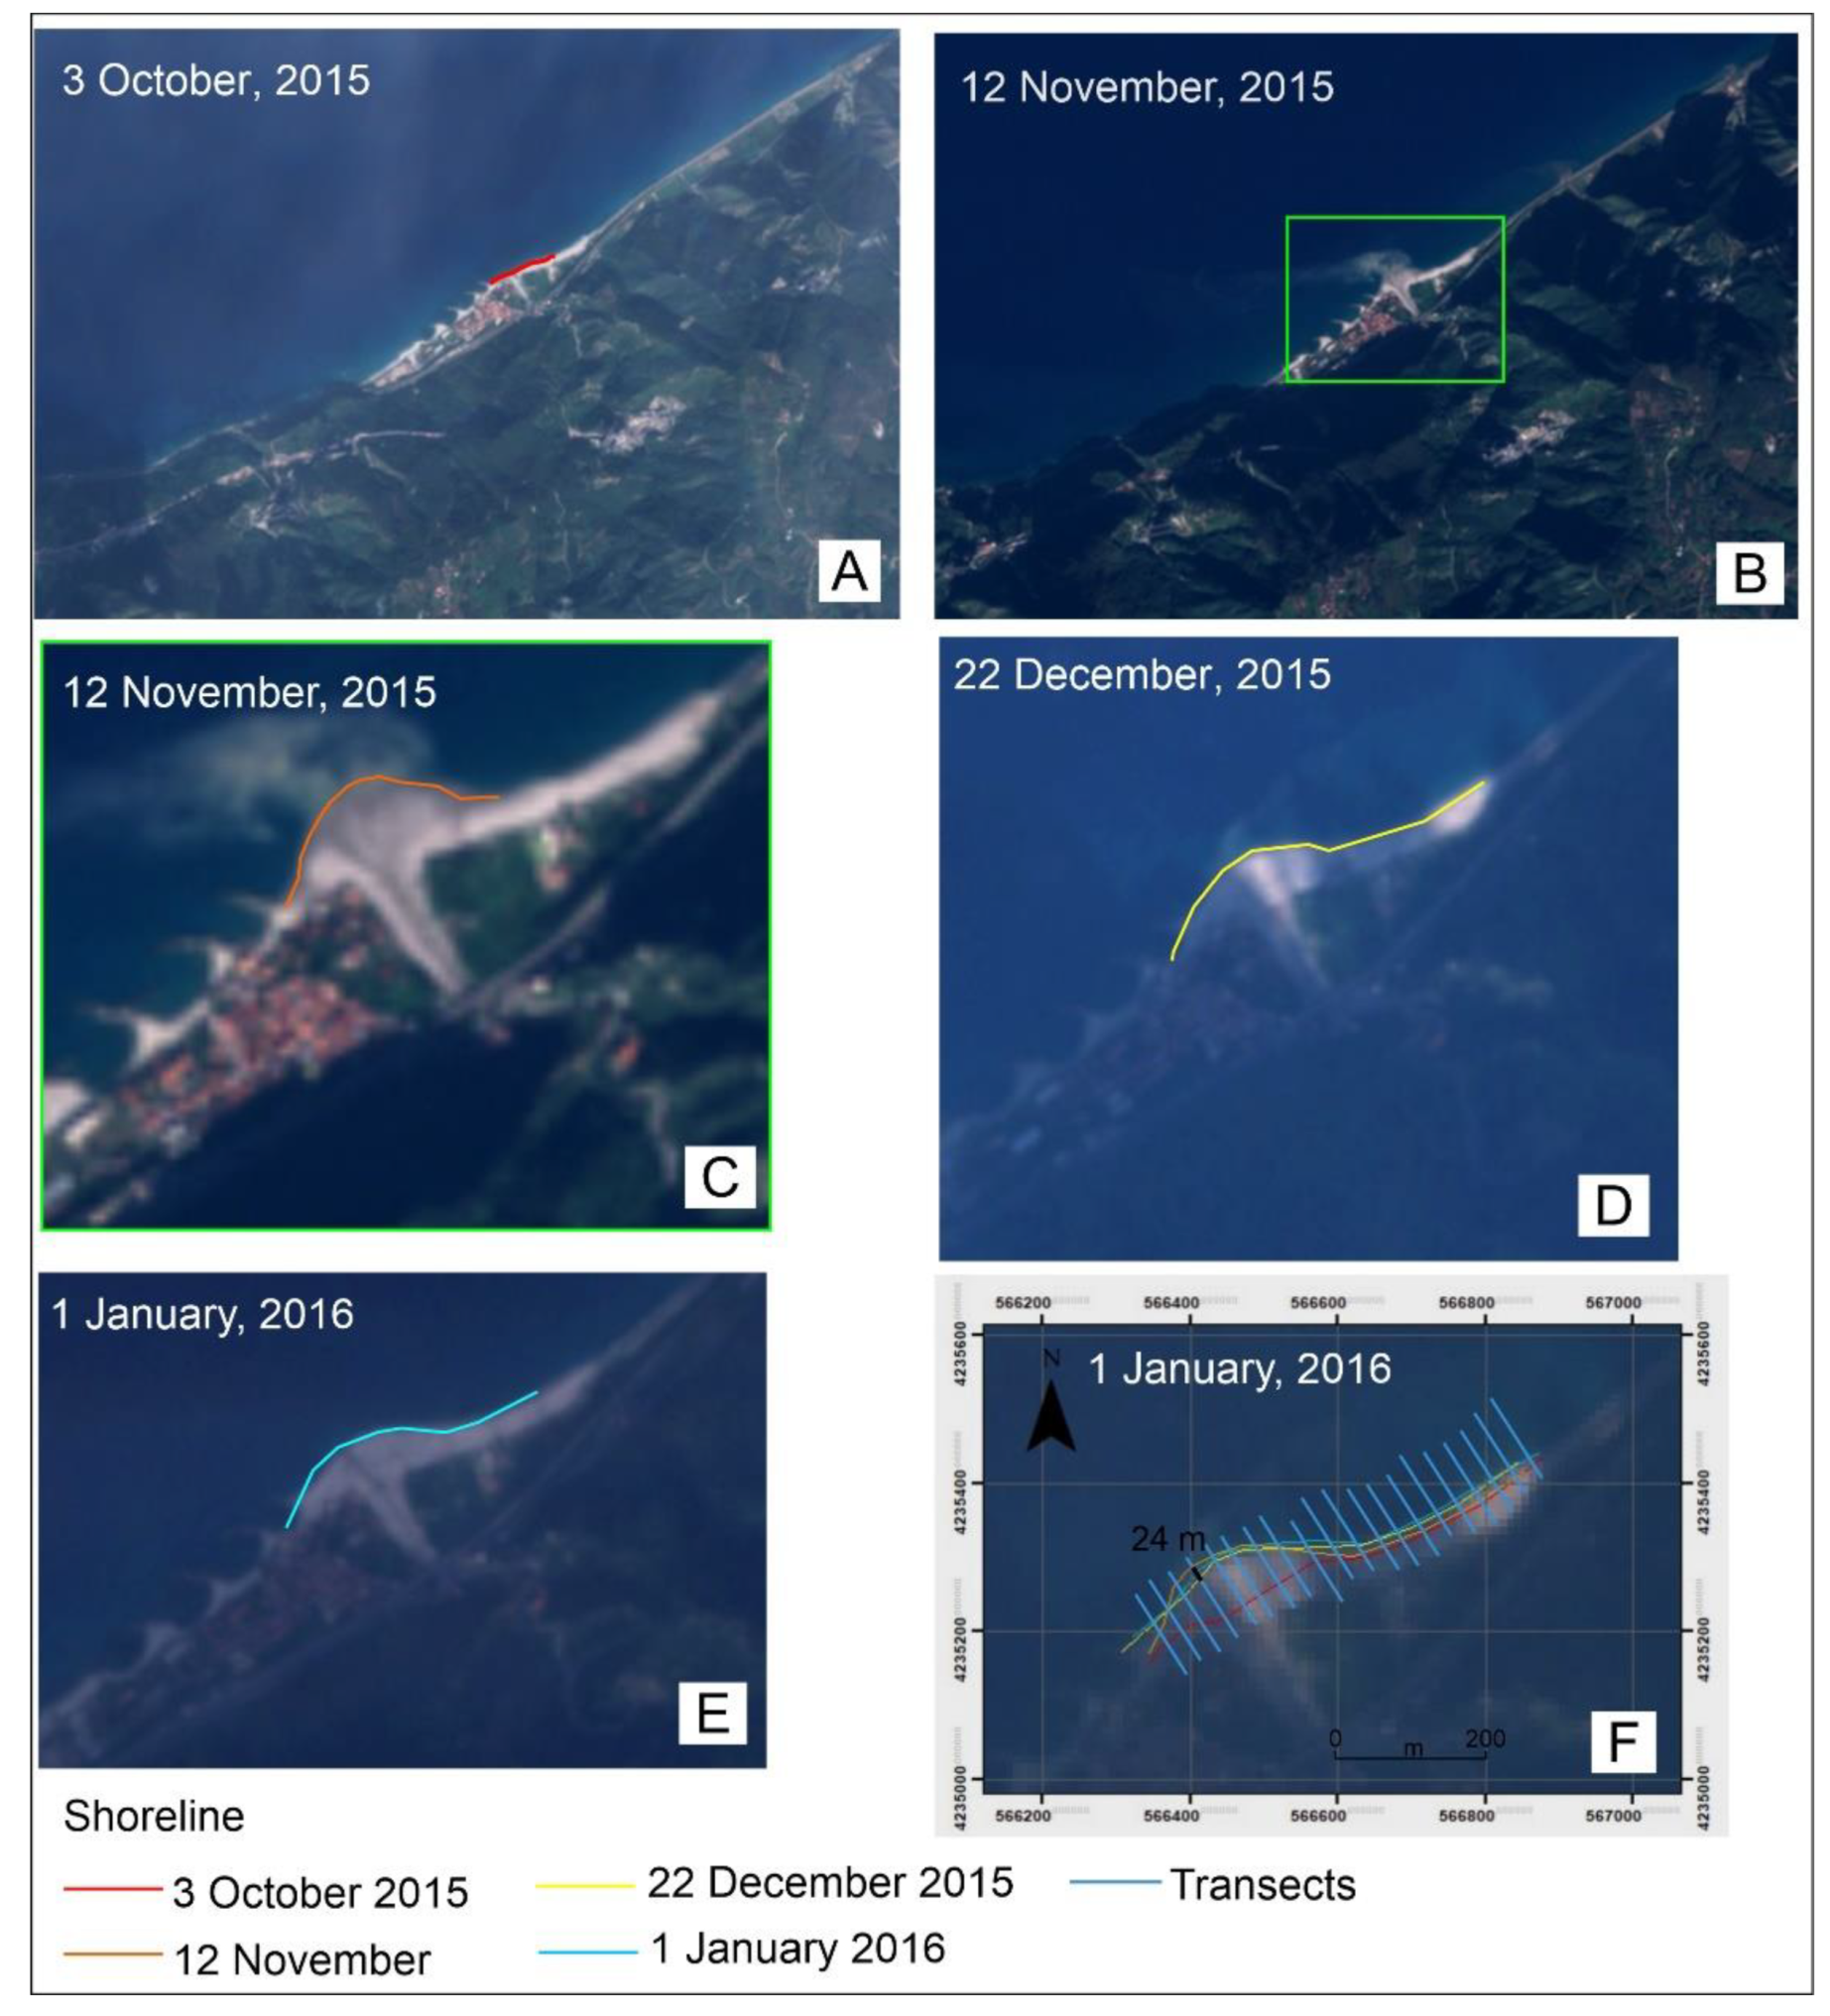
Sentinel 2 satellite images (
https://sentinels.copernicus.eu/web/sentinel/sentinel-data-access, accessed on 2 October 2021) made it possible to monitor the spatial and temporal fan delta development. On 3 October 2015 the coastline was straight (
Figure 8A) while on 12 November it showed a clear fan delta shape (
Figure 8B,C). This fan appears be partially eroded in the 22 December 2015 image (
Figure 8D) and, except for small variations, retains mostly the same shape in the 1 January 2016 image (
Figure 8E).
This observation testified that the erosion of the fan delta apex, visible in the 22 December 2015 image was mainly due to the sea-storm occurred from 25 to 28 November 2015. The extensive cloud cover in the Sentinel 2 images during January did not allow to observe the evolution of the fan delta during the storm surges occurred between 8–18 January 2016. This visual analysis was supported by a quantitative one (
Figure 8F) which showed erosion of the apex of the fan delta by 10-20 m, between the 12 November and 22 December 2015 coastlines (
Figure 8G). The shoreline variation was not calculated between 22 December 2015 and 1 January 2016 because lower than a mean value of 3m. This latter is very close to the uncertainty value of the coastline position (±1.6 m) defined on the basis of the average daily sea level variation (20 cm, [
47]) and the intertidal slope of 12% (
Figure 8G).
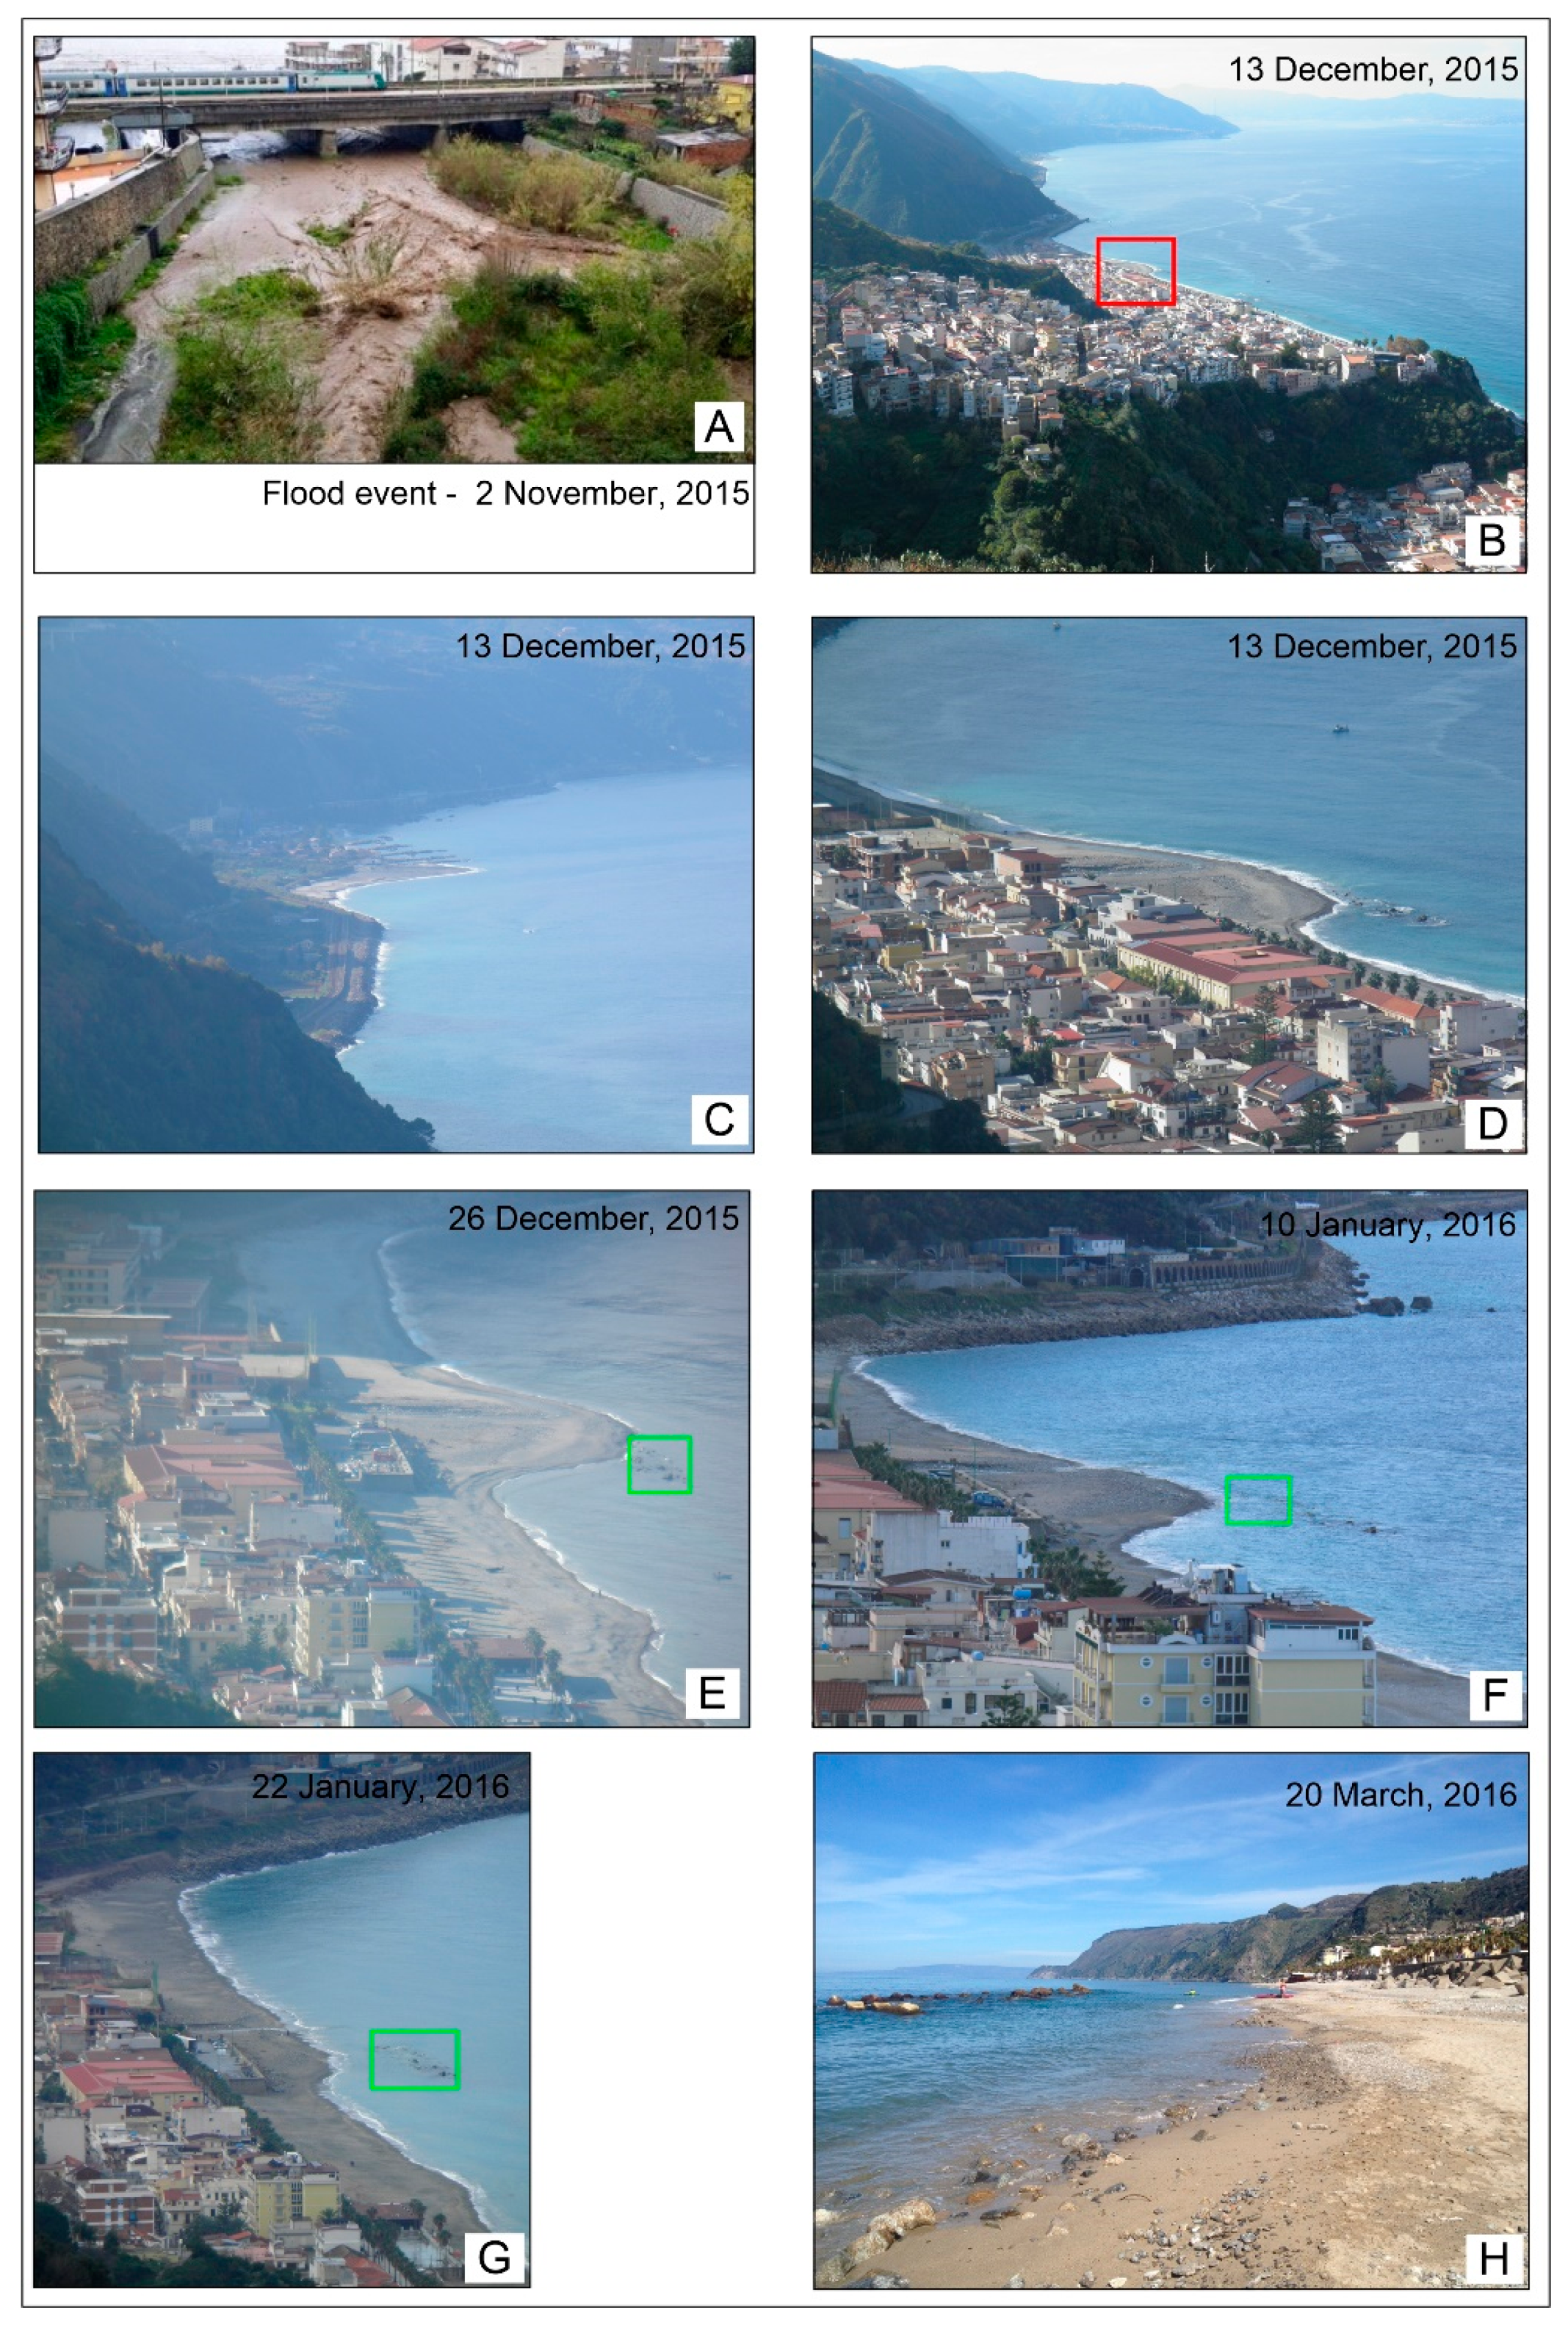
This analysis was also supported by several photographs taken from the formation to the dismantling of the fan delta (
Figure 9). They represent a detailed view of the Sfalassà mouth and complete the state of knowledge for the period not covered by satellite images. In the photo of 2 November 2015, the brown colour of the Sfalassà River highlights a high sediment load (
Figure 9A). The fan delta is reported in the panoramic view of
Figure 9B and in detail in the
Figure 9C,D. All these photos testify the presence of a well-developped fan after more than a month from its formation. The viewpoint of the photo made on 26 December, offers a better visualization of the fan delta, allowing to appreciate its almost unchanged shape (
Figure 9E) while it appears partly eroded in the photos of 10 January 2016 as testified by the absence of sediment beyond the group of rock encircled by the green square in
Figure 9F.
It was almost completely eroded in the 22 January photo, (
Figure 9G) and absent in that performed on 20 March 2016 (
Figure 9H).
The analysis made by Sentinel 2 images was corroborated by the spatio-temporal evolution of the fan delta formed at Favazzina Stream mouth, a few hundred metres south of the Sfalassà Stream. Similarly, the Favazzina fan delta was formed after the flooding event of 2 November 2015 (
Figure 10B,C) and was partially eroded by the sea storm that occurred from 25 to 28 November 2015 (
Figure 10D). The fan delta is still in place on 1 January 2016 (
Figure 10E,F).
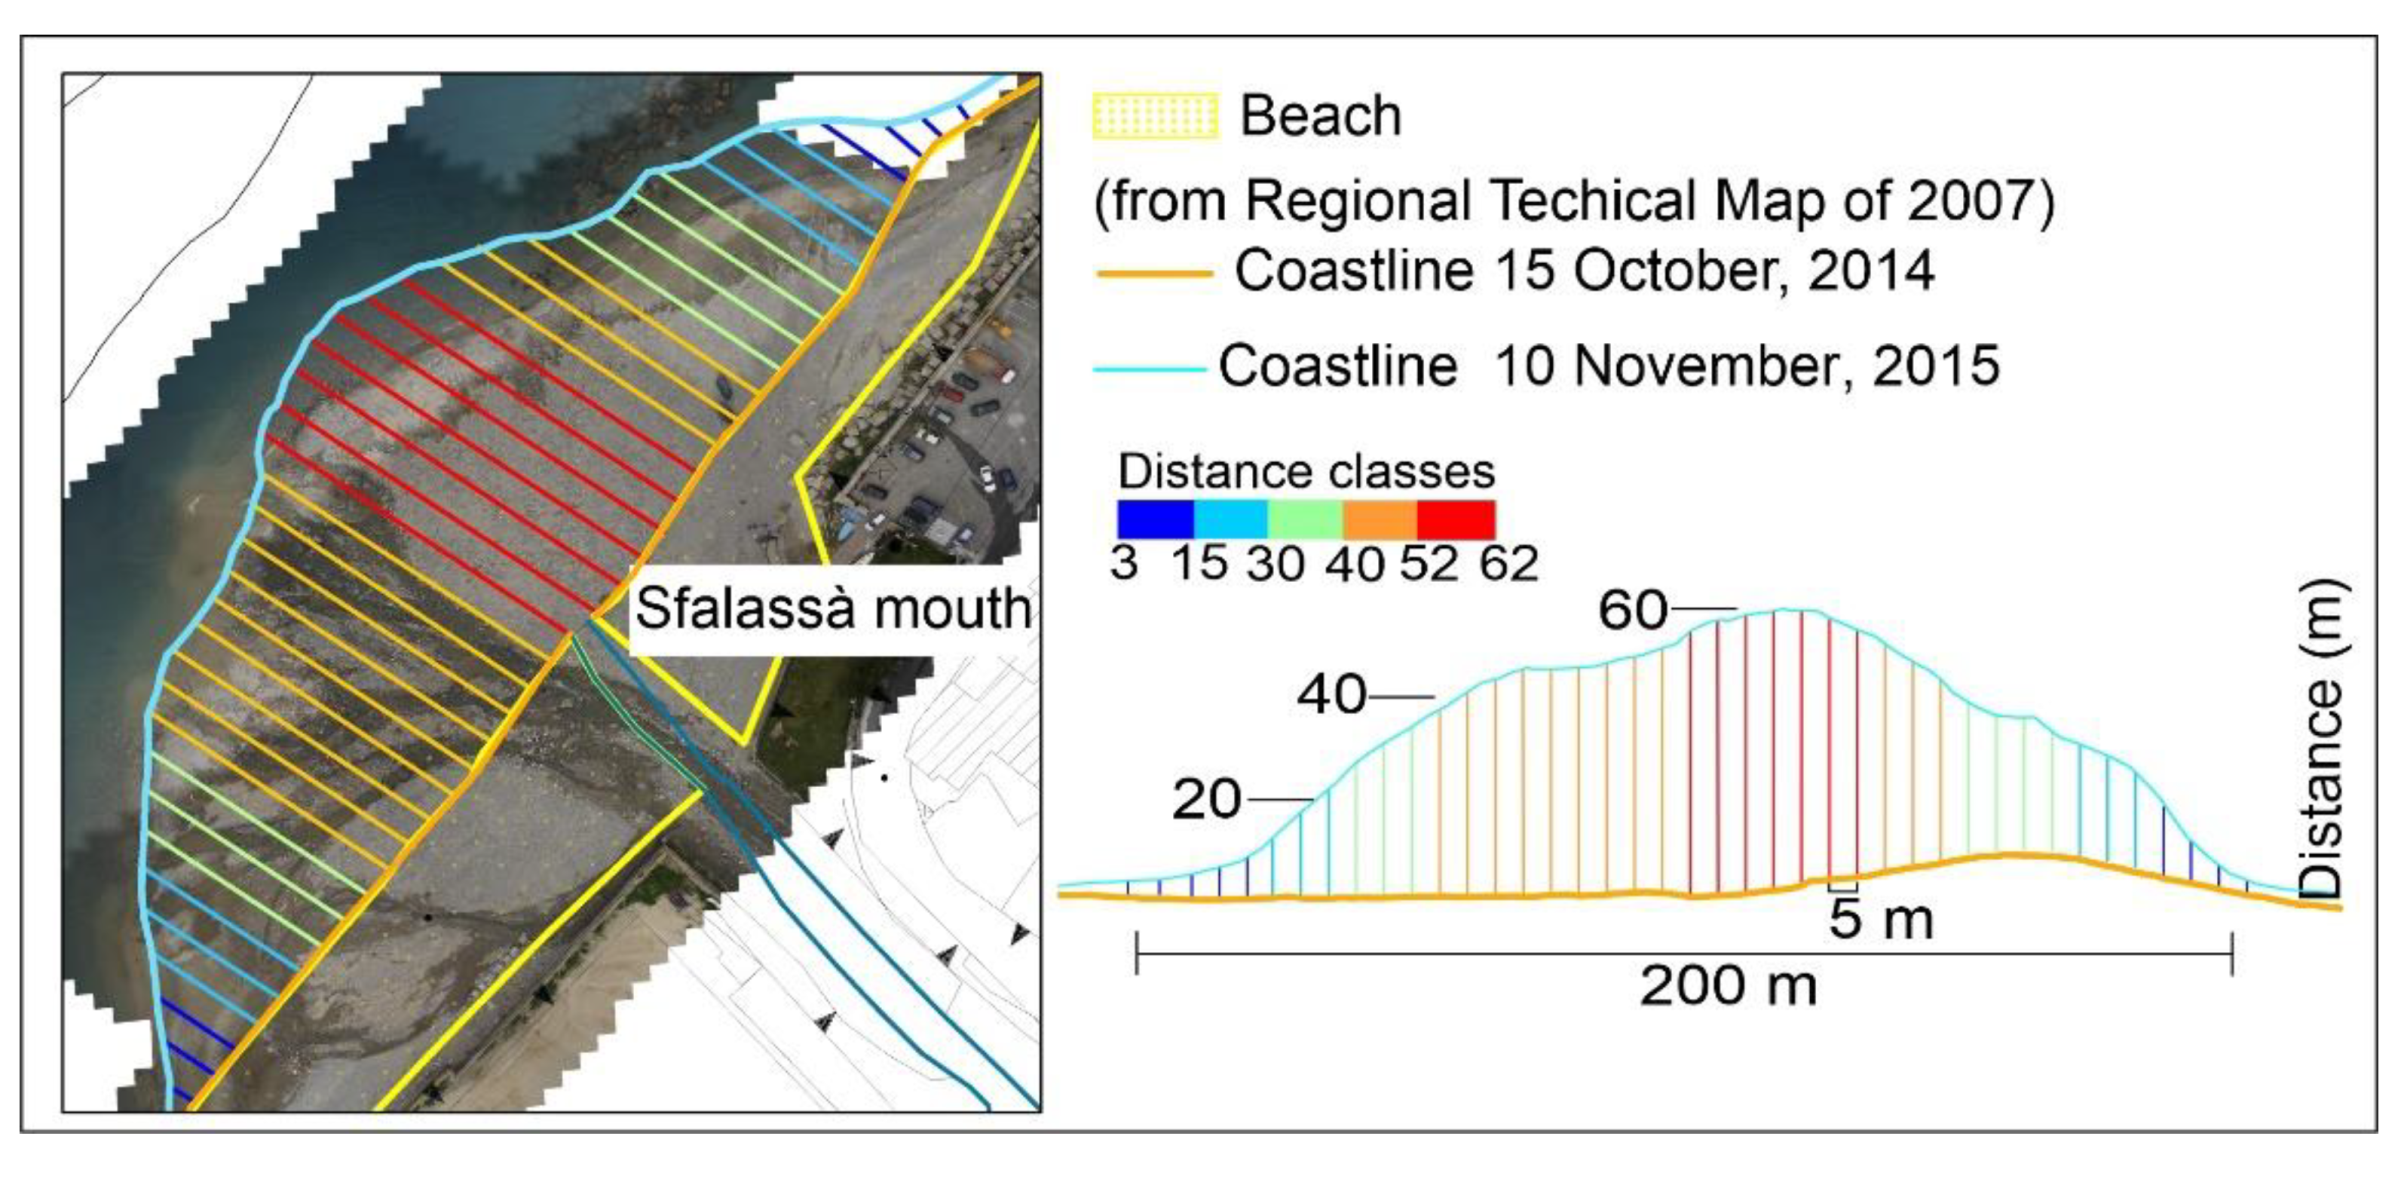
Furthermore, the volume of fan delta was calculated. The overlay between the 3D model of the fan delta and the grid of beach morphology prior the flooding event made it possible to calculate in 25,000 m
3 with an error of ±3100 m
3 the volume of coarse sand and gravel deposited by the river. The prograding of coastline after the fan delta formation was calculates by the comparison of coastlines surveyed on 15 October 2014 and on 10 November 2015 along 40 transects spaced every 5 m (
Figure 11). The apex of the fan delta and the midpoints of its lateral zones are located approximately at 60 m and 30 m from the coastline, respectively (
Figure 11). The fan delta has a maximum width of about 220 m between the two points where the pre- and post- flooding coastlines coincide (
Figure 11).
4.2. Field Survey Data
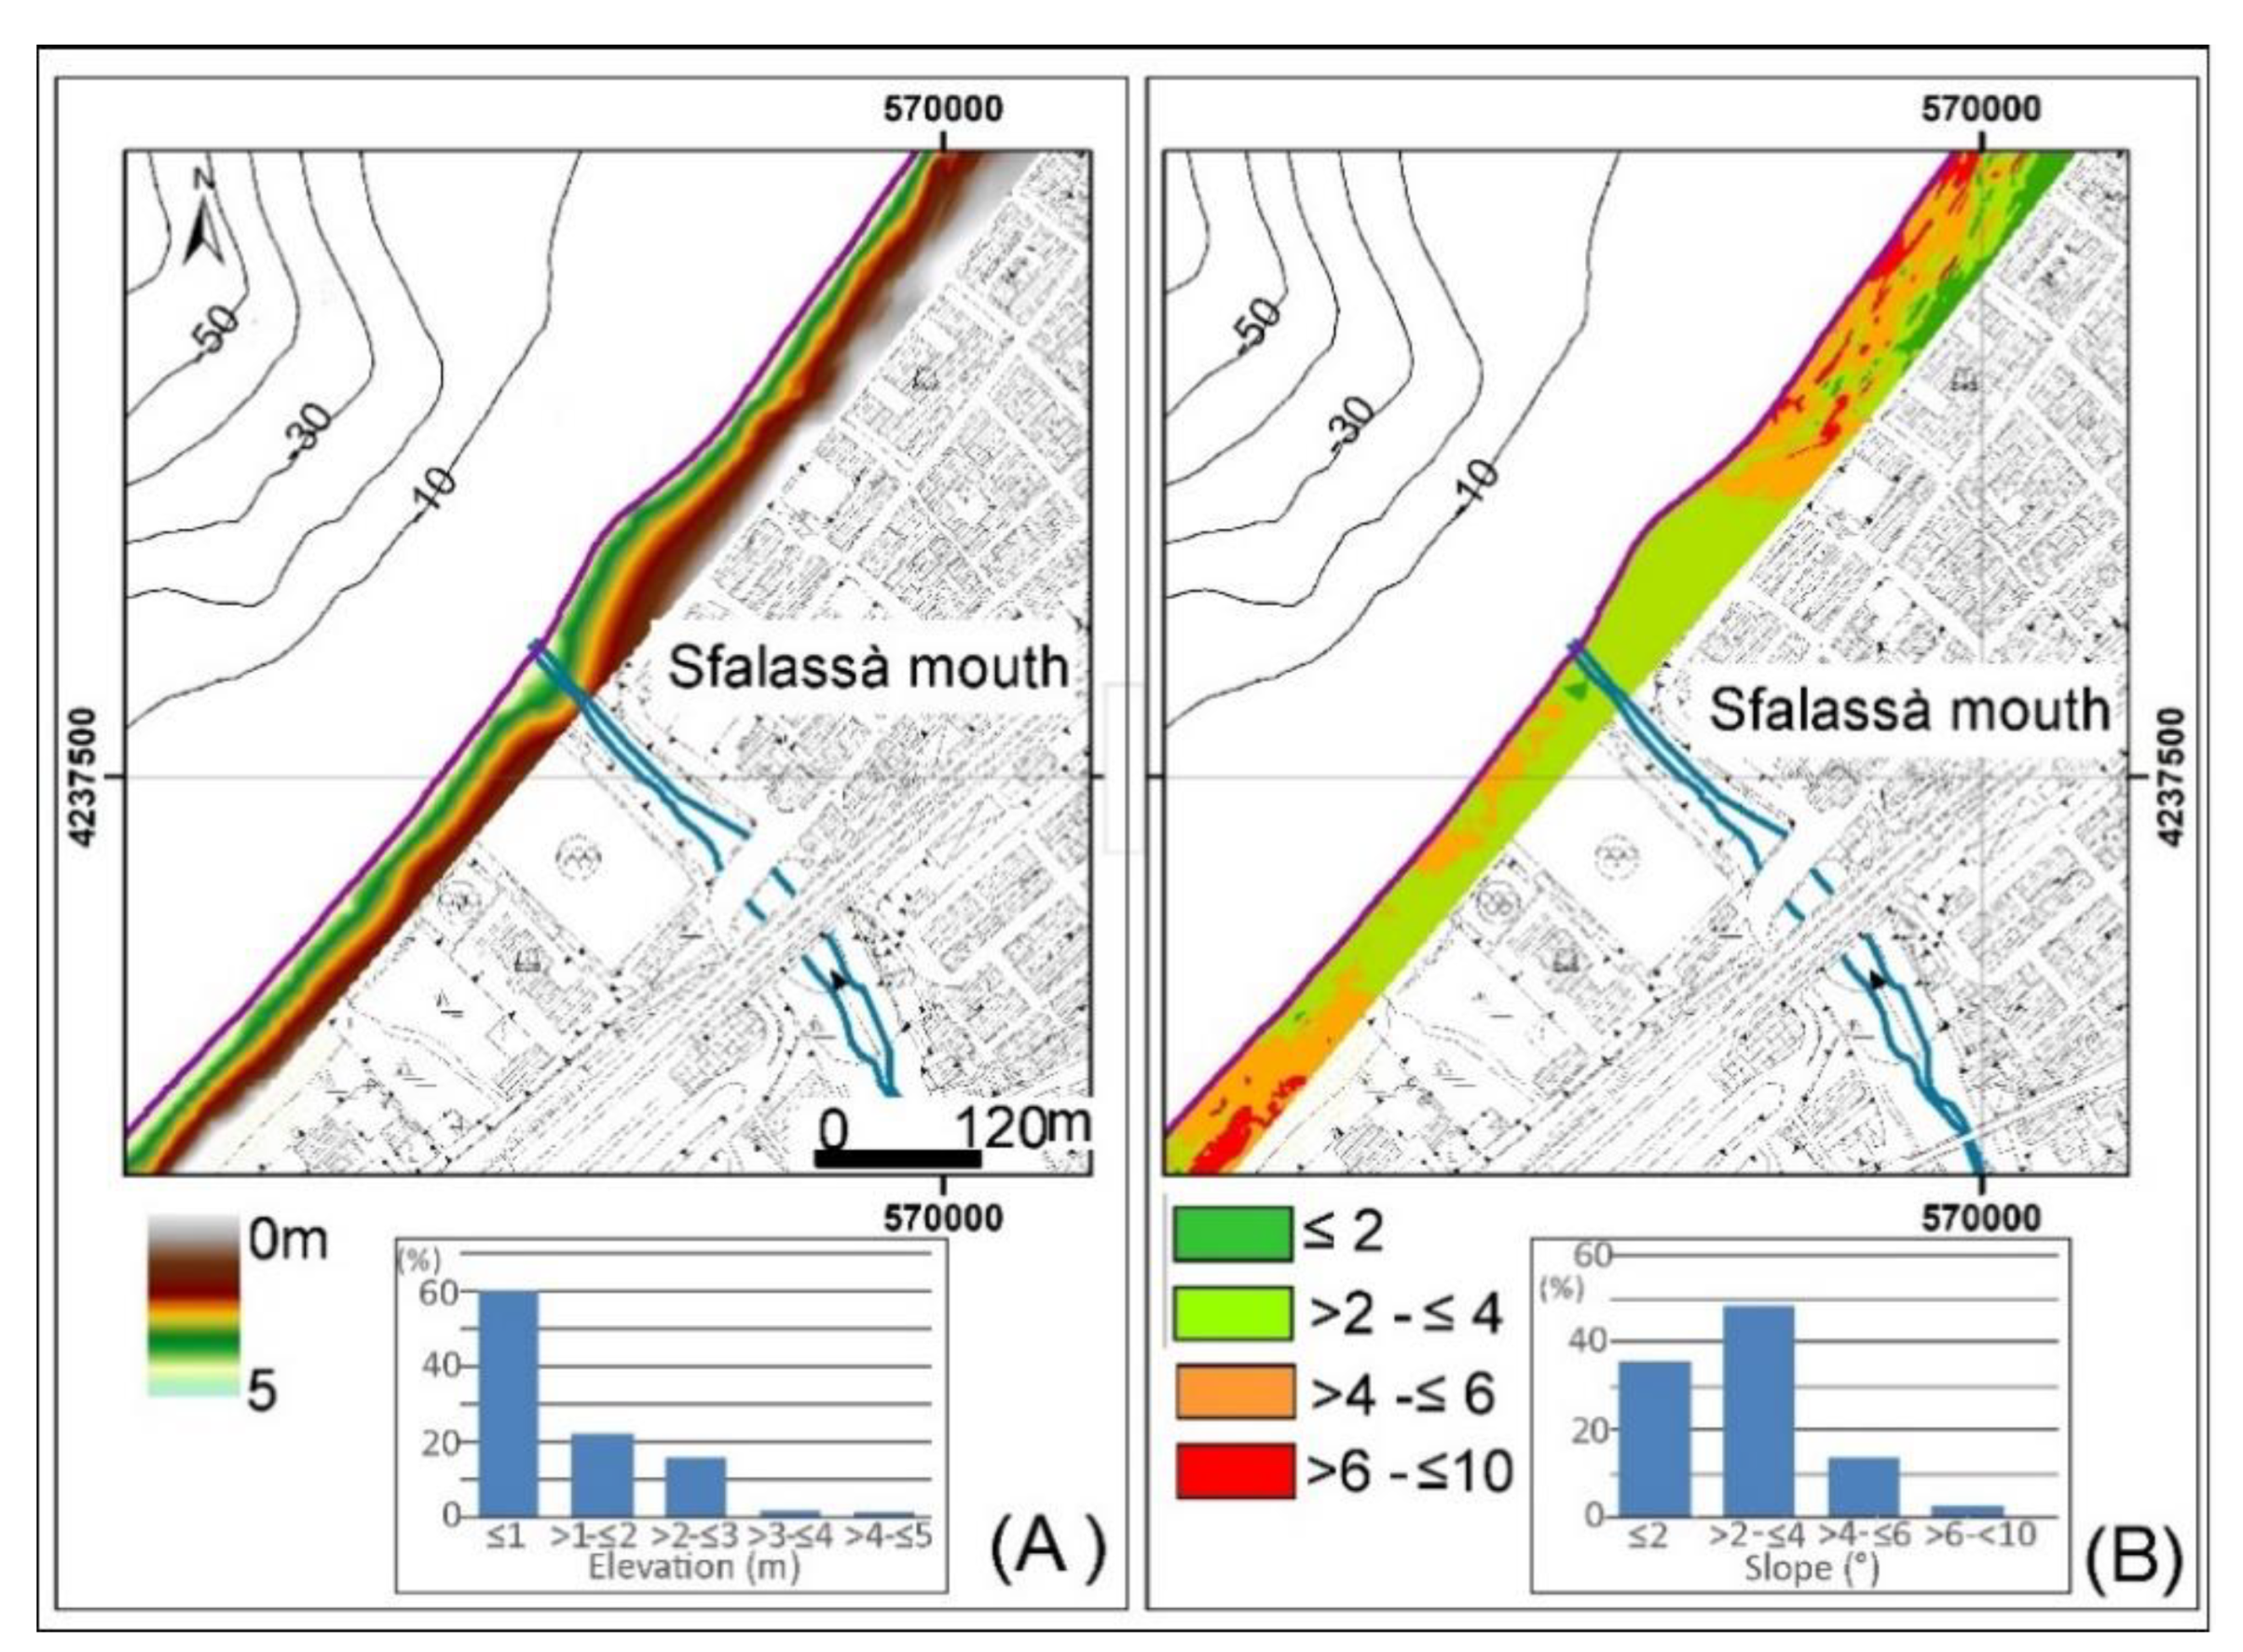
The analysis of data surveyed in October 2014 showed a linear coastline and a backshore with a maximum topographic height of 5 m a.s.l. Approximately 60% of the beach has a height less than 1 m, 20% between 1 m and 2 m and only 3% of about 5 m (
Figure 12A). Furthermore, about the 83% of this area is characterized by slope lower than 4° and the 13.5% between 4° and 6° (
Figure 12B). The geographical distribution of both the elevation and slope data is shown in the maps reported in
Figure 12A,B, respectively.
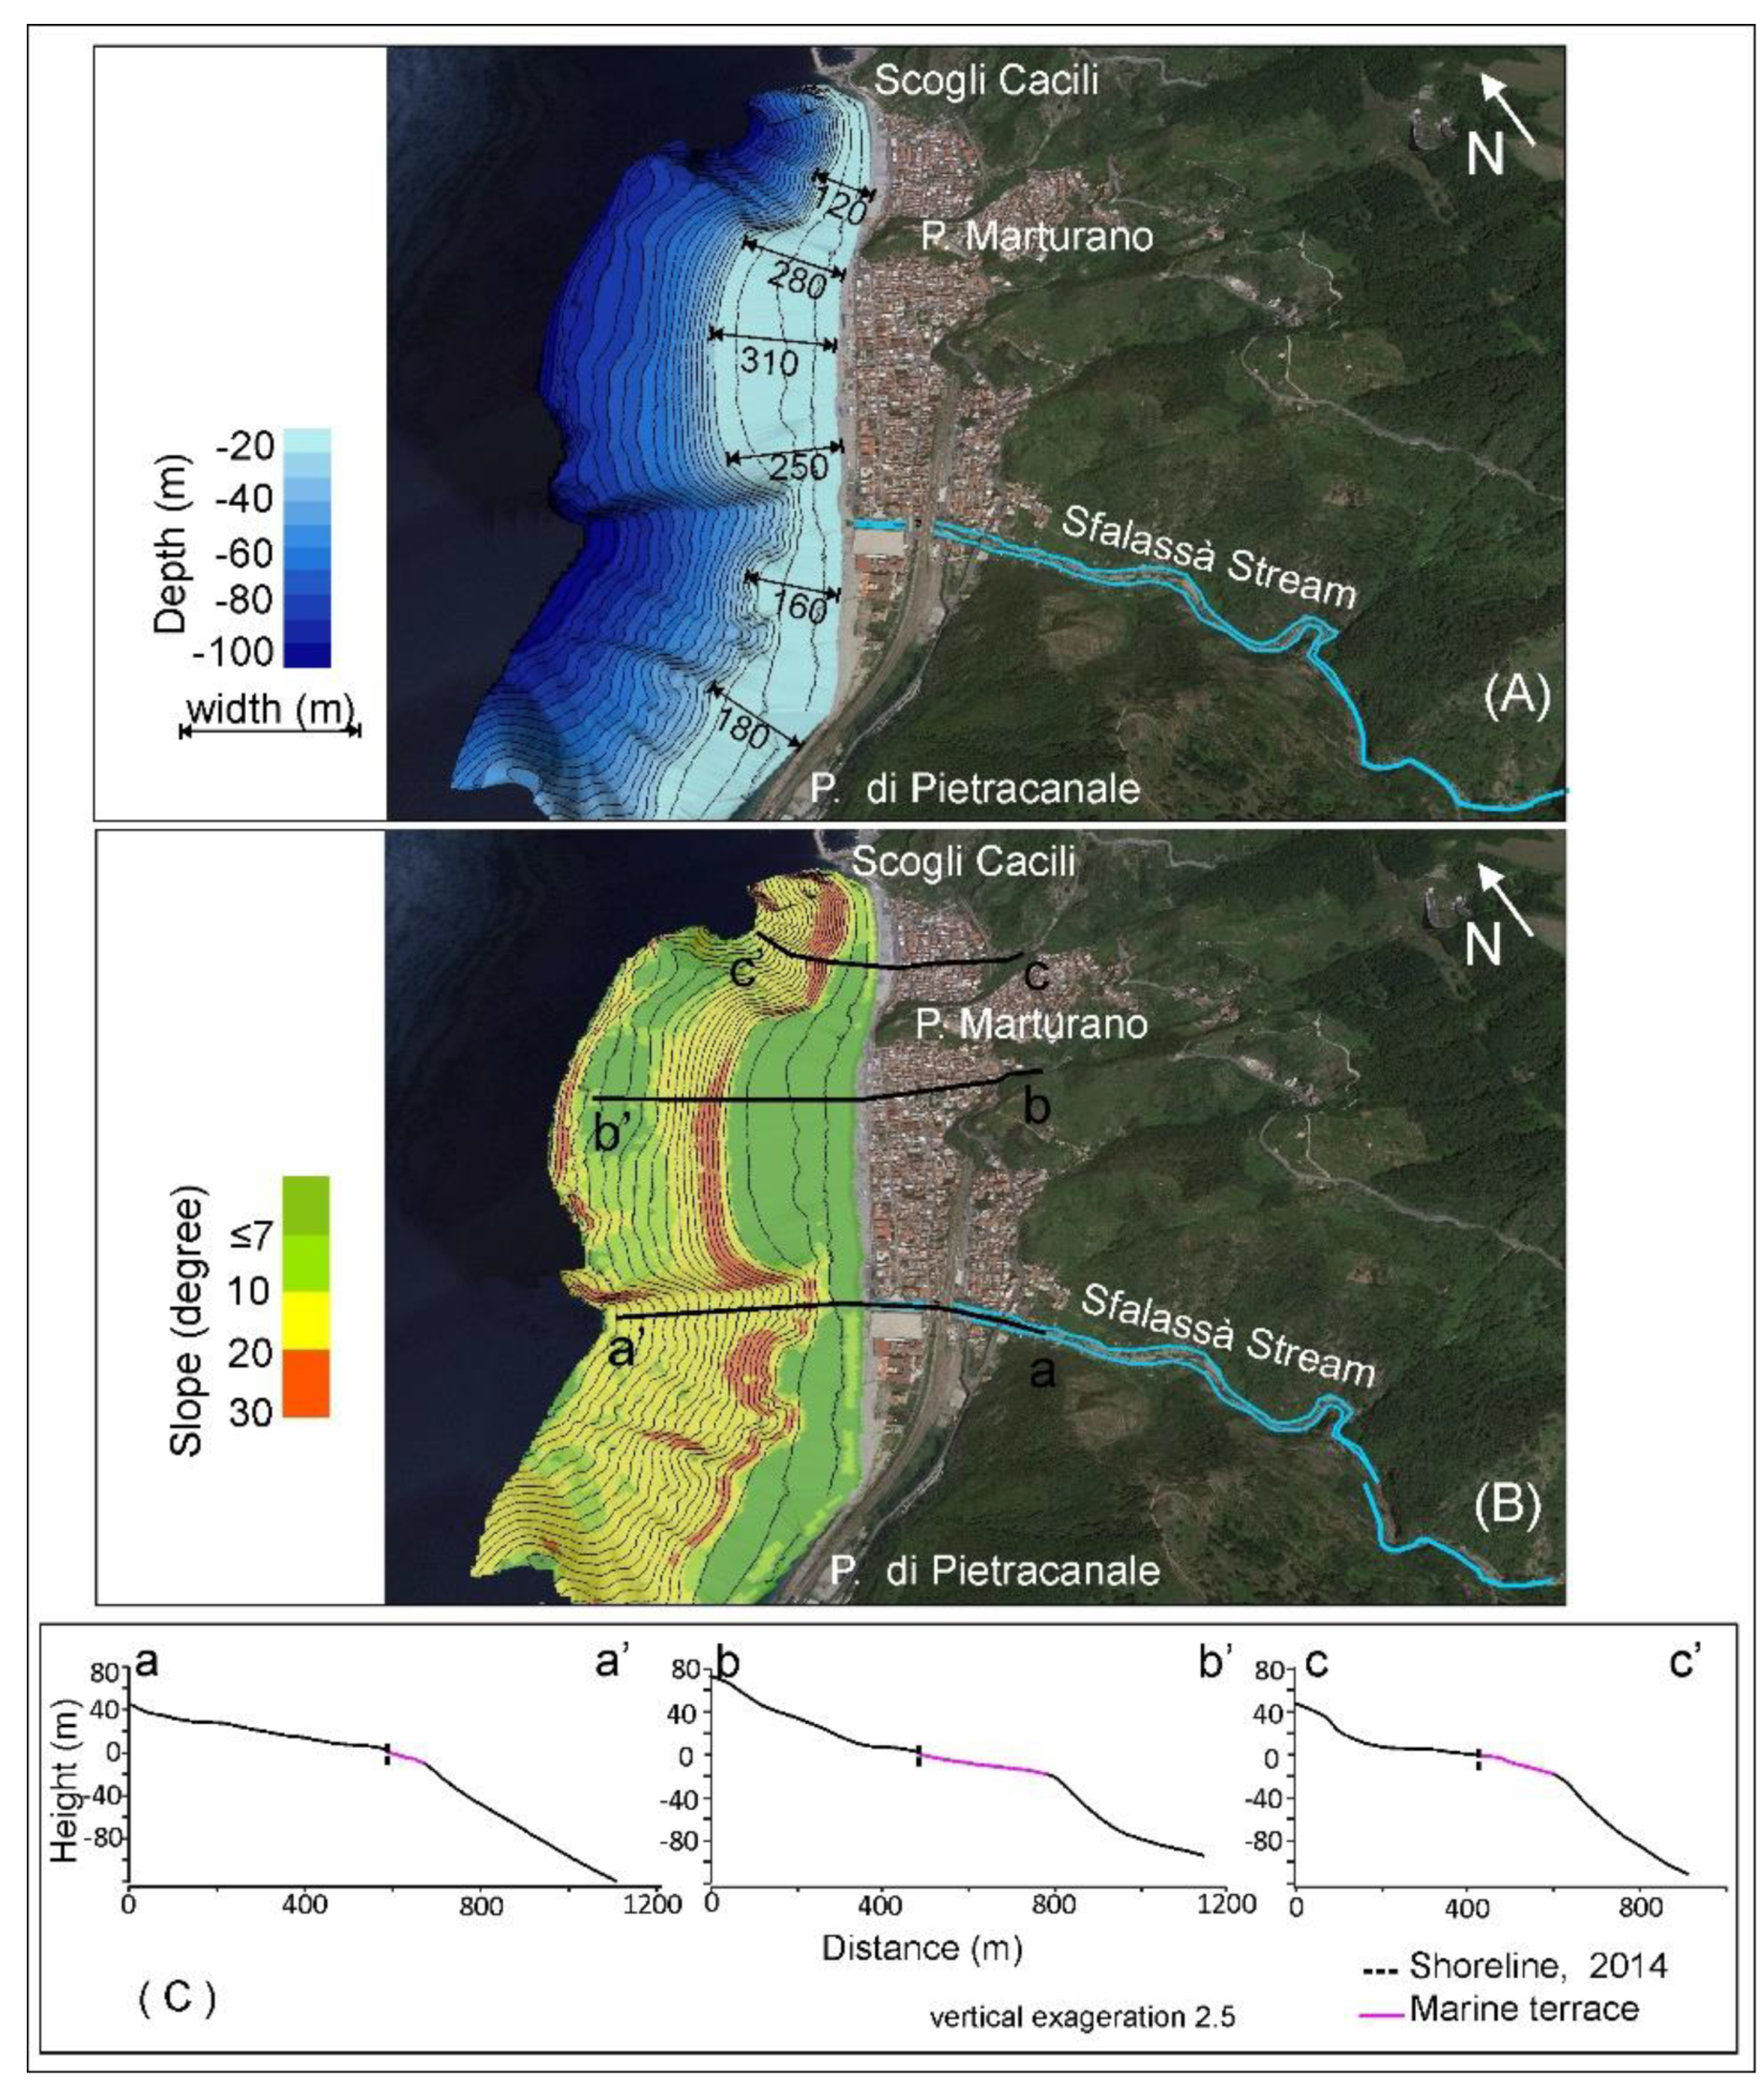
Between Marturano and Cacili Promontories, the survey carried out in October 2014 made it possible to resolve the lack of data along the coast, as shown by the bathymetric map in
Figure 3. A near-shore submarine depositional terrace, varying in width between 120 m and 50 m characterize the study area (
Figure 13A, see also profile a-a’ in
Figure 13C). The terrace has a maximum width of 310 m south of the Marturano Promontory (profile b-b’), it becomes narrower, about 100 m, in the area near the Sfalassà mouth (profile c-c’), and then wider (about 180 m) towards the south (
Figure 13A). The terrace edge, located at depths ranging between 20 (south of P. Marturano, profile b-b’) and 10 m (near Sfalassà mouth or south of it, profile c-c’), marks an abrupt change of slope (
Figure 13B).
The slope values continue to be high up to −100 m water depth, both in front of Sfalassà mouth and southward, this zone coincides to the shelf-indenting channel shown in Figure. The slope decreases to values <10° in the depth range 70–100 m in the sea sector encompassed between Sfalassà mouth and Marturano Promontory (
Figure 13B), for increasing again at depths higher than 100 m, where the shelf break is located (
Figure 3). Bathymetric and slope gradient maps also highlight the occurrence of multiple landslide scars at canyon headwall, one of them coinciding with the Sfalassà mouth (
Figure 3).
4.3. Rainfall and Mass Failures
The analysis of rainfall, recorded by the meteorological station of Bagnara Calabra [
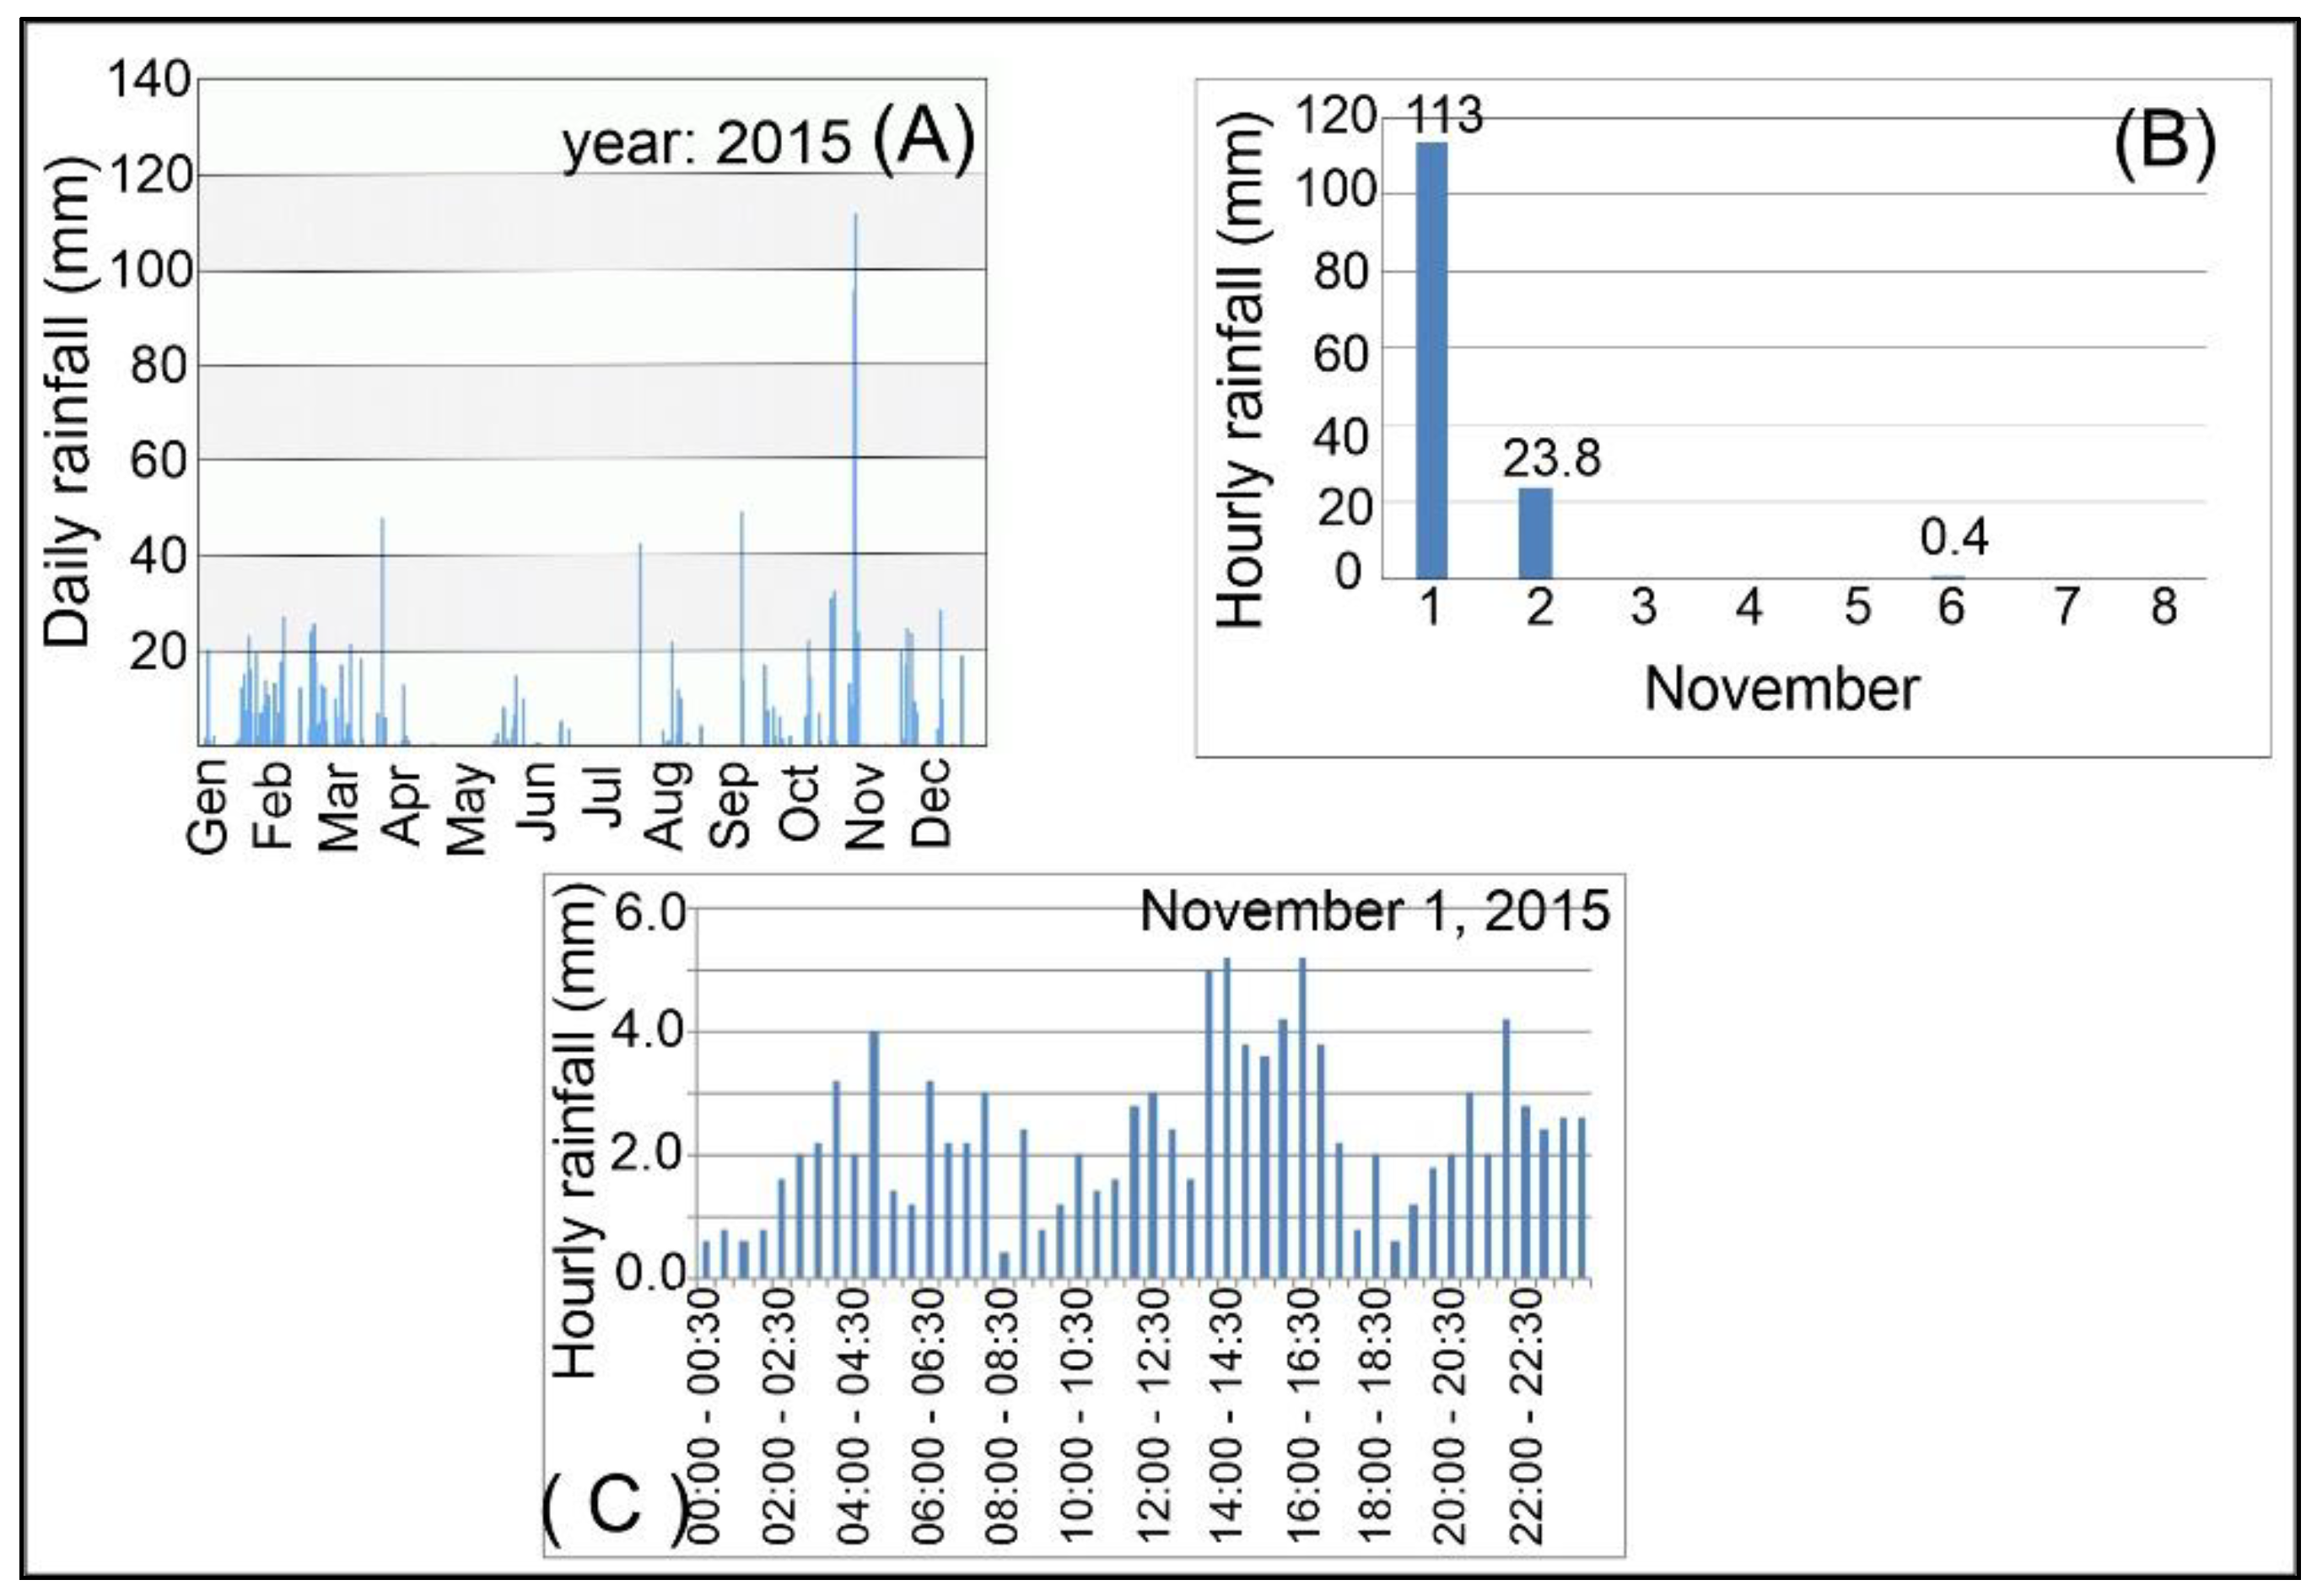
48] during the year 2015, shown the abundance of rainfall in the spring and autumn seasons and the exceptional nature of the rainfall event of 1 November 2015 (
Figure 14A). The latter is clearly visible in
Figure 14B, which shows a cumulative hourly rainfall of 113 mm and continuous rainfall during the whole day (
Figure 14C).
There is a close connection between precipitation and landslides. The study area is often exposed to shallow landslides triggered by heavy rainfall similar to the one recorded at Bagnara Calabra on 31 October 2015. The analysis of the hourly rainfall recorded in the last 50 years by the meteorology stations pertaining to the coastal area between Bagnara Calabra and Pellaro (homogeneous area T4; [
48]) evidenced recurrent events of high intensity. This information indicate that in several cases, during the rainfall, the disturbed sequence is exposed to violent pulses interspersed with moments of relative calm that can favour mass failure [
2]. Furthermore, in the last five years, the coastal area from Bagnara Calabra to Scilla, was exposed to several mud flows originating from translational landslides occurring to the head of the basin where very intense rainfalls affect the weathered part of the metamorphic substratum. During heavy rains, landslide reaching the river, are often fluidized by runoff from smaller streams [
3].
4.4. Meteo-Marine Climate
The mobile radar did not provide any data for the time window examined because it was not working. However, the climate characteristics of the waves along the Bagnara Calabra coast were inferred from Punzo et al., (2016) who analysed the sea state during the storm surge of 24–27 February 2014. The dominant direction during the winter season is from the west-northwest, the waves are oblique to the coast and become parallel when the section closest to the coast slows down and then the wave front progressively rotates [
37]. The system measured an
Hs (mean wave height) ranging from about 0.5 to 4.5 m. In addition, the high refraction measured by the radar between the Sfalassà mouth and the Marturano Promontory identified several rip currents that could favour the movement of sediments seaward.
5. Discussion and Conclusions
The present work highlighted the importance of data integration from different observing systems that offer the possibility to study the evolution of coastal areas with different spatial and temporal resolutions.
Freely satellite images, drone images and survey data were collected and managed, according to a detailed workflow implemented in a GIS environment, to describe the formation and dismantling of the Sfalassà Stream fan delta (Southern Italy). It was generated on 2 November 2015 as a consequence of the flooding event triggered by the exceptional rainfall of the day before and successively dismantled by three main storm surges between November 2015 and January 2016. The mapping of the fan delta, the assessment its volume and the dismantling time are the main results of present work.
The high spatial resolution of drone images provided a unique dataset that allowed to detected the morphology of the beach immediately after the fan delta formation and to generate a 3D model. The high temporal resolution of the Sentinel 2 images, on the other hand, enabled the monitoring of fan delta morphological changes during time.
Sentinel 2 images and photographs confirmed that the Sfalassà Stream fan-delta was reshaped by the three storm surges that occurred from 25 to 28 November 2015, from 3 to 8 January and from 12 to 18 January 2016. During the first event, the apex of the delta retreats of about 10–15 m and the eroded sediments, that partially nourished the nearby coastal area, produced a beach progression of few meters. The photographs show a further erosion of the fan delta during the other two sea storm events and its completely dismantling in March 2016. In about 3 months, the coastline resumed the daily linear shape. However, only a part of sediments building the fan delta was distributed along the coast, nourishing the surrounding beaches. The presence of a marine canyon head very close to the Sfalassà mouth favours the sediment capture and its funnelling seaward. This movement of sediments could be also enhanced by the presence of rip currents located between the breakwater barriers parallel to the coast.
In somewhat, this evolution was to be expected, the rapid elevation changes occurring in a narrow beach, so testifying the immaturity of the area. This setting can also be related to active erosive channels at shallow-water depths and very close to the coastline, just in front of the Sfalassà mouth (
Figure 3 and
Figure 13). These channels are usually characterized by a retrogressive evolution, with the occurrence of small slope failures affecting the edge of the submarine depositional terrace, as testified by repeated bathymetric surveys and comparison with aerial photos performed in the area in the last two decades [
31,
49]. Therefore, sedimentary gravity flows associated with the development of strong rip currents or small slope failures, triggered during these severe storms, may have funnelled at greater depths river-borne sediments previously accumulated on the coast and near-shore sectors, leading to the complete dismantling of the fan delta in a few months. This process along with the direct plunging of hyperpycnal flows generated during flash-flood events frequently occurred in the evolution of the area, as testified by the recognition of coaxial trains of small-scale arcuate-shaped bedforms. These features are interpreted as upper-flow regime bedforms within the channel’s floor [
34] and considered as a proxy of very recent sedimentary activity within the channel head linked with the activity of rivers characterized by the torrential regime (e.g., [
50,
51,
52,
53]).
The methodological approach here presented can be applied to both the coastal areas with a similar geomorphological setting but also to other setting as the sandy beaches of alluvial plains. More generally, we highlighted that the integrated monitoring systems observing continuously and at high spatial resolution the coastal environments can be considered fundamental for their management. They provide an up-to-date knowledge of the territory and of the drivers shaping the coastal environment, and can therefore be considered fundamental for taking the right actions to promote environmental sustainability. In the next future, a database recording information on events similar to those described in this article, aiming at quickly share and compare data processed in several study areas, will be implemented. Furthermore, further analysis would benefit of the automation of multisource data fusion as already occur for studying vegetation seasonality, estimating crop yields, and revealing the ecosystem-climate feedback [
54], upgrading maps [
55] and map soil moisture [
56].
Author Contributions
I.A. designed the study identifying methodology, aims and verified the method applicability in other areas; I.A., N.P., R.T. and D.C. occupied for the formal analysis; R.D., N.P. and R.T. collected data; C.C. and R.D. provided study material; I.A. and D.C. write-review and edit the manuscript; I.A. and R.D.R. administrated the research. All authors have read and agreed to the published version of the manuscript.
Funding
This research was funded by PON (Operational National Plan) 2007–2013 from MIUR (Italian Research Ministry of Research) Project SIGIEC (Integrated Management System for Coastal Erosion) ID: PON01 02651. The APC was funded by C. Calidonna Istituto di Scienze dell’Atmosfera e del Clima (ISAC), CNR.
Informed Consent Statement
Informed consent was obtained from all subjects involved in the study.
Data Availability Statement
Sentinel 2 images can be found at
https://sentinels.copernicus.eu/web/sentinel/sentinel-data-access (accessed on 2 October 2021). The authors confirm that the other data supporting the findings of this study area available within the article and in its
Appendix A. Raw data that support the findings of this data are available from the corresponding author, upon reasonable request.
Conflicts of Interest
The authors declare no conflict of interest.
Appendix A
Table A1.
Main features of AEROPIX UAV.
Table A1.
Main features of AEROPIX UAV.
| Component | Feature |
|---|
| Drone frame: | Carbon fiber and composite materials |
| | Motors: 6 in Hexa V configuration |
| Electronics: | Autopilot controller with IMU, GPS, OSD Telemetry, Ground Control Station |
| Video Downlink: | Dual Video Downlink (front camera and payload view |
| SPR: | Dual Pilot-Cameraman Control Station |
| Gimbal: | 3 Axis stabilized with dedicated power supply |
| Safety: | Advanced fail safe system, Cut-off with dedicated command and parachute |
| Operating time: 15 min (on battery) | Advanced fail safe system, Cut-off with dedicated command and parachute |
| Photo/Video Camera Specifications | |
| Sensor: | 35 mm Full Frame 36.4 Mp |
| Lenses: | Interchangeable on E mount from 28 to 135 mm |
Table A2.
Main characteristic of ®STONEX S9III system.
Table A2.
Main characteristic of ®STONEX S9III system.
| STONEX S9 III Receiver | Accuracy Specifications |
|---|
| Channels | 220 | Static horizontal | 3 mm ± 0.5 ppm (RMS) |
| Satellite Tracked | GPS: Simultaneous L1 C/A, L2E, L2C, L5 | Static vertical | 5 mm ± 0.8 ppm (RMS) |
| | GLONASS: Simultaneous L1 C/A, L1P, L2 C/A (GLONASS M Only), L2P | Fixed RTK horizontal | 1 cm ± 1 ppm (RMS) |
| | LSBAS: Simultaneous L1 C/A, L5 | Fixed RTK vertical | 2 cm ± 1 ppm (RMS) |
| | GIOVE-A (reserved): Simultaneous L1 BOC, E5A, E5B, E5AltBOC1. | Code differential posit. | 0.45 m (CEP) |
| | COMPASS: (reserved): B1 (QPSK), B1-MBOC (6,1, 1/11), B1-2 (QPSK), B2 (QPSK), B2-BOC (10,5), B3 (QPSK), B3BOC (15,2,5), L5 (QPSK) | Stand Alone RTK posit. | 1.5 m (CEP) |
| Position rate | Up to 20 Hz | SBAS positioning | typically <5 m (3D RMS) |
| Signal recapture | <1 s | | |
| RTK signal initialization | typically <10 s | | |
| Initial capture time | typically <15 s | | |
Table A3.
Permanent GNSS stations of Calabria Region.
Table A3.
Permanent GNSS stations of Calabria Region.
| ID | Place | ID | Place | ID | Place |
|---|
| PRAI | Praia a Mare | AMAN | Amantea | TROP | Tropea |
| CAST | Castrovillari | SFIO | San Giovanni in Fiore | MONA | Monastarace |
| TREB | Trebisacce | CIRO | Cirò Marina | LOCR | Locri |
| DIAM | Diamante | LAME | Lamezia Terme | TGRC | Reggio Calabria (ITG Righi) |
| ROSS | Rossano Calabro | CATA | Catanzaro | BOVA | Bova Marina |
| BISI | Bisigano | CUTR | Cutro | | |
Table A4.
Main features of Elac HydroStar 300.
Table A4.
Main features of Elac HydroStar 300.
| Frequency | 30/200 kHz |
|---|
| Output power | Up to 800 W |
| Depth resolution | 1 cm |
| Accuracy | +/−0.25% of water depth |
| Max ping rate | 11 Hz |
| Beam angle | 8°/24° |
Table A5.
Main features of Hemisphere Vector V103 Compass GPS system.
Table A5.
Main features of Hemisphere Vector V103 Compass GPS system.
| Receiver Type | L1 C/A Code |
|---|
| GPS sensivity | −142 dBm |
| Update rate | 20 Hz |
| Horizontal accuracy | <0.6 m 95% confidence (DGPS)
<2.5 m 95% confidence (autonomous) |
| Heading accuracy | <0.30° rms |
| Pitch/roll accuracy | <1° rms |
References
- Guzzetti, F.; Stark, C.P.; Salvati, P. Evaluation of flood and landslide risk to the population of Italy. Environ. Manag. 2005, 36, 15–36. [Google Scholar] [CrossRef] [PubMed]
- Bonavina, M.; Bozzano, F.; Martino, S.; Pellegrino, A.; Prestininzi, A.; Scandurra, R. Le colate di fango e detrito lungo il versante costiero tra Bagnara Calabra e Scilla (Reggio Calabria): Valutazioni di suscettibilità. G. Geol. Appl. 2005, 2, 65–74. [Google Scholar] [CrossRef]
- Terranova, O.G.; Gariano, S.L.; Bruno, C.; Greco, R.; Pellegrino, A.D.; Iovine, G.G.R. Landslide-risk scenario of the Costa Viola mountain ridge (Calabria, Southern Italy). J. Maps 2016, 12, 261–270. [Google Scholar] [CrossRef] [Green Version]
- Penna, D.; Borga, M.; Aronica, G.T.; Brigandì, G.; Tarolli, P. The influence of grid resolution on the prediction of natural and road-related shallow landslides. Hydrol. Earth Syst. Sci. 2014, 18, 2127–2139. [Google Scholar] [CrossRef] [Green Version]
- Ciurleo, M.; Ferlisi, S.; Foresta, V.; Mandaglio, M.C.; Moraci, N. Landslide Susceptibility Analysis by Applying TRIGRS to a Reliable Geotechnical Slope Model. Geoscience 2022, 12, 18. [Google Scholar] [CrossRef]
- Antronico, L.; Greco, R.; Sorriso-Valvo, M. Recent alluvial fans in Calabria (southern Italy). J. Maps 2016, 12, 503–514. [Google Scholar] [CrossRef] [Green Version]
- Mollica, L.M.; Tripodi, E. Master Plan Erosione Costiera. Area 13 Regione Calabria. 2005. Autorità di Bacino Regionale. p. 32. Available online: http://www.regione.calabria.it/abr/allegati/difesa_coste/master_plan/AREA_13%20-%20da%20Bagnara%20Calabra%20a%20Rosarno.pdf) (accessed on 7 March 2022).
- Casalbore, D.; Chiocci, F.L.; Mugnozza, G.S.; Tommasi, P.; Sposato, A. Flash-flood hyperpycnal flows generating shallow-water landslides at Fiumara mouths in Western Messina Strait (Italy). Mar. Geophys. Res. 2011, 32, 257–271. [Google Scholar] [CrossRef]
- Clementucci, R.; Lafosse, M.; Casalbore, D.; Ridente, D.; d’Acremont, E.; Rabaute, A.; Chiocci, F.L.; Gorini, C. Common origin of coexisting sediment undulations and gullies? Insights from two modern Mediterranean prodeltas (southern Italy and northern Morocco). Geomorphology 2022, 402, 108133. [Google Scholar] [CrossRef]
- Lupiano, V.; Calidonna, C.R.; Avolio, E.; Larosa, S.; Cianflone, G.; Viscomi, A.; De Rosa, R.; Dominici, R.; Alberico, I.; Pelosi, N.; et al. Final Sediment Outcome from Meteorological Flooding Events: A Multi-Modelling Approach. In Numerical Computations: Theory and Algorithms: NUMTA 2019; Sergeyev, Y., Kvasov, D., Eds.; Lecture Notes in Computer Science; Springer: Cham, Switzerland, 2019; Volume 11973. [Google Scholar] [CrossRef]
- Kroon, A.; Davidson, M.A.; Aarninkhofetal, S.G.J. Application of remote sensing video systems to coastline management problems. Coast. Eng. 2015, 54, 493–505. [Google Scholar] [CrossRef]
- Dugan, J.P.; Piotrowski, C.C.; Williams, J.Z. Water depth and surface current retrievals from airborne optical measurements of surface gravity wave dispersion. J. Geophys. Res. 2001, 106, 16903–16915. [Google Scholar] [CrossRef] [Green Version]
- Ludeno, G.; Reale, F.; Dentale, F. An X-band radar system for bathymetry and wave field analysis in a harbour area. Sensors 2015, 5, 1691–1707. [Google Scholar] [CrossRef] [PubMed] [Green Version]
- Hessner, K.; Reichert, K.; Borge, J.C.N.; Stevens, C.L.; Smith, M.J. High-resolution X-band radar measurements of currents, bathymetry and sea state in highly in homogeneous coastal areas. Ocean Dyn. 2014, 64, 989–998. [Google Scholar] [CrossRef]
- Alberico, I.; Cavuoto, G.; Di Fiore, V.; Punzo, M.; Tarallo, D.; Pelosi, N.; Ferraro, L.; Marsella, E. Historical maps and satellite images as tools for shoreline variations and territorial changes assessment: The case study of Volturno Coastal Plain (Southern Italy). J. Coast. Conserv. 2018, 22, 919–937. [Google Scholar] [CrossRef]
- Alberico, i.; Amato, V.; Aucelli, P.P.C.; D’Argenio, B.; Di Paola, G.; Pappone, G. Historical Shoreline Change of the Sele Plain (Southern Italy): The 1870–2009 Time Window. J. Coast. Res. 2012, 28, 1638–1647. [Google Scholar] [CrossRef] [Green Version]
- Borzì, L.; Anfuso, G.; Manno, G.; Distefano, S.; Urso, S.; Chiarella, D.; Di Stefano, A. Shoreline Evolution and Environmental Changes at the NW Area of the Gulf of Gela (Sicily, Italy). Land 2021, 10, 1034. [Google Scholar] [CrossRef]
- Munasinghe, D.; Cohen, S.; Gadiraju, K. A Review of Satellite Remote Sensing Techniques of River Delta Morphology Change. Remote Sens. Earth Syst. Sci. 2021, 4, 44–75. [Google Scholar] [CrossRef]
- Dubovyk, O. The role of Remote Sensing in land degradation assessments: Opportunities and challenges. Eur. J. Remote Sens. 2017, 50, 601–613. [Google Scholar] [CrossRef]
- Pezzino, A.; Puglisi, G. Indagine geologico-petrografica sul cristallino dell’Aspromonte centro-settentrionale (Calabria). Boll. Soc. Geol. Ital. 1980, 99, 255–268. [Google Scholar]
- Rottura, A.; Maccarrone, E.; Messina, A.; Puglisi, G. La massa migmatitico-tonalitica di Palmi-Bagnara (Calabria meridionale). Boll. Soc. Geol. Ital. 1975, 94, 495–536. [Google Scholar]
- Bozzano, F.; Della Seta, M.; Martin, S. Time-dependent evolution of rock slopes by a multi-modelling approach. Geomorphology 2016, 263, 113–131. [Google Scholar] [CrossRef]
- Faccenna, C.; Becker, T.W.; Lucente, F.P.; Jolivet, L.; Rossetti, F. History of subduction and back-arc extension in the Central Mediterranean. Geophys. J. Int. 2001, 145, 809–820. [Google Scholar] [CrossRef] [Green Version]
- Faccenna, C.; Piromallo, C.; Crespo-Blanc, A.; Jolivet, L.; Rossetti, F. Lateral slab deformation and the origin of the western Mediterranean arcs. Tectonics 2004, 23, TC1012. [Google Scholar] [CrossRef]
- Ghisetti, F. Upper Pliocene–Pleistocene uplift rates as indicators of neotectonic pattern: An example from Southern Calabria (Italy). Geomorphology 1981, 40, 93–118. [Google Scholar]
- Monaco, C.; Tortorici, L.; Nicolich, R.; Cemobori, L.; Costa, M. From collisional to rifted basins: An example from the southern Calabrian arc (Italy). Tectonophysics 1996, 266, 233–249. [Google Scholar] [CrossRef]
- Catalano, S.; De Guidi, G.; Monaco, C.; Tortorici, L. Long-term behavior of the Late Quaternary normal faults in the Strait of Messina region: Structural and morphological constraints. Quat. Int. 2003, 101–102, 81–91. [Google Scholar] [CrossRef]
- Ferranti, L.; Monaco, C.; Morelli, D.; Antonioli, F.; Maschio, L. Holocene activity of the Scilla Fault, Southern Calabria: Insights from coastal morphological and structural investigations. Tectonophysics 2008, 453, 74–93. [Google Scholar] [CrossRef]
- Faccenna, C.; Molin, P.; Orecchio, B.; Olivetti, V.; Bellier, O.; Funiciello, F.; Minelli, L.; Piromallo, C.; Billi, A. Topography of the Calabria subduction zone (southern Italy): Clues for the origin of Mt. Etna. Tectonics 2011, 30, TC1003. [Google Scholar] [CrossRef]
- Fabbri, A.; Ghisetti, F.; Vezzani, L. The Pelorirani-Calabria range and the Gioia basin in the Calabrian arc (southern Italy): Relationships between land and marine da/a. Geol. Romana 1980, 19, 131–150. [Google Scholar]
- Casalbore, D.; Bosman, A.; Ridente, D.; Chiocci, F.L. Coastal and Submarine Landslides in the Tectonically-Active Tyrrhenian Calabrian Margin (Southern Italy): Examples and Geohazard Implications in Submarine Mass Movements and Their Consequences. In Advances in Natural and Technological Hazards Research; Krastel, S., Behrmann, J.-H., Völker, D., Stipp, M., Berndt, C., Urgeles, R., Chaytor, J., Huhn, K., Strasser, M., Harbitz, C.B., Eds.; Springer International Publishing: Cham, Switzerland, 2014. [Google Scholar] [CrossRef] [Green Version]
- Martorelli, E.; Casalbore, D.; Falcini, F.; Bosman, A.; Falese, F.G.; Chiocci, F.L. Large and Medium-Scale Morpho-Sedimentary Features of the Messina Strait: Insights on Bottom-Current Controlled Sedimentation and Interaction with Downslope Processes; Special Publications; Geological Society: London, UK, 2021; p. 523. [Google Scholar] [CrossRef]
- Punzo, M.; Lanciano, C.; Tarallo, D.; Bianco, F.; Cavuoto, G.; De Rosa, R.; Di Fiore, V.; Cianflone, G.; Dominici, R.; Iavarone, M.; et al. Application of X-Band Wave Radar for Coastal Dynamic Analysis: Case Test of Bagnara Calabra (South Tyrrhenian Sea, Italy). J. Sensors 2016, 2016, 6236925. [Google Scholar] [CrossRef] [Green Version]
- Thieler, E.R.; Himmelstoss, E.A.; Zichichi, J.L.; Miller, T.L. Digital Shoreline Analysis System (DSAS) Version 3.0: An ArcGIS’ Extension for Calculating Shoreline Change; U.S. Geological Survey Open File Report 1304; U.S. Geological Survey: Reston, VA, USA, 2005.
- Del Pozo, J.A.M.; Anfuso, G. Spatial approach to mediumterm coastal evolution in south Sicily (Italy): Implications for coastal erosion management. J. Coast. Res. 2008, 24, 33–42. [Google Scholar] [CrossRef] [Green Version]
- Nex, F.; Remondino, F. UAV for 3D mapping applications: A review. Appl. Geomat. 2014, 6, 1–15. [Google Scholar] [CrossRef]
- Smith, W.H.F.; Wessel, P. Gridding with continuous curvatures splines in tension. Geophysics 1990, 55, 293–305. [Google Scholar] [CrossRef]
- Borge, J.C.N.; Rodrıguez, G.R.; Hessner, K.; Gonzalez, P.I. Inversion of marine radar images for surface wave analysis. J. Atmos. Ocean. Tech. 2004, 21, 1291–1300. [Google Scholar] [CrossRef]
- Young, I.R.; Rosenthal, W.; Ziemer, F. Three-dimensional analysis of marine radar images for the determination of ocean wave directionality and surface currents. J. Geophys. Res. 1985, 90, 1049–1059. [Google Scholar] [CrossRef] [Green Version]
- Federico, S.; Avolio, E.; Pasqualoni, L.; De Leo, L.; Sempreviva, A.M.; Bellecci, C. Preliminary results of a 30-year daily rainfall data base in southern Italy. Atmos. Res. 2009, 94, 641–651. [Google Scholar] [CrossRef]
- Bellecci, C.; Federico, S.; Casella, G.; Avolio, E.; Lo Feudo, T.; Sisca, M. Intense Precipitation in southern Italy. In New Trends in Hydrology; Editoriale BIOS: Cosenza, Italy, 2002; pp. 57–74. [Google Scholar]
- Vennari, C.; Gariano, S.L.; Antronico, L.; Brunetti, M.T.; Iovine, G.; Peruccacci, S.; Terranova, O.; Guzzetti, F. Rainfall thresholds for shallow landslide occurrence in Calabria, southern Italy. Nat. Hazards Earth Syst. Sci. 2014, 14, 317–330. [Google Scholar] [CrossRef] [Green Version]
- Ferrari, E.; Terranova, O. Non-parametric detection of trends and change point years in monthly and annual rainfalls. In Proceedings of the 1st Italian-Russian Workshop New Trends in Hydrology, Rende, Italy, 24–26 September 2004; CNR: Rome, Italy, 2004; pp. 177–188. [Google Scholar]
- Terranova, O.G.; Gariano, S.L. Rainstorms able to induce flash floods in a Mediterranean-climate region (Calabria, southern Italy). Nat. Hazard Earth Syst. Sci. 2014, 14, 2423–2434. [Google Scholar] [CrossRef] [Green Version]
- Greco, A.; De Luca, D.L.; Avolio, E. Heavy Precipitation Systems in Calabria Region (Southern Italy): High-Resolution Observed Rainfall and Large-Scale Atmospheric Pattern Analysis. Water 2020, 12, 1468. [Google Scholar] [CrossRef]
- ARPACAL. Available online: www.cfd.calabria.it (accessed on 7 March 2022).
- ISPRA (Istituto Superiore per la Protezione e la Ricerca Ambientale). 2010. Available online: http://www.idromare.it/analisi_dati.php (accessed on 7 March 2022).
- Versace, P.; Ferrari, E.; Gabriele, S.; Rossi, F. Valutazione delle Piene in Calabria; Geodata 30; CNR-IRPI-GNDCI: Cosenza, Italy, 1989. (In Italian) [Google Scholar]
- Bosman, A.; Casalbore, D.; Dominici, R. Cyclic steps at the head of channelized features along the Calabrian Margin (southern Tyrrhenian Sea, Italy). In Atlas of Bedforms in the Western Mediterranean; Springer: Cham, Switzerland, 2017; pp. 229–233. [Google Scholar]
- Babonneau, N.; Delacourt, C.; Cancouët, R.; Sisavath, E.; Bachèlery, P.; Mazuel, A.; Jorry, S.J.; Deschamps, A.; Ammann, J.; Villeneuve, N. Direct sediment transfer from land to deep-sea: Insights into shallow multibeam bathymetry at La Réunion Island. Mar. Geol. 2013, 346, 47–57. [Google Scholar] [CrossRef] [Green Version]
- Vendettuoli, D.; Clare, M.A.; Clarke, J.H.; Vellinga, A.; Hizzet, J.; Hage, S.; Lintern, D.G. Daily bathymetric surveys document how stratigraphy is built and its extreme incompleteness in submarine channels. Earth Planet. Sci. Lett. 2019, 515, 231–247. [Google Scholar] [CrossRef]
- Hill, P.R.; Lintern, D.G. Sedimentary processes at the mouth of a tidally-influenced delta: New insights from submarine observatory measurements, Fraser Delta, Canada. Sedimentology 2021, 68, 2649–2670. [Google Scholar] [CrossRef]
- Clare, M.A.; Pope, E.L.; Quartau, R.; Bosman, A.; Chiocci, F.L.; Santos, R. Bedforms on the submarine flanks of insular volcanoes: New insights gained from high resolution seafloor surveys. Sedimentology 2021, 68, 1400–1438. [Google Scholar]
- Zhu, X.; Cai, F.; Tian, J.; William, T.K. Spatiotemporal Fusion of Multisource Remote Sensing Data: Literature Survey, Taxonomy, Principles, Applications, and Future Directions. Remote Sens. 2018, 10, 527. [Google Scholar] [CrossRef] [Green Version]
- Matikainen, L.; Pandžic, M.; Li, F.; Karila, K.; Hyyppä, J.; Litkey, P.; Kukko, A.; Lehtomäki, M.; Karjalainen, M.; Puttonena, E. Toward utilizing multitemporal multispectral airborne laser scanning, Sentinel-2, and mobile laser scanning in map updating. J. Appl. Remote Sens. 2019, 13, 044504. [Google Scholar] [CrossRef]
- El Hajj, M.; Baghdadi, N.; Zribi, M.; Bazzi, H. Synergic Use of Sentinel-1 and Sentinel-2 Images for Operational Soil Moisture Mapping at High Spatial. Resolution over Agricultural Areas. Remote Sens. 2017, 9, 1292. [Google Scholar] [CrossRef] [Green Version]
Figure 1.
The images display the Sfalassà basin and river network overlaid on the 3D image of Google Earth (a), a detail of Bagnara Calabra coastal area (b) and the location of study area (c). Source: own elaboration draped over the Google Earth images.
Figure 1.
The images display the Sfalassà basin and river network overlaid on the 3D image of Google Earth (a), a detail of Bagnara Calabra coastal area (b) and the location of study area (c). Source: own elaboration draped over the Google Earth images.
Figure 2.
Schematic map of geological features of Bagnara Calabra and surrounding areas. Source: own elaboration on the basis of previous studies cited in this paragraph and overlaid to Google Academic Editor Earth images.
Figure 2.
Schematic map of geological features of Bagnara Calabra and surrounding areas. Source: own elaboration on the basis of previous studies cited in this paragraph and overlaid to Google Academic Editor Earth images.
Figure 3.
Shaded relief map and isobaths of the continental margin facing Bagnara village, where a narrow continental shelf, deeply carved by three submarine channels (Ch1-3) is present. 1: edge of the near-shore depositional terrace, 2: continental shelf edge, 3: channel sidewall, 4: depositional fan shaped feature. CSBs: crescent-shaped bedforms. Source: multibeam bathymetry data from MaGIC project integrated with Google Earth images.
Figure 4.
The flow chart illustrates the input data and procedure to study the formation and dismantling of the Sfalassà Stream fan delta. Source: own elaboration. The “x” and “xx” symbols indicate the figures showing the Google Earth and Sentinel 2 images, respectively.
Figure 4.
The flow chart illustrates the input data and procedure to study the formation and dismantling of the Sfalassà Stream fan delta. Source: own elaboration. The “x” and “xx” symbols indicate the figures showing the Google Earth and Sentinel 2 images, respectively.
Figure 5.
Data surveyed from 2014 to 2015 in the coastal area of Sfalassà mouth. Source: own elaboration draped over the Technical Map of Calabria Region.
Figure 5.
Data surveyed from 2014 to 2015 in the coastal area of Sfalassà mouth. Source: own elaboration draped over the Technical Map of Calabria Region.
Figure 6.
The Google Earth images show a straight coastline shape, during daily condition and a small change of beach width (red lines). Source: own elaboration on the basis of Google Earth images.
Figure 6.
The Google Earth images show a straight coastline shape, during daily condition and a small change of beach width (red lines). Source: own elaboration on the basis of Google Earth images.
Figure 7.
The fan delta’s drone image draped over the Calabria Region’s technical map at 1:5000 scale. Source: own elaboration.
Figure 7.
The fan delta’s drone image draped over the Calabria Region’s technical map at 1:5000 scale. Source: own elaboration.
Figure 8.
Sentinel 2 images show the development of the Sfalassà mouth: (i) before (A) and after (B,C) the flooding event of 2 October 2015; (ii) the fan-delta apex eroded by the storm surge occurred on 25-28 November 2015 (D); (iii) the unchanged fan delta morphology on 1 January 2016 (E). Image (F) shows the transects used to calculate shoreline variations. Image (G) displays shoreline change values between 12 November and 22 December 2015. Source: own elaboration overlaid to Sentinel 2 images.
Figure 9.
The figures show: (i) the high sediment load of Sfalassà Stream during the flooding event (A); (ii) the fan delta location (B); (iii) the fan delta morphology after the storm surge of 25–28 November 2015 (C–E) and after those occurred from 3 to 8 (F) and from 12 to 18 January 2016 (G,H). Source: own elaboration on the basis of our photos.
Figure 10.
The Sentinel 2 images display the Favazzina mouth: (i) before (A) and after (B,C) the flooding event of 2 October 2015; (ii) the fan-delta apex eroded by the storm surge occurred on 25–28 November 2015 (D); (iii) the unchanged fan delta morphology on 1 January 2016 (E). Source: own elaboration overlaid to the Sentinel 2 images. Image (F) shows the transects used to calculate shoreline variations between 12 November and 22 December 2015. Source: own elaboration over-laid to Sentinel 2 images.
Figure 11.
The extent of fan delta measured from the coastlines surveyed on 15 October 2014. Source: own elaboration overlaid to the Technical Map of Calabria Region.
Figure 11.
The extent of fan delta measured from the coastlines surveyed on 15 October 2014. Source: own elaboration overlaid to the Technical Map of Calabria Region.
Figure 12.
The maps show the spatial distribution of elevation (A) and slope (B) data. The bar graphs indicate the percentage of emerged beaches characterised by specific elevation and slope values. Source: own elaboration overlaid to the Technical Map of Calabria Region.
Figure 12.
The maps show the spatial distribution of elevation (A) and slope (B) data. The bar graphs indicate the percentage of emerged beaches characterised by specific elevation and slope values. Source: own elaboration overlaid to the Technical Map of Calabria Region.
Figure 13.
The bathymetric (A) and slope (B) maps of the study area are shown. The three sections point out the extent of the marine terrace (C). Source: own elaboration overlaid to the Google Earth images.
Figure 13.
The bathymetric (A) and slope (B) maps of the study area are shown. The three sections point out the extent of the marine terrace (C). Source: own elaboration overlaid to the Google Earth images.
Figure 14.
The bar diagrams show daily (A), cumulative (B) and hourly rainfall (C), respectively. Source: own elaboration on the basis of data registered by the hydrometric station of Regional Agency for Environmental Protection of Calabria.
Figure 14.
The bar diagrams show daily (A), cumulative (B) and hourly rainfall (C), respectively. Source: own elaboration on the basis of data registered by the hydrometric station of Regional Agency for Environmental Protection of Calabria.
| Publisher’s Note: MDPI stays neutral with regard to jurisdictional claims in published maps and institutional affiliations. |
© 2022 by the authors. Licensee MDPI, Basel, Switzerland. This article is an open access article distributed under the terms and conditions of the Creative Commons Attribution (CC BY) license (https://creativecommons.org/licenses/by/4.0/).


 ,
, 


