Article

Catchment-Scale Participatory Mapping Identifies Stakeholder Perceptions of Land and Water Management Conflicts

Biological & Environmental Sciences, University of Stirling, Stirling FK9 4LA, UK
*
Author to whom correspondence should be addressed.
Submission received: 22 January 2022 / Revised: 6 February 2022 / Accepted: 13 February 2022 / Published: 16 February 2022
(This article belongs to the Special Issue Land Use Optimisation)

Abstract

:
Competing socioecological demands and pressures on land and water resources have the potential to increase land use conflict. Understanding ecosystem service provisioning and trade-offs, competing land uses, and conflict between stakeholder groups in catchments is therefore critical to inform catchment management and the sustainable use of natural resources. We developed a novel stakeholder engagement methodology that incorporates participatory conflict mapping in three catchments with a short questionnaire to identify the perceptions of 43 participants from four key land and water management stakeholder groups: environmental regulators, water industry practitioners, the farm advisor community, and academics. The participatory mapping exercise produced heat maps of perceived conflict and land use competition, providing spatial detail of the complex combination of land use issues faced by catchment managers. Distinct, localised hotspots were identified in areas under pressure from flooding, abstraction, and urbanisation; as well as more dispersed issues of relevance at the landscape scale, such as from farming, forestry, energy production, and tourism. Subsequent regression modelling linked perceived conflict to land cover maps and identified coastal, urban, and grassland areas as the most likely land cover types associated with conflict in the study catchments. Our approach to participatory conflict mapping provides a novel platform for catchment management and can facilitate increased cooperation among different catchment stakeholders. In turn, land and water management conflicts can be recognised and their underlying drivers and likely solutions identified in an effort to better manage competing demands on catchment resources.

1. Introduction

Sustainable management of natural resources is under pressure from environmental and social drivers, such as climate change and global population growth [1,2]. If landscape-scale decisions are implemented in response to environmental and social drivers without full consideration of the socioecological complexity of catchments, then there is the potential for unintended consequences for both the environment and society, for example, a loss of biodiversity or heightened risk to human health and wellbeing [3,4]. Therefore, integrated catchment management is often described as a “wicked problem” because solutions can be difficult to identify and implement due to the uncertainty, complexity, and divergency of stakeholder interests [5,6]. The potential for increased land use conflict, arising when stakeholders have incompatible interests concerning land use and resource management [7], becomes more likely as demands and pressures on catchments and coastal waters grow or become more diverse [8,9]. Thus, identifying sustainable solutions to wicked problems requires adaptive and integrated decision-making in land and water management [10,11,12], and highlights the importance of stakeholder-focused approaches [13].
Land use conflict is frequently driven by rapid land use change [14], resource scarcity (particularly water scarcity) [15,16], or power imbalances [17] and can increase social tensions, political instability, and, in the most extreme cases, can lead to violent conflict [18,19]. In more stable, affluent societies, the causes of land use conflict are often due to changes in land management affecting broader, often difficult to measure, socioecological aspects, such as noise, odour, negative visual impacts, or risks to biodiversity conservation [20,21]. Trade-offs are often expressed downstream, in lower parts of the catchment [22,23], and can cause severe disadvantages to affected communities or even entire national economies [24]. Due to hydrological connectivity, river catchments often integrate multiple pressures, e.g., from point and diffuse source pollutants, abstraction, and physical alterations of the landscape [25,26]. This places riparian ecosystems and their critical natural resources at risk [27], and reinforces the concept of the “catchment” being the most appropriate scale to holistically manage land and water environments [28].
Ecosystem service mapping techniques can identify likely trade-offs between different land management decisions in catchments, i.e., refs. [29,30], or model estimates of land use conflict, i.e., using spatial indicators of the potential for soil erosion and the quality of agricultural land [31]; however, there are many factors that mapping efforts cannot take into consideration, especially sociocultural benefits and disbenefits [32]. Trade-offs between ecosystem services manifest themselves in complex interactions [33], and bundles of services respond to changes in a variety of social, environmental, economic, and political drivers across both space and time [34,35]. Accurately modelling and mapping ecosystem services in catchments is therefore challenging, due to the stochastic and often nonlinear, and even chaotic, nature of socioecological systems [36,37]. Furthermore, ecosystem service mapping studies often lack sufficient primary, scale-appropriate data, and frequently fail to validate their modelled results or assess uncertainty in their models [38,39].
These shortcomings suggest a role for including the knowledge and perspectives of experts, stakeholders, and local communities in assessing the potential for ecosystem service trade-offs and land use conflict in catchments. Widening participant involvement in research can identify differences in opinion and understanding across different stakeholder communities, capture valuable local expertise and understanding, and facilitate knowledge exchange between stakeholders [40,41]. Participatory research approaches can also ensure that management decisions are more inclusive and socially acceptable, and are implemented more effectively [42,43]. Participatory mapping, where spatial information is used or produced as part of a participatory process, is a useful methodology to support the integration of knowledge from multiple contributors and to elicit information which may be challenging to estimate using only empirical data. Participatory mapping studies are often used to understand how stakeholders value ecosystem services [44,45,46,47,48], or to map, understand, and mediate conflict [49,50,51]. Participatory mapping has also been used to inform mitigation measures by identifying spatial hotspots of ecosystem service benefits and areas at risk of competing demands [49,52,53]. To date, relatively few participatory mapping studies have used both quantitative and qualitative data to complement and validate their methodologies [54].
In this study, the perceptions of four distinct land and water management stakeholder groups were identified in three contrasting catchments by applying a novel, mixed-method stakeholder engagement methodology that incorporates participatory conflict mapping with a qualitative questionnaire. The objectives were to (1) identify and characterise spatial hotspots of perceived conflict in catchments of varying land use and environmental characteristics, (2) quantify how perceived conflicts differ between key groups of stakeholders within each catchment, (3) model whether land cover data and other variables can be used to predict conflict and land use competition in the study catchments, and (4) use supporting qualitative data to interrogate the potential drivers of any perceived land use conflicts and likely solutions to the issues.

2. Materials and Methods

This study developed a mixed method participatory mapping exercise coupled with a qualitative questionnaire as part of a novel stakeholder engagement methodology. Combining quantitative spatial data and qualitative responses allowed us to determine how participants from four key stakeholder groups perceived conflict and competing demands on water resources (herein termed conflict) within their local catchments, as well as the underlying drivers of conflict and any perceived likely future changes to such demands. Three contrasting catchments with diverse geomorphologies, land cover composition, stakeholder communities and land and water management pressures were selected from across Scotland, UK (Figure 1).

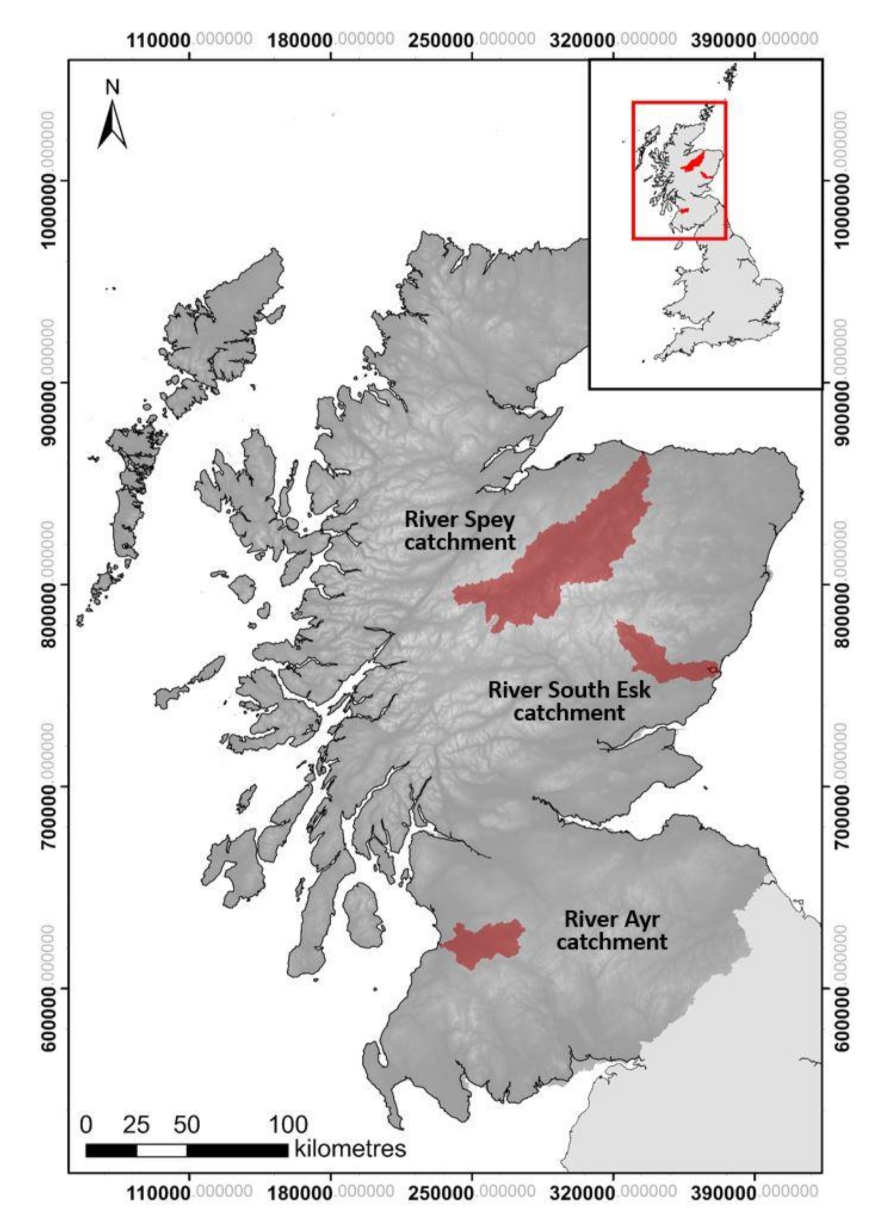
2.1. Study Catchments

The River Spey drains an area of just under 3000 km2 in the northeast of Scotland and lies within the northwestern part of the Cairngorms National Park. Land cover is dominated by moors and heathland (29%), sparsely vegetated highlands (23%), and coniferous forest (16%; Table 1). This catchment has a varied land use including rough grazing, commercial forestry, arable farming, and sporting estates. Whisky distilleries, tourism, and angling also represent important local industries, with 8% of Scotland’s total wild salmon catch originating from the River Spey. The river is a Special Area of Conservation (SAC) for Atlantic salmon, sea lamprey, freshwater pearl mussel, and otter, and forms part of the EU Natura 2000 network [55]. An estimated 20% of the mean annual water flow to Spey Bay is diverted to large hydropower schemes in nearby catchments. Competing demands on the remaining water resources in the catchment are local hydropower plants, a growing food and drink manufacturing industry, and increasing domestic water demands and irrigation needs [56].
In the east of Scotland, the South Esk catchment has an area of just over 600 km2, originating in Glen Clova, in the Cairngorms National Park and draining into Montrose Bay. The geomorphology and land cover are distinctly split between its upper catchment at higher altitudes, which is dominated by moors and heathland (33%) used for rough grazing, and its more gently sloping lower catchment, which is dominated by arable land (31%) and improved grazing (12%). The catchment has been designated as an SAC for Atlantic salmon, freshwater pearl mussel, and otter. It has also been identified as a nitrate vulnerable zone as both ground and surface waters are at risk of nitrate leaching from soils; therefore, farmers in the catchment must adhere to additional management restrictions to reduce nitrate leaching in the catchment. Point source pollution from wastewater effluent discharge, diffuse pollution from agriculture, and water abstraction for arable farming are the major pressures on this catchment system [57].
The River Ayr catchment drains an area of just under 600 km2 into the Firth of Clyde. Approximately 65% of the catchment area is pasture with lowland improved grassland used for intensive dairy farming and upland pastures supporting sheep and beef farming; diffuse pollution from agriculture represents a significant challenge for water quality and human health, the latter being especially important due to a number of designated public bathing water beaches on the Ayrshire coast. Livestock rearing, tourism, and wild salmon angling are important local economies, which impose contrasting demands on the catchment. The Scottish Environment Protection Agency (SEPA) has declared the catchment a “priority catchment for diffuse pollution” and has worked with local farmers to avoid breaches of local regulation, which have primarily been caused by riverbank erosion by livestock and their direct access to watercourses.

2.2. Sample Selection and Engagement Design

In each of the three study catchments, three to five individuals from four key stakeholder groups took part in the exercise: environmental regulator staff (n = 12; all from SEPA), water industry staff (n = 9; all from Scottish Water, Scotland’s public water and wastewater company), catchment scientists (n = 11; from Universities and research institutes across Scotland) and farm advisors (n = 11; from the National Farmers Union Scotland as well as independent farm consultants). A total of 43 stakeholders carried out the survey in 2017, 15 of whom had local expert knowledge on the River Spey catchment, 13 on the South Esk catchment, and 15 on the Ayr catchment. The four stakeholder groups were selected through a preliminary desk-based exercise that ranked the importance of the stakeholder groups for land and water management, and their influence on management decisions. Criteria for selection of participants were (i) evidence of experience in their respective catchment, e.g., an individual was required to have worked for at least a year in the catchment, or written a publication or report linked to the catchment; and (ii) expertise on land and water management issues. Participants were initially identified through a desktop study with additional stakeholders identified through recommendations from the initial cohort.
Participatory mapping was conducted face-to-face to ensure that the tasks and their context were understood and to avoid any miscommunication or misinterpretation between the interviewer and participant. All surveys were conducted by the same interviewer to ensure consistency in approach, and the results anonymised so that the stakeholder group of each respondent was known, but not their identity. The interviews were carried out on a one-to-one basis to allow stakeholders to express their perspectives frankly, even if their views deviated from the majority-held opinions within their stakeholder group. The interviews were developed to elicit responses to 12 questions, prompting participants to consider their views about the major themes of ecosystem service provisioning and trade-offs, competing land use, and conflict between stakeholder groups in their catchments. Of central importance was a mapping exercise whereby participants were asked to spatially identify areas on a catchment map where they perceived there to be conflict among stakeholder groups. As there are no “severe” water or land use conflicts in Scotland, a number of participants in pilot interviews thought the word “conflict” was too strong, so the definition in the survey was broadened to include areas of competition between land uses as a proxy of a driver of conflict [58]. Participants were asked to delineate the areas of conflict/competition that they identified on a map of their catchment, and they were also told that they could select the entire area of a particular land cover type. Hardcopy maps were used for this exercise, as opposed to digital mapping, as this proved more accessible to participants during pilot interviews, with both formats shown to produce equivalent mapped outputs [59]. Following the mapping exercise, the remaining questions of the interview focused on collecting qualitative evidence to support why particular areas had been selected and to identify the possible drivers behind land use competition and how they may be resolved or may change in the future (full questionnaire available in supplementary information).

2.3. Analysis

Responses from the participatory mapping exercise were digitised from the scanned paper maps to polygons in ArcMap 10.4.1 [60]. The polygons were overlaid in ArcMap to generate heat maps of conflict for each catchment, where higher numbers of overlap in stakeholder perception equate to increased “heat” of conflicts and land use competition. To quantify where each of the polygons from different participants overlapped, the polygons were first converted to raster files and resampled to 10,000 m2 resolution as well as “snapped to raster” in their processing extent to make sure all the files were aligned. To identify the overlapping raster cells between different respondents, the polygons were reclassified using numbers as place holders for each participant. Numbers which were powers of two were used, or 2n (i.e., 1, 2, 4, 8, 16...), as they could then be overlapped and summed in ArcMap prior to extraction as an Excel file while retaining the identifying information of each stakeholder.
To compare the amount of overlap among different stakeholder groups, the number of overlapping raster cells per stakeholder group (z) was normalised by subtracting the mean number of raster cells per participant (µ) from their stakeholder group’s mean number of raster cells (x) and dividing by the standard deviation (σ), which accounted for the variation in raster cell selection among the stakeholder groups and the differing scales of the catchment, as represented by:
z = x µ σ
The differences in overlap of participant’s highlighted area of conflict between the stakeholder groups and between catchments were compared using a Kruskal–Wallis statistic using SPSS version 23 statistical software, with differences reported at a significance level of 0.05 (95% confidence interval) [61].
Regression analysis was used to model whether land cover data and other variables such as stakeholder group or catchment type could be used to predict conflict and land use competition in the study catchments. The raster data from all of the heat maps were combined with 2015 CEH landcover data in ArcMap and extracted to R using the “tiff” [62], “raster” [63], “sp” [64], and “rgdal” packages [65]. The “brick” function was used to extract the raster information from ArcMap into R and combine data from the three catchments into one file. For the regression analysis, general linear models were used to determine how perceived conflict may be explained in part by land cover type, catchment, or stakeholder group identity, with significance tested at α = 0.05. The final model was selected as all factors were highly statistically significant (p < 0.001), and its Akaike information criterion was lower than other more and less complex models.
The responses from the questionnaire were grouped into themes according to content. The themes were types of ecosystem services, types of conflict, and types of drivers. This categorisation allowed comparison between groups and catchments. The responses to Question 9 (“What are the major drivers for conflict between land use, ecosystem service provision, and stakeholders in your catchment?”) were initially grouped into 16 categories, with the nine smallest categories being grouped together as “Other”, resulting in eight groups: “Policy”, “Subsidies”, “Climate change”, “Financial pressures”, “Competing interests”, “Urban population growth and increased tourism”, “Lack of communication and integrated management”, and “Other”.

3. Results

Participants identified a total of 97 areas of conflict within the participatory conflict mapping exercise. The most polygons were mapped in the Spey catchment (41), followed by the Ayr (34) and the Esk (22). Catchment scientists were the stakeholder group that identified most polygons (33), followed by environmental regulator staff (27), farm advisors (24), and water industry staff (13).

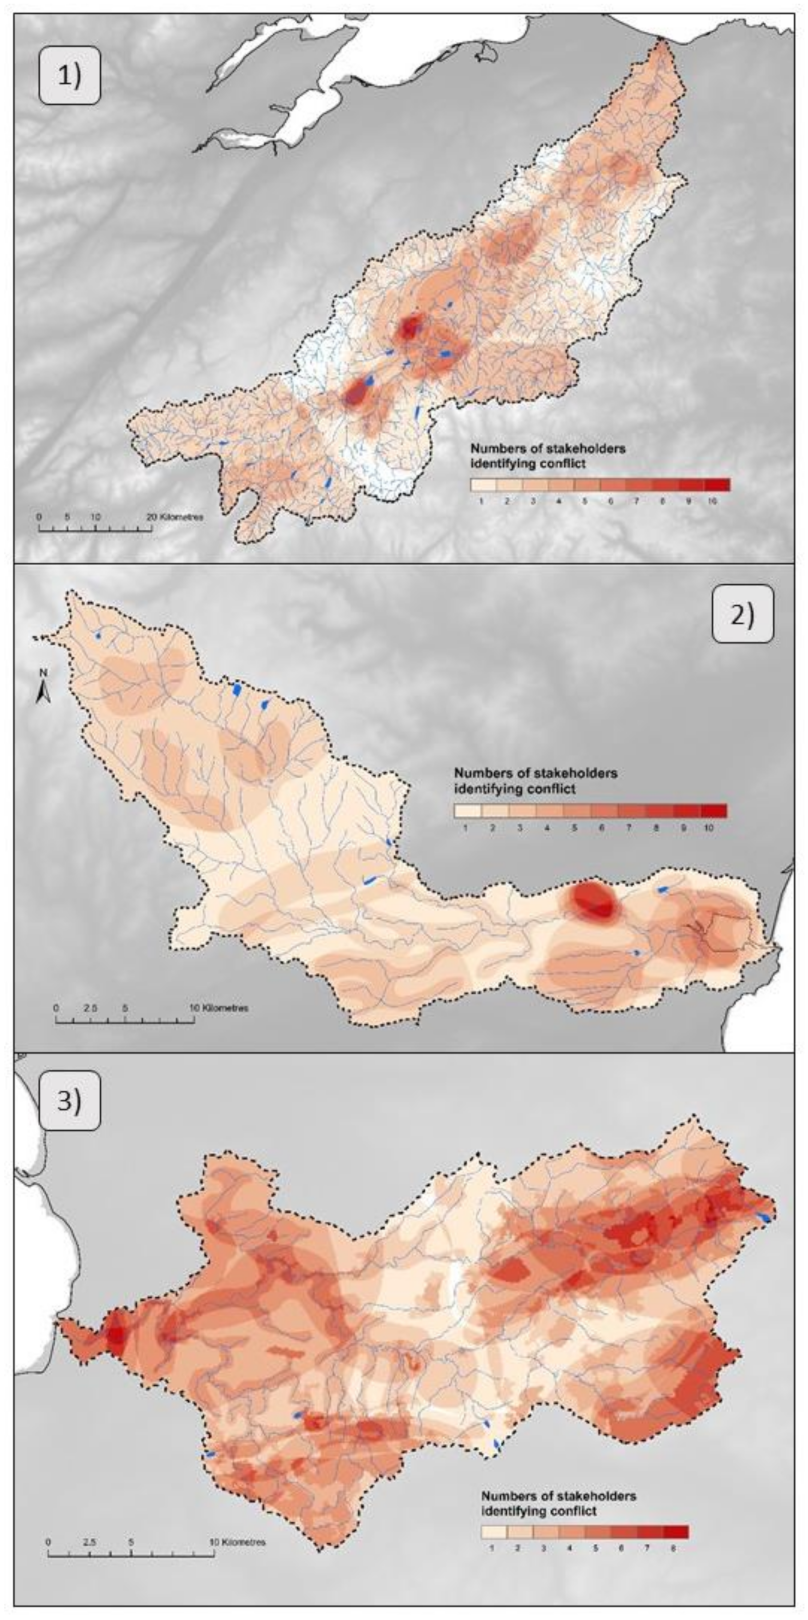
3.1. Hotspots of Conflict

The heat maps of perceived conflict, combining all the stakeholder’s responses, showed that perception of conflict in all three catchments was often congruent among participants, with up to ten stakeholders identifying the same localised hotspots in their catchment. Participants also identified more dispersed issues across the catchments, which were manifest at a landscape scale (Figure 2). In the River Spey and South Esk catchments, the most commonly identified conflict areas were more localised. Stakeholders in the Ayr catchment identified areas of conflict more widely across the catchment, and the mean proportion of perceived conflict across the catchment was larger, with 22.44% ± 0.04, followed by the Spey (18.71% ± 0.02) and the South Esk (17.17% ± 0.04). Results from the questionnaire data also suggested that there were more diverse issues in the Ayr catchment compared to the other two catchments.

3.1.1. The Spey Catchment—Land Use Strongly Influenced by Tourism

In the Spey catchment, two clear hotspots emerged from the participatory mapping. The more northerly hotspot (which is further downstream) is situated around a town popular with tourists, where stakeholders asserted that this holiday destination has experienced an increase in urban development and tourism influx in recent years. The hotspot, with an area of around 9 km2, was identified by ten out of the fifteen Spey stakeholders. Development in and around the town was thought to cause significant socioecological pressures, such as increasing house prices and demands on the local water resources for potable use, in addition to increasing abstraction pressures on the Spey. Further upstream, the second hotspot (of about 13 km2 and identified by nine participants) was perceived to be where a significant proportion of the river’s water was being diverted to a neighbouring catchment to power a hydroelectric dam. The upstream abstraction of water to generate energy in a neighbouring catchment was widely mentioned by participants in their questionnaire responses as causing compromised downstream flows, and concern for aquatic biodiversity (especially for conservationists, anglers, and river trusts). The third most commonly identified area (7 out of 15 stakeholders) of conflict in the Spey was due to increases in tourism and recreation in the uplands around the local town, which is perceived to cause conflict with anglers, sporting estates, and biodiversity conservation efforts. Five participants mentioned that an increased use of the area was causing conflict with biodiversity conservation; however, four stakeholders also mentioned that conflict situations were arising among different groups of recreational users, such as between anglers and wild water rafters or between shooting estates and hill walkers.

3.1.2. The South Esk Catchment—Mixed Land Use

In the South Esk catchment, the most intense perceived conflict around a lowland town was identified by ten out of the thirteen stakeholders. The complementary questionnaire determined that a recently installed large flood control scheme had caused extreme flooding and erosion of farmland downstream of the town. Out of the ten stakeholders that identified conflict within this 8 km2 area, seven specifically identified the town as an area of conflict. Throughout the rest of the catchment, overlaps were much less common although more extensive in area, with a maximum of six overlaps near the urban and coastal areas. Seven stakeholders from the South Esk and the two other catchments also voiced concerns over the Scottish Government’s target to plant a minimum of 10,000 ha of forestry per year to offset greenhouse gas emissions. They were concerned about this encroaching on the availability of upland grazing spaces, as trees would not be planted on high-quality agricultural land nor on peatlands which would probably emit greenhouse gases when forested. Other trade-offs mentioned were the impacts of future tree felling on downstream water quality, and how wet woodland planting may impact wading bird conservation as it would provide cover for predators such as birds of prey.

3.1.3. The Ayr Catchment—Land Use Mainly Characterised by Agriculture (Esp. Dairy)

Responses of up to eight stakeholders overlapped in the Ayr catchment; however, in contrast to the other two catchments, these did not form spatially distinct or acute hotspots. Although conflict was commonly identified around distinct locations in the Spey and South Esk, stakeholders from the Ayr catchment perceived conflict more widely across the catchment, with larger areas showing overlaps of five or more stakeholders (18% of total area). The areas of conflict identified by five or more stakeholders in the Spey catchment were only 5%, and only 3% in the South Esk catchment. The greatest number of overlaps in the Ayr catchment were situated around the urban and coastal areas of Ayr, which is the main town in the catchment (eight out of 15 stakeholders), in the upland areas of the catchment (seven stakeholders), and within improved grassland areas immediately surrounding the River Ayr and its tributaries (six stakeholders). The qualitative data from the questionnaire showed that although the numbers of conflict and drivers raised by stakeholders in the Ayr were comparable to those in the other two catchments, they revealed a more diverse array of issues. In terms of the area of conflict identified around the town of Ayr, seven out of fifteen stakeholders mentioned concerns around bathing water quality being impacted by farming and particularly poaching of riverbanks by cattle. Five stakeholders perceived urban development to cause a loss of prime agricultural land and flooding, and seven catchment stakeholders voiced concern that increases in forestry were leading to farmers becoming frustrated by rising land prices for rough grazing, exacerbated by the Scottish Government’s 10,000 ha tree planting targets. Four stakeholders also mentioned that mining areas that have been historically poorly managed are now left unused and unrestored, and three of the fifteen Ayr stakeholders thought there was conflict due to visual impacts of increasing windfarm development in the uplands.

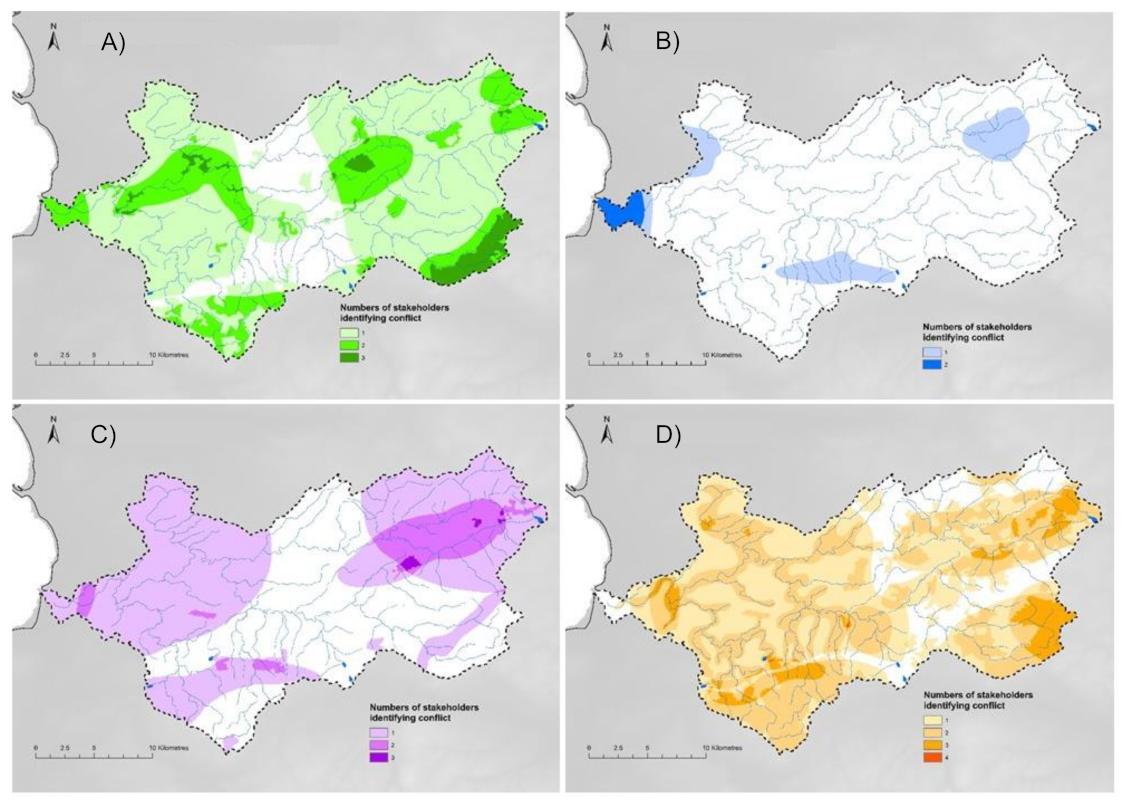
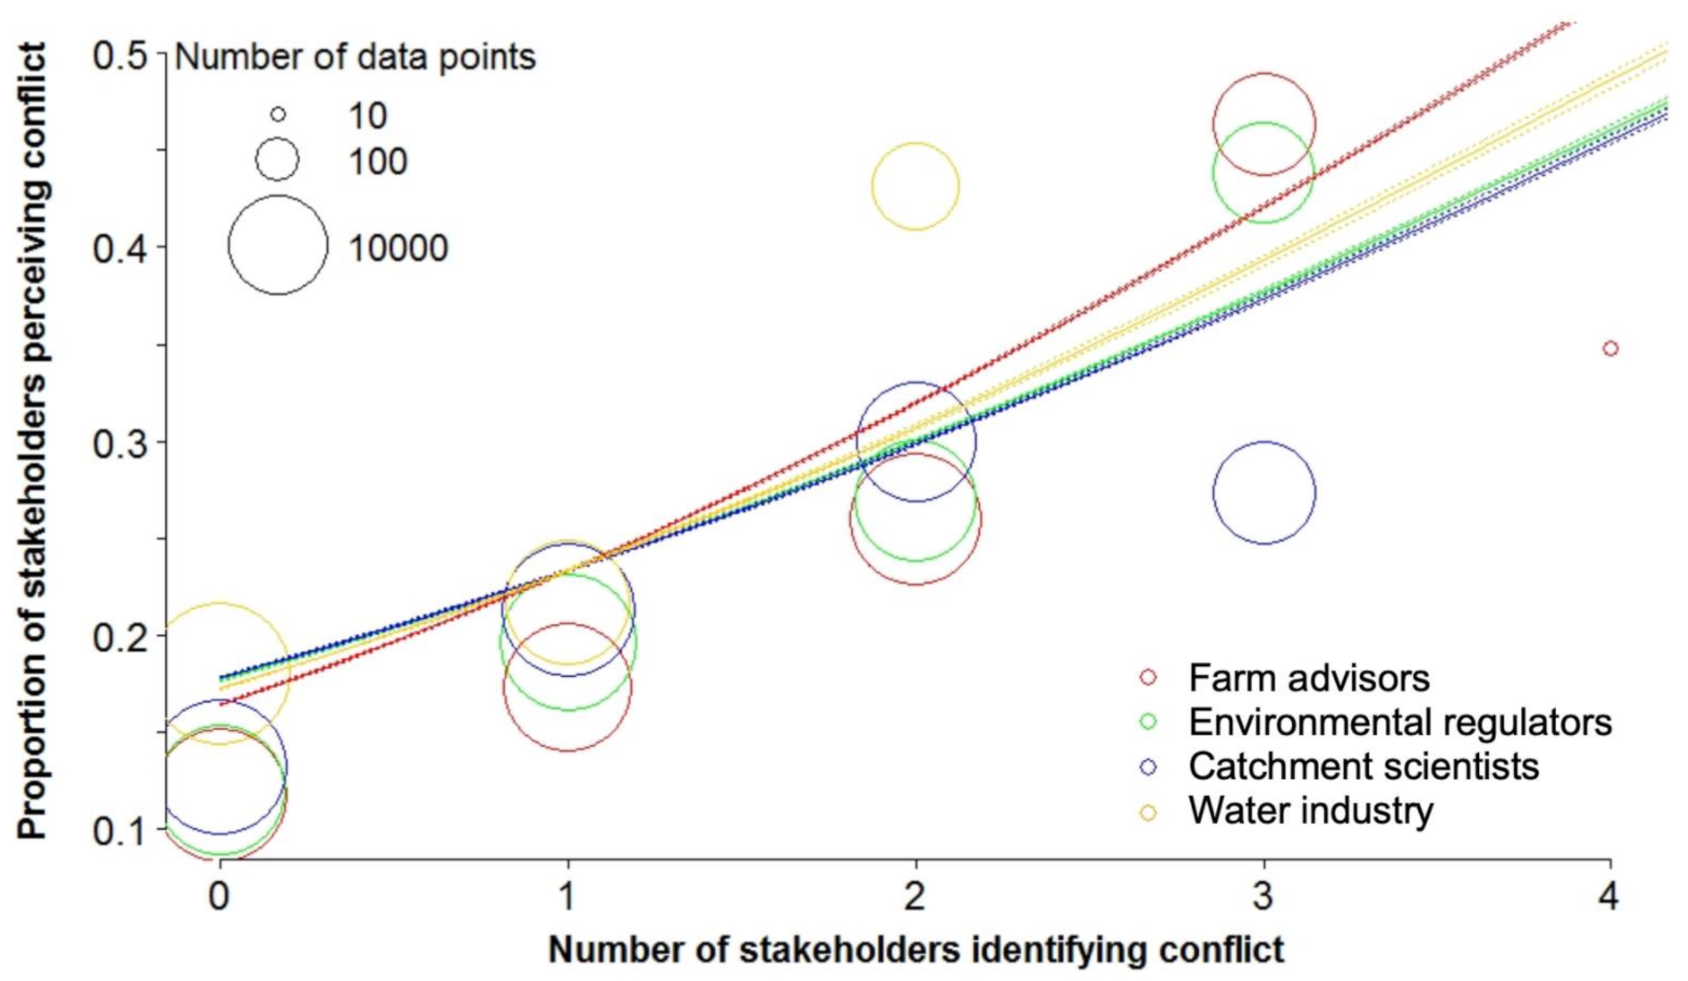
3.2. Stakeholder Groups and Conflict

In the Ayr catchment, water industry staff selected fewer, and smaller, areas of land use competition in the participatory mapping exercise, and responses within this stakeholder group only overlapped in the very west of the catchment around the town of Ayr (Figure 3). The other stakeholder groups’ responses cover larger areas of the catchment and overlap up to a maximum of three times for environmental regulator staff and catchment scientists and up to four times for farm advisors. Water industry staff identified only five polygons of perceived conflict in the Ayr catchment, with a total of 89.9 km2, whereas environmental regulator staff identified 11 polygons with a total area of 873.9 km2, catchment scientists identified seven polygons at 396.4 km2 and farm advisors selected 11 polygons and the largest area with 1008.2 km2. This trend was similar in the other two catchments, where water industry staff also identified fewer, and smaller, areas of potential conflict compared to the other three stakeholder groups.

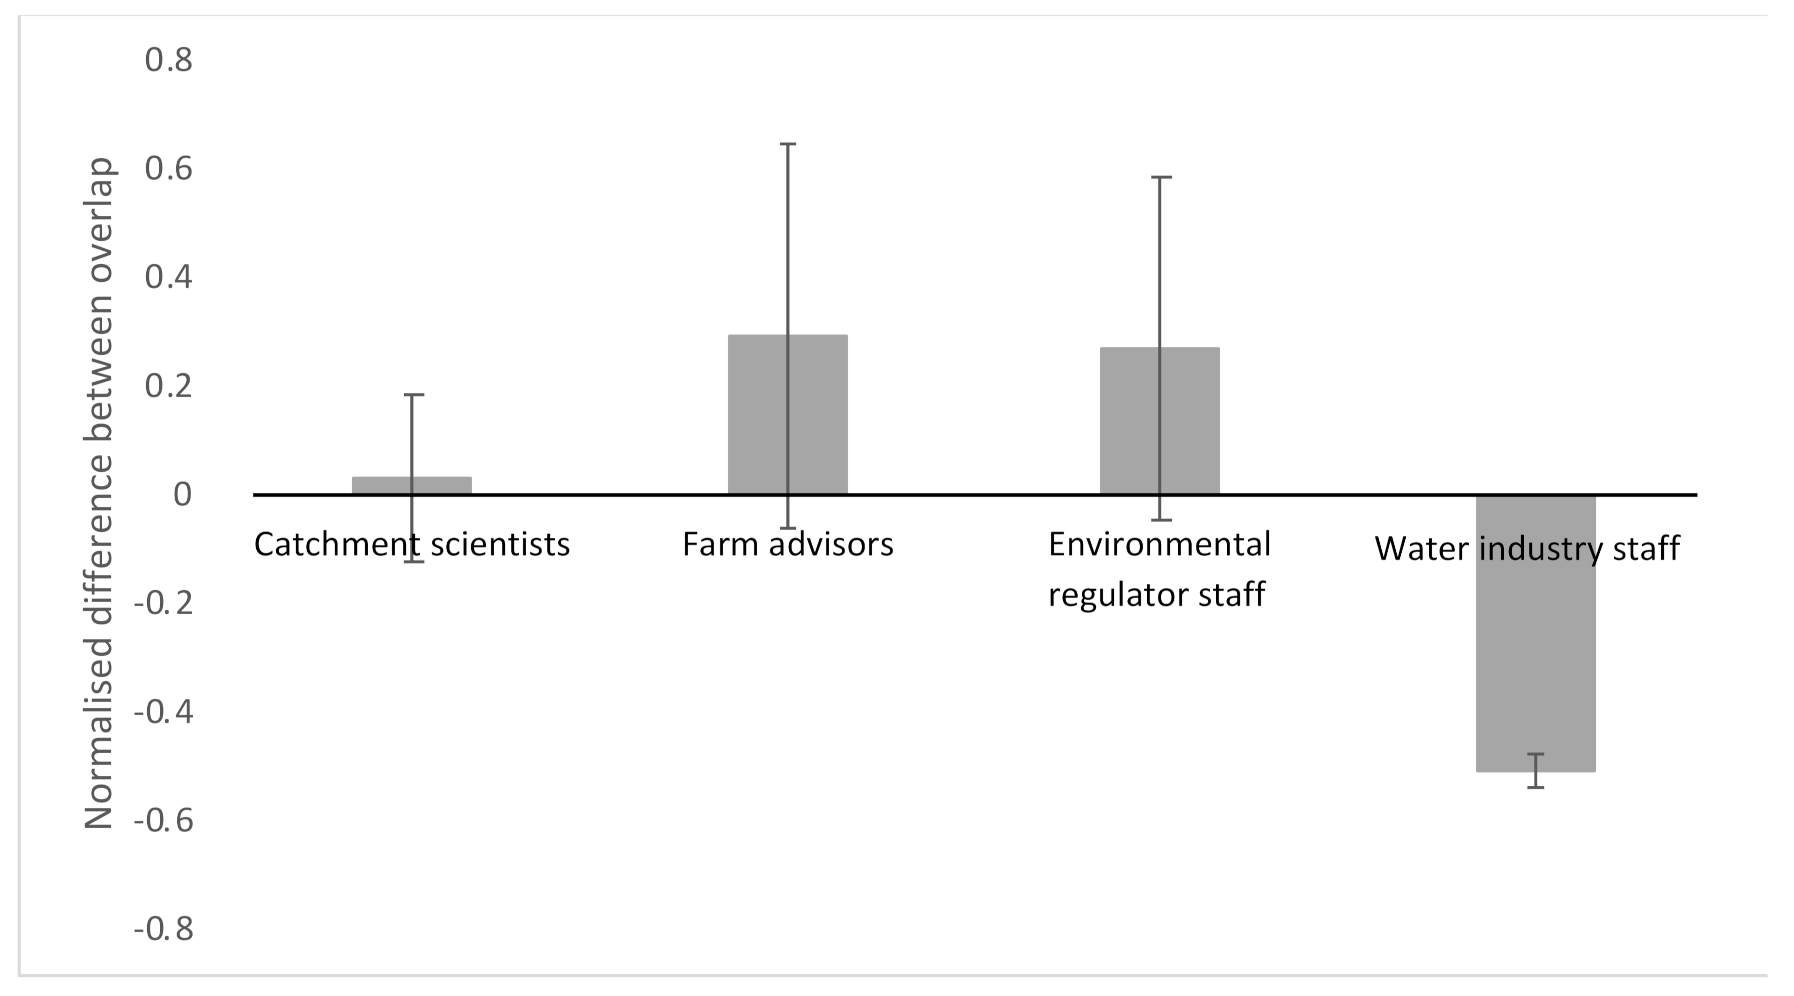
3.3. Overlap Analysis

Overlap analysis revealed that although there was a lower number of normalised overlaps in the South Esk catchment, there was no significant difference in the amount of overlap between the catchments (H = 0.37, p > 0.05), although there was a significant difference between stakeholder groups (H = 11.6, p < 0.01). The responses of catchment scientists were very similar to the mean overlap of responses (Figure 4). Responses from farm advisors and environmental regulators were, on average, more similar within their group; however, this was not statistically significant due to the large variation in overlap among stakeholders. Farm advisors in the Ayr catchment and all water industry staff showed significantly less overlap within their stakeholder group.

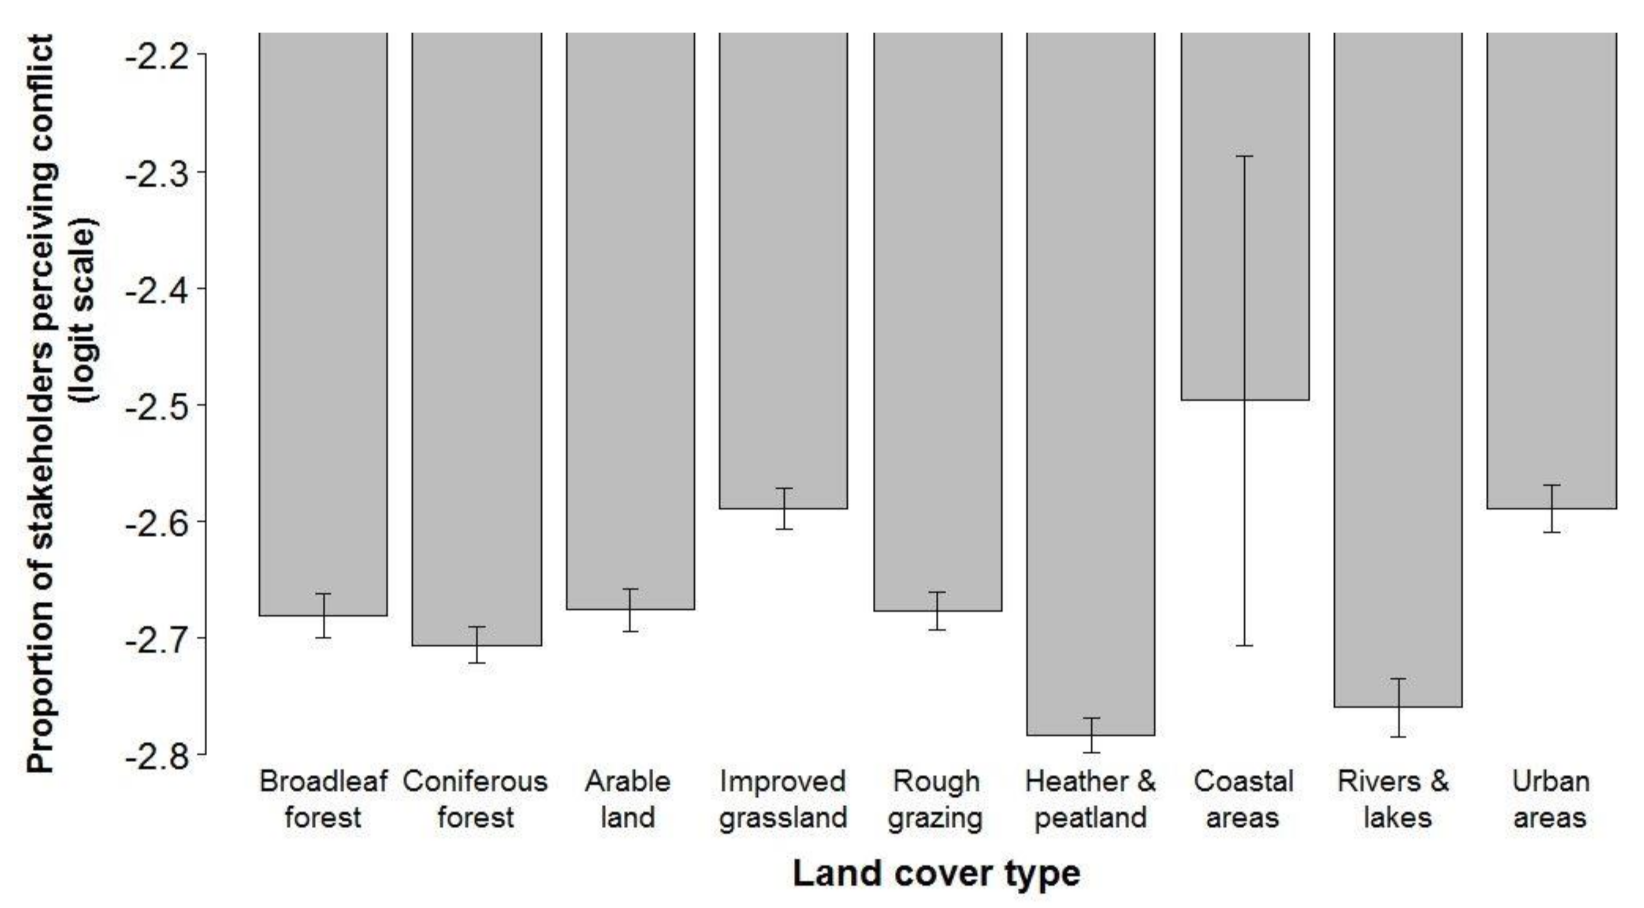
3.4. Land Cover and Conflict

The proportion of stakeholders perceiving conflict could be explained in part by land cover, catchment, and stakeholder group identity (full model outputs in Table 2). The land cover types that were the best predictors of areas with greater perceived conflict in the model were improved grassland and urban areas (Figure 5). Coastal areas had an even larger effect; however, they had much greater variability associated with them compared to all other land cover types, probably due to their smaller size.
With respect to individual catchments, Ayr was associated with greater perceived conflict than the Spey and the South Esk catchments. The modelled proportion of perceived conflict was greatest in the Ayr, followed by the Spey.
Results of the modelling for the four stakeholder groupings showed that farm advisors were most likely to identify conflict in areas where there was a large proportion of stakeholders that perceived conflict, followed by water industry staff (Figure 6). Catchment scientists and environmental regulator staff were the least likely to identify conflict in areas where there was a large proportion of stakeholders that perceived conflict.

3.5. Drivers of Conflict

When stakeholders were asked to comment on the drivers behind conflicts in their catchment, legislation was most commonly mentioned (by 21 of the total 43 stakeholders), followed by financial pressures (13 stakeholders), competing stakeholder interests (11 stakeholders), and urban population growth and increases in tourism (7 stakeholders). These drivers were mentioned by all four stakeholder groups. Other drivers mentioned by multiple stakeholders were subsidy payments (6 out of 43 stakeholders), climate change (4 stakeholders), and a lack of integrated management and stakeholder understanding (3 stakeholders).

3.6. Future Change to Conflict

A majority (27) of stakeholders stated that, by 2030, there would be changes to the major drivers for conflict between land use, ecosystem service provision, and stakeholders in their catchment. When listing likely changes, seven stakeholders identified negative changes due to climate change, such as increased flooding, drought, and diffuse pollution, as well as threats to biodiversity, particularly Atlantic salmon and alpine bird species such as dotterel and ptarmigan. Other negative likely changes mentioned were increased competition due to the Scottish Government’s forestry planting targets and increased financial pressures on farmers and local residents. Eleven participants also mentioned likely positive changes, such as improvements to agricultural and forestry practices (through increased agricultural outputs, reduced pollution from farmland, and sustainable forestry), improved payments for ecosystem services, restoration of rivers, woodlands, and mining sites, more holistic catchment management, and increased communication and cooperation among stakeholder groups.
Ten stakeholders perceived the likely impact of the UK leaving the European Union (Brexit) to be negative in terms of land use, ecosystem service provisioning, and stakeholder conflict in their catchment. A commonly held concern was that new UK Government environmental legislation would be less stringent than EU legislation, although eleven stakeholders thought that most environmental legislation would be carried over after Brexit. Five stakeholders stated that they particularly hoped that the EU Water Framework Directive and Bathing Water Directive would not become less stringent after Brexit. Seven stakeholders believed that at a minimum, environmental protection from EU farm payments would be matched after Brexit; however, six others voiced concerns that this was unlikely and would force farmers to make “hard choices” and make it particularly difficult for those farmers who were on the breadline. Eight stakeholders viewed Brexit as an opportunity for land and water managers to have greater involvement in decision-making and saw opportunities for more targeted farm payments that improve food security and broader ecosystem service provisioning than the current Common Agricultural Policy payments.

3.7. Conflict Mitigation

Four stakeholders commented that stakeholders already generally work well together, with two stakeholders mentioning their catchment management plan as being pivotal in that respect. When asked to suggest how conflict may be further mitigated, they most commonly (6) replied that improved stakeholder communication and cooperation would help reduce conflict in their catchments. This was followed by improving farm payments (4), such as making them less difficult to apply for and increasing effective management of water margins, and by catchment restoration (4), i.e., improving ecological connectivity and installing natural flood management across the catchments. Other ways to alleviate conflict put forward by multiple stakeholders were research into ecosystem service provisioning and conflict in catchments (2), increasing climate change resilience (2), identifying win–win solutions to issues in the catchments (2), and engaging the local community to become more involved in, and benefit from, how the catchment is managed (2).

4. Discussion

Our proposed methodology provides an innovative and engaging tool for unpacking stakeholder perceptions of conflict and land use competition at the catchment scale. This novel application of participatory mapping captured spatial data across multiple catchments with varying land use and environmental characteristics by stakeholders from four key land and water management stakeholder groups. The heat maps of perceived conflict illustrated the complex combination of local and landscape-scale issues present in the catchments and identified the three main aspects of land use conflict—trade-offs between ecological, agricultural, and construction interests [66]. We were able to quantify how perceived conflicts differed between catchments and groups of stakeholders and used modelling of land cover types to predict conflict in the study catchments. The mixed method approach allowed for robust mapping results, which were complemented with rich insight into the complex issues from the short questionnaire [67]. This also provided opportunity for validation as well as clarification and elaboration of the mapping results [54]. The methodology was effective at identifying and characterising spatial hotspots of perceived conflict in catchments of varying land use, environmental characteristics, and stakeholder cohorts, which demonstrates the potential transferability of this approach to the rest of the UK, and beyond, as well as to broader groups of stakeholders, such as nongovernmental organisations (NGOs) and the public. Consulting with and engaging the public allows for the elicitation of local knowledge, which can further inform land and water management decision-making while empowering communities and developing social capital [68]. Mapping approaches, such as the one presented here, can also help to bridge the communication gap between lay and expert knowledge [69].

4.1. Differences in Perceived Conflict among Stakeholder Groups

Although each of the catchments had distinct local issues and sources of conflict raised by stakeholders, several themes were raised by all four stakeholder groups and in all study catchments. Most of the broader themes emerging from the mapping exercise (forestry, energy provisioning, agricultural diffuse pollution, urban development, and flooding) were also identified by all the four stakeholder groups, whereas pressures on farmland management were only identified by farm advisors and catchment scientists, and pressures from tourism and recreation were only identified by environmental regulator staff and catchment scientists. Hence, catchment scientists were the only stakeholder group to identify the entirety of the categories of conflict, which may be a reflection of their role as unbiased outside observers of land and water management issues [70].
Different stakeholder groups did not, however, overlap more within their groups than across all the responses, which was also reflected by congruent reporting of types of conflict by the stakeholder groups. This may indicate that membership to a particular stakeholder group did not impact on stakeholders’ ability to identify a range of land and water management conflicts, and not just those within their main domain of interest. It is still vital, however, to include various actors in any such participatory engagement exercise, as they will have different perspectives on issues and likely solutions to those [71], despite this not being statistically quantifiable in the overlap analysis. The significantly lower overlap between water industry staff was probably due to them selecting a smaller number of more specific and local issues, such as flooding or abstraction, which are more relevant in their day-to-day work, as opposed to wider, landscape-scale conflicts in which the other three stakeholder groups may be much more engaged with. Across all three catchments, water industry staff identified fewer and smaller areas of potential conflict compared to the other three stakeholder groups, whereas farm advisors identified comparable numbers of raster cells. The comparability among farm advisors may point to their central role as brokers between the farming community and other stakeholder groups, and their familiarity with local land management issues [72].
The four main drivers of conflict were also identified by all stakeholder groups and in all catchments. This indicates that, although we were only able to incorporate the views from a limited number of stakeholders, we were able to effectively elicit the general views of the stakeholders in the three catchments.

4.2. Land Cover Data

Results from the regression modelling linking perceived conflict to coastal, urban, and grassland land use correspond well to what has been found in other participatory conflict mapping studies: coastal areas are used by a number of different stakeholder groups and are under multiple and cumulative environmental and sociocultural pressures [73,74]. In this study, the main underlying issues surrounding coastal areas were bathing water quality, flooding, and urbanisation. Urban development may cause rural–urban conflict when resources such as water or valuable farmland are partitioned away from rural areas to secure the needs of a growing urban population [75,76]. Although Scotland is not water-scarce, several stakeholders were concerned about aquatic ecological quality being impacted by urban development that already had significant abstractions for hydro power, agriculture, and local industries. A common trade-off of renewable hydroenergy is its impact on the ecological needs of the river [77,78]. The spatially constrained nature of urban and coastal areas also probably contributes to the finding that conflict in those areas was highly acute.
Agricultural diffuse pollution has overtaken urban and industrial contamination as the major source of pollutants to water bodies in a number of high-income countries [79]. It is a key contributor to impacts on ecological status and bathing water quality in Scotland, which is probably why improved grasslands were shown to be more likely areas of conflict for the stakeholders of this study [80]. Arable land was not seen to be as significant, which may be due to the dominance of intensive dairy pastures in the study catchment with the greatest agricultural land use; however, the mapping of land use conflicts will reflect the catchment context. In other catchments of Scotland, the UK, or, indeed, the world, where improved grassland is less common, the agricultural drivers of conflict may instead focus more heavily on farming practices related to, e.g., soil erosion or pesticide leaching, and hence result in different types of conflict.

4.3. Temporal Aspects of Conflict

The major hotspot of conflict identified in the mixed land use catchment (surrounding the flood mitigation scheme which caused extensive flooding and loss of agricultural soil downstream) demonstrates how a relatively localised issue can be highly relevant for stakeholders across the catchment. It also illustrates how a short and sudden event can have broader temporal impacts on conflict identified by stakeholders [81], and indicates the significance of a recent extreme flood event to stakeholders, which in turn may help develop resilience to future flooding in the catchment [82]. As well as capturing a snapshot of current conflict via the participatory mapping, the methodology also highlighted emerging and prospective temporal variability in land use conflicts by asking stakeholders to consider current issues and likely changes after Brexit and by 2030. Stakeholders identified a number of likely future opportunities and risks for their catchments, for example, how a possible departure from the Common Agricultural Policy incentive scheme may allow for more targeted payments for ecosystem services that aim for greatest socioecological benefits [83]. Participatory mapping approaches such as this could be applied longitudinally to provide insight into how the areas of land use conflict may change over time and in response to different policy drivers or catchment “events” and determine which conflicts were more dynamic or transient. However, longer-term application of such an approach would have greater time and resource demands. Alternatively, the methodology could be adapted as part of a participatory scenario planning exercise to help foster common understanding and engage stakeholders with future planning of social–ecological systems [84].

4.4. Drivers of Conflict

Legislation was the most commonly mentioned driver behind conflict in all of the catchments and by all participants, which highlights that although supra-catchment policies such as the EU Water Framework Directive encourage bottom-up management and participatory approaches, there is a need to adapt national and EU-wide policy and governance to allow more flexibility and self-determination at the local level to incorporate multiple knowledges and perspectives [85]. The Scottish Government target of expanding forestry in Scotland by 10,000 ha per year was highlighted as a policy that may exacerbate conflicts and land use competition in all the study catchments, although it has been implemented with a goal of improving overall ecosystem service benefits. When investigating stakeholder views on woodland expansion in Scotland, Burton et al. [83] similarly found that stakeholders voiced reservations about possible trade-offs from tree planting, although they generally thought it to be an overall positive initiative.
Increases in urban development and tourism were also considered a major driver of conflict, particularly in the Spey catchment. A hotspot was identified by stakeholders in the uplands near the local tourism town, where increases in tourism and recreation are impacting on those “wild” spaces which originally attract people there [86], demonstrating that tourism development has the potential to be a key driver of conflict [87]. Other studies have also found that an increase in the recreational use of an area can cause conflict with biodiversity conservation [88,89], or among different recreational users [90]. As such areas are seen to be too often frequented, more people will likely disperse further into the uplands, which may exacerbate impacts on biodiversity in a wider area of the catchment. Given the varied attitudes towards tourism development [91], improved understanding of the nuanced perceptions of space-specific conflict in such areas is important. In turn, this can help to underpin future management of, e.g., environmentally sensitive areas or national parks, to reduce conflict driven by growing tourism and recreation.

4.5. Using Participatory Conflict Mapping to Inform Land Use Decision-Making

Our methodology has revealed several hotspots of perceived conflict in the study catchments, suggesting that these areas require attention in future policy and management proposals. When looking at relatively explicit and localised conflict, expert judgements informed by our methodology may be sufficient in helping to find solutions to land and water management issues, for example, if adapted to be used as part of a group exercise [92]. Many conflicts in catchments are, however, inherently complex, and the main benefit of participatory mapping of land use conflicts is likely as a tool to quantify and spatially identify areas where more focused problem-solving efforts are needed. This could be achieved through the use of frameworks for managing conflicts, such as was developed for conservation agencies by Young et al. [93], or ecosystem service-based tools to critically evaluate trade-offs and create a range of solutions to sustainably manage landscapes while considering multiple socioecological benefits [94]. Our methodology may also be applied at a national scale to identify “complex conflict priority catchments”, where catchments that are experiencing multiple and exacerbating conflicts (such as the agricultural study catchment with intensive dairy farming) could benefit from a more holistic management of landscapes. Funding mechanisms could then be used to support such catchments in setting up ecosystem service-based catchment management initiatives and facilitating greater communication among stakeholders in the catchment. Many of the participants in our study stated that often conflicts arise due to a clear trade-off between two reasonable interests which are conflicting, hence making a “win–win” solution unlikely. However, involvement of relevant stakeholders increases the likelihood of measures being implemented, and the knowledge of local conditions can aid identification of efficient solutions at lower cost [95].

5. Conclusions

Increasing demands on catchments to supply food, deliver water and energy security, and provide wider ecosystem services require an integrated and sustainable approach to catchment management, which can be challenging. Participatory approaches such as the methodology reported here are crucial to aid the understanding and management of socioecological systems and help to reduce conflict among land and water management stakeholder groups. Engaging key stakeholder groups in our study catchments allowed quantification of local and landscape-scale issues as well as insight into stakeholders’ perceptions on the current land and water management issues in their catchments of interest. Extension of the approach to other catchments clearly requires engagement from relevant communities, but where there are perceived conflicts in land and water management, there is likely to be an appetite for catchment stakeholders to share their views. There is an opportunity for innovative and engaging participatory approaches to play a key role in assessing conflict and land use competition and identifying catchments and areas with a particular need for more holistic land and water management, as well as playing a vital part in initiating discourse between stakeholder groups to foster mutual understanding and decision-making.

Supplementary Materials

The following are available online https://0-www-mdpi-com.brum.beds.ac.uk/article/10.3390/land11020300/s1, Interview protocol and questionnaire.

Author Contributions

Conceptualization, K.C.S., R.S.Q., N.B. and D.M.O.; methodology, K.C.S., R.S.Q., N.B. and D.M.O.; formal analysis, K.C.S. and N.B.; investigation, K.C.S., R.S.Q., N.B. and D.M.O.; data curation, K.C.S.; writing—original draft preparation, K.C.S.; writing—review and editing, K.C.S., R.S.Q., N.B. and D.M.O.; visualization, K.C.S. and N.B.; supervision, D.M.O.; project administration, K.C.S. All authors have read and agreed to the published version of the manuscript.

Funding

This research was funded by the Scottish Government Hydro Nation Scholars Programme.

Institutional Review Board Statement

The study was conducted following ethical approval from the General University Ethics Panel of the University of Stirling on the 4th of August 2016.

Informed Consent Statement

Informed consent was obtained from all subjects involved in the study.

Data Availability Statement

Data available from authors on request.

Acknowledgments

We would like to thank all the stakeholders for volunteering their time and expertise. Thank you to Scott Jackson and John McArthur for technical support.

Conflicts of Interest

The authors declare no conflict of interest.

References

  1. Ye, B.; Zhang, X.; Zhang, X.; Zheng, C. Climate Change, Environmental Impact, and Human Health. Environ. Geochem. Health 2020, 42, 715–717. [Google Scholar] [CrossRef] [PubMed] [Green Version]
  2. Khan, I.; Hou, F.; Le, H.P. The Impact of Natural Resources, Energy Consumption, and Population Growth on Environmental Quality: Fresh Evidence from the United States of America. Sci. Total Environ. 2021, 754, 142222. [Google Scholar] [CrossRef] [PubMed]
  3. Shepherd, E.; Milner-Gulland, E.J.; Knight, A.T.; Ling, M.A.; Darrah, S.; van Soesbergen, A.; Burgess, N.D. Status and Trends in Global Ecosystem Services and Natural Capital: Assessing Progress Toward Aichi Biodiversity Target 14. Conserv. Lett. 2016, 9, 429–437. [Google Scholar] [CrossRef]
  4. Schmeller, D.S.; Courchamp, F.; Killeen, G. Biodiversity Loss, Emerging Pathogens and Human Health Risks. Biodivers. Conserv. 2020, 29, 3095–3102. [Google Scholar] [CrossRef] [PubMed]
  5. Rittel, H.W.J.; Webber, M.M. Dilemmas in a General Theory of Planning. Policy Sci. 1973, 4, 155–169. [Google Scholar] [CrossRef]
  6. Kirschke, S.; Zhang, L.; Meyer, K. Decoding the Wickedness of Resource Nexus Problems—Examples from Water-Soil Nexus Problems in China. Resources 2018, 7, 67. [Google Scholar] [CrossRef] [Green Version]
  7. Von Der Dunk, A.; Grêt-Regamey, A.; Dalang, T.; Hersperger, A.M. Defining a Typology of Peri-Urban Land-Use Conflicts—A Case Study from Switzerland. Landsc. Urban Plan. 2011, 101, 149–156. [Google Scholar] [CrossRef]
  8. Durance, I.; Bruford, M.W.; Chalmers, R.; Chappell, N.A.; Christie, M.; Cosby, B.J.; Noble, D.; Ormerod, S.J.; Prosser, H.; Weightman, A.; et al. The Challenges of Linking Ecosystem Services to Biodiversity: Lessons from a Large-Scale Freshwater Study. In Advances in Ecological Research; Academic Press: Cambridge, MA, USA, 2016; Volume 54, pp. 87–134. [Google Scholar]
  9. Mendenhall, E.; Hendrix, C.; Nyman, E.; Roberts, P.M.; Hoopes, J.R.; Watson, J.R.; Lam, V.W.Y.; Sumaila, U.R. Climate Change Increases the Risk of Fisheries Conflict. Mar. Policy 2020, 117, 103954. [Google Scholar] [CrossRef]
  10. Pahl-Wostl, C.; Kabat, P.; Möltgen, J. Adaptive and Integrated Water Management: Coping with Complexity and Uncertainty; Springer: Berlin/Heidelberg, Germany, 2008; Volume 89. [Google Scholar]
  11. Vasslides, J.M.; Jensen, O.P. Fuzzy Cognitive Mapping in Support of Integrated Ecosystem Assessments: Developing a Shared Conceptual Model among Stakeholders. J. Environ. Manag. 2016, 166, 348–356. [Google Scholar] [CrossRef]
  12. Mohamad Ibrahim, I.H.; Gilfoyle, L.; Reynolds, R.; Voulvoulis, N. Integrated Catchment Management for Reducing Pesticide Levels in Water: Engaging with Stakeholders in East Anglia to Tackle Metaldehyde. Sci. Total Environ. 2019, 656, 1436–1447. [Google Scholar] [CrossRef]
  13. Mason, T.H.E.; Pollard, C.R.J.; Chimalakonda, D.; Guerrero, A.M.; Kerr-Smith, C.; Milheiras, S.A.G.; Roberts, M.; Ngafack, P.R.; Bunnefeld, N. Wicked Conflict: Using Wicked Problem Thinking for Holistic Management of Conservation Conflict. Conserv. Lett. 2018, 11, e12460. [Google Scholar] [CrossRef] [PubMed] [Green Version]
  14. Abram, N.K.; Meijaard, E.; Wilson, K.A.; Davis, J.T.; Wells, J.A.; Ancrenaz, M.; Budiharta, S.; Durrant, A.; Fakhruzzi, A.; Runting, R.K.; et al. Oil Palm–Community Conflict Mapping in Indonesia: A Case for Better Community Liaison in Planning for Development Initiatives. Appl. Geogr. 2017, 78, 33–44. [Google Scholar] [CrossRef] [Green Version]
  15. Hummel, S. Relative Water Scarcity and Country Relations along Cross-Boundary Rivers: Evidence from the Aral Sea Basin. Int. Stud. Q. 2017, 61, 795–808. [Google Scholar] [CrossRef]
  16. Adams, E.A.; Kuusaana, E.D.; Ahmed, A.; Campion, B.B. Land Dispossessions and Water Appropriations: Political Ecology of Land Andwater Grabs in Ghana. Land Use Policy 2019, 87, 104068. [Google Scholar] [CrossRef]
  17. Boelens, R. Cultural Politics and the Hydrosocial Cycle: Water, Power and Identity in the Andean Highlands. Geoforum 2014, 57, 234–247. [Google Scholar] [CrossRef]
  18. Eliasson, J. The Rising Pressure of Global Water Shortages. Nature 2015, 517, 6. [Google Scholar] [CrossRef]
  19. Cusack, J.J.; Bradfer-Lawrence, T.; Baynham-Herd, Z.; Castelló y Tickell, S.; Duporge, I.; Hegre, H.; Moreno Zárate, L.; Naude, V.; Nijhawan, S.; Wilson, J.; et al. Measuring the Intensity of Conflicts in Conservation. Conserv. Lett. 2021, 14, e12783. [Google Scholar] [CrossRef]
  20. Klæboe, R.; Sundfør, H.B. Windmill Noise Annoyance, Visual Aesthetics, and Attitudes towards Renewable Energy Sources. Int. J. Environ. Res. Public Health 2016, 13, 746. [Google Scholar] [CrossRef] [Green Version]
  21. Young, J.; Watt, A.; Nowicki, P.; Alard, D.; Clitherow, J.; Henle, K.; Johnson, R.; Laczko, E.; McCracken, D.; Matouch, S.; et al. Towards Sustainable Land Use: Identifying and Managing the Conflicts between Human Activities and Biodiversity Conservation in Europe. Biodivers. Conserv. 2005, 14, 1641–1661. [Google Scholar] [CrossRef]
  22. Asquith, N.M.; Vargas, M.T.; Wunder, S. Selling Two Environmental Services: In-Kind Payments for Bird Habitat and Watershed Protection in Los Negros, Bolivia. Ecol. Econ. 2008, 65, 675–684. [Google Scholar] [CrossRef]
  23. Stosch, K.; Quilliam, R.; Bunnefeld, N.; Oliver, D. Managing Multiple Catchment Demands for Sustainable Water Use and Ecosystem Service Provision. Water 2017, 9, 677. [Google Scholar] [CrossRef] [Green Version]
  24. Munia, H.; Guillaume, J.H.A.; Mirumachi, N.; Porkka, M.; Wada, Y.; Kummu, M. Water Stress in Global Transboundary River Basins: Significance of Upstream Water Use on Downstream Stress. Environ. Res. Lett. 2016, 11, 14002. [Google Scholar] [CrossRef]
  25. Heathwaite, A.L. Multiple Stressors on Water Availability at Global to Catchment Scales: Understanding Human Impact on Nutrient Cycles to Protect Water Quality and Water Availability in the Long Term. Freshw. Biol. 2010, 55 (Suppl. 1), 241–257. [Google Scholar] [CrossRef]
  26. Elosegi, A.; Sabater, S. Effects of Hydromorphological Impacts on River Ecosystem Functioning: A Review and Suggestions for Assessing Ecological Impacts. Hydrobiologia 2013, 712, 129–143. [Google Scholar] [CrossRef]
  27. Albert, J.S.; Destouni, G.; Duke-Sylvester, S.M.; Magurran, A.E.; Oberdorff, T.; Reis, R.E.; Winemiller, K.O.; Ripple, W.J. Scientists’ Warning to Humanity on the Freshwater Biodiversity Crisis. Ambio 2021, 50, 85–94. [Google Scholar] [CrossRef]
  28. Johnson, R.K.; Angeler, D.G.; Hallstan, S.; Sandin, L.; McKie, B.G. Decomposing Multiple Pressure Effects on Invertebrate Assemblages of Boreal Streams. Ecol. Indic. 2017, 77, 293–303. [Google Scholar] [CrossRef]
  29. Lautenbach, S.; Volk, M.; Strauch, M.; Whittaker, G.; Seppelt, R. Optimization-Based Trade-off Analysis of Biodiesel Crop Production for Managing an Agricultural Catchment. Environ. Model. Softw. 2013, 48, 98–112. [Google Scholar] [CrossRef]
  30. Karabulut, A.; Egoh, B.N.; Lanzanova, D.; Grizzetti, B.; Bidoglio, G.; Pagliero, L.; Bouraoui, F.; Aloe, A.; Reynaud, A.; Maes, J.; et al. Mapping Water Provisioning Services to Support the Ecosystem-Water-Food-Energy Nexus in the Danube River Basin. Ecosyst. Serv. 2016, 17, 278–292. [Google Scholar] [CrossRef]
  31. Kim, I.; Arnhold, S. Mapping Environmental Land Use Conflict Potentials and Ecosystem Services in Agricultural Watersheds. Sci. Total Environ. 2018, 630, 827–838. [Google Scholar] [CrossRef]
  32. Harrison, P.A.; Vandewalle, M.; Sykes, M.T.; Berry, P.M.; Bugter, R.; de Bello, F.; Feld, C.K.; Grandin, U.; Harrington, R.; Haslett, J.R.; et al. Identifying and Prioritising Services in European Terrestrial and Freshwater Ecosystems. Biodivers. Conserv. 2010, 19, 2791–2821. [Google Scholar] [CrossRef] [Green Version]
  33. Pilgrim, E.S.; Macleod, C.J.A.; Blackwell, M.S.A.; Bol, R.; Hogan, D.V.; Chadwick, D.R.; Cardenas, L.; Misselbrook, T.H.; Haygarth, P.M.; Brazier, R.E.; et al. Interactions among Agricultural Production and Other Ecosystem Services Delivered from European Temperate Grassland Systems. Adv. Agron. 2010, 109, 117–154. [Google Scholar]
  34. Spake, R.; Lasseur, R.; Crouzat, E.; Bullock, J.M.; Lavorel, S.; Parks, K.E.; Schaafsma, M.; Bennett, E.M.; Maes, J.; Mulligan, M.; et al. Unpacking Ecosystem Service Bundles: Towards Predictive Mapping of Synergies and Trade-Offs between Ecosystem Services. Glob. Environ. Chang. 2017, 47, 37–50. [Google Scholar] [CrossRef] [Green Version]
  35. Rodríguez, J.P.; Beard, T.D.J.; Bennett, E.M.; Cumming, G.S.; Cork, S.J.; Agard, J.; Dobson, A.P.; Peterson, G.D. Trade-Offs across Space, Time, and Ecosystem Services. Ecol. Soc. 2006, 11, 28. [Google Scholar] [CrossRef] [Green Version]
  36. Walker, W.E.; Harremoës, P.; Rotmans, J.; van der Sluijs, J.P.; van Asselt, M.B.A.; Janssen, P.; Krayer von Krauss, M.P. Defining Uncertainty: A Conceptual Basis for Uncertainty Management in Model-Based Decision Support. Integr. Assess. 2003, 4, 5–17. [Google Scholar] [CrossRef] [Green Version]
  37. Spears, B.M.; Carvalho, L.; Perkins, R.; Kirika, a.; Paterson, D.M. Long-Term Variation and Regulation of Internal Phosphorus Loading in Loch Leven. Hydrobiologia 2012, 681, 23–33. [Google Scholar] [CrossRef]
  38. Martínez-Harms, M.J.; Balvanera, P. Methods for Mapping Ecosystem Service Supply: A Review. Int. J. Biodivers. Sci. Ecosyst. Serv. Manag. 2012, 8, 17–25. [Google Scholar] [CrossRef]
  39. Seppelt, R.; Dormann, C.F.; Eppink, F.V.; Lautenbach, S.; Schmidt, S. A Quantitative Review of Ecosystem Service Studies: Approaches, Shortcomings and the Road Ahead. J. Appl. Ecol. 2011, 48, 630–636. [Google Scholar] [CrossRef]
  40. Darvill, R.; Lindo, Z. The Inclusion of Stakeholders and Cultural Ecosystem Services in Land Management Trade-off Decisions Using an Ecosystem Services Approach. Landsc. Ecol. 2016, 31, 533–545. [Google Scholar] [CrossRef]
  41. Galafassi, D.; Daw, T.M.; Munyi, L.; Brown, K.; Barnaud, C.; Fazey, I. Learning about Social-Ecological Trade-Offs. Ecol. Soc. 2017, 22, 2. [Google Scholar] [CrossRef]
  42. Etienne, M.; du Toit, D.R.; Pollard, S. ARDI: A Co-Construction Method for Participatory Modeling in Natural Resources Management. Ecol. Soc. 2011, 16, 44. [Google Scholar] [CrossRef] [Green Version]
  43. Oliver, D.M.; Bartie, P.J.; Heathwaite, A.L.; Pschetz, L.; Quilliam, R.S. Of a Decision Support Tool for Visualising E. Coli Risk on Agricultural Land. Land Use Policy 2017, 66, 227–234. [Google Scholar] [CrossRef]
  44. Brown, G.; Fagerholm, N. Empirical PPGIS/PGIS Mapping of Ecosystem Services: A Review and Evaluation. Ecosyst. Serv. 2014, 13, 119–133. [Google Scholar] [CrossRef]
  45. Mahboubi, P.; Parkes, M.; Stephen, C.; Chan, H.M. Using Expert Informed GIS to Locate Important Marine Social-Ecological Hotspots. J. Environ. Manag. 2015, 160, 342–352. [Google Scholar] [CrossRef] [PubMed]
  46. Klain, S.C.; Chan, K.M.A. Navigating Coastal Values: Participatory Mapping of Ecosystem Services for Spatial Planning. Ecol. Econ. 2012, 82, 104–113. [Google Scholar] [CrossRef]
  47. Plieninger, T.; Torralba, M.; Hartel, T.; Fagerholm, N. Perceived Ecosystem Services Synergies, Trade-Offs, and Bundles in European High Nature Value Farming Landscapes. Landsc. Ecol. 2019, 34, 1565–1581. [Google Scholar] [CrossRef]
  48. Zoderer, B.M.; Tasser, E.; Carver, S.; Tappeiner, U. An Integrated Method for the Mapping of Landscape Preferences at the Regional Scale. Ecol. Indic. 2019, 106, 105430. [Google Scholar] [CrossRef]
  49. Brown, G.; Raymond, C.M. Methods for Identifying Land Use Conflict Potential Using Participatory Mapping. Landsc. Urban Plan. 2014, 122, 196–208. [Google Scholar] [CrossRef]
  50. Cronkleton, P.; Albornoz, M.A.; Barnes, G.; Evans, K.; de Jong, W. Social Geomatics: Participatory Forest Mapping to Mediate Resource Conflict in the Bolivian Amazon. Hum. Ecol. 2010, 38, 65–76. [Google Scholar] [CrossRef]
  51. Philpot, S.; Hipel, K.; Johnson, P. Identifying Potential Conflict in Land-Use Planning Using a Values-Centered E-Participation Tool: A Canadian Case Study in Aggregate Mining. In Proceedings of the 52nd Hawaii International Conference on System Sciences, Grand Wailea, HI, USA, 8–11 January 2019. [Google Scholar]
  52. Bryan, B.A.; Raymond, C.M.; Crossman, N.D.; Macdonald, D.H. Targeting the Management of Ecosystem Services Based on Social Values: Where, What, and How? Landsc. Urban Plan. 2010, 97, 111–122. [Google Scholar] [CrossRef]
  53. Reilly, K.; Adamowski, J.; John, K. Participatory Mapping of Ecosystem Services to Understand Stakeholders’ Perceptions of the Future of the Mactaquac Dam, Canada. Ecosyst. Serv. 2018, 30, 107–123. [Google Scholar] [CrossRef]
  54. Brown, G.; Strickland-Munro, J.; Kobryn, H.; Moore, S.A. Mixed Methods Participatory GIS: An Evaluation of the Validity of Qualitative and Quantitative Mapping Methods. Appl. Geogr. 2017, 79, 153–166. [Google Scholar] [CrossRef]
  55. Joint Nature Conservation Committee. Natura 2000 Standard Data Form. Quality 2013, 1–3. [Google Scholar]
  56. Fleming, G.; MacDougall, K. EnviroCentre Report No: 3329 “River Spey Abstractions” to the Spey Fishery Board; Envirocentre: Glasgow, UK, 2008. [Google Scholar]
  57. South Esk Catchment Partnership Steering Group. The South Esk Catchment Management Plan. 2022. Available online: http://theriversouthesk.org/assets/Docs/river-south-esk-plan-dec09.pdf (accessed on 14 February 2022).
  58. Jensen, D.; Baird, T.; Blank, G. New Landscapes of Conflict: Land-Use Competition at the Urban–Rural Fringe. Landsc. Res. 2019, 44, 418–429. [Google Scholar] [CrossRef]
  59. Pocewicz, A.; Nielsen-Pincus, M.; Brown, G.; Schnitzer, R. An Evaluation of Internet Versus Paper-Based Methods for Public Participation Geographic Information Systems (PPGIS). Trans. GIS 2012, 16, 39–53. [Google Scholar] [CrossRef]
  60. ESRI. ArcMap 10.4.1. ESRI; Environmental Systems Research Institute: Redlands, CA, USA, 2016. [Google Scholar]
  61. IBM. IBM SPSS Advanced Statistics 23; IBM Corp: Armonk, NY, USA, 2012; p. 184. [Google Scholar]
  62. Urbanek, S. Tiff: Read and Write TIFF Images. R Package Version 0.1-5. 2003. Available online: https://CRAN.R-project.org/package=tiff (accessed on 14 February 2022).
  63. Hijmans, R.J. Raster: Geographic Data Analysis and Modeling. R Package Version 2.5-2. 2015. Available online: https://CRAN.R-project.org/package=raster (accessed on 14 February 2022).
  64. Pebesma, E.J.; Bivand, R.S. Classes and Methods for Spatial Data in R. R News 2005, 5(2), 9–13. [Google Scholar]
  65. Bivand, R.; Keitt, T.; Rowlingson, B. Rgdal: Bindings for the Geospatial Data Abstraction Library. R Package Version 1.1-8. Available online: https://CRAN.R-project.org/package=rgdal (accessed on 14 February 2022).
  66. Cui, J.; Kong, X.; Chen, J.; Sun, J.; Zhu, Y. Spatially Explicit Evaluation and Driving Factor Identification of Land Use Conflict in Yangtze River Economic Belt. Land 2021, 10, 43. [Google Scholar] [CrossRef]
  67. Haworth, B.; Whittaker, J.; Bruce, E. Assessing the Application and Value of Participatory Mapping for Community Bushfire Preparation. Appl. Geogr. 2016, 76, 115–127. [Google Scholar] [CrossRef]
  68. Brown, G.; Reed, P.; Raymond, C.M. Mapping Place Values: 10 Lessons from Two Decades of Public Participation GIS Empirical Research. Appl. Geogr. 2020, 76, 115–127. [Google Scholar] [CrossRef]
  69. Zolkafli, A.; Liu, Y.; Brown, G. Bridging the Knowledge Divide between Public and Experts Using PGIS for Land Use Planning in Malaysia. Appl. Geogr. 2017, 83, 107–117. [Google Scholar] [CrossRef]
  70. Rose, N.A.; Parsons, E.C.M. “Back off, Man, I’m a Scientist!” When Marine Conservation Science Meets Policy. Ocean Coast. Manag. 2015, 115, 71–76. [Google Scholar] [CrossRef] [Green Version]
  71. Micha, E.; Roberts, W.; Ryan, M.; O’Donoghue, C.; Daly, K. A Participatory Approach for Comparing Stakeholders’ Evaluation of P Loss Mitigation Options in a High Ecological Status River Catchment. Environ. Sci. Policy 2018, 84, 41–51. [Google Scholar] [CrossRef]
  72. Skaalsveen, K.; Ingram, J.; Urquhart, J. The Role of Farmers’ Social Networks in the Implementation of No-till Farming Practices. Agric. Syst. 2020, 181, 102824. [Google Scholar] [CrossRef]
  73. Stepanova, O. Conflict Resolution in Coastal Resource Management: Comparative Analysis of Case Studies from Four European Countries. Ocean Coast. Manag. 2015, 103, 109–122. [Google Scholar] [CrossRef] [Green Version]
  74. Noble, M.M.; Harasti, D.; Pittock, J.; Doran, B. Understanding the Spatial Diversity of Social Uses, Dynamics, and Conflicts in Marine Spatial Planning. J. Environ. Manag. 2019, 246, 929–940. [Google Scholar] [CrossRef]
  75. Duvernoy, I.; Zambon, I.; Sateriano, A.; Salvati, L. Pictures from the Other Side of the Fringe: Urban Growth and Peri-Urban Agriculture in a Post-Industrial City (Toulouse, France). J. Rural Stud. 2018, 57, 25–35. [Google Scholar] [CrossRef]
  76. Punjabi, B.; Johnson, C.A. The Politics of Rural–Urban Water Conflict in India: Untapping the Power of Institutional Reform. World Dev. 2019, 120, 182–192. [Google Scholar] [CrossRef]
  77. Couto, T.B.A.; Olden, J.D. Global Proliferation of Small Hydropower Plants—Science and Policy. Front. Ecol. Environ. 2018, 16, 91–100. [Google Scholar] [CrossRef]
  78. Lees, A.C.; Peres, C.A.; Fearnside, P.M.; Schneider, M.; Zuanon, J.A.S. Hydropower and the Future of Amazonian Biodiversity. Biodivers. Conserv. 2016, 25, 451–466. [Google Scholar] [CrossRef]
  79. Evans, A.E.; Mateo-Sagasta, J.; Qadir, M.; Boelee, E.; Ippolito, A. Agricultural Water Pollution: Key Knowledge Gaps and Research Needs. Curr. Opin. Environ. Sustain. 2019, 36, 20–27. [Google Scholar] [CrossRef]
  80. Aitken, M.N. Impact of Agricultural Practices and River Catchment Characteristics on River and Bathing Water Quality. Water Sci. Technol. 2003, 48, 217–224. [Google Scholar] [CrossRef]
  81. Saad-Sulonen, J.; Eriksson, E.; Halskov, K.; Karasti, H.; Vines, J. Unfolding Participation over Time: Temporal Lenses in Participatory Design. CoDesign 2018, 14, 4–16. [Google Scholar] [CrossRef] [Green Version]
  82. McEwen, L.; Garde-Hansen, J.; Holmes, A.; Jones, O.; Krause, F. Sustainable Flood Memories, Lay Knowledges and the Development of Community Resilience to Future Flood Risk. Trans. Inst. Br. Geogr. 2017, 42, 14–28. [Google Scholar] [CrossRef]
  83. Burton, V.; Metzger, M.J.; Brown, C.; Moseley, D. Green Gold to Wild Woodlands; Understanding Stakeholder Visions for Woodland Expansion in Scotland. Landsc. Ecol. 2018, 34, 1693–1713. [Google Scholar] [CrossRef] [Green Version]
  84. Oteros-Rozas, E.; Martín-López, B.; Daw, T.M.; Bohensky, E.L.; Butler, J.R.A.; Hill, R.; Martin-Ortega, J.; Quinlan, A.; Ravera, F.; Ruiz-Mallén, I.; et al. Participatory Scenario Planning in Place-Based Social-Ecological Research: Insights and Experiences from 23 Case Studies. Ecol. Soc. 2015, 20, 32. [Google Scholar] [CrossRef]
  85. Rollason, E.; Bracken, L.J.; Hardy, R.J.; Large, A.R.G. Evaluating the Success of Public Participation in Integrated Catchment Management. J. Environ. Manag. 2018, 228, 267–278. [Google Scholar] [CrossRef] [PubMed]
  86. Fedreheim, G.E.; Blanco, E. Co-Management of Protected Areas to Alleviate Conservation Conflicts: Experiences in Norway. Int. J. Commons 2017, 11, 754–773. [Google Scholar] [CrossRef]
  87. Moore, S.A.; Brown, G.; Kobryn, H.; Strickland-Munro, J. Identifying Conflict Potential in a Coastal and Marine Environment Using Participatory Mapping. J. Environ. Manag. 2017, 197, 706–718. [Google Scholar] [CrossRef] [Green Version]
  88. Coppes, J.; Ehrlacher, J.; Thiel, D.; Suchant, R.; Braunisch, V. Outdoor Recreation Causes Effective Habitat Reduction in Capercaillie Tetrao Urogallus: A Major Threat for Geographically Restricted Populations. J. Avian Biol. 2017, 48, 1583–1594. [Google Scholar] [CrossRef]
  89. Karimi, A.; Brown, G. Assessing Multiple Approaches for Modelling Land-Use Conflict Potential from Participatory Mapping Data. Land Use Policy 2017, 67, 253–267. [Google Scholar] [CrossRef]
  90. Wilkes-Allemann, J.; Pütz, M.; Hirschi, C.; Fischer, C. Conflict Situations and Response Strategies in Urban Forests in Switzerland. Scand. J. For. Res. 2015, 30, 204–216. [Google Scholar] [CrossRef]
  91. Lechner, A.M.; Verbrugge, L.N.H.; Chelliah, A.; Ang, M.L.E.; Raymond, C.M. Rethinking Tourism Conflict Potential within and between Groups Using Participatory Mapping. Landsc. Urban Plan. 2020, 203, 103902. [Google Scholar] [CrossRef]
  92. Jacobs, S.; Burkhard, B.; Van Daele, T.; Staes, J.; Schneiders, A. ‘The Matrix Reloaded’: A Review of Expert Knowledge Use for Mapping Ecosystem Services. Use Ecol. Indic. Model. 2015, 295, 21–30. [Google Scholar] [CrossRef]
  93. Young, J.C.; Thompson, D.B.A.; Moore, P.; MacGugan, A.; Watt, A.; Redpath, S.M. A Conflict Management Tool for Conservation Agencies. J. Appl. Ecol. 2016, 53, 705–711. [Google Scholar] [CrossRef] [Green Version]
  94. Quilliam, R.S.; Kinzelman, J.; Brunner, J.; Oliver, D.M. Resolving Conflicts in Public Health Protection and Ecosystem Service Provision at Designated Bathing Waters. J. Environ. Manag. 2015, 161, 237–242. [Google Scholar] [CrossRef] [PubMed]
  95. Graversgaard, M.; Jacobsen, B.H.; Kjeldsen, C.; Dalgaard, T. Stakeholder Engagement and Knowledge Co-Creation in Water Planning: Can Public Participation Increase Cost-Effectiveness? Water 2017, 9, 191. [Google Scholar] [CrossRef] [Green Version]
Figure 1. Location of the three study catchments in Scotland, UK.
Land 11 00300 g001
Figure 2. Heat maps of perceived conflict in the River Spey (1), River South Esk (2), and River Ayr catchment (3).
Land 11 00300 g002
Figure 3. Heat maps of perceived conflict by environmental regulator staff (A), water industry staff (B), catchment scientists (C), and farm advisors (D) in the River Ayr catchment.
Land 11 00300 g003
Figure 4. Difference in the overlap of the raster cells of perceived conflict among stakeholder groups across all three catchments, normalised by the mean overlap and standard deviation (±standard error), with 0 representing the mean overlap.
Land 11 00300 g004
Figure 5. Difference between the binomial GLM coefficients, modelling how different land cover types may explain perceived conflict in the South Esk catchment (logit scale, ± standard error). The greater the coefficient (closer to 0), the better a land cover type predicts areas with greater perceived conflict in the model.
Land 11 00300 g005
Figure 6. General linear model predictions of the relationship between the number of stakeholders from each group and the proportion of stakeholders perceiving conflict across the catchment (modelling for the South Esk catchment and the broadleaf forest land cover type as they were the first factors, and catchment type and land cover were not considered in this model). Data points are displayed using a logarithmic bubble graph to portray the large number of 10,000 m² rasters used for the analysis.
Land 11 00300 g006
Table 1. Land cover types in the three study catchments as a percentage of overall area covered.
Land Cover TypeSpey(% Land Cover)
Esk
Ayr
Moors and heathland29.0732.9111.47
Coniferous forest15.898.459.38
Pastures9.1812.0939.46
Sparsely vegetated areas22.610.030.00
Natural grasslands8.549.8114.39
Arable land2.0131.207.04
Peat bogs6.570.8610.11
Transitional woodland-shrub2.711.342.02
Broad-leaved forest1.951.411.15
Urban areas0.521.032.10
Table 2. GLM binomial modelling outputs of how the proportion of perceived conflict may be explained by land cover type, catchment, or stakeholder group.
EstimateStd. Errorz Valuep-Value
Intercept (Broadleaf forest and the South Esk catchment)−2.680860.004817−556.571<0.001
Coniferous forest−0.025430.003976−6.397<0.001
Arable farmland0.0048650.0046631.0430.297
Improved grazing0.0915550.00447620.456<0.001
Rough grazing0.0044070.0041191.070.285
Upland (moorland and heather)−0.103360.00378−27.346<0.001
Coastal areas0.1839850.0531473.462<0.001
Freshwater areas−0.079060.006352−12.446<0.001
Urban areas0.0917510.00514817.823<0.001
Ayr catchment0.1046960.0047222.183<0.001
Spey catchment0.0303720.004247.162<0.001
Catchment Scientists0.3500550.001388252.188<0.001
Environmental Regulator Staff0.3357820.001497224.377<0.001
Farm Advisors0.4138250.001446286.089<0.001
Water Industry Staff0.3759580.002527148.752<0.001
Publisher’s Note: MDPI stays neutral with regard to jurisdictional claims in published maps and institutional affiliations.

